Embed Size (px)
Citation preview

© All Rights Reserved*Corresponding author. Email: [email protected]
International Food Research Journal 19 (3): 1137-1144 (2012)
1*Salengke, S., 2Sastry, S. K. and 3Zhang, H. Q.
1Department of Agricultural Engineering and Food Technology, Hasanuddin University
Makassar, Indonesia2Department of Food, Agricultural, and Biological Engineering, The Ohio State
University Columbus, OH 43210, USA
3USDA Western Regional Research Center, Albany, CA 94710, USA
Pulsed electric field technology: Modeling of electric field and temperature distributions within continuous flow PEF treatment
chamber
Abstract: Innovations and technology developments in the field of food pasteurization and sterilization are continuously evolving. These include innovations in thermal processing technologies such as aseptic processing, ohmic technology, and microwave technology, as well as non-thermal processing technologies which include pulsed electric field technology and high pressure processing technology. This paper discussed the results of a study on mathematical modeling of electric field and temperature distributions in a pulsed electric field (PEF) treatment chamber. A commercially available CFD software package (Fluent, Inc., Lebanon, NH, USA) was used to solve the continuity, momentum, energy and electric field equations in the PEF treatment chamber of different geometries. Results of the simulations indicated that chamber design affects fluid velocity profile, electric field distribution, and temperature distribution within the PEF treatment chamber. This result suggests that chamber design can significantly affect the effectiveness of PEF treatment on microbial inactivation during pasteurization or sterilization of liquid foods.
Keywords: Pulsed electric field, modeling, pasteurization and sterilization
Introduction
Recent developments in non-thermal food sterilization technologies have shown that pulsed electric field (PEF) of high intensities is a viable alternative for sterilization of liquid foods such as fruit juices, milk, liquid egg and many others. Previous studies (Sale and Hamilton, 1967; Hamilton and Sale, 1967; Hülsheger and Niemann, 1980; Hülsheger et al., 1981, 1983; Jacob et al., 1981; Mizuno and Hori, 1988; Matsumoto et al., 1991; Yoichi et al., 1991; Jayaram et al., 1992; Castro et al., 1993; Zhang et al., 1994a; Grahl and Märkl, 1996) have demonstrated the ability of high intensity pulsed electric fields to inactivate yeast, molds, and bacteria. The mechanism of microbial inactivation by PEF is related to the occurrence of electropermeabilization by pore formation (dielectric breakdown) in the cell membrane (Sale and Hamilton, 1968; Zimmermann, 1986; Mizuno and Hori, 1988; Jayaram et al., 1992). The extent of the pore formation or membrane damage, and thus the lethal effect of PEF on microorganisms, depends on the intensity of the electric field and the
duration (as represented by the number of pulses and pulse width) of treatment (Sale and Hamilton, 1967, 1968; Hamilton and Sale, 1967; Zimmermann et al., 1980; Hülsheger et al., 1980, 1981; Mizuno and Hori, 1988). In various publications, it has been indicated that for the lethal effect of the PEF to effectively take place, the applied field intensities must be above a critical value that is specific to each microorganism (Knorr et al., 1994; Zhang et al., 1994b; Ho et al., 1995). Many researchers (Sale and Hamilton, 1967, 1968; Zimmermann et al., 1976; Kinosita and Tsong, 1977, 1979; Hülsheger et al., 1983) reported that transmembrane potential of about 1 Volt would cause a dielectric breakdown in the cell membrane of many microorganisms and cellular systems. This critical membrane potential corresponds to field strength of about 10 kV/cm for E. coli (Sale and Hamilton, 1968; Zimmermann et al., 1974). Knorr et al. (1994) and Ho et al. (1995) reported comparable field strengths required to inactivate P. fluorescens. Mertens and Knorr (1992) reported critical field strength of about 16 kV/cm for inactivation of E. coli. In contrast, several researchers reported that the lethal effect of PEF on
1138 Salengke, S., Sastry, S. K. and Zhang, H. Q.
International Food Research Journal 19(3): 1137-1144
E. coli could be observed at field intensities of about 6 kV/cm (Hülsheger and Niemann, 1980; Hülsheger et al., 1981, 1983; Liu et al., 1996). However, for processes requiring a three or more log reduction of microbial count, their results indicated that at least 20 kV/cm of field intensity is required. More recently, Jin and Zhang (1999) reported that at least 40 kV/cm field strength is required to effectively inactivate molds, yeast, and bacteria inoculated in fruit juice.
The PEF technology is an attractive alternative to thermal processing due to its potential to provide microbiologically safe and fresh-like food products (Zhang et al., 1995; Barbosa-Canovas et al., 1999). This is supported by experimental results which suggested that the PEF processing is capable of inactivating yeast, molds, and bacteria in liquid foods without any significant effect on sensory or nutritional attributes of the processed food products (Grahl and Märkl, 1996; Jia et al., 1999; Jin and Zhang, 1999; Evrendilek et al., 2000). Results of the study reported by Jia et al. (1999) also indicated that flavor losses in orange juice during PEF processing were significantly lower than the losses that occurred during a conventional heat treatment.
Although PEF technology is considered as a non-thermal processing (Mertens and Knorr, 1992; Castro et al., 1993; Zhang et al., 1995; Grahl and Märkl, 1996), the use of high voltage electric fields as in PEF processing can bring about an increase in temperature in the processed food product due to the Joule (ohmic) heating effect. The rate of the volumetric heat generation (ü) within the food during pulses is dependent on the electrical conductivity (σ) of the food material and the applied electric field intensity ( V∇ ) and is given by Eq. (1).
(1)The average heating rate of the food per unit mass due to the Joule heating effect can be expressed, using a lumped analysis, as:
(2)where dT, dt, ρ and Cp repectively represents temperature increase, time elapsed during pulse, density, and heat capacity of the food material.
In order to avoid an excessive increase in product temperature during PEF processing, treatments with short pulse duration and low repetition rate are generally recommended. However, this may lead to a less effective treatment. Another approach which had been proposed to avoid an excessive heating is by incorporating a cooling mechanism in the PEF
processing system to dissipate the heat generated within the treatment chambers (Zhang et al., 1995).
In several studies, the increase in the average (bulk) fluid temperature during PEF treatments had been reported to be relatively small (Sale and Hamilton, 1967; Zimmermann et al., 1974; Jacob et al., 1981; Hulsheger et al., 1981; Grahl and Märkl, 1996; Yeom et al., 1999; Jin and Zhang, 1999). It is important to note, however, that localized over heating may occur at certain locations within treatment chamber due to non-uniformity of electric field distributions which may arise from poorly designed treatment chambers. The non-uniformity of the electric field in the treatment chamber will also lead to a more serious problem of nonuniform treatment of food products. Therefore, in order to achieve a better design of PEF processing system, it is important to examine the electric field and temperature distributions within PEF treatment chambers of chosen geometry using numerical simulation techniques. Accordingly, the objective of this study is to perform numerical simulations of temperature and electric field distributions within continuous flow PEF treatment chambers using a Computational Fluid Dynamic (CFD) software.
Materials and Methods
Numerical simulationA commercially available CFD software
package, Fluent® version 5.4 (Fluent, Inc., Lebanon, NH, USA), was used to solve the continuity, momentum, energy, and electric field equations in the PEF treatment chamber of chosen geometry. The continuity, momentum, and energy equations solved are given in Eqs. (3) – (5). 0=⋅∇ u (3)
(4)
(5)
In the above equation, ü is the volumetric heat source (internal energy generation) due to the Joule (ohmic) heating effect as given in Eq. (1). The energy source term (ü) was obtained by solving Eq. (1) using a user-defined subroutine.
The electric field distributions within the PEF treatment chamber is calculated by solving Laplace equation:
gpuutu
rtr +⋅∇−−∇=
∇⋅+∂∂
uTkTutTC p +∇⋅∇=
∇⋅+∂∂
r
2Vu ∇= s

Pulsed electric field technology: Modeling of electric field and temperature distributions within continuous flow PEF treatment chamber
1139
International Food Research Journal 19(3): 1137-1144
(6)
with voltage boundary conditions during pulses and interpulses are given in Eqs. (7) and (8) respectively.
60000,0 21 == −− electrodeelectrode VV (7)
021 == −− electrodeelectrode VV (8)
For liquid foods such as juices, the electrical conductivity (σ) has been found to depend on temperature (Palaniappan and Sastry, 1991) and follows a linear equation as shown in Eq. (9).
(9) In order to mimic the properties of real fluid foods, the specific heat, thermal conductivity, and viscosity of the fluid were assumed to be temperature dependent according to the following polynomial equation:
4
53
42
321 TcTcTcTcc ++++=Φ (10)
where Φ represents the specific heat, thermal conductivity, and viscosity of the fluid; and T is absolute temperature in Kelvin. Values of the constants in Eqs. (9) and (10) are given in Table 1. The density of the fluid was also assumed to be a function of temperature according to the Boussinesq model incorporated in the Fluent codes.
The PEF treatment chambers evaluated were characterized as “co-field” flow geometry (Yin et al., 1997) and designed to process up to 1000 liters per hour of liquid foods. Depending on viscosity of the processed liquid foods, with other parameters such as product flow rate, product density, and inlet diameter remain unchanged, flow regime within the treatment chamber can be laminar or turbulent. Therefore, in the current study, the flow, temperature, and voltage field within the treatment chamber are simulated using both laminar and turbulent (standard k-ε) models. The no-slip boundary condition was assumed at the chamber wall. The flow within the PEF treatment chamber was assumed fully developed. Therefore, to avoid having to include a long entrance region in the simulated domain, the inlet boundary condition assumed that velocity profile, uz, at the entrance was fully developed.
The velocity profile at the entrance for laminar flow regime is given in Eq. (11),
−= 2
2
max, 1RrUU zz
(11)
with r being the coordinate in the radial direction, R being the inlet radius, and Uz, max is the centerline (maximum) velocity whose value is given in Eq. (12).
avgzz UU ,max, 2=
(12) The fully developed velocity profile at the entrance for turbulent flow condition was assumed to follow an empirical equation proposed by Pai (1953), as cited in Brodkey and Hershey (1988), as shown in Eq. (13).
+
+=
m
zz RrD
RrCUU
22
max, 1
(13)In the above equation, r is the coordinate in the radial direction and R is the radius of the inlet of the PEF chamber. The centerline velocity, Uz, max, can be calculated based on integration of the Pai’s equation and is given in Eq. (14) (Brodkey and Hershey, 1988).
++
+
=
121
,max,
mDC
uu avgz
z
(14)
In Eq. (12) and (14), the average velocity, Uz,avg, can be calculated from the given volumetric flow rate and the cross section area of the inlet. The coefficient m is a unique function of the Reynolds number. Brodkey (1963), as cited in Brodkey and Hershey (1988), showed that m could be taken as the whole integer closest to the value computed from Eq. (15).
( ) 786.0008211.0617.0 eRm +−= (15)
The coefficients C and D can be determined from the following equations:
1−−
=m
msC
(16)
11−−
=m
sD
(17)where, for Re>2800, the value of s can be calculated from Eq. (18) (Brodkey, 1963).
( ) 833.0003172.0585.0 eRs += (18)The Reynolds numbers at the inlet for the
turbulent flow regime are given in Table 2. Simulations of processed fluid temperature, fluid
( ) 0=∇⋅∇ Vs
Tcc 21 +=s

1140 Salengke, S., Sastry, S. K. and Zhang, H. Q.
International Food Research Journal 19(3): 1137-1144
velocity profile, and electric field distributions were carried out using Cartesian grids on 3-dimensional domains. The modeled domains consisted of one-quarter of the cross section area of the flow due to symmetric condition of the PEF treatment chamber. Three different geometries (designs) of the co-field PEF treatment chamber were evaluated. A modeled domain of the PEF treatment chamber is shown in Figure 1. It is important to note that the only difference between the three designs is the internal diameter of the insulating tube separating the two ring electrodes. For Design 1 the internal diameter of the insulating tube is the same as that of the ring electrodes, for Design 2 the internal diameter of the insulating tube is 1 mm smaller than that of the ring electrodes, and for Design 3 the internal diameter of the insulating tube is 2 mm smaller than that of the ring electrodes. To avoid formation of dead zones due to contraction and expansion of flow (in Design 2 and 3), the internal edges of the insulating tube was tapered about 1 mm for design 1 and 2 mm for design 2 to provide a smooth transition. Physical characteristics as well as operating parameters of the treatment chambers are presented in Table 2.
The simulations were carried out by first solving the flow and turbulence parameters under a steady state condition. Next, the electric field equation was solved under the steady condition while the flow field was kept constant. These were done to establish the initial flow profile and electric field distributions within the domain. It is relevant to note that PEF treatments involve a time-periodic process where electric pulses of predetermined duration and interval were applied repetitively. This will bring about periodic changes of the fluid temperature during PEF treatment, which in turn might lead to changes in thermophysical and electrical properties of the fluid. These changes may affect both the flow profile and the electric field distribution within the treatment chamber. Therefore, in the actual simulation, all of the equations (flow, turbulent, energy, and electric field) were solved in a transient fashion using the segregated solution scheme available in Fluent. The simulations were performed with time steps of 2e-08 s and 2e-05 s during pulse and interpulse respectively. It is important to note that during interpulse, only the
flow, turbulent (for turbulent condition only), and energy equations were solved since no electric field is applied within the treatment chamber during this period. As a consequence, the energy source term in the energy equation (Eq. (5)) was deactivated (no energy generation) during the interpulse periods. A series of grid refinement was performed on each of the geometry evaluated to ensure that the solutions obtained at each time step were grid independent. As the criteria of convergence for the solutions, the residuals must be less than 1e-07 and 1e-08 for the continuity and energy equations respectively. There was no need to set the convergence criteria for velocity components and voltage since their residuals were generally well below 1e-10.
Results and Discussion
Simulation results on fluid velocity vectors and velocity profiles indicate that in the case of Design 1, the velocity of the fluid in the PEF treatment chamber was only a function of the distance from the chamber wall (radial direction) and no change in the axial direction. In the case of Design 2 and 3, however, the velocity also changed in the axial direction, especially in the transition regions (contraction and expansion) where the ring electrodes and the insulating tube meet. Of the three designs evaluated, Design #3 is the most likely to pose flow problems due to the presence of the contraction and expansion of flow cross section area. However, the simulation results indicate that there is no evidence of flow circulation (secondary flow) or dead zone developed in the modeled domain, thus from fluid flow considerations, all of the three designs evaluated would be acceptable.
It is important to note that when using a treatment chamber with a contraction in the gap region between the electrodes, there is an increase in fluid velocity in the gap region, resulting in a decrease in the treatment time. In the case of Design 2 with a contraction of about 19.9% (inside diameter of the insulating tube was 1 mm smaller than that of the ring electrode), there was an increase in the fluid velocity at the center line of about 37.60% for laminar flow (from 7.08 m/s to 9.74 m/s) and 48.98% for tubullent flow (from 4.15 m/s to 6.18 m/s) compared to the center line velocity attained from Design 1 at similar flow regime. By increasing the contraction to about 37.6% as the case for Design 3 (diameter of the insulating tube was 2 mm smaller than that of the ring electrode), the center line velocity increased by about 76.6% (from about 7.08 m/s for Design 1 to about 12.5 m/s for Design 3) under laminar flow condition and about 91.2% (from about 4.15 m/s for Design
Table 1. Values of constants in Equations (9) and (10)

Pulsed electric field technology: Modeling of electric field and temperature distributions within continuous flow PEF treatment chamber
1141
International Food Research Journal 19(3): 1137-1144
1 to about 7.93 m/s for Design 3) under turbulent flow condition. This significant increase in the center line velocity indicates that the residence time of the processed liquid foods in the PEF treatment chamber would decrease significantly, which will bring about a significant decrease in treatment time and PEF dosage (due to the decrease in the number pulses received by the processed liquid food).
In continuous processing technology such as used in PEF sterilization of liquid foods, the center line velocity of the liquid food is of paramount importance. The fluid food flowing at or near the center line of the treatment chamber represents the part of the product which receives the least treatment (lowest PEF dosage) and poses the danger of under sterilization. Therefore, the increase in fluid velocity (decrease in the residence or treatment time) at the centerline of the treatment chamber due to contraction of the flow cross section area must be taken into consideration when determining process parameters such as pulse width, pulse interval (repetition rate), and electric field intensity. In addition, processing under turbulent flow condition can provide longer exposure time to PEF treatment, especially for the fluid element flowing along the centerline, thus increasing the effectiveness and the safety of PEF treatment.
It is important to note that the length of the insulating tube (the distance between the electrodes) used for the three designs was 1.5 cm (Figure 1). Based on the velocity of the fluid flowing along the centerline, the minimum residence time of the processed fluid in the gap region under laminar flow condition was only about 2.1195 x 10⁻³ seconds for Design 1, 1.5404 x 10⁻³ seconds for Design 2, and 1.2002 x 10⁻³ seconds for Design 3. The corresponding values under turbulent flow condition was 3.6167 x 10⁻³ seconds, 2.4277 x 10⁻³ seconds, and 1.8916 x 10⁻³ seconds for Design 1, 2, and 3 respectively. Therefore, for process under the simulated conditions shown in Table 2, the fluid elements that flow around the center line of the PEF chamber will only receive at most two pulses of electric field for Design 1 and most likely only one pulse for Design 2 and 3. Therefore, sterilization and pasteurization of liquid foods using PEF treatment will be more effective by using Design 1. This result clearly indicates the important effect of chamber design on the efficacy of PEF sterilization or pasteurization of liquid foods such as juice and puree.
Electric field (voltage) profiles during pulses are shown in Figure 2. The equipotential lines at zone away from the electrodes in the gap region (region underneath the insulator) are relatively straight and parallel to each other. This is true for all the chamber
Table 2. Physical characteristics of the PEF treatment chambers and operating parameters used in simulations
Figure 1. Modeled domains of the PEF treatment chamber. Design 1 (shown above): internal diameter of the ring electrodes and the inslating tube was the same; Design 2: internal diameter of the
insulating tube was 1 mm smaller than that of the ring electrodes; and Design 3: internal diameter of the insulating tube was 2 mm smaller
than that of the ring electrodes.
Figure 2. Isopotential lines for voltage distributions within PEF treatment chambers of different geometry. Notations: E1 represents
neutral electrode (0 V), E2 represents high voltage electrode (60 kV), and I represents the non-conducting tube. Results shown obtained from
simulation under laminar flow condition.
Figure 3. Electric field strength (V/m) within the PEF treatment chambers of different geometry. Notations: E1 represents neutral
electrode (0 V), E2 represents high voltage electrode (60 kV), and I represents the non-conducting tube. Result shown obtained from
simulation under laminar flow condition.
1142 Salengke, S., Sastry, S. K. and Zhang, H. Q.
International Food Research Journal 19(3): 1137-1144
geometries evaluated. Moreover, simulation results indicated that electric field profile under laminar and turbulent flow were identical indicating that there is no effect of flow regime (laminar or turbulent) on the electric field profile. The same phenomenon was also found for electric field strength distribution.
The electric field strength distributions in the modeled PEF chambers are shown in Figure 3. It can be seen from the figure that the electric field strength was not uniform throughout the chamber. As expected, the electric field intensities are high in the gap region (mostly above 30 kV/cm) and low in the zones directly underneath the electrodes (mostly less than 10 kV/cm). It is also important to note that in the region underneath the insulator (gap region), the electric field intensities at region close to the chamber axis (centerline) are slightly lower than those at region adjacent to the insulator wall. For this reason, along with the fact that fluid velocity is highest at the centerline, we can anticipate the fluid flowing
through the centerline of the PEF treatment chamber to receive the least PEF treatment and achieve lowest degree of sterilization.
It is worth noting that the geometry of the PEF treatment chambers clearly affects the distribution of electric field intensities within the chamber. Electric field intensity along the centerline is relatively higher for Design #3, followed by Design #2. It can also be seen that the electric field intensities in the gap region are relatively uniform. It is important to note that in the case of Design #1, spots of extremely high electric field intensity exist in the fluid adjacent to the edge of the electrodes. This high field intensity can cause local overheating. Spots of high field intensity are also observed in Design #2 and #3 but the magnitude is much lower than those found in Design #1.
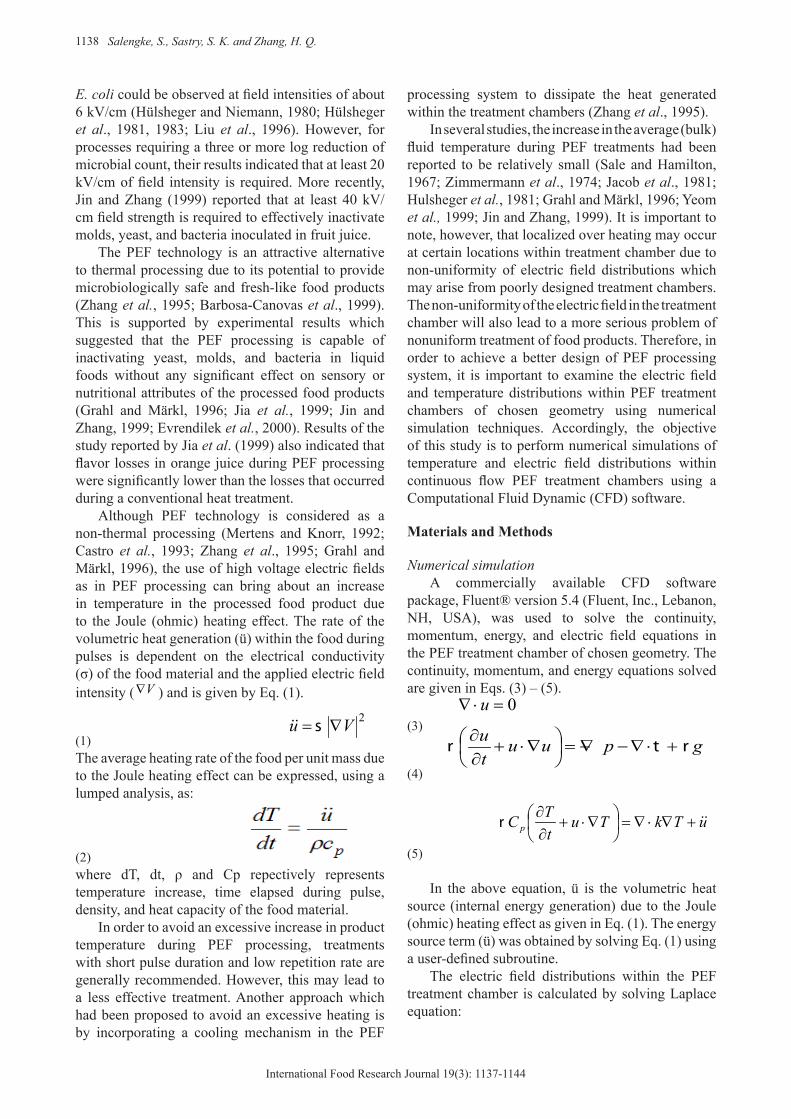
Figures 4 and 5 present temperature field across the symmetric plane at the end of each pulse under laminar and turbulent flow respectively. As expected from the trends of the electric field intensity, there was local overheating occurs at spots adjacent to the edge of the electrodes, especially the electrode at the outlet of the PEF chamber. Under laminar flow condition, maximum temperature of around 500K was found to occur at fluid close to the edge of the electrode at the outlet for Design #1. Maximum temperature was also found at the same location for Design #2 and #3 but the magnitude was much lower, i.e. 405K for Design #2 and 330K for Design #3. For all the designs, however, the temperature reached by majority of the fluid was only up to 310 to 315 K under laminar flow condition suggesting an average of 10 - 15oC increase of the processed liquid food temperature during processing under the simulated conditions. Simulation results under turbulent flow condition also indicated the presence of hotspots at zone close to the edge of the electrode at the outlet but the magnitudes of the temperature buildup were significantly lower than those found under laminar flow, i.e. 343K for Design #1, 315K for Design #2, and 310K for Design #3. It is also evident from the figures that the majority of the fluid only attained a small increase in temperature during pulse.
Temperature distributions within the simulated PEF treatment chamber at the end of each interpulse are shown in Figures 6 and 7. As shown in Figure 6 (laminar flow condition), traces of fluid with temperature above 400 K was found around the edge of the electrode at the outlet for Design 1. High temperature was also found at the expansion zone for Designs 2 and 3 but the magnitudes of the temperature were lower (around 380 K for Design 2 and 320 K for Design 3). For simulation under turbulent flow condition, the temperatures at those high temperature
Figure 4. Temperature profiles across symmetric plane within PEF treatment chambers of different geometry at the end of each pulse.
Notations: E1 represents neutral electrode (0 V), E2 represents high voltage electrode (60 kV), and I represents the non-conducting tube.
Simulation under laminar flow condition.
Figure 5. Temperature profiles across symmetric plane within PEF treatment chambers of different geometry at the end of each pulse.
Notations: E1 represents neutral electrode (0 V), E2 represents high voltage electrode (60 kV), and I represents the non-conducting tube.
Simulation under turbulent flow condition

Pulsed electric field technology: Modeling of electric field and temperature distributions within continuous flow PEF treatment chamber
1143
International Food Research Journal 19(3): 1137-1144
zones were much lower, i.e. 315 K for Design 1, 310 K for Design 3, and 308 K for Design 3. In addition, the results shown in Figures 6 and 7 also show that the temperature of the majority of the fluid within the PEF treatment chamber has gone down to around 305 K or below at the end of each interpulse. Conclusions
Flow profile, electric field, and temperature distributions within a “co-field” PEF treatment chamber can be successfully simulated using Computational Fluid Dynamic (CFD) software. Pulsed electric field (PEF) chamber geometry can significantly affect the velocity and the residence
time of processed fluid in the treatment chamber and the presence of zones with extremely high electric field and temperature. Temperature buildup at these zones was significantly higher under laminar flow condition compared to that under turbulent flow condition. In addition, worst-case-scenario in PEF processing using “co-field” treatment chamber will be expected to occur under laminar flow since under this condition, the residence (treatment) time of fluid element moving along the centerline would be expected to reach a lowest value.
References
Barbosa-Cánovas, G.V., Góngora-Nieto, M.M., Pothakamury, U.R., and Swanson, B.G. 1999. Preservation of foods with pulsed electric fields. Academic Press, San Diego, CA .
Brodkey, R.S. and Hershey, H.C. 1988. Transport Phenomena – A unified approach. McGraw-Hill Book Company, New York. p. 244.
Castro, A.J., Barbosa-Cánovas, G.V. and Swanson, B.G. 1993. Microbial inactivation of foods by pulsed electric fields. Journal of Food Processing and Preservation 17: 47-73.
Evrendilek, G.A., Jin, Z.T., Ruhlman, K.T., Qiu, X., Zhang, Q.H. and Richter, E.R. 2000. Microbial safety and shelf-life of apple juice and cider processed by bench and pilot scale PEF systems. Innovative Food Science and Emerging Technologies 1: 77-86.
Grahl, T. and Märkl, H. 1996. Killing of microorganisms by pulsed electric fields. Applied Microbiology and Biotechnology 45: 148-157.
Hamilton, W.A. and Sale, A.J.H. 1967. Effect of high electric fields on microorganisms. II. Mechanisms of action of the lethal effect. Biochimica et Biophysica Acta. 148: 789-800.
Hülsheger, H. and Niemann, E.G. 1980. Lethal effects of high voltage pulses on E. Coli K12. Radiation and Environmental Biophysics 18: 281-288.
Hülsheger, H., Potel, J. and Niemann, E.G. 1981. Killing of bacteria with electric pulses of high field strength. Radiation and Environmental Biophysics 20: 53-65.
Hülsheger, H., Potel, J., and Niemann, E.G. 1983. Electric field effects on bacteria and yeast cells. Radiation and Environmental Biophysics 22: 149-162.
Ho, S.Y., Mittal, G.S., Cross, J.D. and Griffiths, M.W. 1995. Inactivation of Pseudomonas fluorescens by high voltage electric pulses. Journal of Food Science 60(6): 1337-1340.
Jacob, H.E., Förster, W. and Berg, H. 1981. Microbiological implications of electric field effects. II. Inactivation of yeast cells and repair of their cell envelop. Zeitschrift fur Allgemeine Mikrobiologie 21: 225-233.
Jayaram, S., Castle, G.S.P. and Margaritis, A. 1992. Kinetics of sterilization of Lactobacillus brevis cells by the application of high voltage pulses. Biotechnology and Bioengineering 40: 1412-1420.
Figure 6. Temperature profiles across symmetric plane within PEF treatment chambers of different geometry at the end of each interpulse.
Notations: E1 represents neutral electrode (0 V), E2 represents high voltage electrode (60 kV), and I represents the non-conducting tube.
Simulation under laminar flow condition
Figure 7. Temperature profiles across symmetric plane within PEF treatment chambers of different geometry at the end of each interpulse.
Notations: E1 represents neutral electrode (0 V), E2 represents high voltage electrode (60 kV), and I represents the non-conducting tube.
Simulation under turbulent flow condition

1144 Salengke, S., Sastry, S. K. and Zhang, H. Q.
International Food Research Journal 19(3): 1137-1144
Jia, M., Zhang, Q. H. and Min, D. B. 1999. Pulsed electric field processing effects on flavor compounds and microorganisms of orange juice. Food Chemistry 65: 445-451.
Kinosita, K. and Tsong, T.Y. 1977. Voltage-induced pore formation and hemolysis of human erythrocytes. Biochimica et Biophysica Acta 471: 227-242.
Kinosita, K. and Tsong, T.Y. 1979. Voltage-induced conductance in human erythrocyte membranes. Biochimica et Biophysica Acta 554: 479-497.
Knorr, D., Guelen, M., Grahl, T. and Sitzmann, W. 1994. Food application of high electric field pulses. Trends in Food Science and Technology 5: 71-75.
Liu, X., Yousef, A.E. and Chism, G.W. 1996. Inactivation of Escherichia coli O157:H7 by the combination of organaic acids and pulsed electric field. Journal of Food Safety 16: 287-299.
Matsumoto, Y., Satake, T., Shioji, N., and Sakuma, A. 1991. Inactivation of microorganisms by pulsed high voltage applications. Conf. Rec. of IEEE Industrial Applications Society Annual Meeting, pp. 652-659.
Mertens, B. and Knorr, D. 1992. Developments of nonthermal processes for food preservation. Food Technology 46: 124-133.
Mizuno, A. and Hori, Y. 1988. Destruction of living cells by pulsed high-voltage application. IEEE Transaction on Industrial Application 24: 387-394.
Palaniappan, S. and Sastry, S.K. 1991. Electrical conductivity of selected juices: Influences of temperature, solid content, applied voltage, and particle size. Journal of Food Process Engineering 14: 247-260.
Sale, A.J.H. and Hamilton, W.A. 1967. Effect of high electric fields on microorganisms. I. Killing of bacteria and yeast. Biochimica et Biophysica Acta 148: 781-788.
Sale, A.J.H. and Hamilton, W.A. 1968. Effect of high electric fields on microorganisms. III. Lysis of erythrocytes and protoplasts. Biochimica et Biophysica Acta 163: 37-43.
Jin, Z.T. and Zhang, Q.H. 1999. Pulsed electric field inactivation of microorganisms and preservation of quality of cranberry juice. Journal of Food Processing and Preservation 23: 481-497.
Yeom, H.W., Zhang, Q.H. and Dunne, C.P. 1999. Inactivation of papain by pulsed electric fields in a continuous system. Food Chemistry 67: 53-59.
Yin, Y., Zhang, Q.H. and Sastry, S.K. 1997. High voltage pulsed electric field treatment chambers for the preservation of liquid food products. US Patent 5,690,978.
Yoichi, M., Norio, S., Tokuki, S. and Akihiro, S. 1991. Inactivation of microorganisms by pulsed high voltage application. In: IEEE Industry Application Conference Proceedings, pp. 652-659.
Zhang, Q., Monsalve-Gonzáles, A., Barbosa-Cánovas, G.V. and Swanson, B.G. 1994a. Inactivation of E. Coli and S. Cerevisiae by pulsed electric fields under controlled temperature conditions. Transaction of American Society of Agricultural Engineers 32(2):
581-587.Zhang, Q., Chang, F.J., Barbosa-Cánovas, G.V. and
Swanson, B.G. 1994b. Inactivation of microorganisms in a semi-solid model food using high voltage pulsed electric fields. Lebensmittel Wissenschaft Technologie 27: 538-543.
Zhang, Q., Barbosa-Cánovas, G.V. and Swanson, B.G. 1995. Engineering aspects of pulsed electric field pasteurization. Journal of Food Engineering 25: 261-281.
Zimmermann, U. 1986. Electrical breakdown, electropermeabilization and electrofusion. Reviews of Physiology, Biochemistry & Pharmacology 105: 175-256.
Zimmermann, U., Vienken, J. and Pilwat, G. 1980. Development of a drug carrier system: electrical field induced effects in cell membranes. Bioelectrochemistry and Bioenergetics 7: 553-574.
Zimmermann, U., Pilwat, G. and Riemann, F. 1974. Dielectric breakdown of cell membranes. Biophysical Journal 14: 881-899.
Zimmermann, U., Pilwat, G. and Riemann, F. 1976. Effects of external fields on cell membranes. Bioelectrochemistry and Bioenergetics 3: 58-83.