Embed Size (px)
Citation preview
EUR 24521 EN - 2010
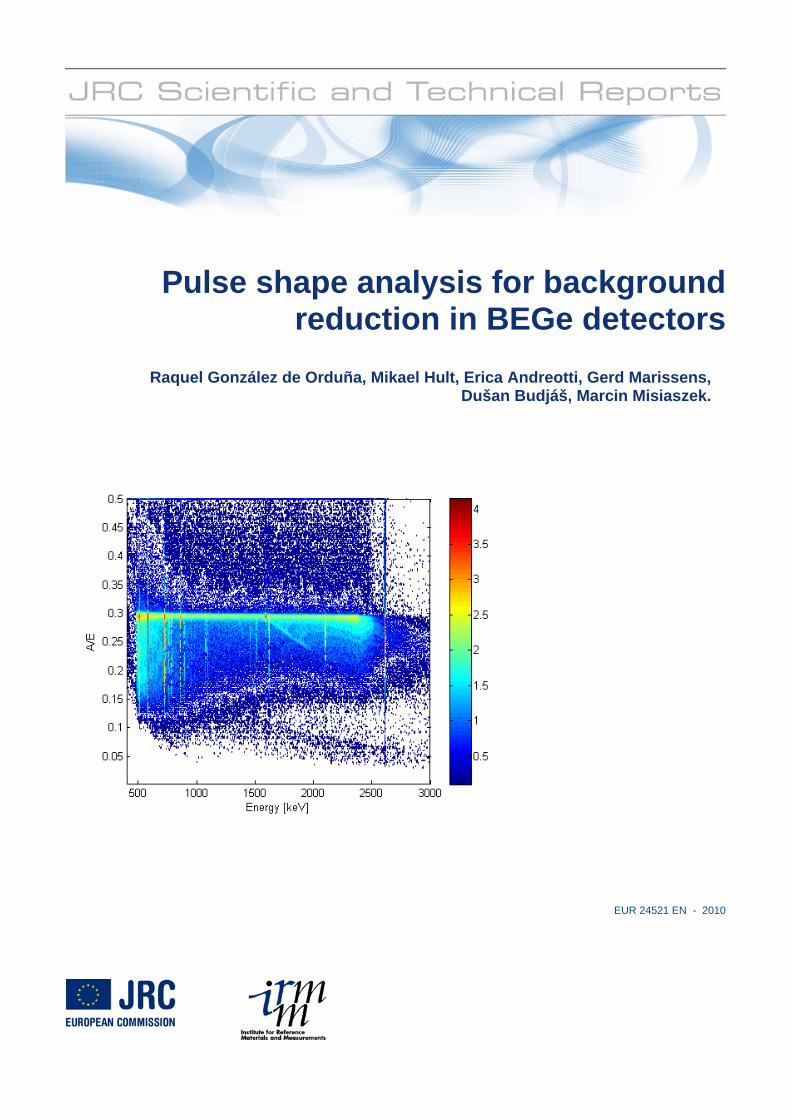
Pulse shape analysis for backgroundreduction in BEGe detectors
Raquel González de Orduña, Mikael Hult, Erica Andreotti, Gerd Marissens,Dušan Budjáš, Marcin Misiaszek.

The mission of the JRC-IRMM is to promote a common and reliable European measurement system in support of EU policies. European Commission Joint Research Centre Institute for Reference Materials and Measurements Contact information Address: Retieseweg 111 B-2440 Geel Belgium E-mail: [email protected] Tel.: +32 (0) 14 571 854 Fax: +32 (0) 14 571 863 http://irmm.jrc.ec.europa.eu/ http://www.jrc.ec.europa.eu/ Legal Notice Neither the European Commission nor any person acting on behalf of the Commission is responsible for the use which might be made of this publication.
Europe Direct is a service to help you find answers to your questions about the European Union
Freephone number (*):
00 800 6 7 8 9 10 11
(*) Certain mobile telephone operators do not allow access to 00 800 numbers or these calls may be billed.
A great deal of additional information on the European Union is available on the Internet. It can be accessed through the Europa server http://europa.eu/ JRC 60405 EUR 24521 EN ISBN 978-92-79-16701-0 ISSN 1018-5593 doi:10.2787/28767 Luxembourg: Publications Office of the European Union © European Union, 2010 Reproduction is authorised provided the source is acknowledged Printed in Belgium

Pulse shape analysis for background reduction in BEGe detectors
Raquel González de Orduña, Mikael Hult, Erica Andreotti, Gerd Marissens
European Commission, Joint Research Centre, Institute for Reference Materials and Measurements
Dušan Budjáš
Max-Planck-Institut für kernphysik, Heidelberg, Germany
Marcin Misiaszek
M.Smoluchowski Institute of Physics, Jagiellonian University, Krakow, Poland

1
Summary Recent developments in pulse shape analysis (PSA) [1] show that detectors with a small read-out contact can be used to discriminate between pulses generated when the deposited energy is located within a small region of about 1 mm3 from the pulses generated when the energy is deposited at different locations several mm or cm apart. Two possible applications using this technique are: i) experiments that look for neutrinoless double beta decay in 76Ge, such as GERDA ii) gamma spectrometry measurements where the Compton continuum can be reduced and the efficiency for cascading gamma-rays can remain high. A commercial detector with similar characteristics as the one described by Barbeau et al. [1] is the so-called BEGe produced by Canberra. A modified model of such type detector was successfully used by Budjáš [2] in the frame of the GERDA experiment. This report presents the results obtained for two standard BEGe detectors, with 19% and 50% relative efficiency respectively, using the same technique for the pulse shape discrimination (PSD) as Budjáš et al. This technique is rather simple; it is based on just one parameter obtained from one signal read out. The aim of this study is to determine the influence of the detector size in the PSD as well as to study the capability of using this PSA to reduce the Compton continuum and thus improve the detection limits. The results obtained show that it is possible to use this PSD technique with commercial BEGe detectors though the discrimination capability is not as good as for specially designed detectors. Two key questions were the electrode size and the electronic noise which have proved to have bigger influence in the PSD than the size of the crystal.

2

3
Table of contents Summary .................................................................................................................................................. 1 Table of contents ...................................................................................................................................... 3 Glossary.................................................................................................................................................... 4 1. Introduction .......................................................................................................................................... 5
1.1 Context ........................................................................................................................................... 5 1.2 Single site and multiple site events ................................................................................................ 6
2. Materials and methods.......................................................................................................................... 7 2.1 BEGe detectors............................................................................................................................... 7 2.2 Flash ADC and VME system ......................................................................................................... 9 2.3 Procedure for data analysis........................................................................................................... 11
3. Results ................................................................................................................................................ 14 3.1 Measurements with Ge-8 above ground....................................................................................... 14 3.2 Measurements with Ge-8 underground ........................................................................................ 15
3.2.1 Acepting SSEs mode ............................................................................................................. 15 3.2.2 Accepting MSEs mode.......................................................................................................... 18
3.3 More test with detector Ge-8 above ground................................................................................. 21 3.4 Measurements with Ge-5 underground ........................................................................................ 23
3.4.1 Accepting SSEs mode ........................................................................................................... 24 3.4.2 Accepting MSEs mode.......................................................................................................... 27
3.5 Effect of the high voltage on the PSA performance..................................................................... 27 3.5.1 Effect of the high voltage in detector Ge-5 ........................................................................... 27 3.5.2 Effect of the high voltage in detector Ge-8 ........................................................................... 29
4. Discussion .......................................................................................................................................... 29 5. Conclusions ........................................................................................................................................ 30 6. Future investigations .......................................................................................................................... 30 Acknowledgements ................................................................................................................................ 31 References .............................................................................................................................................. 31

4
Glossary
PSA: Pulse Shape Analysis;
PSD: Pulse Shape Discrimination;
SSE: Single Site Event;
MSE: Multiple Site Event;
FEP: Full Energy Peak;
DEP: Double Escape Peak;
SEP: Single Escape Peak;
CC: Compton Continuum;
BEGe: Broad Energy Germanium;
GERDA: GERmanium Detector Array;
5
1. Introduction
1.1 Context Pulse shape discrimination of signals from germanium detectors have been studied ever since the introduction of germanium detectors in the early 1960ies. In their paper from 2000, Hellmig and Klapdor-Kleingrothaus [3] list a number of fields where the pulse shape from germanium detectors has been studied. One such example is the identification of pulses induced by gamma-rays, neutrons and protons [4]. In their paper from 1993, Petry et al., [5] describe the identification of multiple site events (MSEs) and single site events (SSEs) (see section 1.2) in coaxial HPGe-detectors. Barbeau et al. [1] studied this using "small electrode Ge-diodes" that are very similar to the commercially available so-called BEGe-detectors [6]. They show in their paper that the temporal features of the pulse shapes enable a more robust discrimination compared to coaxial detectors. Budjáš and co-workers have shown [2, 7] that BEGe-detectors do indeed produce the type of signal that Barbeau et al. describe, and attributed the temporal pulse structure to the specific shape of weighting field inside such detectors. They have furthermore studied the possibility of using this type of detectors for the GERDA experiment. The GERDA experiment [8] aims at studying the nature of the neutrino particle by using one of the double beta decay isotopes, the 76Ge. For this reason Ge-crystals made from germanium enriched in 76Ge are used. A multitude of background reduction techniques are being used in order to optimise the signal to background ratio at the 76Ge decay energy of 2039 keV. To shield against cosmic rays, the experiment will take place in the underground laboratory in Gran Sasso with an overburden of 3800 m water equivalent. The Ge-crystals will be immersed in a cryostat with 65 m3 of LAr, which will serve as coolant and shield for the bare crystals. This cryostat is placed inside a water tank acting as additional shield, where a Cherenkov muon veto with 66 PMTs is also installed. All the materials used for the experiment are chosen by strict radiopurity criteria. However, to reach the goal of reducing the background in a 10 keV interval around 2039 keV to 0.001counts/(keV·kg·year), required for the second phase of the experiment, an additional background suppression system is necessary. The active background reduction can be achieved with segmented detectors [9] or with pulse shape discrimination (PSD) techniques. The decision of which active background reduction system will be used depends on the results of tests that are being carried out with both techniques. A disadvantage of using segmented detectors is the complexity of the readout electronics, and the high number of detector contacts, which give additional sources of background. In order to optimise the usage of the precious enriched materials, for GERDA phase II, it will be necessary to use Ge-crystals of slightly different sizes. It is possible that detectors of different sizes show different characteristics. Additionally all crystals have somewhat different doping and impurity properties and consequently slightly different electrical properties. These differences necessitate slightly different sizes of the read-out contact and affect the pulse shapes. This report presents the results obtained for two standard BEGe detectors, with 19% and 50% relative efficiency respectively, using the same technique for the pulse shape discrimination (PSD) as Budjáš et al. This technique is rather simple; it is based on just one parameter, obtained from one signal read out. The aim of this study is to determine the influence of the detector size in the PSD as well as to study the capability of using this PSA to reduce the Compton continuum and thus improve the detection limits.
6
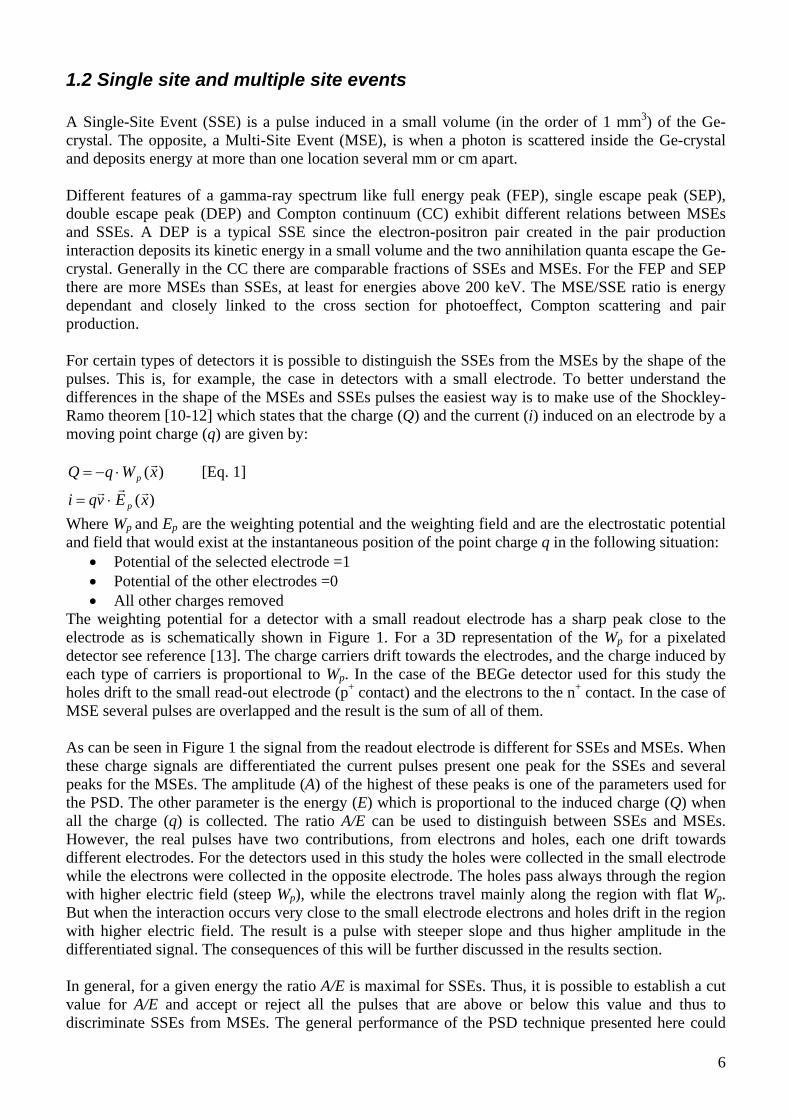
1.2 Single site and multiple site events A Single-Site Event (SSE) is a pulse induced in a small volume (in the order of 1 mm3) of the Ge-crystal. The opposite, a Multi-Site Event (MSE), is when a photon is scattered inside the Ge-crystal and deposits energy at more than one location several mm or cm apart. Different features of a gamma-ray spectrum like full energy peak (FEP), single escape peak (SEP), double escape peak (DEP) and Compton continuum (CC) exhibit different relations between MSEs and SSEs. A DEP is a typical SSE since the electron-positron pair created in the pair production interaction deposits its kinetic energy in a small volume and the two annihilation quanta escape the Ge-crystal. Generally in the CC there are comparable fractions of SSEs and MSEs. For the FEP and SEP there are more MSEs than SSEs, at least for energies above 200 keV. The MSE/SSE ratio is energy dependant and closely linked to the cross section for photoeffect, Compton scattering and pair production. For certain types of detectors it is possible to distinguish the SSEs from the MSEs by the shape of the pulses. This is, for example, the case in detectors with a small electrode. To better understand the differences in the shape of the MSEs and SSEs pulses the easiest way is to make use of the Shockley-Ramo theorem [10-12] which states that the charge (Q) and the current (i) induced on an electrode by a moving point charge (q) are given by:
)(xWqQ p
[Eq. 1]
)(xEvqi p
Where Wp and Ep are the weighting potential and the weighting field and are the electrostatic potential and field that would exist at the instantaneous position of the point charge q in the following situation:
Potential of the selected electrode =1 Potential of the other electrodes =0 All other charges removed
The weighting potential for a detector with a small readout electrode has a sharp peak close to the electrode as is schematically shown in Figure 1. For a 3D representation of the Wp for a pixelated detector see reference [13]. The charge carriers drift towards the electrodes, and the charge induced by each type of carriers is proportional to Wp. In the case of the BEGe detector used for this study the holes drift to the small read-out electrode (p+ contact) and the electrons to the n+ contact. In the case of MSE several pulses are overlapped and the result is the sum of all of them. As can be seen in Figure 1 the signal from the readout electrode is different for SSEs and MSEs. When these charge signals are differentiated the current pulses present one peak for the SSEs and several peaks for the MSEs. The amplitude (A) of the highest of these peaks is one of the parameters used for the PSD. The other parameter is the energy (E) which is proportional to the induced charge (Q) when all the charge (q) is collected. The ratio A/E can be used to distinguish between SSEs and MSEs. However, the real pulses have two contributions, from electrons and holes, each one drift towards different electrodes. For the detectors used in this study the holes were collected in the small electrode while the electrons were collected in the opposite electrode. The holes pass always through the region with higher electric field (steep Wp), while the electrons travel mainly along the region with flat Wp. But when the interaction occurs very close to the small electrode electrons and holes drift in the region with higher electric field. The result is a pulse with steeper slope and thus higher amplitude in the differentiated signal. The consequences of this will be further discussed in the results section. In general, for a given energy the ratio A/E is maximal for SSEs. Thus, it is possible to establish a cut value for A/E and accept or reject all the pulses that are above or below this value and thus to discriminate SSEs from MSEs. The general performance of the PSD technique presented here could

7
perhaps be improved by using more sophisticated algorithms. This is a study that will be developed by the GERDA collaboration.
Figure 1: Schematic representation of the weighting potential for a detector with a small read-out electrode. Shape of the charge pulses induced in the electrode in the case of SSE and MSE. Shape of the differentiated current signals for a SSE and MSE.
2. Materials and methods
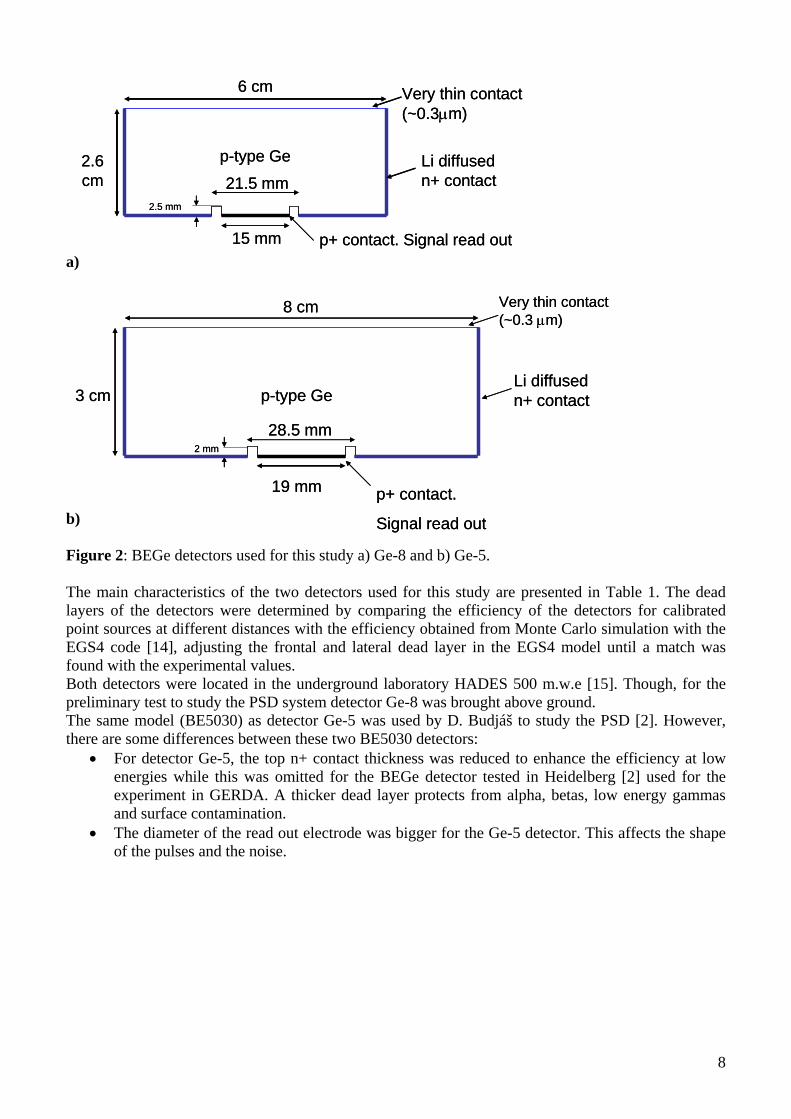
2.1 BEGe detectors A commercial detector with potentially good PSD features is the BEGe detector (Broad Energy Germanium) produced by Canberra [6]. It is a planar p-type detector with a relatively small electrode on the back side (p+ contact), a very thin contact (~0.3 m) in the front side and a Li-drifted n+ contact covering the lateral and bottom part. Two detectors of this type were used for this exploratory project. The dimensions of these detectors are shown in Figure 2.
8
a) b) Figure 2: BEGe detectors used for this study a) Ge-8 and b) Ge-5. The main characteristics of the two detectors used for this study are presented in Table 1. The dead layers of the detectors were determined by comparing the efficiency of the detectors for calibrated point sources at different distances with the efficiency obtained from Monte Carlo simulation with the EGS4 code [14], adjusting the frontal and lateral dead layer in the EGS4 model until a match was found with the experimental values. Both detectors were located in the underground laboratory HADES 500 m.w.e [15]. Though, for the preliminary test to study the PSD system detector Ge-8 was brought above ground. The same model (BE5030) as detector Ge-5 was used by D. Budjáš to study the PSD [2]. However, there are some differences between these two BE5030 detectors:
For detector Ge-5, the top n+ contact thickness was reduced to enhance the efficiency at low energies while this was omitted for the BEGe detector tested in Heidelberg [2] used for the experiment in GERDA. A thicker dead layer protects from alpha, betas, low energy gammas and surface contamination.
The diameter of the read out electrode was bigger for the Ge-5 detector. This affects the shape of the pulses and the noise.
6 cm
2.6 cm
15 mm
p-type Ge Li diffused n+ contact
p+ contact. Signal read out
21.5 mm2.5 mm
Very thin contact (~0.3m)
6 cm
2.6 cm
15 mm
p-type Ge Li diffused n+ contact
p+ contact. Signal read out
21.5 mm2.5 mm
Very thin contact (~0.3m)
8 cm
3 cm
19 mm
p-type GeLi diffused n+ contact
p+ contact.
Signal read out
28.5 mm2 mm
Very thin contact (~0.3 m)
8 cm
3 cm
19 mm
p-type GeLi diffused n+ contact
p+ contact.
Signal read out
28.5 mm2 mm
Very thin contact (~0.3 m)

9
Table 1: Characteristics of the two BEGe detectors used for the PSA.
Name Ge-5 Ge-8
Location HADES HADES
Type Planar (BEGe) Planar (BEGe)
Model BE5030 BE2825
Manufactory year 2001 2008 (change of endcap)
2006
Relative Efficiency (%) 50 19
Crystal type P P
Manufacturer Canberra Canberra
Diameter (cm) 8 6
Thickness (cm) 3 2.6
Electrode diameter (cm) 1.9 1.5
FWHM (%) at 122 keV 0.72 0.644
FWHM (%) at 1333 keV 1.978 1.715
Preamplifier 2002CP 2002C
Depletion voltage +3500V +3000V
Recommended bias +4000V +3500V
Total volume (cm3) 155 14.45
Active volume (cm3) 143.2 12.38
Mass (g) 825 77
Top dead layer (cm) 210-4 310-5
Lateral dead layer (cm) 0.08 0.08
Window type LB-Al LB-Al
Window thickness (mm) 1.5 1.5
Cryostat U-style Integral U-style Integral
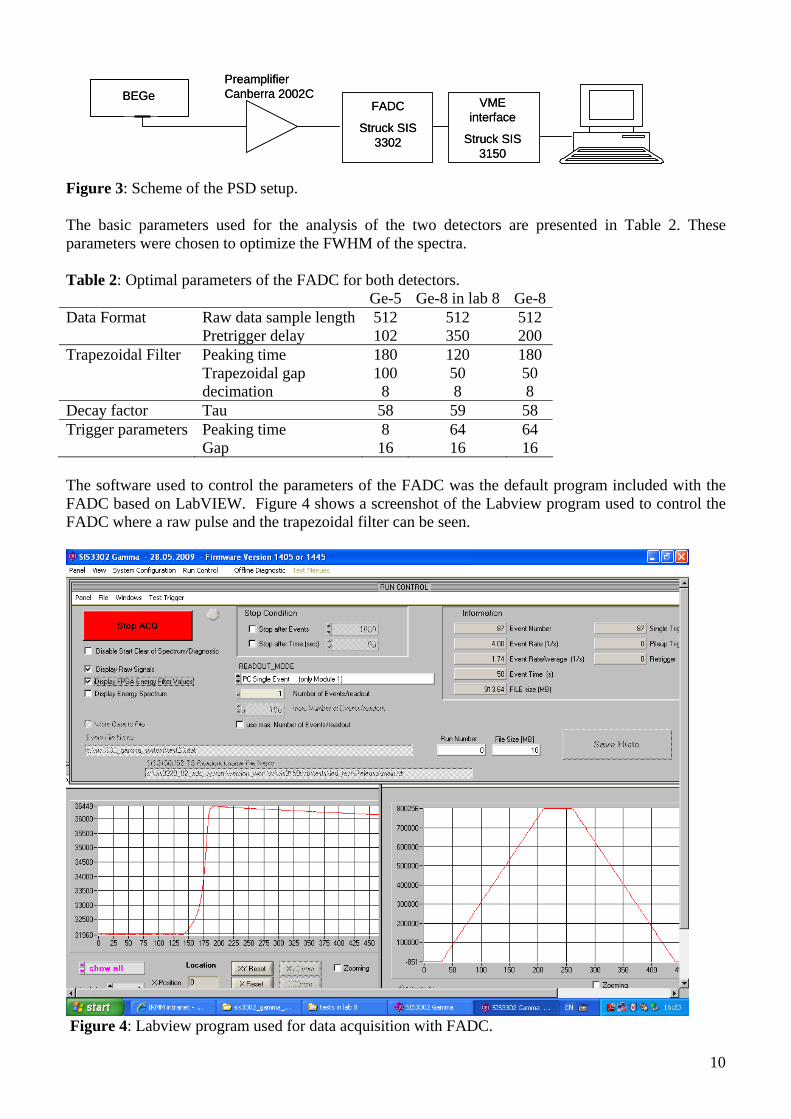
2.2 Flash ADC and VME system The front-end electronics consisted of a Canberra preamplifier Model 2002C connected to a flash-ADC (Struck SIS 3302) with 100 MSamples/s, and 16 bit resolution connected to the computer via a VME interface (Struck SIS 3150) (see Figure 3). With this setup the signal traces were recorded. Additionally, real time processing of the signals was performed with a software trapezoidal filter and an energy spectrum was produced on line.
10
Figure 3: Scheme of the PSD setup. The basic parameters used for the analysis of the two detectors are presented in Table 2. These parameters were chosen to optimize the FWHM of the spectra. Table 2: Optimal parameters of the FADC for both detectors. Ge-5 Ge-8 in lab 8 Ge-8Data Format Raw data sample length 512 512 512 Pretrigger delay 102 350 200 Trapezoidal Filter Peaking time 180 120 180 Trapezoidal gap 100 50 50 decimation 8 8 8 Decay factor Tau 58 59 58 Trigger parameters Peaking time 8 64 64 Gap 16 16 16 The software used to control the parameters of the FADC was the default program included with the FADC based on LabVIEW. Figure 4 shows a screenshot of the Labview program used to control the FADC where a raw pulse and the trapezoidal filter can be seen.
Figure 4: Labview program used for data acquisition with FADC.
BEGePreamplifier Canberra 2002C
FADC
Struck SIS 3302
VME interface
Struck SIS 3150
BEGePreamplifier Canberra 2002C
FADC
Struck SIS 3302
VME interface
Struck SIS 3150

11
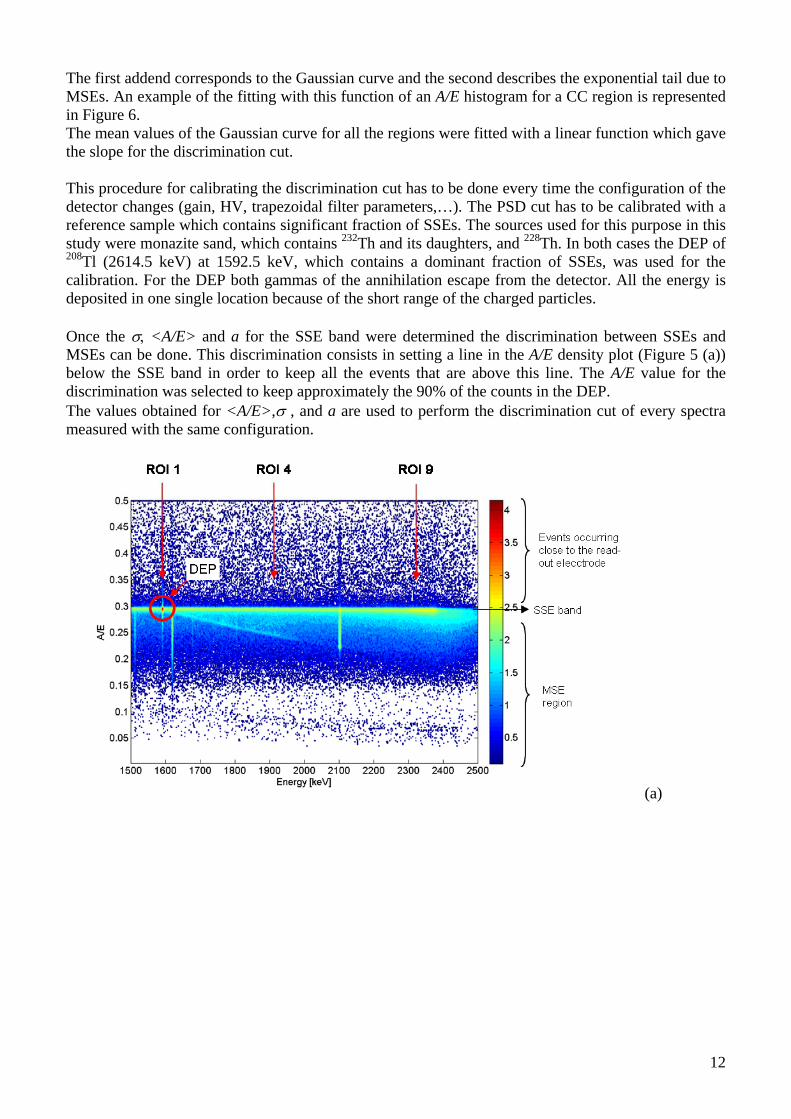
2.3 Procedure for data analysis The raw data, consisting of a file with the pulses from the preamplifier, were analysed off-line. The first step was to obtain the energy histogram, which was used for the energy calibration, and the pairs of amplitude (A) and energy (E) for each pulse. E was determined as the difference between the maximum and the minimum value of the signal after passing a software trapezoidal filter. To determine A, the signal was differentiated (10 ns) and then smoothed (50 ns). The parameter used to establish the cut between SSEs and MSEs was the ratio A/E. Figure 5 shows A/E as function of E for data from a 228Th sample with all daughters in equilibrium together with the energy spectrum and the histogram of the A/E distribution for three regions in the spectum. A horizontal band, with a higher density of events, is clearly visible in Figure 5 (a) and corresponds to the SSEs. Below this band is the MSE region, where for a given energy, the amplitude of the highest peak in the differentiated signal is smaller than for the SSE, which has only one peak (See Figure. 1). The events above the SSE band probably correspond to events that occur very close to the read-out electrode and will be further discussed in the results section. The vertical lines that can be seen in the A/E density plot correspond to FEPs. A DEP appears as a high density spot at 1592 keV in the SSE line. For a given energy, the profile of the SSE band can be approximated by a Gaussian curve with an exponential tail. Figure 5 (c) shows this profile for the three regions of the 228Th spectrum that are indicated in Figure 5 (a) and (b). The limits of the regions are given in Table 3. To determine the cut value it is necessary first to calculate the width () and mean value <A/E> of the Gaussian curve. Though the SSE line appears to be constant with energy it is not entirely the case. Before making the cut to discriminate SSEs and MSEs it is necessary to determine the slope (a) of this line. In order to do this, several CC regions of the spectrum, which also contain a significant fraction of SSEs, were selected (see Table 3). Table 3: Regions of interest selected for calculate the slope a of the linear dependence of <A/E> with E.
ROI Left marker (keV) Right marker 1 (DEP) 1591 1594 2 1520 1570 3 1770 1820 4 1895 1935 5 2010 2050 6 2125 2165 7 2225 2255 8 2295 2320 9 2320 2345 10 2345 2365 11 2365 2385
The histograms of the A/E distribution in these regions were fitted with a Gaussian plus exponential tail function using the following equation:
1exp
exp
2exp
2)(
2
2
t
lx
dlxec
s
mx
s
nxf
Eq [2]
12
The first addend corresponds to the Gaussian curve and the second describes the exponential tail due to MSEs. An example of the fitting with this function of an A/E histogram for a CC region is represented in Figure 6. The mean values of the Gaussian curve for all the regions were fitted with a linear function which gave the slope for the discrimination cut. This procedure for calibrating the discrimination cut has to be done every time the configuration of the detector changes (gain, HV, trapezoidal filter parameters,…). The PSD cut has to be calibrated with a reference sample which contains significant fraction of SSEs. The sources used for this purpose in this study were monazite sand, which contains 232Th and its daughters, and 228Th. In both cases the DEP of 208Tl (2614.5 keV) at 1592.5 keV, which contains a dominant fraction of SSEs, was used for the calibration. For the DEP both gammas of the annihilation escape from the detector. All the energy is deposited in one single location because of the short range of the charged particles. Once the <A/E> and a for the SSE band were determined the discrimination between SSEs and MSEs can be done. This discrimination consists in setting a line in the A/E density plot (Figure 5 (a)) below the SSE band in order to keep all the events that are above this line. The A/E value for the discrimination was selected to keep approximately the 90% of the counts in the DEP. The values obtained for <A/E>, , and a are used to perform the discrimination cut of every spectra measured with the same configuration.
(a)

13
(b)
(c) Figure 5. (a) A/E density plot as function of the energy for a 228Th sample measured in detector Ge-8. (b) Spectrum from the same measurement. (c) Histogram of the A/E distribution for three regions of interest (ROI).
Exponential tail
Gaussian curve
Exponential tail
Gaussian curve
Figure 6: Gaussian plus exponential tail fit for the A/E histogram of ROI 4
14
3. Results
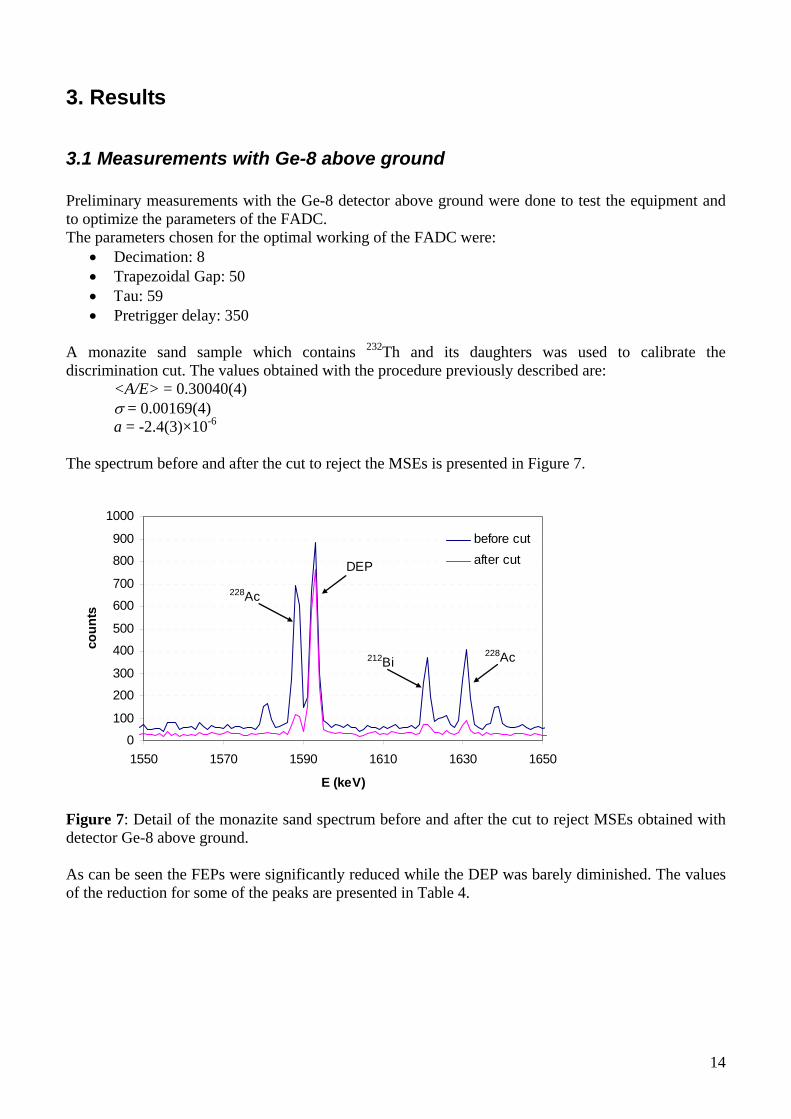
3.1 Measurements with Ge-8 above ground Preliminary measurements with the Ge-8 detector above ground were done to test the equipment and to optimize the parameters of the FADC. The parameters chosen for the optimal working of the FADC were:
Decimation: 8 Trapezoidal Gap: 50 au: 59 Pretrigger delay: 350
A monazite sand sample which contains 232Th and its daughters was used to calibrate the discrimination cut. The values obtained with the procedure previously described are:
<A/E> = 0.30040(4) = 0.00169(4) a = -2.4(3)×10-6
The spectrum before and after the cut to reject the MSEs is presented in Figure 7.
0
100
200
300
400
500
600
700
800
900
1000
1550 1570 1590 1610 1630 1650
E (keV)
cou
nts
before cut
after cutDEP
228Ac
228Ac212Bi
Figure 7: Detail of the monazite sand spectrum before and after the cut to reject MSEs obtained with detector Ge-8 above ground. As can be seen the FEPs were significantly reduced while the DEP was barely diminished. The values of the reduction for some of the peaks are presented in Table 4.

15
Table 4: PSD cut acceptances for the measurement with monazite sand in detector Ge-8 above ground DEP FEP SEP
1592 keV
1620 keV
1588 keV
2614 keV
2103 keV
Counts before cut 2203 893 1799 9320 1790 Counts after cut 1828 233 349 1189 292 % accepted SSE 83% 26% 19.4% 12.8% 16.3%
% discarded MSE 17% 74% 80.6% 87.2% 83.7% The result is satisfactory although is not as good as for Budjáš et al. [2] but considering the differences in size of the crystal and electrodes this differences were expected.
3.2 Measurements with Ge-8 underground After the preliminary test, the detector Ge-8 was placed back in the underground laboratory HADES, where the background due to cosmic rays is significantly smaller. A few more adjustments in the FADC parameters were done to improve the energy resolution. Though no big changes in the calibration settings for the cut discrimination were expected a new calibration was performed using again the monazite sand. The results obtained were:
<A/E> = 0.30322(6) = 0.00194(6) a = -2.3(2)×10-6
3.2.1 Accepting SSEs mode By applying the discrimination cut obtained from the calibration procedure previously described to reject the MSEs, the result obtained was a significant reduction of the FEPs and CC. A detail of the spectrum of monazite sand before and after the cut is presented in Figure 8. Figure 8: Detail of the monazite sand (232Th) spectrum obtained with detector Ge-8 in HADES, before and after applying the pulse shape discrimination cut to reject the MSE. The percentage of accepted SSEs for different FEP and CC regions of the monazite sand spectrum are represented in Figure 9 (a) This percentage is linked to the cross section for photoeffect, compton and
0
200
400
600
800
1000
1550 1570 1590 1610 1630 1650
E (keV)
coun
ts
Before
AfterDEP228Ac
228Ac212Bi
0
200
400
600
800
1000
1550 1570 1590 1610 1630 1650
E (keV)
coun
ts
Before
AfterDEP228Ac
228Ac212Bi
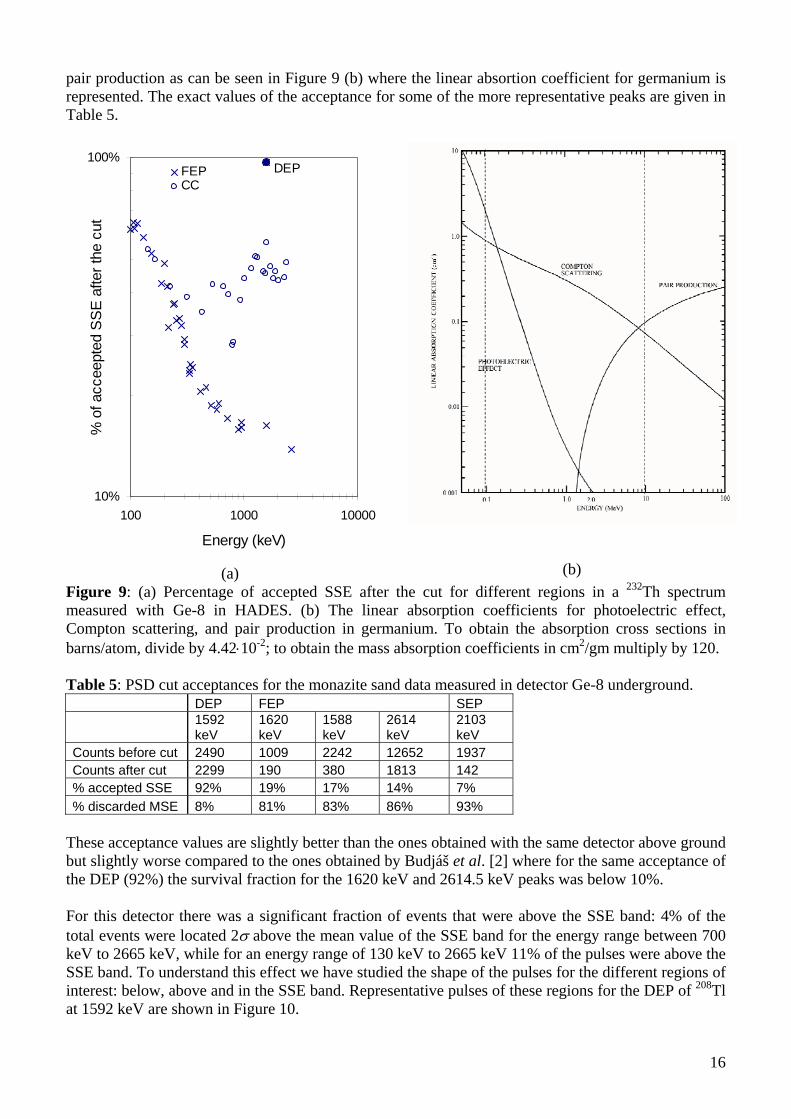
16
pair production as can be seen in Figure 9 (b) where the linear absortion coefficient for germanium is represented. The exact values of the acceptance for some of the more representative peaks are given in Table 5.
10%
100%
100 1000 10000
Energy (keV)
% o
f acc
eept
ed S
SE
afte
r th
e cu
t
FEPCCSEPDEP
DEP
(a)
(b)
Figure 9: (a) Percentage of accepted SSE after the cut for different regions in a 232Th spectrum measured with Ge-8 in HADES. (b) The linear absorption coefficients for photoelectric effect, Compton scattering, and pair production in germanium. To obtain the absorption cross sections in barns/atom, divide by 4.4210-2; to obtain the mass absorption coefficients in cm2/gm multiply by 120. Table 5: PSD cut acceptances for the monazite sand data measured in detector Ge-8 underground. DEP FEP SEP
1592 keV
1620 keV
1588 keV
2614 keV
2103 keV
Counts before cut 2490 1009 2242 12652 1937 Counts after cut 2299 190 380 1813 142 % accepted SSE 92% 19% 17% 14% 7%
% discarded MSE 8% 81% 83% 86% 93% These acceptance values are slightly better than the ones obtained with the same detector above ground but slightly worse compared to the ones obtained by Budjáš et al. [2] where for the same acceptance of the DEP (92%) the survival fraction for the 1620 keV and 2614.5 keV peaks was below 10%. For this detector there was a significant fraction of events that were above the SSE band: 4% of the total events were located 2 above the mean value of the SSE band for the energy range between 700 keV to 2665 keV, while for an energy range of 130 keV to 2665 keV 11% of the pulses were above the SSE band. To understand this effect we have studied the shape of the pulses for the different regions of interest: below, above and in the SSE band. Representative pulses of these regions for the DEP of 208Tl at 1592 keV are shown in Figure 10.

17
Below SSE band
In SSE band
Below SSE band
Above SSE band
Below SSE band
In SSE band
Below SSE band
Above SSE band
Below SSE band
In SSE band
Below SSE band
Above SSE band
Figure 10: Representative pulses for the 1592 keV DEP of the 2614 keV line from 208Tl in the monazite sand sample The difference between pulses above and below the SSE line is the shape of the pulse. All the events above the line have a steeper slope. A possible reason to have these steep pulses is, as explained before, due to events that occur very close to the electrode where the slope of the Wp rises abruptly, and thus the electric field is higher. We don’t know the exact Wp for this detector but we expect to have similar Wp as for pixelated detectors that can be found in the literature [13]. To confirm if the events above the SSE line are due to interactions occurring close to the electrode it would be necessary to scan the detector with a collimated gamma-ray beam. The events above the SSE band are mainly SSEs. However, some examples of MSEs have also been found above the SSE band. This is for example the case when one of the events in an MSE deposits most part of its energy very close to the readout electrode. Since most of the events above the SSE band are SSEs, the discrimination technique based on rejecting or accepting the events above this line can still be used for this detector. There is another undesirable effect found in the raw pulses of the detector due to electronic noise. An example of this noise distorting the pulse signal is shown in Figure 11.
Figure 11: Effect of electronic noise for detector Ge-8 operating in HADES laboratory. On top: raw pulse from the preamplifier. On bottom: differentiated pulse.
18
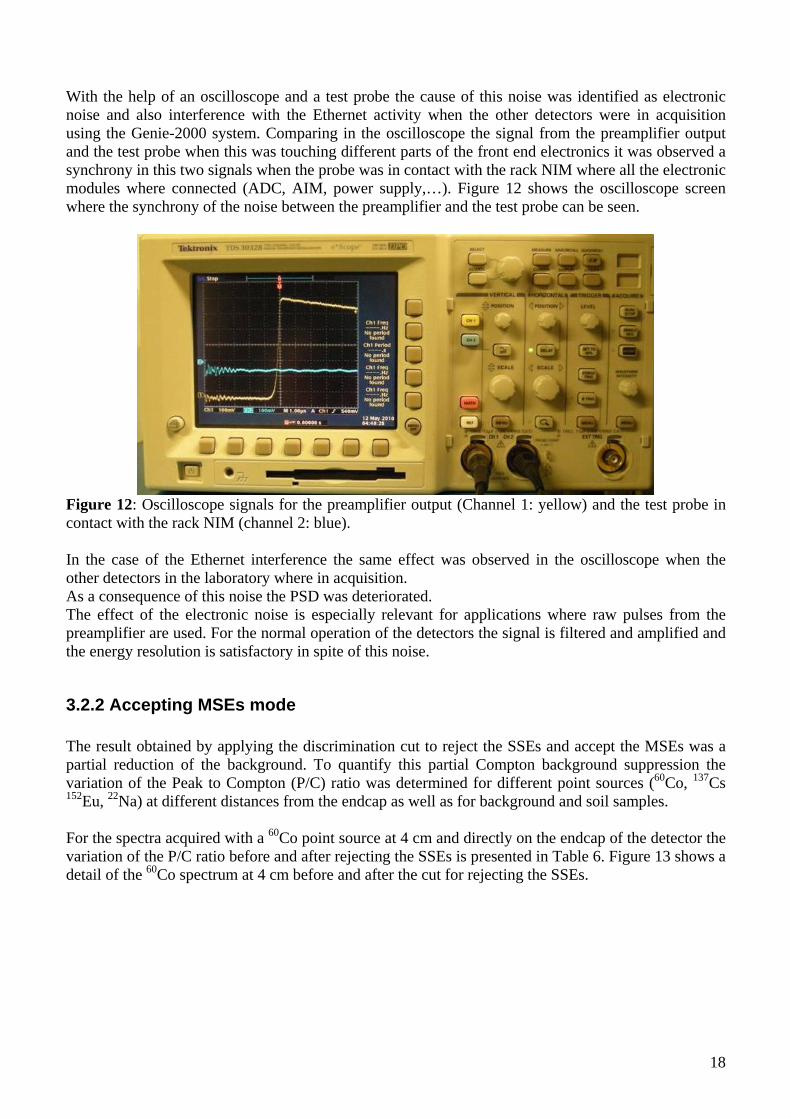
With the help of an oscilloscope and a test probe the cause of this noise was identified as electronic noise and also interference with the Ethernet activity when the other detectors were in acquisition using the Genie-2000 system. Comparing in the oscilloscope the signal from the preamplifier output and the test probe when this was touching different parts of the front end electronics it was observed a synchrony in this two signals when the probe was in contact with the rack NIM where all the electronic modules where connected (ADC, AIM, power supply,…). Figure 12 shows the oscilloscope screen where the synchrony of the noise between the preamplifier and the test probe can be seen.
Figure 12: Oscilloscope signals for the preamplifier output (Channel 1: yellow) and the test probe in contact with the rack NIM (channel 2: blue). In the case of the Ethernet interference the same effect was observed in the oscilloscope when the other detectors in the laboratory where in acquisition. As a consequence of this noise the PSD was deteriorated. The effect of the electronic noise is especially relevant for applications where raw pulses from the preamplifier are used. For the normal operation of the detectors the signal is filtered and amplified and the energy resolution is satisfactory in spite of this noise.
3.2.2 Accepting MSEs mode The result obtained by applying the discrimination cut to reject the SSEs and accept the MSEs was a partial reduction of the background. To quantify this partial Compton background suppression the variation of the Peak to Compton (P/C) ratio was determined for different point sources (60Co, 137Cs 152Eu, 22Na) at different distances from the endcap as well as for background and soil samples. For the spectra acquired with a 60Co point source at 4 cm and directly on the endcap of the detector the variation of the P/C ratio before and after rejecting the SSEs is presented in Table 6. Figure 13 shows a detail of the 60Co spectrum at 4 cm before and after the cut for rejecting the SSEs.

19
Table 6: Variation of the P/C ratio and survival fraction of the FEP and CC before and after rejecting the SSEs for 60Co spectra acquired with detector Ge-8 in HADES laboratory. 60Co directly on the
endcap
60Co at 4 cm
P/C before the cut (1332 keV) 33.0 33.2 P/C after the cut (1332 keV) 54.3 64.6 P/C variation after SSEs rejection (1332 keV) 39% 49% Survival fraction of SSE in the 1332 keV peak 17% 18% Survival fraction of SSE in the CC region [1040-1096] 49% 58% P/C before the cut (1173 keV) 44.7 45.6 P/C after the cut (1173 keV) 105.9 115.1 P/C variation after SSEs rejection (1173 keV) 58% 60% Survival fraction of SSE in the 1173 keV peak 15% 18% Survival fraction of SSE in the CC region [600-656] 64% 67%
1
10
100
1000
10000
100 300 500 700 900 1100 1300
Energy (keV)
Co
un
ts p
er
ke
V
Total
MSE
3.5
1
10
100
1000
1150 1160 1170 1180 1190 1200
Total
MSE
SSE
1
10
100
1000
10000
100 300 500 700 900 1100 1300
Energy (keV)
Co
un
ts p
er
ke
V
Total
MSE
3.5
1
10
100
1000
1150 1160 1170 1180 1190 1200
Total
MSE
SSE
Figure 13: Data collected from a 60Co point source positioned at 4 cm from the endcap. The inlet figure shows the peak at 1173 keV The results corresponding to a 137Cs point source are presented in Table 7. A detail of the spectrum of 137Cs on the endcap before and after the cut is presented in Figure 14.
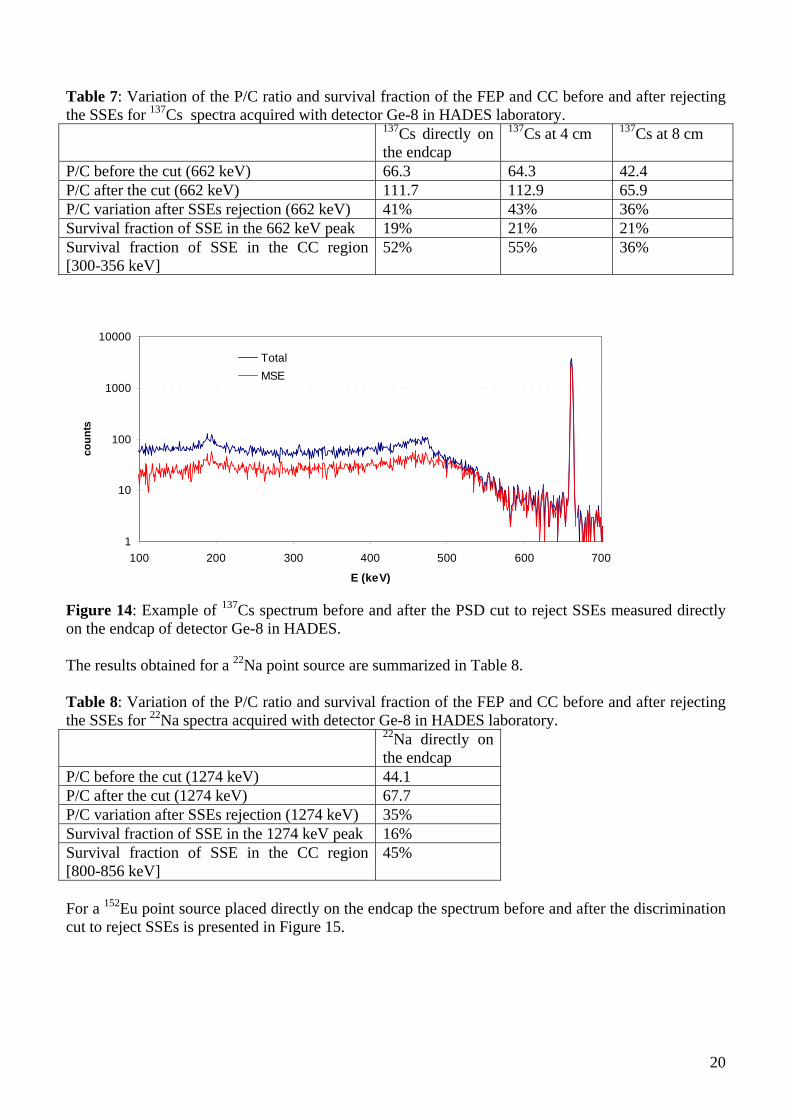
20
Table 7: Variation of the P/C ratio and survival fraction of the FEP and CC before and after rejecting the SSEs for 137Cs spectra acquired with detector Ge-8 in HADES laboratory. 137Cs directly on
the endcap
137Cs at 4 cm 137Cs at 8 cm
P/C before the cut (662 keV) 66.3 64.3 42.4 P/C after the cut (662 keV) 111.7 112.9 65.9 P/C variation after SSEs rejection (662 keV) 41% 43% 36% Survival fraction of SSE in the 662 keV peak 19% 21% 21% Survival fraction of SSE in the CC region [300-356 keV]
52% 55% 36%
1
10
100
1000
10000
100 200 300 400 500 600 700
E (keV)
cou
nts
Total
MSE
Figure 14: Example of 137Cs spectrum before and after the PSD cut to reject SSEs measured directly on the endcap of detector Ge-8 in HADES. The results obtained for a 22Na point source are summarized in Table 8. Table 8: Variation of the P/C ratio and survival fraction of the FEP and CC before and after rejecting the SSEs for 22Na spectra acquired with detector Ge-8 in HADES laboratory. 22Na directly on
the endcap P/C before the cut (1274 keV) 44.1 P/C after the cut (1274 keV) 67.7 P/C variation after SSEs rejection (1274 keV) 35% Survival fraction of SSE in the 1274 keV peak 16% Survival fraction of SSE in the CC region [800-856 keV]
45%
For a 152Eu point source placed directly on the endcap the spectrum before and after the discrimination cut to reject SSEs is presented in Figure 15.

21
1
10
100
1000
10000
100 300 500 700 900 1100 1300 1500E (keV)
cou
nts
Total
MSE
Figure 15: 152Eu spectra before and after the cut to reject SSEs. It is clear that the suppression efficiency achieved with this technique is not as great as with a well designed Compton suppression system using NaI or BGO detectors surrounding a HPGe-detector. However, some advantages are worth to point out:
(i) This system has relatively high suppression efficiency at lower energies. In traditional systems, scattered gamma-rays must leave one detector and enter into a second one in order to provide a veto signal. Attenuation in the Ge-crystal holder and the walls of the Ge-detector and NaI detector result in a low suppression efficiency at lower energies. It can also be difficult to position a veto detector "behind" the Ge-detector, which is necessary to detect gamma-rays with small scattering angles.
(ii) This system does not eliminate the FEPs of cascading gamma-rays. (iii) The hardware for this system constitutes a lower cost.
A combination of this technique with a traditional Compton suppression system, similar to what Jung et al. [16] did for coaxial detectors, could give an extra edge in reducing the background. This can prove to be vital in certain applications such as detecting 137Cs (E=662 keV) in soil or 7Be (E=478 keV) in air filters.
3.3 More tests with detector Ge-8 above ground After we found the problem with the electronic noise in the signal for both detectors in HADES we decided to take again detector Ge-8 above ground (lab. 8) to perform more tests. It was observed that the noise due to the Ethernet interference remained but the electronic noise level was significantly smaller in this laboratory. A new acquired 228Th source was used this time for the calibration procedure. The advantage of 228Th over the monazite sand is the absence of 228Ac peaks, specially the peak at 1588 keV which is very close to the DEP. The parameters obtained in this case for the discrimination cut were:
<A/E> = 0.29795(3) = 0.00169(3) a = -2.17(9)×10-6
The results obtained with this source are presented in Figure 16 and Table 9.
22
0%
10%
20%
30%
40%
50%
60%
70%
80%
90%
100%
0 500 1000 1500 2000 2500 3000
E (keV)
% a
ccep
ted
SS
E
FEP
CC
DEP
SEP
DEP
SEP
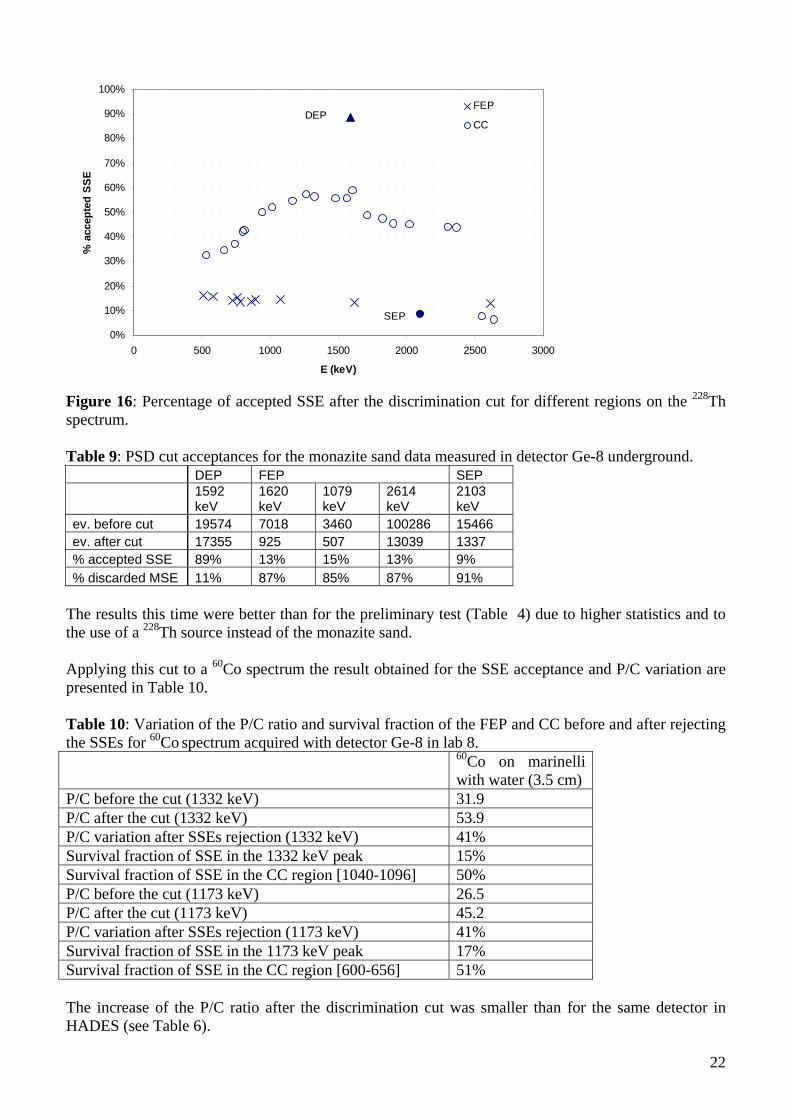
Figure 16: Percentage of accepted SSE after the discrimination cut for different regions on the 228Th spectrum. Table 9: PSD cut acceptances for the monazite sand data measured in detector Ge-8 underground. DEP FEP SEP
1592 keV
1620 keV
1079 keV
2614 keV
2103 keV
ev. before cut 19574 7018 3460 100286 15466 ev. after cut 17355 925 507 13039 1337 % accepted SSE 89% 13% 15% 13% 9%
% discarded MSE 11% 87% 85% 87% 91% The results this time were better than for the preliminary test (Table 4) due to higher statistics and to the use of a 228Th source instead of the monazite sand. Applying this cut to a 60Co spectrum the result obtained for the SSE acceptance and P/C variation are presented in Table 10. Table 10: Variation of the P/C ratio and survival fraction of the FEP and CC before and after rejecting the SSEs for 60Co spectrum acquired with detector Ge-8 in lab 8. 60Co on marinelli
with water (3.5 cm) P/C before the cut (1332 keV) 31.9 P/C after the cut (1332 keV) 53.9 P/C variation after SSEs rejection (1332 keV) 41% Survival fraction of SSE in the 1332 keV peak 15% Survival fraction of SSE in the CC region [1040-1096] 50% P/C before the cut (1173 keV) 26.5 P/C after the cut (1173 keV) 45.2 P/C variation after SSEs rejection (1173 keV) 41% Survival fraction of SSE in the 1173 keV peak 17% Survival fraction of SSE in the CC region [600-656] 51% The increase of the P/C ratio after the discrimination cut was smaller than for the same detector in HADES (see Table 6).

23
With the intention of finding some other applications where the PSD between SSEs and MSEs could be useful a possibility is to look for the DEP, which contains a dominant fraction of SSEs. However, the DEPs are generally very small and thus the advantage of reducing or preserving them in the spectrum is probably not crucial for any application. An example of radionuclide that may have an appreciable contribution of DEP is the 2H produced in the 1H(n,)2H reaction which have a FEP at 2223 keV and the DEP at 1201 keV. To increase the production yield of this reaction a Marinelli beaker filled with water was placed on the endcap of the detector and a shield of paraffin and lead was surrounding the detector. Water and paraffin contain H and the lead act as a neutron multiplier. The result obtained for this measure is presented in Figure 17.
10
100
1000
2150 2170 2190 2210 2230 2250
E (keV)
coun
ts
TotalSSEMSE
H-22223 keV
(a)
100
1000
1150 1170 1190 1210 1230 1250
E (keV)
coun
ts
TotalSSEMSE
DEP1201 keV
(b)
1
10
100
1000
10000
2550 2570 2590 2610 2630 2650
E (keV)
coun
ts
TotalSSEMSE
Tl-2082614 keV
(c)
10
100
1000
1550 1570 1590 1610 1630 1650
E (keV)
coun
ts
TotalSSEMSE
DEP1592 keV
(d)
Figure 17: Four details of the background spectrum in detector Ge-8 with a marinelli filled with water on the endcap a) FEP of 2H at 2223 keV, b) region where the DEP of the 2H should appear, c) FEP of 208Tl, d) DEP of 208Tl. The DEP of 208Tl is clearly visible in the spectrum (Figure 17 (d)) while for 2H there is no DEP observed at 1201 keV (Figure 17 (b)).
3.4 Measurements with Ge-5 underground The same procedure for the calibration was used for detector Ge-5. The parameters of the FADC are presented in Table 2. For the calibration of the discrimination cut a monazite sand sample was used and the values obtained for the calibration parameters were:
<A/E> = 0.15498(5)
24
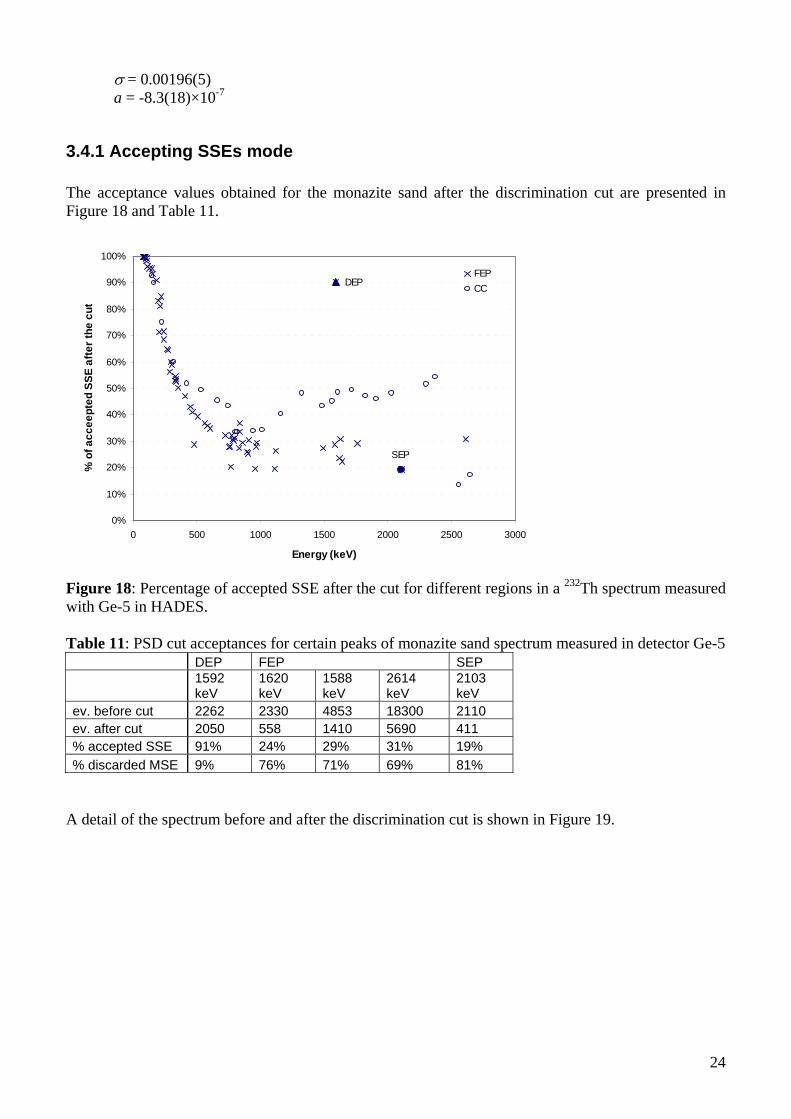
= 0.00196(5) a = -8.3(18)×10-7
3.4.1 Accepting SSEs mode The acceptance values obtained for the monazite sand after the discrimination cut are presented in Figure 18 and Table 11.
0%
10%
20%
30%
40%
50%
60%
70%
80%
90%
100%
0 500 1000 1500 2000 2500 3000
Energy (keV)
% o
f a
cc
ee
pte
d S
SE
aft
er
the
cu
t
FEP
CC
SEP
DEP
DEP
SEP
Figure 18: Percentage of accepted SSE after the cut for different regions in a 232Th spectrum measured with Ge-5 in HADES. Table 11: PSD cut acceptances for certain peaks of monazite sand spectrum measured in detector Ge-5 DEP FEP SEP
1592 keV
1620 keV
1588 keV
2614 keV
2103 keV
ev. before cut 2262 2330 4853 18300 2110 ev. after cut 2050 558 1410 5690 411 % accepted SSE 91% 24% 29% 31% 19%
% discarded MSE 9% 76% 71% 69% 81% A detail of the spectrum before and after the discrimination cut is shown in Figure 19.

25
0
500
1000
1500
2000
1550 1570 1590 1610 1630 1650
E (keV)
Co
un
ts
Before
After
DEP228Ac 228Ac
212Bi
0
500
1000
1500
2000
1550 1570 1590 1610 1630 1650
E (keV)
Co
un
ts
Before
After
DEP228Ac 228Ac
212Bi
Figure 19: 232Th spectrum with Ge-5 in HADES before and after the cut. As can be seen the discrimination performance of this detector is worse than for detector Ge-8. The same problem with the electronic noise was also found here, as well as a large number of events above the SSE band (see Figure 20). Figure 20: A/E density plot in function of the energy for a monazite sand sample measured in detector Ge-5.
Region A
Region B
Region C
Region A
Region B
Region C

26
Some examples of the pulses found in the different regions of the A/E density plot indicated in Figure 20 are presented in Figure 21.
(a)
(b)
(c) Figure 21: Representation of different types of pulses for a monazite sand sample in detector Ge-5 for different regions: (a) pulses above the SSE band, (b) pulses in the SSE band and (c) pulses below the SSE band. As can be seen the electronic noise was present in several pulses spoiling significantly the PSD performance. The pulses in region A (above SSEs band) were not always due to SSE but also some MSE were found. It is clear, however, that the pulses in this region present steep slope as in the case of detector Ge-8, and thus we can assume that are due to events occurring close to the readout electrode. Although this detector has the same size as the one used in [2] there were some differences that can explain the differences found in the discrimination performance:
The size of the read-out electrode is bigger, and thus the number of events occurring close to it is also higher.
The front electrode is different. Ge-5 is a commercial BEGe detector which was not designed for this PSD application and thus the front contact was thinner than the one used for the GERDA experiment, where it is better to have thicker dead-layers to reduce the contribution from X-rays, alpha and beta particles.
The setup of the experiment was also different, in Heidelberg a non-shaping amplifier was used to amplify the signal from the preamplifier. The model of FADC was also different.
27
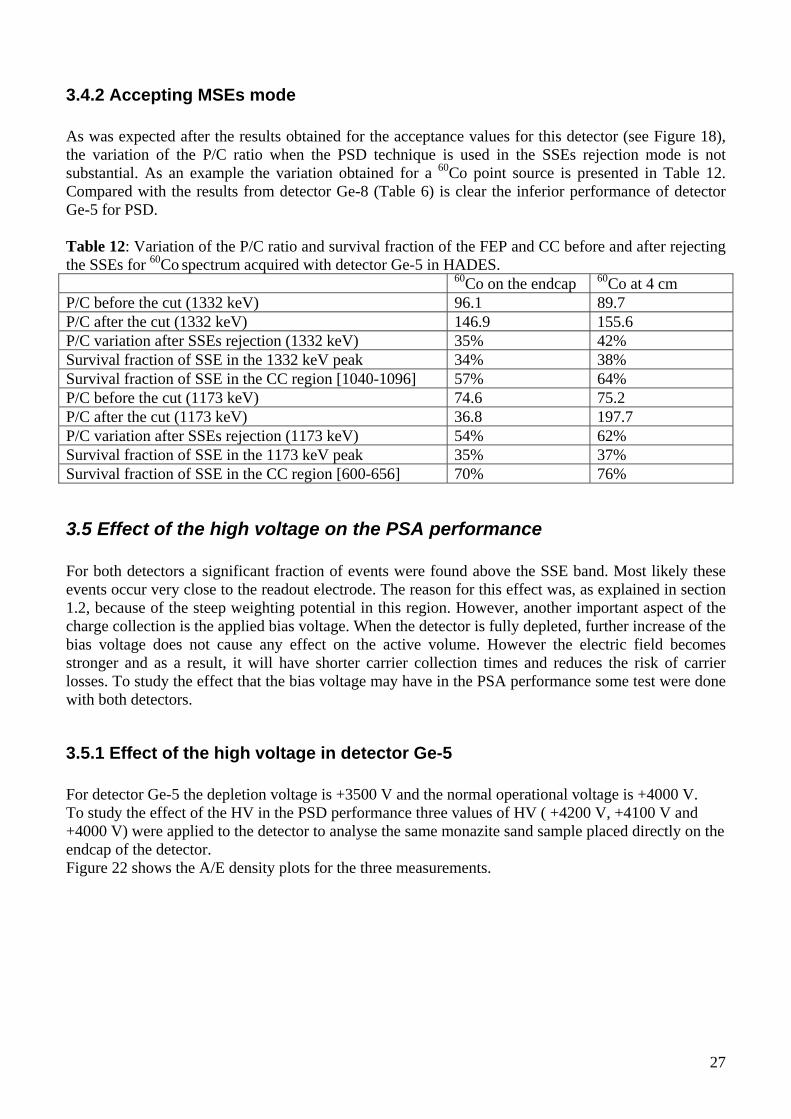
3.4.2 Accepting MSEs mode As was expected after the results obtained for the acceptance values for this detector (see Figure 18), the variation of the P/C ratio when the PSD technique is used in the SSEs rejection mode is not substantial. As an example the variation obtained for a 60Co point source is presented in Table 12. Compared with the results from detector Ge-8 (Table 6) is clear the inferior performance of detector Ge-5 for PSD. Table 12: Variation of the P/C ratio and survival fraction of the FEP and CC before and after rejecting the SSEs for 60Co spectrum acquired with detector Ge-5 in HADES. 60Co on the endcap 60Co at 4 cm P/C before the cut (1332 keV) 96.1 89.7 P/C after the cut (1332 keV) 146.9 155.6 P/C variation after SSEs rejection (1332 keV) 35% 42% Survival fraction of SSE in the 1332 keV peak 34% 38% Survival fraction of SSE in the CC region [1040-1096] 57% 64% P/C before the cut (1173 keV) 74.6 75.2 P/C after the cut (1173 keV) 36.8 197.7 P/C variation after SSEs rejection (1173 keV) 54% 62% Survival fraction of SSE in the 1173 keV peak 35% 37% Survival fraction of SSE in the CC region [600-656] 70% 76%
3.5 Effect of the high voltage on the PSA performance For both detectors a significant fraction of events were found above the SSE band. Most likely these events occur very close to the readout electrode. The reason for this effect was, as explained in section 1.2, because of the steep weighting potential in this region. However, another important aspect of the charge collection is the applied bias voltage. When the detector is fully depleted, further increase of the bias voltage does not cause any effect on the active volume. However the electric field becomes stronger and as a result, it will have shorter carrier collection times and reduces the risk of carrier losses. To study the effect that the bias voltage may have in the PSA performance some test were done with both detectors.
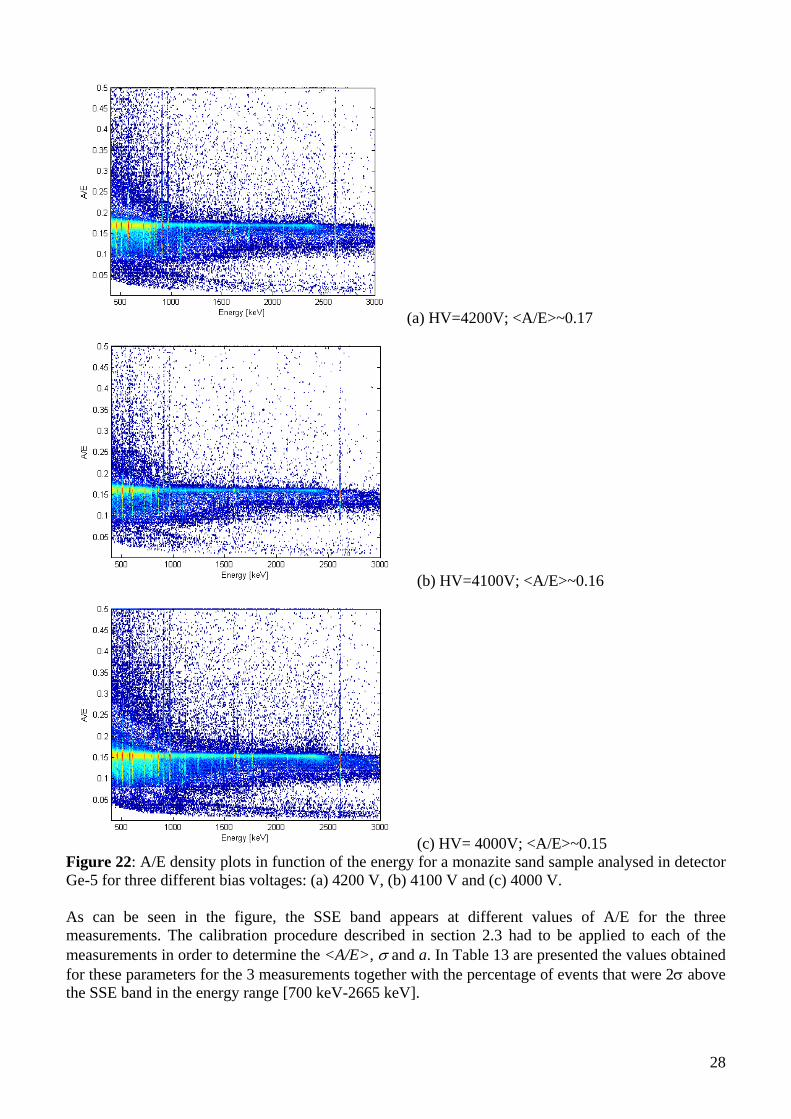
3.5.1 Effect of the high voltage in detector Ge-5 For detector Ge-5 the depletion voltage is +3500 V and the normal operational voltage is +4000 V. To study the effect of the HV in the PSD performance three values of HV ( +4200 V, +4100 V and +4000 V) were applied to the detector to analyse the same monazite sand sample placed directly on the endcap of the detector. Figure 22 shows the A/E density plots for the three measurements.
28
(a) HV=4200V; <A/E>~0.17
(b) HV=4100V; <A/E>~0.16
(c) HV= 4000V; <A/E>~0.15 Figure 22: A/E density plots in function of the energy for a monazite sand sample analysed in detector Ge-5 for three different bias voltages: (a) 4200 V, (b) 4100 V and (c) 4000 V. As can be seen in the figure, the SSE band appears at different values of A/E for the three measurements. The calibration procedure described in section 2.3 had to be applied to each of the measurements in order to determine the <A/E>, and a. In Table 13 are presented the values obtained for these parameters for the 3 measurements together with the percentage of events that were 2 above the SSE band in the energy range [700 keV-2665 keV].

29
Table 13: Percentage of events 2 above the SSE band at 3 different HV bias for detector Ge-5 in HADES. HV (V) <A/E> % events 2 above <A/E>
[700 keV-2665 keV] 4000 V 0.15446(13) 0.0014(3) 15% 4100 V 0.1605(3) 0.0018(5) 13% 4200 V 0.17014(16) 0.0023(9) 9%
As can be seen the increase in the HV reduces the number of events above the SSE band.
3.5.2 Effect of the high voltage in detector Ge-8 A similar test was done for detector Ge-8 applying two different bias voltages: +3500V (nominal value) and +2800 V (less than the depletion voltage). A 60Co point source was placed directly on the endcap of the detector Ge-8. The result obtained is presented in Table 14. Table 14: Parameters of the discrimination cut for detector Ge-8 above ground for two 60Co measurements at 3500 V and 2800 V respectively and the percentage of events 2 above the SSE band. HV(V) <A/E> for ROI 6 % events 2 above <A/E>
[700 keV-1500 keV] 3500V 0.29791(5) 0.00183(7) 12% 2800 V 0.19629(3) 0.00132(5) 19% As expected the percentage of events is higher for the lower HV. The result obtained for detector Ge-5 for the normal operational voltage ( +4000 V) can be compared with the result obtained for detector Ge-8, also at its normal operational voltage (+3500 V). For the same monazite sand sample and operating both detectors in the underground laboratory HADES, there were 15% of events 2 above SSE band in the energy range [700 keV- 2665 keV] for detector Ge-5 and only 4% for Ge-8
4. Discussion Using the PSD technique in the MSEs accepting mode a background suppression of a factor of 2-3.5 in the CC can be achieved. The main advantage of this technique over a conventional Compton suppression system is that the cascading gamma rays are not eliminated and at low energies the suppression efficiency is relatively high. This technique can be used in the future for low background gamma spectrometry. While for the SSE accepting mode the main application remains the search of neutrinoless double beta decay. The attempts to find samples where the discrimination of DEPs from a spectrum can be useful have shown that DEPs are normally very small and it is not worth to use this technique to discriminate them. The presence of significant amount of events above the SSEs band and the noise distortion in some of the pulses indicate that a relevant aspect of the PSD technique for BEGe detectors is the electrode geometry. In order to have a suitable weighting potential in the detector for PSD it is preferable to have small electrodes to reduce the volume of the detector where the electric field is higher. Another advantage of small electrodes is the noise reduction.

30
The improvement in the background reduction that we expected to achieve by combining the PSD technique in BEGe detectors with underground measurements was diminished by the effect of the electronic noise which was found to be higher in the HADES laboratory than in the laboratory above ground. Though the background in the HADES laboratory is significantly lower than above ground, the electronic noise is significantly higher. This worsens the performance of the detectors for this particular application where the raw pulses, directly from the preamplifier, are used. For the normal operation of the detector, this noise has no negative consequence since it is filtered.
5. Conclusions
The PSD technique described in this report is very robust to use together with commercial BEGe-detectors.
The technique is highly suitable for identifying double escape peak and the (possible) peak
from the neutrinoless double beta decay of 76Ge at 2039 keV. The SSE acceptance is around 92% whilst the MSE survival is only around 10%.
The effect of using this PSD-technique for Compton suppression is significant although not as
great as with a traditional Compton suppression system. A Compton suppression factor varying between 2 and 3.5 was observed. However, in contrast to traditional Compton suppression, FEPs from cascading gamma-rays were not significantly suppressed (<15%).
The technique is more sensitive to electronic noise than "normal" gamma-ray spectrometry
since fast rise time of small (noise-) pulse can give high peaks in the differentiated spectrum.
The large number of events above the SSE-line in an "A/E-vs-E-plot" is probably due to the events that occur very close to the electrode. The bigger the read-out electrode is, the higher number of these events there are. A majority of these peaks were, however, SSEs, thus the effect is not so severe.
The size of the crystal seems not to be crucial for this technique. There were only minor
variations to the results and characteristics. This means that for the GERDA experiment, maximum usage of the enriched material can be foreseen and the objective in the detector fabrication process should be to minimise the size of the read-out electrode.
Considering the relatively simple hardware that is needed, one can imagine that the technique
has a potential for being used for routine measurements in numerous laboratories in order to improve detection limits for radionuclides with cascading gamma-rays that "sit" on a Compton-background from gamma-rays of other radionuclides present in the sample.
6. Future investigations
Develop algorithms to filter out electronic noise with small pulses of fast rise time Improve the PSD by using more sophisticated rejection algorithms that will be developed for
the GERDA experiment.
Study the weighting field and weighting potential and perform tests on the detectors using a collimated source.
31
In order to compare, under the same conditions, the detectors used here with the one used by Budjáš et al. [2] one possibility is to take the detectors to the Heidelberg underground laboratory (- 15 m w.e.) or to bring here some of their electronic equipment.
Try to combine the PSD technique presented here with conventional Compton suppression
systems.
Acknowledgements The supporting work done by EURIDICE and the HADES team of SCK•CEN in Mol, Belgium, is gratefully acknowledged.
References 1. Barbeau P.S., C.J.I., Tench O., Large-Mass Ultra-Low Noise Germanium Detectors:
Performance and Applications in Neutrino and Astroparticle Physics. Journal of Cosmology and Astroparticle Physics, 2007(09): p. 09.
2. Budjáš, D., et al., Pulse shape discrimination studies with a Broad-Energy Germanium detector for signal identification and background suppression in the GERDA double beta decay experiment. Journal of Instrumentation, 2009. 4(10).
3. Hellmig, J. and H.V. Klapdor-Kleingrothaus, Identification of single-site events in germanium detectors by digital pulse shape analysis. Nuclear Instruments and Methods in Physics Research Section A: Accelerators, Spectrometers, Detectors and Associated Equipment, 2000. 455(3): p. 638-644.
4. Sherman, I.S. and M.G. Strauss, Gamma-ray position-sensitive coaxial Ge(Li) detector. Nuclear Instruments and Methods, 1974. 117(1): p. 285-294.
5. Petry, F., et al., Background recognition in Ge detectors by pulse shape analysis. Nuclear Instruments and Methods in Physics Research Section A: Accelerators, Spectrometers, Detectors and Associated Equipment, 1993. 332(1-2): p. 107-112.
6. CANBERRA. [cited; Available from: http://www.canberra.com/products/485.asp. 7. Budjáš, D., Germanium detector studies in the framework of the GERDA experiment. 2009,
Heidelberg. 8. GERDA, GERDA The GERmanium Detector Array for the search of neutrinoless bb decays of
76Ge at LNGS. Proposal. 2004. 9. Abt, I., et al., Identification of photons in double beta-decay experiments using segmented
germanium detectors--Studies with a GERDA phase II prototype detector. Nuclear Instruments and Methods in Physics Research Section A: Accelerators, Spectrometers, Detectors and Associated Equipment, 2007. 583(2-3): p. 332-340.
10. Shockley, W., Current to Conductors Induced by a Moving Point Charge. J. Appl.Phys., 1938. 9(635).
11. Ramo, S., Current induced by electron motion. Proceedings of the I.R.E, 1939. 584. 12. He, Z., Review of the Shockley-Ramo theorem and its application in semiconductor gamma-ray
detectors. Nuclear Instruments and Methods in Physics Research Section A: Accelerators,Spectrometers,Detectors and Associated Equipment, 2001. 463(1-2): p. 250-267.
13. Feng, Y., et al., A pixilated design of high pressure xenon gamma-ray spectrometer. Nuclear Instruments and Methods in Physics Research Section A: Accelerators, Spectrometers, Detectors and Associated Equipment, 2007. 579(1): p. 54-57.
14. Nelson, W.R., H. Hirayama, and D.W.O. Rogers, The EGS4 code system, S.-R. 265, Editor. 1985, Stanford Linear Accelerator Centre: Stanford, California.

32
15. Hult, M., et al., Underground gamma-ray spectrometry. Acta Chimica Slovenica, 2006. 53(1): p. 1-7.
16. Jung, H.S., et al., Improvement of the Compton suppression ratio of a standard BGO suppressor system by a digital pulse shape analysis. Nuclear Instruments and Methods in Physics Research Section A: Accelerators, Spectrometers, Detectors and Associated Equipment, 2007. 580(2): p. 1016-1019.
European Commission EUR 24521 EN – Joint Research Centre – Institute for Reference Materials and Measurements Title: Pulse shape analysis for background reduction in BEGe detectors Author(s): Raquel González de Orduña, Mikael Hult, Erica Andreotti, Gerd Marissens, Dušan Budjáš, Marcin Misiaszek Luxembourg: Publications Office of the European Union 2010 – 38 pp. – 21.0 x 29.7 cm EUR – Scientific and Technical Research series – ISSN 1018-5593 ISBN 978-92-79-16701-0 DOI 10.2787/28767 Abstract A simple technique for pulse shape discrimination (PSD) in HPGe-detectors of the so-called BEGe type, based on just one parameter obtained from one signal read out, is presented here. This technique allows discriminating between pulses generated when the deposited energy is located within a small region of about 1 mm3 from the pulses generated when the energy is deposited at different locations several mm or cm apart. Two possible applications using this technique are: i) experiments that look for neutrinoless double beta decay in 76Ge, such as GERDA ii) gamma spectrometry measurements where the Compton continuum can be reduced and the efficiency for cascading gamma-rays can remain high. This report presents the results obtained for two standard BEGe detectors, with 19% and 50% relative efficiency respectively. The aim of this study is to determine the influence of the detector size in the PSD as well as to study the capability of using this PSA to reduce the Compton continuum and thus improve the detection limits.

How to obtain EU publications Our priced publications are available from EU Bookshop (http://bookshop.europa.eu), where you can place an order with the sales agent of your choice. The Publications Office has a worldwide network of sales agents. You can obtain their contact details by sending a fax to (352) 29 29-42758.

The mission of the JRC is to provide customer-driven scientific and technical support for the conception, development, implementation and monitoring of EU policies. As a service of the European Commission, the JRC functions as a reference centre of science and technology for the Union. Close to the policy-making process, it serves the common interest of the Member States, while being independent of special interests, whether private or national.
L
A-N
A-245
21-EN
-C