Embed Size (px)
Citation preview
Puffin crossing operation and behaviour study
by R Walker, M Winnett, A Martin
and J Kennedy (TRL Limited)
PPR239
PUBLISHED PROJECT REPORT


TRL Limited
PUBLISHED PROJECT REPORT PPR239
PUFFIN CROSSING OPERATION AND BEHAVIOUR STUDY Version: FINAL
by R Walker, M Winnett, A Martin and J Kennedy (TRL Limited)
Prepared for:Project Record: Puffin Crossing Operation and Behaviour Study SC.0388.006
Client: Nina Webster, London Road Safety Unit, Transport for London.
Copyright TRL Limited August 2005 This report has been prepared TfL, London Road Safety Unit. The views expressed are those of the author(s) and not necessarily those of TfL. Published Project Reports are written primarily for the Customer rather than for a general audience and are published with the Customer’s approval.
Approvals
Project Manager
Quality Reviewed
This report has been produced by TRL Limited, under/as part of a Contract placed by TfL. Any views expressed are not necessarily those of TfL. TRL is committed to optimising energy efficiency, reducing waste and promoting recycling and re-use. In support of these environmental goals, this report has been printed on recycled paper, comprising 100% post-consumer waste, manufactured using a TCF (totally chlorine free) process.

TRL Limited PPR239
CONTENTS
1 Introduction 4
1.1 Background 4 1.2 Objectives 4
1.2.1 Observable data 4 1.2.2 Data not recorded 5
1.3 Puffin and Pelican Operational Characteristics 5 1.3.1 The Pelican Crossing 5 1.3.2 The Puffin crossing 7 1.3.3 Features of both the Puffin crossing and the Pelican crossing 9
2 Methodology 10
2.1 Site Selection 10 2.2 Video Surveys 11 2.3 Selection of data for analysis 12 2.4 Vehicle and Speed Data 13 2.5 Conflict Analysis 13
3 Results: Site Data 15
3.1 Pedestrian data 15 3.2 Vehicle data 16
3.2.1 Vehicle flows 16 3.2.2 Vehicle Speed (mph) 17
3.3 Signal Equipment Failures 19
4 Results: Pedestrian and Vehicle Behaviour 21
4.1 Pedestrian Behaviour 21 4.1.1 Pedestrian delay 21 4.1.2 Pedestrians crossing before the green man 24 4.1.3 Pedestrians who do not use the button 26 4.1.4 Pedestrians who start to cross late 27 4.1.5 Pedestrian crossing times 28 4.1.6 Vehicle red times 29 4.1.7 Pedestrian crossing behaviours 32
4.2 Vehicle Driver Behaviour 32 4.2.1 Vehicle delay 32 4.2.2 Vehicles moving before vehicle green 34
4.3 Vehicle and Pedestrian Interactions 37 4.4 Summary 38 4.5 Comparing Pelican and Puffin Crossings 40
5 Results: Conflict Analysis 42
5.1 Holloway Puffin 44 5.1.1 Observation A (puffin) 44 5.1.2 Observation B (puffin) 44 5.1.3 Observation C (puffin) 45 5.1.4 Observation D (puffin) 45 5.1.5 Observation E (puffin) 46
5.2 Beckenham Puffin 47
TRL Limited PPR239
5.2.1 Observation A (puffin) 47 5.3 Beckenham Pelican 48
5.3.1 Observation A (pelican) 48 5.3.2 Observation B (pelican) 49 5.3.3 Observation C (pelican) 49
5.4 Mill Hill Pelican 50 5.4.1 Observation A (pelican) 50 5.4.2 Observation B (pelican) 50
5.5 Euston Road, Pelican 51 5.5.1 Observation A (pelican) 51 5.5.2 Observation B (pelican) 53
5.6 Euston Puffin 54 5.6.1 Observation A (puffin) 54 5.6.2 Observation B (puffin) 55
5.7 Hammersmith Puffin 55 5.7.1 Observation A (puffin) 55 5.7.2 Observation B (puffin) 56 5.7.3 Observation C (puffin) 57
5.8 Hammersmith Pelican 57 5.8.1 Observation A (pelican) 57 5.8.2 Observation B (pelican) 58
5.9 Discussion on conflicts 59 5.10 Collision Data 60
6 Conclusions and discussion 61
6.1 Conclusions 61 6.2 Discussion 63
7 Recommendations 64
7.1 Pedestrian Attitude Survey 64
Appendix A: Site Information...............................................................................................................67 Appendix B: Site Statistics ...................................................................................................................83 Appendix C: Pedestrian and Vehicle Statistics.....................................................................................89 Appendix D: Pedestrian Crossing Behaviour Statistics ........................................................................99 Appendix E: Results of Significance Tests.........................................................................................103
TRL Limited i PPR239
Published Project Report Version: FINAL
Executive Summary
This report was commissioned by Transport for London (TfL) and examines pedestrian and driver behaviour in terms of efficiency, and conflicts between drivers and pedestrians at five representative Puffin sites, compared with five paired Pelican sites.
TRL understands that the Department for Transport intention is that Puffin crossings should be the standard pedestrian light controlled crossing (and there were 101 mid-block Puffin crossings in London in January 2005). However, there is still uncertainty about the road safety implications of Puffins in comparison to Pelican crossings. This study details the gathering of information on the behaviour of vehicle drivers and pedestrians at Puffin crossing sites. This involved studying the number and nature of ‘near misses’ at a site, assuming that the number and type of conflicts that occur between road users at different times of day will be an indicator of safety at the crossings.
The Puffin crossing was designed as an improvement on the Pelican crossing, offering advantages to both the pedestrian and the driver. The advantages were intended to be:
• An extension period for pedestrians who move slowly or start to cross towards the end of the green man phase.
• The facility to cancel a pedestrian demand to cross by detecting their presence or absence at the kerbside.
• The removal of the flashing amber/flashing green man period. • The introduction of a nearside pedestrian indicator upstream of the crossing, to
replace the far side green man signal, to encourage those using the signal demand button to look in the direction of traffic flow and to show a red man when it is no longer appropriate to start crossing.
The three research questions were: 1. What types of traffic conflict occur at Puffin crossings and with what frequency?
In total only 38 incidents were recorded at the five Puffin crossings (representing 60 hours of data) that were identified as vehicle-pedestrian interactions or violations by vehicles, and of these events only 1 was considered to be a conflict. The events were largely site dependent with different behaviours at each site.
2. Does the nature and frequency of these conflicts at Puffin crossings differ from those at Pelican crossing facilities?
While slightly more events that were judged to be conflicts or interactions were seen at the Puffin sites than at the Pelican sites (23 compared to 20), there were too few conflicts overall to draw conclusions. Differences may be due to local factors.
3. Are other crossing behaviours observed which do not result in conflicts but which might have implications for safety of road users at crossing sites?
The interactions represent potentially dangerous situations that did not develop into a conflict. More of these events were seen at the Puffin sites, however it is difficult to judge whether one crossing behaviour is more dangerous than another. Site specific details regarding dangers at each of the sites and potential remedial solutions have been detailed within the report.
The study also found that pedestrians appeared to be statistically significantly more likely to begin crossing on a flashing green man at the Pelicans, compared to the red extension period at the Puffins studied, and longer waiting times for pedestrians led to more pedestrians crossing against the lights. Large numbers of pedestrians crossed without using the signal demand button. At both types of crossing, there were many instances where cyclists ignored the red light. These are dealt with in more detail, in the main findings below.

TRL Limited ii PPR239
Published Project Report Version: FINAL
Other findings were as follows: The extensions at the observed Puffins resulted in longer waiting times for the first vehicles that had to stop at a red light than at the paired Pelicans. This was partly because the flashing amber phase to vehicles at the Pelicans allowed vehicles to move off as soon as the crossing was clear of pedestrians and partly because of the conservative timings used at the Puffins. If current recommendations for timings at Puffins were followed, the first vehicle waiting times at Puffins would compare more equitably with those at the Pelicans. The call cancel facility appeared to be rarely used at any of the Puffins studied. From over 500 recorded events, the call cancel facility was activated only once. There were reported problems with the call cancel facility at each of the crossings, however the analysis shows that there were only 8 occasions where the call should have been cancelled but was not. Pedestrians were statistically significantly more likely to begin crossing on a flashing green man at the Pelicans, compared to the red extension period at the Puffins studied. Twenty-eight pedestrians (1.0% of sample) did this at Pelican crossings compared to only one (0.1% of sample) at a Puffin crossing. This was a statistically significantly greater proportion at Pelican sites over Puffin sites and suggests that pedestrians were more cautious when shown a steady red man signal compared with a flashing green man signal. Longer waiting times for pedestrians led to more pedestrians crossing against the lights. Where waiting times for pedestrians after pressing the demand button were higher, namely at the sites under UTC, pedestrians were statistically significantly more likely to cross during the red man phase. There is some evidence from various authors, as well as the present study, that the longer pedestrians have to wait at a crossing, the more likely they are to cross against the signal. A Canadian paper reviewing practice in Europe and North America reported that if the waiting time is longer than 40 seconds, the number of pedestrians crossing against the signal increases greatly. However, different laws and cultures might mean this does not apply to the UK. Some authors have found no link between average delay to pedestrians and non-compliance with signals. It was widely asserted in the 1960s that 30 seconds was the longest that pedestrians would wait, but the basis for this assertion is not known and even if correct then, it is by no means clear that the same would be true now. It is also the case that there may be more opportunities to cross during vehicle green time when there is a long cycle time, particularly where there is a UTC system with well-defined platoons of vehicles.
Large numbers of pedestrians crossed without using the signal demand button. Up to 49% of pedestrians crossed without using the signal demand button; this behaviour was more prevalent at the UTC sites, which had long waiting times for pedestrians, and at the Euston site where it is expected that a large proportion of the pedestrians were commuters. Differences between the observed Puffins and Pelicans could often be explained by local factors; the video data suggests that the use of the crossing was highly dependent upon its location and the signal strategy adopted. At both types of crossing, there were many instances where cyclists ignored the red light. Consideration should be given to an enforcement programme ensuring that this group follows the same rules of the road as other users. There was insufficient evidence from this study to determine whether Puffin crossings were safer than Pelican crossings or whether they perform better in terms of reduced delays to either vehicles or pedestrians. Although more pedestrians began crossing during the flashing green/flashing amber phase at the Pelicans than the all red period at the Puffins, there were too few observed conflicts overall to conclude whether this behaviour affected safety. As a result it is recommended that a

TRL Limited iii PPR239
Published Project Report Version: FINAL
pedestrian attitude survey is undertaken that could address issues such as the pedestrian knowledge of the crossing types, perceived safety and perceived delays at the crossings. The results of the study are affected by the following:
• Despite the considerable efforts made to match sites by type of road, land use and vehicle flow, there remained differences in the pedestrian flow (at two of the pairs), the types of user and the signal timings at the paired crossings.
• The timings of the Puffin crossings were set very conservatively and were in some instances delaying traffic by up to 7 seconds longer than necessary if current guidelines for Puffin design were followed.
• Problems such as automatic demand cycling where the pedestrian demand was generated without pedestrian intervention and faulty crossing detectors were observed with 4 of the Puffin crossings. These faults have the effect of altering the operation of the crossing and may have affected the pedestrian and vehicle behaviours observed in this study.
There was insufficient evidence from this study to determine whether Puffins were safer than Pelicans, as the numbers of accidents and observed pedestrian conflicts or encounters were low. One of the principal advantages of the Puffin crossing was expected to be the cancelling of unnecessary pedestrian demand and consequent reduction in delay to vehicles. In the crossings observed in this study, the call cancel feature was seldom brought into operation. On average, vehicles in this study that were stopped by the signals had to wait longer at the Puffins than at the Pelicans because the extension periods at the Puffins were frequently activated and drivers at Pelicans were often able to move off during the flashing amber period.
This study concentrated on detailed analysis of the timing of pedestrian movements at each crossing. The conflict analysis enabled each crossing to be audited for safe or risky behaviour. Behaviour was dependent on the operation of the crossing (functioning correctly), the type of user and the location. A larger sample, or a longer period of observation, would have allowed the examination of a larger number of conflicts between pedestrians and vehicles.

TRL Limited 4 PPR239
Published Project Report Version: FINAL
1 Introduction
1.1 Background
This report was commissioned by Transport for London (TfL) and examines pedestrian and driver behaviour in terms of efficiency, user acceptance and conflicts between drivers and pedestrians at five representative Puffin sites, compared with five paired Pelican sites.
TRL understands that the Department for Transport intention is that Puffin crossings should be the standard pedestrian light controlled crossing (and there are 101 mid-block Puffin crossings in London today). However, there is still uncertainty about the road safety implications of Puffins in comparison to Pelican crossings.
This report details the gathering of information on the behaviour of vehicle drivers and pedestrians at Pelican and Puffin crossing sites. This involved analysis which studies the number and nature of ‘near misses’ at a site, assuming that the number and type of conflicts that occur between road users at different times of day will be an indicator of safety at the crossings.
1.2 Objectives
The study observed driver and pedestrian behaviour at five representative Puffin sites and five Pelican type control sites.
The specific research questions that are addressed:
• What types of traffic conflict occur at Puffin crossings and with what frequency?
• Does the nature and frequency of these conflicts differ from those at Pelican crossing facilities?
• More generally, are other crossing behaviours observed which do not result in conflicts but which might have implications for the safety of road users at crossing sites e.g. watching on-coming traffic, pedestrians turning back once they have started crossing?
1.2.1 Observable data
The following list details the observable data that was collected as part of the study, as specified in the original brief (provided by TfL).
Applicable to Puffins and Pelicans
• Pedestrian and vehicle flow
• Average waiting time for pedestrians.
• Average crossing time (when crossing started on green pedestrian phase).
• Proportion of pedestrians crossing within the marked crossing area (studs).
• Proportion of pedestrians who cross outside the studs but in the vicinity of the crossing.
• Proportion of pedestrians who start to cross before the green pedestrian phase.
• The status of the vehicle signal when pedestrians finish crossing if they started to cross during pedestrian green phase.
• Distribution of times that pedestrians start to cross after the start of the pedestrian green phase.

TRL Limited 5 PPR239
Published Project Report Version: FINAL
• Proportion of pedestrians who turn back after having started crossing on the green pedestrian phase.
• Proportion of vehicles at head of the queue of stopped traffic moving off before vehicle green phase when there are pedestrians on the crossing.
• The distribution and average time between the change from vehicle red/amber to green and when the first vehicle crosses the stop line.
Applicable to Puffins only
• Proportion of failures of the kerbside and on crossing pedestrian detection.
• Proportion of time that pedestrian signal is not visible because of crowds around the nearside signal.
• Proportion of calls which are cancelled because the pedestrian crossed before green pedestrian phase.
1.2.2 Data not recorded
The following two data sets were not recorded as specified in the brief (the reasons are set out below):
i. Proportion of pedestrians who press button on arrival at crossing if it has not already been pressed.
Pedestrians were grouped subject to the crossing events and as a result the button time (time of the first button press) for the group was recorded rather than whether the first individual to arrive pressed the button. However the proportion of pedestrians that cross without using the signals was recorded including the crossing characteristics for a sample of this group.
ii. Proportion of drivers at head of queue of stopped traffic who appear to use the pedestrian audible signal instead of the traffic lights showing to traffic.
The data analysis team were not able to identify whether the vehicles move due to the pedestrian audible signal, or other movement triggers.
1.3 Puffin and Pelican Operational Characteristics
1.3.1 The Pelican Crossing
The fundamental differences between the Pelican (formerly Pelicon Crossing - PEdestrian LIght CONtrolled crossing) and the Puffin (Pedestrian User-Friendly Intelligent crossing) are as follows. The Pelican crossing has a signal demand button mounted on the traffic signal pole that gives a message “WAIT” when pressed by a pedestrian. The red man signal on the far side of the crossing changes to a green man to indicate to the pedestrian that it is safe to cross the road and a red light is shown to traffic (Figures 1 and 2).

TRL Limited 6 PPR239
Published Project Report Version: FINAL
Figure 1: Pelican crossing
Figure 2: Pelican Crossing
The far side green man begins to flash at the end of the signal demand cycle, warning pedestrians that they should no longer attempt to start crossing. Figure 3 shows the timing sequence for the Pelican crossing.
Figure 3: Pelican signal timing sequence

TRL Limited 7 PPR239
Published Project Report Version: FINAL
1.3.2 The Puffin crossing
Puffin crossings were designed to reduce delays to vehicles and improve pedestrians’ sense of security while crossing the road. By detecting pedestrians on the crossing and varying the length of the vehicle red phase accordingly, they aim to give pedestrians (especially older or disabled pedestrians) a greater sense of protection compared with Pelican crossings. Puffin crossings (Figure 4) have been introduced at a steady pace since the introduction of The Zebra, Pelican and Puffin Pedestrian Crossings Regulations and General Directions 1997. A Puffin crossing differs from a Pelican crossing in several respects. In particular, at a Puffin crossing, the red man / green man indicator is positioned above the push button on the upstream signal pole (push button units without the pedestrian aspects are often mounted on upstream poles, Figure 5). These nearside pedestrian signals are intended to facilitate crossing for people with visual impairments and encourage pedestrians to watch approaching traffic and the pedestrian signal simultaneously. Puffin crossings also aim to reduce delays to vehicles by using kerbside detectors to detect when a pedestrian has made the signal demand to cross, but subsequently finds an opportunity to cross before the commencement of the green pedestrian phase, or when the pedestrian moves away from the crossing. In these situations the signal demand for the pedestrian phase is cancelled.
Figure 4: Puffin crossing
Figure 5: Puffin crossing nearside pedestrian signal head.
The Puffin crossing also has on-crossing detectors which will extend the all red period giving pedestrians time to complete their crossing of the road (Figure 6). The left image illustrates the detection area for the crossing extension, while the image on the right shows the detection of

TRL Limited 8 PPR239
Published Project Report Version: FINAL
pedestrians waiting to use the crossing before the signals change. Figure 7 shows the timing sequence for the Puffin crossing.
Figure 6: The detection windows for the crossing detectors
Figure 7: Puffin signal timing sequence
Figure 8 shows the potential benefits of the Puffin crossing (TAL 1/01, 2001). It suggests that the case for installing Puffin crossings is greatest where they will be of benefit to older people and to those who have a mobility impairment.

TRL Limited 9 PPR239
Published Project Report Version: FINAL
Figure 8: Potential benefits of Puffin crossings
1.3.3 Features of both the Puffin crossing and the Pelican crossing
On both Puffin and Pelican crossings, zig-zag markings are laid on the approaches and the exits to the crossing. The zig-zags ban waiting or parking, prohibit vehicles from overtaking each other and warn pedestrians of the increased risk of crossing in the zig-zag area.
At both types of crossings, when the green man is illuminated, the pedestrians have right of way and may begin to cross the road if it is safe to do so. There may also be a bleeping sound to assist the visually impaired. Some push button units are also fitted with a tactile knob under the unit which rotates when the green man is illuminated to assist the visually impaired for straight across crossings.
TRL Limited 10 PPR239
Published Project Report Version: FINAL
2 Methodology
2.1 Site Selection
In selecting the sites for study a number of criteria were applied. These included:
• Location: A school
A hospital
A station – either tube or main line
2 high street locations
• Flows high pedestrian and vehicle flows were required to give enough crossing cycles to be studied during the 12 hour periods which were videoed.
• Puffin installation: 1 site to have been installed within the last year
1 site to have been installed between 1 and 2 years ago
3 sites to have been installed more than 2 years ago
• Audible signal to be present for Puffin
• Link- where possible the Puffin and Pelican should be on the same link
• Road type- preferably single carriageway
• Refuge- preferably no refuge, definitely not a staggered crossing
• Accidents- accident data for the three years before each installation
The Puffin information, supplied by LRSU (London Road Safety Unit), was searched to find suitable sites subject to the above criteria. Some of the Puffins on the list were either not functioning correctly or not yet installed. The remaining sites were plotted on street maps to see if schools or hospitals etc were nearby. It proved to be impossible to find a hospital site with a Puffin. A great many sites were near a school, so that once a school site had been selected, the remaining school sites were eliminated. Initially, those sites which were known to be on a dual carriageway were discarded because of the requirement to avoid a refuge, however a compromise was made due to difficulties in finding appropriate sites.
A comparator Pelican was sought for each Puffin - preferably on the same link. If no suitable comparator Pelican could be found, then the Puffin was removed from the list of possible survey sites. These restrictions resulted in a final short list of 7 for the selection of 5 site pairs. Information for the 5 chosen sites can be found in Appendix A and a summary is given Table 1 below.
TRL Limited 11 PPR239
Published Project Report Version: FINAL
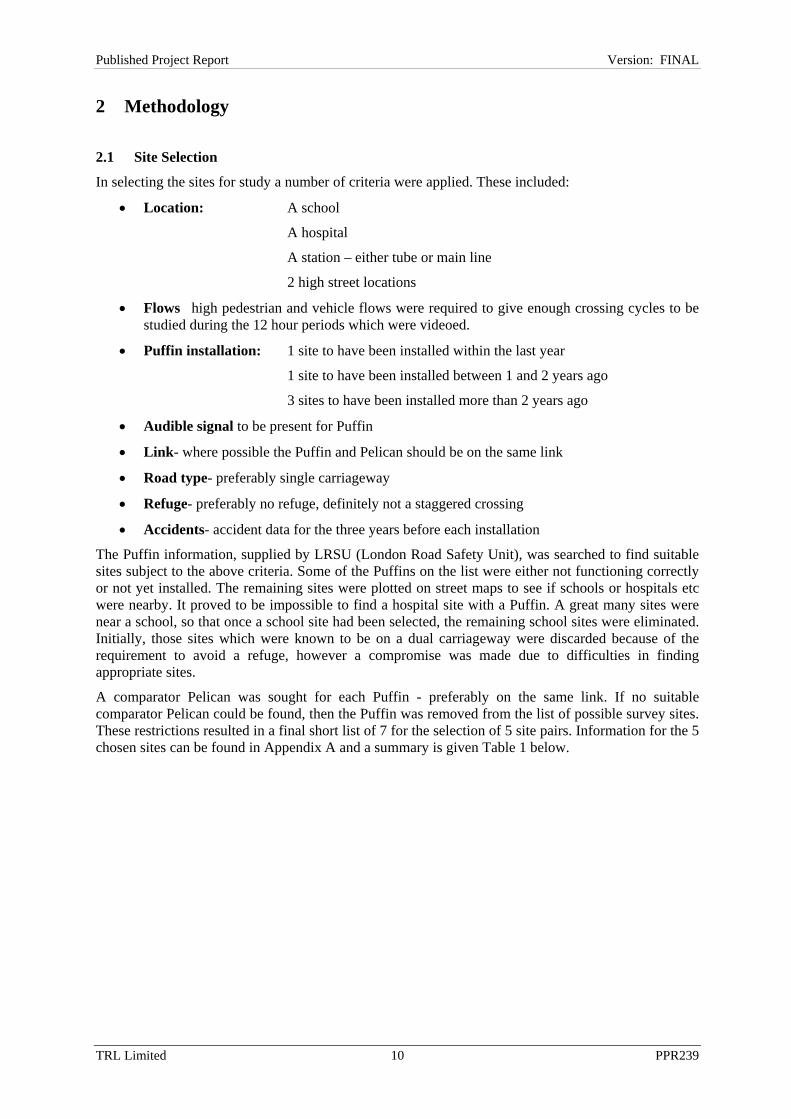
Table 1: Sites for Puffin and Pelican Video Surveys
Site Characteristics Length of Time Puffin Implemented
Holloway • High Street/Shopping • 4 lanes (one way) 2 years+
Beckenham • High Street/ Shopping • Single carriageway 2 years+
Mill Hill • School site • Single carriageway 2 years+
Euston • Train Station • Single carriageway 2 years+
Hammersmith • Shops at Pelican none at Puffin • Train Station at Pelican • Dual carriageway • Median signal demand
1- 2 years
2.2 Video Surveys
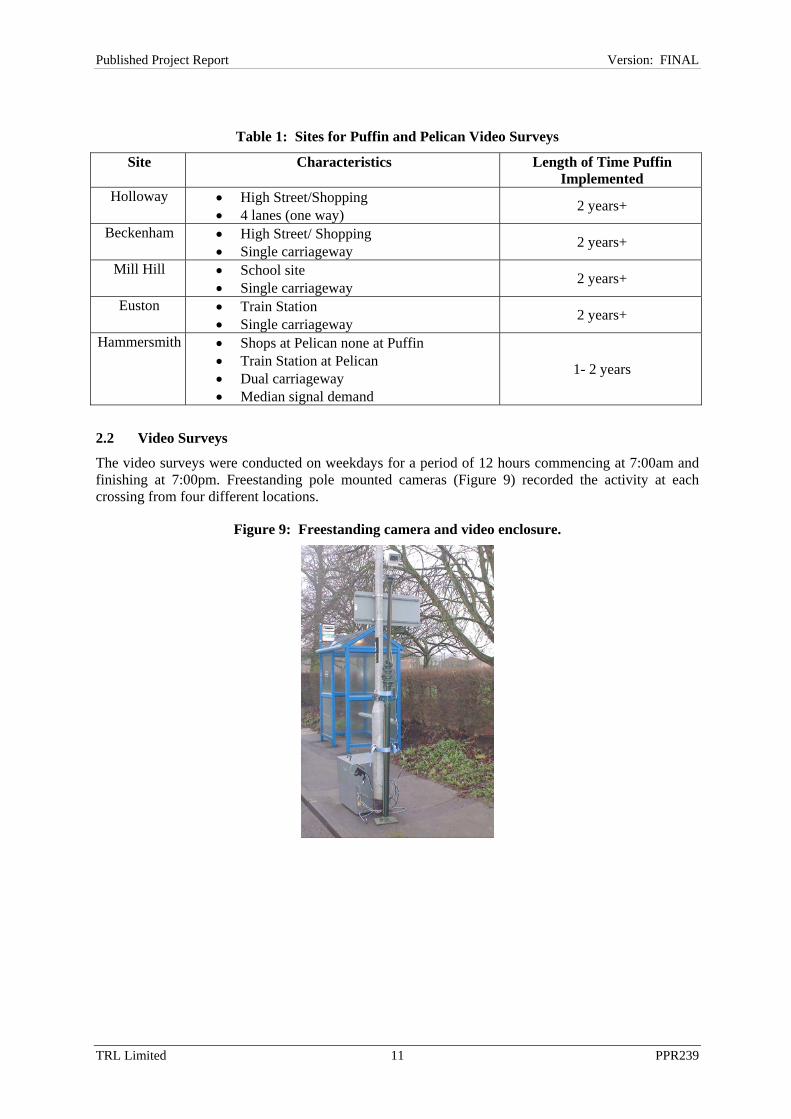
The video surveys were conducted on weekdays for a period of 12 hours commencing at 7:00am and finishing at 7:00pm. Freestanding pole mounted cameras (Figure 9) recorded the activity at each crossing from four different locations.
Figure 9: Freestanding camera and video enclosure.

TRL Limited 12 PPR239
Published Project Report Version: FINAL
Two cameras were positioned close to the signal head to record pedestrian usage and movements and two were placed at a distance sufficient to identify traffic movements (see Figure 10 below).
Figure 10: Camera layout for video surveys
2.3 Selection of data for analysis
When the first set of data was received it became clear that to analyse every crossing movement would be prohibitively time consuming, so a strategy was developed to obtain meaningful results without examining all the data.
To make the video analysis manageable at sites with high pedestrian flows and to ensure a sample which was as large and representative as possible analysis was based on “groups” of pedestrians i.e. one or more individuals who cross the road in the same manner (at the same time with the same speed and direction). An “event” was composed of one or more groups that cross the road during the same light sequence. Several “groups” of people may cross the road during one “event”.
In order to obtain statistically robust results it was necessary to analyse approximately 120 crossing “events”. This would give a sufficiently large data set allowing appropriate results to be tested for significance at the 95% level of confidence. The appropriate statistical test (Student‘s t-test, Wilcoxon test, or chi-square test) was performed in order to test for significance.
It was decided to analyse the morning and afternoon peak periods at the two school locations (Mill Hill), when children would be using the crossing. When the data was analysed it was found that the Puffin site had only 97 button-pressing events and 18 non-button pressing events during the 12 hour period from 7am to 7pm. In order to achieve the target sample size of 120 events, all the events for the Puffin were analysed.
The school Pelican site had 134 button pressing events and 19 non-pressing events. The target was for 100 pressing events and 20 non-pressing events. To match the Puffin morning and afternoon peak periods, the same periods were analysed for the Pelican for all pressing and non-pressing events. In order to make up the required sample through the whole 12 hour period, a proportion of the remaining events taken sequentially, were examined in detail.
C1
C2
C3
C4
Camera 1
Camera 2
Camera 3
Camera 4
Signal head
Signal head
Camera angle
C1
C2
C3
C4
Camera 1
Camera 2
Camera 3
Camera 4
Signal head
Signal head C1
C2
C3
C4
C1
C2
C3
C4
Camera 1
Camera 2
Camera 3
Camera 4
Signal head
Signal head
Camera angle
TRL Limited 13 PPR239
Published Project Report Version: FINAL
For the remaining Pelican and Puffin sites, where much larger numbers of crossing events occurred, a similar procedure was followed with the events being sampled throughout the day.
For the Conflict analysis the whole 12 hour period was analysed for risk taking behaviour, the results of the conflict analysis can be seen in section 5.
2.4 Vehicle and Speed Data
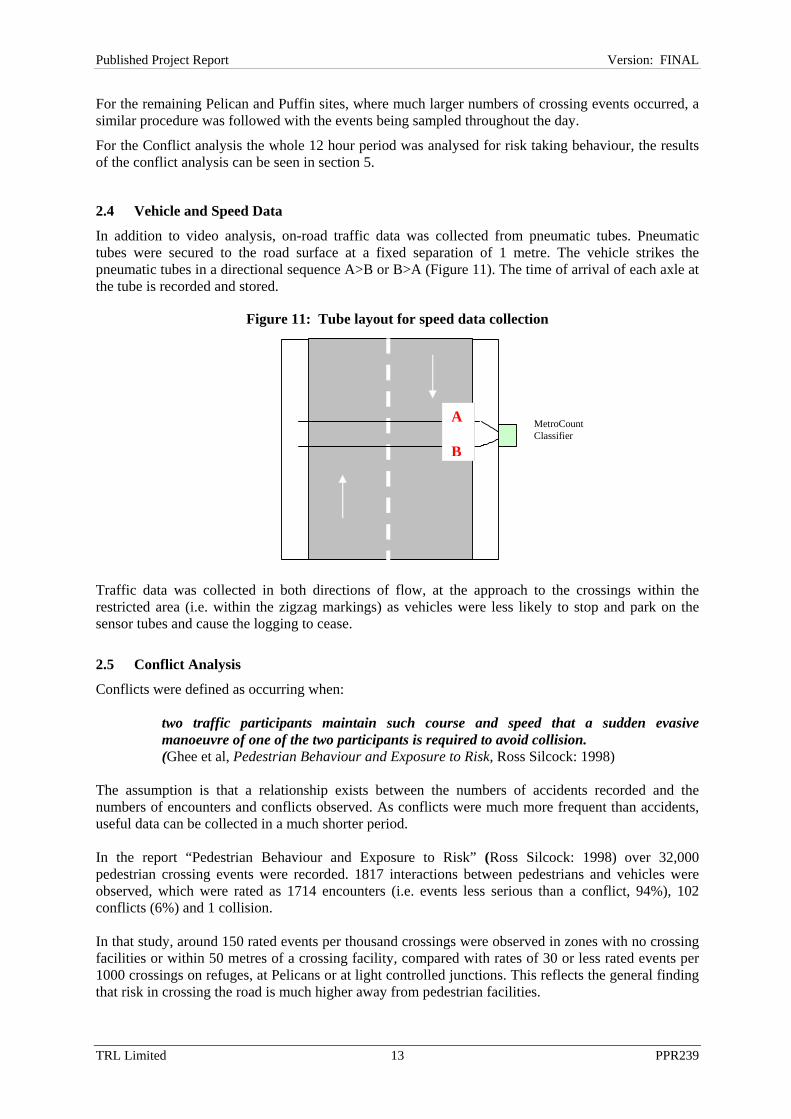
In addition to video analysis, on-road traffic data was collected from pneumatic tubes. Pneumatic tubes were secured to the road surface at a fixed separation of 1 metre. The vehicle strikes the pneumatic tubes in a directional sequence A>B or B>A (Figure 11). The time of arrival of each axle at the tube is recorded and stored.
Figure 11: Tube layout for speed data collection Traffic data was collected in both directions of flow, at the approach to the crossings within the restricted area (i.e. within the zigzag markings) as vehicles were less likely to stop and park on the sensor tubes and cause the logging to cease.
2.5 Conflict Analysis
Conflicts were defined as occurring when:
two traffic participants maintain such course and speed that a sudden evasive manoeuvre of one of the two participants is required to avoid collision. (Ghee et al, Pedestrian Behaviour and Exposure to Risk, Ross Silcock: 1998)
The assumption is that a relationship exists between the numbers of accidents recorded and the numbers of encounters and conflicts observed. As conflicts were much more frequent than accidents, useful data can be collected in a much shorter period. In the report “Pedestrian Behaviour and Exposure to Risk” (Ross Silcock: 1998) over 32,000 pedestrian crossing events were recorded. 1817 interactions between pedestrians and vehicles were observed, which were rated as 1714 encounters (i.e. events less serious than a conflict, 94%), 102 conflicts (6%) and 1 collision. In that study, around 150 rated events per thousand crossings were observed in zones with no crossing facilities or within 50 metres of a crossing facility, compared with rates of 30 or less rated events per 1000 crossings on refuges, at Pelicans or at light controlled junctions. This reflects the general finding that risk in crossing the road is much higher away from pedestrian facilities.
A B
MetroCount Classifier
TRL Limited 14 PPR239
Published Project Report Version: FINAL
In view of these findings it was not anticipated that enough conflicts would be observed during the survey periods to make any reliable comment on differences in safety between Pelicans and Puffins.
TRL Limited 15 PPR239
Published Project Report Version: FINAL
3 Results: Site Data This section considers the site data, the overall similarities and differences in pedestrian use, the traffic along the road and any problems that were experienced on each of the sites.
3.1 Pedestrian data
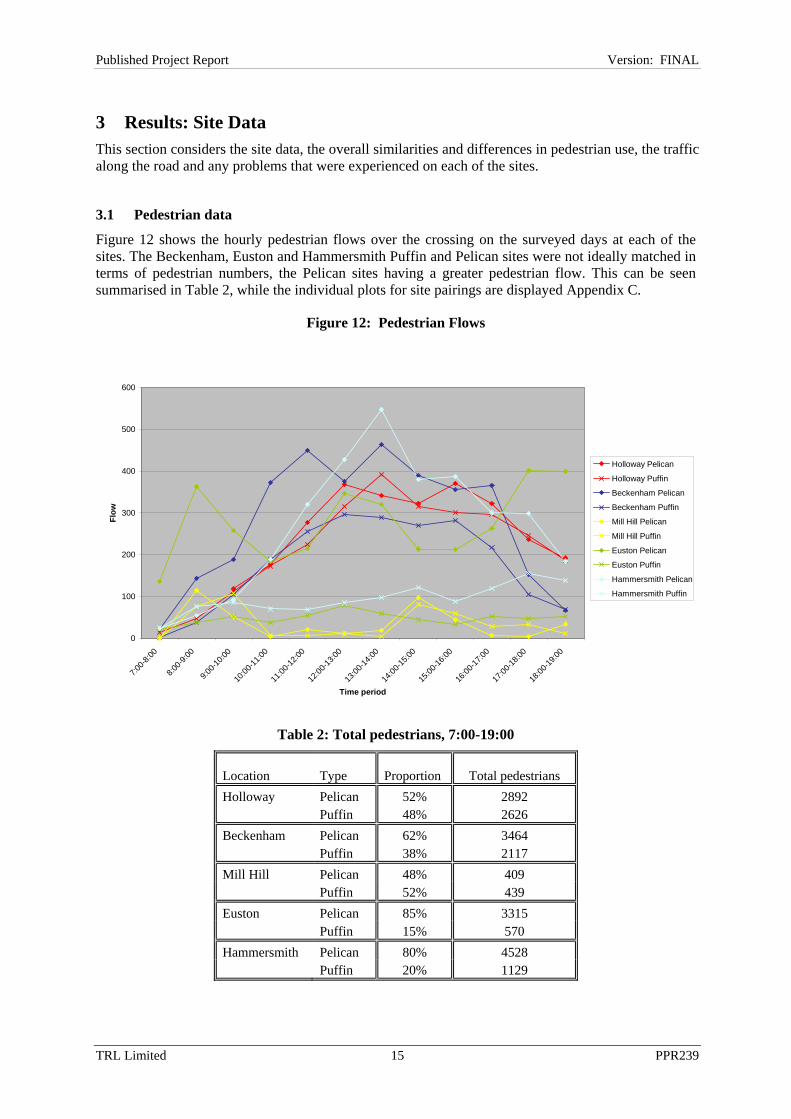
Figure 12 shows the hourly pedestrian flows over the crossing on the surveyed days at each of the sites. The Beckenham, Euston and Hammersmith Puffin and Pelican sites were not ideally matched in terms of pedestrian numbers, the Pelican sites having a greater pedestrian flow. This can be seen summarised in Table 2, while the individual plots for site pairings are displayed Appendix C.
Figure 12: Pedestrian Flows
0
100
200
300
400
500
600
7:00-8
:00
8:00-9
:00
9:00-1
0:00
10:00
-11:00
11:00
-12:00
12:00
-13:00
13:00
-14:00
14:00
-15:00
15:00
-16:00
16:00
-17:00
17:00
-18:00
18:00
-19:00
Time period
Flow
Holloway Pelican
Holloway Puffin
Beckenham Pelican
Beckenham Puffin
Mill Hill Pelican
Mill Hill Puffin
Euston Pelican
Euston Puffin
Hammersmith Pelican
Hammersmith Puffin
Table 2: Total pedestrians, 7:00-19:00
Location Type Proportion Total pedestrians Holloway Pelican 52% 2892 Puffin 48% 2626 Beckenham Pelican 62% 3464 Puffin 38% 2117 Mill Hill Pelican 48% 409 Puffin 52% 439 Euston Pelican 85% 3315 Puffin 15% 570 Hammersmith Pelican 80% 4528 Puffin 20% 1129
TRL Limited 16 PPR239
Published Project Report Version: FINAL
The Mill Hill (school) sites peak in pedestrian flow around the school opening and closing hours as expected. The Euston Pelican site was close to a station and shows commuting peaks at 8:00-9:00 hours, 12:00-13:00 hours and 17:00-18:00 hours. The other sites generally show increases throughout the morning and were consistent with the profile that might be expected for shopping precincts.
The Mill Hill sites show the greatest proportion of young pedestrians (who appeared to be less than 18 years old) and adults with children, which was expected due to the proximity to schools. The Beckenham sites have the greatest proportion over 60 years and the Euston and Hammersmith sites had predominantly pedestrians that fell into the 18-60 years category.
Detailed statistics for the sample population can be found in Appendix C.
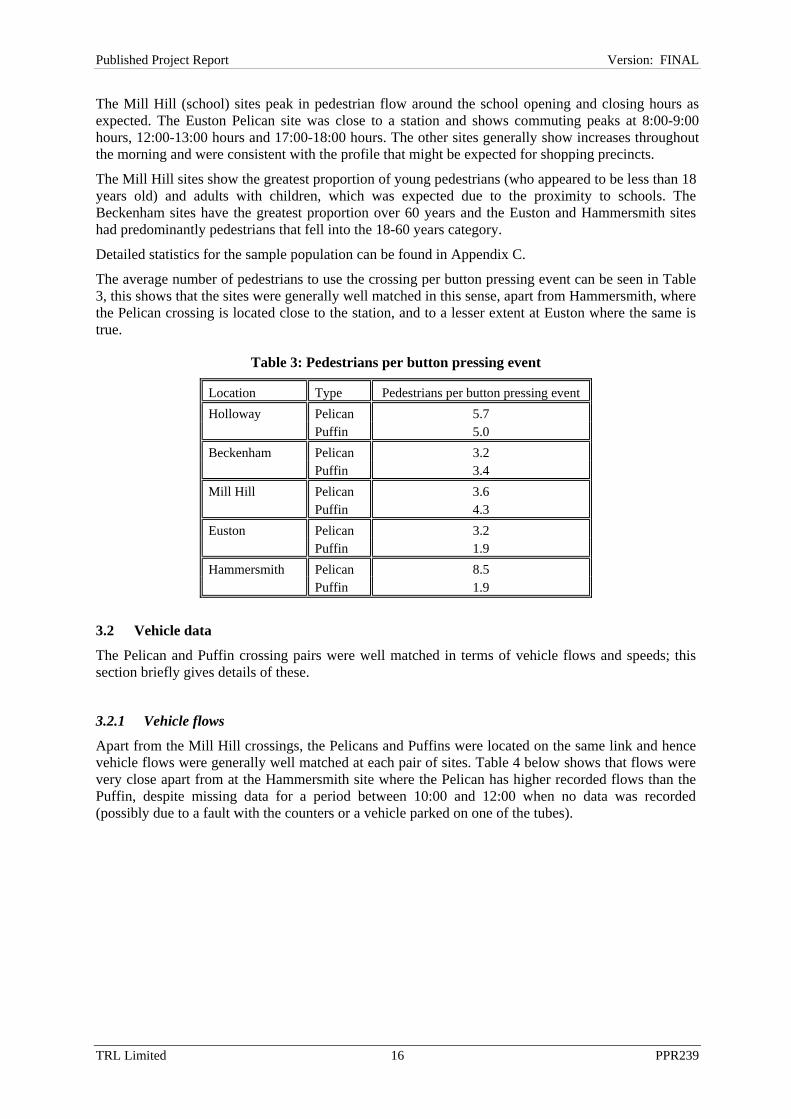
The average number of pedestrians to use the crossing per button pressing event can be seen in Table 3, this shows that the sites were generally well matched in this sense, apart from Hammersmith, where the Pelican crossing is located close to the station, and to a lesser extent at Euston where the same is true.
Table 3: Pedestrians per button pressing event
Location Type Pedestrians per button pressing event Holloway Pelican 5.7 Puffin 5.0 Beckenham Pelican 3.2 Puffin 3.4 Mill Hill Pelican 3.6 Puffin 4.3 Euston Pelican 3.2 Puffin 1.9 Hammersmith Pelican 8.5 Puffin 1.9
3.2 Vehicle data
The Pelican and Puffin crossing pairs were well matched in terms of vehicle flows and speeds; this section briefly gives details of these.
3.2.1 Vehicle flows
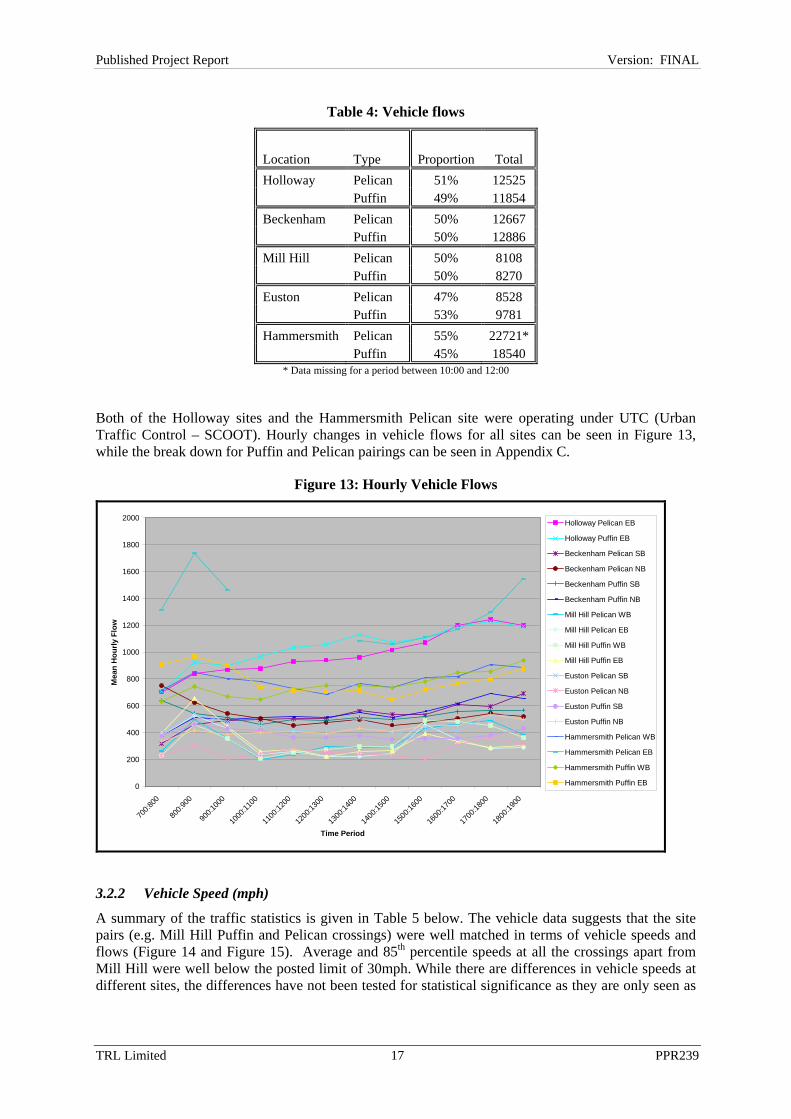
Apart from the Mill Hill crossings, the Pelicans and Puffins were located on the same link and hence vehicle flows were generally well matched at each pair of sites. Table 4 below shows that flows were very close apart from at the Hammersmith site where the Pelican has higher recorded flows than the Puffin, despite missing data for a period between 10:00 and 12:00 when no data was recorded (possibly due to a fault with the counters or a vehicle parked on one of the tubes).
TRL Limited 17 PPR239
Published Project Report Version: FINAL
Table 4: Vehicle flows
Location Type Proportion Total Holloway Pelican 51% 12525 Puffin 49% 11854 Beckenham Pelican 50% 12667 Puffin 50% 12886 Mill Hill Pelican 50% 8108 Puffin 50% 8270 Euston Pelican 47% 8528 Puffin 53% 9781 Hammersmith Pelican 55% 22721* Puffin 45% 18540
* Data missing for a period between 10:00 and 12:00
Both of the Holloway sites and the Hammersmith Pelican site were operating under UTC (Urban Traffic Control – SCOOT). Hourly changes in vehicle flows for all sites can be seen in Figure 13, while the break down for Puffin and Pelican pairings can be seen in Appendix C.
Figure 13: Hourly Vehicle Flows
0
200
400
600
800
1000
1200
1400
1600
1800
2000
700:8
00
800:9
00
900:1
000
1000
:1100
1100
:1200
1200
:1300
1300
:1400
1400
:1500
1500
:1600
1600
:1700
1700
:1800
1800
:1900
Time Period
Mea
n H
ourly
Flo
w
Holloway Pelican EB
Holloway Puffin EB
Beckenham Pelican SB
Beckenham Pelican NB
Beckenham Puffin SB
Beckenham Puffin NB
Mill Hill Pelican WB
Mill Hill Pelican EB
Mill Hill Puffin WB
Mill Hill Puffin EB
Euston Pelican SB
Euston Pelican NB
Euston Puffin SB
Euston Puffin NB
Hammersmith Pelican WB
Hammersmith Pelican EB
Hammersmith Puffin WB
Hammersmith Puffin EB
3.2.2 Vehicle Speed (mph)
A summary of the traffic statistics is given in Table 5 below. The vehicle data suggests that the site pairs (e.g. Mill Hill Puffin and Pelican crossings) were well matched in terms of vehicle speeds and flows (Figure 14 and Figure 15). Average and 85th percentile speeds at all the crossings apart from Mill Hill were well below the posted limit of 30mph. While there are differences in vehicle speeds at different sites, the differences have not been tested for statistical significance as they are only seen as

TRL Limited 18 PPR239
Published Project Report Version: FINAL
indicative of the local conditions. This is because it is difficult to collect the speeds under the same conditions at each site (distance from the crossing, other junction, etc).
Table 5: Summary vehicle statistics
Vehicle Speeds
(mph) Site Type Direction Mean 85%ile
Holloway Pelican Eastbound 21.0 27.5 Puffin Eastbound 20.6 26.8 Beckenham Pelican Southbound 14.9 23.0 Pelican Northbound 18.5 24.6 Puffin Southbound 16.4 21.7 Puffin Northbound 18.8 22.1
Mill Hill Pelican Westbound 25.9 32.0 Pelican Eastbound 26.4 33.6 Puffin Westbound 25.4 30.9 Puffin Eastbound 25.0 30.4 Euston Pelican Southbound 21.3 26.2 Pelican Northbound 18.1 23.9 Puffin Southbound 21.9 26.4 Puffin Northbound 21.5 26.8 Hammersmith Pelican Westbound 17.0 24.2 Pelican Eastbound 19.3 26.8 Puffin Westbound 21.0 28.4 Puffin Eastbound 22.0 29.1
Figure 14: Mean speed distributions
0
5
10
15
20
25
30
Hollow
ay EB
Becke
nham
SB
Becke
nham
NB
Mill Hill W
B
Mill Hill E
B
Euston
SB
Euston
NB
Hammersm
ith W
B
Hammersm
ith EB
Site/Direction
Mea
n Sp
eed
(mph
)
PelicanPuffin

TRL Limited 19 PPR239
Published Project Report Version: FINAL
Figure 15: 85th percentile speed distributions
0
5
10
1520
25
30
35
40
Hollow
ay EB
Becke
nham
SB
Becke
nham
NB
Mill Hill W
B
Mill Hill E
B
Euston
SB
Euston
NB
Hammersm
ith W
B
Hammersm
ith EB
Site/Direction
85%
ile S
peed
(mph
)
PelicanPuffin
3.3 Signal Equipment Failures
Several faults with the equipment were noted during analysis of the video data or through site visits by engineers after the survey had taken place. Table 6 highlights these problems. Data that has been confounded by onsite problems has been excluded from the analysis where possible. Automatic or faulty demand registration was relatively simple to exclude from the analysis but the frequency of such events was not recorded due to the sampling methodologies required to consider a data set of this size. However faulty detectors were less easily identified the few instances where faults were observed were noted and considered in the analysis.
Table 6: Site malfunctions
Location Type
*Automatic demand cycling
**Faulty demand
registration Faulty on-
crossing detectors Faulty kerbside
detectors
Faulty Vehicle
loop detectors
Holloway Pelican No No N/A N/A N/A Puffin Occasionally No Occasionally Sensitive N/A
Beckenham Pelican No No N/A N/A No Puffin No Yes No Occasionally No
Mill Hill Pelican No No N/A N/A Yes Puffin Yes No Yes Yes Yes
Euston Pelican No No N/A N/A N/A Puffin No No No Yes No
Hammersmith Pelican No No N/A N/A N/A Puffin No Yes No No Yes***
* Pedestrian demand continuously activating, despite no button press and no pedestrians in vicinity of crossing
** Pedestrian demand intermittently activating, despite no button press and no pedestrians in vicinity of crossing
*** Hammersmith Puffin had the vehicle input set to Permanent Demand on the controller
TRL Limited 20 PPR239
Published Project Report Version: FINAL
All Puffin sites showed evidence of a working extension period as shown in section 4.1.6 of this report, however it was not clear if all of these extensions were valid i.e. whether there were pedestrians crossing at the time. Problems reported by engineers at the Mill Hill Puffin site did not appear to show up in the data. This suggested that the faults occurred after the data had been collected.
Faulty demand requests were reported at the Holloway Puffin i.e. the pedestrian green phase was cycling automatically despite no one having pressed the pedestrian demand button. The data was sampled to exclude where this may have occurred in the survey, however it is possible that pedestrian behaviours could have been affected by this. Events where demand is registered but clearly no one has pressed the button would either lower the average pedestrian waiting time or increase delay to vehicles.
Faulty loop detectors in the carriageway may influence the signal timings; however their effect is not taken into account in the analysis.
The Euston Pelican site was not connected to the UTC system at the time of the survey.
In addition to the issues highlighted above, data was only recorded from 8:44 am onwards at the Holloway Pelican site. This was due to a decision to move the survey from the Holloway Puffin site to the Pelican when it was found that the Puffin site was not functioning correctly.
It is likely that the on crossing detectors would be required at some point during the day, due to high pedestrian demand.
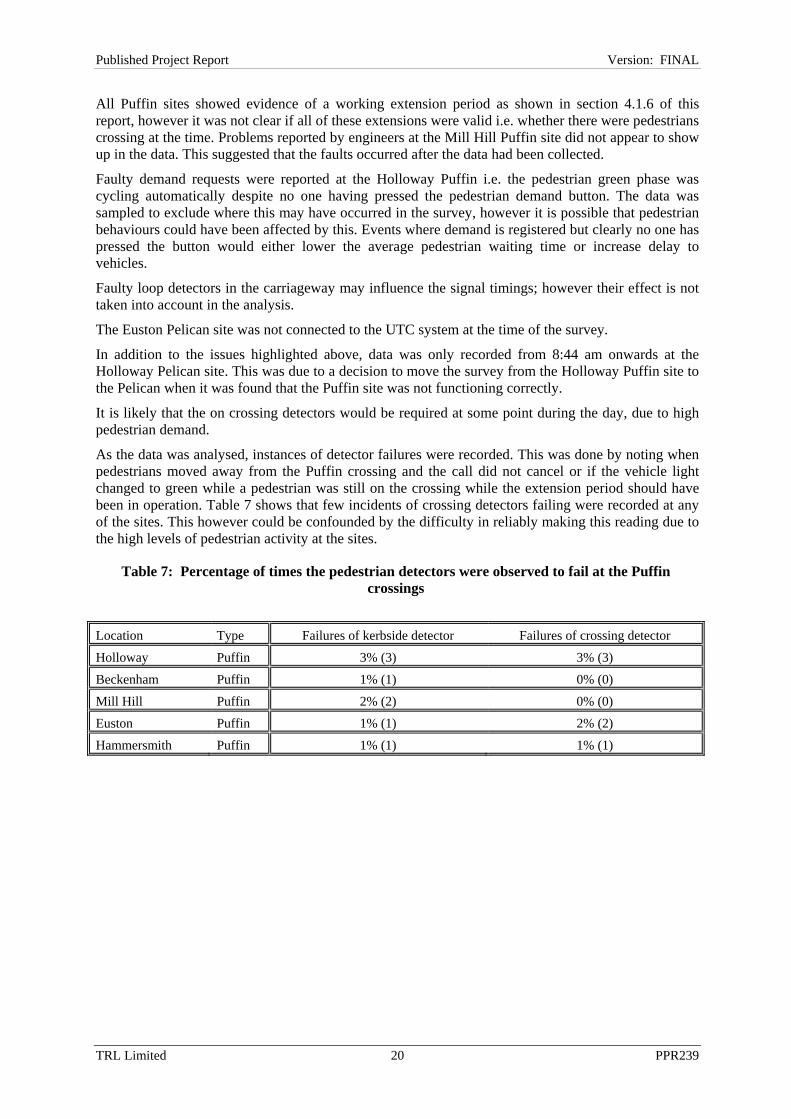
As the data was analysed, instances of detector failures were recorded. This was done by noting when pedestrians moved away from the Puffin crossing and the call did not cancel or if the vehicle light changed to green while a pedestrian was still on the crossing while the extension period should have been in operation. Table 7 shows that few incidents of crossing detectors failing were recorded at any of the sites. This however could be confounded by the difficulty in reliably making this reading due to the high levels of pedestrian activity at the sites.
Table 7: Percentage of times the pedestrian detectors were observed to fail at the Puffin crossings
Location Type Failures of kerbside detector Failures of crossing detector
Holloway Puffin 3% (3) 3% (3)
Beckenham Puffin 1% (1) 0% (0)
Mill Hill Puffin 2% (2) 0% (0)
Euston Puffin 1% (1) 2% (2)
Hammersmith Puffin 1% (1) 1% (1)
TRL Limited 21 PPR239
Published Project Report Version: FINAL
4 Results: Pedestrian and Vehicle Behaviour The behaviour of pedestrians and vehicles at a crossing will affect pedestrian safety and at sites where pedestrians and drivers take more risks it is thought that there will be more conflicts. The type of crossing may affect the behaviour of both pedestrians and vehicles, with for example, longer pedestrian waiting times making pedestrians more willing to cross the road against the lights. This section investigates the behaviours observed at the different crossings.
4.1 Pedestrian Behaviour
Pedestrian behaviour may be affected by certain external factors including:
• The pedestrian signals;
• The traffic flow and speed;
• The waiting time for the traffic light changes.
While the signals given to vehicles and pedestrians by Pelican and Puffin crossings were different, the last two of these factors was likely to be less dependent on the type of crossing. The traffic flow and speed in section 3.2, traffic light phase timings and signal periods are all detailed in Appendix B.
The indicators of road safety and the differences between the sites will be drawn out in this section.
4.1.1 Pedestrian delay
The delay to pedestrians once the signal demand button has been pressed depends on the signal control strategy in use. It is possible that pedestrians who are delayed are more willing to take risks when crossing the road.
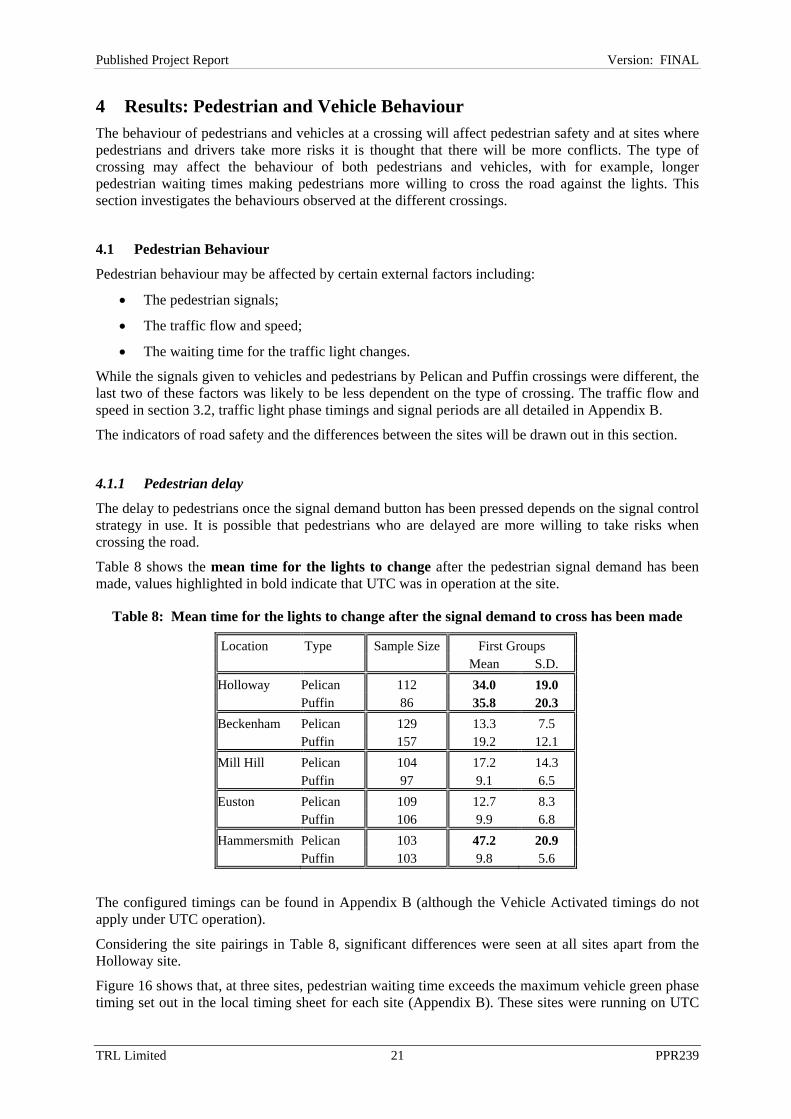
Table 8 shows the mean time for the lights to change after the pedestrian signal demand has been made, values highlighted in bold indicate that UTC was in operation at the site.
Table 8: Mean time for the lights to change after the signal demand to cross has been made
Location Type Sample Size First Groups Mean S.D. Holloway Pelican 112 34.0 19.0 Puffin 86 35.8 20.3 Beckenham Pelican 129 13.3 7.5 Puffin 157 19.2 12.1 Mill Hill Pelican 104 17.2 14.3 Puffin 97 9.1 6.5 Euston Pelican 109 12.7 8.3 Puffin 106 9.9 6.8 Hammersmith Pelican 103 47.2 20.9 Puffin 103 9.8 5.6
The configured timings can be found in Appendix B (although the Vehicle Activated timings do not apply under UTC operation).
Considering the site pairings in Table 8, significant differences were seen at all sites apart from the Holloway site.
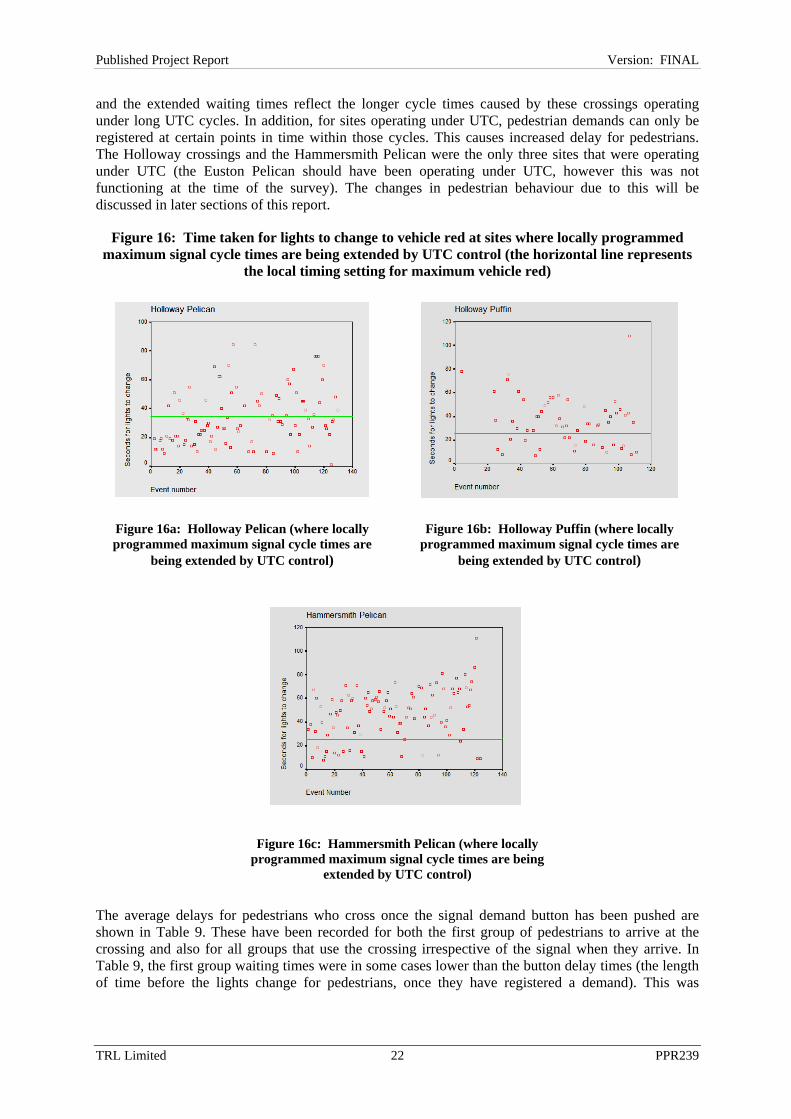
Figure 16 shows that, at three sites, pedestrian waiting time exceeds the maximum vehicle green phase timing set out in the local timing sheet for each site (Appendix B). These sites were running on UTC
TRL Limited 22 PPR239
Published Project Report Version: FINAL
and the extended waiting times reflect the longer cycle times caused by these crossings operating under long UTC cycles. In addition, for sites operating under UTC, pedestrian demands can only be registered at certain points in time within those cycles. This causes increased delay for pedestrians. The Holloway crossings and the Hammersmith Pelican were the only three sites that were operating under UTC (the Euston Pelican should have been operating under UTC, however this was not functioning at the time of the survey). The changes in pedestrian behaviour due to this will be discussed in later sections of this report.
Figure 16: Time taken for lights to change to vehicle red at sites where locally programmed maximum signal cycle times are being extended by UTC control (the horizontal line represents
the local timing setting for maximum vehicle red)
Figure 16a: Holloway Pelican (where locally programmed maximum signal cycle times are
being extended by UTC control)
Figure 16b: Holloway Puffin (where locally programmed maximum signal cycle times are
being extended by UTC control)
Figure 16c: Hammersmith Pelican (where locally programmed maximum signal cycle times are being
extended by UTC control)
The average delays for pedestrians who cross once the signal demand button has been pushed are shown in Table 9. These have been recorded for both the first group of pedestrians to arrive at the crossing and also for all groups that use the crossing irrespective of the signal when they arrive. In Table 9, the first group waiting times were in some cases lower than the button delay times (the length of time before the lights change for pedestrians, once they have registered a demand). This was

TRL Limited 23 PPR239
Published Project Report Version: FINAL
because some of the pedestrians crossed before the lights change. The value for all groups was lower still since these groups arrive after the button was first pressed.
The largest differences in delay to the first pedestrian group to arrive at the crossing, compared to the button delay times, occur at the three sites detailed earlier that operate under UTC, and are highlighted here in bold. This indicates that the opportunity, or the willingness to cross without the protection of the traffic lights, has increased (possibly due to gaps in the traffic). At the Mill Hill and Hammersmith sites the delay was significantly longer at the Pelican crossing (at the 95% level), while at the Beckenham crossing the Puffin delayed pedestrians longer. No significant differences were seen at the Holloway crossings. In some instances the first group delay time was greater than the button time; this was due to delays between when the pedestrian arrived at the crossing and when s/he chooses to make the signal demand.
Table 9: Average delay (seconds) to pedestrians having pressed the signal demand button
First Groups All Groups Location Type Sample Mean S.D. Sample Mean S.D. Holloway Pelican 112 26.9 17.3 220 18.9 16.9 Puffin 86 27.2 17.6 153 20.1 17.5 Beckenham Pelican 129 14.8 9.5 246 9.6 9.6 Puffin 157 21.7 12.5 275 15.1 12.9 Mill Hill Pelican 104 18.1 14.4 138 15.9 14.2 Puffin 97 10.8 8.8 118 9.6 8.8 Euston Pelican 109 12.4 9.2 197 8.3 8.4 Puffin 106 11.2 7.2 136 9.9 7.5 Hammersmith Pelican 103 24.5 21.3 353 14.4 18.3 Puffin 103 9.7 7.3 131 8.8 7.2
From Table 10 it can be seen that pedestrians who choose to cross without using the demand button at all had a mean waiting time that was lower than those who use the button (c.f. Table 9 above); again sites operating UTC have figures highlighted in bold. All mean waiting times were significantly lower at the 95% level if the pedestrian chooses to cross without the aid of the lights. This was because they have no delay or a reduced delay due to waiting for a gap in the traffic.
Table 10: Average delay to pedestrians NOT pressing the signal demand button (crossing on red)
Location Type Sample size Mean S.D. Holloway Pelican 19 6.3 6.9 Puffin 25 11.9 13.7 Beckenham Pelican 19 2.4 3.5 Puffin 16 3.1 3.6 Mill Hill Pelican 8 5.4 5.7 Puffin 19 2.3 3.3 Euston Pelican 25 4.6 5.1 Puffin 20 3.7 5.2 Hammersmith Pelican 20 3.1 5.7 Puffin 13 4.3 4.0
TRL Limited 24 PPR239
Published Project Report Version: FINAL
4.1.2 Pedestrians crossing before the green man
In section 4.1.1 it was seen that the mean waiting time for groups that arrive at the crossing and do not wait for the green man was lower than the mean delay time for those using the signal demand button. This was particularly so at both Holloway sites and the Hammersmith Pelican site where the UTC system affects the pedestrian waiting time. This could explain why the pedestrians were not waiting for the lights to change and were choosing to cross the road against the lights. A pedestrian who crosses the road without the aid of the lights may be at greater risk because he does not have precedence over the vehicles.
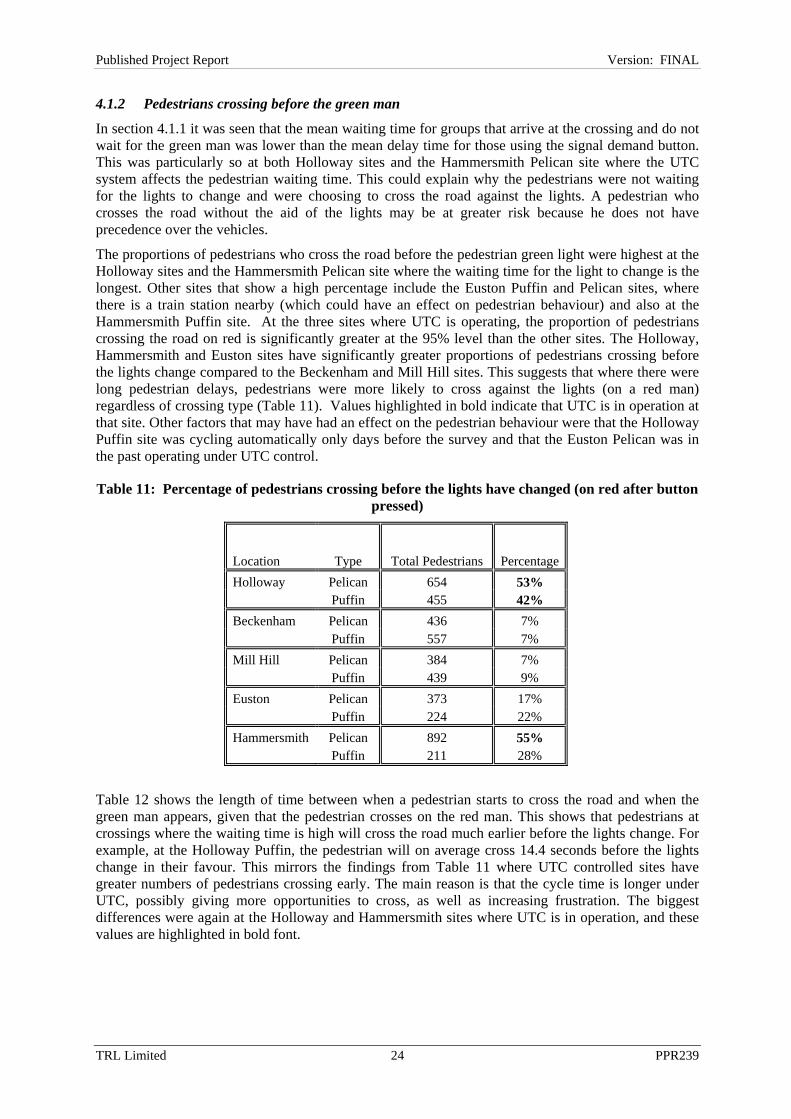
The proportions of pedestrians who cross the road before the pedestrian green light were highest at the Holloway sites and the Hammersmith Pelican site where the waiting time for the light to change is the longest. Other sites that show a high percentage include the Euston Puffin and Pelican sites, where there is a train station nearby (which could have an effect on pedestrian behaviour) and also at the Hammersmith Puffin site. At the three sites where UTC is operating, the proportion of pedestrians crossing the road on red is significantly greater at the 95% level than the other sites. The Holloway, Hammersmith and Euston sites have significantly greater proportions of pedestrians crossing before the lights change compared to the Beckenham and Mill Hill sites. This suggests that where there were long pedestrian delays, pedestrians were more likely to cross against the lights (on a red man) regardless of crossing type (Table 11). Values highlighted in bold indicate that UTC is in operation at that site. Other factors that may have had an effect on the pedestrian behaviour were that the Holloway Puffin site was cycling automatically only days before the survey and that the Euston Pelican was in the past operating under UTC control.
Table 11: Percentage of pedestrians crossing before the lights have changed (on red after button pressed)
Location Type Total Pedestrians PercentageHolloway Pelican 654 53% Puffin 455 42% Beckenham Pelican 436 7% Puffin 557 7% Mill Hill Pelican 384 7% Puffin 439 9% Euston Pelican 373 17% Puffin 224 22% Hammersmith Pelican 892 55% Puffin 211 28%
Table 12 shows the length of time between when a pedestrian starts to cross the road and when the green man appears, given that the pedestrian crosses on the red man. This shows that pedestrians at crossings where the waiting time is high will cross the road much earlier before the lights change. For example, at the Holloway Puffin, the pedestrian will on average cross 14.4 seconds before the lights change in their favour. This mirrors the findings from Table 11 where UTC controlled sites have greater numbers of pedestrians crossing early. The main reason is that the cycle time is longer under UTC, possibly giving more opportunities to cross, as well as increasing frustration. The biggest differences were again at the Holloway and Hammersmith sites where UTC is in operation, and these values are highlighted in bold font.

TRL Limited 25 PPR239
Published Project Report Version: FINAL
Table 12: Early crossing times (before lights change) after button is pressed
Seconds
Before Green Location Type Sample Size Mean S.D.
Holloway Pelican 347 9.0 9.3 Puffin 191 14.4 15.6
Beckenham Pelican 31 4.0 5.1 Puffin 39 2.9 2.8
Mill Hill Pelican 27 3.0 5.0 Puffin 40 2.8 4.9
Euston Pelican 63 6.4 5.3 Puffin 49 3.0 3.2
Hammersmith Pelican 491 27.0 19.8 Puffin 59 6.3 7.2
Figure 17 shows how the average number of seconds for the lights to change, once a pedestrian signal demand has been made, relates to the percentage who cross before the pedestrian green light. No difference can be seen that is dependent on crossing type i.e. whether it is a Puffin or Pelican at the observed sites. Again this indicates that, if pedestrian delays are long, pedestrians will cross on the red man regardless of crossing type.
Figure 17: Relationship between waiting time and percentage of pedestrians choosing to cross on red
Button w ait time (seconds)
50403020100
Perc
enta
ge o
f ped
estri
ans
cros
sing
bef
ore
gree
n lig
ht
60
50
40
30
20
10
0
TYPE
Puffin
Pelican
Table 13 shows the mean delay between pressing the demand button and the pedestrian signal turning to red, dependent on whether the pedestrian crossed before or during the pedestrian green phase. This shows that the wait for the pedestrian green light was on average significantly longer for those pedestrians that chose to cross before the signals change, implying that the length of wait affects whether the pedestrian would choose to cross without the aid of the traffic lights.

TRL Limited 26 PPR239
Published Project Report Version: FINAL
Table 13: Delay (seconds) to light change once a pedestrian has pressed the demand button, dependent on whether the group crosses before the pedestrian green phase
Pelican Puffin
Before Green During Green Before Green During Green Mean 42.8 23.3 26.4 16.0 Standard Deviation 21.8 22.4 26.8 12.0 Sample Size 360 768 146 619
4.1.3 Pedestrians who do not use the button
In addition to crossing before the lights have changed, crossing without pressing the signal demand button (and hence crossing on the red light) may involve a greater risk than crossing on the green man. Table 14 shows the percentages of pedestrians failing to use the signal demand button (those sites that are UTC controlled have values highlighted in bold).
Table 14: Proportion of pedestrians not using the signal demand button
Location Type Sample PercentageHolloway Pelican 2892 22% Puffin 2626 49% Beckenham Pelican 3464 3% Puffin 2117 10% Mill Hill Pelican 409 2% Puffin 439 4% Euston Pelican 3315 26% Puffin 570 36% Hammersmith Pelican 4528 29% Puffin 1129 18% Total* Pelican 14608 20% Puffin 6881 28%
*The total figures represent the mean of all the surveyed Puffins and Pelicans, it should be noted that the values given here will be confounded by factors including: length of waiting times, traffic flow and
speed and number of carriageways.
Apart from at Hammersmith, it can be seen that a greater percentage of pedestrians chose to cross without the use of the button at Puffin sites. The reasons for this are unclear but may be a result of local factors where for example the Euston site is likely to be servicing a high proportion of commuters who may be more likely to make judgement calls about crossing the road than school children at the Mill Hill sites. It is important to note that the Holloway Pelican site was cycling constantly up until 3 days before the survey which may explain the high percentage of pedestrians not using the push demand button.
The Hammersmith and Holloway crossings cannot be compared with the other crossings because of the possible effect of UTC on pedestrian behaviour. At the Beckenham and Euston crossings the pedestrian flows were different at the Pelican and the Puffin crossings with 1.6 and 5.8 times more pedestrians respectively at the Pelicans.
Comparing the Pelican and Puffin crossings as a group yields a mean and standard deviation of 17% and 13% respectively for the Pelican crossings, while the Puffin crossing had a mean of 23% and a standard deviation of 19%. However it should be noted that these values will be being affected by the local factors which cause variation between the sites.

TRL Limited 27 PPR239
Published Project Report Version: FINAL
4.1.4 Pedestrians who start to cross late
Pedestrians who cross towards the end of a pedestrian phase (during the clearance period) were more likely to be in conflict with traffic than those at the start of the phase because late crossing may mean that pedestrians were in the carriageway when the lights change and the vehicles begin to move. The type of crossing (Pelican or Puffin) may have an effect on this behaviour as the operation of the pedestrian signals is different.
At a Pelican crossing the flashing green man period may encourage late crossing, whereas at a Puffin crossing the pedestrians were shown a red man which may discourage crossing. The results suggest that pedestrians were more likely to step onto a Pelican crossing than a Puffin crossing during this clearance period. 28 people did this at a Pelican crossing compared to only one at a Puffin crossing (Table 15). This suggests that pedestrians were more cautious when shown a steady red man signal than a flashing green man signal. Weighting the total pedestrians that cross at each type of site and performing a chi-square test shows that significantly more pedestrians exhibited this behaviour at the Pelican sites (at the 95% level).
There was better observance of the red man at Puffin sites than of the flashing man at Pelican sites. This might suggest that the pedestrians were not aware of the extension facility on Puffin crossings.
Table 15: Percentage of pedestrians starting to cross in the clearance period
Location Type Number PercentageHolloway Pelican 3 0.5% Puffin 0 0.0% Beckenham Pelican 6 1.4% Puffin 0 0.0% Mill Hill Pelican 2 0.5% Puffin 1 0.2% Euston Pelican 2 0.5% Puffin 0 0.0% Hammersmith Pelican 15 1.7% Puffin 0 0.0% Total Pelican 28 1.0% Puffin 1 0.1%
The light showing to vehicles, after the pedestrians have cleared the crossing, was red more frequently at Puffin crossings than at Pelican crossings (Table 16). The difference between Pelican and Puffin crossings is significant at the 95% level at all sites apart from the Holloway site. The Holloway site has the longest vehicle red period of all of the Pelican sites, which explains why it was more likely that this signal shows red to the vehicles once the pedestrians had finished crossing.

TRL Limited 28 PPR239
Published Project Report Version: FINAL
Table 16: Vehicle signal phase when pedestrians finish crossing
Location Type Red Flashing Amber Green Holloway Pelican 79% (170) 16% (35) 5% (10) Puffin 88% (64) 12% (9)
Beckenham Pelican 19% (21) 79% (85) 2% (2) Puffin 98% (207) 2% (4)
Mill Hill Pelican 41% (52) 57% (73) 2% (2) Puffin 97% (92) 3% (3)
Euston Pelican 14% (14) 80% (81) 6% (6) Puffin 99% (92) 1% (1)
Hammersmith Pelican 9% (10) 75% (79) 16% (17) Puffin 99% (123) 1% (1)
Total Pelican 41% (267) 54% (353) 6% (37) Puffin 97% (578) 3% (18)
Of the 29 pedestrians (Pelican and Puffin crossing combined) who started crossing after the steady green man period, 45% ran across the road compared with 7% of those who started to cross on the green man. This suggests that pedestrians who cross late could feel pressured to cross more quickly, either by traffic beginning to move, or by the flashing pedestrian signal that is shown at Pelican sites. None of these pedestrians had any kind of mobility issue.
4.1.5 Pedestrian crossing times
Crossing times at the study sites were affected by factors that include:
• Road width
• Crossing method (running, walking,…)
• Pedestrian characteristics (age, mobility….)
• Presence of a pedestrian refuge or central reserve at the crossing
This section considers these factors in relation to the overall crossing time and establishes any differences between the groups.
Table 17: Average pedestrian crossing times (seconds)
First Groups All Groups Location Type Sample Mean S.D. Sample Mean S.D.
Holloway Pelican 108 12.7 4.4 222 12.1 4.3 Puffin 80 12.3 3.5 154 12.0 4.1
Beckenham Pelican 109 7.4 2.4 246 7.2 2.1 Puffin 139 9.7 2.4 275 9.6 2.8
Mill Hill Pelican 103 7.5 2.0 139 7.3 2.0 Puffin 93 6.9 2.2 115 6.9 2.2
Euston Pelican 101 8.1 2.2 197 7.8 2.1 Puffin 113 7.4 2.2 136 7.3 2.2
Hammersmith* Pelican 82 14.7 6.3 281 12.8 4.7 Puffin 90 10.6 2.5 118 10.5 2.5
* Both Hammersmith sites have a pedestrian refuge
TRL Limited 29 PPR239
Published Project Report Version: FINAL
Overall crossing times tend to be slightly greater for the first group of pedestrians crossing the road (defined as the group that first stepped into the road) compared to every group to cross the road, however this difference is not statistically significant.
In Appendix C crossing times have been broken down by mobility impairment: impairment has been defined as having either a physical impairment (e.g. in a wheelchair or moving with difficulty) or by having an object that makes walking awkward (e.g. pushing a buggy or carrying a heavy object). The following provides a summary of the findings:
• Younger pedestrians (those pedestrians that appeared to be under the age of 18) tended to cross more quickly than older pedestrians or pedestrians with young children.
• Pedestrians considered to have some kind of mobility impairment took longer to cross on average than pedestrians with no visible mobility impairment.
Pedestrian walking speeds can be determined from crossing times and the width of the road. These can be seen in Figure C8 and Figure C10 (Appendix C) by age and impairment respectively. There was no statistically significant difference between crossing speeds at Pelicans and Puffins. However the walking speeds of the older pedestrians (61+) and those that were impaired were consistently slower than those that were non-impaired or younger.
Table C2 and Figure C11 (in Appendix C) show the distribution of start times for pedestrians at the Pelican and Puffin crossings. It appears that pedestrians behave in largely the same manner at both Pelican and Puffin sites and statistical tests reveal no significant differences.
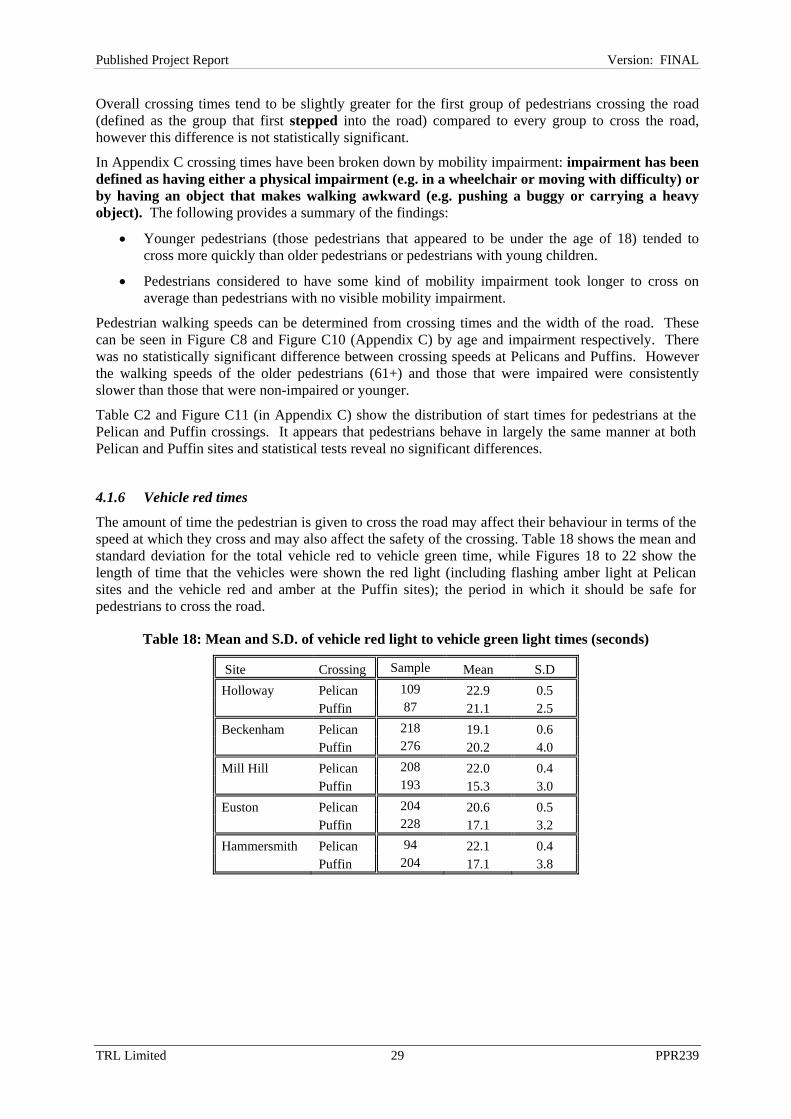
4.1.6 Vehicle red times
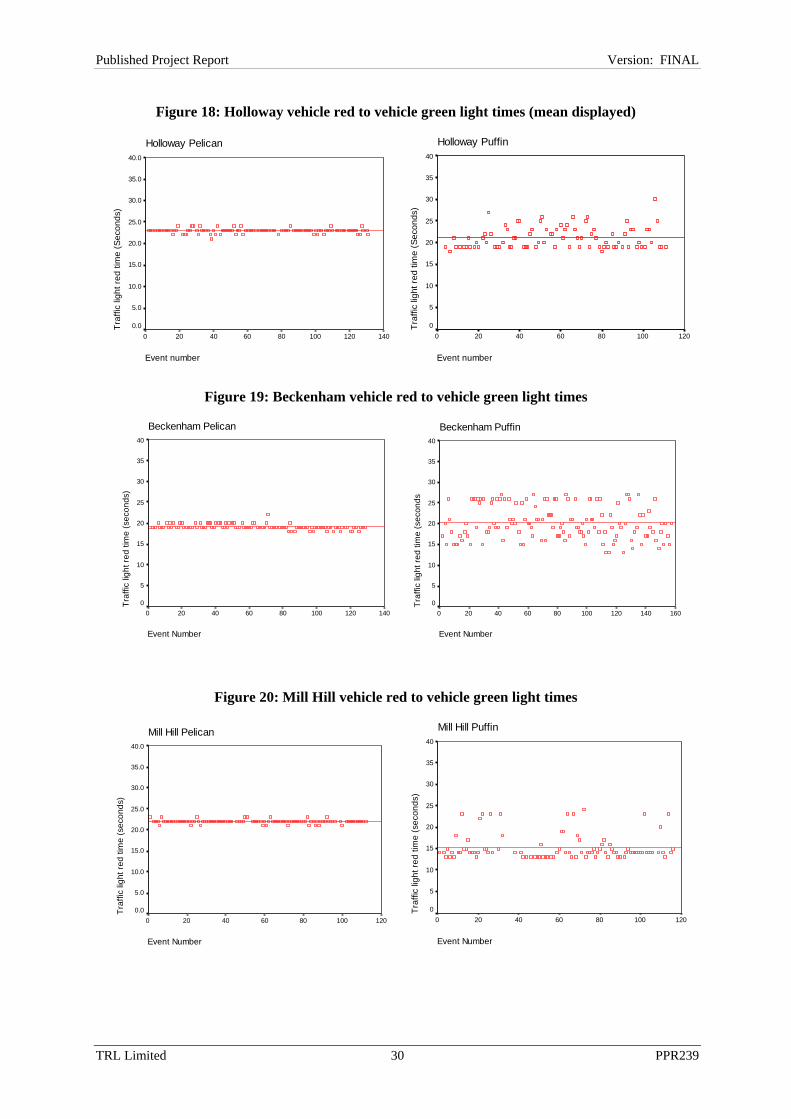
The amount of time the pedestrian is given to cross the road may affect their behaviour in terms of the speed at which they cross and may also affect the safety of the crossing. Table 18 shows the mean and standard deviation for the total vehicle red to vehicle green time, while Figures 18 to 22 show the length of time that the vehicles were shown the red light (including flashing amber light at Pelican sites and the vehicle red and amber at the Puffin sites); the period in which it should be safe for pedestrians to cross the road.
Table 18: Mean and S.D. of vehicle red light to vehicle green light times (seconds)
Site Crossing Sample Mean S.D Holloway Pelican 109 22.9 0.5 Puffin 87 21.1 2.5 Beckenham Pelican 218 19.1 0.6 Puffin 276 20.2 4.0 Mill Hill Pelican 208 22.0 0.4 Puffin 193 15.3 3.0 Euston Pelican 204 20.6 0.5 Puffin 228 17.1 3.2 Hammersmith Pelican 94 22.1 0.4 Puffin 204 17.1 3.8
TRL Limited 30 PPR239
Published Project Report Version: FINAL
Figure 18: Holloway vehicle red to vehicle green light times (mean displayed)
Holloway Pelican
Event number
140120100806040200
Traf
fic li
ght r
ed ti
me
(Sec
onds
)
40.0
35.0
30.0
25.0
20.0
15.0
10.0
5.0
0.0
Holloway Puffin
Event number
120100806040200
Traf
fic li
ght r
ed ti
me
(Sec
onds
)
40
35
30
25
20
15
10
5
0
Figure 19: Beckenham vehicle red to vehicle green light times
Beckenham Pelican
Event Number
140120100806040200
Traf
fic li
ght r
ed ti
me
(sec
onds
)
40
35
30
25
20
15
10
5
0
Beckenham Puffin
Event Number
160140120100806040200
Traf
fic li
ght r
ed ti
me
(sec
onds
40
35
30
25
20
15
10
5
0
Figure 20: Mill Hill vehicle red to vehicle green light times
Mill Hill Pelican
Event Number
120100806040200
Traf
fic li
ght r
ed ti
me
(sec
onds
)
40.0
35.0
30.0
25.0
20.0
15.0
10.0
5.0
0.0
Mill Hill Puffin
Event Number
120100806040200
Traf
fic li
ght r
ed ti
me
(sec
onds
)
40
35
30
25
20
15
10
5
0

TRL Limited 31 PPR239
Published Project Report Version: FINAL
Figure 21: Euston vehicle red to vehicle green light times
Euston Pelican
Event number
140120100806040200
Traf
fic li
ght r
ed ti
me
(sec
onds
)
40.0
35.0
30.0
25.0
20.0
15.0
10.0
5.0
0.0
Euston Puffin
Event Number
140120100806040200
Traf
fic li
ght r
ed ti
me
(sec
onds
)
40
35
30
25
20
15
10
5
0
Figure 22: Hammersmith vehicle red to vehicle green light times
Hammersmith Pelican
Event number
120100806040200
Traf
fic li
ght r
ed ti
me
(Sec
onds
)
40.0
35.0
30.0
25.0
20.0
15.0
10.0
5.0
0.0
Hammersmith Puffin
Event number
120100806040200
Traf
fic li
ght r
ed ti
me
(Sec
onds
)40
35
30
25
20
15
10
5
0
The pairs of figures show that while the Pelican sites have a fixed vehicle wait time (which includes the vehicle amber phase), the Puffin is clearly not operating at a fixed time at any of the sites and hence it can be concluded that the extension period is functioning. The frequency that the extension period is occurring is shown in Table 19; the values for the Beckenham and Hammersmith crossings are very high as Figure 19 and Figure 22 show that the extension period appears to be being employed for almost all crossing events. At both the Beckenham and Mill Hill Puffin crossings the maximum pedestrian extension time was recorded on a number of events.
The period at the Hammersmith Pelican site where no data was recorded is due to glare from sunlight obscuring the traffic lights on the video tapes.
Table 19: Frequency of extension period use
Location Type Percentage
Holloway Puffin 35%
*Beckenham Puffin 91%
Mill Hill Puffin 20%
Euston Puffin 20%
*Hammersmith Puffin 87% * estimated figures due to high frequency of pedestrian extensions

TRL Limited 32 PPR239
Published Project Report Version: FINAL
4.1.7 Pedestrian crossing behaviours
This section will consider pedestrian behaviour. On no occasion was the pedestrian signal aspect at either the Pelicans or the Puffins obstructed by crowds.
On only one occasion was a pedestrian observed to press a button and move away, causing the Puffin crossing to call cancel. This feature is generally considered to be one of the key benefits of Puffin crossings for traffic. The reasons for the call not cancelling were possibly caused by high levels of pedestrian activity on the footway.
Table D1 (in Appendix D) indicates that higher proportions of pedestrians ran across the crossings at the Mill Hill school sites where there were younger pedestrians. The greatest numbers of pedestrians who walked slowly across the crossing were at the Beckenham sites where the proportion of pedestrians over the age of 60 was greatest.
Considering whether pedestrians cross within the crossing boundaries, Table D2 shows that pedestrians were most compliant at the Mill Hill sites with very few pedestrians crossing outside the studs. Presence of a guard rail on the site appears to have an effect on this behaviour and statistical tests show no significant differences (Chi-Square indicates that the null hypothesis that the proportions crossing completely inside the studs compared to those, at least partially, outside for both full and partial sets of guard rails cannot be rejected at the 90% level). The statistics for this can be seen in Table D2 and Figure D2 appended.
If a pedestrian began to cross during the green phase then this pedestrian always completed the crossing before the vehicle green light. This was seen to be the case at all sites, whether Puffin or Pelican.
4.2 Vehicle Driver Behaviour
The safety of pedestrians will in part be determined by vehicle driver behaviour, which will in turn be influenced by the signals at the different types of crossings. The principal difference between Pelican and Puffin crossings is the flashing amber period that occurs at a Pelican crossing but not at a Puffin. Vehicles that move during the flashing amber phase may come into conflict with pedestrians. Vehicle driver behaviour may also be affected by the length of time that they were kept waiting at the traffic lights and whether the pedestrians were making use of the crossing.
4.2.1 Vehicle delay
One of the purposes of introducing the Puffin crossing was to reduce vehicle delay, achieved by using the call cancel facility, while late crossers are deterred by the red signal. Section 4.1.4 showed that pedestrians were less likely to start crossing once the pedestrian green period had ended at a Puffin than at a Pelican crossing. However the mean waiting time of the first vehicle at these Puffin crossings was greater than at the Pelican crossings; this was because, despite more pedestrians crossing at the Pelican, the vehicle in the majority of cases moved off during the amber phase rather than waiting for the green signal. The delay to the first vehicle was lower than the timings shown in 4.1.6 as the vehicle would often arrive after the vehicle red light was already showing. The recorded delays for the first vehicle in the queue (time in seconds from when the wheels stop to when the wheels start) can be seen in Table 20.

TRL Limited 33 PPR239
Published Project Report Version: FINAL
Table 20: Average delay to the first vehicle in queue (vehicle stop to vehicle start time) (seconds)
Location Type Sample Mean S.D. Holloway Pelican 49 8.8 4.4 Puffin 77 14.3 4.7 Beckenham Pelican 169 8.5 5.4 Puffin 237 14.9 6.1 Mill Hill Pelican 166 9.2 4.5 Puffin 130 10.5 4.6 Euston Pelican 111 8.2 3.8 Puffin 164 10.2 4.9 Hammersmith Pelican 176 9.1 5.0 Puffin 171 12.4 5.3 All Pelican 671 8.8 4.8 Puffin 779 12.6 5.6 When Puffin crossings were first installed the timings for the periods that make up the pedestrian sequence had to be quite pessimistic towards vehicular traffic. This was in part due to the detector technology originally available and the natural feeling of having to be careful. Recently, views have evolved to the position that control of Puffin crossings has to be ‘snappy’. The current recommendations for periods 1 to 9 (as defined in TAL 1/01 and Figure 7) are given in Table 21.
Table 21: Current recommended timings for periods 1 to 9 in the Puffin sequence (in seconds)
1 2 3 4 5 6 7 8 9 Red Vehicle Signal Green Amber Red Amber
Pedestrian Signal Red Green Red Ext. Red Red
Recommended Timings variable 3
1 – 3 (1 for low
speed sites)
4 upwards depending on requirements
1.8
Min 0
Max variable
0 0 2
Note that periods 7 and 8 are alternatives: period 7 applies when period 6 reached its maximum and period 8 applies if it did not (i.e. if there were no further pedestrians requiring period 6 to be extended). The timings suggested in Table 21 should not present any problems providing that the Puffin on-crossing detectors are working satisfactorily as they will themselves extend period 6 long enough to allow pedestrians to complete their manoeuvre. Any further allowance either in period 6 itself, or in periods 5, 7 or 8 is unnecessary. To extend the all-red longer than is absolutely necessary risks indecision on the part of pedestrians as they see the signals to traffic on red, and despite seeing their own signals on red, some are tempted to think it will be safe to cross. Ending the red phase quite positively after the last pedestrian has finished crossing may reduce somewhat risky behaviour. In the surveys reported on here, the Puffin crossings had been variously set up with somewhat conservative timings, especially for periods 5, 7 and 8. This increases the effective red to traffic by several seconds for all the sites (see Table B3 in Appendix B – the time saved is the difference between the current minimums and the revised minimums if current advice was followed). If timings

TRL Limited 34 PPR239
Published Project Report Version: FINAL
that followed current advice were used at the Puffins in this study, the wait time for the first vehicle in the queue would compare much more equitably with the Pelicans that they were paired with.
4.2.2 Vehicles moving before vehicle green
It is interesting to contrast the differences between the waiting time for the first vehicle at the Pelican and Puffin crossings in this study. At Pelicans, drivers can treat the flashing amber as effectively green as soon as the last pedestrian has cleared the path of the vehicle. At Puffins, drivers have to wait until the system (i.e. controller, detectors etc) has decided that the last pedestrian has finished crossing and is off the road completely. Thus at Puffins the wait time for the first vehicle is highly dependent on the settings in periods 5, 7 or 8. If these times are set conservatively (and, arguably, they have been at the Puffins in this study) then pedestrians might be well clear of the crossing before the signals change in favour of vehicles. Hence in this study, the wait time for the first driver at Puffins is longer than for Pelicans. At Pelicans, however, the flashing amber period, whilst often helpful in giving both pedestrians and vehicles the flexibility to be efficient, can bring pedestrians and vehicles into conflict. Puffins can potentially offer nearly the same level of flexibility and have been designed to do so in a way that is safer than Pelican, by protecting pedestrians with a red-to-traffic. This is considered in section 4.3.
Table 22 shows that between 86% and 95% of vehicles move during the amber period at the Pelican crossing sites. Very few vehicles at either type of crossing move during the red light phase.
Table 22: Traffic light signal to vehicles when first vehicle moves off1
Location Type Red Amber Green
Holloway Pelican 0% (0) 86% (38) 14% (6) Puffin 0% (0) 100% (74)
Beckenham Pelican 1% (2) 95% (161) 4% (6) Puffin 5% (12) 95% (224)
Mill Hill Pelican 2% (4) 95% (162) 3% (5) Puffin 2% (2) 98% (129)
Euston Pelican 1% (1) 95% (105) 5% (5) Puffin 3% (5) 97% (159)
Hammersmith Pelican 3% (5) 92% (105) 5% (9) Puffin 2% (4) 98% (167)
All Pelican 2% (12) 94% (628) 5% (31) Puffin 3% (23) 97% (753)
1 This does not necessarily mean that they have crossed the stop line.

TRL Limited 35 PPR239
Published Project Report Version: FINAL
Table 23 indicates the number of pedestrians still on the crossing when the lights change. From the limited number of observations made during this study it has not been possible to determine whether the type of crossing affects the frequency of this situation.
Table 23: Number of times a pedestrian is still on the crossing when vehicles move under a red light
Location
Type Total vehicles moving on red light
Total when pedestrian is still on the crossing (Proportionof times a pedestrian is still on
the crossing)
Proportion of all vehicles to move on green when
a pedestrian is still on thecrossing
Holloway Pelican 0 (of 44) 0 (n\a) 0% Puffin 0 (of 74) 0 (n\a) 0%
Beckenham Pelican 2 (of 169) 1 (50%) 1% Puffin 12 (of236) 2 (17%) 1%
Mill Hill Pelican 4 (of 171) 2 (50%) 1% Puffin 2 (of 131) 1 (50%) 1%
Euston Pelican 1 (of 111) 1 (100%) 1% Puffin 5 (of 164) 2 (40%) 1%
Hammersmith Pelican 5 (of 176) 4 (80%) 2% Puffin 4 (of 171) 2 (50%) 1%
All Pelican 12 (of 671) 8 (67%) 1% Puffin 23 (of 776) 7 (30%) 1% Table 24 shows the number of vehicles that moved off during vehicle green while there was still a pedestrian on the crossing. Far more vehicles moved off during the vehicle green light on Puffin crossings as there is no flashing amber phase; this was reflected in the number of times a pedestrian is still on the crossing.
Table 24: Number of times a pedestrian is still on the crossing when vehicles move under a green light
Location Type
Total vehicles moving on green light (total vehicles)
Proportion moving on green when a pedestrian is still
on the crossing (number moving on green)
Proportion of all vehiclesto move on red when a pedestrian is still on the
crossing Holloway Pelican 6 (of 44) 0% (0) 0% Puffin 74 (of 74) 4% (3) 4%
Beckenham Pelican 6 (of 169) 17% (1) 1% Puffin 224 (of 236) 1% (2) 1%
Mill Hill Pelican 5 (of 171) 0% (0) 0% Puffin 129 (of 131) 0% (0) 0%
Euston Pelican 5 (of 111) 0% (0) 0% Puffin 159 (of 164) 0% (0) 0%
Hammersmith Pelican 9 (of 176) 0% (0) 0% Puffin 167 (of 171) 0% (0) 0%
All Pelican 31 (of 671) 3% (1) 0% Puffin 757 (of 776) 1% (5) 0%

TRL Limited 36 PPR239
Published Project Report Version: FINAL
Figures 23 and 24 below show the distribution of vehicle movement times at Pelican and Puffin crossings respectively. It can be seen that the vehicles at Pelican crossings generally move off long before the vehicle green light and often move during the flashing amber period – as indicated in Table 22. However at the Puffin crossings the vehicle movement time is shortly after the vehicle green light. It is possible that vehicles that move off before the vehicle green light at Pelican crossings could be conflicting with pedestrians who cross late; this is investigated in section 4.3.
Figure 23: Distribution of vehicle movement times – Pelican crossings
Pelican Crossings
Vehicle movement time after start of AMBER light (seconds)
2217131086420-2-5-8
Cou
nt
200
100
0
SITE
Hammersmith
Euston
Mill Hill
Beckenham
Hollow ay
The Pelican sites have varying lengths of flashing amber times, these range between 9 and 13 seconds and can be seen in Table B1 (Appendix B).
Figure 24: Distribution of vehicle movement times – Puffin crossings
Puffin Crossings
Vehicle movement time after start of GREEN light (seconds)
1386420-2-4-7-10-12
Cou
nt
400
300
200
100
0
SITE
Hammersmith
Euston
Mill Hill
Beckenham
Hollow ay
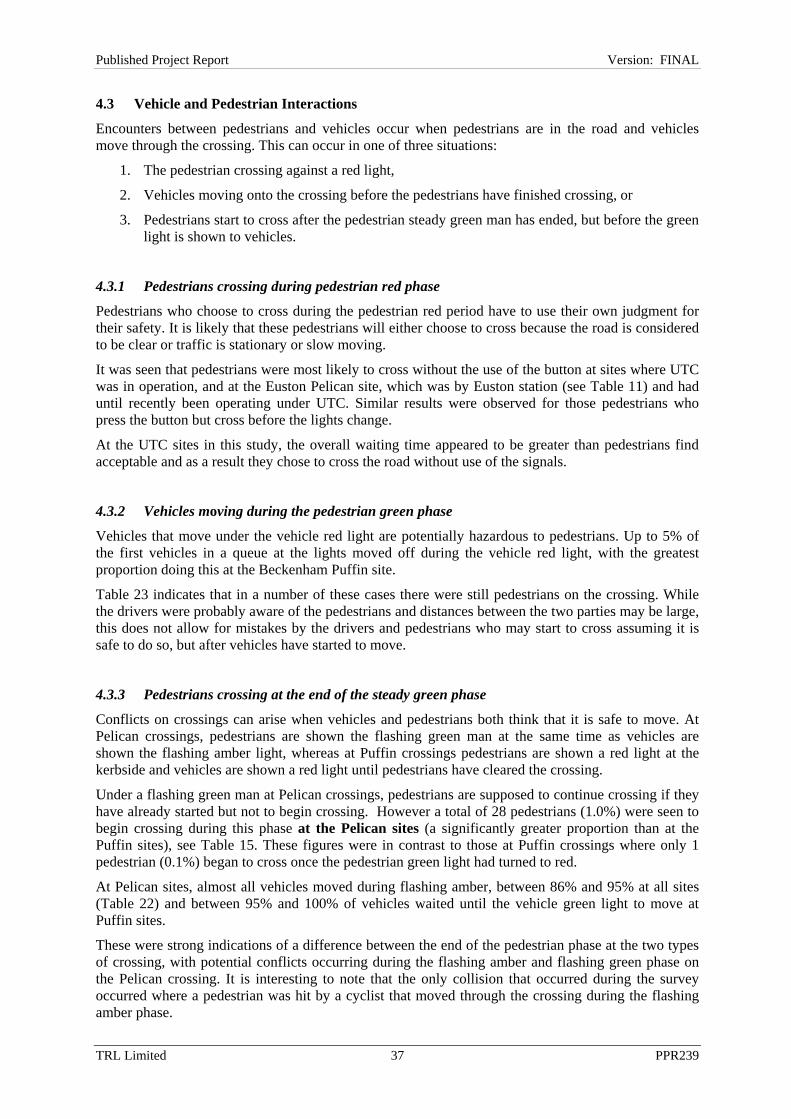
TRL Limited 37 PPR239
Published Project Report Version: FINAL
4.3 Vehicle and Pedestrian Interactions
Encounters between pedestrians and vehicles occur when pedestrians are in the road and vehicles move through the crossing. This can occur in one of three situations:
1. The pedestrian crossing against a red light,
2. Vehicles moving onto the crossing before the pedestrians have finished crossing, or
3. Pedestrians start to cross after the pedestrian steady green man has ended, but before the green light is shown to vehicles.
4.3.1 Pedestrians crossing during pedestrian red phase
Pedestrians who choose to cross during the pedestrian red period have to use their own judgment for their safety. It is likely that these pedestrians will either choose to cross because the road is considered to be clear or traffic is stationary or slow moving.
It was seen that pedestrians were most likely to cross without the use of the button at sites where UTC was in operation, and at the Euston Pelican site, which was by Euston station (see Table 11) and had until recently been operating under UTC. Similar results were observed for those pedestrians who press the button but cross before the lights change.
At the UTC sites in this study, the overall waiting time appeared to be greater than pedestrians find acceptable and as a result they chose to cross the road without use of the signals.
4.3.2 Vehicles moving during the pedestrian green phase
Vehicles that move under the vehicle red light are potentially hazardous to pedestrians. Up to 5% of the first vehicles in a queue at the lights moved off during the vehicle red light, with the greatest proportion doing this at the Beckenham Puffin site.
Table 23 indicates that in a number of these cases there were still pedestrians on the crossing. While the drivers were probably aware of the pedestrians and distances between the two parties may be large, this does not allow for mistakes by the drivers and pedestrians who may start to cross assuming it is safe to do so, but after vehicles have started to move.
4.3.3 Pedestrians crossing at the end of the steady green phase
Conflicts on crossings can arise when vehicles and pedestrians both think that it is safe to move. At Pelican crossings, pedestrians are shown the flashing green man at the same time as vehicles are shown the flashing amber light, whereas at Puffin crossings pedestrians are shown a red light at the kerbside and vehicles are shown a red light until pedestrians have cleared the crossing.
Under a flashing green man at Pelican crossings, pedestrians are supposed to continue crossing if they have already started but not to begin crossing. However a total of 28 pedestrians (1.0%) were seen to begin crossing during this phase at the Pelican sites (a significantly greater proportion than at the Puffin sites), see Table 15. These figures were in contrast to those at Puffin crossings where only 1 pedestrian (0.1%) began to cross once the pedestrian green light had turned to red.
At Pelican sites, almost all vehicles moved during flashing amber, between 86% and 95% at all sites (Table 22) and between 95% and 100% of vehicles waited until the vehicle green light to move at Puffin sites.
These were strong indications of a difference between the end of the pedestrian phase at the two types of crossing, with potential conflicts occurring during the flashing amber and flashing green phase on the Pelican crossing. It is interesting to note that the only collision that occurred during the survey occurred where a pedestrian was hit by a cyclist that moved through the crossing during the flashing amber phase.
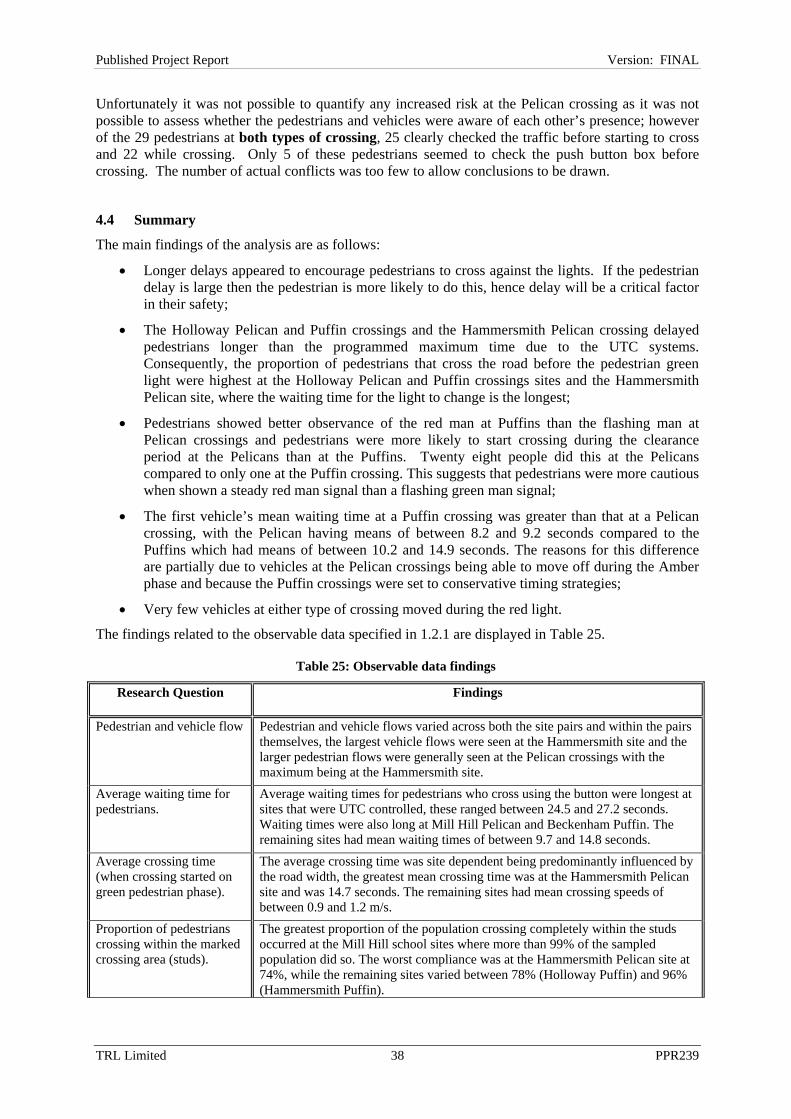
TRL Limited 38 PPR239
Published Project Report Version: FINAL
Unfortunately it was not possible to quantify any increased risk at the Pelican crossing as it was not possible to assess whether the pedestrians and vehicles were aware of each other’s presence; however of the 29 pedestrians at both types of crossing, 25 clearly checked the traffic before starting to cross and 22 while crossing. Only 5 of these pedestrians seemed to check the push button box before crossing. The number of actual conflicts was too few to allow conclusions to be drawn.
4.4 Summary
The main findings of the analysis are as follows:
• Longer delays appeared to encourage pedestrians to cross against the lights. If the pedestrian delay is large then the pedestrian is more likely to do this, hence delay will be a critical factor in their safety;
• The Holloway Pelican and Puffin crossings and the Hammersmith Pelican crossing delayed pedestrians longer than the programmed maximum time due to the UTC systems. Consequently, the proportion of pedestrians that cross the road before the pedestrian green light were highest at the Holloway Pelican and Puffin crossings sites and the Hammersmith Pelican site, where the waiting time for the light to change is the longest;
• Pedestrians showed better observance of the red man at Puffins than the flashing man at Pelican crossings and pedestrians were more likely to start crossing during the clearance period at the Pelicans than at the Puffins. Twenty eight people did this at the Pelicans compared to only one at the Puffin crossing. This suggests that pedestrians were more cautious when shown a steady red man signal than a flashing green man signal;
• The first vehicle’s mean waiting time at a Puffin crossing was greater than that at a Pelican crossing, with the Pelican having means of between 8.2 and 9.2 seconds compared to the Puffins which had means of between 10.2 and 14.9 seconds. The reasons for this difference are partially due to vehicles at the Pelican crossings being able to move off during the Amber phase and because the Puffin crossings were set to conservative timing strategies;
• Very few vehicles at either type of crossing moved during the red light.
The findings related to the observable data specified in 1.2.1 are displayed in Table 25.
Table 25: Observable data findings
Research Question Findings
Pedestrian and vehicle flow Pedestrian and vehicle flows varied across both the site pairs and within the pairs themselves, the largest vehicle flows were seen at the Hammersmith site and the larger pedestrian flows were generally seen at the Pelican crossings with the maximum being at the Hammersmith site.
Average waiting time for pedestrians.
Average waiting times for pedestrians who cross using the button were longest at sites that were UTC controlled, these ranged between 24.5 and 27.2 seconds. Waiting times were also long at Mill Hill Pelican and Beckenham Puffin. The remaining sites had mean waiting times of between 9.7 and 14.8 seconds.
Average crossing time (when crossing started on green pedestrian phase).
The average crossing time was site dependent being predominantly influenced by the road width, the greatest mean crossing time was at the Hammersmith Pelican site and was 14.7 seconds. The remaining sites had mean crossing speeds of between 0.9 and 1.2 m/s.
Proportion of pedestrians crossing within the marked crossing area (studs).
The greatest proportion of the population crossing completely within the studs occurred at the Mill Hill school sites where more than 99% of the sampled population did so. The worst compliance was at the Hammersmith Pelican site at 74%, while the remaining sites varied between 78% (Holloway Puffin) and 96% (Hammersmith Puffin).

TRL Limited 39 PPR239
Published Project Report Version: FINAL
Research Question Findings
Proportion of pedestrians who cross outside the studs but in the vicinity of the crossing.
Few pedestrians were recorded with this behaviour (at most 1% of the sample at a site), which is probably due to a combination of the presence of guard rails at most of the sites and the size of the area focused on in the study surrounding the crossings.
Proportion of pedestrians who start to cross before the green pedestrian phase.
The largest proportion of pedestrians crossing before the pedestrian green phase occurred at the sites controlled by the UTC, where between 42% and 55% of the sampled population do so. Beckenham and Mill Hill sites saw between 7% and 9% of the population with this behaviour, while the Euston Pelican was at 17%, Puffin at 22% and the Hammersmith Puffin at 28%.
The status of the vehicle signal when pedestrians finish crossing if they started to cross during pedestrian green phase.
At Pelican sites the vehicle signal was predominantly on Red or Amber when the pedestrians finished crossing and at Puffins the signals were mainly red. The light was green to vehicles generally less than 3% of the time, with exceptions for - Holloway pelican 5% - Holloway Puffin 12% - Euston Pelican 6% - Hammersmith Pelican 16%.
Distribution of times that pedestrians start to cross after the start of the pedestrian green phase.
The majority of pedestrians cross within the first few seconds of the crossing having changed to the pedestrian phase; more pedestrians crossed after the pedestrian phase at the pelican crossing than at the puffin crossing.
Proportion of pedestrians who turn back after having started crossing on the green pedestrian phase.
No pedestrians turned back after starting to cross on the green phase at any of the sites.
Proportion of vehicles at head of the queue of stopped traffic moving off before vehicle green phase when there were pedestrians on the crossing.
Few vehicles moved off under a red light while pedestrians were still on the crossing, there were no instances of this behaviour at either of the Holloway sites and the most frequent occurrences of this occurred at the Hammersmith Pelican site where this occurred 4 times. It should be noted that at the Beckenham Puffin site some vehicles moved off before the green light, however no pedestrians were on the crossing at the time.
The distribution and average time between the change from vehicle red/amber to green and when the first vehicle crosses the stop line.
At both types of crossing the vehicle movement times were approximately normally distributed with a right hand tail; the peak occurs 2 seconds after the start of the amber period at the Pelican crossings and on the green light at the Puffin crossings
Proportion of failures of the kerbside and on crossing pedestrian detection.
Very few instances of crossing detector failures were recorded, between 0% and 3% of sampled crossing events.
Proportion of time that pedestrian signal is not visible because of crowds around the nearside signal.
The nearside signal was not obscured by crowds on any occasion.
Proportion of calls which were cancelled because the pedestrian crossed before green pedestrian phase.
Only once did this occur, this was at the Beckenham Puffin site.

TRL Limited 40 PPR239
Published Project Report Version: FINAL
4.5 Comparing Pelican and Puffin Crossings
This section will compare the Pelican and Puffin crossings, giving consideration to the operation, pedestrian behaviour and vehicle driver behaviour found as a result of conducting this study.
Signal Operation
The principal differences between Pelican and Puffin crossings in terms of crossing setup and signal operation are that:
• The Puffin crossing incorporates kerbside and on crossing detectors which should cancel the demand should the pedestrian move away before the start of the pedestrian phase, or extend the pedestrian phase if pedestrians are still on the crossing at the end of the standard crossing time.
• The location of the pedestrian signal is different, with the Puffin crossing having a red/green man indicator positioned above the push button on the upstream signal pole, while the Pelican crossing has a signal demand button mounted on the traffic signal pole which gives a “WAIT” message when pressed by the pedestrian. The Puffin arrangement is designed to encourage the pedestrian to look at the oncoming traffic.
• Rather than having a flashing amber phase shown to vehicles, with a flashing green phase to pedestrians, at a Puffin timing the pedestrian signals are simply red or green, while the vehicle signal passes from red directly to red with amber and then green.
In conducting the study, for the sites surveyed it was also seen that:
• At the studied sites the Pelican crossings generally had shorter vehicle red periods than at the paired Puffin site. This was because the Puffin crossings were set to ‘conservative’ timings, while the flashing amber period at the Pelicans allowed vehicles to move when the crossing was clear.
• On very few occasions did the call cancel functionality of the Puffin operate; from over 500 recorded events the call cancel facility was only activated once, although there were only 8 occasions when the call should have cancelled but did not. If there had been fewer pedestrians, it is possible that the call cancel would have operated more frequently.
• The extension period was frequently employed at some of the sites.
Pedestrian Behaviour
• No significant difference in crossing speeds could be found between any of the site pairs or for Pelican and Puffin crossings on the whole. Older pedestrians and those pedestrians that had some form of mobility impairment (e.g. carrying a heavy bag, pushing a pushchair etc) had significantly lower crossing speeds than those pedestrians that appeared younger or to have no form of impairment.
• At the surveyed Pelican crossings, 28 pedestrians began crossing during the pedestrian clearance period (flashing green man) compared to one pedestrian that crossed during the clearance period at the Puffin crossing. This difference is significant at the 5% level when weighted by the respective crossing frequencies at the Pelican and Puffin crossings.
• At 4 of the 5 surveyed site pairs, Puffin crossings had greater proportions of pedestrians crossing the road without using the signal demand button. However due to variations between the sites caused by local factors, no overall significant differences could be demonstrated between Puffin and Pelican crossings.
TRL Limited 41 PPR239
Published Project Report Version: FINAL
• The crossing behaviours (cycling, running, walking, walking slowly) at the sites were largely the same across Puffin and Pelican crossing pairs. However it was noticed that local factors such as the Mill Hill sites being located near a school and therefore having a high proportion of were having an effect. It was seen that a higher proportion of pedestrians ran across the road at the Mill Hill sites when compared to the other sites.
• At both Puffin and Pelican crossings the majority of pedestrians began crossing within the first two seconds after the pedestrian green light, with the rest following shortly after.
• The pedestrian signal was not obstructed by crowds on any of the sampled crossings events.
Vehicle Driver Behaviour
• When the pedestrians reached the opposite kerb, the vehicle signal was most frequently red at Puffin crossings, while at Pelican crossings the light was most frequently amber.
• The average delay to the first vehicle in the queue was longer at the Puffin crossing than at the respective Pelican crossing. The main reason for this was that vehicles that were able to move away at the Pelican under the flashing amber light once the pedestrians had finished crossing, were held at the Puffin crossing under the red light. This was largely due to the ‘conservative’ settings of the sampled Puffin crossings which used long vehicle red times; had these crossings been set to current recommended times the first vehicle delay would be more equitable.
• The majority of vehicles at the head of a queue moved off on the vehicle green light at Puffin crossings and vehicle amber light at the Pelican crossings. Overall 2% of vehicles moved off on the vehicle red light at Pelican crossings and 3% at Puffin crossings.
• Of the 12 vehicles that moved off under a red light at Pelican crossings, a pedestrian was still on the crossing on 8 occasions. 23 vehicles moved off under a red light at Puffin crossings and on 7 of these occasions pedestrians were still on the crossing. It was not possible to establish if these differences between the crossing types were statistically significant.

TRL Limited 42 PPR239
Published Project Report Version: FINAL
5 Results: Conflict Analysis The following section details some of the vehicle pedestrian interactions observed at the study sites. Two different types of interaction were observed: conflicts and encounters. These classifications were derived from the pedestrian behaviour and exposure to risk study (Ross Silcock, 1998). The numbers of interactions (and of violations of traffic laws by vehicles where no conflict or encounter occurred) recorded at each site is detailed in Table 26. The distinction between the interactions is often a matter of judgement which has been based on the following basic assumptions.
• Conflicts have been defined as occurring when: two traffic participants maintain such course and speed that a sudden evasive manoeuvre of one of the two participants is required to avoid collision.
• Encounters were considered to be events less serious than conflicts. For example, a pedestrian stopping in the carriageway to allow a vehicle to pass.
The video analysis team provided clips from all the potential conflicts observed during the 12 hour video survey, which resulted in up to 15 clips of potential conflicts for each site studied. The lower numbers of clips were from Mill Hill, where the crossing behaviour was generally good. At other locations (e.g. Euston) there were more incidents of poor behaviour (e.g. pedestrians entering the crossing late and vehicles running the amber light) among both the pedestrians and vehicles. At 2 locations, the Holloway Pelican and the Mill Hill Puffin, there were no observed conflicts as the crossings were used correctly.

TRL Limited 43 PPR239
Published Project Report Version: FINAL
Table 26: Vehicle-pedestrian interactions and violations by drivers/cyclists
Site Location No. of Violations by drivers
Description No. of encounters
Description No. of conflicts
Description
Holloway Puffin 0 15 Pedestrians crossing against the lights. Failure to give way to pedestrians.
0
Holloway Pelican 0 0 0
Beckenham Puffin 3 Vehicles moving off before lights change.
4 Cars stopping on crossing due to traffic backing up and pedestrians crossing in traffic.
1 Pedestrian crossing against lights conflicts with M/C.
Beckenham Pelican 3 Red Running. Cycle indiscipline. PSV fails to slow on amber light.
3 Pedestrians cross on vehicle green light using gaps in traffic.
1 Pedestrian makes evasive movement crossing against the lights.
Mill Hill Puffin 0 0 0
Mill Hill Pelican 0 3 Crossing against the red man.
0
Euston Puffin 5 Vehicles running the red light.
1 Pedestrian takes opportunity to cross against the lights.
0
Euston Pelican 0 5 Violation of flashing amber. Platooning.
1 Pedestrian struck by cyclist
Hammersmith Puffin 7 Cyclists running red light.
2 Pedestrians walking in carriageway.
0
Hammersmith Pelican 0 7 Platooning. Crossing against red man.
0
Total: Puffin 15 22 1
Total: Pelican 3 18 2
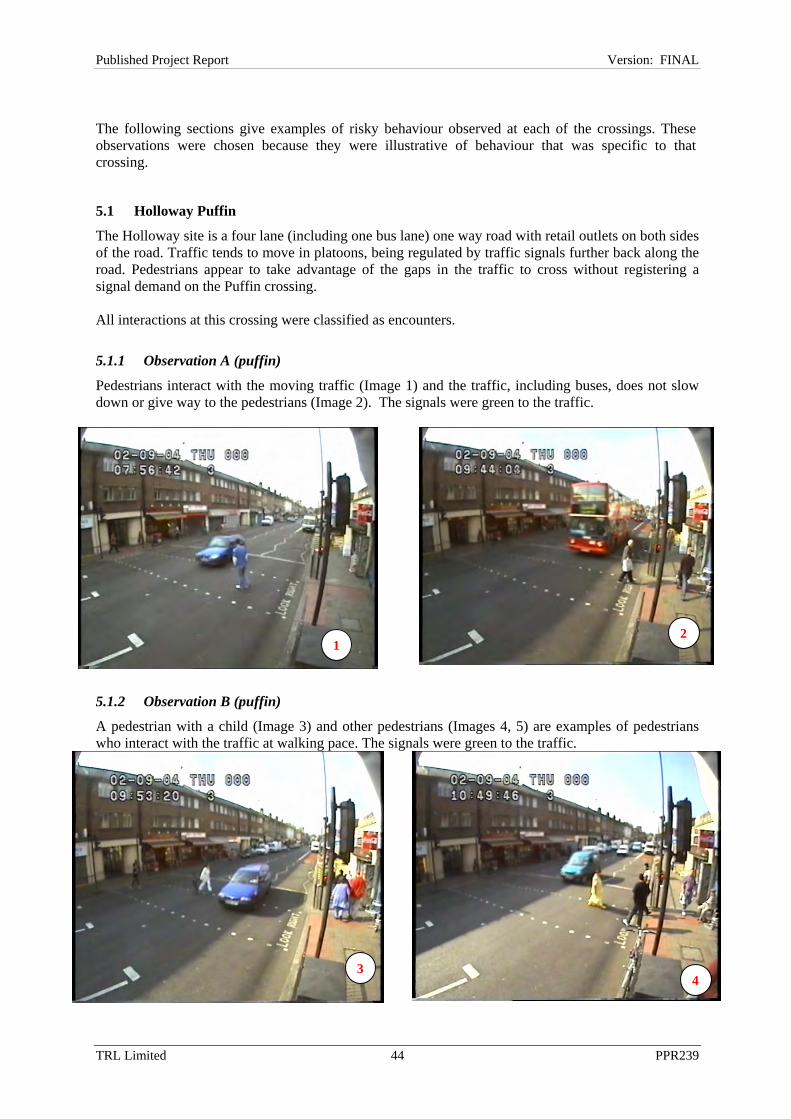
TRL Limited 44 PPR239
Published Project Report Version: FINAL
The following sections give examples of risky behaviour observed at each of the crossings. These observations were chosen because they were illustrative of behaviour that was specific to that crossing.
5.1 Holloway Puffin
The Holloway site is a four lane (including one bus lane) one way road with retail outlets on both sides of the road. Traffic tends to move in platoons, being regulated by traffic signals further back along the road. Pedestrians appear to take advantage of the gaps in the traffic to cross without registering a signal demand on the Puffin crossing. All interactions at this crossing were classified as encounters.
5.1.1 Observation A (puffin)
Pedestrians interact with the moving traffic (Image 1) and the traffic, including buses, does not slow down or give way to the pedestrians (Image 2). The signals were green to the traffic.
5.1.2 Observation B (puffin)
A pedestrian with a child (Image 3) and other pedestrians (Images 4, 5) are examples of pedestrians who interact with the traffic at walking pace. The signals were green to the traffic.
12
34

TRL Limited 45 PPR239
Published Project Report Version: FINAL
5.1.3 Observation C (puffin)
A senior citizen crosses against the lights (Images 6, 7) and is forced to wait in the road for a bus to pass.
5.1.4 Observation D (puffin)
The pedestrian crossing against the lights stops to allow a motorcyclist to pass in front of him (Images 8 to 10).
76
5

TRL Limited 46 PPR239
Published Project Report Version: FINAL
5.1.5 Observation E (puffin)
Following an initial platoon that crosses the road a second platoon begins to cross at the start of the pedestrian red phase. An older pedestrian joins this platoon (Image 11) but is forced to return to the kerb once the traffic lights change and the stationary traffic begins to move off (Images 12, 13). No extension occurs as the crossing is clear before the second platoon begins to cross.
8
10
1211
9
12
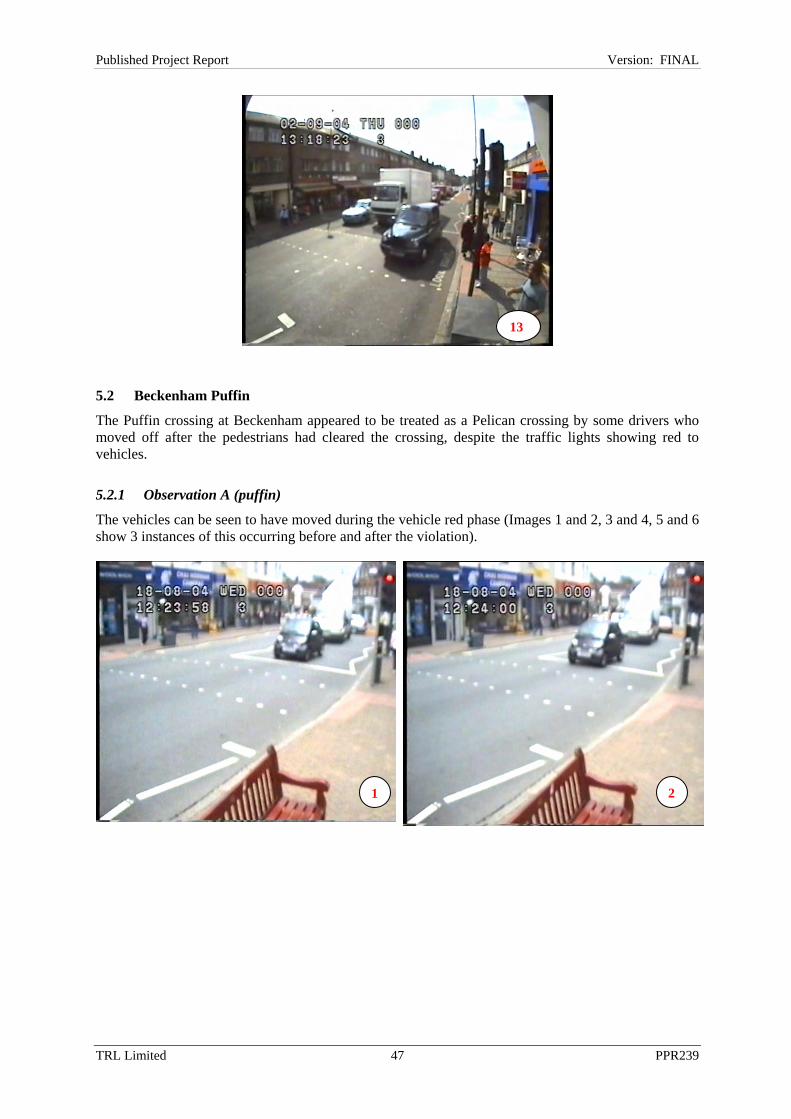
TRL Limited 47 PPR239
Published Project Report Version: FINAL
5.2 Beckenham Puffin
The Puffin crossing at Beckenham appeared to be treated as a Pelican crossing by some drivers who moved off after the pedestrians had cleared the crossing, despite the traffic lights showing red to vehicles.
5.2.1 Observation A (puffin)
The vehicles can be seen to have moved during the vehicle red phase (Images 1 and 2, 3 and 4, 5 and 6 show 3 instances of this occurring before and after the violation).
13
1 2

TRL Limited 48 PPR239
Published Project Report Version: FINAL
5.3 Beckenham Pelican
A characteristic of the behaviours at this location was the willingness of pedestrians and vehicles to cross against the lights (i.e. whilst the lights were on red).
5.3.1 Observation A (pelican)
The bus can be seen to be moving through the crossing on flashing amber (event classified as a violation) while the pedestrians were clearing the crossing (Images 1 and 2).
3
5
4
6

TRL Limited 49 PPR239
Published Project Report Version: FINAL
5.3.2 Observation B (pelican)
A cyclist can be seen approaching the crossing at speed and running the red light (images 3 and 4).
5.3.3 Observation C (pelican)
There was a tendency for pedestrians to create a signal demand (press the WAIT button) and move onto the crossing almost immediately. In many cases the traffic gave way to the pedestrians but not always. In images 5 and 6 below, the pedestrian having made the signal demand to cross, walks onto the crossing on a pedestrian red man signal, sees the vehicle and steps back to the kerb. This event was classified as a conflict.
1 2
3 4
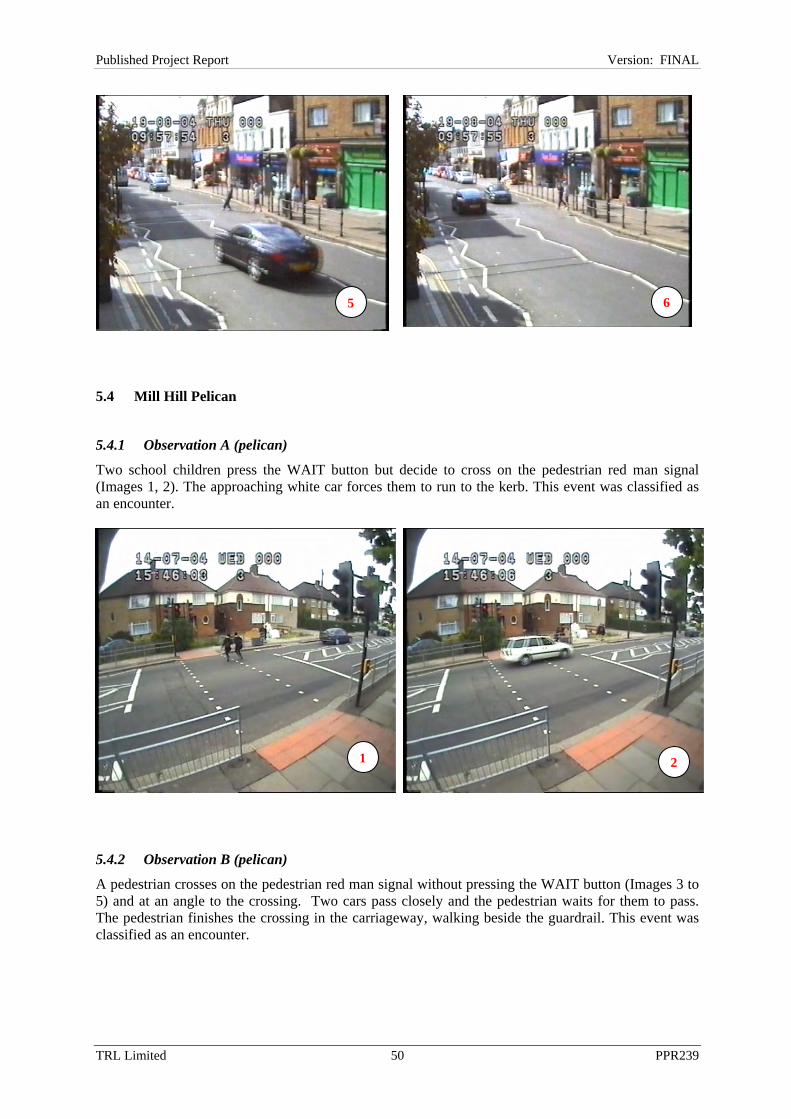
TRL Limited 50 PPR239
Published Project Report Version: FINAL
5.4 Mill Hill Pelican
5.4.1 Observation A (pelican)
Two school children press the WAIT button but decide to cross on the pedestrian red man signal (Images 1, 2). The approaching white car forces them to run to the kerb. This event was classified as an encounter.
5.4.2 Observation B (pelican)
A pedestrian crosses on the pedestrian red man signal without pressing the WAIT button (Images 3 to 5) and at an angle to the crossing. Two cars pass closely and the pedestrian waits for them to pass. The pedestrian finishes the crossing in the carriageway, walking beside the guardrail. This event was classified as an encounter.
5 6
21

TRL Limited 51 PPR239
Published Project Report Version: FINAL
5.5 Euston Road, Pelican
Pedestrians using the Pelican crossing on the Euston road often enter the crossing at an angle which would reduce their ability to see approaching traffic. The installation of guardrail would encourage the pedestrians to enter the crossing squarely with an improved view of approaching traffic. The events at this crossing were classified as encounters with the exception of observation A which was classified as a conflict.
5.5.1 Observation A (pelican)
The following describes a conflict between a pedestrian and a cyclist. The female in white trousers follows a platoon of pedestrians and begins crossing on the flashing amber (Image 1) while a cyclist is approaching in the red bus lane (Image 2).
3 4
5

TRL Limited 52 PPR239
Published Project Report Version: FINAL
The white van makes no attempt to reduce speed even though the pedestrians still have priority on the crossing (Image 3). One pedestrian glances back over her right shoulder and looks at the van (Image 4).
The pedestrian does not appear to have seen the cyclist and steps back towards the kerb (Image 5). The cyclist has made no attempt to reduce speed and collides with the pedestrian (Image 6). The traffic lights are flashing amber.
Flashing amber Female Pedestrian
Cyclist
Flashing amber
Female steps back
1 2
3 4
5 6

TRL Limited 53 PPR239
Published Project Report Version: FINAL
The pedestrian is thrown forward head first into the road and the cyclist appears to strike the kerb before being thrown off of his cycle (Images 7, 8, 9, 10).
The pedestrian recovers after a few seconds but the cyclist appears to have received a more severe injury (Images 11, 12).
5.5.2 Observation B (pelican)
The following sequence of clips (Images 13 to 17) shows a similar pattern of crossing behaviour where the pedestrians platoon onto the crossing during the flashing amber sequence.
7 8
9 10
11 12

TRL Limited 54 PPR239
Published Project Report Version: FINAL
]
5.6 Euston Puffin
5.6.1 Observation A (puffin)
The vehicle flows were relatively low at this location and it is possible that pedestrians took advantage of this to cross on the vehicle green signal without making a pedestrian demand (image 1). This event was classified as an encounter.
13
14 15
16 17
Flashing amber

TRL Limited 55 PPR239
Published Project Report Version: FINAL
5.6.2 Observation B (puffin)
Vehicles did not always obey the signals and in image 2 a bus can be seen running the red light.
5.7 Hammersmith Puffin
5.7.1 Observation A (puffin)
This crossing was characterised by the indiscipline of cyclists, many of whom ran the red light (Images 1 and 2).
1
2

TRL Limited 56 PPR239
Published Project Report Version: FINAL
5.7.2 Observation B (puffin)
Cyclists were also observed cycling against the traffic to the crossing point (Images 3, 4 where the vehicle signals are changing to red and 5 on the vehicle green).
1 2
3 4

TRL Limited 57 PPR239
Published Project Report Version: FINAL
5.7.3 Observation C (puffin)
Pedestrians were also seen to walk along the carriageway in the road (outside of the guard rail) to the crossing point (Image 6). The signals were green to the traffic. These events were classified as encounters.
5.8 Hammersmith Pelican
There were few interactions observed at this location as traffic was prepared to concede right of way to pedestrians as it was often slow moving or queuing. Traffic tended to use the outer of the two lanes, possibly due to vehicles stopping and parking in the first lane. All of the events at this crossing were classified as encounters.
5.8.1 Observation A (pelican)
Image 1 shows a conflict between a pedestrian crossing on the vehicle green signal and the bus not slowing down, causing the pedestrian to run to the central refuge.
5
6
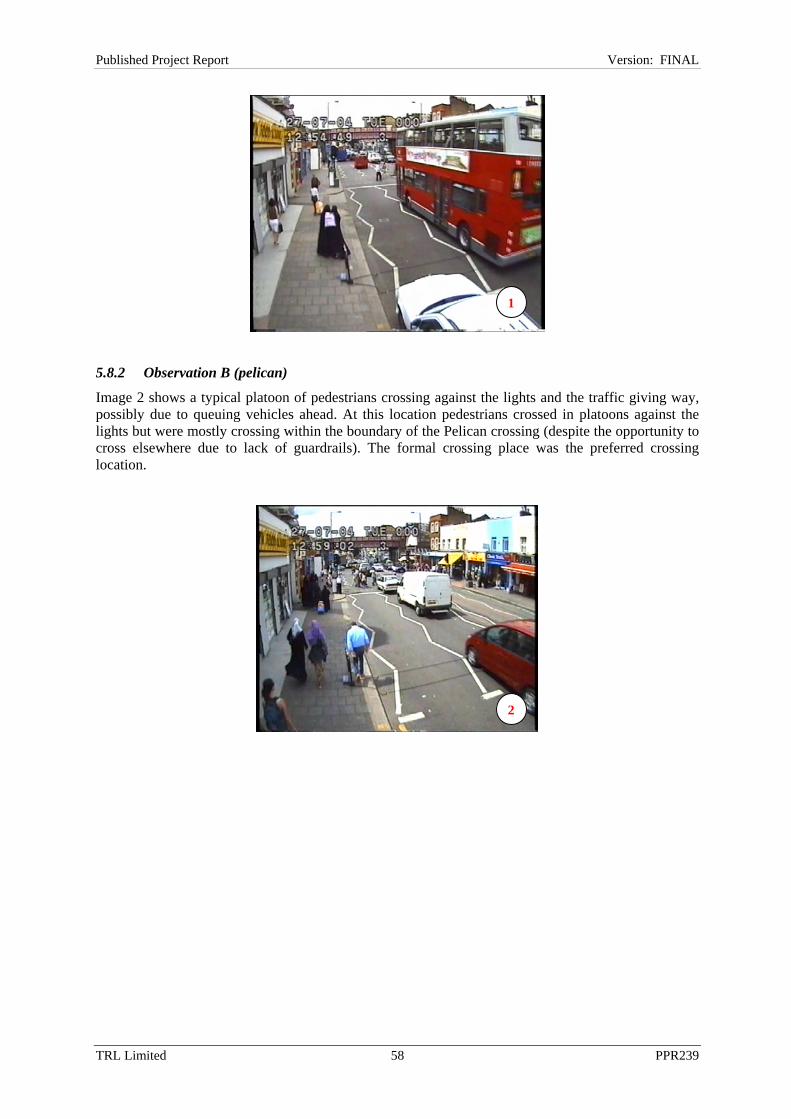
TRL Limited 58 PPR239
Published Project Report Version: FINAL
5.8.2 Observation B (pelican)
Image 2 shows a typical platoon of pedestrians crossing against the lights and the traffic giving way, possibly due to queuing vehicles ahead. At this location pedestrians crossed in platoons against the lights but were mostly crossing within the boundary of the Pelican crossing (despite the opportunity to cross elsewhere due to lack of guardrails). The formal crossing place was the preferred crossing location.
1
2
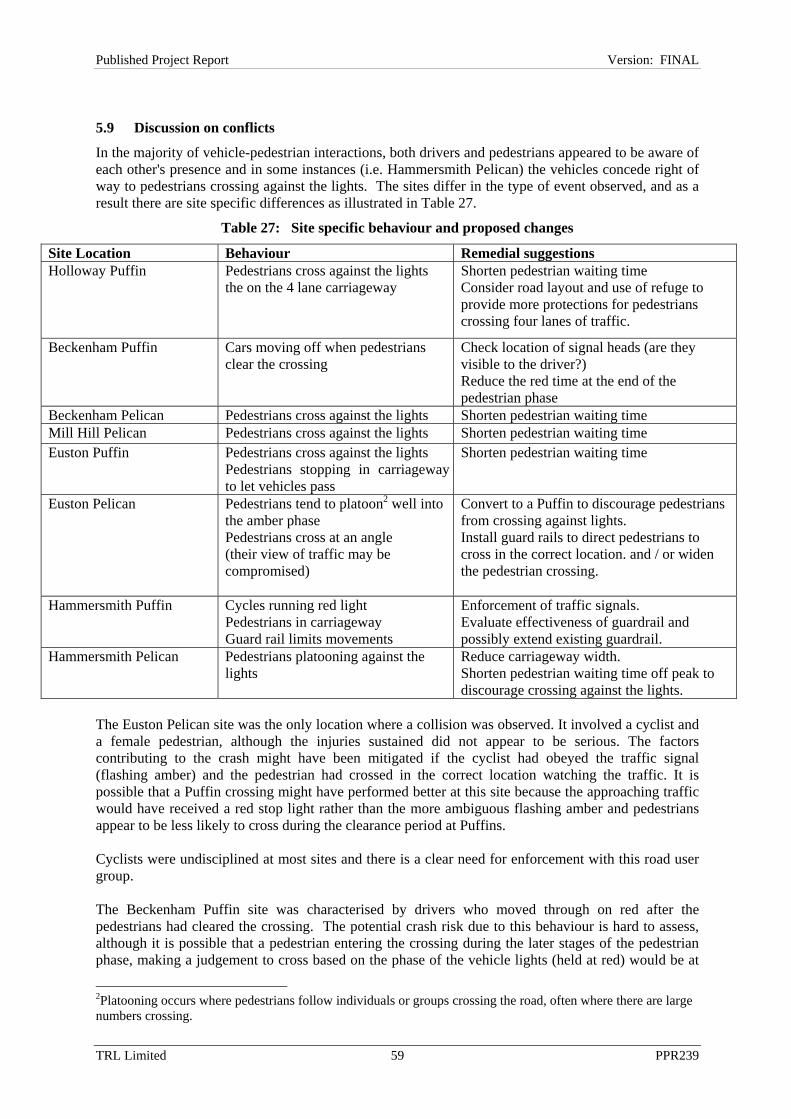
TRL Limited 59 PPR239
Published Project Report Version: FINAL
5.9 Discussion on conflicts
In the majority of vehicle-pedestrian interactions, both drivers and pedestrians appeared to be aware of each other's presence and in some instances (i.e. Hammersmith Pelican) the vehicles concede right of way to pedestrians crossing against the lights. The sites differ in the type of event observed, and as a result there are site specific differences as illustrated in Table 27.
Table 27: Site specific behaviour and proposed changes
Site Location Behaviour Remedial suggestions Holloway Puffin Pedestrians cross against the lights
the on the 4 lane carriageway
Shorten pedestrian waiting time Consider road layout and use of refuge to provide more protections for pedestrians crossing four lanes of traffic.
Beckenham Puffin Cars moving off when pedestrians clear the crossing
Check location of signal heads (are they visible to the driver?) Reduce the red time at the end of the pedestrian phase
Beckenham Pelican Pedestrians cross against the lights Shorten pedestrian waiting time Mill Hill Pelican Pedestrians cross against the lights Shorten pedestrian waiting time Euston Puffin Pedestrians cross against the lights
Pedestrians stopping in carriageway to let vehicles pass
Shorten pedestrian waiting time
Euston Pelican Pedestrians tend to platoon2 well into the amber phase Pedestrians cross at an angle (their view of traffic may be compromised)
Convert to a Puffin to discourage pedestrians from crossing against lights. Install guard rails to direct pedestrians to cross in the correct location. and / or widen the pedestrian crossing.
Hammersmith Puffin Cycles running red light Pedestrians in carriageway Guard rail limits movements
Enforcement of traffic signals. Evaluate effectiveness of guardrail and possibly extend existing guardrail.
Hammersmith Pelican Pedestrians platooning against the lights
Reduce carriageway width. Shorten pedestrian waiting time off peak to discourage crossing against the lights.
The Euston Pelican site was the only location where a collision was observed. It involved a cyclist and a female pedestrian, although the injuries sustained did not appear to be serious. The factors contributing to the crash might have been mitigated if the cyclist had obeyed the traffic signal (flashing amber) and the pedestrian had crossed in the correct location watching the traffic. It is possible that a Puffin crossing might have performed better at this site because the approaching traffic would have received a red stop light rather than the more ambiguous flashing amber and pedestrians appear to be less likely to cross during the clearance period at Puffins. Cyclists were undisciplined at most sites and there is a clear need for enforcement with this road user group. The Beckenham Puffin site was characterised by drivers who moved through on red after the pedestrians had cleared the crossing. The potential crash risk due to this behaviour is hard to assess, although it is possible that a pedestrian entering the crossing during the later stages of the pedestrian phase, making a judgement to cross based on the phase of the vehicle lights (held at red) would be at
2Platooning occurs where pedestrians follow individuals or groups crossing the road, often where there are large numbers crossing.
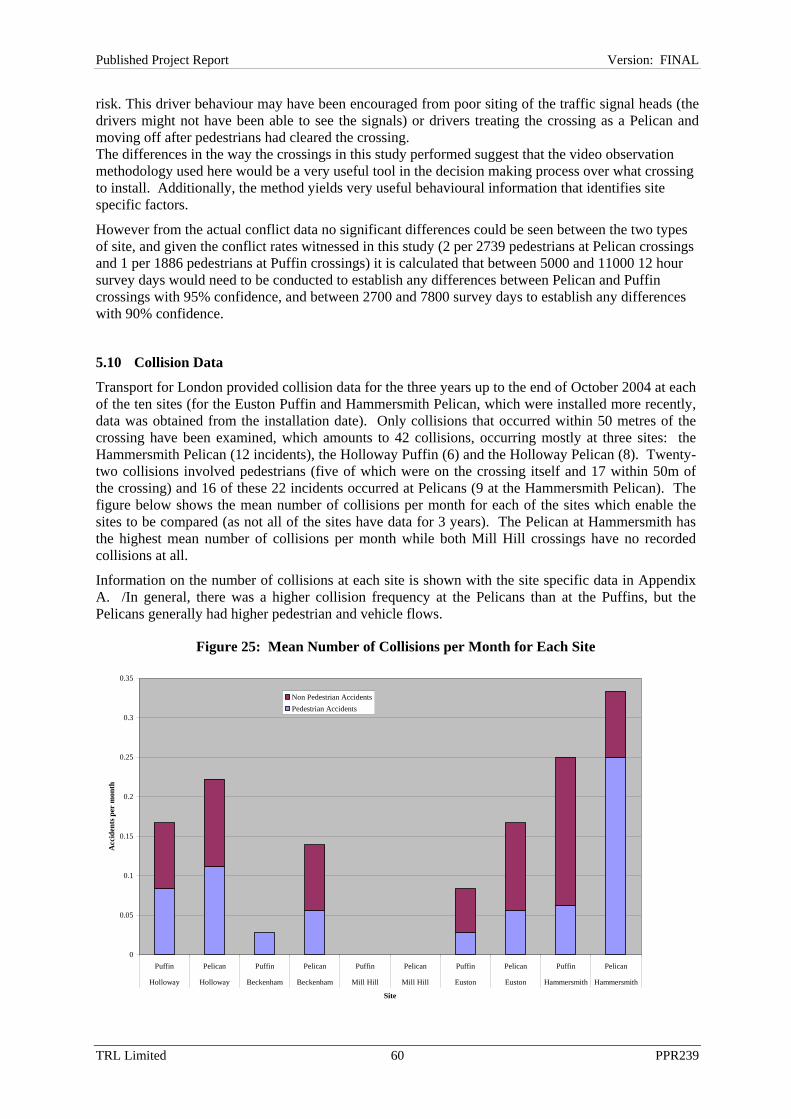
TRL Limited 60 PPR239
Published Project Report Version: FINAL
risk. This driver behaviour may have been encouraged from poor siting of the traffic signal heads (the drivers might not have been able to see the signals) or drivers treating the crossing as a Pelican and moving off after pedestrians had cleared the crossing. The differences in the way the crossings in this study performed suggest that the video observation methodology used here would be a very useful tool in the decision making process over what crossing to install. Additionally, the method yields very useful behavioural information that identifies site specific factors.
However from the actual conflict data no significant differences could be seen between the two types of site, and given the conflict rates witnessed in this study (2 per 2739 pedestrians at Pelican crossings and 1 per 1886 pedestrians at Puffin crossings) it is calculated that between 5000 and 11000 12 hour survey days would need to be conducted to establish any differences between Pelican and Puffin crossings with 95% confidence, and between 2700 and 7800 survey days to establish any differences with 90% confidence.
5.10 Collision Data
Transport for London provided collision data for the three years up to the end of October 2004 at each of the ten sites (for the Euston Puffin and Hammersmith Pelican, which were installed more recently, data was obtained from the installation date). Only collisions that occurred within 50 metres of the crossing have been examined, which amounts to 42 collisions, occurring mostly at three sites: the Hammersmith Pelican (12 incidents), the Holloway Puffin (6) and the Holloway Pelican (8). Twenty-two collisions involved pedestrians (five of which were on the crossing itself and 17 within 50m of the crossing) and 16 of these 22 incidents occurred at Pelicans (9 at the Hammersmith Pelican). The figure below shows the mean number of collisions per month for each of the sites which enable the sites to be compared (as not all of the sites have data for 3 years). The Pelican at Hammersmith has the highest mean number of collisions per month while both Mill Hill crossings have no recorded collisions at all.
Information on the number of collisions at each site is shown with the site specific data in Appendix A. /In general, there was a higher collision frequency at the Pelicans than at the Puffins, but the Pelicans generally had higher pedestrian and vehicle flows.
Figure 25: Mean Number of Collisions per Month for Each Site
0
0.05
0.1
0.15
0.2
0.25
0.3
0.35
Puffin Pelican Puffin Pelican Puffin Pelican Puffin Pelican Puffin Pelican
Holloway Holloway Beckenham Beckenham Mill Hill Mill Hill Euston Euston Hammersmith Hammersmith
Site
Acc
iden
ts p
er m
onth
Non Pedestrian AccidentsPedestrian Accidents

TRL Limited 61 PPR239
Published Project Report Version: FINAL
6 Conclusions and discussion
6.1 Conclusions
The results of the study were affected by the following:
• Despite the considerable efforts made to match sites by type of road, land use and vehicle flow, there remained differences in the pedestrian flow (at two of the pairs), the types of user and the signal timings at the paired crossings.
• The timings of the Puffin crossings were set very conservatively and were in some instances delaying traffic by up to 7 seconds longer than necessary if current guidelines for Puffin design were followed.
• Problems such as automatic demand cycling where the pedestrian demand was generated without pedestrian intervention and faulty crossing detectors were observed with 4 of the Puffin crossings. These faults have the effect of altering the operation of the crossing and may have affected the pedestrian and vehicle behaviours observed in this study.
Three specific research questions were addressed:.
1. What types of traffic conflict occur at Puffin crossings and with what frequency?
In total only 38 incidents were recorded at the five Puffin crossings (representing 60 hours of data) that were identified as risk taking behaviour by pedestrians or worse, of these events only 1 was considered to be a conflict. The events were largely site dependent with different behaviours at each site, with for example the Beckenham Puffin suffering from large numbers of vehicles pulling away early from the traffic lights, while the Euston Puffin saw a large numbers of pedestrians crossing against the vehicle green light.
2. Does the nature and frequency of these conflicts at Puffin crossings differ from those at Pelican crossing facilities?
While slightly more events that were judged to be conflicts or interactions were seen at the Puffin sites than at the Pelican sites (23 compared to 20), there were too few conflicts overall to draw conclusions. Differences may be due to local factors.
3. Are other crossing behaviours observed which do not result in conflicts but which might have implications for safety of road users at crossing sites?
The risk taking behaviours and interactions represent potentially dangerous situations that did not develop into a conflict. More of these events were seen at the Puffin sites, however it is difficult to judge whether one crossing behaviour is much more dangerous than another. Site specific details regarding specific dangers at each of the sites and potential remedial solutions have been detailed within the report.
The study also found that pedestrians appeared to be significantly more likely to begin crossing on a flashing green man at the Pelicans, compared to the red extension period at the Puffins studied, and longer waiting times for pedestrians led to more pedestrians crossing against the lights. Large numbers of pedestrians crossed without using the signal demand button. At both types of crossing, there were many instances where cyclists ignored the red light. These are dealt with in more detail, in the main findings below.
Other findings were as follows:
The extensions at the observed Puffins resulted in longer waiting times for the first vehicles that were stopped at a red light than at the matched Pelicans.

TRL Limited 62 PPR239
Published Project Report Version: FINAL
Pelicans have a fixed green period followed by flashing amber to vehicles which allows vehicles to move off as soon as the crossing is clear of pedestrians. In the surveyed Pelicans, the first vehicle was able to move off during this period in a high percentage of cases. It was also the case that the extension period was frequently activated at the Puffins. These two facts combined to increase delay at the Puffins compared to the Pelicans, FOR VEHICLES AT THE HEAD OF THE QUEUE. This does not necessarily indicate that overall delay to vehicles was increased as the number of times the pedestrian phase is called was highly variable between pairs. On average, the combined red and flashing amber period at the Pelicans were longer than the steady red at the related Puffins, so that the main difference between the crossing types was that in the absence of pedestrians, vehicles could move off earlier at Pelicans. Interestingly, at one Puffin location it appeared that drivers were using the fact that pedestrians had cleared the crossing as a cue to move off rather than observing the traffic signals, which resulted in vehicles running a red light. However it was noted the timings at the Puffin sites were very conservative and it is thought that if the current recommended timings were used this discrepancy in the vehicle waiting times could be reduced. The call cancel facility appeared to be rarely used at the Puffins studied during the period of observation. From over 500 recorded events, the call cancel facility was activated only once. There were reported problems with the call cancel facility at each of the crossings; however, the analysis suggests that there were only 8 occasions where the call should have been cancelled but did not. The low number of calls cancelling and the occasions where call cancelling should have occurred but did not may have been affected by the difficulty in making the observations due to the high levels of pedestrians in the survey. It is possible that the pedestrians on the crossing or on the pavement in the detection area were detected before the call cancelling should begin, causing a lighting cycle to complete. Pedestrians were significantly more likely to begin crossing on a flashing green man at Pelicans, compared to the red extension period at Puffins. Twenty-eight pedestrians (1% of the sample) did this at Pelican crossings compared to only one (0.1% of the sample) at a Puffin crossing. This suggests that pedestrians were more cautious having been shown a steady red man signal than a flashing green man signal. However, it cannot be said that it is any more dangerous to cross during the flashing green man on a Pelican, because too few conflicts were observed in the study. It is interesting to note, however, that the crash observed at the Euston Pelican occurred during the flashing green man/flashing amber to vehicle phase and it is possible that the incident may not have occurred had the pedestrian been shown a red man, or the vehicle had been shown a red light (i.e. the light sequence at a Puffin). It is possible that if pedestrians were better educated in the features of Puffin crossings then this behaviour may change. The result of this could be more pedestrians crossing during a light sequence with greater numbers crossing during the red man when most conflicts were expected to occur. There may be further safety implications if the on crossing detectors malfunction. There may also be a longer vehicle red period and hence further increased delay for vehicles, this may however be offset by fewer button presses. Longer waiting times for pedestrians led to more pedestrians crossing against the lights. Where waiting times for pedestrians after pressing the demand button were higher, namely at the sites under UTC, pedestrians were significantly more likely to cross during the red man phase. There is some evidence from various authors e.g. Baass (1989) and Wall (2000), as well as the present study, that the longer pedestrians have to wait at a crossing, the more likely they are to cross against the signal. In a Canadian paper reviewing practice in Europe and North America, Baass reported that if the waiting time is longer than 40 seconds, the number of pedestrians crossing against the signal increases significantly. However, different laws and cultures might mean this does not apply to the UK. Some authors e.g. Garder (1989) have found no link between average delay to pedestrians and non-compliance with signals. It was widely asserted in the 1960s that 30 seconds was the longest that

TRL Limited 63 PPR239
Published Project Report Version: FINAL
pedestrians would wait, but the basis for this assertion is not known and even if correct then, it is by no means clear that the same would be true now. It is also the case that there may be more opportunities to cross during vehicle green time when there is a long cycle time, particularly where there is a UTC system with well-defined platoons of vehicles (cf Reading et al, 1995). Large numbers of pedestrians crossed without using the signal demand button. Up to 49% of pedestrians crossed without using the signal demand button; this behaviour was more prevalent at the UTC sites, which had long waiting times for pedestrians, and at the Euston site where it is expected that a large proportion of the pedestrians were commuters. At both types of crossing, there were many instances where cyclists ignored the red light. The cyclist involved in the crash at the Pelican crossing (Euston Road) was approaching the crossing during a flashing green man/flashing amber phase, but it is not clear whether a Puffin would have been safer and the crash avoided if a Puffin had been installed. As mentioned above, implementing guard rails may also have prevented the collision. The major hazard to pedestrians observed in this study was due to the indiscipline of pedal cyclists. Serious consideration should be given to an enforcement programme that would subject this user group to the same rules of the road as other users. Difference between the observed Puffins and Pelicans could often be explained by local factors. The video data suggests that the pedestrian and driver behaviour at Pelican and Puffin crossings is highly dependent on their location and the signal strategy adopted. School crossing behaviour was different from commuter behaviour at the railway station, and high street shoppers behaved differently if they were in groups rather than individuals. There was insufficient evidence to determine whether Puffins were safer than Pelicans. There were very few recorded collisions on, or within 50m of, the crossings in the study and also very few observed conflicts. Thus it was not possible to establish whether or not Puffins were safer overall than Pelicans.
6.2 Discussion
The Puffin crossing was designed as an improvement on the Pelican crossing, offering both advantages to the pedestrian and the driver in terms of an extension period for pedestrians, a facility to cancel a pedestrian demand, the removal of the flashing amber/flashing green man period and the introduction of a nearside pedestrian indicator upstream of the crossing.
There was insufficient evidence from this study to determine whether Puffins were safer than Pelicans, as the numbers of accidents and observed pedestrian conflicts or encounters were low. One of the principal advantages of the Puffin crossing was expected to be the cancelling of unnecessary pedestrian demand and consequent reduction in delay to vehicles. In the crossings observed in this study, the call cancel feature was seldom brought into operation. On average, vehicles in this study that were stopped by the signals had to wait longer at the Puffins than at the Pelicans because the extension periods at the Puffins were frequently activated and drivers at Pelicans were often able to move off during the flashing amber period.
This study concentrated on detailed analysis of the timing of pedestrian movements at each crossing. The conflict analysis enabled each crossing to be audited for safe or risky behaviour. Behaviour was dependent on the operation of the crossing (functioning correctly), the type of user and the location. A larger sample, or a longer period of observation, would have allowed the examination of a larger number of conflicts between pedestrians and vehicles.

TRL Limited 64 PPR239
Published Project Report Version: FINAL
7 Recommendations Because of the difficulties in finding sites that were matched in all respects, before and after studies would probably have provided a better comparison, recording data at a Pelican before it is converted to a Puffin. The comparison would also have been better if the chosen Puffins had followed current advice in terms of timings. It was not possible to include Pelican/Puffin conversions as part of this study because none were planned within the relevant timescale. It is essential in this type of study that crossings are functioning correctly, with appropriate timings and this should to be confirmed at the start of any future work. The type of signal control, i.e. whether Vehicle Activated or UTC, should be the same if paired crossings are used.
A number of issues have arisen from this study that would be useful to consider in the future. The following areas are highlighted for further evaluation:
1. Further examination of the potential risk in crossing on the flashing amber phase of the Pelican signals compared with the clearance phase on the Puffin crossing.
2. An in-depth examination of the delay and safety implications from malfunctioning Puffin crossings.
3. The effect of waiting times on pedestrian behaviour at signal controlled crossings.
4. An in-depth evaluation of vehicle delays at Puffins compared with Pelicans.
5. A reassessment of the signal timings applied at the studied Puffin sites with the possibility of adopting strategies similar to those outlined in TAL 1/01.
7.1 Pedestrian Attitude Survey
The research described in this report could be expanded upon by implementing a pedestrian attitude survey. The following lists areas that should be considered in an attitude survey should it be undertaken:
• Pedestrian knowledge and understanding of the different types of crossing (Puffin and Pelican);
• Perceived safety at the different crossing types (perhaps by asking them about specific crossings);
• Perceived delays at the different crossing types;
• Preference for crossing at different crossing types;
• Perceived attitude of drivers at different crossing types;
• Fear of traffic;
• Willingness to take risks (and frequency);
• Willingness to misuse the crossing (and frequency);
• How guardrails affect crossing behaviour.
In a before and after survey, it is important to consider the timing of the surveys, particularly with regards to the after survey. The time between the installation of the Puffin and conducting the after survey is dependent on whether long term or short term effects are expected. In this case, the effects are likely to be noticeable in the short term and there is a risk that left too long, pedestrians may have forgotten what it was like to cross with the Pelican crossing. It is therefore recommended that the after survey is conducted no later than 2 months after the installation of the Puffin.
TRL Limited 65 PPR239
Published Project Report Version: FINAL
Acknowledgements The work described in this report was carried out in the Safety Group of TRL Limited. The authors are grateful to Janet Kennedy who carried out the quality review and auditing of this report, Nina Webster (Transport for London) for her support and contribution throughout the project, and to TfL Data Management Team, Modernisation team, North Central Area Team, Traffic Signals section Fault Control team, Serco Group Plc and Traffic Signals UK Ltd. Thanks also to representatives of Barnet, Bromley, Camden, Hammersmith and Fulham, and Islington Borough Councils. Also thanks to Mark Crabtree of TRL, Ian Routledge of Ian Routledge Consultancy and Suku Phull of the DfT for their input.
TRL Limited 66 PPR239
Published Project Report Version: FINAL
References Baass K G (1989). Review of European and North American practice of pedestrian signal timing. Prepared for RTAC Annual Conference Calgary, Alberta.
Garder P (1989). Pedestrian safety at traffic signals: a study carried out with the help of a traffic conflicts technique. Accident Analysis and Prevention. Vol 20, No. 5, pp435-444.
Highways Agency (2001). TR2210 issue A: Specifications for microprocessor-based traffic signal controller. Traffic Control Systems and Lighting Team Specification, Highways Agency, Bristol.
Reading I A D, Dickinson K & D J Barker (1995). The Puffin pedestrian crossing: pedestrian-behavioural study. Traffic Engineering & Control, 472-478.
Ross Silcock (1998). Pedestrian Behaviour and Exposure to Risk: Final Report. Ross Silcock: London.
TAL 1/01 (2001). Puffin Pedestrian Crossing. DETR.
TAL 22/01 (2001). Specification for Traffic Signal Controller. DTLR.
Wall G T (2000). Road markings to improve pedestrian safety at crossings. Traffic Engineering and Control pp136-140
TRL Limited 67 PPR239
Published Project Report Version: FINAL
Appendix A: Site Information

TRL Limited 68 PPR239
Published Project Report Version: FINAL
LOCATION: HOLLOWAY Puffin Crossing (03/122):
The crossing appeared to be fully functional and covered four lanes (one direction) of traffic, including a bus lane. There was high pedestrian usage and the crossing was often used by groups of pedestrians (as distinct from individuals).
Pelican Crossing (03/010):
This was situated about 200 metres upstream from the Puffin crossing with a similar road layout and usage.
Additional Information:
• Single Carriageway
• High Street/Shopping
• Puffin installed 2 years+
Table A1: Accident Data: Holloway, 36months to October 2004
3 Year Total
No. of Fatal
No. of Serious
No. of Slight
No. Involving
Pedestrians
No. of pedestrian incidents
occurring on the Crossing
Puffin 6 0 0 6 3 1
Pelican 8 0 0 8 4 0
Comments:
The crossings were well matched in terms of traffic volume as they share the same link. There is a high level of pedestrian activity from a multi-ethnic population. Cycle timing information can be found in Tables B1 and B2 in Appendix B.
A
PuffinPelican
A
PuffinPelican

TRL Limited 69 PPR239
Published Project Report Version: FINAL
SCALE SITE DIAGRAM: HOLLOWAY PELICAN
SITE DETAIL DIAGRAM: HOLLOWAY PELICAN (not to scale)

TRL Limited 70 PPR239
Published Project Report Version: FINAL
SCALE SITE DIAGRAM: HOLLOWAY PUFFIN
SITE DETAIL DIAGRAM: HOLLOWAY PUFFIN (not to scale)

TRL Limited 71 PPR239
Published Project Report Version: FINAL
LOCATION: BECKENHAM
Puffin Crossing (19/118):
The crossing appeared to be fully functional and covered two lanes (bi-directional flow) of traffic. There was moderate crossing usage in a busy high street environment.
Pelican Crossing (19/067):
This crossing was not heavily used and there was no shop frontage in the vicinity.
Additional Information:
• Single Carriageway
• Shops
• Puffin installed 2 years+
Table A2: Accident Data: Beckenham, 36months to October 2004
3 Year Total
No. of Fatal
No. of Serious
No. of Slight
No. Involving
Pedestrians
No. of pedestrian incidents
occurring on the Crossing
Puffin 1 0 0 1 1 0
Pelican 5 0 0 5 2 2
. Cycle timing information can be found in Tables B1 and B2 in Appendix B.
B
Puffin
B
Puffin Pelican

TRL Limited 72 PPR239
Published Project Report Version: FINAL
SCALE SITE DIAGRAM: BECKENHAM PELICAN
SITE DETAIL DIAGRAM: BECKENHAM PELICAN (not to scale)

TRL Limited 73 PPR239
Published Project Report Version: FINAL
SCALE SITE DIAGRAM: BECKENHAM PUFFIN
SITE DETAIL DIAGRAM: BECKENHAM PUFFIN (not to scale)

TRL Limited 74 PPR239
Published Project Report Version: FINAL
LOCATION: MILL HILL Puffin Crossing (30/156):
The crossing appeared to be fully functional and covered two lanes (bi-directional flow) of traffic. Usage was mainly confined to school arrival and departure times with after school clubs extending usage in the afternoon.
Pelican Crossing (30/205):
The location shown is the second site chosen, since the first site data collection was confounded by the additional factor of a Lollipop person directing traffic. The site shown in the picture had moderate traffic flows and its situation at the school was considered similar to the Puffin crossing.
Additional Information:
• School sites
• Puffin installed 2years+
Table A3: Accident Data: Mill Hill, 36months to October 2004
3 Year Total
No. of Fatal
No. of Serious
No. of Slight
No. Involving
Pedestrians
No. of pedestrian incidents
occurring on the Crossing
Puffin 0
Pelican 0
Comments:
The crossings were reasonably matched but on different links. Cycle timing information can be found in Tables B1 and B2 in Appendix B.
C
PuffinPelican
C
PuffinPelican
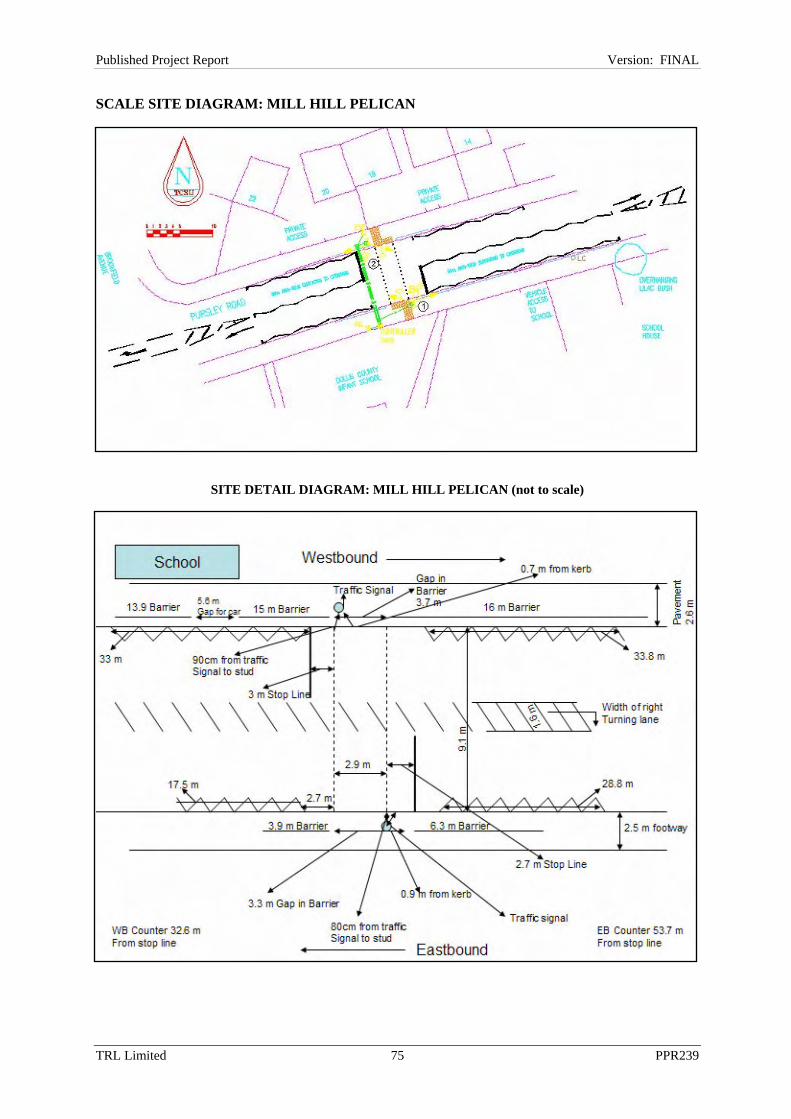
TRL Limited 75 PPR239
Published Project Report Version: FINAL
SCALE SITE DIAGRAM: MILL HILL PELICAN
SITE DETAIL DIAGRAM: MILL HILL PELICAN (not to scale)
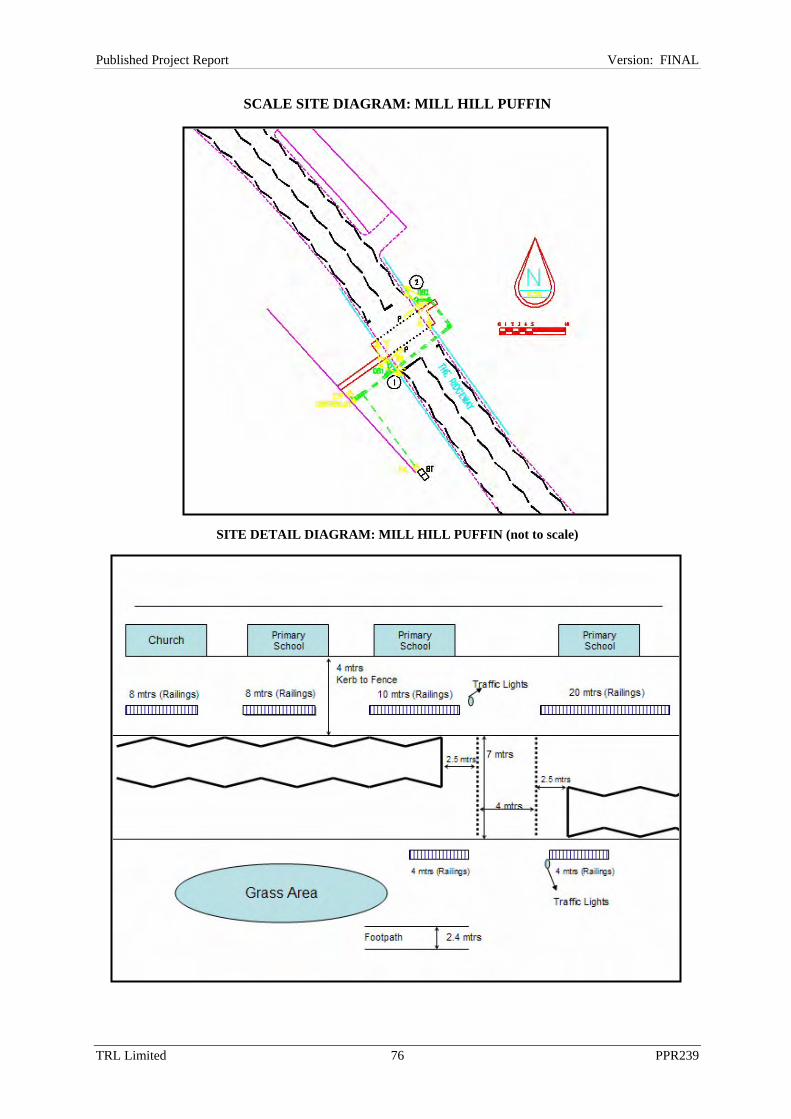
TRL Limited 76 PPR239
Published Project Report Version: FINAL
SCALE SITE DIAGRAM: MILL HILL PUFFIN
SITE DETAIL DIAGRAM: MILL HILL PUFFIN (not to scale)

TRL Limited 77 PPR239
Published Project Report Version: FINAL
LOCATION: EUSTON Puffin Crossing (02/236):
The crossing was fully functional. There was moderate pedestrian activity at the time of the site visit at the location which was close to the entrance of a college.
Pelican Crossing (02/178):
This location appeared to have higher pedestrian usage than the Puffin crossing being situated closer to the station.
Additional Information:
• Station on link
• Single carriageway
• Puffin installed 2years+
Table A4: Accident Data: Euston Collision data to end Oct 2004
Total No. of Fatal
No. of Serious
No. of Slight
No. Involving
Pedestrians
No. of pedestrian incidents
occurring on the Crossing
Puffin (36 months) 3 0 1 2 1 0
Pelican (18 months since installation) 3 0 0 3 1 0
Comments:
The crossings were reasonably well matched, being on the same link.
E
PuffinPelican
E
PuffinPelican
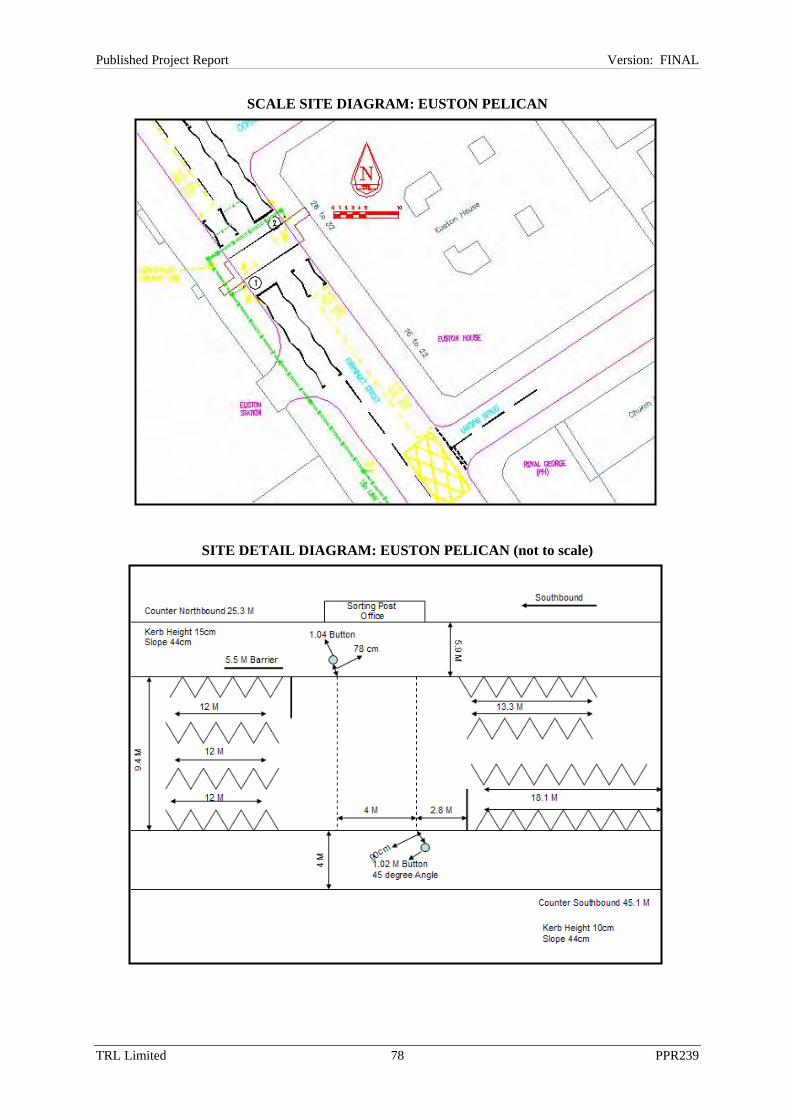
TRL Limited 78 PPR239
Published Project Report Version: FINAL
SCALE SITE DIAGRAM: EUSTON PELICAN
SITE DETAIL DIAGRAM: EUSTON PELICAN (not to scale)

TRL Limited 79 PPR239
Published Project Report Version: FINAL
SCALE SITE DIAGRAM: EUSTON PUFFIN
SITE DETAIL DIAGRAM: EUSTON PUFFIN (not to scale)

TRL Limited 80 PPR239
Published Project Report Version: FINAL
LOCATION: HAMMERSMITH
Puffin Crossing (11/151):
The crossing covered a dual carriageway with a central refuge. In addition to the normal controls, a median signal demand button had been installed.
Pelican Crossing (11/051):
This location covered a dual carriageway with a median signal demand button. There was higher pedestrian usage than at the Puffin due to the local market and station.
Additional Information:
• Station on link
• Shops at Pelican none at Puffin
• Median signal demand
• Dual carriageway
• Puffin installed 1- 2 years
Table A5: Accident Data: Hammersmith Collision Data to end Oct 2004
Total No. of Fatal
No. of Serious
No. of Slight
No. Involving
Pedestrians
No. of pedestrian incidents
occurring on the Crossing
Puffin (16 months since installation) 4 0 0 4 1 0
Pelican (36 months) 12 1 2 9 9 2
Comments:
The crossings were reasonably well matched in terms of traffic on the same link.
Cycle timing information can be found in Tables B1 and B2 in Appendix B.
F
Puffin Pelican
F
Puffin Pelican

TRL Limited 81 PPR239
Published Project Report Version: FINAL
SCALE SITE DIAGRAM: HAMMERSMITH PELICAN
SITE DETAIL DIAGRAM: HAMMERSMITH PELICAN (not to scale)

TRL Limited 82 PPR239
Published Project Report Version: FINAL
SCALE SITE DIAGRAM: HAMMERSMITH PUFFIN
SITE DETAIL DIAGRAM: HAMMERSMITH PUFFIN (not to scale)
TRL Limited 83 PPR239
Published Project Report Version: FINAL
Appendix B: Site Statistics

TRL Limited 84 PPR239
Published Project Report Version: FINAL
Table B1: Pelican Period Times (Min/Max) (Periods as per LTN 2/95)
Period To Pedestrians To Vehicles Holloway Beckenham Mill Hill Euston HammersmithA Red Standing Figure Steady Green 7/30 (WAIT) (Proceed if clear) (VA Max)* 7/20 7/30 7/20 10/20 B Red Standing Figure Steady Amber (stop if safe) 3 3 3 3 3 C Red Standing Figure Steady Red (Wait at stop line) 2/3 2/3 3 2 1
D Green Walking Figure Steady Red
+ audible signal 8 7 7 7 9
E Flashing Green Figure Steady Red
(do not start to cross) 2 0 0 0 0
F Flashing Green Figure Flashing Amber
(Give way to peds) 9 8 10 9 11
G Red Standing Figure Flashing Amber 2 1 2 1 2
*VA MAX will not apply while SCOOT is in operation
Table B2: Puffin Period Times (Min/Max) (Periods as per TAL 1/01 and TR2210)
Period To Pedestrians To Vehicles Holloway Beckenham Mill Hill Euston Hammersmith1 Red Standing Figure Steady Green 7/20 7/20 (WAIT) (Proceed if clear) (VA Max)* 7/20 7/20 15/30 (VA Max)* 2 Red Standing Figure Steady Amber (stop if safe) 3 3 3 3 3 3 Red Standing Figure Steady Red (Wait at stop line) 2 3/1 3 3 3
4 Green Walking Figure Steady Red
+ audible signal 6 6 6 8 5 5 Red Standing Figure Steady Red (do not start to cross) 5 3 3 1 3 6 Red Standing Figure Steady Red 0/18 0/8 0/9 0/12 0/20 7 Red Standing Figure Steady Red 3 2 3 3 3 8 Red Standing Figure Steady Red 3 4 0 0 0 9 Red Standing Figure Red with Amber (stop) 2 2 2 2 2
*VA MAX will not apply while SCOOT is in operation

TRL Limited 85 PPR239
Published Project Report Version: FINAL
Table B3: Minimum and Maximum effective red times to vehicles Puffin Pelican
Maximum
time effectively red
Minimum time effectively red
Min if current
advice used
Maximum time
effectively red
Minimum time effectively red
Holloway 34 16 9 24 12 Beckenham 21 13 9 19 9 Mill Hill 24 12 9 22 10 Euston 27 13 11 19 9 Hammersmith 34 11 8 23 10
Table B4: Sample sizes
Location Type
Total button pressing events
Total non-button pressing
pedestrians
Total pedestrians
Recorded button
pressing events
Recorded non-
button pressing events
Recorded pedestrians
Holloway Pelican 443 648 2892 112 19 654 Puffin 349 1289 2626 86 25 455
Beckenham Pelican 889 121 3464 129 19 436 Puffin 555 205 2117 157 16 557
Mill Hill Pelican 132 8 409 104 8 384 Puffin 97 19 439 97 19 439
Euston Pelican 766 849 3315 109 25 373 Puffin 229 207 570 106 20 224
Hammersmith Pelican 427 1323 4528 103 20 892 Puffin 472 200 1129 103 13 211
All Pelican 2657 2949 14608 557 91 2739 Puffin 1702 1920 6881 549 93 1886
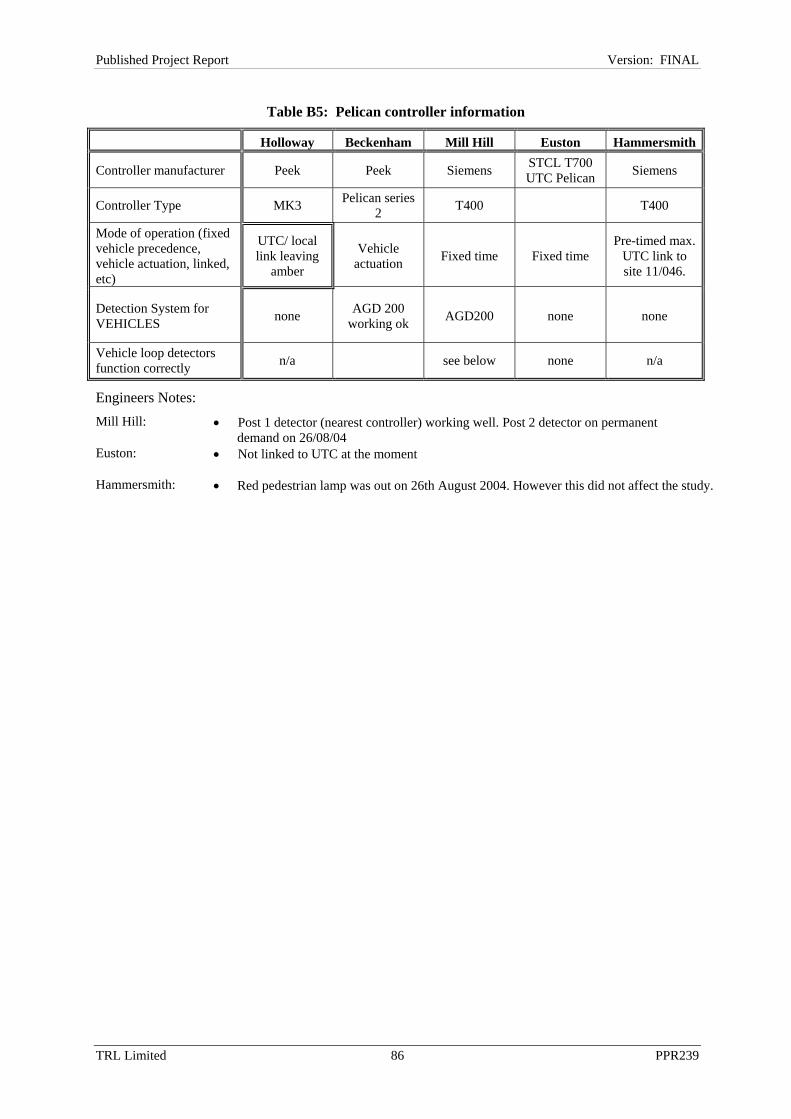
TRL Limited 86 PPR239
Published Project Report Version: FINAL
Table B5: Pelican controller information
Holloway Beckenham Mill Hill Euston Hammersmith
Controller manufacturer Peek Peek Siemens STCL T700 UTC Pelican Siemens
Controller Type MK3 Pelican series 2 T400 T400
Mode of operation (fixed vehicle precedence, vehicle actuation, linked, etc)
UTC/ local link leaving
amber
Vehicle actuation Fixed time Fixed time
Pre-timed max. UTC link to site 11/046.
Detection System for VEHICLES none AGD 200
working ok AGD200 none none
Vehicle loop detectors function correctly n/a see below none n/a
Engineers Notes: Mill Hill: • Post 1 detector (nearest controller) working well. Post 2 detector on permanent
demand on 26/08/04 Euston: • Not linked to UTC at the moment
Hammersmith: • Red pedestrian lamp was out on 26th August 2004. However this did not affect the study.

TRL Limited 87 PPR239
Published Project Report Version: FINAL
Table B6: Puffin controller information
Holloway Beckenham Mill Hill Euston Hammersmith
Controller manufacturer Microsense Siemens Microsense Microsense Siemens
Controller Type Pedestrian 400 Pedestrian Pedestrian 700
Mode of operation (fixed vehicle precedence, vehicle actuation, linked, etc)
Originally fixed time, changed to
vehicle actuation
Vehicle actuation not
pre timed max
Vehicle actuation Pre-
timed max
Vehicle actuation
Vehicle actuation Pre-
timed max
Detection System for PEDESTRIANS on Crossing
AGD 220 AGD 220 AGD PX02401 AGD I/R AGD420
Detection System for PEDESTRIANS at Kerbside
AGD 420
Microsense (AGD 620 up until 3 weeks
ago)
AKD R24 AGD420 AGD420
Detection System for VEHICLES none AGD 200 Microsense AGD 200
MVD no
Above ground detectors function correctly
nearside kerbside
picks up too much
see below Permanent demand
Prob. with kerbside giving
permanent demand
yes
Vehicle loop detectors function correctly n/a yes Permanent
demand ok n/a
Engineers Notes: Holloway: • Kerbside detection nearside northbound sometimes permanent demand. • New detectors needed. • There are sometimes extensions from on crossing detectors and sometimes not. Beckenham: • Couldn't tell plot area - too busy. • The kerbside detector on nearside as you travel westbound often goes to permanent demand
but tries to reset itself. This happens quite a lot. • Call cancel working Mill Hill: • 26/08/04: Pedestrian kerbside detector on post 2 was full of water and facing wrong way • All other detectors on permanent demand Hammersmith: • Link to UTC not commissioned • Vehicle detectors set to permanent demand in the controller.
Table B7: Pelican and Puffin matching (Yes = well matched, No = Poorly matched) Holloway Beckenham Mill Hill Euston Hammersmith Pedestrain Flow Yes No Yes No No Crossing Location Yes Yes Yes No Yes Vehicle Speeds Yes Yes Yes Yes No Vehicle Flows Yes Yes Yes Yes No
TRL Limited 88 PPR239
Published Project Report Version: FINAL

TRL Limited 89 PPR239
Published Project Report Version: FINAL
Appendix C: Pedestrian and Vehicle Statistics
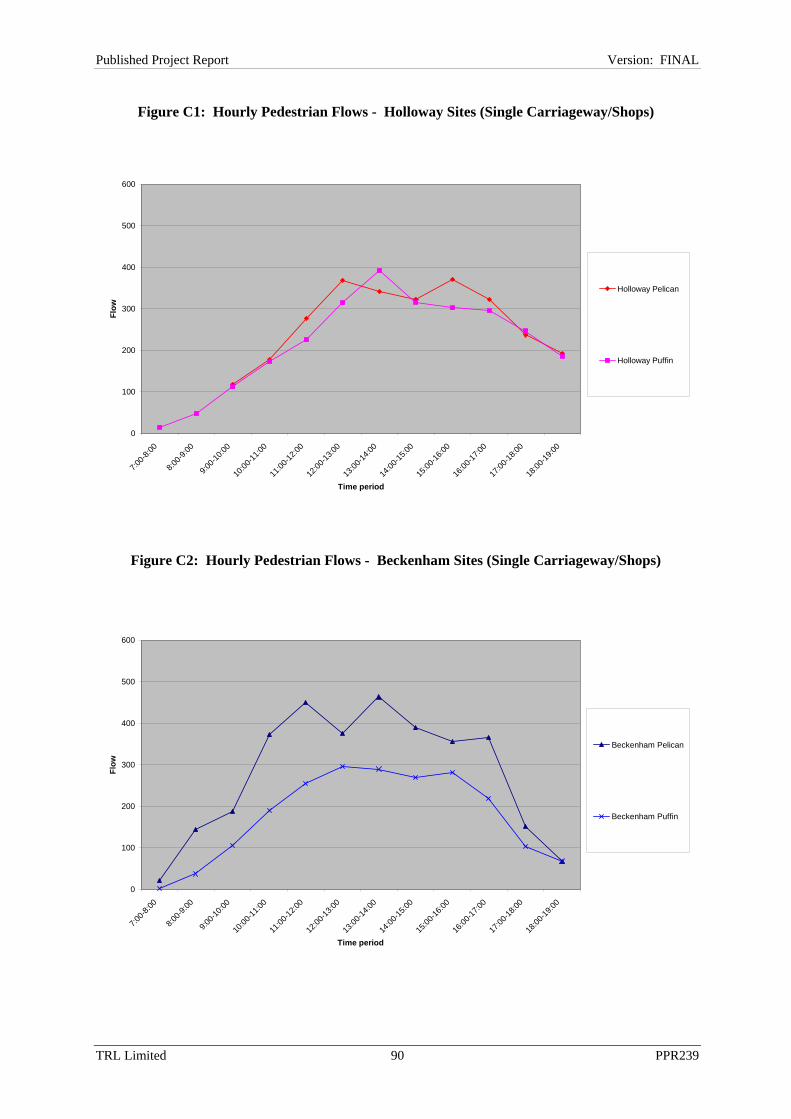
TRL Limited 90 PPR239
Published Project Report Version: FINAL
Figure C1: Hourly Pedestrian Flows - Holloway Sites (Single Carriageway/Shops)
0
100
200
300
400
500
600
7:00-8
:00
8:00-9
:00
9:00-1
0:00
10:00
-11:00
11:00
-12:00
12:00
-13:00
13:00
-14:00
14:00
-15:00
15:00
-16:00
16:00
-17:00
17:00
-18:00
18:00
-19:00
Time period
Flow
Holloway Pelican
Holloway Puffin
Figure C2: Hourly Pedestrian Flows - Beckenham Sites (Single Carriageway/Shops)
0
100
200
300
400
500
600
7:00-8
:00
8:00-9
:00
9:00-1
0:00
10:00
-11:00
11:00
-12:00
12:00
-13:00
13:00
-14:00
14:00
-15:00
15:00
-16:00
16:00
-17:00
17:00
-18:00
18:00
-19:00
Time period
Flow
Beckenham Pelican
Beckenham Puffin

TRL Limited 91 PPR239
Published Project Report Version: FINAL
Figure C3: Hourly Pedestrian Flows - Mill Hill Sites (Single Carriageway/School)
0
100
200
300
400
500
600
7:00-8
:00
8:00-9
:00
9:00-1
0:00
10:00
-11:00
11:00
-12:00
12:00
-13:00
13:00
-14:00
14:00
-15:00
15:00
-16:00
16:00
-17:00
17:00
-18:00
18:00
-19:00
Time period
Flow
Mill Hill Pelican
Mill Hill Puffin
Figure C4: Hourly Pedestrian Flows - Euston Sites (Single Carriageway/Station)
0
100
200
300
400
500
600
7:00-8
:00
8:00-9
:00
9:00-1
0:00
10:00
-11:00
11:00
-12:00
12:00
-13:00
13:00
-14:00
14:00
-15:00
15:00
-16:00
16:00
-17:00
17:00
-18:00
18:00
-19:00
Time period
Flow
Euston Pelican
Euston Puffin

TRL Limited 92 PPR239
Published Project Report Version: FINAL
Figure C5: Hourly Pedestrian Flows - Hammersmith Sites (Dual Carriageway/Shops at Pelican)
0
100
200
300
400
500
600
7:00-8
:00
8:00-9
:00
9:00-1
0:00
10:00
-11:00
11:00
-12:00
12:00
-13:00
13:00
-14:00
14:00
-15:00
15:00
-16:00
16:00
-17:00
17:00
-18:00
18:00
-19:00
Time period
Flow
Hammersmith Pelican
Hammersmith Puffin
Table C1: Description of sampled population
Location Type 0-12
Years 13-17 Years
18-60 Years
61+ Years
Adult(s) with
Child(ren)
Mixture of
CategoriesHolloway Pelican 1% 2% 50% 10% 0% 36% Puffin 0% 1% 44% 8% 6% 42% Beckenham Pelican 0% 4% 67% 11% 7% 10% Puffin 0% 2% 59% 21% 0% 18% Mill Hill Pelican 10% 7% 35% 3% 26% 20% Puffin 12% 4% 36% 5% 33% 10%
Euston Pelican 0% 0% 82% 5% 7% 6% Puffin 0% 1% 80% 9% 8% 3% Hammersmith Pelican 0% 2% 80% 5% 2% 11% Puffin 0% 0% 83% 6% 6% 5%

TRL Limited 93 PPR239
Published Project Report Version: FINAL
Figure C6: Description of sampled population
Description
0%
10%
20%
30%
40%
50%
60%
70%
80%
90%
100%
Pelican Puffin Pelican Puffin Pelican Puffin Pelican Puffin Pelican Puffin
Holloway Beckenham Mill Hill Euston Hammersmith
Mixture of AboveAdult(s) with Child(ren)61+ Years18-60 Years13-17 Years0-12 Years
Figure C7: Crossing times by age
8.58.0
5.6
8.5
6.0 6.0
11.2
10.4 10.4
6.8
8.7
6.6
5.9
7.57.1
12.6
9.9
11.2 11.4
8.2
10.1
7.8
6.6
9.1
7.7
13.1 13.0
0.0
2.0
4.0
6.0
8.0
10.0
12.0
14.0
Pelican Puffin Pelican Puffin Pelican Puffin Pelican Puffin Pelican Puffin
Holloway Beckenham Mill Hill Euston Hammersmith
Site
Ave
rage
cro
ssin
g tim
e
0-17 years18-60 Years61+ Years

TRL Limited 94 PPR239
Published Project Report Version: FINAL
Figure C8: Crossing speeds by age
1.4
1.61.5
1.3
1.5
1.2 1.21.11.2
1.3 1.2
1.4
1.2
1.3 1.3
1.0
1.5
1.1 1.11.0
1.1
1.2
1.11.0
1.2
1.0
1.1
0.0
0.2
0.4
0.6
0.8
1.0
1.2
1.4
1.6
1.8
Pelican Puffin Pelican Puffin Pelican Puffin Pelican Puffin Pelican Puffin
Holloway Beckenham Mill Hill Euston Hammersmith
Site
Ave
rage
cro
ssin
g sp
eed
(m/s
)
0-17 years18-60 Years61+ Years
Figure C9: Crossing times by impairment1
11.7 11.5
7.1
9.4
7.16.8
7.77.2
13.2
10.1
13.0
14.4
7.4
10.5
7.68.2
8.8
7.6
16.2
13.1
0.0
2.0
4.0
6.0
8.0
10.0
12.0
14.0
16.0
18.0
Pelican Puffin Pelican Puffin Pelican Puffin Pelican Puffin Pelican Puffin
Holloway Beckenham Mill Hill Euston Hammersmith
Site
Cro
ssin
g Ti
me
(sec
onds
)
No impairmentImpairment
1Impairment is defined as having either a physical impairment (e.g. In a wheelchair or moving with difficulty) or by having an object that
makes walking awkward (e.g. Pushing a buggy or carrying a heavy object)

TRL Limited 95 PPR239
Published Project Report Version: FINAL
Figure C10: Crossing speed by impairment1
1.0
1.1
1.21.2
1.3
1.0
1.21.3
1.0
1.5
0.90.9
1.1
1.0
1.2
0.9
1.1
1.2
0.8
1.1
0.0
0.2
0.4
0.6
0.8
1.0
1.2
1.4
1.6
Pelican Puffin Pelican Puffin Pelican Puffin Pelican Puffin Pelican Puffin
Holloway Beckenham Mill Hill Euston Hammersmith
Site
Cro
ssin
g Sp
eed
(m/s
)
No impairmentImpairment
1Impairment is defined as having either a physical impairment (e.g. In a wheelchair or moving with difficulty) or by having an object that makes walking awkward (e.g. Pushing a buggy or carrying a heavy object)
Table C2: Distribution of crossing times after the start of the pedestrian green phase
Location Type Number Mean S.D. Holloway Pelican 66 3.6 3.1 Puffin 59 3.8 3.9 Beckenham Pelican 121 3 2.2 Puffin 52 2.3 2.1 Mill Hill Pelican 72 2.3 1.7 Puffin 38 2.9 4.4 Euston Pelican 121 3 2.2 Puffin 52 2.3 2.1 Hammersmith Pelican 101 3.7 4.0 Puffin 34 2.4 2.3 All Pelican 481 3.1 2.7 Puffin 235 2.8 3.2

TRL Limited 96 PPR239
Published Project Report Version: FINAL
Figure C11: Distribution of crossing times after the start of the pedestrian green phase
61.2
16.6
9.26.8
4.1
0.5 0.6 0.5 0.4 0.0 0.0
71.2
14.9
4.92.7
0.82.5
0.8 0.8 0.0 0.5 0.70.0
10.0
20.0
30.0
40.0
50.0
60.0
70.0
80.0
1/2 3/4 5/6 7/8 9/10 11/12 13/14 15/16 17/18 19/20 21/22
Time after pedestrian green (seconds)
Perc
enta
ge
Total PelicanTotal Puffin
Figure C12: Holloway hourly vehicle flows
0
200
400
600
800
1000
1200
1400
1600
1800
07:00
-08:00
08:00
-09:00
09:00
-10:00
10:00
-11:00
11:00
-12:00
12:00
-13:00
13:00
-14:00
14:00
-15:00
15:00
-16:00
16:00
-17:00
17:00
-18:00
18:00
-19:00
Time Period
Mea
n H
ourly
Flo
w
Holloway Pelican EB
Holloway Puffin EB

TRL Limited 97 PPR239
Published Project Report Version: FINAL
Figure C13: Beckenham hourly vehicle flows
0
200
400
600
800
1000
1200
1400
1600
1800
07:00
-08:00
08:00
-09:00
09:00
-10:00
10:00
-11:00
11:00
-12:00
12:00
-13:00
13:00
-14:00
14:00
-15:00
15:00
-16:00
16:00
-17:00
17:00
-18:00
18:00
-19:00
Time Period
Mea
n H
ourly
Flo
w
Beckenham Pelican SB
Beckenham Pelican NB
Beckenham Puffin SB
Beckenham Puffin NB
Figure C14: Mill Hill hourly vehicle flows
0
200
400
600
800
1000
1200
1400
1600
1800
07:00
-08:00
08:00
-09:00
09:00
-10:00
10:00
-11:00
11:00
-12:00
12:00
-13:00
13:00
-14:00
14:00
-15:00
15:00
-16:00
16:00
-17:00
17:00
-18:00
18:00
-19:00
Time Period
Mea
n H
ourly
Flo
w
Mill Hill Pelican WB
Mill Hill Pelican EB
Mill Hill Puffin WB
Mill Hill Puffin EB

TRL Limited 98 PPR239
Published Project Report Version: FINAL
Figure C15: Euston hourly vehicle flows
0
200
400
600
800
1000
1200
1400
1600
1800
07:00
-08:00
08:00
-09:00
09:00
-10:00
10:00
-11:00
11:00
-12:00
12:00
-13:00
13:00
-14:00
14:00
-15:00
15:00
-16:00
16:00
-17:00
17:00
-18:00
18:00
-19:00
Time Period
Mea
n H
ourly
Flo
w
Euston Pelican SB
Euston Pelican NB
Euston Puffin SB
Euston Puffin NB
Figure C16: Hammersmith hourly vehicle flows
0
200
400
600
800
1000
1200
1400
1600
1800
07:00
-08:00
08:00
-09:00
09:00
-10:00
10:00
-11:00
11:00
-12:00
12:00
-13:00
13:00
-14:00
14:00
-15:00
15:00
-16:00
16:00
-17:00
17:00
-18:00
18:00
-19:00
Time Period
Mea
n H
ourly
Flo
w
Hammersmith Pelican WB
Hammersmith Pelican EB
Hammersmith Puffin WB
Hammersmith Puffin EB
TRL Limited 99 PPR239
Published Project Report Version: FINAL
Appendix D: Pedestrian Crossing Behaviour Statistics

TRL Limited 100 PPR239
Published Project Report Version: FINAL
Table D1: Crossing method of sampled population
Location Type Slow Walk Walk Run Cycle
Holloway Pelican 1% 94% 5% 0% Puffin 2% 92% 7% 0% Beckenham Pelican 5% 86% 9% 0% Puffin 0% 92% 7% 0%
Mill Hill Pelican 0% 78% 20% 1% Puffin 1% 86% 12% 0% Euston Pelican 1% 94% 5% 0% Puffin 1% 90% 8% 1% Hammersmith Pelican 1% 91% 7% 1% Puffin 3% 92% 1% 4% Total Pelican 2% 90% 8% 0% Puffin 1% 91% 7% 1%
Figure D1: Crossing method of sampled population
Crossing Method
0%
10%
20%
30%
40%
50%
60%
70%
80%
90%
100%
Pelican Puffin Pelican Puffin Pelican Puffin Pelican Puffin Pelican Puffin
Holloway Beckenham Mill Hill Euston Hammersmith
CycleRunWalkSlow Walk
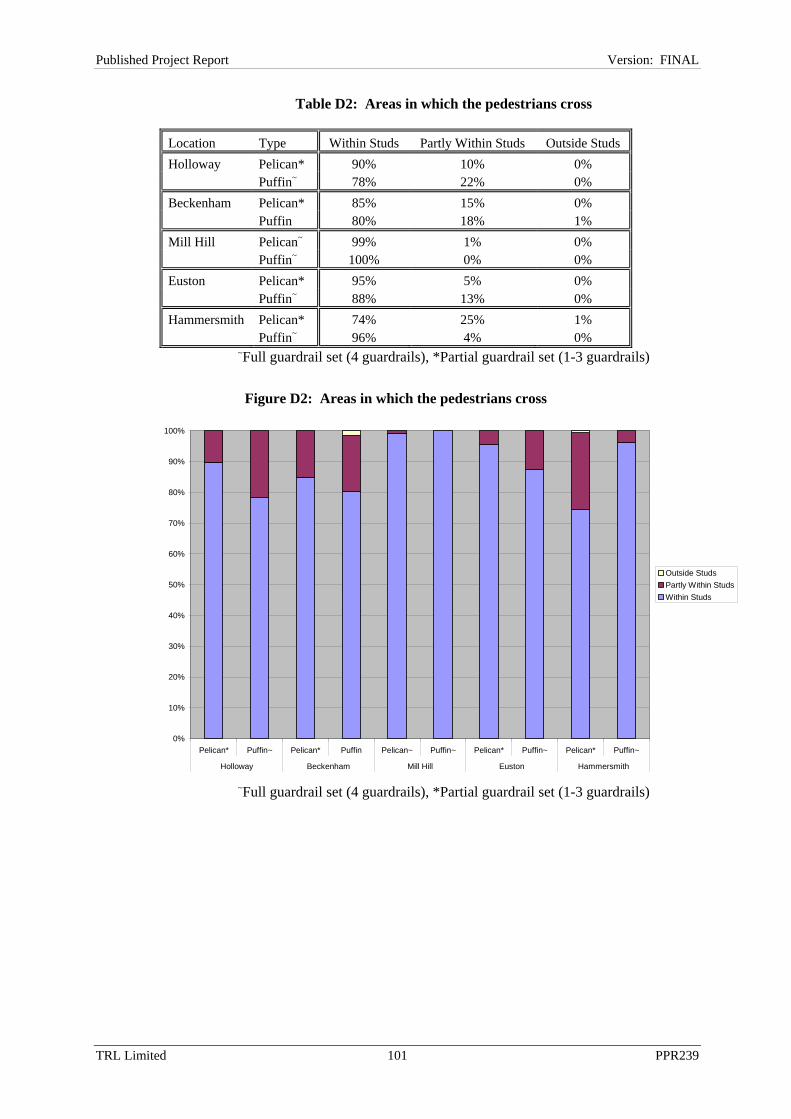
TRL Limited 101 PPR239
Published Project Report Version: FINAL
Table D2: Areas in which the pedestrians cross
Location Type Within Studs Partly Within Studs Outside Studs Holloway Pelican* 90% 10% 0% Puffin~ 78% 22% 0% Beckenham Pelican* 85% 15% 0% Puffin 80% 18% 1% Mill Hill Pelican~ 99% 1% 0% Puffin~ 100% 0% 0% Euston Pelican* 95% 5% 0% Puffin~ 88% 13% 0% Hammersmith Pelican* 74% 25% 1% Puffin~ 96% 4% 0%
~Full guardrail set (4 guardrails), *Partial guardrail set (1-3 guardrails)
Figure D2: Areas in which the pedestrians cross
0%
10%
20%
30%
40%
50%
60%
70%
80%
90%
100%
Pelican* Puffin~ Pelican* Puffin Pelican~ Puffin~ Pelican* Puffin~ Pelican* Puffin~
Holloway Beckenham Mill Hill Euston Hammersmith
Outside StudsPartly Within StudsWithin Studs
~Full guardrail set (4 guardrails), *Partial guardrail set (1-3 guardrails)

TRL Limited 102 PPR239
Published Project Report Version: FINAL
TRL Limited 103 PPR239
Published Project Report Version: FINAL
Appendix E: Results of Significance Tests
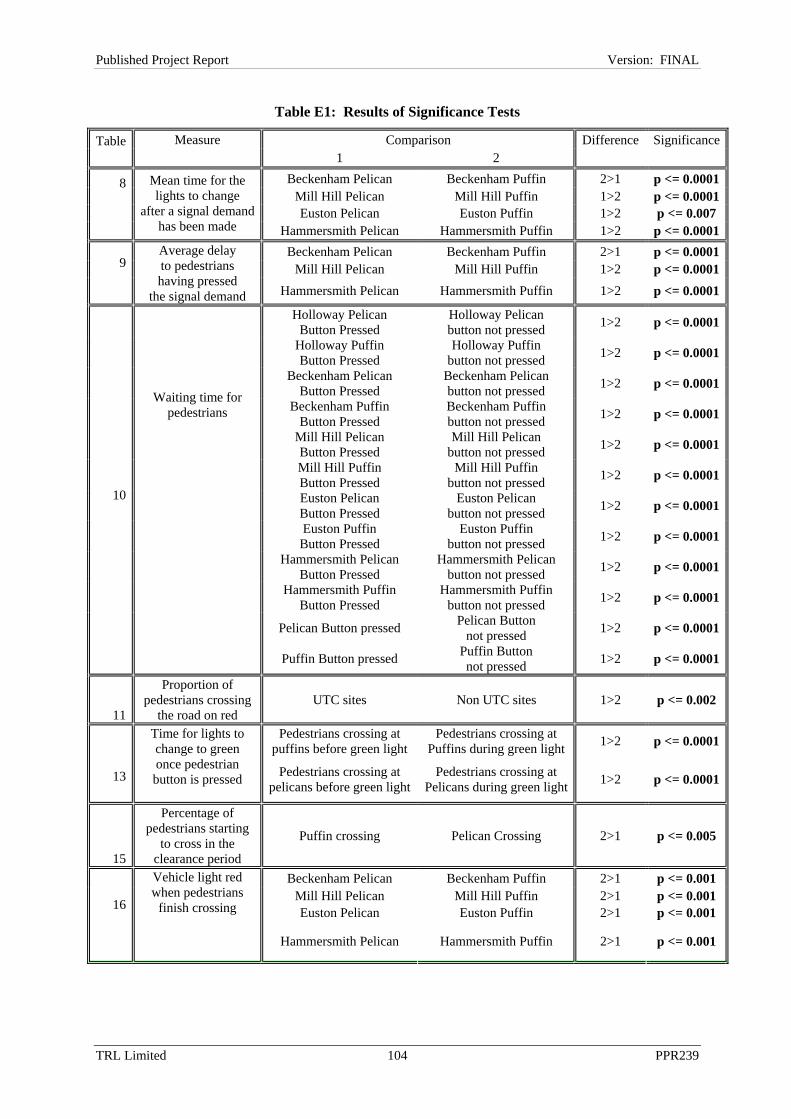
TRL Limited 104 PPR239
Published Project Report Version: FINAL
Table E1: Results of Significance Tests
Comparison Difference SignificanceTable
Measure 1 2
Beckenham Pelican Beckenham Puffin 2>1 p <= 0.0001Mill Hill Pelican Mill Hill Puffin 1>2 p <= 0.0001Euston Pelican Euston Puffin 1>2 p <= 0.007
8
Mean time for the lights to change
after a signal demand has been made Hammersmith Pelican Hammersmith Puffin 1>2 p <= 0.0001
Beckenham Pelican Beckenham Puffin 2>1 p <= 0.0001Mill Hill Pelican Mill Hill Puffin 1>2 p <= 0.00019
Average delay to pedestrians having pressed
the signal demand Hammersmith Pelican Hammersmith Puffin 1>2 p <= 0.0001
Holloway Pelican Button Pressed
Holloway Pelican button not pressed 1>2 p <= 0.0001
Holloway Puffin Button Pressed
Holloway Puffin button not pressed 1>2 p <= 0.0001
Beckenham Pelican Button Pressed
Beckenham Pelican button not pressed 1>2 p <= 0.0001
Beckenham Puffin Button Pressed
Beckenham Puffin button not pressed 1>2 p <= 0.0001
Mill Hill Pelican Button Pressed
Mill Hill Pelican button not pressed 1>2 p <= 0.0001
Mill Hill Puffin Button Pressed
Mill Hill Puffin button not pressed 1>2 p <= 0.0001
Euston Pelican Button Pressed
Euston Pelican button not pressed 1>2 p <= 0.0001
Euston Puffin Button Pressed
Euston Puffin button not pressed 1>2 p <= 0.0001
Hammersmith Pelican Button Pressed
Hammersmith Pelican button not pressed 1>2 p <= 0.0001
Hammersmith Puffin Button Pressed
Hammersmith Puffin button not pressed 1>2 p <= 0.0001
Pelican Button pressed Pelican Button not pressed 1>2 p <= 0.0001
10
Waiting time for pedestrians
Puffin Button pressed Puffin Button not pressed 1>2 p <= 0.0001
11
Proportion of pedestrians crossing
the road on red UTC sites Non UTC sites 1>2 p <= 0.002
Pedestrians crossing at puffins before green light
Pedestrians crossing at Puffins during green light 1>2 p <= 0.0001
13
Time for lights to change to green once pedestrian button is pressed
Pedestrians crossing at pelicans before green light
Pedestrians crossing at Pelicans during green light 1>2 p <= 0.0001
15
Percentage of pedestrians starting
to cross in the clearance period
Puffin crossing Pelican Crossing 2>1 p <= 0.005
Beckenham Pelican Beckenham Puffin 2>1 p <= 0.001 Mill Hill Pelican Mill Hill Puffin 2>1 p <= 0.001 Euston Pelican Euston Puffin 2>1 p <= 0.001 16
Vehicle light red when pedestrians
finish crossing
Hammersmith Pelican Hammersmith Puffin 2>1 p <= 0.001