Embed Size (px)
Citation preview

Siemens Industry, Inc.Siemens Power Technologies International400 State Street • P.O. Box 1058Schenectady, New York 12301-1058 USATel: +1 (518) 395-5000 • Fax: +1 (518) 346-2777www.siemens.com/power-technologies
v16
PREPA Ex. 1.0
Siemens PTI Report Number: RPT-015-19
Puerto Rico Integrated Resource Plan2018-2019
Draft for the Review of the Puerto RicoEnergy Bureau
Prepared for
Puerto Rico Electric Power Authority
Submitted by:Siemens Industry
Rev. [1]2/12/2019

Revision History
Date Rev. Description
01/21/2019 0 Initial draft
02/12/2019 1 Second Draft with Implementation Plan and Caveats and limitations and otheradjustments
Siemens Industry, Inc. – Siemens Power Technologies International i i
ContentsLegal Notice ................................................................................................................ vii
Part 1 – Introduction and Summary of Conclusions .......................................... 1-1Introduction ............................................................................................................1-1
Summary of Conclusions and Recommendations ................................................1-4
Supply Side Decisions and Conclusions .................................................1-5
Transmission and Distribution Decisions, Conclusions andRecommendations...................................................................................1-7
Demand Side Decisions ..........................................................................1-7
Part 2 – Planning Environment .............................................................................. 2-1Environmental and Energy Standards and Regulations Applicable toPREPA...................................................................................................................2-1
Laws and Regulations Changed Since Last IRP ..................................................2-3
Solar and Energy Storage Cost Decline ................................................................2-5
Hurricane Impacts on the IRP ...............................................................................2-6
PROMESA Federal Act .........................................................................................2-7
Title III ......................................................................................................2-8
Title V .......................................................................................................2-8
Fiscal Plan .............................................................................................................2-8
PREPA Board Vision Statement ...........................................................................2-9
Privatization ........................................................................................................ 2-11
Part 3 – Load Forecast ............................................................................................ 3-1Data, Assumptions and Methodology....................................................................3-1
Historical Energy Sales............................................................................3-1
Load Forecast Methodology ....................................................................3-2
Fundamental Drivers for the Load Forecast ............................................3-3
Macroeconomic and Weather Projections ..............................................3-5
Long Term Energy Forecast ....................................................................3-8
Long Term Peak Demand Forecast ..................................................... 3-13
Stochastic Distribution .......................................................................... 3-16
Parametric Distributions ........................................................................ 3-17
Quantum Distribution: Additional Variability ......................................... 3-17

Contents
ii Siemens Industry, Inc. – Siemens Power Technologies International
Part 4 – Existing Resources ................................................................................... 4-1Existing Generation Resources and Distributed Generation .................................4-1
PREPA’s Existing Generation Facilities ..................................................4-1
Utility Scale Renewable PPOAs ..............................................................4-9
Environmental Considerations ............................................................................ 4-13
National Ambient Air Quality Standards (NAAQS) ............................... 4-14
SO2 NAAQS.......................................................................................... 4-15
Mercury and Air Toxics Standards (MATS) .......................................... 4-18
Carbon Regulation ................................................................................ 4-21
New Source Performance Standards for GHGs for ElectricGenerating Units ................................................................................... 4-22
Clean Power Plan and Affordable Clean Energy Rule – GHGEmissions Guidelines for Existing Electric Generating Units ............... 4-22
Consideration of the Effect of Future Regulation of Carbon onGenerators in Puerto Rico .................................................................... 4-23
Puerto Rico RPS .................................................................................. 4-23
Clean Water Act Section 316(b) ........................................................... 4-24
Puerto Rico Water Quality Standards Regulation ................................ 4-25
Part 5 – Resource Needs Assessment ................................................................. 5-1Overview of the Needs ..........................................................................................5-1
Three Strategies ....................................................................................................5-2
Uncertainties ..........................................................................................................5-4
Scenarios ...............................................................................................................5-4
Sensitivities ............................................................................................................5-6
Portfolio Cases.......................................................................................................5-7
Part 6 – New Resource Options ............................................................................ 6-1Overview of New Generation Resources ..............................................................6-1
New Fossil-Fired Generation Resources ..............................................................6-2
Generation Options Development and Sizing .........................................6-2
Representative Future Generation Resources Characteristics ...............6-3
Future Generation Resources Development Timeline ......................... 6-12
Levelized Cost of Energy (LCOE) ........................................................ 6-13
Solar Photovoltaic (PV) Projects......................................................................... 6-17
Baseline Operating and Overnight Capital Costs ................................. 6-17
Interconnection Costs ........................................................................... 6-18

Contents
Siemens Industry, Inc. – Siemens Power Technologies International iii iii
Land Costs ............................................................................................ 6-19
Weighted Average Cost of Capital (WACC) ......................................... 6-19
Investment Tax Credit (ITC) ................................................................. 6-20
Project Development and Construction Time ....................................... 6-20
Levelized Cost of Energy (LCOE) ........................................................ 6-21
Minimum Technical Requirements (MTR)............................................ 6-26
Battery Storage ................................................................................................... 6-26
Installed Costs and Applications ........................................................... 6-27
Future Cost Trends ............................................................................... 6-28
Li-ion Battery System Price Forecast ................................................... 6-29
Wind Projects ...................................................................................................... 6-31
Baseline Operating and Overnight Capital Costs ................................. 6-31
Investment Tax Credit (ITC) ................................................................. 6-32
Project Development and Construction Time ....................................... 6-32
Levelized Cost of Energy (LCOE) ........................................................ 6-32
Part 7 – Assumptions and Forecasts ................................................................... 7-1Fuel Infrastructure and Forecast............................................................................7-1
Fuel Infrastructure Options ......................................................................7-1
Pre-Storm Fuel Infrastructure ..................................................................7-4
Fuel Price Forecasts ........................................................................................... 7-18
Henry Hub Natural Gas ........................................................................ 7-19
EIA Annual Energy Outlook 2018 ......................................................... 7-21West Texas Intermediate (WTI) Crude Oil ........................................... 7-23
Columbia Coal ...................................................................................... 7-24
Forecast Delivered Fuel Prices at Key Power Plants ........................... 7-25
Value of Lost Load Estimation ............................................................................ 7-32
Methodological Approaches to Estimating VOLL ................................. 7-33
VOLL Trends ........................................................................................ 7-34
First Approach to Calculate Puerto Rico’s VOLL ............................................... 7-35
Second Approach to Calculate Puerto Rico’s VOLL .......................................... 7-37
Conclusion ............................................................................................ 7-39
Part 8 – Resource Plan Development ................................................................... 8-1Overview of Scenario Results ...............................................................................8-1
Scenario 4 Results .................................................................................................8-7

Contents
iv Siemens Industry, Inc. – Siemens Power Technologies International
Capacity Additions and Retirements .......................................................8-8
Capital Expenditures............................................................................. 8-10
Capacity Retirements ........................................................................... 8-11
Future Generation Mix and Reserves .................................................. 8-13
Fuel Diversity ........................................................................................ 8-14
RPS and Environmental Compliance ................................................... 8-15
System Costs........................................................................................ 8-17
Resiliency (MiniGrid Considerations) ................................................... 8-18
Scenario 4. Strategy 2 – Expert Review ............................................... 8-20
Considerations under Strategy 3 .......................................................... 8-21
Considerations under Strategy 1 .......................................................... 8-24
Sensitivities Considerations .................................................................. 8-26
Rate Impact .......................................................................................... 8-28
Nodal Analysis Scenario 4, Strategy 2 ................................................. 8-31
Nodal Analysis Scenario 4, Sensitivity 6 .............................................. 8-32
The ESM Plan..................................................................................................... 8-34
Generating Additions ............................................................................ 8-35
Capacity Retirements ........................................................................... 8-36
Future Generation Mix and Reserves .................................................. 8-37Fuel Diversity ........................................................................................ 8-39
System Costs........................................................................................ 8-40
Resiliency (Mini Grid Considerations) .................................................. 8-42
RPS and Environmental Compliance ................................................... 8-43
ESM with 50% RPS Sensitivity ............................................................ 8-45
Rate Impact .......................................................................................... 8-46
Nodal Analysis of the ESM ................................................................... 8-48
Scenario 1 Results .............................................................................................. 8-49
Capacity Additions and Retirements for Scenario 1 ............................. 8-50
Fuel Diversity ........................................................................................ 8-53
System Costs........................................................................................ 8-54
RPS Compliance .................................................................................. 8-55
Rate Impact .......................................................................................... 8-56
Results of Comparison to Customer Based Alternatives ..................... 8-56
Nodal Analysis of the S1S2B................................................................ 8-58
Scenario 3 Base Case Results ........................................................................... 8-58

Contents
Siemens Industry, Inc. – Siemens Power Technologies International v v
Capacity Additions and Retirements .................................................... 8-58
Fuel diversity ......................................................................................... 8-62
RPS Compliance .................................................................................. 8-63
System Costs........................................................................................ 8-64
Resiliency (Mini Grid Considerations) .................................................. 8-65
Scenario 5 Base Case Results ........................................................................... 8-66
Capacity Additions and Retirements .................................................... 8-66
Fuel Diversity ........................................................................................ 8-69
RPS Compliance .................................................................................. 8-70
System Costs........................................................................................ 8-71
Resiliency (Mini Grid Considerations) .................................................. 8-72
Considerations Under High Gas Prices................................................ 8-72
Planning Reserve Margin Considerations .......................................................... 8-73
Introduction ........................................................................................... 8-73
Binding Planning Reserve Margin Cases ............................................. 8-73
Planning Reserve Margin Sensitivity Analysis ..................................... 8-74
Part 9 – Caveats and Limitations........................................................................... 9-1
Part 10 – Action Plan ............................................................................................. 10-1Supply Resources............................................................................................... 10-2
Overview and Principal Recommendations ......................................... 10-2
Modify and Retire Existing Resources ................................................. 10-4
Unit Retirements ................................................................................... 10-5
Install New Resources .......................................................................... 10-5
Summary Timetable ............................................................................. 10-8
Summary of Capital Expenditures ........................................................ 10-8
Permitting and Regulatory Activities ..................................................... 10-9
Transmission System ....................................................................................... 10-10
Overview and Principal Recommendations ....................................... 10-10
Schedule of Capital Expenditures ...................................................... 10-11
Timetables .......................................................................................... 10-14
Permitting and Regulatory Activities ................................................... 10-16
Distribution System ........................................................................................... 10-16
Schedule of Capital Expenditures ...................................................... 10-20
Timetables .......................................................................................... 10-20

Contents
vi Siemens Industry, Inc. – Siemens Power Technologies International
Permitting and Regulatory Activities .......... Error! Bookmark not defined.
Attachment A – Gas Pipeline Competition Model ............................................... A-1Gas Pipeline Competition Model (GPCM®) .................................................................... A-1
GPCM® Model Structure and Capabilities ...................................................................... A-1
GPCM® Geography and Granularity ................................................................... A-2
GPCM® Power-Gas Model Integration ........................................................................... A-3

Siemens Industry, Inc. – Siemens Power Technologies International vii vii
Legal NoticeThis document was prepared by Siemens Industry, Inc., Siemens Power TechnologiesInternational (Siemens PTI), solely for the benefit of Puerto Rico Electric Power Authority.Neither Siemens PTI, nor parent corporation or its or their affiliates, nor Puerto Rico ElectricPower Authority, nor any person acting in their behalf (a) makes any warranty, expressed orimplied, with respect to the use of any information or methods disclosed in this document; or(b) assumes any liability with respect to the use of any information or methods disclosed inthis document.
Any recipient of this document, by their acceptance or use of this document, releasesSiemens PTI, its parent corporation and its and their affiliates, and Puerto Rico Electric PowerAuthority from any liability for direct, indirect, consequential or special loss or damagewhether arising in contract, warranty, express or implied, tort or otherwise, and irrespective offault, negligence, and strict liability.

Legal Notice
viii Siemens Industry, Inc. – Siemens Power Technologies International
This page intentionally left blank.

Siemens Industry, Inc. – Siemens Power Technologies International 1-1 1-1
Part
1Introduction and Summary ofConclusions
Introduction
Following the massive destruction resulting from hurricanes Irma and María in 2017, PuertoRico faced the unprecedented challenge of rebuilding their electric power system. Thehurricanes forced the Puerto Rico Electric Power Authority (PREPA) to rethink how its powersupply and delivery infrastructure should be modified to ensure that the utility infrastructurewas much better prepared for future weather events. In addition, PREPA’s current fiscalsituation as a debtor under the Title III of the Puerto Rico Oversight, Management, andEconomic Stability Act (PROMESA) requires it to identify a roadmap for the electrical systeminfrastructure that will support its path to comply with sound financial utility practices.
The development of an Integrated Resource Plan (IRP) is essential in developing a plan thatwould realize these goals. PREPA is required, under Puerto Rico Act 57 of May 27, 2014(Act 57-2014), as amended, to prepare an IRP which shall consist of a detailed planningprocess considering all reasonable resources to satisfy the demand for electrical servicesover a twenty (20) year planning horizon, including resources related to energy supply anddemand. In addition, the IRP shall consider resiliency, reliability, and stability of the powersystem, and be fully compliant with current and future environmental regulations.
This document and associated appendices present PREPA’s 2019 IRP, which provides theanalysis and recommendations for PREPA’s energy supply resources for a 20 year period(2019 to 2038). The parts and appendices of this document are intended to fulfill therequirements of the Puerto Rico Energy Bureau (PREB) Regulation 9021, Regulation onIntegrated Resource Plan for the Puerto Rico Electric Power Authority (IRP Regulation). TheIRP was developed by Siemens Power Technology, Inc. (Siemens) using a rigorousanalytical process. The IRP analyses considered a large number of options and uncertainties,recognizing formal and informal input from PREPA and a large number of stakeholders.
The IRP recommendations are fully aligned with the five key pillars adopted by the PREPAGoverning Board in its Vision for the Future of Power in Puerto Rico that we summarizebelow (also see Exhibit 2-2):
1. Customer-Centric: The IRP includes costumer participation via energy efficiency,customer side energy resources and demand response with a predominant role inthe supply and consumption matrix of Puerto Rico, and empowering customers toparticipate and take ownership on their energy security and affordability.

Introduction and Summary of Conclusions
1-2 Siemens Industry, Inc. – Siemens Power Technologies International
2. Financial Viability: Within the requirements of resiliency and reliability, the planminimizes the cost of supply and drastically reduces the dependence on importedfuels and the associated volatility; thus, supporting affordable rates that promotefinancial viability at both sides of the meter.
3. Reliable and Resilient: The IRP is centered on the concept of MiniGrids, defined aszones of resiliency into which the system can be segregated during and after a majorweather event ensuring that the load can be served using local resources. In addition,MiniGrids must support effectively preparing, managing and timely recovery fromsuch event.
4. Model of Sustainability: The IRP’s implementation will transition the Puerto Ricoelectric system from one centered on fossil fuels to one in which renewable resourcesplay a central, if not, the predominant role. The IRP’s implementation will drasticallyreduce emissions, increase the penetration of renewable generation, achievecompliance with all current regulations, and position Puerto Rico for futureregulations.
5. Economic Growth Engine: The distributed nature of the new generation resourcesthat will have to be developed, the high levels of customer participation on the energyproduction and the overall reduction in the system cost are expected to result inemployment opportunities and economic growth for Puerto Rico. The IRP will supporta reliable and economic system that will attract economic development in PuertoRico.
The 2019 IRP is not a classical IRP designed to identify the least cost approach to addressthe expected gap between future load growth and resources while maintaining a desiredPlanning Reserve Margin (PRM). Rather, this plan must satisfy the five pillars stated abovefor a system with declining load. The load served by the PREPA is expected to significantlydecline over the course of this IRP’s planning horizon due to a combination of expected baseload reduction (driven by population and economic changes), energy efficiency gains, anddemand side resources. Instead of new resources to meet load growth, this IRP is designedinstead, to address the following needs:
a) Address the impacts of an aging generation fleet that burns costly liquid fuels (mostlyheavy fuel oil), that does not meet environmental regulations (e.g. MATS), has poorreliability, and is inflexible, which limits the incorporation of renewable resources.
b) Achieve a reduction of cost of supply by incorporating renewable resources which willprovide a permanent reduction in expensive and volatile fuel costs, trading this off byeffective capital investments.
c) Achieve compliance with the Renewable Portfolio Standard (RPS) mandate.However, Siemens observed that the renewable cost benefits alone justified greaterlevels of penetration and, consequently, making it possible to go beyond the currentRPS mandates.
d) Shift from centralized generation located in the south of the island to moredecentralized generation resources distributed across the island.
In developing this IRP, Siemens worked with PREPA and the PREB to identify five Scenariosdeemed worthy of analysis:
Introduction and Summary of Conclusions
Siemens Industry, Inc. – Siemens Power Technologies International 1-3 1-3
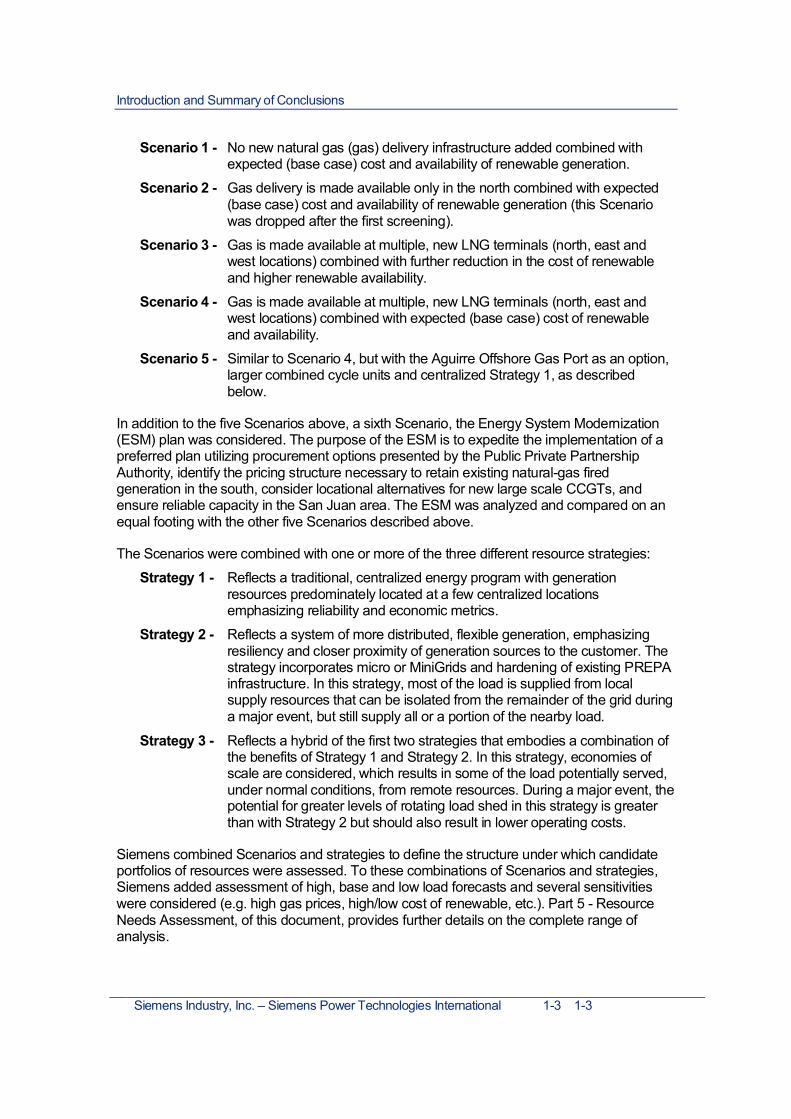
Scenario 1 - No new natural gas (gas) delivery infrastructure added combined withexpected (base case) cost and availability of renewable generation.
Scenario 2 - Gas delivery is made available only in the north combined with expected(base case) cost and availability of renewable generation (this Scenariowas dropped after the first screening).
Scenario 3 - Gas is made available at multiple, new LNG terminals (north, east andwest locations) combined with further reduction in the cost of renewableand higher renewable availability.
Scenario 4 - Gas is made available at multiple, new LNG terminals (north, east andwest locations) combined with expected (base case) cost of renewableand availability.
Scenario 5 - Similar to Scenario 4, but with the Aguirre Offshore Gas Port as an option,larger combined cycle units and centralized Strategy 1, as describedbelow.
In addition to the five Scenarios above, a sixth Scenario, the Energy System Modernization(ESM) plan was considered. The purpose of the ESM is to expedite the implementation of apreferred plan utilizing procurement options presented by the Public Private PartnershipAuthority, identify the pricing structure necessary to retain existing natural-gas firedgeneration in the south, consider locational alternatives for new large scale CCGTs, andensure reliable capacity in the San Juan area. The ESM was analyzed and compared on anequal footing with the other five Scenarios described above.
The Scenarios were combined with one or more of the three different resource strategies:
Strategy 1 - Reflects a traditional, centralized energy program with generationresources predominately located at a few centralized locationsemphasizing reliability and economic metrics.
Strategy 2 - Reflects a system of more distributed, flexible generation, emphasizingresiliency and closer proximity of generation sources to the customer. Thestrategy incorporates micro or MiniGrids and hardening of existing PREPAinfrastructure. In this strategy, most of the load is supplied from localsupply resources that can be isolated from the remainder of the grid duringa major event, but still supply all or a portion of the nearby load.
Strategy 3 - Reflects a hybrid of the first two strategies that embodies a combination ofthe benefits of Strategy 1 and Strategy 2. In this strategy, economies ofscale are considered, which results in some of the load potentially served,under normal conditions, from remote resources. During a major event, thepotential for greater levels of rotating load shed in this strategy is greaterthan with Strategy 2 but should also result in lower operating costs.
Siemens combined Scenarios and strategies to define the structure under which candidateportfolios of resources were assessed. To these combinations of Scenarios and strategies,Siemens added assessment of high, base and low load forecasts and several sensitivitieswere considered (e.g. high gas prices, high/low cost of renewable, etc.). Part 5 - ResourceNeeds Assessment, of this document, provides further details on the complete range ofanalysis.

Introduction and Summary of Conclusions
1-4 Siemens Industry, Inc. – Siemens Power Technologies International
In the development of the IRP, over 78 Long-Term Capacity Expansion (LTCE) plans wereinvestigated to assess plausible options and numerous uncertainties, taking into accountstakeholder input. These points were critical for the final product and included multipleaspects, for example: a) the timing of investments in traditional thermal generation units, b)practical limits to the ability of PREPA to effectively interconnect additional battery energystorage and renewables generation, c) uncertainty associated with fuel price forecasts andinfrastructure options, d) uncertainty associated with the customer demand forecast, and d)assessment of resource candidates provided by PREPA’s management and the Puerto RicoPublic-Private Partnership Authority (P3). As detailed in Part 7 – Assumptions and Forecasts,this effort resulted in the identification of a final set of 34 LTCE plans that were assessed toidentify the recommended resource plan with a primary focus on the next 5 years, while alsoconsidering the long-term planning horizon of 20 years. Part 8 – Resource Plan Developmentof this IRP provides the details of assessment and inputs of the 34 LTCE plans. A summaryof the main resource additions of the 34 LTCE plans are provided in Exhibit 1-1.
The next section provides a summary of Siemens conclusions and recommendations basedon the consideration of the broad array of Scenarios and all strategies represented in the 34LTCE plans and identification of common elements among them to define the minimumregret or no regret decisions (i.e., the decision that would provide the best possible solutionover the broadest range of potential future conditions). Siemens has also prepared thetransmission expansion plans associated with the generation resource options, which issummarized in Appendix 1 – Transmission and Distribution Planning.
This IRP is a recommended plan for PREPA and Puerto Rico. The IRP does not address thedetails of procurement, interconnection, ownership, rate structures, nor the issues associatedwith PREPA’s debt or privatization plans. All of these other important issues will need to beaddressed in other processes and venues, and later combined with this IRP to develop acomplete roadmap for Puerto Rico’s power system.
Summary of Conclusions and RecommendationsThe conclusions and minimum regret or no regret recommendations of this IRP includeintegrating the maximum amount of renewable generation that is practical to interconnect inthe first four years of the planning period, adding distributed resources and hardening thetransmission and distribution grid so that it can be segregated into eight largely self-sufficientelectric islands (MiniGrids). This is essential in order to mitigate, manage and enable timelyrecovery from a major storm, while shifting the traditional generation from largely heavy fueloil and distillate fuels to renewables and cleaner natural gas.
The review of the options revealed two resource plans that were deemed both low cost andmost practicable, the ESM and the Scenario 4 Strategy 2 (S4S2) plan. These two plans werevirtually identical in cost, with less than a $9M or 0.06% difference in cost, as measured bynet present value of cash flows (NPV).
While the S4S2 and ESM plans had a number of identical elements, they also containeddifferences. In order to create an action plan with no regrets or minimum regrets, Siemensrecommends that PREPA implement the ESM and add preliminary activities drawn fromselective elements of the S4S2. By adding elements from the S4S2, the resulting ESM planhas greater flexibility and incorporates a hedge against potential issues that may arise withthe development of new resources, the continued reliance on PREPA’s aging generation fleetand the changes in the future system load.
Introduction and Summary of Conclusions
Siemens Industry, Inc. – Siemens Power Technologies International 1-5 1-5
The following list provides a summary of conclusions and recommendations.
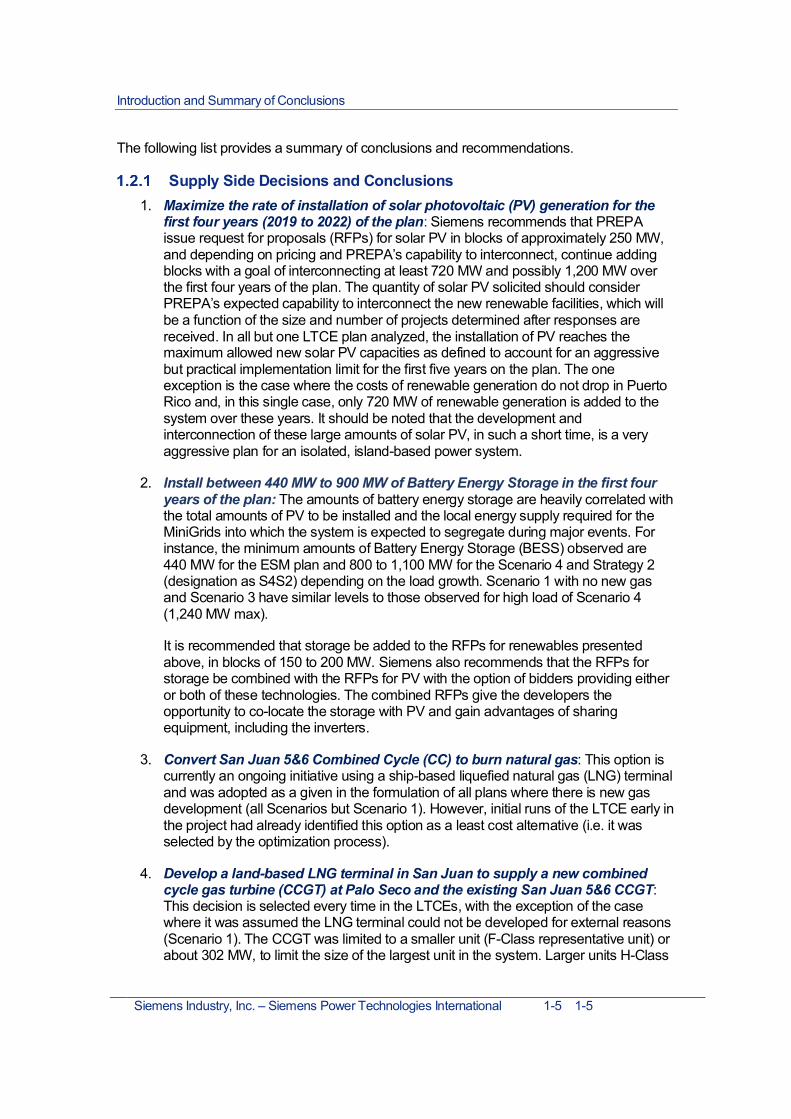
Supply Side Decisions and Conclusions1. Maximize the rate of installation of solar photovoltaic (PV) generation for the
first four years (2019 to 2022) of the plan: Siemens recommends that PREPAissue request for proposals (RFPs) for solar PV in blocks of approximately 250 MW,and depending on pricing and PREPA’s capability to interconnect, continue addingblocks with a goal of interconnecting at least 720 MW and possibly 1,200 MW overthe first four years of the plan. The quantity of solar PV solicited should considerPREPA’s expected capability to interconnect the new renewable facilities, which willbe a function of the size and number of projects determined after responses arereceived. In all but one LTCE plan analyzed, the installation of PV reaches themaximum allowed new solar PV capacities as defined to account for an aggressivebut practical implementation limit for the first five years on the plan. The oneexception is the case where the costs of renewable generation do not drop in PuertoRico and, in this single case, only 720 MW of renewable generation is added to thesystem over these years. It should be noted that the development andinterconnection of these large amounts of solar PV, in such a short time, is a veryaggressive plan for an isolated, island-based power system.
2. Install between 440 MW to 900 MW of Battery Energy Storage in the first fouryears of the plan: The amounts of battery energy storage are heavily correlated withthe total amounts of PV to be installed and the local energy supply required for theMiniGrids into which the system is expected to segregate during major events. Forinstance, the minimum amounts of Battery Energy Storage (BESS) observed are440 MW for the ESM plan and 800 to 1,100 MW for the Scenario 4 and Strategy 2(designation as S4S2) depending on the load growth. Scenario 1 with no new gasand Scenario 3 have similar levels to those observed for high load of Scenario 4(1,240 MW max).
It is recommended that storage be added to the RFPs for renewables presentedabove, in blocks of 150 to 200 MW. Siemens also recommends that the RFPs forstorage be combined with the RFPs for PV with the option of bidders providing eitheror both of these technologies. The combined RFPs give the developers theopportunity to co-locate the storage with PV and gain advantages of sharingequipment, including the inverters.
3. Convert San Juan 5&6 Combined Cycle (CC) to burn natural gas: This option iscurrently an ongoing initiative using a ship-based liquefied natural gas (LNG) terminaland was adopted as a given in the formulation of all plans where there is new gasdevelopment (all Scenarios but Scenario 1). However, initial runs of the LTCE early inthe project had already identified this option as a least cost alternative (i.e. it wasselected by the optimization process).
4. Develop a land-based LNG terminal in San Juan to supply a new combinedcycle gas turbine (CCGT) at Palo Seco and the existing San Juan 5&6 CCGT:This decision is selected every time in the LTCEs, with the exception of the casewhere it was assumed the LNG terminal could not be developed for external reasons(Scenario 1). The CCGT was limited to a smaller unit (F-Class representative unit) orabout 302 MW, to limit the size of the largest unit in the system. Larger units H-Class

Introduction and Summary of Conclusions
1-6 Siemens Industry, Inc. – Siemens Power Technologies International
of about 449 MW were selected by the LTCE runs if allowed. However, the CCGTsize was limited to reduce the amount of spinning reserve generation that must be online to respond to the potential trips of large generating units. This new CCGT shouldbe in place as soon as practical (2025 was assumed in this study).
5. Install a CCGT at Costa Sur Steam Plant or extend a renegotiated contract withEcoEléctrica: Under all cases, unless the contract with EcoEléctrica is renegotiatedto significantly reduce the fixed payments and the plant is allowed to cycle frequently,EcoEléctrica is replaced by a 302 MW CCGT after the contract expires in 2022. Theanalysis assumes the new CCGT can be built in 2025. Due to the inability of installinggas generation elsewhere in the system, Scenario 1 installs two or even threeF-Class CCGT here over time, depending on the load.
6. Install new Gas Turbines (GTs) capable of burning containerized natural gas:The need to serve critical and priority loads within the MiniGrids resulted in thenecessity to add 17 to 18 small gas turbines (each of 23 MW) at selected locationsacross the island. In addition, the new units will allow PREPA to retire the 18 ofPREPA’s existing old and unreliable Frame 5 GTs (21 MW each) The new GTsinclude 2 units at located at Ponce East (Jobos), 4 units at Mayagüez North(Aguadilla), 5 units at Carolina (Daguao) - 5 units at Caguas (Yabucoa) and 2 units atCayey. Siemens found the costs of these small GTs was significantly less than thecosts to the Puerto Rico economy should another large hurricane strike Puerto Ricoand the MiniGrids were forced to operate in isolated mode for a month and not haveenough resources to supply the critical and priority load. In the assessment, Siemensincluded all the resources available to the MiniGrids during grid isolated operationsincluding the PV and storage in addition to the GTs, however we verified that therewas enough thermal generation to supply the critical loads. These small GTs shouldbe placed in service as soon as practical (2021 is assumed as the earliestcommercial operation date).
7. Develop a Ship-Based LNG terminal at Mayagüez: Developing a new LNG importterminal at Mayagüez and install a large 302 MW CCGT is the least cost solutionunder most cases, with the exception of cases when one of the following apply: a)very low cost of renewables, b) no new gas can be developed, c) low load growth, ord) the Yabucoa LNG terminal is developed and a 302 MW CCGT as is the case ofthe ESM plan or if the LNG in the North is limited to the ship-based delivery . Underthe balance of the Scenarios, including the Scenario 4 Strategy 2 (S4S2), the 302MW CCGT is recommended for installation at Mayagüez by 2028 under the base andhigh load forecast. Under the ESM plan, the Ship-Base LNG is also developed but itis used to supply the aeroderivative gas turbines (Aeros) installed at Mayagüez thatare converted to natural gas. The recommendation is to advance the development ofthe ship-based LNG with the view of at least converting the existing units to burn LNGinitially and then develop a larger CCGT plant as the load, status of other resourcedevelopments and prices of renewables require.
8. Develop a Ship-Based LNG terminal at Yabucoa: A new LNG terminal at Yabucoais part of the least cost solution for a number of cases such as high demand, inabilityto develop a land-based LNG at San Juan, and the ESM plan. Under a number of theLTCE cases, a large CCGT (302 MW) is called for at Yabucoa in conjunction with theLNG terminal, and in others a medium CCGT (150 MW) is developed. This terminalis recommended as a hedge against the potential that either of the other two LNG

Introduction and Summary of Conclusions
Siemens Industry, Inc. – Siemens Power Technologies International 1-7 1-7
terminals (San Juan and Mayagüez) is not developed. In addition, as was observedin the ESM plan, if the LNG terminal and the 302 MW CCGT are developed atYabucoa, the cost differential with the S4S2 that develops a CCGT at Mayagüez isminimal. This Yabucoa CCGT, when part of the plan, is selected in general by 2025(i.e. as soon as possible).
As a consequence of the investment decisions above and the expected reduction in the load,accelerated by the assumed energy efficiency gains and the increased penetration ofdemand side resources, most of the existing generating fleet is recommended to be retired by2025, with the exception of the CCGTs at San Juan and Aguirre and the GTs at Cambalacheand Mayagüez. It must be stressed that these retirements can only be carried out when allthe conditions leading to the recommendation are in place; in particular, the new supplyresources are fully operational.
Transmission and Distribution Decisions, Conclusions andRecommendations
Central to the IRP is developing the capability to segregate the system into eight MiniGrids forresiliency of the electrical service. The MiniGrids require the recommended generation andbattery energy storage projects described above and the recommended transmission anddistribution hardening projects described in Appendix 1. The recommended MiniGrids aredesigned to operate in grid-isolated mode following a major storm, ensuring continued supplyto critical loads (those necessary to manage the recovery), and provide timely resupply to thepriority loads (those required to regain normalcy and restart the economy) and balance theloads within the MiniGrid. Complementary to the MiniGrids, smaller microgrids have beenidentified for those areas that, due to geography and system topology, are likely to remainisolated for longer periods of time after a major event.
Under interconnected operation, no additional transmission investments were foundnecessary, beyond those already identified for grid hardening. This result was expected dueto the shift towards distributing new generation additions across Puerto Rico and the de-emphasis of the concentration of generation in the South.
The system was also found to be stable and have appropriate frequency response even withhigh levels of renewable generation online, thanks to the support from the additions of batteryenergy storage. However, studies also identified the need to convert some of the generatorsslated for retirement to synchronous condensers. Preliminary analyses indicate that PaloSeco Units 3&4 and San Juan Units 7, 8, 9 and 10 are the minimum number of units thatneed to be converted. However, Siemens recommends that a detailed study be conducted todetermine the schedule, capacity, and costs of the synchronous condenser’s conversions aswell defined its technical performance in support of transient voltage recovery and stability.The stability study also identified the need to conduct a study to optimize the frequencyresponse of existing and new resources (including the storage) and the under frequency loadshedding strategies.
Demand Side DecisionsThe demand side decisions are twofold:
1. Establish an Energy Efficiency (EE) program with the objective of reducing thedemand in values approximating the 2% per year, as defined in Part 3 – LoadForecast.

Introduction and Summary of Conclusions
1-8 Siemens Industry, Inc. – Siemens Power Technologies International
2. Reinforce the distribution system and enable two-way flow of energy and providingvoltage regulation and flicker control to facilitate the high penetration of distributedenergy, as forecasted in this IRP (see Appendix 4 – Demand-Side Resources).

Siemens Industry, Inc. – Siemens Power Technologies International 1-9 1-9
Exhibit 1-1: Summary of Investment Decisions by Scenario, Strategy and Load Growth1
1 See Part 5 – Resource Needs Assessment for a detailed description of the various Scenarios.
Count Case IDF - Class Palo
Seco 2025F - Class Costa
Sur 2025
F-ClassMayaguez 2028
F-ClassYabucoa
2025
SmallCCGT
(LPG/NG)North
F - ClassSan Juan
2029
MediumCCGT
Yabucoa2024
Peakers(small CC)2019-2022
NewSolar2019 -2022
BESS2019 -2022
NewSolar2023 -2028
BESS2023 -2028
NewSolarTotal
BESSTotal
1 S1S2B X ✔ (2025, 2028) X X X X X 396 1200 1200 2520 380 3720 21402 S1S2H X ✔ (2025 x 2, 2033) X X X X ✔ Palo Seco 2027 472 1200 1240 3060 120 4320 18803 S1S2L X ✔ (2025, 2028) X X X X X 303 1200 1160 2100 180 3300 18004 S1S3B ✔ ✔ (2025, 2028) X X X X X 343 1200 1120 2520 160 3720 16405 S1S3H ✔(141 MW) ✔ (2025, 2028) X X X X ✔ Palo Seco 2027 476 1200 940 3060 120 4260 25006 S1S3L X ✔ (2025, 2028) X X X X X 303 1200 1120 2040 20 3240 19007 S1S2S1B ✔(141 MW) ✔ (2025, 2028) X X X X X 345 1200 1120 2640 500 3840 27008 S1S2S2B X ✔ (2025 x 2, 2028) X X X X X 444 1200 1140 2820 80 4020 18009 S1S2S3B ✔(S. Juan LFO) ✔ (2025) X X X X ✔ (LFO) 350 1200 1140 1140 0 2640 156010 S1S1B X ✔ (2025, 2028) X X X X X 297 1200 1160 2520 0 3720 222011 S3S2B ✔ ✔ X X X X X 303 1500 980 2520 200 4020 238012 S3S2H ✔ ✔ X X X X X 303 1500 1180 4560 200 4560 326013 S3S2L ✔ 2027 ✔ X X X X X 303 1500 940 1980 240 3480 198014 S3S3B ✔ ✔ X X X X X 303 1500 1020 2460 260 3960 396015 S3S3H ✔ 2027 ✔ X X ✔(76MW) X ✔ 303 1500 1100 2880 100 4560 222016 S3S3L ✔ 2027 ✔ X X X X X 303 1500 960 1860 260 3420 244017 S4S2B ✔ ✔ ✔ X X X X 372 1200 900 1020 40 2220 108018 S4S2B-M ✔ ✔ ✔ X X X X 387 1200 900 1020 40 2220 108019 S4S2H ✔ ✔ ✔ X X ✔ ✔ 479 1200 800 1380 0 2580 96020 S4S2L ✔ ✔ X X X X X 280 1200 1100 900 60 2100 116021 S4S3B ✔ ✔ ✔ X X X X 388 1200 900 1140 160 2340 154022 S4S3H ✔ ✔ ✔ ✔ X X X 440 1200 1000 1380 0 2580 142023 S4S3L ✔ ✔ X ✔ (2028) X X X 280 1200 1080 720 0 1920 108024 S4S2S3B ✔ ✔ X X X X X 303 1200 920 960 20 2160 102025 S4S2S4B ✔ ✔ 2027 X ✔ X X X 327 1200 1160 1140 0 2340 122026 S4S2S5B ✔ ✔ X X X X ✔ 591 1200 580 1140 80 2340 96027 S4S2S6B ✔ ✔ ✔ (2025) X X ✔ (2028) ✔ 204 720 620 0 0 780 62028 S4S1B ✔ ✔ ✔ X X X X 324 1200 900 1140 0 2340 146029 S5S1B ✔ 302 + 369 X X X X X 71 1200 1020 960 0 2160 102030 S5S1S5B ✔ ✔ X X X X X 60 1200 1060 1140 643 2340 140031 ESM Plan ✔ Eco Instead X ✔ ✔ X X 418 720 440 180 140 900 80032 ESM high ✔ Eco Instead X ✔ ✔ X X 477 720 440 960 160 1680 78033 ESM low ✔ Eco Instead X ✔ ✔ X X 418 720 440 0 140 720 64034 ESM 50% RPS ✔ Eco Instead X ✔ ✔ X X 618 720 440 420 260 1980 820
Strong no regret with no varation among cases that support decision being madeDecission common to multiple cases / little variation between scenarios that allow the decission to be takenDecission common to few scenarios that allow the decission to be takenDecission common to one scenario, PV / BESS: outlier or close follow up required.

Introduction and Summary of Conclusions
1-10 Siemens Industry, Inc. – Siemens Power Technologies International
This page intentionally left blank.

Siemens Industry, Inc. – Siemens Power Technologies International 2-1 2-1
Part
2Planning EnvironmentIn this part Siemens documents the set of external factors that affect the environment underwhich PREPA is operating at the time of the IRP development. In addition to marketconditions and stakeholders’ input, it is important to consider the other key external factorsthat are in place, including applicable laws and regulations and conditions that have changedsince the last IRP.
The description of this planning environment is a requirement of the IRP Regulation, whichspecifically requires the following:
µ PREPA shall describe, at a minimum, the following factors: federal, state, ormunicipal standards and rules that impact the requirement for, or availability of,energy efficiency, renewable energy, fuel alternatives, or other resourcerequirements; and environmental standards and regulations that impact existing utilityresources or resource choices at the present time and throughout the planningperiod.
µ The Planning Environment part shall also include a discussion of substantialregulatory or legislative standards and rules that have changed since the approval ofthe most recent IRP.
Although there are numerous factors that have the potential to directly or indirectly impact theIRP, summarized herein are what have been identified to be the key factors warrantingacknowledgement and documentation.
Environmental and Energy Standards and RegulationsApplicable to PREPA
Puerto Rico is subject to most federal environmental standards applicable to energygenerating facilities as well as state standards and regulations. A description of policiesdeemed as substantial to resource planning and how they are considered in the IRP analysisis included in Exhibit 2-1. These largely include the Environmental Protection Agency (EPA)federal air emission and water standards and Puerto Rico regulations governing energyefficiency, resource requirements, and environmental standards.

Planning Environment
2-2 Siemens Industry, Inc. – Siemens Power Technologies International
Exhibit 2-1. Environmental and Energy Standards Applicable to PREPA
Category Law /Regulation Summary
Fede
ralE
nviro
nmen
talS
tand
ards
-EPA
2
Mercury and AirToxicsStandard(MATS)
The MATS rule was finalized in December 2011 and requires facility specificemission reductions of mercury, acid gases, and particulate matter. This is acommand-and-control type of regulation with no allowance trading. Several PREPAfacilities remain out of compliance and are required to run for reliability purposes. TheIRP will inform pathways to MATS compliance for these units.
NationalAmbient AirQualityStandards(NAAQS)
EPA updated attainment designations for SO2 based on detailed air qualitymonitoring in December 2017. The standard for SO2 is 75 parts per billion. PuertoRico must finalize a state implementation plan (SIP) by May 2019 addressingcompliance for two areas designated as nonattainment. Emissions from allgenerating units will be modeled and reported in the IRP analysis. The IRP will informthe SIP as PREPA units currently represent the most significant emission sources inthe areas in Puerto Rico designated as nonattainment.
GreenhouseGas EmissionStandards
The New Source Performance Standards (NSPS) for Electric Utility Generating Unitswas finalized in August of 2015 and sets a rate limit of 1,000lbs of CO2/MWh forcombined cycle natural gas plants and a limit of 1,400lbs of CO2/MWh for coal plants.Units emitting above these levels are not included as new generation options due tothis rule and market conditions not supporting, for example, new build coal.
Clean PowerPlan (CPP)
The final CPP under Section 111(d) of the Clean Air Act was finalized in August 2015and required state-level emission targets by 2030. Puerto Rico was not coveredunder the final rule. Due to legal challenges and additional review of this rule, it isanticipated that this rule will be withdrawn in its entirety. The IRP therefore is notmodeling compliance with the CPP. CO2 emissions are reported and are expected toshow a significant decline.
Puer
toR
icoEn
ergy
Stan
dard
s
RenewablePortfolioStandard (RPS)
Act 82 of July 19, 2010, as amended, defines specific requirements to promoteenergy diversification by creating an RPS (Renewable Portfolio Standard). This rulerequires load serving entities to supply increasing shares of retail sales with qualifiedrenewable and alternative sources starting at 12 percent in 2015 increasing to 15percent in 2027 and 20 percent in 2035. PREPA has not met RPS targets to date.The IRP will target compliance beginning in 2020, depending on feasibility, andmaintain compliance for the balance of the study horizon. Sensitivities consideringhigher RPS targets are also modeled.
Energy RELIEFPlan – EnergyEfficiency
Act 57-2014 orders PREPA to adopt Puerto Rico’s RELIEF Plan, which requires thatwithin 3 years from July 1, 2014, at least 60 percent of the electricity generated inPuerto Rico from fossil fuels is generated in a highly efficient manner, as defined bythe regulations approved by the PREB.
Government energy savings mandates also established under this Act include a 40percent reduction in energy consumption by state agencies, public corporations, andjudicial branch buildings by promoting energy savings performance contracts(ESPCs) unless proven not cost effective. The Legislature must reduce its electricalenergy consumption 12% by 2022, from a baseline of fiscal year 2012-2013.Municipalities must reduce electricity consumption by 5% annually for three years, or15% in the first three years. Compliance was initially expected to begin in 2016 or
2 These regulations and requirements are further detailed in the environmental section of the IRP found at the endof Part 4 – Existing Resources.

Planning Environment
Siemens Industry, Inc. – Siemens Power Technologies International 2-3 2-3
Category Law /Regulation Summary
2017.
The State Office of Energy Policy will oversee the development and implementationof plans and programs to fulfill this law and publish semi-annual results from programevaluations. Act 57-2014 also mandates the benchmarking of energy use andmonitoring of energy efficiency measures in all public buildings, includingmunicipalities.
Regulation onMicrogridDevelopment
The final Microgrid Regulation of May 2018 sets the legal and regulatory frameworkrequired to promote and encourage the development of microgrid systems in PuertoRico, enable customer choice and control over their electric service, increase systemresiliency, foster energy efficiency and environmentally sustainable initiatives, andspur economic growth by creating a new and emerging market for microgrid services.It intends to promote the development of Microgrid systems by enabling theirimplementation through different business and operational models. The FinalMicrogrid Regulation recognizes three main types of microgrid systems: (i) PersonalMicrogrids; (ii) Cooperative Microgrids and (iii) Third-Party Microgrids.
While supporting microgrids where operationally and economically beneficial, PREPAexpressed concerns with the final Microgrid regulation adopted by PREB and mayseek changes.
In the context of long term resource planning, the IRP will identify microgrids thatcould be owned by the utility or private entities. Moreover, if during the developmentof the IRP plans for a privately owned microgrid become available, this could beincorporated as an option when assessing the coverage of the MiniGrids.
Source: various statutes referenced, Siemens
Additional detail on how these laws and regulations are accounted for in the IRP is includedthroughout the IRP report.
Laws and Regulations Changed Since Last IRP
Regulation on Integrated Resource Planning for the Puerto Rico Electric PowerAuthority (Regulation 9021)The PREB adopted the Regulation 9021 on April 24, 2018. This regulation, referred to as theRegulation on Integrated Resource Plan for Puerto Rico Electric Power Authority, wasenacted as required under the Act No. 83 of May 2, 1941, as amended, known as the PuertoRico Electric Power Authority Act (Act 83 of 1941), and Act 57-2014, as amended, the PuertoRico Energy Transformation and RELIEF Act. Regulation 9021 serves to make sure that theIRP is a useful tool to improve the system's reliability, resiliency, efficiency, and transparency,and offer electric power services at reasonable prices. Specifically, this regulation defines therequired contents and organization of the IRP, the process with PREB, and performancemetrics for PREPA following PREB’s review and evaluation of the IRP.
Key parameters of the IRP are reflected including the defined 20-year planning period, thecontents and organization of the IRP report and technical appendices, and sourcingrequirements and documentation. As noted above, the requirement for documentation on theIRP planning environment is one of the required parts of the IRP. This IRP analysis alsoreflects the specific requirements outlined in Regulation 9021 regarding load forecasting,existing resources, resource needs determination including planning reserve margin, new

Planning Environment
2-4 Siemens Industry, Inc. – Siemens Power Technologies International
resource options including supply- and demand-side resources as well as distributed andstorage resources.
To account for a range of future market conditions, Regulation 9021 specifies that the IRPshall consider multiple Scenarios that cover a reasonable range of possible outcomes foruncertain forecasts and that the IRP shall consider sufficient Scenarios to capture a widerange of possible risks and justify Scenarios included and those excluded. It is also requiredthat a single reference case representing PREPA’s best understanding of expected futureconditions is included in the IRP. This Scenario is called the Base in this report.
The approach to analyze the resource options and tools used are also discussed in therequirements. Specifically, a capacity expansion model is required for the basis of theanalysis. Further, sensitivity analysis of each resource plan is required. In this analysis,Siemens is using AURORAxmp® (by EPIS, now Energy Exemplar) as the long-term capacityexpansion tool. Risk analysis is performed using Scenarios (high/low/base) and a number ofsensitivities as discussed later in this report.
Finally, Regulation 9021 lays out the requirements for analysis of the transmission anddistribution system. This will be addressed in the IRP analysis using AURORA nodalmodeling, PSS®E transmission system studies and targeted distribution hardeningdistribution studies3.
Regulation on Microgrid Development (Regulation 9028)The PREB adopted the Regulation 9028 on May 18, 2018. This regulation, referred to as theRegulation on Microgrid Development, sets the legal and regulatory framework required topromote and encourage the development of microgrid systems in Puerto Rico, enablecustomer choice and control over their electric service, increase system resiliency, fosterenergy efficiency and environmentally sustainable initiatives, and spur economic growth bycreating a new and emerging market for microgrid services. It intends to promote thedevelopment of Microgrid systems by enabling their implementation through differentbusiness and operational models. The Final Microgrid Regulation recognizes three maintypes of microgrid systems: (i) Personal Microgrids; (ii) Cooperative Microgrids and (iii) Third-Party Microgrids.
While supporting microgrids where operationally and economically beneficial, PREPAexpressed concerns with Regulation 9028 adopted by PREB and may seek changes.
PREPA Revitalization Act, Act 4 of 2016On February 17, 2016, the Governor signed into law the Puerto Rico Electric PowerRevitalization Act, Act 4 of 2016. The law aimed to begin restructuring for PREPA’s $9 billiondebt as a means to start addressing the Commonwealth’s $70 billion debt. Under the law, thePREPA Revitalization Corporation was created. This entity would issue new bonds inexchange for PREPA bonds under a new securitization that did not close. On July 30, 2018,the Governor of Puerto Rico and the federal Financial Oversight and Management Boardannounced a new agreement relating to restructuring certain of PREPA’s debt, which may or
3 These studies include those carried out by NYSSGC and ProsumerGrid for the Puerto Rico Grid Re-Design™Study.
Planning Environment
Siemens Industry, Inc. – Siemens Power Technologies International 2-5 2-5
may not implicate Act 4 in one or more respects. A restructuring, if consummated, couldaffect PREPA’s cost of capital in the IRP.
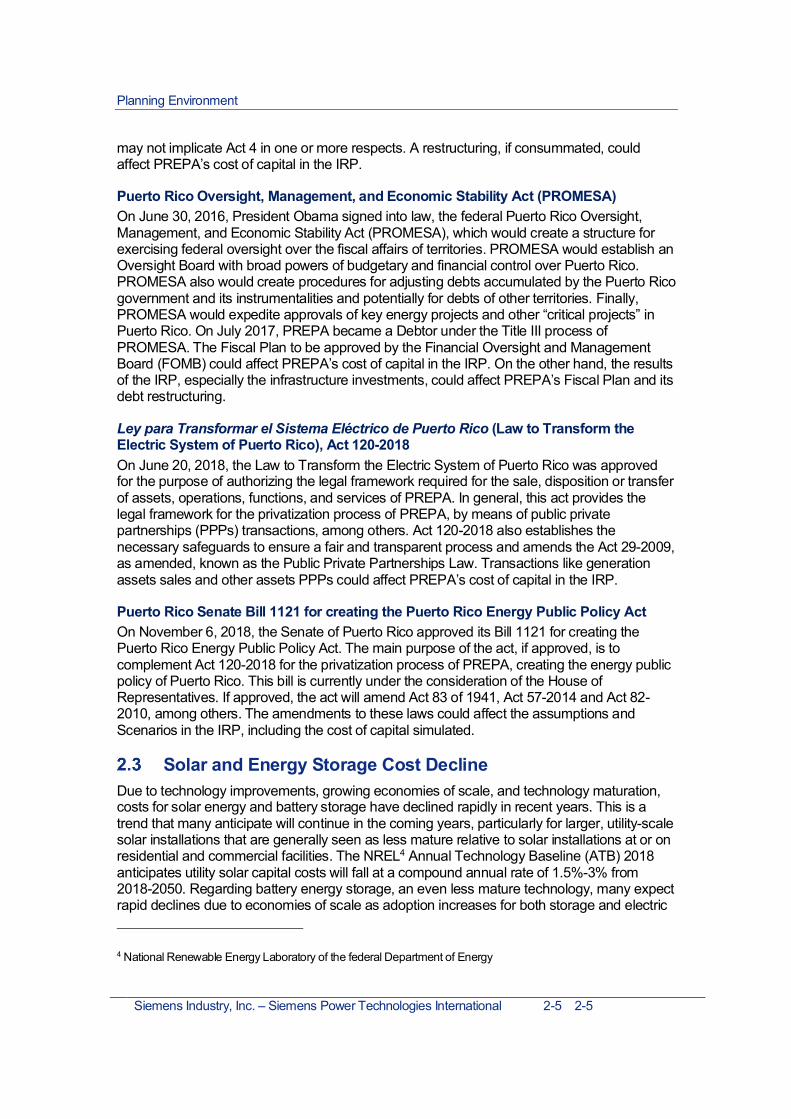
Puerto Rico Oversight, Management, and Economic Stability Act (PROMESA)On June 30, 2016, President Obama signed into law, the federal Puerto Rico Oversight,Management, and Economic Stability Act (PROMESA), which would create a structure forexercising federal oversight over the fiscal affairs of territories. PROMESA would establish anOversight Board with broad powers of budgetary and financial control over Puerto Rico.PROMESA also would create procedures for adjusting debts accumulated by the Puerto Ricogovernment and its instrumentalities and potentially for debts of other territories. Finally,PROMESA would expedite approvals of key energy projects and other “critical projects” inPuerto Rico. On July 2017, PREPA became a Debtor under the Title III process ofPROMESA. The Fiscal Plan to be approved by the Financial Oversight and ManagementBoard (FOMB) could affect PREPA’s cost of capital in the IRP. On the other hand, the resultsof the IRP, especially the infrastructure investments, could affect PREPA’s Fiscal Plan and itsdebt restructuring.
Ley para Transformar el Sistema Eléctrico de Puerto Rico (Law to Transform theElectric System of Puerto Rico), Act 120-2018On June 20, 2018, the Law to Transform the Electric System of Puerto Rico was approvedfor the purpose of authorizing the legal framework required for the sale, disposition or transferof assets, operations, functions, and services of PREPA. In general, this act provides thelegal framework for the privatization process of PREPA, by means of public privatepartnerships (PPPs) transactions, among others. Act 120-2018 also establishes thenecessary safeguards to ensure a fair and transparent process and amends the Act 29-2009,as amended, known as the Public Private Partnerships Law. Transactions like generationassets sales and other assets PPPs could affect PREPA’s cost of capital in the IRP.
Puerto Rico Senate Bill 1121 for creating the Puerto Rico Energy Public Policy ActOn November 6, 2018, the Senate of Puerto Rico approved its Bill 1121 for creating thePuerto Rico Energy Public Policy Act. The main purpose of the act, if approved, is tocomplement Act 120-2018 for the privatization process of PREPA, creating the energy publicpolicy of Puerto Rico. This bill is currently under the consideration of the House ofRepresentatives. If approved, the act will amend Act 83 of 1941, Act 57-2014 and Act 82-2010, among others. The amendments to these laws could affect the assumptions andScenarios in the IRP, including the cost of capital simulated.
Solar and Energy Storage Cost DeclineDue to technology improvements, growing economies of scale, and technology maturation,costs for solar energy and battery storage have declined rapidly in recent years. This is atrend that many anticipate will continue in the coming years, particularly for larger, utility-scalesolar installations that are generally seen as less mature relative to solar installations at or onresidential and commercial facilities. The NREL4 Annual Technology Baseline (ATB) 2018anticipates utility solar capital costs will fall at a compound annual rate of 1.5%-3% from2018-2050. Regarding battery energy storage, an even less mature technology, many expectrapid declines due to economies of scale as adoption increases for both storage and electric
4 National Renewable Energy Laboratory of the federal Department of Energy
Planning Environment
2-6 Siemens Industry, Inc. – Siemens Power Technologies International
vehicle applications. In China, 332 GWh of battery manufacturing capacity have beenannounced by 2021.5 Despite this general consensus at this time for future declines in cost,the magnitude and timing of these declines are less certain. Also, as these technologiesbecome more affordable and, consequently, their demand increases, it is uncertain how theoffer and their cost will behave in the future.
Solar and solar paired with energy storage, such as lithium-ion (Li-ion) batteries, representclean and renewable energy options for Puerto Rico that do not require the need for fuelinfrastructure or volatility associated with fuel costs. Further, with additional storm hardeningtactics like deeper anchoring of ground mounted solar installations, these technologies canwithstand significant hurricane conditions. Battery storage technologies can produce orabsorb power, providing value to utilities in managing supply to meet load throughout the day.Due to the remote location and hardening requirements, cost premiums (higher costs) forthese technologies are assumed in this analysis relative to that, for example, of new solarbuilds in advantageous areas in the continental U.S. However, the changes in cost outlookeven relative to a few years ago are reflected in this IRP analysis as well as a range ofoutcomes as to the timing and magnitude of these technology cost declines. Overall,however, this trend and the need for a reliable and resilient electric grid present a uniqueopportunity for Puerto Rico to transition to cleaner, renewable energy sources that by theirdistributed nature support resiliency.
It is expected that the utilities will deploy huge amounts of solar energy and battery storage,due to the decline in their costs. However, there is no precedent in the electric industry ofsuch deployments and, consequently, there is no experience in developing projects for thesimultaneous integration of very large amounts of solar energy and battery storage, inaddition to no operational experience managing them. Hence, even though the developmentof these technologies promises to achieve these benefits, it is important to deploy them in anorderly and planned manner, so the utility is able to acquire the needed operationalexperience of managing a new technology which has not yet been proved at the large scalethat was analyzed in this IRP.
New wind generation is also considered as a part of the IRP analysis. Although the windtechnology costs are not declining as noteworthy as solar and battery storage costs, theperformance of wind turbines is improving particularly at low wind speeds. This increasedperformance offers a lower levelized cost of energy from new wind projects. Part 7 –Assumptions and Forecasts provides further details on Siemens forecast.
Hurricane Impacts on the IRPEven before the 2017 hurricanes, Puerto Rico’s economy was in structural decline, withGNP6 and population falling by at least a percentage point a year. The devastation ofHurricanes María and Irma in 2017 exacerbated these trends with this event alone resultingin a 4 percent population decline due to migration and the death toll from the storm.7 Theseconditions and the uncertainty as to the future population and economy of Puerto Rico arekey considerations in this IRP.
5 https://www.wsj.com/articles/batteries-are-taking-over-the-world-15118803196 Gross national product7 Per a study from the Harvard T.H. Chan School of Public Health, published in New England Journal of Medicine,May 2018

Planning Environment
Siemens Industry, Inc. – Siemens Power Technologies International 2-7 2-7
Outlooks for economic growth vary between highly credible sources including the FinancialOversight and Management Board (FOMB), the World Bank, and the International MonetaryFund. Some suggest a relatively fast recovery from the impacts of the hurricanes due todisaster relief spending, structural reforms and improved fiscal transparency in theGovernment of Puerto Rico (Government). On the other hand, the Fiscal Plan has thepotential to negate some of these economic growth drivers. Central to population andeconomic growth is a reliable and cost effective electric supply to Puerto Rico.
A more detailed discussion of these impacts, specific to the baseline load projections andrange of load uncertainty considered in the IRP analysis, is included in Part 3 – LoadForecast of this report. A real additional risk of future natural disasters in the coming yearscannot be ignored. Although these quantum events are difficult to directly include in such ananalysis, the range of future market conditions, particularly load growth, aim to incorporate arealistic range of recovery outlooks for Puerto Rico and the resulting impacts to resourcedecisions over the 20-year planning period are covered in this IRP.
Puerto Rico’s exposure to hurricanes and the disruption that they bring to overheadtransmission and distribution facilities necessitates that the IRP identifies an optimal balancebetween local generation resources and limited centralized new generation. To achieve this,the IRP defines portfolios based on the three strategies detailed in Section 5.2. Central tothese strategies is the concept of segregating the system into a number of electrical islands(called MiniGrids), defined considering the vulnerabilities of the overhead transmissionsystem, whose lines could take a month or more to rebuild after a major hurricane, andcontain the identification of facilities that need to be hardened (e.g., undergrounding) toensure integrity of supply to critical loads and timely recovery of the balance of the localloads. Appendix 1 provides more details.
The IRP analysis will consider a range of load outcomes as Scenarios (High, Base and Low).Additional variables including the cost of fuel and capital costs for new supply options are alsoanalyzed through sensitivities. Scenario and sensitivity analysis will consider alternateregulatory outcomes (i.e. strengthened future renewable mandate) and future fuel supplyoptions (i.e. natural gas availability to fossil generating facilities located at the north of theisland).
PROMESA Federal ActThe Puerto Rico Oversight, Management, ad Economic Stability Act (PROMESA), signedinto law by President Obama on June 30, 2016, is a unique federal legislative enactment thatincludes a number of different provisions that apply to Puerto Rico in respect to its ownfinancial situation. This Law became effective one day before Puerto Rico defaulted onsignificant payment obligations. Key provisions of PROMESA include:
Financial Oversight and Management Board – PROMESA required a Financial Oversightand Management Board (FOMB) to independently oversee fiscal planning, budgeting, andoperations. This Oversight Board consists of seven members appointed by the President ofthe United States and an ex officio member without voting rights, the Governor or appointee.Among other public entities, PREPA is a listed entity covered by PROMESA and theOversight Board. As such, activities of PREPA fall under the FOMB, specifically as it relatesto its financial planning.

Planning Environment
2-8 Siemens Industry, Inc. – Siemens Power Technologies International
Fiscal Plan – PROMESA requires the development and maintenance of a fiscal plan forPuerto Rico. This plan, at a minimum is required to document the reduction of deficits,payment of debts, and fiscal accountability. Key also to this plan is a description of howcritical services, including electric service, will be maintained. Additional contents of PREPA’sown fiscal plan are detailed in Part 3 – Load Forecast.
Stay – Title IV of PROMESA implemented a temporary stay on actions and litigation tocollect from Puerto Rico entities or enforce liabilities and claims. This stay, similar toprotections under the U.S. Bankruptcy code, is enacted to allow Puerto Rico to assessfinances and negotiate with creditors.
Debt Reorganization – Title III of PROMESA allows for Puerto Rico or designatedrepresentative selected by the FOMB on behalf of the Government to file for reorganizing itsdebt. This provision maintains elements of Chapter 9 under the U.S. Bankruptcy Code aswell as unique provisions specific to Puerto Rico. This includes safe harbors for municipaldebts. Title III filing must be approved by the Oversight Board.
Title IIIDuring the Stay period that, with extensions, was in place through May 1, 2017, voluntarynegotiations with creditors were ongoing. Following this time, the Oversight Board determinedit necessary to file a petition under Title III of PROMESA. The preference is to continue topursue voluntary negotiations, however the Title III filing was deemed necessary to protectthe Government and its people.
As of May 3, 2017, Puerto Rico filed for bankruptcy under Title III of PROMESA. PREPA filedfor bankruptcy on July 2017 and became a debtor under Title III of PROMESA. TheGovernment and agencies are working to address the $70 billion debt. PREPA is workingwith the Government and its statutory fiscal agent, the Fiscal Agency and Financial AdvisoryAuthority (AAFAF), to reach restructuring and the electric sector transformation.
Title VTitle V defines a Critical Project Process which promotes expedited permitting to advancemajor projects as those that could be identified in the IRP to develop local generation and/orhardened transmission or distribution facilities to provide resiliency.
Title V establishes the position of the “Revitalization Coordinator,” who operates under theFOMB and who is charged with evaluating infrastructure projects that will provide direct andsubstantive benefits to Puerto Rico. After receiving a project proposal, the RevitalizationCoordinator identifies all Puerto Rico agencies that have a role in permitting, approving, orauthorizing the proposed project, and those agencies are required to submit to theRevitalization Coordinator an expedited permitting process, with the goal of ensuring thatcritical projects are given priority to the maximum extent possible. In the case of energyprojects, the process requires the approval of the PREB. The effectiveness of this procedureis still to be confirmed, but it defines a path that would benefit the implementation of therecommendations of this IRP.
Fiscal PlanAs noted above, PROMESA required the development of a fiscal plan and budget for PuertoRico that will supersede previous fiscal plans. PREPA submitted its draft fiscal plan on

Planning Environment
Siemens Industry, Inc. – Siemens Power Technologies International 2-9 2-9
February 21, 2017 and the latest plan was published, following updates after the post-hurricane restoration in August 2018. PREPA’s fiscal plan aligns with the Government’s fiscalplan and addresses areas specific to PREPA. The plan focuses on the need for privatizationof assets, efficiency in expenditures, and the need for being an economic growth engine forPuerto Rico.
PREPA’s current situation including aging and poorly maintained infrastructure, limited fueloptions, and operational challenges drive the current high cost of energy service. Theongoing recession has resulted in lower energy sales, and required subsidized service tocertain customers. Growing debt limited PREPA’s ability to invest in the grid and the PREPApension fund. As a result, PREPA’s service reliability and infrastructure lags industrystandards. The fiscal plan details a path to modernization through transformation. Key to thistransformation is the development of PREPA’s 2018 IRP. Details and timeline for the IRP areincluded in the plan.
The fiscal plan presents a path forward covering the term through FY20238 based on what isknown at this time. Key provisions detailed in the fiscal plan include:
µ Behind the meter, distributed generationµ System efficiency, reducing system lossesµ Reduce PREPA operating costs (i.e. labor costs and maintenance expenses which
were provided by PREPA and reflected in the analysis)µ Updated load outlook to account for post hurricane conditionsµ Rates anticipated and rate structure including the ongoing cost of debt service
obligationµ Privatization of generating assets
In the fiscal plan, PREPA reports improvements in its liquidity and expectation that it willreturn to cash flow neutrality in FY2019. Scenarios for post-transformation capital spendingand costs are presented. These will be refined and further updated with results of the IRP.
The IRP will be performed within the context of the relevant aspects of the FOMB certifiedFiscal Plan for PREPA and the PREPA Governing Board’s vision which is presented below.
PREPA Board Vision StatementNoting the need for an efficient and resilient system, on February 1, 2018, the PREPAGoverning Board released its vision statement to guide the future of the utility. This visionaddressed the reliability and resilience of the system, the transition to a sustainable system –both financially and environmentally sustainable – and its importance in acting as aneconomic growth engine for Puerto Rico. These elements are noted and factored into thestructuring of the IRP analysis, Scenarios and sensitivities, and inputs. The vision statementas approved is presented in Exhibit 2-2 below.
8 FY means Fiscal Year and, hence, FY2023 is the fiscal year starting July 1, 2022 and ending June 30, 2023

Planning Environment
2-10 Siemens Industry, Inc. – Siemens Power Technologies International
Exhibit 2-2. PREPA Vision for the Future of Power inPuerto Rico
Pillar Summary
System isCustomer-Centric
The system serves the customer with affordable, reliable power, with transparentmetrics for quality of service and with equitable consideration across all customers.Quality/Reliability can be differentiated for customers in a manner that serves theirtotal cost and risk objectives. Customers are engaged by innovative products andvalue-added services that provide choice among rate plan and risk managementoptions and provide access to wholesale contracting options for large customers.Customers are empowered with behind-the-meter alternatives for energy efficiency,demand management, and distributed generation, with the ability to becomeprosumers if they so choose.
SystemPromotesFinancialViability
The system is premised on positive economics on both sides of the meter. Rates arereasonable and create value for the customer, while pricing is sufficient to cover costs.Rate and market design create incentives to purchase, consume or produce energy ina manner that benefits the entire system. Subsidies are minimized, and those thatremain have a non-distortionary impact. Operational excellence and sound long termplanning reduce the cost to serve. Rates are affordable within a model that allows theutility to earn a reasonable rate of return and service its debt. The business model isrobust to changes such as outmigration and reduction in energy demand and doesnot create disincentives for adoption of cheaper energy resources, either at the gridlevel or at the customer premises.
System isReliable andResilient
The grid is thoughtfully planned, well maintained and safely operated to achievedefined reliability and resiliency goals. There is visibility into the system at all levels,and control where appropriate. Standards for recoverability create a measure forresilience. The choice of architecture (distributed vs. regionalized vs. centralized) isintentionally made to balance reliability/resilience and cost objectives while also takingadvantage of advancements in technology and innovation.
System is aModel ofSustainability
There is a progressive focus on diversifying energy resources and reducing thecarbon intensity of the power sector, in both primary generation and backupgeneration. Power generation is efficient and minimizes emissions. Customers haveincentives to use energy wisely and to generate their own clean energy. The grid andgrid systems are designed to take maximum advantage of increasingly cost effectiverenewable power generation alternatives and to integrate emerging technologies.
Systemserves as anEconomicGrowthEngine forPuerto Rico
The quality, reliability, and cost of power attracts new commercial and industrialdevelopment to Puerto Rico and encourages existing commercial and industrialcustomers to expand their operations. Transformation and reinvestment in the powersystem creates new jobs. Innovation in the generation and delivery of power creates alocal ecosystem of businesses that provide for evolving needs for equipment,technology and services in Puerto Rico and beyond.
Source: PREPA, 2018

Planning Environment
Siemens Industry, Inc. – Siemens Power Technologies International 2-11 2-11
PrivatizationThe Governor of Puerto Rico has publicly stated that the reconstruction and transformation ofthe electricity sector will include the privatization of PREPA’s generating facilities. This wouldinclude the generating assets and be complemented by the operation of the transmission anddistribution system by a third party. The Law to Transform the Electric System of Puerto Ricowas passed on June 12, 2018, becoming Act 120-2018. As a means to transform PuertoRico’s electric system into a modern and sustainable one, system ownership includinggenerating assets will be open to private entities. PREPA and Puerto Rico's Authority forPublic-Private Partnerships are to collaborate in the process to privatize assets. Finalagreements would need to be ratified by Puerto Rico's Legislature and the Governor.
Request for Proposals are to be issued for PREPA’s owned generating units. Bids will beevaluated on metrics that balance commercial interests and social responsibility as well asthe bidder’s interest and ability to transition to cleaner generating sources when reasonablypossible. The act also requires the PREB to sign off on the sales and regulate tariffs andother charges for electricity following the transactions. Under the act, the PREB has fifteendays to review and decide on the approval. Approved contracts would be issued an "energycompliance certificate". Finally, the act expands the PREB’s staff to facilitate timely decisions.
Based on the Act 120-2018 authorizing PREPA to sell its generating assets to more than oneprivate buyers, Siemens considered future builds to be financed by third parties, assumingPREPA obtains financial backing to contract as a credit-worthy counterparty if needed.

Siemens Industry, Inc. – Siemens Power Technologies International 3-1 3-1
Part
3Load ForecastThis Part covers Siemens load forecast methodology and results. The energy efficiency anddemand response complementary to this analysis are presented in Appendix 4.
Data, Assumptions and Methodology
Historical Energy SalesPREPA provided monthly historical energy sales for July 1999 – June 2018 (Fiscal Years2000 – 2008) divided into six customer classes: residential, commercial, industrial,agriculture, public lighting, and other. The commercial sector accounted for 47% of the totalsales in FY 2017, followed by residential at 38% and industrial at 13%. Overall, sales toresidential, commercial, and industrial customers represented 98% of total sales in FY 2017,the remaining 2% originated from the public lightning sector. These FY 2017 results aregenerally consistent with the results of recent historical years for sales by customer class.
Electricity sales in Puerto Rico declined by 18% since the 2008 recession and net migration.Starting in 2007 until 2017, Puerto Rico’s real gross national product (GNP) shrank byapproximately 17% and the population declined by over 15%9. For FY 2018, total energysales declined 22%, reflecting the disruption in the transmission and distribution networks dueto the hurricanes as well as customer billing delays10.
Industrial sales declined by 47% in FY 2007 to FY2017, while residential and commercialsales fell 12% and 10% respectively. Industrial share of the total energy sales declined from20% in FY 2007 to 13% in FY 2017. In contrast, the share of commercial sales increased by4 percentage points. Exhibit 3-1 shows historical energy sales for FY 2000 to FY2017 bycustomer class.
9 Based on data provided by the Financial Oversight & Management Board (FOMB)10 Based on preliminary data provided by PREPA

Load Forecast
3-2 Siemens Industry, Inc. – Siemens Power Technologies International
Exhibit 3-1. Historical PREPA Annual Sales byCustomer Class (GWh)
Source: PREPA
PREPA and Financial Oversight & Management Board (FOMB) provided historical data suchas population, gross national product (GNP), and weather. These data along with long-termprojections of GNP and population were leveraged to create a model and develop gross loadforecasts by customer class.
Load Forecast MethodologyThe load forecasting methodology employed customer-class specific, statistical andeconometric time-series models to develop forecasted monthly energy sales for the threelargest customer classes: residential, commercial and industrial. The gross energyconsumption forecast was developed using a Classical Linear Regression Model (CLRM) inwhich the dependent variable, energy sales, is expressed as a linear equation combining theindependent variables. For Puerto Rico, 15 variables were used including:
µ a weather variable (cooling degree days or CDD)µ two economic variables (population and GNP)µ 12 month specific dummy variables (one for each month of the year) to capture the
seasonality of energy demand on a monthly basis
Population was found not to have a statistical significance for industrial. Therefore,manufacturing employment was substituted for population as an independent variable in theregression analysis used to forecast industrial energy consumption.
The econometric model uses an ordinary least-squares regression technique and isdeveloped in MATLAB11. This basic approach is widely used to develop long-term load
11 MATLAB is a numerical computing environment and proprietary programming language developed byMathWorks

Load Forecast
Siemens Industry, Inc. – Siemens Power Technologies International 3-3 3-3
forecasts for independent system operators like PJM, the California Energy Commission andindividual utilities. Siemens used monthly historical data for FY 2000 through FY 2017 toestimate the regression coefficients applied to the forecast, with 210 observations for eachvariable.
The unique coefficients that are produced for each independent variable are used to developthe gross energy sale forecast. The 12 monthly dummy binary variables were included in theforecast formulation to capture monthly seasonality in demand. The sum product of thecoefficients and variables on a monthly basis result in the gross energy forecast equation isshown below:
= ∗ + ∗ … … … ∗ +
In the equation above, is the coefficient corresponding to each independent variable ,and b represents a constant.
The statistical significance and predicted fit of the model for residential, commercial, andindustrial classes was robust, with all three customer classes combined representingapproximately 98% of the total load, in line with historical values. Exhibit 3-2 illustrates thevariables used to develop the forecast for each of three largest classes.
Exhibit 3-2. Independent variables for Each Customer Classes
For the smaller customer classes (agriculture, lighting, and other) the overall fit of the CLRMmodel was weak with the economic and weather fundamental variables providing littleexplanatory value on the energy consumption for each class. For these customer classes,Siemens developed the forecast of energy consumption for these three classes based onhistorical seasonality and using a simple extrapolation technique with the expectation thateach class will follow similar growth rate as the overall system. This simpler forecast methodwas deemed acceptable since the three classes collectively represented approximately 2% ofthe total energy consumption.
Fundamental Drivers for the Load ForecastIn line with the econometric model, Siemens used population, GNP, CDD and the monthlydummy variables as explanatory variables to develop the load forecast by customer class forFY 2019–2038. Other economic data considered included disposable income, income per-capita, and the heat index for weather. However, these additional independent variables wereultimately not incorporated in the final forecast due to their high correlation to other variablesalready incorporated in the analysis such as CDD (highly correlated to the heat index) or theGNP (highly correlated to disposable income), which diluted their predictive value.

Load Forecast
3-4 Siemens Industry, Inc. – Siemens Power Technologies International
For weather data, Siemens found CDD as the most significant statistically variable to predictthe impact of weather on load, which is consistent with Puerto Rico having a tropical climaticzone with year-round warm temperatures averaging 80°F (27°C) in low elevation areas, and70°F (21°C) in the central mountains of the island. Although temperature variation is relativelymodest throughout the year, the overall heat level drives cooling load trends (demand for airconditioning). Weather data was sourced from the National Oceanic and AtmosphericAssociation (NOAA) for the San Juan station, as a representative for the overall islandtemperature and rainfall trends. Higher elevation locations were not found to have asignificant impact on overall load changes.
Customer rates were considered in the analysis, in particular industrial rates, but they werefound not to have a strong historic correlation to demand and explanatory power. From 2000to 2017, there were periods where industrial demand fell along with declining industrial ratesor the opposite. The expectation would be an inverse relationship with lower demand as aconsequence of rising industrial rates. The manufacturing sector in Puerto Rico, mostlycomprised of pharmaceutical, textiles, petrochemicals, and electronics; appears to be lessresponsive to changes in customer rates compared to other manufacturing industries such assteel or aluminum, which are highly sensitive (high elasticity). The residential sector istraditionally a sector with low response to changes in retail rates and to some extend thecommercial customers. However, sustained high retail rates could change customer behaviorand create more incentives for implementation of energy efficiency programs.
Siemens compiled and reviewed macroeconomic data (historical and forecasts) from severalsources including Moody’s Analytics, the International Monetary Fund, World Bank, the U.S.Census Bureau, Federal Reserve of Economic Data of St. Louis (FRED) and Puerto Rico’sFederal Management Oversight Board (FOMB), among others.
Exhibit 3-3 below shows the historical annual values for the independent variables used inthe regression analysis.

Load Forecast
Siemens Industry, Inc. – Siemens Power Technologies International 3-5 3-5
Exhibit 3-3. Historical Population, Macroeconomic, andWeather Variables
YearPopulation
(thousands)GNP
(Real Million US dollars)Cooling Degree Days
(Monthly Average)Manufacturing Employment
(thousands)
2000
2001200220032004
200520062007
2008200920102011
201220132014
201520162017
3,815
3,822 3,825 3,827 3,825
3,814 3,794 3,772
3,750 3,733 3,702 3,656
3,615 3,566 3,504
3,441 3,372 3,190
6,773
6,8736,8506,9917,178
7,3157,3517,262
7,0546,7846,5426,432
6,4666,4586,348
6,3126,2096,060
453
476477472461
478473489
467499491462
506496519
513506504
143
132121118118
115110106
101928784
827675
747472
Source: FOMB (GNP), Moody’s Analytics (Population), NOAA (weather), Federal ReserveBank of St. Louis Economic Data - FRED (Manufacturing Employment)
Before the hurricane, Puerto Rico’s economy was in structural decline, with GNP andpopulation falling by at least a percentage point a year since 2006, the last year when theGNP saw an increase. Puerto Rico’s GNP shrunk 8% in the decade after the GreatRecession with GNP reaching $6 billion dollars in 2017 (real dollars).
Population declined 15% since 2007 with Maria and Irma accounting for 4 percentage pointsof this decline in population (182 thousand people in 2017) due to the combined impact ofmigration and the death toll after the storm, estimated at over 4,100 people12.
Macroeconomic and Weather ProjectionsHistorical monthly NOAA data was utilized (2000-2016) to develop expected monthly CDDunder normal weather conditions. The expected normal weather conditions and itsassociated monthly CDD was used as a common basis for each year of the energy salesforecast. Exhibit 3-4 shows the normalized CDD used for the forecast.
12 Per a study from the Harvard T.H. Chan School of Public Health, published in New England Journal of Medicine,May 2018

Load Forecast
3-6 Siemens Industry, Inc. – Siemens Power Technologies International
Exhibit 3-4. Weather Variables
MonthCoolingDegree
Days (CDD)
JanuaryFebruary
MarchAprilMayJuneJuly
AugustSeptember
OctoberNovemberDecember
391361427454511547567572552552466427
Source: NOAA, Siemens
To be consistent with the FOMB, Siemens used their historical and forecasted data for GNPand population in 2019–2038. According to FOMB, the GNP is estimated to decline 13% forFY 2018, reflecting the impact of hurricanes Maria and Irma on the economy. However, GNPis projected to grow at 6.1% in FY 2019. FOMB forecast shows a relatively fast recovery fromMaria’s impact, driven by the effect of the Disaster Relief Fund spending program. In themedium-term GNP is projected to increase at 1.6% per-year in 2019-2027. After 2027, GNPgrowth is projected to soften to -0.3% per-year. The structural reforms are projected toenhanced economic growth, including a reform of the electrical grid, enhanced fiscaltransparency and a labor reform aimed to bring Puerto Rican labor law into closer alignmentwith U.S. law. An offset to economic growth is expected to come from the proposed fiscalconsolidation plan which could bring significant austerity over the next few years to reducePuerto Rico’s public debt.
Siemens considered other outlooks as well, including Moody’s Analytics (Moody’s) and theInternational Monetary Fund (IMF), as shown on Exhibit 3-5. Moody’s projects the GNP torecoup much of its hurricane-related losses and to remain relatively stable throughout theforecast horizon. The IMF shows a more pessimistic forecast through 2023 with GNP notrecovering from the aftermath of hurricane Maria through 2023.

Load Forecast
Siemens Industry, Inc. – Siemens Power Technologies International 3-7 3-7
Exhibit 3-5. Puerto Rico GNP Forecasts
Note: The forecast have been standardized for comparison purposes using theimplied growth rates. Moody’s GNP forecast is based on real 2009$ and the IMFbased on real 1954$.
Sources: Moody’s June 2018 Forecast, IMF April 2018 WEO, Financial Oversightand Managing Board of Puerto Rico, Fiscal Plan April 2018
The FOMB forecast for population shows a decline of 5.8% in FY2018 due to hurricanefatalities and net migration off the island. Over the study period, FOMB projects population todecline at 1.3% per year in 2019–2038. Population in Puerto Rico is projected to fall by over900 thousand people by 2038. Moody’s projects a faster pace of population loss over thenext decade, compared to FOMB, as the island gets increasingly dragged into a negativefeedback loop whereby out-migration undermines the tax base and the provision of publicservices (which deteriorated since Hurricane Maria), will engender more out-migration. TheU.S. Census (prior to Maria) projects higher population levels but still with a falling trendthrough the forecast. The IMF provides a forecast between the projections from FOMB andMoody’s.
Exhibit 3-6. Puerto Rico Population Forecast
Sources: Moody’s June 2018 Forecast, IMF April 2018 WEO, US Census Bureau August 2017

Load Forecast
3-8 Siemens Industry, Inc. – Siemens Power Technologies International
Exhibit 3-7 shows the long-term economic forecast used in the load forecast.
Exhibit 3-7. Macroeconomic Long Term Forecast
FiscalYear
Population(thousands of
people)
GNP(Real MillionsUS dollars)
ManufacturingEmployment(thousands of
people)2018201920202021
202220232024
2025202620272028202920302031203220332034
2035203620372038
3,143 3,104 3,084 3,039
2,995 2,951 2,910
2,871 2,833 2,794 2,756 2,718 2,681 2,644 2,609 2,575 2,541
2,508 2,476 2,445 2,414
5,2515,5735,6325,707
5,7925,8735,941
5,9916,0296,0416,0385,9845,9495,9225,8975,8775,862
5,8525,8475,8465,849
70697070
707071
71717272737374747575
76777778
Source: FOMB (population and GNP), Siemens for Manufacturing employment
Long Term Energy ForecastExhibit 3-8 shows Siemens forecasted gross energy sales by customer class. The forecastdoes not include any future energy efficiency and/or demand response programs anddistributed generation (DG) in addition to current programs in place. The impact of thoseprograms is addressed and modeled separately as discussed in later sections of thisdocument. The forecast includes the impact of naturally occurring energy efficiency savings,such as more efficient household appliances, in as much these efficiency savings areembedded in the historical energy consumption data used to create the forecast.

Load Forecast
Siemens Industry, Inc. – Siemens Power Technologies International 3-9 3-9
Exhibit 3-8. Gross Sales Demand by Customer Class
FiscalYear
ResidentialSales(GWh)
CommercialSales(GWh)
IndustrialSales(GWh)
AgriculturalSales(GWh)
PublicLightingSales(GWh)
OtherSales(GWh)
Total Sales(GWh)
20192020202120222023202420252026202720282029203020312032203320342035203620372038
5,4725,4805,4735,4735,4705,4645,4515,4315,3965,3535,2845,2235,1685,1155,0655,0204,9784,9404,9054,873
7,9627,9487,9177,8867,8567,8277,8017,7747,7477,7217,6957,6697,6447,6197,5967,5727,5497,5277,5067,484
1,4911,5511,6351,7301,8221,9001,9602,0082,0282,0321,9841,9561,9371,9211,9101,9051,9051,9111,9211,935
2626262627272727272626262626262525252525
315 316 317 318 320 320 321 321 320 319 316 313 311 309 307 306 304 303 302 302
35.6 35.8 35.9 36.0 36.2 36.3 36.3 36.3 36.2 36.1 35.7 35.5 35.2 35.0 34.8 34.6 34.5 34.3 34.2 34.1
15,301 15,357 15,403 15,470 15,530 15,574 15,595 15,596 15,554 15,487 15,341 15,223 15,120 15,025 14,939 14,862 14,796 14,741 14,694 14,654
CAGR -0.61% -0.32% 1.38% -0.23% -0.23% -0.23% -0.23%
Note: The sales forecasts reflect gross energy sales inclusive of existing EE programs. It does notinclude loses, PREPA’s own use and auxiliary demand neither any future incremental EE and/or demandresponse programs.
Gross energy sales are projected to increase by 15% in fiscal year 2019 due to the projected,near-term recovery in the economy. However, over the full 20-year study period, grossenergy sales are projected to decline at average of 0.23% per-year driven by the long-termdecline in population and softening of the GNP growth after 2027. Among customer classes,the industrial class is the only customer class projected to have a positive average growthover the study period, at an average of 1.4% per-year, primarily driven by the projectedeconomic growth through 2026. In contrast, the residential and commercial classes areprojected to decline by an average of 0.6% and 0.3% per-year, mostly driven by the long-term decline in population.
Agriculture, public lightning and “other” are projected to decline in line with the overall systemaverage of -0.23% per year. The public lighting forecast does not include the impact of a widespread replacement of the current metal-vapor-based public lightning with LED light bulbs.LED replacement and other energy efficiency programs are addressed in a separatedocument; however, at the end of this report, Siemens provides a summary of the effects ofenergy efficiency programs on the load forecast.
Exhibit 3-9 illustrates the gross energy demand inclusive of the generation auxiliary loads,technical and non-technical loses, and PREPA’s own use. The first column, gross energysales, reflects the totals from the exhibit above. PREPA’s own use is assumed to stayconstant through the forecast. The forecast includes no material change in the auxiliarygeneration load, and for modeling purposes is assumed to be constant until the plants retire.

Load Forecast
3-10 Siemens Industry, Inc. – Siemens Power Technologies International
However, in the portfolio Scenario analysis of the Integrated Resource Plan, futureretirements are incorporated into the forecast and their corresponding impact on demand.
Exhibit 3-9. Gross Energy Demand for Generation
FiscalYear
Gross EnergySales
(GWh)
TechnicalLosses
(GWh)
Non-TechnicalLosses
(GWh)
Auxiliary
(GWh)
PREPAOwn Use
(GWh)
Total EnergyDemand
(GWh)
2019
2020
2021
2022
2023
2024
2025
2026
2027
2028
2029
2030
2031
2032
2033
2034
2035
2036
2037
2038
15,301
15,357
15,403
15,470
15,530
15,574
15,595
15,596
15,554
15,487
15,341
15,223
15,120
15,025
14,939
14,862
14,796
14,741
14,694
14,654
1,438
1,444
1,448
1,454
1,460
1,464
1,466
1,466
1,462
1,456
1,442
1,431
1,421
1,412
1,404
1,397
1,391
1,386
1,381
1,377
827
830
832
836
839
841
842
843
840
837
829
822
817
812
807
803
799
796
794
792
751
751
751
751
751
751
751
751
751
751
751
751
751
751
751
751
751
751
751
751
34
34
34
34
34
34
34
34
34
34
34
34
34
34
34
34
34
34
34
34
18,351
18,415
18,469
18,545
18,613
18,665
18,689
18,690
18,642
18,565
18,397
18,261
18,144
18,034
17,935
17,848
17,772
17,708
17,654
17,608
CAGR -0.23% -0.23% -0.23% 0.00% 0.00% -0.22%
To assess the geographical location of the demand above, as necessary for the modeling ofthe system, PREPA provided the composition of the load in term of customer classes(residential, commercial, industrial, etc.) by County which was used to map the forecast toeach of the areas into which the system is modeled. Exhibit 3-10 and Exhibit 3-11 shows theresulting allocation of the Energy Demand for Generation above in tabular and graphic form.

Load Forecast
Siemens Industry, Inc. – Siemens Power Technologies International 3-11 3-11
Exhibit 3-10. Gross Energy Demand for Generation by Area
FiscalYear
ARECIBO(GWh)
BAYAMON(GWh)
CAGUAS (GWh)
CAROLINA (GWh)
MAYAGÜEZ(GWh)
PONCE ES(GWh)
PONCE OE(GWh)
SANJUAN(GWh)
AUX(GWh
)TOTAL(GWh)
2,019 1,748 2,558 2,818 1,956 1,961 719 1,422 4,417 751 18,3512,020 1,759 2,566 2,840 1,961 1,966 724 1,429 4,418 751 18,4152,021 1,771 2,571 2,866 1,965 1,969 729 1,436 4,411 751 18,4692,022 1,787 2,579 2,898 1,970 1,974 736 1,445 4,406 751 18,5452,023 1,801 2,585 2,927 1,975 1,978 742 1,453 4,401 751 18,6132,024 1,813 2,590 2,951 1,978 1,981 746 1,460 4,394 751 18,6652,025 1,820 2,591 2,968 1,979 1,981 750 1,464 4,385 751 18,6892,026 1,824 2,589 2,978 1,978 1,979 751 1,466 4,374 751 18,6902,027 1,821 2,581 2,975 1,971 1,972 750 1,462 4,357 751 18,6422,028 1,815 2,569 2,965 1,962 1,963 747 1,457 4,337 751 18,5652,029 1,794 2,544 2,930 1,945 1,945 739 1,442 4,307 751 18,3972,030 1,779 2,524 2,903 1,930 1,931 732 1,430 4,280 751 18,2612,031 1,766 2,506 2,882 1,917 1,918 727 1,420 4,256 751 18,1442,032 1,755 2,490 2,862 1,905 1,905 722 1,411 4,233 751 18,0342,033 1,744 2,475 2,845 1,894 1,894 717 1,403 4,211 751 17,9352,034 1,736 2,461 2,831 1,885 1,884 714 1,396 4,191 751 17,8482,035 1,728 2,449 2,820 1,876 1,875 710 1,390 4,172 751 17,7722,036 1,723 2,439 2,812 1,868 1,867 708 1,385 4,155 751 17,7082,037 1,719 2,430 2,806 1,862 1,860 706 1,381 4,139 751 17,6542,038 1,715 2,422 2,802 1,856 1,854 705 1,378 4,124 751 17,608
Exhibit 3-11. Graph of Gross Energy Demand for Generation byArea
Source: Siemens
The IRP Regulation issued by the PREB requires the load forecast evaluation include:
µ Comparisons of prior forecasts versus actual data
µ An explanation of the cause of any significant deviation between the prior forecastsand the actual annual peak demand and energy that occurred
µ An explanation of the impact that historical demand—side resources had on the priorload forecast.

Load Forecast
3-12 Siemens Industry, Inc. – Siemens Power Technologies International
Siemens believes the comparisons with actual data to recent forecasts have been renderedmeaningless by structural changes in the island population, economy and energyconsumption that have taken place as a result of Hurricane Maria. A more meaningfulcomparison is the significant changes resulting from Hurricane Maria to the forecasts. Exhibit3-12Illustrates the differences in the customer class level energy sales forecasts developedfor the 2015 IRP and the forecasts developed for this 2018 IRP. Exhibit 3-13 provides acomparison of the forecasted total energy sales from the 2015 IRP versus this 2018 IRP.
Exhibit 3-12: Comparison of 2015 versus 2018 IRP ForecastedClass-Level Energy Sales

Load Forecast
Siemens Industry, Inc. – Siemens Power Technologies International 3-13 3-13
Exhibit 3-13: Comparison of 2015 versus 2018 IRP ForecastedTotal Energy Sales
Long Term Peak Demand ForecastTo estimate the peak demand associated with the energy forecast the expected load factors(i.e. the ratio of average demand to the peak demand) for each customer class was assessedalong with the percentage of their peak demand that occurs at the time of the system peak(called Customer Class Coincidence Factor – CCCF – or Contribution to the Peak Factor). Inprinciple, these factors would ordinarily be determined monthly, consistent with the monthlydetail of the energy forecast and include an analysis of load factors and coincident factorsover multiple years. However, for this study, a single annual average load factor value wasused for each class due to the fact that: a) there was not a significant change in the hourlyload shapes for the relevant customer classes across the year, b) the load factor can bevolatile unless averages are used due to its dependence on the measured peak, c) only one-year worth of hourly load data by customer class was available. The inclusion of a stochasticdistribution of energy forecasts, discussed in later sections of this report, serves to drive alarge range of forecasted peak demand.
Exhibit 3-14 shows the normalized load shapes for the main customer classes (residential,commercial and industrial) that constitute the vast majority of the forecasted energyconsumption as well as the system total. As can be observed, unlike the mainland U.S.where there are large changes in the shape from summer to winter, the Puerto Rico loadshapes show little seasonal variation (residential shows the greatest variation). An averageannual load factor represents a reasonable method to represent each customer class. Exhibit3-14 also illustrates that there are two peaks a day, the first in the daytime hours driven bycommercial and industrial loads and the second an evening peak driven by the residentialload. The evening peak is the higher of the two daily peaks. Thus, the residential customerspeak coincides with the system peak (CCCF =1) while the industrial and commercialcustomers have a load below their respective class level peak loads at the time of the systempeak load (CCCF < 1).

Load Forecast
3-14 Siemens Industry, Inc. – Siemens Power Technologies International
Exhibit 3-14. Normalized Load Shapes for main CustomerClasses and System Total
Based on the hourly information provided by PREPA, Siemens estimated the CustomerClass Load Factors and Customer Class Coincidence Factors (% of the Customer Classpeak at the time of the System Peak) shown in Exhibit 3-15.
Exhibit 3-15. Selected Load Factors and Customer ClassCoincidence Factor
Customer ClassCustomer Class
Load FactorCustomer Class
CoincidenceFactor
% %Residential 66.9% 100%Commercial 70.2% 70%Industrial 81.2% 85%Lighting 49.3% 100%Other 73.6% 80%Agriculture 46.8% 32%

Load Forecast
Siemens Industry, Inc. – Siemens Power Technologies International 3-15 3-15
Using the values above and the forecasted energy consumption by customer class, thedemand at the time of system peak can be forecasted. To this forecast peak load thefollowing elements of load were added:
a) The effect of the technical transmission and distribution technical loses using acorrection to convert energy losses into capacity losses based on the load factor13.
b) The non-technical losses using same load factor and CCCF values as the residentialload.
c) PREPA’s own consumption using an estimated load factor based on historical values.d) The effects of the consumption on the generating plants auxiliary services.
Exhibit 3-16 shows the energy demand and peak demand for generation, inclusive of thefactors indicated above (technical and non-technical losses, auxiliary demand and PREPA’sown use). Exhibit 3-16 does not include the impact of future energy efficiency (EE), demandresponse programs or DG. It should be noted that while DG is modeled separately as asource, it does have an impact in reducing the T&D technical losses and this is accounted forin the final forecast together with the impacts of EE, as is discussed later in this report.Demand Response is a resource used to provide reserves and it does not affect the loadforecast.
Peak demand (before EE) is projected to decline by 0.24% per year. The lower rate of peakgrowth relative to the energy demand is a consequence of more modest growth in theresidential demand compared to commercial demand and the corresponding contribution ofeach class to system peak demand. Commercial load peaks during the day, while theresidential load peaks in the evening (sometimes very late), the latter driving the systempeak. A reduction in residential load results in a reduction in the evening peak and anincrease in the overall system load factor.
13 Capacity Losses % = (Energy Losses %) / (0.3+0.7*LF)

Load Forecast
3-16 Siemens Industry, Inc. – Siemens Power Technologies International
Exhibit 3-16. Gross Generation
FiscalYear
Energy (GWh)
Peak Demand LoadFactor
(%)(MW)
2019 18,353 2,791 75.1%2020 18,417 2,799 75.1%2021 18,471 2,805 75.2%2022 18,547 2,815 75.2%2023 18,615 2,823 75.3%2024 18,666 2,829 75.3%2025 18,691 2,831 75.3%2026 18,691 2,830 75.4%2027 18,644 2,822 75.4%2028 18,567 2,810 75.4%2029 18,399 2,785 75.4%2030 18,264 2,765 75.4%2031 18,146 2,748 75.4%2032 18,037 2,731 75.4%2033 17,938 2,716 75.4%2034 17,851 2,703 75.4%2035 17,775 2,692 75.4%2036 17,711 2,682 75.4%2037 17,657 2,673 75.4%2038 18,353 2,666 75.4%
CAGR -0.22% -0.24%
Note: Forecast includes technical and non-technical losses,auxiliary demand and PREPA’s own use. The forecast does notinclude the impact of future energy efficiency and/or demandresponse programs.
Stochastic DistributionTo generate Scenarios for energy growth, Siemens developed statistical distributions basedon deterministic energy forecasts. The process involves two steps: the first involvesdeveloping parametric distributions around key fundamental variables that could presentmore volatility in the future (weather and economic performance in Puerto Rico). Siemensutilized historical data to develop 2,000 Scenarios for weather and GNP that were fed into theeconometric regression model to determine 2,000 iterations of average and high energygrowth. The second step involves developing quantum distributions, which incorporate futureuncertainties not captured by the historical data. The overall process is summarized by theflow chart in Exhibit 3-17 below.

Load Forecast
Siemens Industry, Inc. – Siemens Power Technologies International 3-17 3-17
Exhibit 3-17. Stochastic Process for Energy Forecasts
Parametric DistributionsThe development of stochastics is based on building probability distributions around thedeterministic energy forecast. To produce probability distributions of the energy forecast,Siemens propagates three independent random paths: CDD, GNP, and a residual.
µ To produce reasonable weather data projections, Siemens sampled 17-years ofmonthly historical weather data based on CDD for 2000-2017.
µ GNP is assumed to follow a Geometric Brownian Motion. This means that thereexists a normal distribution with constant mean and variance that describes how theGNP could behave at any time in the future. The process is developed usinghistorical quarterly GNP data for 2000-2017.
µ Finally, to account for unexplained variation in the observed data, Siemens adds anormally distributed residual with mean zero and standard deviation equal to the rootmean squared error from a stepwise regression.
Based on historical volatility, 2,000 distributions of these variables are developed and used inthe stepwise regression model to develop an intermediate distribution of average and peakenergy forecast distributions.
Quantum Distribution: Additional VariabilityIt is Siemens’ opinion that future energy demand may differ substantially from past energydemand. To account for this possibility, Siemens adds an additional “Quantum Distribution” toits empirically derived distribution. The 5th percentile of this distribution reflects a low growthScenario (i.e. higher degree of DSM and DG penetration). The upper tail of this distribution(95th Percentile) is weighted to match Siemens’ analysis of historical high periods of energygrowth and to capture other events such as higher penetration of air conditioning loads andrising demand from electric vehicles. Using these high and low growth Scenarios, Siemensgenerates a distribution of energy forecasts using statistical techniques. This distribution issuperimposed on the parametric distribution obtained in the step discussed above. Theresulting distribution is considered the final average and peak energy forecast distribution(2,000 iterations).

Load Forecast
3-18 Siemens Industry, Inc. – Siemens Power Technologies International
Exhibit 3-18 shows an illustrative stochastic distribution of gross sales for planning purposes.
Exhibit 3-18. Stochastic Distribution of Gross Sales
Note: The sales forecasts reflect gross energy sales inclusive of existing EE programs. It does not includeloses, PREPA’s own use and auxiliary demand neither any future incremental EE and/or demand responseprograms.
The mean path corresponds to the average of 2,000 iterations of combinations of thestochastic input drivers. The percentile bands are not energy paths but instead represent thelikelihood that the sales could be at or below that level in a given year. For example, in 2025there is a 95% likelihood that energy sales will be at or below 18,885 MWh. Also, in 2025,there is a 5% chance that energy sales will be at or below 14,352 MWh.
Based on its assessment of the results of the stochastic distributions, Siemens chose to usethe 25th percentile as the low case and the 85th percentile as the high case for all Scenarios.In general, the 75th and the 25th percentile represent approximately one standard deviationabove and below the mean on a normal distribution. However, load tends to follow a lognormal distribution, which tends to have an upward bias. As result, Siemens considered thatusing the 85th percentile would be more reasonable for the high case.
The 85th and 25th percentiles do not represent extreme cases either but a reasonable highand low forecast for planning purposes. The extreme high and low would typically be definedby the 95th percentile and 5th percentile, respectively.
To describe the factors that could give rise to the extreme high and low forecastsmathematically obtained above, Siemens developed and very optimistic Scenario and a verypessimistic Scenario for the macroeconomic parameters driving the forecast: GNP andpopulation.
The very optimistic case assumes that the structural reforms in Puerto Rico are highlysuccessful and the GNP after hitting a low in 2018 bounces back at a rate 50% faster thanMoody’s forecast for two years as federal funds are invested in the island. From 2020onwards, the Puerto Rico economy recovers to its pre-2006 potential and the GNP grows at75% of the US GNP forecast growth rate – see Exhibit 3-19. Consistent with this economic

Load Forecast
Siemens Industry, Inc. – Siemens Power Technologies International 3-19 3-19
outlook, there is initially a population drop following the U.S. Census forecast until 2019 andfrom 2020 onwards, as the Puerto Rico economy starts to grow, the population outflowreduces to only 25% of the yearly attrition in the U.S. Census forecast – see Exhibit 3-20.
The very pessimistic case, assumes that the structural reforms do not take place and there islimited federal funds invested in the island, resulting in a continuation of the GNP decline at1% per year in line with the historical post 2006 decline. Consistent with this outlook thepopulation decline accelerates and after an initial drop in line with FOMB forecasts, from 2019onwards it declines at 1.5 times yearly attrition in this forecast.
Exhibit 3-19. GNP Scenarios
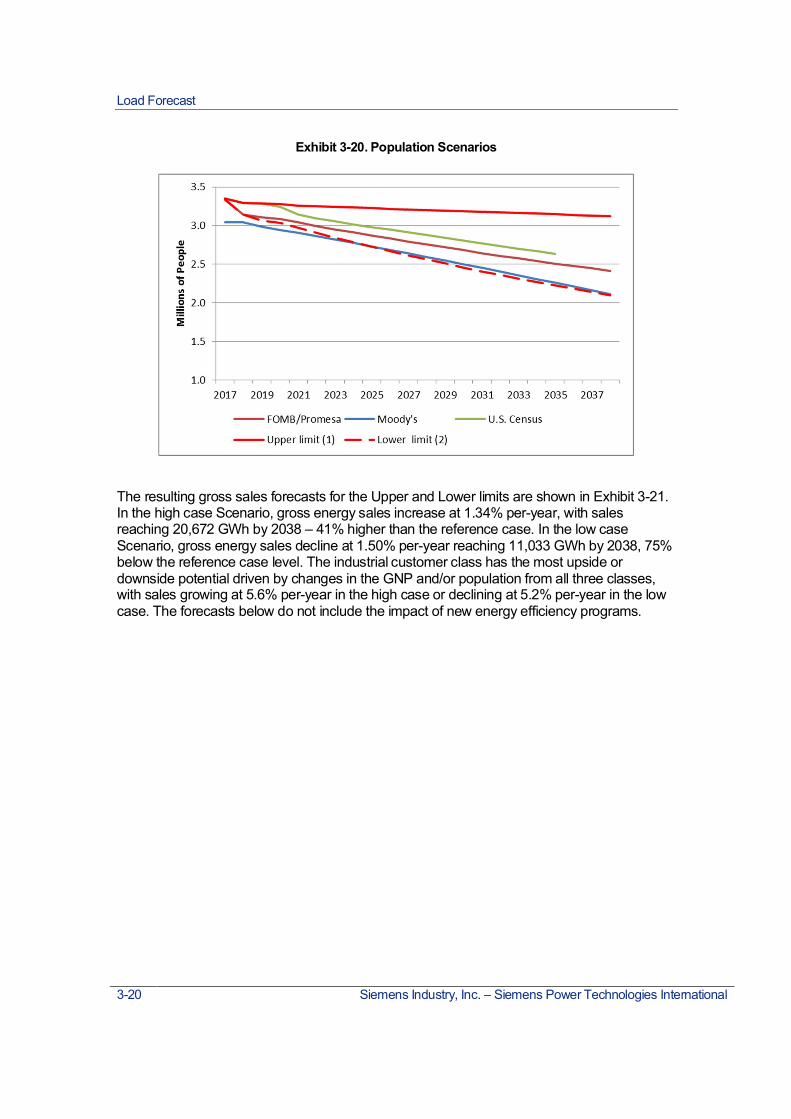
Load Forecast
3-20 Siemens Industry, Inc. – Siemens Power Technologies International
Exhibit 3-20. Population Scenarios
The resulting gross sales forecasts for the Upper and Lower limits are shown in Exhibit 3-21.In the high case Scenario, gross energy sales increase at 1.34% per-year, with salesreaching 20,672 GWh by 2038 – 41% higher than the reference case. In the low caseScenario, gross energy sales decline at 1.50% per-year reaching 11,033 GWh by 2038, 75%below the reference case level. The industrial customer class has the most upside ordownside potential driven by changes in the GNP and/or population from all three classes,with sales growing at 5.6% per-year in the high case or declining at 5.2% per-year in the lowcase. The forecasts below do not include the impact of new energy efficiency programs.

Load Forecast
Siemens Industry, Inc. – Siemens Power Technologies International 3-21 3-21
Exhibit 3-21. Gross Sales Forecast Scenarios – High and Low Cases
Fiscal YearGross Energy Sales
Reference (GWh)
Gross Energy SalesVery Optimistic
(GWh)
Gross Energy SalesVery Pessimistic
(GWh)
Gross EnergySales
High Case(GWh)
Gross EnergySales
Low Case(GWh)
20192020202120222023202420252026202720282029203020312032203320342035203620372038
15,30115,35715,40315,47015,53015,57415,59515,59615,55415,48715,34115,22315,12015,02514,93914,86214,79614,74114,69414,654
16,043 17,400 17,869 17,976 18,102 18,239 18,385 18,540 18,699 18,863 19,030 19,200 19,372 19,547 19,725 19,906 20,091 20,280 20,474 20,672
14,703 14,470 14,257 14,015 13,776 13,545 13,325 13,112 12,901 12,695 12,498 12,304 12,118 11,939 11,765 11,597 11,439 11,295 11,160 11,033
15,670 16,001 16,166 16,358 16,730 16,642 16,755 17,024 17,136 17,114 16,998 16,939 16,932 17,078 17,235 16,923 17,113 16,976 17,270 16,719
14,844 14,811 14,636 14,596 14,588 14,514 14,352 14,292 14,148 13,989 13,831 13,740 13,664 13,690 13,702 13,582 13,435 13,476 13,390 13,323
CAGR -0.23% 1.34% -1.50% 0.34% -0.57%

Existing Resources
Siemens Industry, Inc. – Siemens Power Technologies International 4-1 4-1
Part
4Existing Resources
Existing Generation Resources and Distributed GenerationSiemens reviewed cost and technical characteristics and operating status on PREPA’s existinggeneration resources and Power Purchase and Operating Agreements (PPOAs) as inputs to theIRP. The thermal supply-side resources section of this report (Appendix 5 – New and ExistingSupply-Side Resources Supplemental Data) includes a review of the operating characteristics of thegeneration units along with their operating costs.
On the other hand, Part 6 – New Resources Options of this report presents the new resourcesconsidered in the IRP and Appendix 4 – Demand Side Resources presents a discussion of thedemand side resources including distributed generation, energy efficiency, demand response, andCHP (Combined Heat and Power).
PREPA’s Existing Generation FacilitiesSiemens reviewed and discussed PREPA’s existing generation resources, including the units’condition and operating status, with PREPA’s staff. As a result of this review, 39 existing generationunits, with a total capacity of 5,010 MW, were determined to be in acceptable operating condition forconsideration as available resources in this IRP.
Exhibit 4-1 presents the operational parameters including technology (i.e., steam turbine [ST], simplecycle combustion turbines, referenced as gas turbines per PREPA conventions [GT], and combinedcycle gas turbine [CC]), rated capacity14, fuel type, heat rate, fixed operating and maintenance costs(FOM), and variable operating and maintenance costs (VOM) of the existing generation resources in2018 dollars.
14 The maximum capacities considered in the study are based on information provided by PREPA. These capacities aresmaller than the nominal capacities in the case of San Juan 5 and 6 CC (nominal capacity of 220 MW each), Aguirre CC 1and 2 (nominal capacity of 296 MW each), Mayagüez GT (nominal capacity of 55 MW each), and the hydro generation(nominal capacity of 105 MW). The total nominal capacity of existing PREPA generation resources is 5,213 MW.

Existing Resources
4-2 Siemens Industry, Inc. – Siemens Power Technologies International
Exhibit 4-1. PREPA Existing Units Included in the IRP
Source: PREPA, Siemens.
Note: while San Juan 7 & 8 are included in the model, and 9 & 10 were not, from a modeling perspective they are fully interchangeable. IfPREPA determines that San Juan 9 is more reliable than one of the other units, it may be substituted without impacting model results.
It was jointly decided that 11 existing generation units, with a total capacity of 707 MW, were not insufficient operational condition for inclusion as a generation resource in this IRP. A summary of theexcluded units is shown below:
Generation Units
MaximumModeledCapacity
(MW)
FuelHeat Rate at
Max. Capacity(BTU/kWh)
FOM(2018 $/kW-year)
VOM(2018 $/MWh)
Aguirre 1 ST 450 No. 6 fuel oil 9,600 32.04 2.25Aguirre 2 ST 450 No. 6 fuel oil 9,700 32.04 2.25Costa Sur 5 ST 410 Natural gas 9,747 35.96 2.72Costa Sur 6 ST 410 Natural gas 9,747 35.96 2.72Palo Seco 3 ST 216 No. 6 fuel oil 9,725 46.47 4.95Palo Seco 4 ST 216 No. 6 fuel oil 9,725 46.47 4.95San Juan 7 ST 100 No. 6 fuel oil 10,497 49.02 2.93San Juan 8 ST 100 No. 6 fuel oil 10,445 49.02 2.93Aguirre 1 CC 260 Diesel 11,140 22.64 6.79Aguirre 2 CC 260 Diesel 11,140 22.64 6.79San Juan 5 CC 200 Diesel 7,625 27.40 2.22San Juan 6 CC 200 Diesel 7,853 27.40 2.22Cambalache 2 GT 83 Diesel 11,549 24.44 5.52Cambalache 3 GT 83 Diesel 11,549 24.44 5.52Mayagüez 1 GT 50 Diesel 9,320 10.64 6.40Mayagüez 2 GT 50 Diesel 9,320 10.64 6.40Mayagüez 3 GT 50 Diesel 9,320 10.64 6.40Mayagüez 4 GT 50 Diesel 9,320 10.64 6.40Daguao 2 GTs 42 Diesel 14,400 26.54 20.19Palo Seco GT11 & GT12 42 Diesel 14,400 26.54 20.19Palo Seco GT21 & GT 22 42 Diesel 14,400 26.54 20.19Palo Seco GT31 & GT32 42 Diesel 14,400 26.54 20.19Aguirre GT21 & GT22 42 Diesel 14,400 26.54 20.19Costa Sur GT11 & GT12 42 Diesel 14,400 26.54 20.19Jobos GT11 & GT12 42 Diesel 14,400 26.54 20.19Yabucoa GT11 & GT12 42 Diesel 14,400 26.54 20.19Vega Baja GT11 & GT12 42 Diesel 14,400 26.54 20.19
Hydro Hydro 34 Water N/A N/A N/AAES Coal 2 Units 454 Coal 9,791 79.46 7.23EcoEléctrica Plant 507 Natural gas 7,497 189.34 0.00
5,010
MATS Affected Units
IPP Units
Combined Cycle
Total
GasTurbine
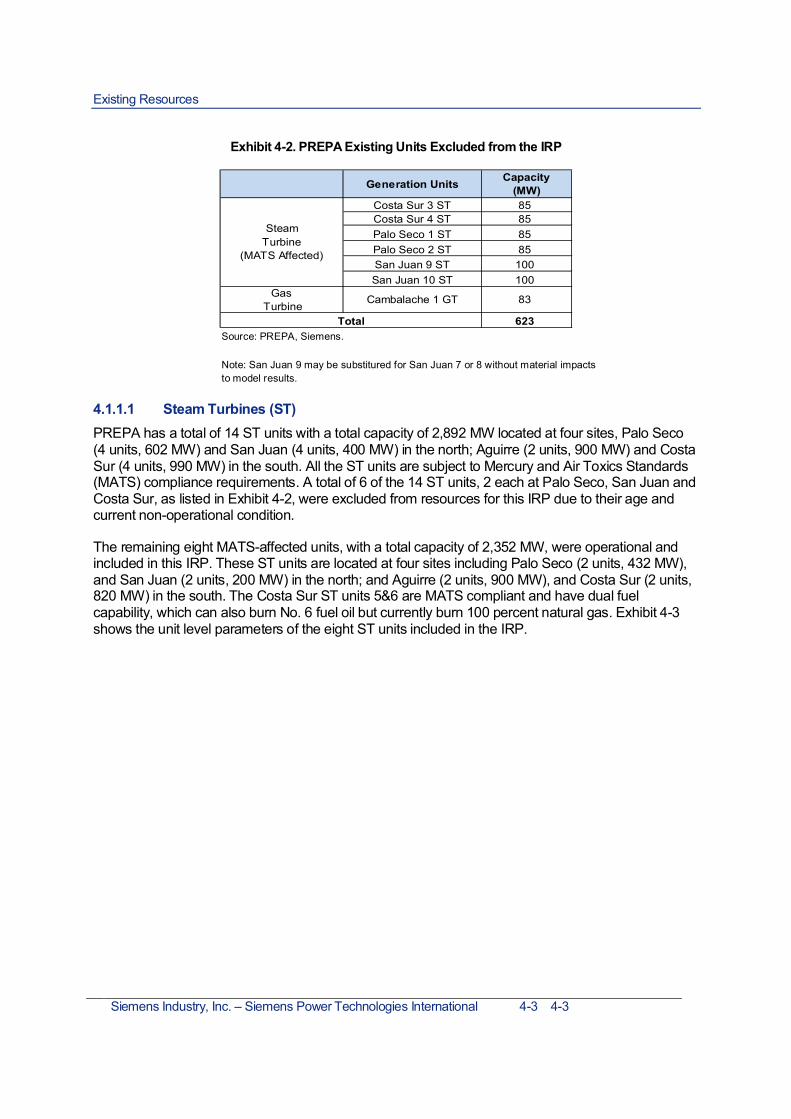
Existing Resources
Siemens Industry, Inc. – Siemens Power Technologies International 4-3 4-3
Exhibit 4-2. PREPA Existing Units Excluded from the IRP
Source: PREPA, Siemens.
Note: San Juan 9 may be substitured for San Juan 7 or 8 without material impactsto model results.
4.1.1.1 Steam Turbines (ST)PREPA has a total of 14 ST units with a total capacity of 2,892 MW located at four sites, Palo Seco(4 units, 602 MW) and San Juan (4 units, 400 MW) in the north; Aguirre (2 units, 900 MW) and CostaSur (4 units, 990 MW) in the south. All the ST units are subject to Mercury and Air Toxics Standards(MATS) compliance requirements. A total of 6 of the 14 ST units, 2 each at Palo Seco, San Juan andCosta Sur, as listed in Exhibit 4-2, were excluded from resources for this IRP due to their age andcurrent non-operational condition.
The remaining eight MATS-affected units, with a total capacity of 2,352 MW, were operational andincluded in this IRP. These ST units are located at four sites including Palo Seco (2 units, 432 MW),and San Juan (2 units, 200 MW) in the north; and Aguirre (2 units, 900 MW), and Costa Sur (2 units,820 MW) in the south. The Costa Sur ST units 5&6 are MATS compliant and have dual fuelcapability, which can also burn No. 6 fuel oil but currently burn 100 percent natural gas. Exhibit 4-3shows the unit level parameters of the eight ST units included in the IRP.
Generation Units Capacity(MW)
Costa Sur 3 ST 85Costa Sur 4 ST 85Palo Seco 1 ST 85Palo Seco 2 ST 85San Juan 9 ST 100San Juan 10 ST 100
Gas Turbine Cambalache 1 GT 83
623Total
SteamTurbine
(MATS Affected)

Existing Resources
4-4 Siemens Industry, Inc. – Siemens Power Technologies International
Exhibit 4-3. ST Unit Parameters (Aguirre, Costa Sur, Palo Seco, San Juan)
Note: Aguirre ST and Costa Sur ST units have an emergency minimum capacity of 150 MW and 100 MWrespectively.Source: PREPA, Siemens.
The minimum capacity levels correspond to the minimum output that would still allow the units toreturn to a regulating operating mode within the hour, according to PREPA operations. There arelower capacity levels (e.g. Costa Sur ST 5&6 at 100 MW and Aguirre ST 1&2 at 150 MW), but theselower capacities would require multiple hours for the units to return to regulating operating mode.
The minimum run time reported was defined by PREPA’s operations team to prevent the units fromweekly cycling as was observed in prior studies that included high levels of renewable penetration.
The reported heat rates correspond to the values currently used in PREPA’s models, adjusted ifnecessary for the reduced operating limits. These heat rates are reasonable for the technologiesconsidered and are the best information available at this time.
For the forced outage assumption, Siemens reviewed the reported forced outage statistics for eachunit from 2011 to October 2016 (reported Forced Outage Factor), in addition to the forced outagerate (FOR) currently used in PREPA’s models and the recent experience with the units.
Unit 1 Unit 2 Unit 5 Unit 6
Fuel Type No. 6 fuel oil No. 6 fuel oil Natural Gas Natural Gas
Maximum Capacity MW450 450 410 410
Minimum Capacity MW 200 200 180 180
Fixed O&M Expense 2018 $/kW-year 32.04 32.04 35.96 35.96
Variable O&M Expense 2018 $/MWh 2.25 2.25 2.72 2.72
Heat Rate at Maximum Capacity MMBtu/MWh 9.60 9.70 9.75 9.75Heat Rate at Minimum Capacity MMBtu/MWh 9.94 10.16 9.93 10.07Forced Outage % 20 20 2 4Minimum Downtime Hours 48 48 48 48Minimum Runtime Hours 720 720 720 720Ramp Up Rate MW/minute 5 5 5 5Ramp Down Rate MW/minute 5 5 5 5
Unit 3 Unit 4 Unit 7 Unit 8
Fuel Type No. 6 fuel oil No. 6 fuel oil No. 6 fuel oil No. 6 fuel oil
Maximum Capacity MW 216 216 100 100
Minimum Capacity MW 130 130 70 70
Fixed O&M Expense 2018 $/kW-year 46.47 46.47 49.02 49.02
Variable O&M Expense 2018 $/MWh 4.95 4.95 2.93 2.93Heat Rate at Maximum Capacity MMBtu/MWh 9.73 9.73 10.50 10.45Heat Rate at Minimum Capacity MMBtu/MWh 10.35 10.35 10.50 10.50Forced Outage % 42 42 15 15Minimum Downtime Hours 48 48 48 48Minimum Runtime Hours 720 720 720 720Ramp Up Rate MW/minute 3 3 3 3Ramp Down Rate MW/minute 3 3 3 3
Parameters Unit Aguirre ST Costa Sur ST
Parameters UnitPalo Seco ST San Juan ST

Existing Resources
Siemens Industry, Inc. – Siemens Power Technologies International 4-5 4-5
Siemens increased the outage rate of Aguirre ST 1&2 from 4 percent in PREPA’s existing models to20 percent based on both the increase in forced outages experienced during 2010-2016 and theoverall unit’s condition. Costa Sur ST 5 was left unchanged at 2 percent and Costa Sur ST 6 wasincreased slightly from 3 percent to 4 percent. Costa Sur units 5&6 are expected to be thoroughlyinspected and repaired.
Palo Seco ST units 3and 4 have had fairly poor performance and Siemens increased the FOR to42% to be conservative and in line with the 45% availability observed. Finally, San Juan ST 7&8outage rates were modeled at 15% to reflect 70% observed availability.
Based on discussions with PREPA staff, Siemens excluded Costa Sur ST 3&4, Palo Seco ST 1&2and San Juan ST 9&10 with a total of 540 MW from the IRP study, because these units are not inacceptable operating condition, are not in MATS compliance, and would require large investmentsthat do not appear to be economic, to achieve MATS compliance and working condition.
4.1.1.2 Combined Cycles Gas Turbine (CCGT)PREPA’s four Combined Cycle Gas Turbine (CCGT) units run on diesel. These units include Aguirre1&2 CC (260 MW each) and San Juan 5&6 CC (200 MW each) with a total capacity of 920 MW. TheAguirre CCGT units went into commercial operation in 1975-1976 and are inefficient with very lowhistorical dispatch levels. The nominal capacity of these units is 296 MW each, but this has beenlimited to 260 MW in this study15. These units can be economically retired in the IRP, however beforethe entry of a new CCGT in the south they do provide support in the case of MiniGrid isolatedoperations, when the load in the system could be too small for larger units like AES Coal orEcoEléctrica (in combine cycle mode) to be dispatched.
San Juan 5&6 CCGT units (also known as the San Juan Repower) began commercial operation in2008 have a heat rate of 7,625 Btu/kWh and 7,853 Btu/kWh, respectively. These units serve as animportant generation resource operating in the north of the island. Their nominal capacity is 220 MWper unit, but this is limited to 200 MW in this study.
Exhibit 4-4 shows the unit level parameters of the four CCGT units included in the IRP. The heatrates correspond to the modeled values and it is important to note that these units should preferablybe able to cycle daily if necessary to integrate renewable generation. However, as shown belowPREPA has determined that the current minimum run time is 120 hours (5 days) which would allowthese units to cycle weekly and be off only during the weekends.
The historical outage factors (2010 to 2016) for the Aguirre CC show values on the order of 2 percentfor the Aguirre CC Unit 1 and 10 percent for Aguirre CC Unit 2, possibly due to its relatively lowdispatch. However, the outage factor for these units was left at 20 percent considering their recentperformance, as Siemens noted that Aguirre CCGT unit 2 had fairly poor performance with 33percent steam turbine outage in 2015 and 20 percent outage in 2016. For San Juan CC, history hasshown relatively poor availability in both units but better than the prior modeled 20 percent for SanJuan unit 5 and worse for San Juan unit 6 (10 percent used in prior modeling). Thus, both units aremodeled in this IRP at 18 percent forced outage rate, in line with the historical values.
15 The maximum capacities considered in the study are based on information provided by PREPA.

Existing Resources
4-6 Siemens Industry, Inc. – Siemens Power Technologies International
Exhibit 4-4. CC Units Parameters (Aguirre and San Juan)
Source: PREPA, Siemens.
4.1.1.3 Gas TurbinesOut of the 25 GT units, 24 units, with a total capacity of 743 MW, are included in the IRP. The GTsinclude Cambalache GT 2&3 (82.5 MW each), Mayagüez GT 1 through 4 (50 MW each), and ninepairs of distributed GTs (21 MW each) spread across the island. The Mayagüez units are four aero-derivative gas turbines with relatively good efficiency. The distributed GT’s (21 MW each) includepairs of two units located: Daguao (2x21), Palo Seco (6x21), Aguirre (2x21), Costa Sur (2x21), Jobos(2x21), Yabucoa (2x21), and Vega Baja (2x21). These nine pair of distributed units, while in operatingcondition, are fairly old and have very poor heat rates. Fourteen of these units are retired early in theIRP capacity expansion plan and replaced by new peakers.
Based on discussions with PREPA staff, Cambalache GT 1 will be excluded from the IRP because itis not planned to be returned to operating condition in the foreseeable future. The two 21 MW GTs atAguirre and two 21 MW GTs at Costa Sur are necessary to provide black-start capability to theirrespective combined cycle and steam turbine at each location. These gas turbines can only beretired after new units are installed with black-start capability.
Exhibit 4-5 shows the unit level parameters of the 24 GT units considered in the IRP. The heat ratesand forced outages are as modeled in the PREPA’s models. The distributed GTs and the Mayagüezunits can cycle with zero downtime and runtime.
Unit 1 Unit 2 Unit 5 Unit 6Fuel Type Diesel Diesel Diesel DieselMaximum Capacity MW 260 260 200 200Minimum Capacity MW 46 46 155 155Fixed O&M Expense 2018 $/kW-year 22.64 22.64 27.40 27.40Variable O&M Expense 2018 $/MWh 6.79 6.79 2.22 2.22Heat Rate at Maximum Capacity MMBtu/MWh 11.14 11.14 7.63 7.85Heat Rate at Minimum Capacity MMBtu/MWh 11.42 11.42 8.46 8.86Forced Outage % 20 20 18 18Minimum Downtime Hours 0 0 48 48Minimum Runtime Hours 2 2 120 120Ramp Up Rate MW/minute 5 5 3 3Ramp Down Rate MW/minute 5 5 3 3
Aguirre CCParameters Unit
San Juan CC

Existing Resources
Siemens Industry, Inc. – Siemens Power Technologies International 4-7 4-7
Exhibit 4-5. GT Units Parameters (Cambalache, Mayagüez and NinePairs of Distributed GT units)
Source: PREPA, Siemens.
4.1.1.4 HydroPREPA has 21 hydroelectric generating units at 11 generating facilities for a total installed nameplatecapacity of 105 MW. However, some of these units are not operational, or are underutilized due tostaffing and funding shortages resulting in deferred maintenance issues. The operational units total34 MW with a capacity factor of less than 20 percent as of the first quarter of 2018. In an effort toalternative methods that could economically increase the output and continuing operation from theseclean hydroelectric resources, PREPA issued a Request for Proposal (RFP) regarding long-termlease and energy sales agreement for their hydroelectric power plants16. Exhibit 4-6 shows aScenario to increase hydroelectric contribution to 70 MW, assuming a high-level estimate of a total of$100 million investment through 2023. This value of 70 MW should be considered a possibleoutcome of a refurbishing project, like the one considered, but larger values are possible.
16 REQUEST FOR PROPOSALS: Long-Term Lease and Energy Sales Agreement(s) for Hydroelectric Power Plants Ownedby: Puerto Rico Electric Power Authority
GT UnitsUnit 2 Unit 3 Each Unit
Fuel Type Diesel Diesel DieselMaximum Capacity MW 83 83 21Minimum Capacity MW 50 50 21Fixed O&M Expense 2018 $/kW-year 24.44 24.44 26.54Variable O&M Expense 2018 $/MWh 5.52 5.52 20.19Heat Rate at Maximum Capacity MMBtu/MWh 11.55 11.55 14.40Heat Rate at Minimum Capacity MMBtu/MWh 11.55 11.55 14.40Forced Outage % 10.0 10.0 15Minimum Downtime Hours 7 7 0Minimum Runtime Hours 7 7 0Ramp Up Rate MW/minute 2 2 2Ramp Down Rate MW/minute 2 2 2
Unit 1 Unit 2 Unit 3 Unit 4Fuel Type Diesel Diesel Diesel DieselMaximum Capacity MW 50 50 50 50Minimum Capacity MW 25 25 25 25Fixed O&M Expense 2018 $/kW-year 10.64 10.64 10.64 10.64Variable O&M Expense 2018 $/MWh 6.40 6.40 6.40 6.40Heat Rate at Maximum Capacity MMBtu/MWh 9.32 9.32 9.32 9.32Heat Rate at Minimum Capacity MMBtu/MWh 11.20 11.20 11.20 11.20Forced Outage % 9 9 9 9Minimum Downtime Hours 0 0 0 0Minimum Runtime Hours 0 0 0 0Ramp Up Rate MW/minute 6 6 6 6Ramp Down Rate MW/minute 6 6 6 6
Parameters Unit Cambalache CT
Parameters Unit Mayagüez CT

Existing Resources
4-8 Siemens Industry, Inc. – Siemens Power Technologies International
Exhibit 4-6. PREPA Operational Hydro Capacity Assumptions
Year 2019 2020 2021 2022 2023
Capacity (MW) 34 50 70 70 70
Availability Factor 20% 40% 60% 80% 90%
Capacity Factor 15% 25% 28% 28% 28%
Annual Generation GWh 44,676 109,500 171,696 171,696 171,696Source: PREPA, Siemens.
4.1.1.5 EcoEléctrica and AES PPOAsTo supplement its own capacity, PREPA purchases power from two co-generators under the termsand conditions of PPOAs, including 507 MW natural gas-fired combined cycle plant fromEcoEléctrica, L.P. and 454 MW coal-fired steam electric cogeneration station from AES. The 961MW of capacity provided by the two co-generators brings the total capacity available to PREPA to5,011 MW17.
In accordance with a 22-year PPOA that commenced in March 2000, each calendar yearEcoEléctrica fixes the fuel cost per million BTU for the first 76 percent of the station’s capacity for thatyear. For capacity in excess of 76 percent, PREPA has been charged a price based upon a spot18
fuel price set by EcoEléctrica at the time the excess capacity was dispatched. The EcoEléctricacontract has a target availability factor of 93 percent, with associated capacity payments. Based ondiscussions with PREPA, a renewal of EcoEléctrica PPOA will be assumed in the base Scenarios ofthe IRP; however, the plant is subject to economic retirement, if so decided by the least cost plan. Areduction on the fixed payments is assumed after 2022.
AES’s coal-fired steam electric cogeneration station began commercial operation in November 2002.The owners of the facility have entered into a PPOA with the PREPA to provide 454 MW of power fora period of 25 years. Based on discussions with PREPA, the base Scenarios of the IRP will notassume a renewal of the AES PPOA, because this is a highly probable Scenario due to the PuertoRico Legislature consideration of stating a very strong public policy against the disposal of coal ash inlocal landfills.
The operational and cost parameters of the two PPOA plants are shown in Exhibit 4-7.
17 This value corresponds to the sum of the maximum capacities considered in this study and includes the GTs and 34 MWof hydro units.18 This “spot price” is not directly related to the spot price of fuels in the market.

Existing Resources
Siemens Industry, Inc. – Siemens Power Technologies International 4-9 4-9
Exhibit 4-7. EcoEléctrica and AES Operational Parameters
Source: PREPA, Siemens.
Utility Scale Renewable PPOAsThis section includes a summary of the projects that were considered for modeling of the renewablegenerators. Between 2008 and 2012, PREPA signed 68 renewable PPOAs. As of December 2018,58 PPOAs remained in effect with a total capacity of 1,480.6 MW, out of which 11 contracts are inoperation.
4.1.2.1 PPOAs in Commercial Operation or in Pre-OperationAs of December 2018, 11 PPOAs are in either commercial operation or in pre-operation (energized,under testing, and selling energy and renewable energy credits to PREPA). These projects represent272.9 MW of capacity, including 147.1 MW of solar photovoltaic (PV), 121 MW of wind, and 4.8 MWof landfill gas.
EcoEléctrica CCUnit 1 Unit 1 Unit 2
Fuel Type Natural Gas Coal CoalMaximum Capacity MW 507 227 227Minimum Capacity MW 275 166 166Fixed O&M Expense 2018 $/kW-year 162.05 77.96 77.96Variable O&M Expense 2018 $/MWh 0.00 7.09 7.09Capital Costs 2018 $(000) 124,226 121,499 121,499Heat Rate at Maximum Capacity MMBtu/MWh 7.50 9.79 9.79Heat Rate at Minimum Capacity MMBtu/MWh 8.31 9.93 9.93Forced Outage % 2 3 3Minimum Downtime Hours 8 48 48Minimum Runtime Hours 168 720 720Ramp Up Rate MW/minute 10 0 0Ramp Down Rate MW/minute 10 0 0
Parameters Unit AES Coal Plant
Fixed O&M Costs(Nominal $/kW)
Variable O&M Costs(Nominal $/MWh)
Capital Costs(Nominal $000)
Fixed O&M Costs(Nominal $/kW)
Variable O&MCosts (Nominal
$/MWh)
Capital Costs(Nominal $000)
2018 77.96 7.09 121,499 162.05 0.00 124,2262019 79.83 7.26 122,916 166.40 0.00 109,6212020 81.75 7.43 122,991 170.84 0.00 120,9622021 83.71 7.61 108,311 194.28 0.00 140,9892022 85.72 7.79 94,026 198.95 0.00 143,8082023 87.78 7.98 83,779 203.72 0.00 146,6852024 89.88 8.17 74,127 208.61 0.00 149,6182025 92.04 8.37 74,865 213.62 0.00 152,6112026 94.25 8.57 75,627 218.75 0.00 155,6632027 96.51 8.78 76,390 224.00 0.00 158,7762028 98.83 8.99 77,159 229.37 0.00 161,9522029 101.20 9.20 77,934 234.88 0.00 165,1912030 103.63 9.42 78,714 240.51 0.00 168,4952031 106.11 9.65 79,502 246.29 0.00 171,8642032 108.66 9.88 80,298 252.20 0.00 175,3022033 111.27 10.12 81,103 258.25 0.00 178,8082034 113.94 10.36 81,915 264.45 0.00 182,3842035 116.67 10.61 82,735 270.79 0.00 186,0322036 119.47 10.86 83,564 277.29 0.00 189,7522037 122.34 11.12 84,400 283.95 0.00 193,5472038 122.34 11.12 84,400 283.95 0.00 193,547
YearAES Coal Plant EcoEléctrica CC
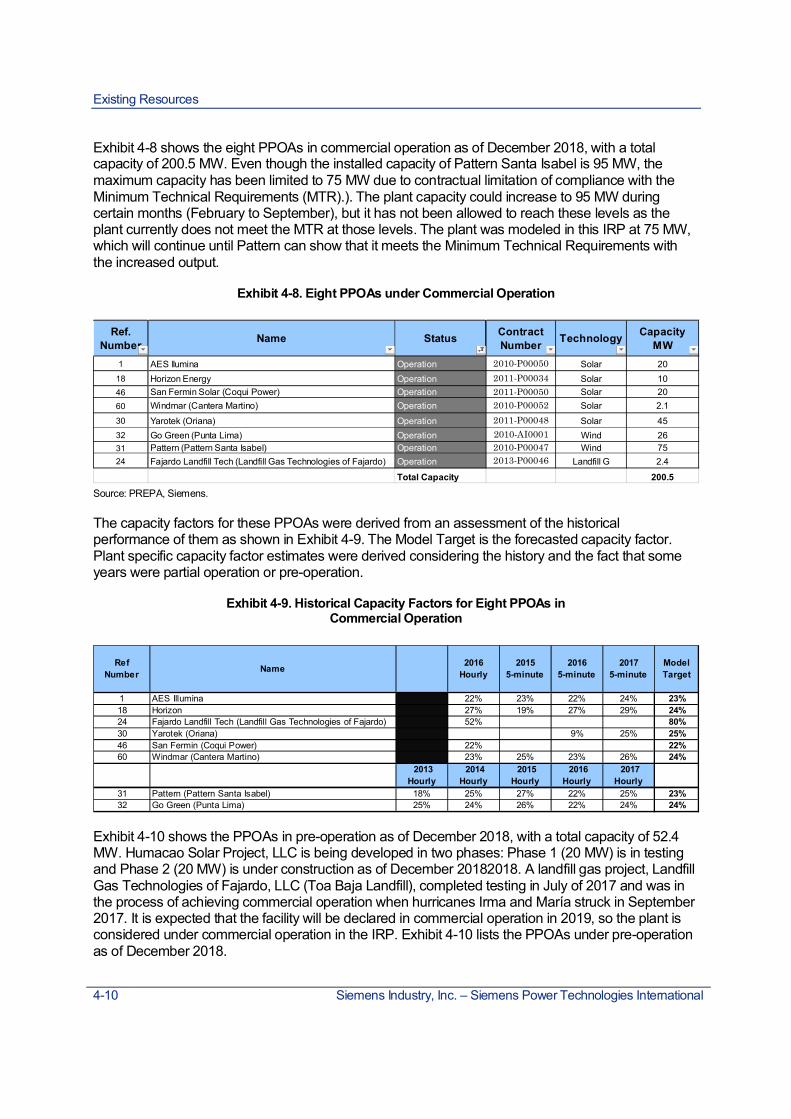
Existing Resources
4-10 Siemens Industry, Inc. – Siemens Power Technologies International
Exhibit 4-8 shows the eight PPOAs in commercial operation as of December 2018, with a totalcapacity of 200.5 MW. Even though the installed capacity of Pattern Santa Isabel is 95 MW, themaximum capacity has been limited to 75 MW due to contractual limitation of compliance with theMinimum Technical Requirements (MTR).). The plant capacity could increase to 95 MW duringcertain months (February to September), but it has not been allowed to reach these levels as theplant currently does not meet the MTR at those levels. The plant was modeled in this IRP at 75 MW,which will continue until Pattern can show that it meets the Minimum Technical Requirements withthe increased output.
Exhibit 4-8. Eight PPOAs under Commercial Operation
Source: PREPA, Siemens.
The capacity factors for these PPOAs were derived from an assessment of the historicalperformance of them as shown in Exhibit 4-9. The Model Target is the forecasted capacity factor.Plant specific capacity factor estimates were derived considering the history and the fact that someyears were partial operation or pre-operation.
Exhibit 4-9. Historical Capacity Factors for Eight PPOAs inCommercial Operation
Exhibit 4-10 shows the PPOAs in pre-operation as of December 2018, with a total capacity of 52.4MW. Humacao Solar Project, LLC is being developed in two phases: Phase 1 (20 MW) is in testingand Phase 2 (20 MW) is under construction as of December 20182018. A landfill gas project, LandfillGas Technologies of Fajardo, LLC (Toa Baja Landfill), completed testing in July of 2017 and was inthe process of achieving commercial operation when hurricanes Irma and María struck in September2017. It is expected that the facility will be declared in commercial operation in 2019, so the plant isconsidered under commercial operation in the IRP. Exhibit 4-10 lists the PPOAs under pre-operationas of December 2018.
Ref.Number Name Status Contract
Number Technology CapacityMW
1 AES Ilumina Operation 2010-P00050 Solar 2018 Horizon Energy Operation 2011-P00034 Solar 1046 San Fermin Solar (Coqui Power) Operation 2011-P00050 Solar 2060 Windmar (Cantera Martino) Operation 2010-P00052 Solar 2.130 Yarotek (Oriana) Operation 2011-P00048 Solar 4532 Go Green (Punta Lima) Operation 2010-AI0001 Wind 2631 Pattern (Pattern Santa Isabel) Operation 2010-P00047 Wind 7524 Fajardo Landfill Tech (Landfill Gas Technologies of Fajardo) Operation 2013-P00046 Landfill G 2.4
Total Capacity 200.5
RefNumber Name 2016
Hourly2015
5-minute2016
5-minute2017
5-minuteModelTarget
1 AES Illumina 22% 23% 22% 24% 23%18 Horizon 27% 19% 27% 29% 24%24 Fajardo Landfill Tech (Landfill Gas Technologies of Fajardo) 52% 80%30 Yarotek (Oriana) 9% 25% 25%46 San Fermin (Coqui Power) 22% 22%60 Windmar (Cantera Martino) 23% 25% 23% 26% 24%
2013Hourly
2014Hourly
2015Hourly
2016Hourly
2017Hourly
31 Pattern (Pattern Santa Isabel) 18% 25% 27% 22% 25% 23%32 Go Green (Punta Lima) 25% 24% 26% 22% 24% 24%

Existing Resources
Siemens Industry, Inc. – Siemens Power Technologies International 4-11 4-11
For the existing solar PPOAs and all future solar projects, the IRP has assumed a capacity factor of22%. This value is viewed as conservative since the historical values are slightly higher, in the 23%range. For landfill gas, a capacity factor of 80% is assumed in this IRP.
Exhibit 4-10. Three PPOAs under Pre-Operation
Source: PREPA, Siemens.
4.1.2.2 PPOAs in RenegotiationOf the 18 PPOAs successfully renegotiated and amended in 2013-2014, 15 have not begunconstruction. Between 2015 and 2016, most of these companies requested extensions to startconstruction and commercial operation dates established in their PPOAs. Most of the requests wererelated to the difficulties alleged by the companies in securing financing for their projects due to thefinancial situation of the Government of Puerto Rico and PREPA. Exhibit 4-11 shows the list of thePPOAs under renegotiation. The PPOAs under re-negotiation are modeled as potential new supplyoptions (volumes and sites), assuming benchmarked new solar prices instead of the PPOAs actualprices.
Exhibit 4-11. Fifteen PPOAs under Renegotiation
Source: PREPA, Siemens.
With respect of the Energy Answers Arecibo PPOA project, there are a number of permitting andlocal opposition challenges. Among others, the Governor of Puerto Rico retired the administrationendorsement to the project. Hence, this project will not be considered as part of the IRP, which isconservative, as its location on the north of the transmission system and high contribution to the RPS
Ref.Number Name Status Contract
Number Technology CapacityMW
7 Fonroche Energy (Humacao Solar Project) Pre-Operation 2012-P00031 Solar 40.062 Windmar (Vista Alegre/Coto Laurel) Pre-Operation 2012-P00052 Solar 10.025 Toa Baja Landfill Tech (Landfill Gas Technologies of Fajardo)Pre-Operation 2013-P00073 Landfill G 2.4
Total Capacity 52.4
Ref.Number Name Status Contract
Number Technology CapacityMW
5 Atenas Solar Farm (Desarrollos del Norte) Re-negotiation 2013-P00070 Solar 203 Blue Beetle III Re-negotiation 2012-P00037 Solar 204 Ciro Group (Ciro One Salinas) Re-negotiation 2011-P00043 Solar 57
15 Grupotec USA Inc (Xzerta-Tec) Re-negotiation 2013-P00042 Solar 2016 Guayama Solar Farm (Guayama Solar Energy) Re-negotiation 2011-P00042 Solar 17.821 Irradia Energy USA (Morovis Solar Farm) Re-negotiation 2012-P00053 Solar 33.542 Moca Solar Farm Re-negotiation 2013-P00003 Solar 2043 North Coast Solar Re-negotiation 2013-P00041 Solar 2036 Renewable Energy Authority (Vega Serena) Re-negotiation 2012-P00045 Solar 2039 Resun (Barceloneta) Re-negotiation 2012-P00061 Solar 2047 Solaner Re-negotiation 2012-P00146 Solar 2548 Solar Blue (Solar Blue Bemoga) Re-negotiation 2013-P00052 Solar 2057 WindMar (Santa Rosa) Re-negotiation 2012-P00080 Solar 2063 YFN Yabucoa Solar (Justin Orozco) Re-negotiation 2013-P00049 Solar 206 Energy Answers Arecibo Re-negotiation 2010-AI0018 WTE 79
Total Capacity 412.3

Existing Resources
4-12 Siemens Industry, Inc. – Siemens Power Technologies International
would result in a favorable outcome from these two points of view. Other waste to energytechnologies could be considered instead.
4.1.2.3 PPOAs not Re-negotiatedThere are 32 projects with PPOAs subject to renegotiation. For the IRP, these projects provide anindication of available sites that may be utilized by alternative renewable generation projects. Exhibit4-12 lists the 32 PPOAs which were not renegotiated. These projects were considered in the IRP aspotential new supply options (capacity and sites), assuming benchmarked new prices instead of thePPOAs actual prices.
Exhibit 4-12.Thirty two PPOAs not Re-negotiated
Source: PREPA, Siemens.
Ref.Number Name Status Contract
Number Technology CapacityMW
41 Cabo Solar Not Renegotiated 2013-P00069 Solar 2044 Caracol Solar (Roma Solar) LLC Not Renegotiated 2013-P00004 Solar 2052 Carolina Solar (Trina) Not Renegotiated 2013-P00067 Solar 2010 Fonroche Energy (Humacao Solar Project) Not Renegotiated 2013-P00048 Solar 159 Fonroche Energy (Solar Project Ponce) Not Renegotiated 2013-P00045 Solar 30
12 Fonroche Energy ( Vega Baja Solar Project) Not Renegotiated 2013-P00050 Solar 158 Fonroche Energy (Lajas Solar Project) Not Renegotiated 2013-P00046 Solar 10
11 Fonroche Energy (South Solar 2) Not Renegotiated 2013-P00047 Solar 3013 GG Alternative Energy Corp. Not Renegotiated 2013-P00077 Solar 2017 Hatillo Solar (Pattern) Not Renegotiated 2013-P00074 Solar 3019 HSEA PR Isla Solar I Not Renegotiated 2013-P00057 Solar 4022 Jonas Solar Farm (Jonas Solar Energy) Not Renegotiated 2012-P000140 Solar 4023 Juncos Solar Energy Not Renegotiated 2012-P00138 Solar 2026 M Solar (M Solar Generating) Not Renegotiated 2012-P00142 Solar 5034 REA Ceiba (REA Energy Ceiba Solar Plant) Not Renegotiated 2013-P00076 Solar 2033 REA Energy (Luquillo Solar Plant) Not Renegotiated 2013-P00051 Solar 2035 REA Hatillo (REA Energy Hatillo Solar Plant) Not Renegotiated 2013-P00075 Solar 2045 Sierra Solar (Roma Solar) Not Renegotiated 2013-P00072 Solar 2053 Vega Baja Solar Energy Not Renegotiated 2012-P00139 Solar 3054 Western Wind (Yabucoa Solar) Not Renegotiated 2011-P00090 Solar 3056 WindMar (Dorado-Toa Baja) Not Renegotiated 2012-P00079 Solar 202 Aspenall Energy Not Renegotiated 2012-P00089 Wind 10
14 GG Alternative Energy Corp. Not Renegotiated 2013-P00071 Wind 1050 Tradewind Energy (Tradewinds Energy Barceloneta) Not Renegotiated 2012-P00030 Wind 7551 Tradewind Energy (Tradewinds Energy Vega Baja) Not Renegotiated 2012-P00028 Wind 5055 Wind to Energy Not Renegotiated 2011-P00101 Wind 2058 WindMar (Dorado-Toa Baja) Not Renegotiated 2012-P00095 Wind 4461 Windmar (Punta Ventana) Not Renegotiated 2008-AI0066C Wind 18.459 Windmar (Punta Verraco) Not Renegotiated 2012-P00049 Wind 34.549 Sunbeam Not Renegotiated 2010-AI0031 WTE 1037 Renewable Power Group Not Renegotiated 2012-P00010 Landfill G 238 Renewable Power Group Not Renegotiated 2012-P0009 Landfill G 1.5
Total Capacity 795.4

Existing Resources
Siemens Industry, Inc. – Siemens Power Technologies International 4-13 4-13
4.1.2.4 PPOAs Assumed Contract PricingAs indicated earlier, any project that is not in operation or pre-operation (i.e. all other projectsirrespective of having re-negotiated PPOAs or not), was modeled in the IRP as potential new supplysites with commercial conditions according to Siemens forecast for new solar prices.
For the projects in operation or pre-operation, Siemens assumed the price conditions shown inExhibit 4-13, where the Contract Price is inclusive of RECs and does not have escalation clauses.
Exhibit 4-13. Projects in Operation or Pre-operation Prices
Project Type Contract Price$/MWh
Solar PV 150
Wind 125
Land fill gas 100Note: above prices include RECs and does not have escalation clauses.
Environmental ConsiderationsEnvironmental regulations have the potential to impact the overall cost and operation of electricgeneration. As such, compliance requirements for key environmental regulations with the potential tosignificantly impact portfolio costs and resource decisions need to be factored into this IRP analysis.This initial review considered existing regulations and the outlook for potential new compliancerequirements over the study horizon (2019-2038). An overview of these key regulations, applicabilityto PREPA’s existing and future portfolio and the approach to incorporate compliance into the IRPanalysis are documented in this section. Although there are numerous environmental policiesimpacting the energy sector at the federal, state and local levels, the primary policies that are drivingpower markets and generation decisions are the suite of Environmental Protection Agency (EPA)rules addressing power plant emissions and state driven renewable and alternative energy portfoliostandards. The environmental regulations determined by Siemens and PREPA to be potentiallysignificant and factored into the IRP analysis include federal air regulations, water regulations, andlocal policy dictating targets for renewable and alternative energy, specifically:
µ National Ambient Air Quality Standards (NAAQS)µ Mercury and Air Toxics Standards (MATS)µ Carbon Regulation
∂ Greenhouse Gas (GHG) Emission Standards for New, Modified, and Existing ElectricGenerating Units
∂ Outlook for potential future regulation of GHG emissions from power generators
µ Puerto Rico Renewable Porfolio Standard (RPS)µ Section 316(b) of the Clean Water Actµ Puerto Rico Water Quality Standards Regulation
A summary of PREPA’s generating units and applicability to the air quality regulations is presented in Exhibit4-14.
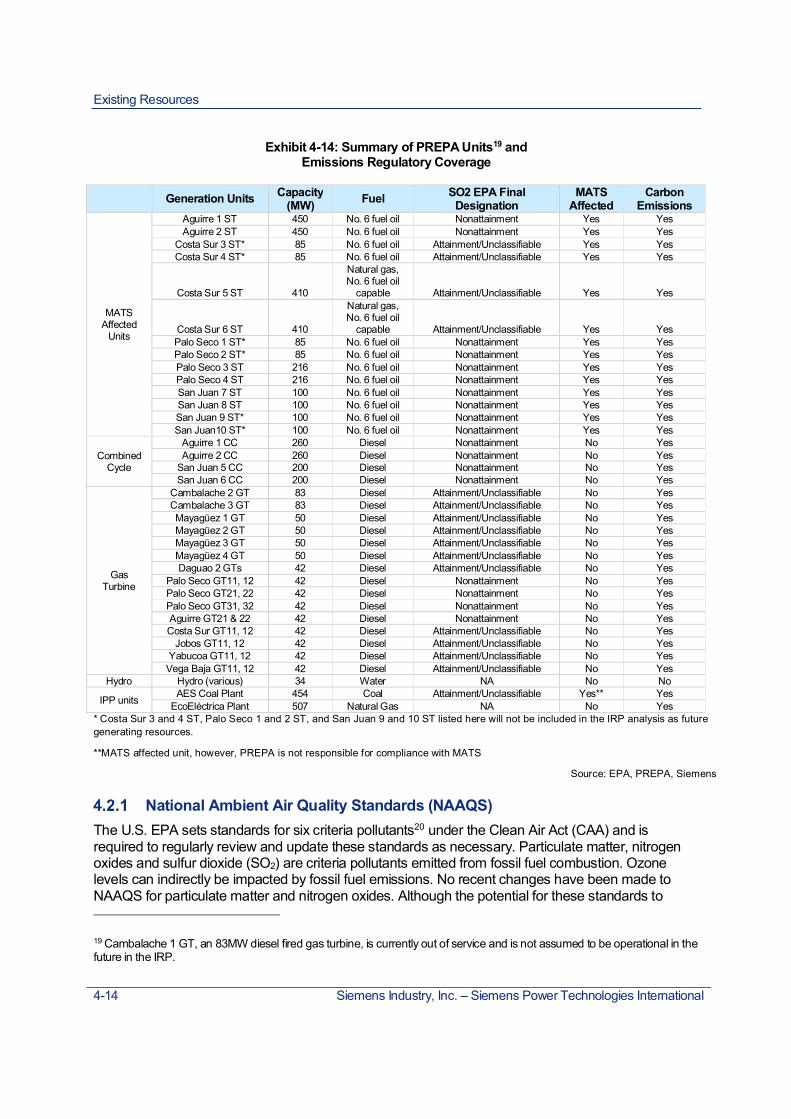
Existing Resources
4-14 Siemens Industry, Inc. – Siemens Power Technologies International
Exhibit 4-14: Summary of PREPA Units19 andEmissions Regulatory Coverage
Generation Units Capacity(MW) Fuel SO2 EPA Final
DesignationMATS
AffectedCarbon
Emissions
MATSAffected
Units
Aguirre 1 ST 450 No. 6 fuel oil Nonattainment Yes YesAguirre 2 ST 450 No. 6 fuel oil Nonattainment Yes Yes
Costa Sur 3 ST* 85 No. 6 fuel oil Attainment/Unclassifiable Yes YesCosta Sur 4 ST* 85 No. 6 fuel oil Attainment/Unclassifiable Yes Yes
Costa Sur 5 ST 410
Natural gas,No. 6 fuel oil
capable Attainment/Unclassifiable Yes Yes
Costa Sur 6 ST 410
Natural gas,No. 6 fuel oil
capable Attainment/Unclassifiable Yes YesPalo Seco 1 ST* 85 No. 6 fuel oil Nonattainment Yes YesPalo Seco 2 ST* 85 No. 6 fuel oil Nonattainment Yes YesPalo Seco 3 ST 216 No. 6 fuel oil Nonattainment Yes YesPalo Seco 4 ST 216 No. 6 fuel oil Nonattainment Yes YesSan Juan 7 ST 100 No. 6 fuel oil Nonattainment Yes YesSan Juan 8 ST 100 No. 6 fuel oil Nonattainment Yes YesSan Juan 9 ST* 100 No. 6 fuel oil Nonattainment Yes YesSan Juan10 ST* 100 No. 6 fuel oil Nonattainment Yes Yes
CombinedCycle
Aguirre 1 CC 260 Diesel Nonattainment No YesAguirre 2 CC 260 Diesel Nonattainment No Yes
San Juan 5 CC 200 Diesel Nonattainment No YesSan Juan 6 CC 200 Diesel Nonattainment No Yes
GasTurbine
Cambalache 2 GT 83 Diesel Attainment/Unclassifiable No YesCambalache 3 GT 83 Diesel Attainment/Unclassifiable No YesMayagüez 1 GT 50 Diesel Attainment/Unclassifiable No YesMayagüez 2 GT 50 Diesel Attainment/Unclassifiable No YesMayagüez 3 GT 50 Diesel Attainment/Unclassifiable No YesMayagüez 4 GT 50 Diesel Attainment/Unclassifiable No YesDaguao 2 GTs 42 Diesel Attainment/Unclassifiable No Yes
Palo Seco GT11, 12 42 Diesel Nonattainment No YesPalo Seco GT21, 22 42 Diesel Nonattainment No YesPalo Seco GT31, 32 42 Diesel Nonattainment No YesAguirre GT21 & 22 42 Diesel Nonattainment No YesCosta Sur GT11, 12 42 Diesel Attainment/Unclassifiable No Yes
Jobos GT11, 12 42 Diesel Attainment/Unclassifiable No YesYabucoa GT11, 12 42 Diesel Attainment/Unclassifiable No Yes
Vega Baja GT11, 12 42 Diesel Attainment/Unclassifiable No YesHydro Hydro (various) 34 Water NA No No
IPP units AES Coal Plant 454 Coal Attainment/Unclassifiable Yes** YesEcoEléctrica Plant 507 Natural Gas NA No Yes
* Costa Sur 3 and 4 ST, Palo Seco 1 and 2 ST, and San Juan 9 and 10 ST listed here will not be included in the IRP analysis as futuregenerating resources.
**MATS affected unit, however, PREPA is not responsible for compliance with MATS
Source: EPA, PREPA, Siemens
National Ambient Air Quality Standards (NAAQS)The U.S. EPA sets standards for six criteria pollutants20 under the Clean Air Act (CAA) and isrequired to regularly review and update these standards as necessary. Particulate matter, nitrogenoxides and sulfur dioxide (SO2) are criteria pollutants emitted from fossil fuel combustion. Ozonelevels can indirectly be impacted by fossil fuel emissions. No recent changes have been made toNAAQS for particulate matter and nitrogen oxides. Although the potential for these standards to
19 Cambalache 1 GT, an 83MW diesel fired gas turbine, is currently out of service and is not assumed to be operational in thefuture in the IRP.

Existing Resources
Siemens Industry, Inc. – Siemens Power Technologies International 4-15 4-15
change exists over the study horizon, no specific assumptions around these potential changes weremade in modeling, given the uncertainty and overall expectation that the portfolio will become lessfossil fuel based in the coming years.
SO2 NAAQSIn January of 2018, EPA updated attainment designations for SO2 for areas in Puerto Rico based onair quality modeling. The 1-hour SO2 standard of 75 parts per billion was finalized in June 2010;however, the latest round of designations was published in January 2018 and became effective inApril 2018. Several areas in Puerto Rico were designated as non-attainment areas, meaning thatthey were found not to meet the SO2 standard. Other areas in Puerto Rico were designated as beingin attainment or otherwise not able to be classified at this time. The designations are based onemissions from all sources of SO2 emissions including transportation and industrial fuel use. For theIRP, the environmental review is focused on emissions from electric generating units. Thecombustion of coal- and petroleum-based fuels releases SO2 emissions. Area designations forPuerto Rico are shown in the exhibits below.
Exhibit 4-15: Puerto Rico San Juan Area SO2 Designations
Source: EPA
20 The six criteria pollutants are ozone, particulate matter, carbon monoxide, nitrogen oxides, sulfur dioxide, and lead.

Existing Resources
4-16 Siemens Industry, Inc. – Siemens Power Technologies International
Exhibit 4-16: Puerto Rico Guayama Salinas Area SO2 Designations
Source: EPA
In the San Juan area, the San Juan and Palo Seco generating facilities represent significant SO2
emitting sources in the area. Actual historic emissions reported by PREPA are presented in Exhibit 417. Several industrial facilities emitting SO2 are located in the San Juan area, all of which arereported by the EPA to emit less than 35 tons SO2 annually. The San Juan Luis Munoz Marin Airportis also located in the San Juan area and is designated as a moderate source with annual emissionsreported at 586 tons SO2 in 2014. Another potentially large source of emissions in the area are theport and mobile sources such as is ship and vehicle traffic. In the Guayama Salinas area, the Aguirregenerating facility is the most significant source contributor in the area. No other specific pointsources were included in the Guayama Salinas area modeling analysis performed by the EPA indeveloping these designations. Aguirre historical emissions are also included in Exhibit 4 17.

Existing Resources
Siemens Industry, Inc. – Siemens Power Technologies International 4-17 4-17
Exhibit 4-17: Actual Reported SO2 Emissions for PREPA Units inNonattainment Areas (tons SO2)21
Facility Area 2013 Emissions 2014 Emissions 2015 Emissions
San Juan San Juan 5,307 5,135 6,063Palo Seco San Juan 5,700 3,128 2,979
Aguirre Guayama Salinas 9,640 9,261 9,585Source: PREPA, EPA Technical Support Document Chapter 36, Final Round 3 Area Designations for the 2010 1-hour SO 2 PrimaryNational Ambient Air Quality Standard for Puerto Rico
Units emitting SO2 located in areas designated as attainment or unclassifiable will still continue tomonitor and report emissions to the EPA, but do not otherwise have to alter operations at this time.
Units emitting SO2 located in areas designated as nonattainment are required to be included in anSO2 State Implementation Plan (SIP) that must be submitted to the EPA by Puerto Rico and finalizedby October 2019. The Puerto Rico Environmental Quality Board (EQB) will develop the SIP, whichwill lay out a plan for how the nonattainment areas will achieve compliance with the SO2 standard by2023. Options for compliance for generating units include installation of sulfur emission controltechnology, fuel switching, or ceasing or reducing operations. Nonattainment designated areas arealso subject to Nonattainment New Source Review requirements for permitting new and modifiedSO2 emitting facilities in these areas.
PREPA units in locations classified as nonattainment for SO2 are presented in the Exhibit below:
21 Note that none of the PREPA units are equipped with continuous emission monitoring (CEMS). Emissions are estimatedbased on fuel specifications and hours of unit operation as reported by PREPA to the Puerto Rico EQB.

Existing Resources
4-18 Siemens Industry, Inc. – Siemens Power Technologies International
Exhibit 4-18: PREPA Units Included in Nonattainment SO2 StandardsDesignation Areas
Area Generation Units Capacity(MW) Fuel SO2 EPA Final Designation
Guayama Salinas
Aguirre 1 ST 450 No. 6 fuel oil NonattainmentAguirre 2 ST 450 No. 6 fuel oil Nonattainment
Aguirre 1 CC 260 Diesel Nonattainment
Aguirre 2 CC 260 Diesel Nonattainment
Aguirre GT21 & 22 42 Diesel Nonattainment
San Juan
Palo Seco 1 ST 85 No. 6 fuel oil NonattainmentPalo Seco 2 ST 85 No. 6 fuel oil NonattainmentPalo Seco 3 ST 216 No. 6 fuel oil NonattainmentPalo Seco 4 ST 216 No. 6 fuel oil Nonattainment
Palo Seco GT11 & GT12 42 Diesel Nonattainment
Palo Seco GT21 & GT 22 42 Diesel Nonattainment
Palo Seco GT31 & GT32 42 Diesel Nonattainment
San Juan 5 CC 200 Diesel Nonattainment
San Juan 6 CC 200 Diesel Nonattainment
San Juan 7 ST 100 No. 6 fuel oil NonattainmentSan Juan 8 ST 100 No. 6 fuel oil Nonattainment
San Juan 9 ST 100 No. 6 fuel oil Nonattainment
San Juan 10 ST 100 No. 6 fuel oil NonattainmentSource: EPA, PREPA
Details on the Puerto Rico SIP will be updated by the results of the IRP analysis. The IRP will trackSO2 emissions from each portfolio and offer options for fuel switching (i.e. should natural gas becomeavailable in the north) and operational changes (i.e. minimum run or retirement and replacement withlower emitting generation options) to existing units. Facility-level operation and emissions resultingfrom the preferred portfolios will be provided to the Puerto Rico EQB. At this time, the followingassumptions in the IRP analysis are expected to support emission reductions from these facilities:
µ Palo Seco steam units 1 and 2 will not be assumed as future generating resources in the IRPanalysis.
µ San Juan steam units 9 and 10 will not be assumed as future generating resources in theIRP analysis.
Mercury and Air Toxics Standards (MATS)The EPA regulates emissions of hazardous pollutants from electric generating units. EPA’s Mercuryand Air Toxics Standards (MATS), originally issued in February 2012, imposes emission reductionsof mercury, acid gases, and particulate matter, and also requires subject facilities to comply with workpractice standards. This is a technology-forcing regulation with no allowance trading. The rule cameinto effect in April of 2015 and existing plants can apply for a one year extension to reachcompliance. PREPA applied for and received a one-year compliance extension for Aguirre. The

Existing Resources
Siemens Industry, Inc. – Siemens Power Technologies International 4-19 4-19
MATS rule sets a decision point for generators – control or retires – even if cost drivers may comeafter 2016.
Several groups filed lawsuits challenging various aspects of the MATS rule, including the EPA’sdetermination that it was appropriate and necessary to regulate emissions from power plants. OnJune 29, 2015, the Supreme Court of the United States found it unreasonable that the EPA did notconsider costs in its initial finding that it was appropriate and necessary to regulate these emissions,22
and the case was remanded to the D.C. Circuit Court of Appeals for further review. The D.C. Circuitremanded the proceeding to EPA to make a finding on the costs issue without vacating the MATSrule, and the MATS rule remains in effect. In April 2016, EPA published a final supplemental findingthat it is appropriate and necessary to regulate hazardous air pollution from coal and oil fired steamEGUs, finding that the consideration of costs does not alter its initial finding that these emissions arenecessary to regulate.23 Therefore, steam coal- and oil-fired power plants continue to be legallyobligated to meet the MATS standards.
PREPA units subject to MATS are presented in the exhibit below and the approach taken by eachunit to comply with MATS.
22 Michigan et al. v. Environmental Protection Agency et al., 135 S.Ct. 2699 (2015).
23 On December 27, 2018, EPA proposed to revise the April 2016 supplemental cost finding for MATS in order to correctwhat EPA deems to be flaws in the analysis. EPA proposes to determine that it is not “appropriate and necessary” to regulatehazardous air pollutant emissions from power plants under Section 112 of the CAA. EPA’s proposal also states that theemission standards and other requirements of the MATS rule would remain in place, since EPA is not proposing to removecoal- and oil-fired power plants from the list of sources that are regulated under Section 112 of the Act at this time. However,EPA requests comment on whether the EPA has the authority or obligation to delist the source category and rescind thestandards, or to rescind the standards without delisting.

Existing Resources
4-20 Siemens Industry, Inc. – Siemens Power Technologies International
Exhibit 4-19: PREPA Existing Units Subject to MATS
Generation Units Fuel MATS Compliance Status
MATS Affected Units(PREPA Responsible
for Compliance)
Aguirre 1 ST No. 6 fuel oil No quarterly test performed until Q4 2018(1)
Aguirre 2 ST No. 6 fuel oil No quarterly test performed until Q4 2018(1)
Costa Sur 3 ST No. 6 fuel oil This unit is currently not operating and will not be considered asa future generating resource in the IRP
Costa Sur 4 ST No. 6 fuel oil This unit is currently not operating and will not be considered asa future generating resource in the IRP
Costa Sur 5 ST Natural gas(No. 6fuel oil capable) MATS compliant – now operating on natural gas
Costa Sur 6 ST Natural gas(No. 6fuel oil capable) MATS compliant – now operating on natural gas
Palo Seco 1 ST No. 6 fuel oilDesignated as limited-use unit but has exceeded heat-input
threshold for limited use. This unit is currently not operating andwill not be considered as a future generating resource in the IRP
Palo Seco 2 ST No. 6 fuel oil
Designated as limited-use unit but has previously exceededheat-input threshold for limited use. This unit is currently notoperating and will not be considered as a future generating
resource in the IRPPalo Seco 3 ST No. 6 fuel oil PM emissions above MATS limit(2)
Palo Seco 4 ST No. 6 fuel oil This unit is currently not operating(2)
San Juan 7 ST No. 6 fuel oilDesignated as limited-use unit but has exceeded heat-input
threshold for limited use units. Modeled as running for reliabilityconsiderations in place of San Juan 9 (2)
San Juan 8 ST No. 6 fuel oilDesignated as limited-use unit but has exceeded heat-input
threshold for limited use units. Modeled as running for reliabilityconsiderations in place of San Juan 10 (2)
San Juan 9 ST No. 6 fuel oil PM emissions above MATS limit. Will not be considered as afuture generating resource in the IRP
San Juan 10 ST No. 6 fuel oil This unit is currently not operating. Will not be considered as afuture generating resource in the IRP
MATS Affected Units(PREPA not
Accountable forCompliance)
AES Coal Plant CoalPower Purchase - PREPA is not responsible for MATS
compliance, AES represents that the plant is MATS compliant
Aguirre 1 & 2 are the largest single units in the system and are required to meet the load. Aguirre 1 & 2 can be made MATScompliant by their conversion to natural gas or can be retired (or designated limited use), when new generation is installed in thesystem.
These units in the north of the island are required to manage transmission limitations and can be retired (or designated limited use)when new generation is commissioned in the north.
Source: EPA, PREPA
The IRP analysis includes the following for MATS affected units:
µ Aguirre units 1 and 2 are currently operating and are not MATS compliant. At this time, theseunits are required for reliability. Future resource portfolios will assume that these units onlyoperate as needed for reliability purposes and then cease their operations as a means tocomply with MATS. Conversion to natural gas was included as an option in Scenario 5.These units continue to operate under a 1999 consent decree with EPA. Additional actionmay be required pending the EPA’s review of the results of the IRP. The IRP assumes thatthe units could run until 2025, when new large combined cycle plants could be in service.
µ Costa Sur units 5 and 6 are complying with MATS by fuel switching, operating on natural gas.As of May 2018, these units began operating on natural gas. However, the permit still allowsthe units to operate on no. 6 fuel oil.

Existing Resources
Siemens Industry, Inc. – Siemens Power Technologies International 4-21 4-21
µ Costa Sur steam units 3 and 4 and Palo Seco steam units 1 and 2 are not currently inoperation and will not be considered as future generating resources in the IRP.
µ Palo Seco Unit 4 and San Juan Unit 10 are currently not in operation. Palo Seco unit 3 andSan Juan unit 9 have had PM emissions above the MATS limit and are run for reliabilityneeds. San Juan Units 7-8 are designated as limited use units, which do not have to meet theMATS emission limits but must comply with certain work practice standards. San Juan Units7-8 have previously exceeded the heat input limit for limited-use units, which require them tooperate at less than eight percent capacity factor, averaged over 24-month block periods.San Juan units 9 and 10 will not be considered as a future resource in the IRP. The IRPassumes that the units could run until 2025, when new large combined cycle plants could bein service.
µ New generating units included in the portfolio analysis are assumed to be MATS compliant.
Limited use and retirement options are also included in assessing portfolio options. PREPA will notconsider investing in costly emission controls as a compliance option and therefore this was notconsidered in this analysis.
Other operational adjustments to comply with MATS have been considered but have been deemedthrough detailed conceptual analysis not to be viable compliance strategies for PREPA’s units. Fuelblending was one compliance strategy assessed, as well as operational adjustments includinginfrequent soot blowing, higher burn point temperatures, and excess oxygen adjustments.Combinations of these operational adjustments have, albeit with significant challenges, enabledHawaiian Electric Company (HECO) to comply with MATS. Characteristics of PREPA’s units relativeto HECO’s units render them unsuitable to comply through these operational adjustments, includingtheir larger size, lower burn temperatures, presence of continuous emission monitoring systems,mandated frequent soot blowing and higher average load levels. HECO also found fuel blending notto be a viable compliance strategy for its units. MATS compliance through fuel blending with ultralowsulfur diesel was considered by PREPA but was determined not to be a viable compliance option forMATS affected units in Puerto Rico based on PREPA’s independent evaluations. In addition, basedon information provided by PREPA, MATS compliance through operational modifications is not anoption for the steam units.24
Carbon RegulationNo economy-wide national regulation of carbon emissions exists in the in the U.S. at this time. InDecember 2009, EPA finalized its endangerment finding for GHG emissions from mobile sources,officially giving it the authority to regulate these emissions under the Clean Air (CAA). BeginningJanuary 1, 2010, major stationary sources were required to track and report their annual GHGemissions to EPA. The EPA has issued regulations regulating the GHG emissions of new, modified,and existing electric generating units. An overview of these regulations, current status andapplicability to this IRP are presented below.
24 Memorandum, “Staff Opinion – Assessment of Fuel Blending for MATS Compliance”, Puerto Rico Electric Authority, July25, 2018

Existing Resources
4-22 Siemens Industry, Inc. – Siemens Power Technologies International
New Source Performance Standards for GHGs for Electric Generating UnitsIn October 2015, EPA finalized New Source Performance Standards (NSPS) for Electric UtilityGenerating Units under §111(b) of the CAA, a proposed regulation that would establish carbondioxide (CO2) emission limits for certain new, modified, and reconstructed power plants in the U.S.The NSPS applies to new, reconstructed, or modified steam EGUs and to new or reconstructednatural gas combustion turbines. The NSPS sets a rate limit of 1,000lbs of CO2/MWh for combinedcycle natural gas plants and a limit of 1,400lbs of CO2/MWh for coal plants. The NSPS effectivelyprevents the permitting of new coal-fired power plants that are not equipped with CO2 pollutioncontrol equipment such as carbon capture and sequestration (CCS), a technology that has yet to bedeployed on a commercial scale.
In December 2018, EPA issued a proposed rule to amend the Section 111(b) standards for GHGs.The main feature of this proposal is that it would change the best system of emission reduction(“BSER”) and emissions standards for steam EGUs. EPA did not propose changes to the NSPS fornewly constructed or reconstructed natural gas stationary combustion turbines, as a part of theproposal.
Even if the rule is not amended, it is not anticipated to have a significant impact in PREPA’s futuregeneration portfolio. No new coal is expected. Even in the absence of this rule, Pace Global does notexpect any build out of additional coal capacity in the near future. Other natural gas and fossil fuelfired units would be expected to need to meet these new source standards.
Clean Power Plan and Affordable Clean Energy Rule – GHG EmissionsGuidelines for Existing Electric Generating Units
In October 2015, EPA finalized the Clean Power Plan (CPP), which established emissions guidelinesfor certain existing electric generating units under §111(d) of the CAA. The CPP established state bystate emission targets for affected existing generation units. Under the CPP, states would determinethe approach to meet their emissions goal, including choosing to comply as a rate goal (lb.CO2/MWh) or a mass goal (short tons of CO2). Overall, the aggregate state goals (on a mass basis)would reduce emissions from affected sources by an estimated 32% below 2005 levels by 2030. Theinitial compliance period would have begun in 2022, with the final reduction goal to be achieved by2030. Trading of emissions between states would be encouraged under the CPP. It should be notedthat Puerto Rico was not covered under the final CPP. Draft standards for existing generators locatedon Indian Country and in the U.S. Territories, including Puerto Rico, were released in 2014, but werenever finalized. The final CPP noted that additional data would be needed to define final standardsfor these areas.
In February of 2016, the Supreme Court granted a request to stay the CPP while the courts rule onthe legal challenges to the rule, rendering the rule and all associated planning deadlines not in effectuntil further notice. Further, the Trump Administration directed the EPA to perform a detailed reviewof the rule in a March 2017 Executive Order. This review resulted in a proposal to withdrawal theCPP in its entirety. Moreover, on August 31, 2018, EPA published the Notice of ProposedRulemaking for the rule to replace the CPP—the “Affordable Clean Energy” or “ACE” rule. TheProposed ACE rule to replace the Clean Power Plan also currently proposes that emissionsguidelines would not apply to Puerto Rico. However, until the final proposal is issued, the regulatorystatus remains uncertain.
Given the pending proposals to withdraw and replace the CPP, a great deal of uncertainty exists atthis time over the future of regulations covering CO2 emissions from existing power generators.Because Puerto Rico was not regulated under the final CPP and the prevailing expectation is that the

Existing Resources
Siemens Industry, Inc. – Siemens Power Technologies International 4-23 4-23
CPP rule will be withdrawn in its entirety, the CPP does not impact this IRP. Sensitivity analysisconsidered for this IRP would assess the impacts of a policy placing a price on carbon in the IRP.
Consideration of the Effect of Future Regulation of Carbon on Generators inPuerto Rico
Despite the absence of the CPP or any other national regulation of carbon emissions from powergenerators at this time, the potential for enactment of such regulation over the study horizon remains.To account for this uncertainty in the IRP analysis, sensitivities could be considered in supplementalanalysis to include a price on CO2 emissions from fossil generators.
This price on carbon is not intended to represent a specific view on an expected future nationalcarbon program. The structure, timing, and resulting requirements of a potential future program arenot known at this time. Rather this price could represent a future carbon trading or carbon tax policyand is intended to analyze the implications that a price on carbon would have on PREPA’s portfoliooperation and resource decisions. The carbon price considered for the potential sensitivity analysis isbased on variety of publicly available sources and is presented in the exhibit below along with therange of pricing represented in public sources referenced.
Exhibit 4-20: Carbon Price – Carbon Regulation Sensitivities
Source: U.S. Energy Information Administration, Synapse, IHS, Siemens
Puerto Rico RPSRenewable Portfolio Standards (RPS) are regulated programs placing an obligation on electricitysuppliers that a certain percentage of their electricity sold be derived from alternative or renewableenergy resources. At this time, 29 states, Puerto Rico, and the District of Columbia have enactedmandatory state-level RPS requirements. These RPS rules dictate expansion options andeconomics.
Puerto Rico established by Act 82-2010 an RPS in July of 2010 which set minimum targets ofrenewable and alternative energy. This rule requires that load serving entities to supply increasingshares of retail sales with qualified renewable and alternative source. This can be procured by direct
$0
$20
$40
$60
$80
$100
$120
$140
$160
2018
2019
2020
2021
2022
2023
2024
2025
2026
2027
2028
2029
2030
2031
2032
2033
2034
2035
2036
2037
2038
2039
2040
Nom
inal
$/to
nC
O2
Public Forecast Range Concensus Forecast

Existing Resources
4-24 Siemens Industry, Inc. – Siemens Power Technologies International
purchase of the energy including renewable attributes or by the purchase of renewable energycertificates (RECs), which are tradable instruments representing the renewable attributes qualifiedgeneration, unbundled from the energy itself. RECs allow for compliance flexibility and can bebanked for use up to two years forward. The RPS targets set forth by the legislation are below.PREPA may set interim goals to meet these prescribed levels. Current law establishes complianceas a percent of purchased REC’s of qualifying renewable generation vs total sales, subject to certaingrounds for permissible non-compliance.
µ 12 percent – 2015 through 2019µ 15 percent – 2020 through 2027µ 20 percent – 2035 and beyond
Eligible renewable generation technologies include wind, solar, geothermal, renewable biomass orbiofuel, new hydropower. Alternative renewable energy generation technologies that can also beused to meet the requirement include landfill gas, fuel cells, and municipal solid waste. The rulesaround the use of net metered renewable energy for RPS compliance are unclear. To date, PREPAis not permitted to use RECs from distributed solar installations for RPS compliance. To beconservative in the IRP, it will be assumed that behind the meter renewables will not count towardsRPS requirements, unless advised from PREPA otherwise.
The RPS to date has not been met. RECs that PREPA does purchase under renewable purchaseagreements generally range from $2 to $4/MWh and include wind and solar photovoltaic generatingfacilities.
The LTCE had as an input compliance with the current RPS and we also assess the ease or difficultythat the various plans would have to reach 50% penetration.
Clean Water Act Section 316(b)The EPA issued the final standards for cooling water intake structures under Section 316(b) of theClean Water Act in May 2014. This rule aims to reduce the impingement and entrainment of marinelife from the impacts of water intake structures. This rule applies to industrial facilities, includingelectric generation facilities, that intake water for operation from bodies of water (i.e. lakes, rivers,estuaries, and oceans) exceeding two million gallons per day and of which 25 percent is usedexclusively for cooling purposes. Covered facilities are required to obtain a National PollutantDischarge Elimination System (NPDES) permit. Further requirements are based on water withdrawallevels.
µ 2 million gallon per day – action to reduce the adverse impact to marine life including controltechnologies like velocity screens and implement biological impact monitoring at the intakestructures
µ 125 million gallon per day – additional assessments of impacts required to assess permitrequirements
µ New systems – review on facility will be conducted to assess controls needed, this applies tonew facilities and expansions at existing facilities that would significantly increase waterintake volumes
Noting the unique design of individual facilities, the rule is not prescriptive of controls required, ratherassigns the permitting agencies the ultimate discretion in individual facility requirements.

Existing Resources
Siemens Industry, Inc. – Siemens Power Technologies International 4-25 4-25
All PREPA generating facilities operate under site-level NPDES permits. Through these permits,information requested to assess facility control needs to comply with 316(b) are being considered.Any new or facility expansions that impact water intake will be designed to comply with requirementsunder 316(b).
Puerto Rico Water Quality Standards RegulationSection 304(a) of the CWA requires the EPA to publish water quality criteria based on the latestscientific review. These criteria can then be used by states to adopt or build on to define state specificwater quality standards as a requirement of the CWA under Section 303(c).
The Puerto Rico EQB publishes and maintains Water Quality Standards Regulation to protectpreserve, maintain and enhance the quality of water in Puerto Rico compatible with the social andeconomic needs of the Commonwealth. The latest standards were updated in April 2016.Specifically, this regulation designates uses for bodies of water, define water quality standards,identify rules and standards applicable to sources of pollution, and establish other measures deemednecessary to maintain water quality.
All existing generation facilities that have intake cooling water, discharge, or otherwise triggerrequirements under the Water Quality Standards Regulation operate under NPDES permits. Thesepermits document facility specific requirements and tolerances based on the applicable regulationand further informed by stakeholder input. Permitting for new facilities is outside of the scope of theIRP. However, new generation options considered as a part of the IRP analysis will assumereasonable levels of controls that would expected to comply with applicable water qualityrequirements for new sources in Puerto Rico.

Siemens Industry, Inc. – Siemens Power Technologies International 5-1 5-1
Part
5Resource Needs Assessment
Overview of the NeedsResource planning is a multifaceted and technically complex process for most utilities. However,Puerto Rico and PREPA have a particularly complex resource planning environment due tonumerous factors, including the isolated island operation without electrical or fuel deliveryconnections to other locations, the significant age and poor condition of much of the existinggeneration fleet, the uncertainty of the future economic conditions which greatly impact the electricgeneration requirements, and the vulnerability of the territory to catastrophic weather events. Whilemany utilities are looking for ways to make incremental changes to their system to enhance theirresiliency, the devastation to PREPA’s electrical infrastructure from the 2017 Hurricanes forcedPREPA to rethink its entire system design including resource planning. This IRP, following on theheels of one of the worst storm related outages experienced by an electric utility, offers PREPA anopportunity to define a sharp and significant improvement in direction for the future energy supply ofPuerto Rico.
Further to the above, 2019 IRP is not a classical IRP designed to identify the least cost approach toaddress the expected gap between load and resources and maintaining a desired Planning ReserveMargin (PRM), but rather produce a plan that satisfies the objectives of being customer centric,financial viability, reliability and resiliency and economic growth, on a context of significant declines inthe load.
Thus, this IRP is designed instead, to address the following resource needs:
a) Address the impacts of an aging generation infrastructure that burns costly liquid fuels(mostly heavy fuel oil), which has poor reliability, does not meet environmental regulations(e.g. MATS) and is inflexible, which limits the incorporation of renewable resources.
b) Achieve a reduction of cost of supply by the incorporation of renewable resources and takeadvantage of the currently observed and forecasted reduction in cost.
c) Achieve compliance with RPS mandate. However, Siemens observed that economies alonejustified greater levels of penetration.
d) Shift from centralized generation located in the south of the island to a more decentralizedgeneration mix, with resources across the island.
Taking in consideration the above, through input received during a series of Stakeholder Workshops,discussion with PREPA staff and Siemens own knowledge and experience with resource planning,the PREPA and Siemens project team defined a number of aspects that the resource planningresulting from this IRP must address. These needs included but were not limited to:
Resource Needs Assessment
5-2 Siemens Industry, Inc. – Siemens Power Technologies International
µ Reduce the dependence on an aging, inflexible and not reliable fleet and move away fromthe reliance on large, concentrated generating plants.
µ Improve the overall resiliency of the system to better enable Puerto Rico to withstand andrecover from future severe weather and other disruptive events.
µ Improve the sustainability of the electrical end use and supply.µ Determine the role of natural gas in PREPA future resource supply.µ Include in the analysis, the uncertainty associated with load, fuel costs and costs of supply
technologies.µ Create a resource plan that addresses the needed changes while balancing the cost of
service to customers.µ Deliver a transparent planning process that allows stakeholders to review and understand the
planning process and recommendations.
In the balance of this section Siemens present the strategies, Scenarios and sensitivities used toformulate the multiple long term capacity expansion plans to address the needs above.
Three StrategiesAs part of the stakeholder process, Siemens shared three potential strategies for consideration asshown below.
Strategy 1 reflects a traditional and centralized energy program that emphasizes reliability andeconomic metrics.
Strategy 2 reflects a distributed system of flexible generation, and micro or mini-grids andhardening of existing infrastructure around Puerto Rico, which emphasizes resiliencyand closeness to the customer. In this strategy, most of the load is supplied from localsupply resources that can be isolated from the remainder of island during a majorevent but still supply all or a portion of the nearby load. It is defined in terms of aminimum level of the load to be supplied by local resources (e.g., 80%).
Strategy 3 reflects a hybrid of the first two strategies that embodies a combination of the benefitsof Strategy 1 and Strategy 2. In this strategy, economies of scale are takenadvantage of, and some of the load may be served under normal conditions fromremote resources. In this strategy, the potential for greater levels of rotating load shedduring a major event is greater than Strategy 2 but should result in lower operatingcosts.

Resource Needs Assessment
Siemens Industry, Inc. – Siemens Power Technologies International 5-3 5-3
Exhibit 5-1. PREPA IRP Strategies
To achieve the vision of a more renewable, resilient, and reliable Puerto Rico electric system, the IRPincorporates analysis of mini-grids, micro-grids, and grid modernization to systematically improveresiliency with pockets of critical loads served by distributed resources that can operate in both grid-connected and island modes. These mini-grids are proposed to be strategically sited to supportclusters of critical transmission and distribution voltage loads, downstream of distribution andtransmission vulnerabilities. The IRP seeks to balance low cost reliable operation under normalconditions and the ability to mitigate and achieve timely recovery from major disruptive events.
Stakeholders generally reached consensus that a strategy founded on distributed rather thancentralized supply resources is more appropriate to Puerto Rico’s situation because it provides amore resilient grid. Generally, participants viewed Strategy 3 (“hybrid strategy” of centralized anddistributed generation) as a short- or medium-term step to Strategy 2 (a long-term mix of distributedand flexible generation in Puerto Rico where supply is located closer to load). Most stakeholders didnot support pursuit of the centralized Strategy 1, except possibly as a reference point for comparison.On the other hand, some stakeholder groups requested that Strategy 1 be explicitly modeled as thisstrategy was thought to likely provide the least cost configuration. Larger centralized resourcesaligned with Strategy 1 were incorporated in the Scenario that has all resources competing to providethe desired cost comparison information.
In addition to the IRP Regulation effective since April 24, 2018, the PREB issued orders onSeptember 5 and September 18, 2018, regarding Scenarios and other points of the IRP, including,but not limited to, a directive to consider Strategy 1. The regulation and orders speak for themselves,so they will not be summarized here, although they are referenced below.
For each strategy, a combination of assets was developed by putting constraints on the generation,transmission, and distribution assets that are available to Puerto Rico for a specific strategy. Forexample, a fully distributed strategy did not consider traditional high capacity generating assets suchas large gas fueled combined cycle plants or diesel fueled assets. A partially distributed system orhybrid system considered only a limited amount of larger traditional generators.

Resource Needs Assessment
5-4 Siemens Industry, Inc. – Siemens Power Technologies International
UncertaintiesIn addition, the IRP captures a series of uncertainties, including load growth, Distributed EnergyResources (DER), O&M25 and capital costs of assets, fuel availability and price forecasts, energypolicy and permitting, weather, energy efficiency, and PPOA termination or extension. The Scenariosand sensitivities are designed to test each strategy against a combination of these uncertainties. TheScenarios, sensitivities, and stochastics (for uncertainties assessment) are discussed below.
ScenariosThe PREB IRP Regulation defines Scenarios as a combination of system requirements needed toserve load, commodity prices, capital costs, and risks that influence the choice of resources servingPREPA's future load. Each Scenario constitutes a possible resource plan. Traditional uncertainties(e.g., load forecasts, fuel forecasts, and renewables capital costs) are assessed via cases (High,Base and Low) and sensitivities. They could also be assessed via stochastic analysis. Based onextensive stakeholder engagement and consolidation of the September Scenarios orders by PREB,PREPA considered a total of six Scenarios as part of the 2018 IRP.
With respect of fuel infrastructure and renewables, the following Scenarios are considered as outlinedin Exhibit 5-2 and further described below.
Scenario 1: No new gas-fired generation is installed. The Scenario uses the base caseassumptions of solar and storage costs and availability.
Scenario 2: Gas to North: The land-based LNG at San Juan in the North is assumed to acquire therequired permitting approval. The Scenario uses the base case assumption of solar andstorage costs and availability.
Scenario 3: Gas to Yabucoa (east) and to Mayagüez (west) through ship-based LNG and gas tothe north is supplied through land-based LNG at San Juan. The land-based LNG atSan Juan is assumed to acquire the required permitting approval. The Scenarioassumes the deeper drop (NREL Low Case) of solar and storage costs coupled withhigh availability of renewables (early ramp up).
Scenario 4: Gas to Yabucoa (east) and to Mayagüez (west) through ship-based LNG and gas tothe north is supplied through land-based LNG at San Juan. The land-based LNG atSan Juan is assumed to acquire the required permitting approval. The Scenario usesthe base case assumption of solar and storage costs and availability.
Scenario 5: Aguirre Offshore Gas Port (AOGP), gas to Yabucoa (east) and to Mayagüez (west) issupplied through ship-based LNG. Gas to the north is supplied through land-basedLNG at San Juan which is assumed to achieve required permitting approval. TheScenario uses the base case assumption of solar and storage costs and availability.The Scenario also places no restriction on the size of the combined cycle units (CCGT)and up to H-Class (449 MW) could be added. All previous Scenarios had a maximumsize of 302 MW F-Class CCGT.
25 Operation and maintenance

Resource Needs Assessment
Siemens Industry, Inc. – Siemens Power Technologies International 5-5 5-5
ESM: Energy System Modernization (ESM); this is a plan advanced by PREPA and thatincludes a set of pre-defined investments decisions that considers ongoing RFPprocesses. The ESM is benchmarked against the formulated least cost plans. Theinvestments included in the ESM plan reported include adjustments made during theanalysis carried out under the IRP.
Exhibit 5-2. PREPA IRP Scenario Definition
ScenarioNew Gas Renewable & Storage
AOGPLand-based
LNG atSan Juan
Ship-basedLNG at
Yabucoa
Ship-basedLNG at
MayagüezCosts Availability
1 No No No No Reference Reference2 No Yes No No Reference Reference3 No Yes Yes Yes Low High4 No Yes Yes Yes Reference Reference5 Yes Yes Yes Yes Reference Reference
ESM No Yes Yes Yes Reference Reference
Some of the ESM decisions above are fixed and not subject to the LTCE selection. This includes theland based LNG terminal at San Juan and a new 302 MW Combined Cycle Gas Turbine (CCGT) by2025 (or as early as possible); this will follow the conversion of San Juan 5&6 to gas, which issupported by the ship-based LNG that will be replaced by the land-based when commissioned. AtYabucoa a Ship-Based LNG terminal is to be developed and 302 MW CCGT is installed by 2025 (oras early as possible). At Mayagüez, a Ship-Based LNG terminal is developed, but the only fixdecision is to convert the existing Aero units to be able to burn natural gas. The possibility of installinga CCGT is left as an option for the optimization process. The ESM also includes an additional smallerplant of approximately 100 MW in the north (modelled as 3x38 MW small CCGT) that can burn bothnatural gas and LPG (liquefied petroleum gas).
The following conditions and assumptions, unless specifically indicated to the contrary, will bemodeled across all five Scenarios and the ESM:
1. Load Forecast is treated via a Base, High and Low case. A stochastic analysis could beconducted as a follow-up analysis; however, as will be discussed later in this report, the Highand Low cases allow identifying the decisions that would be affected by changes in the loadgrowth and the path to account for this uncertainty.
2. Fuel forecast and costs of renewable and storage are treated via sensitivities and themodification on decisions identified.
3. The AES PPOA is assumed to expire in 2027 without renewal and the EcoEléctrica PPOA isassumed to be renewed in 2022 with modifications on the contract to prevent the immediateretirement of the plan. These modifications basically include a reduction of the fixedpayments to 55% (new 2022 payment $108 million down from 240 million the prior year) andEcoEléctrica being able to cycle in and out of service as required to integrate renewable. Onthe other hand, after expiration of the existing contract the energy payments are assumed tofollow market conditions, instead of the reduced prices now in place. Note that with thepayment EcoEléctrica was still found to be retired over the medium term due to the entry of
Resource Needs Assessment
5-6 Siemens Industry, Inc. – Siemens Power Technologies International
an F-Class CCGT. Hence for the ESM plan that does not consider this option, the paymentwas reduced to 60% (new 2022 payment $88 million down from 240 million the prior year).
4. Energy Efficiency is assumed to meet the requirement of the IRP Regulation of 2% per yearincremental savings attributable to new energy efficiency programs.
5. Peaking generation was added to all LTCEs under Strategy 2 and Strategy 3ensure that thecritical loads located in each of the recommended eight electric islands into which the systemwould be segregated after a major storm (the MiniGrids), could be served on grid isolatedmode. This peaking generation along with the renewable generation and the storage in theMiniGrid would serve the priority loads and as much as possible of the balance of the load.Strategy 1 did not have this requirement and was used to identify the tradeoff betweenbenefits and costs (value of loss load) of relying on central generation. The ESM had alsothese GT’s as a fixed decision.
It should be noted that the possibility of achieving permitting approval for any of the LNG terminalabove does not mean that the option of gas generation was automatically be selected nor its size.
SensitivitiesSensitivity analyses were used to isolate the impacts of certain important variables while holdingother assumptions constant. For the 2018 IRP, six sensitivities were included in the core scope of thisstudy26, as shown in Exhibit 5-3. PREPA IRP Sensitivity Definition and further described below
Sensitivity 1: Deeper reduction in cost of solar and storage, coupled with high availability of storageand solar. In Sensitivity 1, higher yearly limits of PV/BESS (photovoltaic / batteryenergy storage system) are assumed. See Exhibit 6-27 for the limits of this Sensitivity1. As a reference, Exhibit 6-28 has the limits for the core LTCE and Exhibit 6-29 thelimits for the ESM.
Sensitivity 2: Lower energy efficiency penetration (~1% reduction per year instead of 2%).
Sensitivity 3: Economic retirement of AES and EcoEléctrica regardless of contract term. Inpractice, if AES is not forced to retire, it will not retire, and as indicated earlierEcoEléctrica’s contract needs to be modified.
Sensitivity 4: Ship-based LNG at San Juan could achieve permitting approval. The ship-basedLNG at San Juan can basically supply the conversion of San Juan 5&6 and providelimited gas to other developments. It has reduced capacity in comparison to the land-based LNG option.
Sensitivity 5: High gas prices.
Sensitivity 6: High cost of solar and storage.
26 Once this study is completed, more sensitivities models and stochastic analysis could be run as well as running the coresensitivities on other strategies, as required by the PREB.

Resource Needs Assessment
Siemens Industry, Inc. – Siemens Power Technologies International 5-7 5-7
Exhibit 5-3. PREPA IRP Sensitivity Definition
Sensitivity
Solar/BESS EnergyEfficiency PPOAs Gas Solar/BESS
Low Cost Low EEEconomicRetirementof AES and
EcoEléctrica
Ship-basedLNG at
San Juan
High GasPrices High Cost
1 ◆2 ◆3 ◆4 ◆5 ◆
6 ◆
Additional important sensitivities were proposed by stakeholders, including no RPS (renewableportfolio standard – Act 82-2010) and/or postponed MATS compliance (US EPA Mercury and AirToxics Standards regulation) to show the cost of compliance. However, all LTCE plans and the ESMexceeded the RPS limits (in some cases widely). Also, most MATS incompliant units were retired oneconomics rather than compliance reasons, which forced the units to retire by 2025.
Finally, it is recognized that additional sensitivities could be included as gas to the north and south viapipelines, emissions prices (CO2), and cost of capital.
Portfolio CasesPortfolio cases are unique combinations of Scenarios and strategies. Exhibit 5-4below illustrates the32 portfolio cases to be modeled in the core IRP. The portfolio cases are named under theconvention of “Scenario ID + Strategy ID + Sensitivity ID + Load Forecast (High, Base or Low)”.
It can be noted below that for Scenarios 1 to 4 and certain sensitivities, the portfolios cases and theresulting LTCE plan is assessed for the High, Base, and Low load growth forecast. Strategy 2 andStrategy 3 are considered for the Scenarios 1 to 4 and as Scenario 5 is designed not to have anyrestrictions, the Strategy 1 is used. Strategy 3 is used for most of the sensitivities.
Regarding the 32 portfolio cases and associated model treatment, the LTCE is run in all portfolioscases, the detailed nodal runs are done on the Base Case, and the PSS®E assessments are donein those cases that are expected to result in maximum stresses of the system, either in terms of largeamounts of renewable online or heavier use of the transmission facilities.
In addition to the 32 portfolios below, as a result of analysis of results, two additional portfolios weredeveloped: a) one for Scenario 2 Strategy 2 where we uniformed the peaking generation additions toavoid different technologies in the same plant providing similar products and b) a sensitivity to theESM case where we evaluated the impact of requiring 50% renewable penetration by 2040.
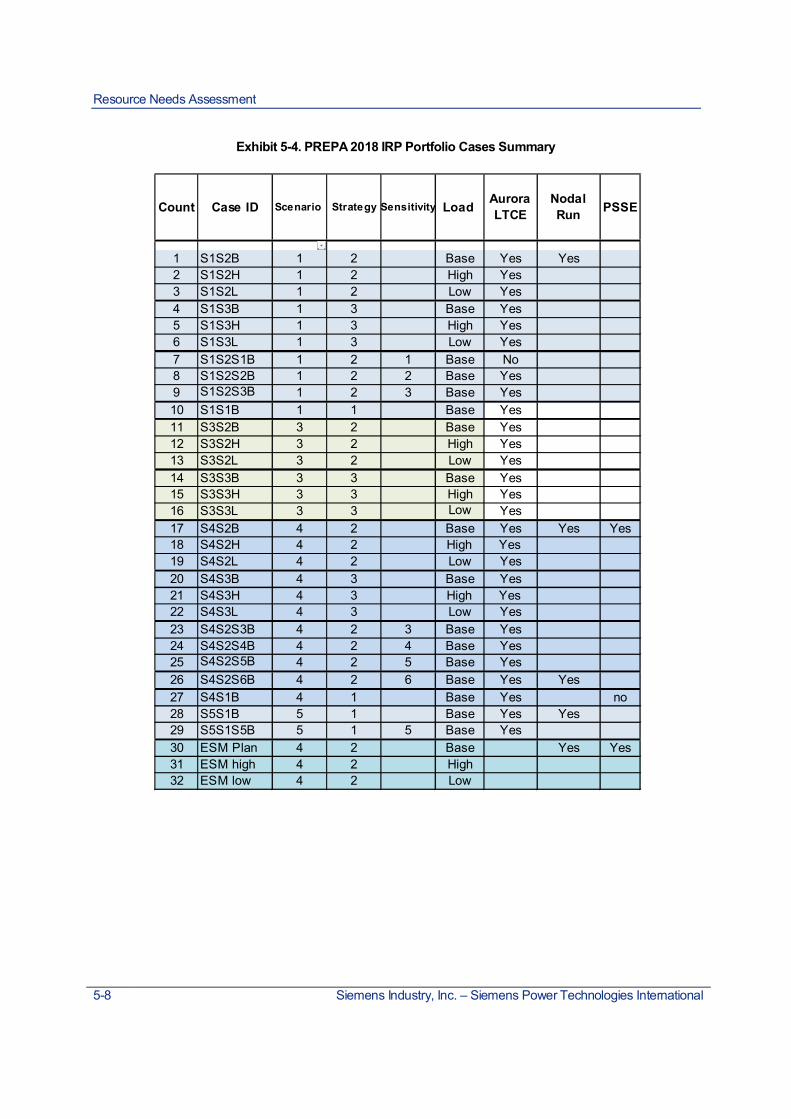
Resource Needs Assessment
5-8 Siemens Industry, Inc. – Siemens Power Technologies International
Exhibit 5-4. PREPA 2018 IRP Portfolio Cases Summary
Count Case ID Scenario Strategy Sensitivity Load AuroraLTCE
NodalRun PSSE
1 S1S2B 1 2 Base Yes Yes2 S1S2H 1 2 High Yes3 S1S2L 1 2 Low Yes4 S1S3B 1 3 Base Yes5 S1S3H 1 3 High Yes6 S1S3L 1 3 Low Yes7 S1S2S1B 1 2 1 Base No8 S1S2S2B 1 2 2 Base Yes9 S1S2S3B 1 2 3 Base Yes10 S1S1B 1 1 Base Yes11 S3S2B 3 2 Base Yes12 S3S2H 3 2 High Yes13 S3S2L 3 2 Low Yes14 S3S3B 3 3 Base Yes15 S3S3H 3 3 High Yes16 S3S3L 3 3 Low Yes17 S4S2B 4 2 Base Yes Yes Yes18 S4S2H 4 2 High Yes19 S4S2L 4 2 Low Yes20 S4S3B 4 3 Base Yes21 S4S3H 4 3 High Yes22 S4S3L 4 3 Low Yes23 S4S2S3B 4 2 3 Base Yes24 S4S2S4B 4 2 4 Base Yes25 S4S2S5B 4 2 5 Base Yes26 S4S2S6B 4 2 6 Base Yes Yes27 S4S1B 4 1 Base Yes no28 S5S1B 5 1 Base Yes Yes29 S5S1S5B 5 1 5 Base Yes30 ESM Plan 4 2 Base Yes Yes31 ESM high 4 2 High32 ESM low 4 2 Low

New Resource Options
Siemens Industry, Inc. – Siemens Power Technologies International 6-1 6-1
Part
6New Resource Options
Overview of New Generation ResourcesSiemens and PREPA discussed the key criteria in developing new generation resources to allow forsystem flexibility and reliability, including the capability to accommodate large blocks of renewablecapacity, primarily solar. Siemens conducted technology screening to identify technically feasible andcommercially viable generation resources that could be used as building blocks in constructinggeneration asset portfolios. For this reason, the technology screening focuses on resource optionsthat could meet PREPA’s new generation resource requirements, including:
1. Size of the new generation resource, which is informed by factors including size of the maximumcontingency and local reserve requirements, load profile, retirement of existing resources, andexpiration of PPOA, etc.
2. Resource type: base load, intermediate, intermittent, or peaking resources, largely determined byrenewable generation integration.
3. Characteristics: ramping rate and daily cycling capability.
4. Fuel type: fossil-fueled (natural gas, diesel or dual fuel with natural gas as primary and diesel asbackup).
5. Local considerations: altitude, temperature, natural wind or solar resources, etc.
6. The technology selection on a broader perspective considered a combination of dispatchablefossil-fueled generation resources, storage and renewable technologies.
7. Utility scale solar and storage for new builds of renewable resources.
8. Fossil-fueled resources included CCGT, GT, reciprocating internal combustion engines (RICE),and CHP. Siemens relied upon information exchanged with PREPA, performance and costinformation provided by vendors, as well as GT Pro27 software performance and cost calculationsin estimating representative generation resources.
27 GT Pro is a software program licensed by Thermoflow for sizing and designing simple cycle, combined cycle,cogeneration, GT, CCGT, CHP, and other types of power generation units. GT Pro was used to determine, among othermeasures, plant output, heat rate, duct firing capacity, and capital costs for the specified site conditions and available fuels.
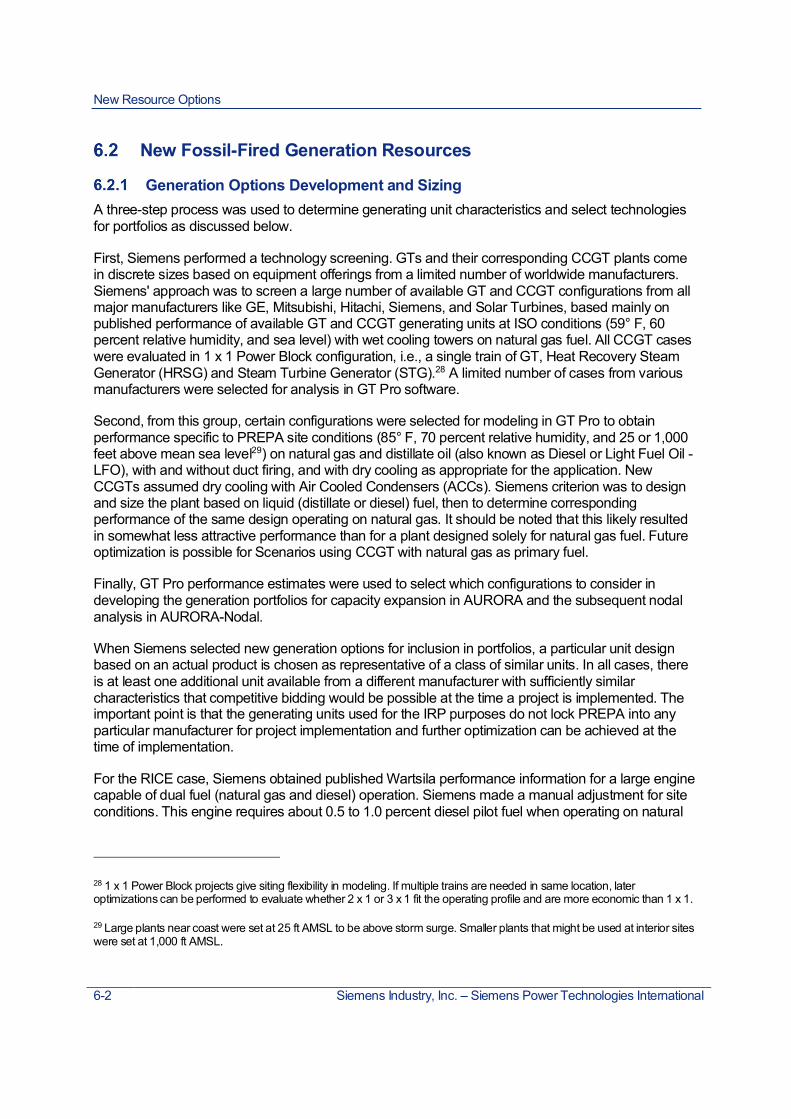
New Resource Options
6-2 Siemens Industry, Inc. – Siemens Power Technologies International
New Fossil-Fired Generation Resources
Generation Options Development and SizingA three-step process was used to determine generating unit characteristics and select technologiesfor portfolios as discussed below.
First, Siemens performed a technology screening. GTs and their corresponding CCGT plants comein discrete sizes based on equipment offerings from a limited number of worldwide manufacturers.Siemens' approach was to screen a large number of available GT and CCGT configurations from allmajor manufacturers like GE, Mitsubishi, Hitachi, Siemens, and Solar Turbines, based mainly onpublished performance of available GT and CCGT generating units at ISO conditions (59° F, 60percent relative humidity, and sea level) with wet cooling towers on natural gas fuel. All CCGT caseswere evaluated in 1 x 1 Power Block configuration, i.e., a single train of GT, Heat Recovery SteamGenerator (HRSG) and Steam Turbine Generator (STG).28 A limited number of cases from variousmanufacturers were selected for analysis in GT Pro software.
Second, from this group, certain configurations were selected for modeling in GT Pro to obtainperformance specific to PREPA site conditions (85° F, 70 percent relative humidity, and 25 or 1,000feet above mean sea level29) on natural gas and distillate oil (also known as Diesel or Light Fuel Oil -LFO), with and without duct firing, and with dry cooling as appropriate for the application. NewCCGTs assumed dry cooling with Air Cooled Condensers (ACCs). Siemens criterion was to designand size the plant based on liquid (distillate or diesel) fuel, then to determine correspondingperformance of the same design operating on natural gas. It should be noted that this likely resultedin somewhat less attractive performance than for a plant designed solely for natural gas fuel. Futureoptimization is possible for Scenarios using CCGT with natural gas as primary fuel.
Finally, GT Pro performance estimates were used to select which configurations to consider indeveloping the generation portfolios for capacity expansion in AURORA and the subsequent nodalanalysis in AURORA-Nodal.
When Siemens selected new generation options for inclusion in portfolios, a particular unit designbased on an actual product is chosen as representative of a class of similar units. In all cases, thereis at least one additional unit available from a different manufacturer with sufficiently similarcharacteristics that competitive bidding would be possible at the time a project is implemented. Theimportant point is that the generating units used for the IRP purposes do not lock PREPA into anyparticular manufacturer for project implementation and further optimization can be achieved at thetime of implementation.
For the RICE case, Siemens obtained published Wartsila performance information for a large enginecapable of dual fuel (natural gas and diesel) operation. Siemens made a manual adjustment for siteconditions. This engine requires about 0.5 to 1.0 percent diesel pilot fuel when operating on natural
28 1 x 1 Power Block projects give siting flexibility in modeling. If multiple trains are needed in same location, lateroptimizations can be performed to evaluate whether 2 x 1 or 3 x 1 fit the operating profile and are more economic than 1 x 1.
29 Large plants near coast were set at 25 ft AMSL to be above storm surge. Smaller plants that might be used at interior siteswere set at 1,000 ft AMSL.

New Resource Options
Siemens Industry, Inc. – Siemens Power Technologies International 6-3 6-3
gas. Siemens made a small adjustment to the RICE natural gas heat rate to account for the highercost of the pilot fuel.
All selected generation resources are analyzed based on dual fuel capability with natural gas anddiesel, with gas being the primary fuel when available and an option when not. For dual fuel units, theunit output and heat rate are somewhat different depending on the fuel type. The representativeoptions selected by Siemens are discussed in the next subsection.
Representative Future Generation Resources CharacteristicsAs indicated above, Siemens developed key operational parameters of the representative futuregeneration resources, primarily relying on published vendor information as well as vendor-suppliedperformance and cost information available in GT Pro performance software.
Exhibit 6-1 presents the operational parameters for an H Class Combined Cycle (GE S107HA.01)unit. Exhibit 6-2 and Exhibit 6-3 present the operational parameters of a larger F-Class CombinedCycle (CCGT - GE S107F.05) unit and a smaller F-Class Combined Cycle (CCGT - GE S107F.04)unit, respectively. Exhibit 6-4 presents the operational parameters for medium-sized combined cycle(Hitachi H-100). These units have a short minimum run time and hence can cycle in and out ofservice daily. Also, the minimum capacity is 39 to 48 percent of the duct fired capacity allowing asignificant reduction in output before the units must be turned off. In addition, the units can ramp upfrom their minimum to the maximum capacity in 3.5 to 8 minutes.
Exhibit 6-1. H Class Combined Cycle (GE S107HA.01)Operational Assumptions
Natural Gas DieselMax. Unit Capacity w/o Duct Fire MW 374 365Max. Unit Capacity with Duct Fire MW 449 438Min. Unit Capacity MW 176 172Min. Unit Capacity (% of Duct F Capacity) % 39% 39%Fixed O&M Expense 2018 $/kW-year 22.09 22.09Variable O&M Expense 2018 $/MWh 1.75 1.75Heat Rate at 100% Rated Capacity (Unfired) MMBtu/MWh 6.77 6.60Heat Rate at Full Duct Fire Capacity MMBtu/MWh 7.09 6.90Unit Capacity Degradation % 2.5% 2.5%Unit Heat Rate Degradation % 1.5% 1.5%Annual Required Maintenance Time Hours per Year 360 360Unit Forced Outage Rate % 2.0% 2.0%Unit Forced Outage Duration Hours 40 40Minimum Downtime Hours 2 2Minimum Runtime Hours 2 2Ramp Up Rate MW/minute 40 40Ramp Down Rate MW/minute 40 40Regulation Minimum Range MW 176 172Regulation Maximum Range MW 449 438Regulation Ramp Rate MW/minute 40 40
UnitGeneration Unit Type H Class CC (GE S107HA.01)
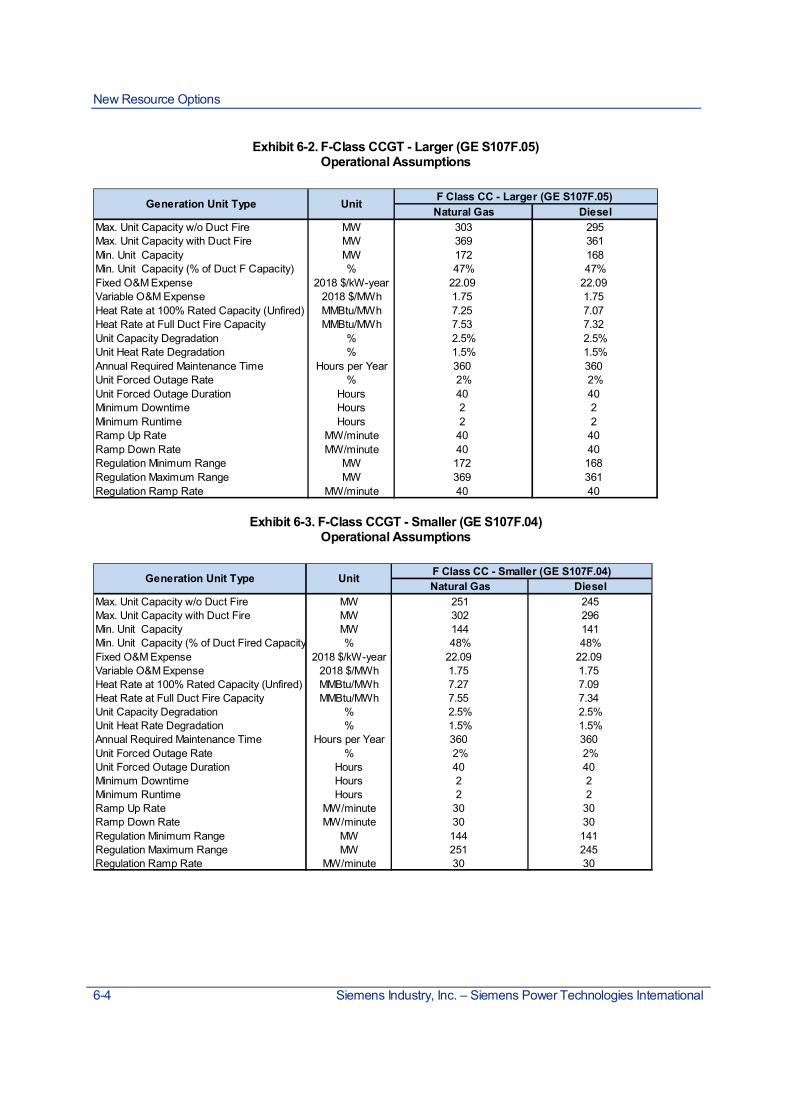
New Resource Options
6-4 Siemens Industry, Inc. – Siemens Power Technologies International
Exhibit 6-2. F-Class CCGT - Larger (GE S107F.05)Operational Assumptions
Exhibit 6-3. F-Class CCGT - Smaller (GE S107F.04)Operational Assumptions
Natural Gas DieselMax. Unit Capacity w/o Duct Fire MW 303 295Max. Unit Capacity with Duct Fire MW 369 361Min. Unit Capacity MW 172 168Min. Unit Capacity (% of Duct F Capacity) % 47% 47%Fixed O&M Expense 2018 $/kW-year 22.09 22.09Variable O&M Expense 2018 $/MWh 1.75 1.75Heat Rate at 100% Rated Capacity (Unfired) MMBtu/MWh 7.25 7.07Heat Rate at Full Duct Fire Capacity MMBtu/MWh 7.53 7.32Unit Capacity Degradation % 2.5% 2.5%Unit Heat Rate Degradation % 1.5% 1.5%Annual Required Maintenance Time Hours per Year 360 360Unit Forced Outage Rate % 2% 2%Unit Forced Outage Duration Hours 40 40Minimum Downtime Hours 2 2Minimum Runtime Hours 2 2Ramp Up Rate MW/minute 40 40Ramp Down Rate MW/minute 40 40Regulation Minimum Range MW 172 168Regulation Maximum Range MW 369 361Regulation Ramp Rate MW/minute 40 40
Generation Unit Type Unit F Class CC - Larger (GE S107F.05)
Natural Gas DieselMax. Unit Capacity w/o Duct Fire MW 251 245Max. Unit Capacity with Duct Fire MW 302 296Min. Unit Capacity MW 144 141Min. Unit Capacity (% of Duct Fired Capacity) % 48% 48%Fixed O&M Expense 2018 $/kW-year 22.09 22.09Variable O&M Expense 2018 $/MWh 1.75 1.75Heat Rate at 100% Rated Capacity (Unfired) MMBtu/MWh 7.27 7.09Heat Rate at Full Duct Fire Capacity MMBtu/MWh 7.55 7.34Unit Capacity Degradation % 2.5% 2.5%Unit Heat Rate Degradation % 1.5% 1.5%Annual Required Maintenance Time Hours per Year 360 360Unit Forced Outage Rate % 2% 2%Unit Forced Outage Duration Hours 40 40Minimum Downtime Hours 2 2Minimum Runtime Hours 2 2Ramp Up Rate MW/minute 30 30Ramp Down Rate MW/minute 30 30Regulation Minimum Range MW 144 141Regulation Maximum Range MW 251 245Regulation Ramp Rate MW/minute 30 30
Generation Unit Type Unit F Class CC - Smaller (GE S107F.04)
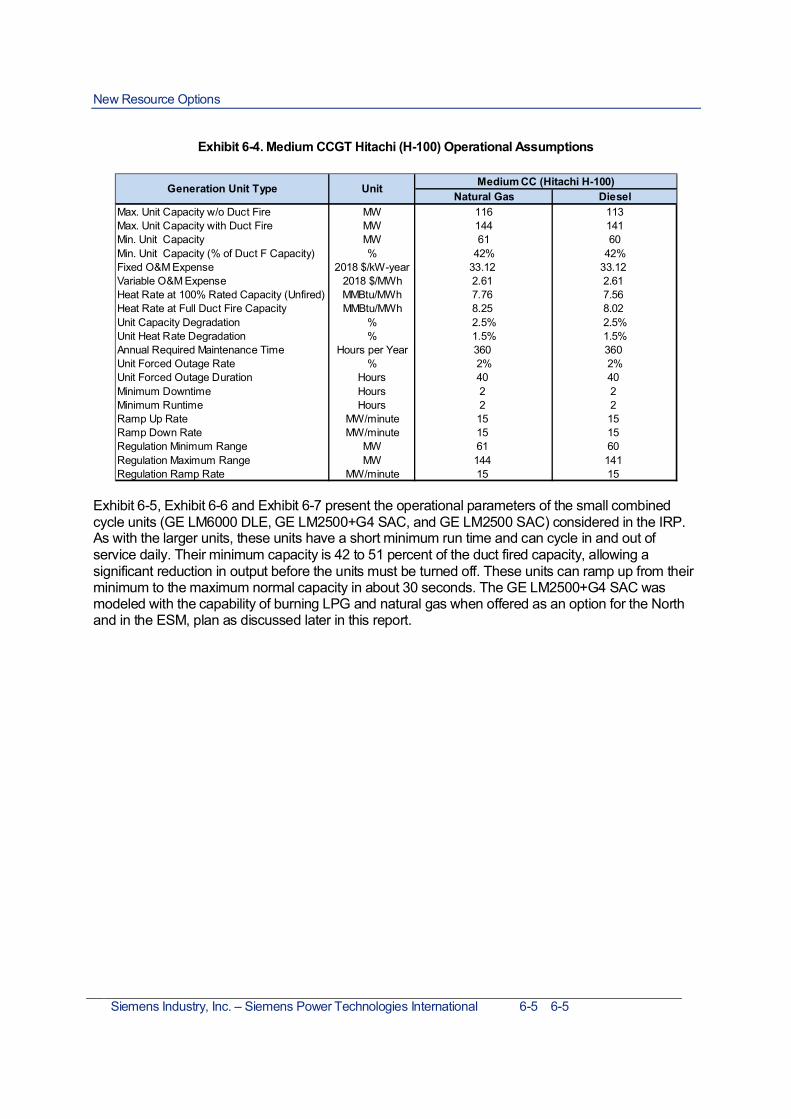
New Resource Options
Siemens Industry, Inc. – Siemens Power Technologies International 6-5 6-5
Exhibit 6-4. Medium CCGT Hitachi (H-100) Operational Assumptions
Exhibit 6-5, Exhibit 6-6 and Exhibit 6-7 present the operational parameters of the small combinedcycle units (GE LM6000 DLE, GE LM2500+G4 SAC, and GE LM2500 SAC) considered in the IRP.As with the larger units, these units have a short minimum run time and can cycle in and out ofservice daily. Their minimum capacity is 42 to 51 percent of the duct fired capacity, allowing asignificant reduction in output before the units must be turned off. These units can ramp up from theirminimum to the maximum normal capacity in about 30 seconds. The GE LM2500+G4 SAC wasmodeled with the capability of burning LPG and natural gas when offered as an option for the Northand in the ESM, plan as discussed later in this report.
Natural Gas DieselMax. Unit Capacity w/o Duct Fire MW 116 113Max. Unit Capacity with Duct Fire MW 144 141Min. Unit Capacity MW 61 60Min. Unit Capacity (% of Duct F Capacity) % 42% 42%Fixed O&M Expense 2018 $/kW-year 33.12 33.12Variable O&M Expense 2018 $/MWh 2.61 2.61Heat Rate at 100% Rated Capacity (Unfired) MMBtu/MWh 7.76 7.56Heat Rate at Full Duct Fire Capacity MMBtu/MWh 8.25 8.02Unit Capacity Degradation % 2.5% 2.5%Unit Heat Rate Degradation % 1.5% 1.5%Annual Required Maintenance Time Hours per Year 360 360Unit Forced Outage Rate % 2% 2%Unit Forced Outage Duration Hours 40 40Minimum Downtime Hours 2 2Minimum Runtime Hours 2 2Ramp Up Rate MW/minute 15 15Ramp Down Rate MW/minute 15 15Regulation Minimum Range MW 61 60Regulation Maximum Range MW 144 141Regulation Ramp Rate MW/minute 15 15
Generation Unit Type Unit Medium CC (Hitachi H-100)

New Resource Options
6-6 Siemens Industry, Inc. – Siemens Power Technologies International
Exhibit 6-5. Small CCGT (GE LM6000 DLE) (Duct Fired)Operational Assumptions
Source: Siemens
Exhibit 6-6. Small CCGT (GE LM2500 +G4 SAC)Operational Assumptions
Natural Gas DieselMax. Unit Capacity w/o Duct Fire MW 51 49Max. Unit Capacity with Duct Fire MW 66 63Min. Unit Capacity MW 27 26Min. Unit Capacity (% of Duct F Capacity) % 42% 42%Fixed O&M Expense 2018 $/kW-year 36.13 36.13Variable O&M Expense 2018 $/MWh 5.29 5.29Heat Rate at 100% Rated Capacity MMBtu/MWh 7.83 7.65Heat Rate at Full Duct Fire Capacity MMBtu/MWh 8.62 8.37Unit Capacity Degradation % 2.5% 2.5%Unit Heat Rate Degradation % 1.5% 1.5%Annual Required Maintenance Time Hours per Year 180 180Unit Forced Outage Rate % 2% 2%Unit Forced Outage Duration Hours 40 40Minimum Downtime Hours 2 2Minimum Runtime Hours 2 2Ramp Up Rate MW/minute 50 50Ramp Down Rate MW/minute 50 50Regulation Minimum Range MW 27 26Regulation Maximum Range MW 66 63Regulation Ramp Rate MW/minute 50 50
Generation Unit Type Unit Small CC (GE LM6000 DLE)
Natural Gas DieselMax. Unit Capacity MW 38 38Min. Unit Capacity MW 19 20Min. Unit Capacity (% of max Capacity) % 51% 51%Fixed O&M Expense 2018 $/kW-year 41.33 41.33Variable O&M Expense 2018 $/MWh 3.12 3.12Heat Rate at 100% Rated Capacity MMBtu/MWh 8.34 8.08Annual Required Maintenance Time Hours per Year 180 180Unit Forced Outage Rate % 2% 2%Unit Forced Outage Duration Hours 40 40Minimum Downtime Hours 2 2Minimum Runtime Hours 2 2Ramp Up Rate MW/minute 30 30Ramp Down Rate MW/minute 30 30Regulation Minimum Range MW 19 20Regulation Maximum Range MW 38 38Regulation Ramp Rate MW/minute 30 30
UnitGeneration Unit Type Small CC (GE LM2500+ G4 SAC)

New Resource Options
Siemens Industry, Inc. – Siemens Power Technologies International 6-7 6-7
Exhibit 6-7. Small CCGT (GE LM2500 SAC) Operational Assumptions
Exhibit 6-8, Exhibit 6-9 and Exhibit 6-10 present the operational parameters of the GT units (Mobile,GE LM6000 DLE, and GE LM2500 SAC) considered in the IRP, which can cycle in and out ofservice frequently. The units in Exhibit 6-8 are mobile units and are good candidates for replacementof the existing Frame 5 units (21 MW each).
These GT’s typically have a minimum capacity of 50% of the maximum (due to emissions limitations)and can ramp up from minimum to maximum capacity in less than 25 seconds.
Exhibit 6-8. Simple Cycle Mobile Unit
Natural Gas DieselMax. Unit Capacity MW 29 28Min. Unit Capacity MW 15 14Min. Unit Capacity (% of max Capacity) % 51% 51%Fixed O&M Expense 2018 $/kW-year 42.49 42.49Variable O&M Expense 2018 $/MWh 3.12 3.12Heat Rate at 100% Rated Capacity MMBtu/MWh 8.69 8.46Unit Capacity Degradation % 2.5% 2.5%Unit Heat Rate Degradation % 1.5% 1.5%Annual Required Maintenance Time Hours per Year 180 180Unit Forced Outage Rate % 2% 2%Unit Forced Outage Duration Hours 40 40Minimum Downtime Hours 2 2Minimum Runtime Hours 2 2Ramp Up Rate MW/minute 30 30Ramp Down Rate MW/minute 30 30Regulation Minimum Range MW 15 14Regulation Maximum Range MW 29 28Regulation Ramp Rate MW/minute 30 30
Generation Unit Type Unit Small CC (GE LM2500 SAC)

New Resource Options
6-8 Siemens Industry, Inc. – Siemens Power Technologies International
Exhibit 6-9. Simple Cycle Peaker GT (GE LM6000 DLE)Operational Assumptions
Exhibit 6-10. Simple Cycle Peaker GT (GE LM2500 SAC)Operational Assumptions
Source: Siemens
Exhibit 6-11 presents the operational parameters for the RICE technologies, which are very flexible,able to cycle frequently, and have low minimum loading and very fast loading rates.
Natural Gas DieselMax. Unit Capacity MW 41 39Min. Unit Capacity MW 21 19Min. Unit Capacity (% of Max Capacity) % 50% 50%Fixed O&M Expense 2018 $/kW-year 32.85 32.85Variable O&M Expense 2018 $/MWh 5.29 5.29Heat Rate at 100% Rated Capacity MMBtu/MWh 9.83 9.68Unit Capacity Degradation % 2.5% 2.5%Unit Heat Rate Degradation % 1.5% 1.5%Annual Required Maintenance Time Hours per Year 180 180Unit Forced Outage Rate % 0.02 0.02Unit Forced Outage Duration Hours 40 40Minimum Downtime Hours 2 2Minimum Runtime Hours 2 2Ramp Up Rate MW/minute 50 50Ramp Down Rate MW/minute 50 50Regulation Minimum Range MW 21 19Regulation Maximum Range MW 41 39Regulation Ramp Rate MW/minute 50 50
Generation Unit Type Unit SC Peaker (GE LM6000 DLE)
Natural Gas DieselMax. Unit Capacity MW 22 21Min. Unit Capacity MW 11 11Min. Unit Capacity (% of Max Capacity) % 50% 50%Fixed O&M Expense 2018 $/kW-year 38.63 38.63Variable O&M Expense 2018 $/MWh 3.12 3.12Heat Rate at 100% Rated Capacity MMBtu/MWh 11.49 11.14Unit Capacity Degradation % 2.5% 2.5%Unit Heat Rate Degradation % 1.5% 1.5%Annual Required Maintenance Time Hours per Year 180 180Unit Forced Outage Rate % 0.02 0.02Unit Forced Outage Duration Hours 40 40Minimum Downtime Hours 2 2Minimum Runtime Hours 2 2Ramp Up Rate MW/minute 30 30Ramp Down Rate MW/minute 30 30Regulation Minimum Range MW 11 11Regulation Maximum Range MW 22 21Regulation Ramp Rate MW/minute 30 30
Generation Unit Type Unit SC Peaker (GE LM2500 SAC)

New Resource Options
Siemens Industry, Inc. – Siemens Power Technologies International 6-9 6-9
Exhibit 6-11. Reciprocating Engine Operational Assumptions
Source: Siemens
As discussed, these selections are representative of each particular technology class and do notrepresent final recommendations of particular equipment or manufacturer. Exact sizing, configurationand performance should be optimized when an actual generation project is planned andimplemented. But for planning purposes, these units demonstrate how different representativetechnologies would fit in the overall dispatch analysis. Output and heat rate degradation are appliedas a single adjustment to the “New and Clean” performance to represent annual averageperformance over the generating unit’s operating life.
Combined Heat and Power (CHP) was also considered as an option and this is discussed inAppendix 4: Demand-Side Resources.
6.2.2.1 Existing Fleet ConsiderationsIn this IRP, no repowering of existing units is considered due to the complications associated withtrying to “recycle” aged infrastructure. However, the fuel conversion of San Juan 5&6 was consideredas a committed decision and there is the possibility of fuel conversions of the Aguirre CCGT. For thefuel conversion candidates, the capital costs assumptions are presented in Exhibit 6-12.
Exhibit 6-12. Fuel Conversion Projects Capital Costs Assumptions
Dual Fuel Conversion Projects Capital Costs (thousand 2018$)
Aguirre 1 CCGT Dual Fuel Conversion 25,371
Aguirre 2 CCGT Dual Fuel Conversion 25,371Source: Siemens
Natural Gas DieselMax. Unit Capacity MW 16 16Min. Unit Capacity MW 2 2Min. Unit Capacity (% of Max Capacity) % 10% 10%Fixed O&M Expense 2018 $/kW-year 28.98 28.98Variable O&M Expense 2018 $/MWh 10.33 10.33Heat Rate at 100% Rated Capacity MMBtu/MWh 8.53 8.89Unit Capacity Degradation % 1.0% 1.0%Unit Heat Rate Degradation % 0.5% 0.5%Annual Required Maintenance Time Hours per Year 360 360Unit Forced Outage Rate % 0.02 0.02Unit Forced Outage Duration Hours 40 40Minimum Downtime Hours 2 2Minimum Runtime Hours 2 2Ramp Up Rate MW/minute 2.5 2.5Ramp Down Rate MW/minute 2.5 2.5Regulation Minimum Range MW 5 5Regulation Maximum Range MW 16 16Regulation Ramp Rate MW/minute 2.5 2.5
Generation Unit Type Unit Reciprocating Engine

New Resource Options
6-10 Siemens Industry, Inc. – Siemens Power Technologies International
6.2.2.2 Representative Future Generation Resources Capital CostsCapital costs for the representative future generation resources are key parameters in the IRPmodels. Siemens developed the capital costs assumptions using the PEACE capital cost estimatingmodule associated with GT Pro software. PEACE uses equipment selection and sizing asdetermined in GT Pro to estimate equipment and installation costs, including associated costs suchas foundations, piping, wiring, buildings, etc. Other components including contractor engineering,commissioning, overhead, escalation, contingency and fees are added to determine the Engineering,Procurement and Construction (EPC) price. Owner’s costs for development, permitting andlegal/contracting activities, and cost escalation were included in PEACE. Most power projectsimplemented by private developers on a project non-recourse financing basis, incur totaldevelopment and financing costs, including Interest during Construction, financing fees, projectmanagement, O&M mobilization, startup fuels and consumables, etc. PEACE included 9 percent ofEPC for development costs. Also, PEACE includes certain adjustments to labor productivity andlabor and materials costs based on project location. However, the program does not includeadjustments specific to Puerto Rico costs. Siemens adopted the U.S. Department of Defense AreaCost Factor of 16 percent for Puerto Rico. This adjustment was inserted into PEACE as a user inputand it was applied against equipment, material and labor costs to reflect delivery or local purchaseand installation of equipment and materials for the project.
PEACE cost estimates are not as accurate as obtaining project specific equipment and constructioncosts estimates from suppliers and contractors but are suitable for planning purposes and provide aconsistent approach across all generation resource options. The PEACE cost estimates also reflectthe specific configuration and sizing of options, such as duct firing and Air-Cooled Condensers, whichneed to be considered when factoring costs based on other projects whose configurations may vary.Exhibit 6-13 shows the estimated all-in capital costs for the selected representative technologies.
Exhibit 6-13. New Generation Resources Capital Costs
Representative New Resource CandidatesNatural Gas Fired Diesel Fired
Capacity(MW)
Capital Costs(2018$/KW)
Capacity(MW)
Capital Costs(2018$/KW)
H Class CCGT (GE S107HA.01) 449 $899 438 $921F-Class CCGT (GE S107F.04) (Duct Fired) 302 $994 296 $1,017F-Class CCGT (GE S107F.05) (Duct Fired) 369 $927 361 $948Medium CCGT (Hitachi H-100) (Duct Fired) 144 $1,250 141 $1,275Small CCGT (GE LM6000 DLE) (Duct Fired) 66 $1,658 63 $1,729Small CCGT (GE LM2500+ G4 SAC) (Duct Fired) 38 $1,798 38 $1,812Small CCGT (GE LM2500 SAC) (Duct Fired) 29 $2,010 28 $2,052
Aero/Small GT Peaker (GE LM6000 DLE) 41 $1,375 39 $1,444Aero/Small GT Peaker (GE LM2500 SAC) 22 $1,627 21 $1,689Small CHP (Solar Turbines Mars 100) 9 $2,651 9 $2,639RICE (Wartsila 18V50DF) 16 $1,612 16 $1,612
Source: Siemens
For the replacement of the 21 MW Frame 5 units using the mobile units (FT8 MOBILEPAC 25 DLN)presented earlier, there are capital cost differences whether it is replacing an existing unit or addinganother unit on site. This is presented below.

New Resource Options
Siemens Industry, Inc. – Siemens Power Technologies International 6-11 6-11
Exhibit 6-14. New Generation Resources Capital Costs
The capital cost curves below are derived based of the 2018 National Renewable Energy Laboratory(NREL) Annual Technology Baseline for the Gas CC/CT based on Annual Energy Outlook 2018. Thecosts curves can be used to estimate the capital costs for future units considering the deploymentdates.
Exhibit 6-15. Capital Cost Curve for Gas CCGT
Source: Siemens, NREL 2018 ATB
500
700
900
1,100
1,300
1,500
1,700
1,900
2,100
2018
2019
2020
2021
2022
2023
2024
2025
2026
2027
2028
2029
2030
2031
2032
2033
2034
2035
2036
2037
2038
Cap
italC
ost(
2018
$/kW
)
F Class CCGT-GE S107F.05-NG F Class CCGT-GE S107F.04-NGMedium CCGT Hitachi (H-100)-NG Small CCGT-GE LM6000 DLE-NGSmall CCGT (GE LM2500+ G4 SAC)-NG Small CCGT (LM2500 SAC)-NGH Class CCGT (GE S107HA.01)- NG
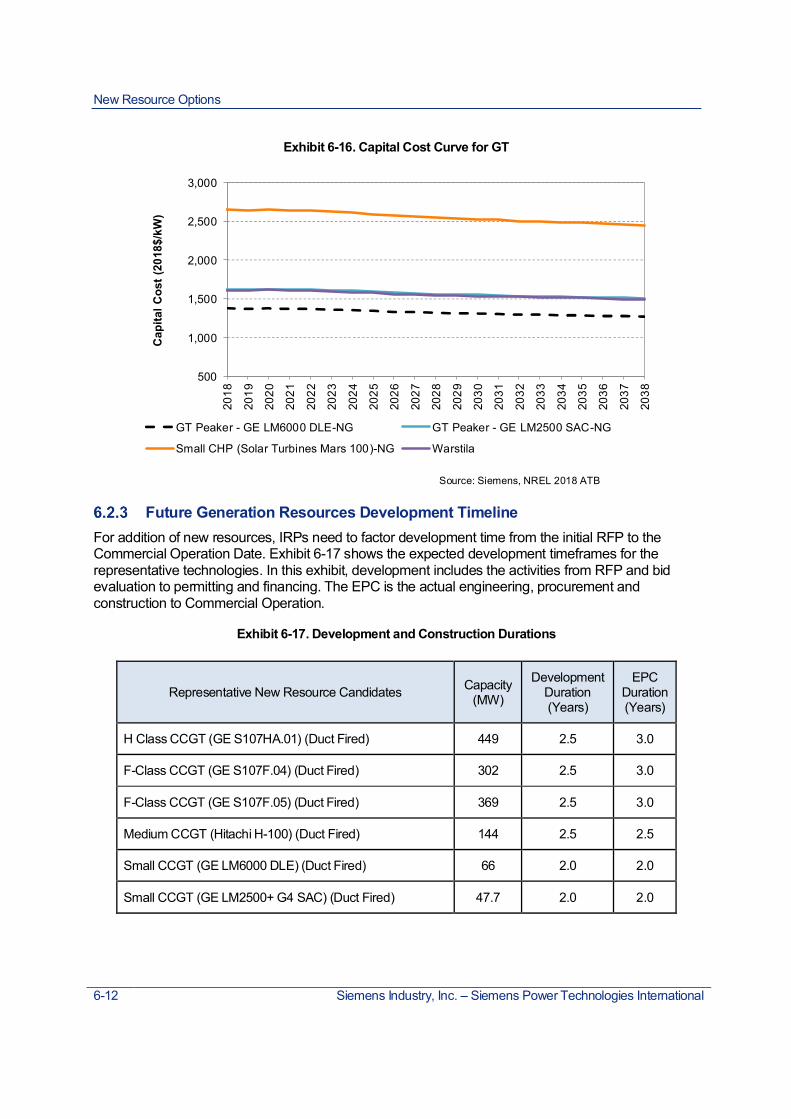
New Resource Options
6-12 Siemens Industry, Inc. – Siemens Power Technologies International
Exhibit 6-16. Capital Cost Curve for GT
Source: Siemens, NREL 2018 ATB
Future Generation Resources Development TimelineFor addition of new resources, IRPs need to factor development time from the initial RFP to theCommercial Operation Date. Exhibit 6-17 shows the expected development timeframes for therepresentative technologies. In this exhibit, development includes the activities from RFP and bidevaluation to permitting and financing. The EPC is the actual engineering, procurement andconstruction to Commercial Operation.
Exhibit 6-17. Development and Construction Durations
Representative New Resource Candidates Capacity(MW)
DevelopmentDuration(Years)
EPCDuration(Years)
H Class CCGT (GE S107HA.01) (Duct Fired) 449 2.5 3.0
F-Class CCGT (GE S107F.04) (Duct Fired) 302 2.5 3.0
F-Class CCGT (GE S107F.05) (Duct Fired) 369 2.5 3.0
Medium CCGT (Hitachi H-100) (Duct Fired) 144 2.5 2.5
Small CCGT (GE LM6000 DLE) (Duct Fired) 66 2.0 2.0
Small CCGT (GE LM2500+ G4 SAC) (Duct Fired) 47.7 2.0 2.0
500
1,000
1,500
2,000
2,500
3,000
2018
2019
2020
2021
2022
2023
2024
2025
2026
2027
2028
2029
2030
2031
2032
2033
2034
2035
2036
2037
2038
Cap
italC
ost(
2018
$/kW
)
GT Peaker - GE LM6000 DLE-NG GT Peaker - GE LM2500 SAC-NG
Small CHP (Solar Turbines Mars 100)-NG Warstila

New Resource Options
Siemens Industry, Inc. – Siemens Power Technologies International 6-13 6-13
Representative New Resource Candidates Capacity(MW)
DevelopmentDuration(Years)
EPCDuration(Years)
Small CCGT (GE LM2500 SAC) (Duct Fired) 35 2.0 2.0
Aero/Small GT Peaker (GE LM6000 DLE) 41 1.5 1.5
Aero/Small GT Peaker (GE LM2500 SAC) 22 1.5 1.5
Small CHP (Solar Turbines Mars 100) 9 1.5 1.5
RICE (Wartsila 18V50DF) 16 1.5 1.5Note: Capacity based on natural gas firing.
Levelized Cost of Energy (LCOE)A high level LCOE was calculated on all new technologies to form a preliminary view of theirrespective costs for the IRP.
The LCOE was estimated using the heat rate at 100% rated unfired capacity and consideringdelivered diesel and new natural gas prices (including commodity, liquefaction, and shipping, but notregasification costs) at San Juan to calculate fuel costs. The regasification costs were determinedconsidering a land-based LNG regasification terminal at San Juan with a pipeline to Palo Seco withmax daily gas volume of 93.6 MMcf/day to support a total generation capacity of 650 MW. Siemensestimated that this regasification infrastructure adds a fixed cost of $116.5/kW-year to any potentialnew gas-fired generation resources at San Juan or Palo Seco accounting for fixed operating costsand return on capital at a WACC (weighted average cost of capital) of 8.5 percent and an economiclife of 22 years. This same WACC was used to annualize the generation capital considering an asseteconomic life of 29 years for a large combined cycle plant and 20 years for the remainingtechnologies.
As a reference, Siemens also calculated the LCOE for Costa Sur 5 & 6 considering the O&M costsplus delivered gas. For AES, Siemens considered the forecasted cost of coal, O&M and capacitypayments. For EcoEléctrica, Siemens considered the two fuel components reflected in the PPOA; forenergy under 76% dispatch, and for the spot price energy produced above that level it was assumedto be equal to the delivered gas at San Juan. Siemens also factored in the EcoEléctrica O&M costsand capacity payments.
Exhibit 6-18 shows the LCOE of the large and medium CCGT with gas and a comparison with theestimated LCOE of Costa Sur 5&6, EcoEléctrica and AES. Exhibit 6-19 provides the numeric valuesof this LCOE. As can be observed below, depending on the dispatch (and the fuel price assumptionsmade), it is possible that EcoEléctrica could be economically retired as well as Costa Sur 5&6,considering that its replacement by a flexible CCGT will reduce the need for energy storage capacity.This result would change for the case where the EcoEléctrica contract is renegotiated, and thecapacity payments are reduced.

New Resource Options
6-14 Siemens Industry, Inc. – Siemens Power Technologies International
Exhibit 6-18. Large and Medium CCGT with Gas, Costa Sur 5&6,EcoEléctrica and AES
Source: Siemens
Exhibit 6-19. LCOE for Large and Medium Combined Cycle units
Source: Siemens
Case Description
ManufacturerModelType
Capacity MW 449 438 369 361 302 296 144 141
Fuel NG Diesel NG Diesel NG Diesel NG Diesel
Capacity Factor5% 565 360 574 373 589 388 674 47810% 309 235 316 246 323 253 368 30315% 224 193 230 203 235 208 266 24420% 182 173 187 182 191 186 215 21525% 156 160 161 169 164 172 185 19730% 139 152 144 161 146 163 164 18535% 127 146 131 154 134 157 150 17740% 118 141 122 150 124 152 139 17145% 111 138 115 146 117 148 130 16650% 105 135 109 144 111 145 124 16255% 100 133 105 141 106 143 118 15960% 96 131 101 139 102 141 113 15665% 93 129 97 138 99 139 109 15470% 90 128 94 136 96 138 106 15275% 88 127 92 135 93 136 103 15080% 86 126 90 134 91 135 101 14985% 84 125 88 133 89 134 98 14890% 82 124 86 132 87 133 96 146
LCOE (2018$/MWh)
H Class CCGT
GES107HA.01
CC 1x1
F ClassCCGT
F ClassCCGT
MediumCCGT
CC 1x1CC - S107F.05
GE GE MHPS
CC 1x1 CC 1x1S107F.04 H-100

New Resource Options
Siemens Industry, Inc. – Siemens Power Technologies International 6-15 6-15
With respect of the small CCGT units, GT and the Wärtsilä RICE, Exhibit 6-20 below shows theLCOE cost converge near the expected capacity factor ranges, with perhaps the LM2500 being theleast competitive. The LCOE is presented considering Diesel (LFO) as the likely fuel for these units.Exhibit 6-21 show the numeric values for the LCOE for the small CCGT units and Exhibit 6-22 for theCHP option. Siemens further notes in this exhibit that for applications where large amount of powerare required, the H-100 Combined Cycle and the LM6000 Combined Cycle are competitive even atvery small capacity factors.
Exhibit 6-20. Small CCGT, Peakers (GT) and RICE with Diesel
Source: Siemens

New Resource Options
6-16 Siemens Industry, Inc. – Siemens Power Technologies International
Exhibit 6-21. LCOE for Small Combined Cycle units andGT Aero Peakers
Source: Siemens
CaseDescriptionManufacturer
ModelType
x` 63 38 38 29 28 41 39 22 21
Fuel NG Diesel NG Diesel NG Diesel NG Diesel NG Diesel
Capacity Factor5% 814 631 861 667 918 734 754 588 838 68210% 440 381 464 402 494 438 417 376 465 43415% 315 298 332 313 353 340 305 306 340 35120% 253 256 266 269 282 290 249 270 278 31025% 215 231 226 242 240 261 215 249 241 28530% 190 214 200 225 211 241 193 235 216 26935% 173 202 181 212 191 227 177 225 198 25740% 159 194 167 202 176 216 165 217 185 24845% 149 187 156 195 164 208 156 211 175 24150% 140 181 147 189 155 201 148 207 166 23655% 134 177 140 184 147 196 142 203 159 23160% 128 173 134 180 141 192 137 200 154 22865% 123 170 128 177 135 188 133 197 149 22470% 119 167 124 174 131 184 129 195 145 22275% 115 164 120 171 127 182 126 193 141 21980% 112 162 117 169 123 179 123 191 138 21785% 110 160 114 167 120 177 121 189 135 21590% 107 159 111 166 117 175 118 188 133 214
Aero SC/Peaker
CC-LM2500 SACGE
CC 1x1CC - LM6000 DLE
Aero or SmallCCGT
Aero or SmallCCGT
GE GE
Aero or SmallCCGT
SC
Aero SC/Peaker
SC
LCOE (2018$/MWh)
SC-LM6000 DLE SC - LM2500 SAC
CC 1x1 CC 1x1
GE GECC - LM2500+ G4 SAC

New Resource Options
Siemens Industry, Inc. – Siemens Power Technologies International 6-17 6-17
Exhibit 6-22. LCOE for CHP and RICE Units
Source: Siemens
Solar Photovoltaic (PV) ProjectsThe IRP assumes utility scale solar for new builds of renewable resources. The cost estimates forutility scale solar PV projects are developed through the following steps: 1) establish baseline solarPV operating and overnight capital costs estimate; 2) evaluate interconnection and land costs specificto Puerto Rico; 3) assess construction and financing costs reflecting Puerto Rico specificassumptions; and 4) calculate Levelized Cost of Energy (LCOE) for solar PV in Puerto Rico.
Baseline Operating and Overnight Capital CostsFor step 1, the IRP assumes overnight capital costs and operating costs for utility-scale PV systemsconsistent with the recently published 2018 Annual Technology Baseline (ATB) by NationalRenewable Energy Laboratory (NREL) as shown in Exhibit 6-23. The PV system is representative ofone-axis tracking systems with performance and pricing characteristics; this cost is somewhat higherthan the cost of fixed tilt normally used in Puerto Rico, but it was maintained considering that in theterritory additional costs may be incurred for hardening. The assumptions below do not account for a
CaseDescription RICE
Manufacturer WartsilaModelType
Capacity MW 9 9 9 9 16
Fuel NG Diesel NG Diesel Diesel
Capacity5% 1124 962 1076 867 60610% 614 587 566 491 37815% 444 461 396 366 30220% 359 399 311 304 26425% 308 361 260 266 24230% 274 336 226 241 22635% 250 318 202 223 21640% 232 305 183 210 20745% 217 294 169 199 20150% 206 286 158 191 19655% 197 279 149 184 19260% 189 274 141 178 18865% 183 269 134 174 18570% 177 265 129 169 18375% 172 261 124 166 18180% 168 258 120 163 17985% 164 255 116 160 17790% 161 253 113 158 176
CHP(56% Heat Rate)
Solar TurbinesMars 100
Cogen -- LP steam
CHP
LCOE (2018$/MWh)
Wartsila 18V50DFMars 100
Cogen -- LP steam
Solar Turbines

New Resource Options
6-18 Siemens Industry, Inc. – Siemens Power Technologies International
1.3 DC-to-AC ratio, otherwise known as inverter loading ratio that is included when calculating theLCOE.
Exhibit 6-23. U.S. Utility Scale Solar PV Costs Assumptions
Source: NREL 2018 ATB, converted to $2018. (https://atb.nrel.gov/electricity/data.html)
Interconnection CostsThe NREL benchmark includes the transformation to transmission voltage level (e.g. 115 kV) and acost of $0.03/Wdc30 for interconnection costs to the point of interconnection (POI) and a cost of$263,000 for the interconnecting lines (Gen-Ties) to the POI (based on a 30 MW plant). In the caseof PREPA, these costs can change significantly, thus Siemens added the PREPA specific cost to itsestimate and subtracted the corresponding NREL cost element. Exhibit 6-24 shows theinterconnection costs assumed for a solar PV project that includes the expansion of an existingsubstation with one new bay for the solar PV project, the expansion of the control house, and 1 mileof interconnecting line. All unit costs shown were provided by PREPA.
Exhibit 6-24. Interconnection Costs
Note: The NREL interconnection costs are subject to update upon receiving response from the NREL
30 The NREL interconnection costs are subject to update upon receiving response from the NREL
Year Year
2018 1,087 9.52 2018 960 8.512019 1,046 9.11 2019 912 8.042020 984 8.37 2020 870 7.452021 933 7.80 2021 833 7.002022 923 7.71 2022 810 6.812023 912 7.63 2023 786 6.622024 902 7.54 2024 763 6.432025 891 7.46 2025 739 6.242026 880 7.38 2026 715 6.052027 870 7.29 2027 692 5.872028 859 7.21 2028 668 5.682029 849 7.12 2029 645 5.492030 838 7.04 2030 621 5.302031 831 6.98 2031 611 5.222032 824 6.92 2032 600 5.132033 817 6.86 2033 590 5.052034 809 6.81 2034 582 4.982035 802 6.75 2035 565 4.852036 795 6.69 2036 552 4.742037 788 6.63 2037 538 4.642038 780 6.57 2038 525 4.532039 773 6.52 2039 512 4.43
NREL 2018 Annual Technology Baseline (ATB) Mid Case NREL 2018 Annual Technology Baseline (ATB) Low Case
PV Overnight Capital Costs$2018/KWdc
Fixed OperatingCosts
$2018/kW-year (dc)PV Overnight Capital Costs
$2018/KWdc
Fixed OperatingCosts
$2018/kW-year (dc)
Interconnection Costs Unit Value Unit Price $/unit Capital ($ 000)Interconnecting Line (Gen-Tie) Miles 1 1,500,000 1,500Right of Way Costs (115 kV 50 ft wide) m2 24,521 3 74New Bay for Interconnection Each 1 2,400,000 2,400Control House Extension Each 1 300,000 300Total Interconnection Cost 4,274Cost already included in NREL (1,433)Total Adjusted Interconnection Cost 2,840

New Resource Options
Siemens Industry, Inc. – Siemens Power Technologies International 6-19 6-19
Land CostsPV facilities require large stretches of land. NREL on its report “Land-Use Requirements for SolarPower Plants in the United States” indicates that for large projects (greater than 20 MW) the land useis approximately 7.5 acres per MWac for fixed tilt systems and approximately and 8.3 acres perMWac for one-axis tilt systems. These values are in the mid-range of project values ranging from 9acres per MWac to 5 acres per MWac, based on Siemens projects experience.
Using NREL values, a 30 MW31 project would require an area of 225 acres or 910,543 m2. Using theland cost provided by PREPA the table below shows Siemens estimation of costs for a 30 MWproject. Note that in this table, Siemens is subtracting the costs already included in NREL benchmark($0.03/Wdc).
Exhibit 6-25. Land Costs
Weighted Average Cost of Capital (WACC)In the context of developing a consensus assumption of WACC among key stakeholders, Siemensacknowledges a few important factors impacting both the cost and availability of capital. With $9billion debt outstanding, PREPA currently has no access to bond market and bank financing. Inaddition, recent Act 120-2018 authorized PREPA to sell its generating assets to potential privatebuyers.
Based on discussions with stakeholders, Siemens considers future builds to be financed by thirdparties and consider that PREPA obtain financial backing to contract as a credit-worthy counterparty,if and as needed. Exhibit 6-26 shows the component assumptions deriving a nominal weightedaverage cost of capital of 8.50%.
31 30 MW was selected as a representative size of a utility scale project.
Land Costs (30 MW Solar) Unit Value Unit Price $/unit Capital ($ 000)Area for PV Project m2 910,543 3 2,732Cost already included in NREL 1,170Total land cost 1,562

New Resource Options
6-20 Siemens Industry, Inc. – Siemens Power Technologies International
Exhibit 6-26. Weighted Average Cost of Capital Assumptions
Note: The corporate income tax rate is assumed based on a base rate of 20%, plus a graduatedsurcharge ranging from 5% to 19%32.
Investment Tax Credit (ITC)The solar Investment Tax Credit (ITC) is one of the most important federal policy mechanisms tosupport the deployment of solar energy in the United States. Consistent with the current policy, theIRP assumes the following: solar facilities that commence construction prior to January 1, 2020 willqualify for the full amount of the ITC (i.e., 30 percent); solar facilities that commence constructionduring 2020, the amount of the ITC will be reduced from 30 percent to 26 percent; solar facilities thatcommence construction during 2021, the amount of the ITC will be reduced from 26 percent to 22percent; and solar facilities that commence construction in 2022 or thereafter, the amount of the ITCwill drop to 10 percent.
Project Development and Construction TimeBased on discussions with PREPA, the IRP assumes an accelerated timeline for solar projects,assuming 12 months for the development period (request for proposal, bid evaluation, permitting, andfinancing) and 12 months for construction.
This time line assumes fast track permitting, proper submittal of project design for evaluation byPREPA (particularly for mathematical model evaluation, and control, protection andtelecommunications design), as well as securing the land for the interconnection line and anyadditional land acquisition required for interconnection at PREPA’s facilities that will be secured by
32 Deloitte International Tax Puerto Rico Highlights 2018
Cost of EquityAsset Beta 0.70Income Tax Rate 39.00%Debt to Equity Ratio 0.90Equity Beta 1.08
Risk-Free Rate 2.95%Equity Risk Premium 5.50%Company Specific Risk Premium 4.00%Cost of Equity 12.91%
Cost of DebtCost of Debt, Pre-tax 5.00%Tax Rate 32.0%Cost of Debt, After-tax 3.40%
Weighted Average Cost of CapitalAfter-tax Cost of Debt 3.40%Percent Debt 47%Cost of Equity 12.91%Percent Equity 53%WACC 8.50%
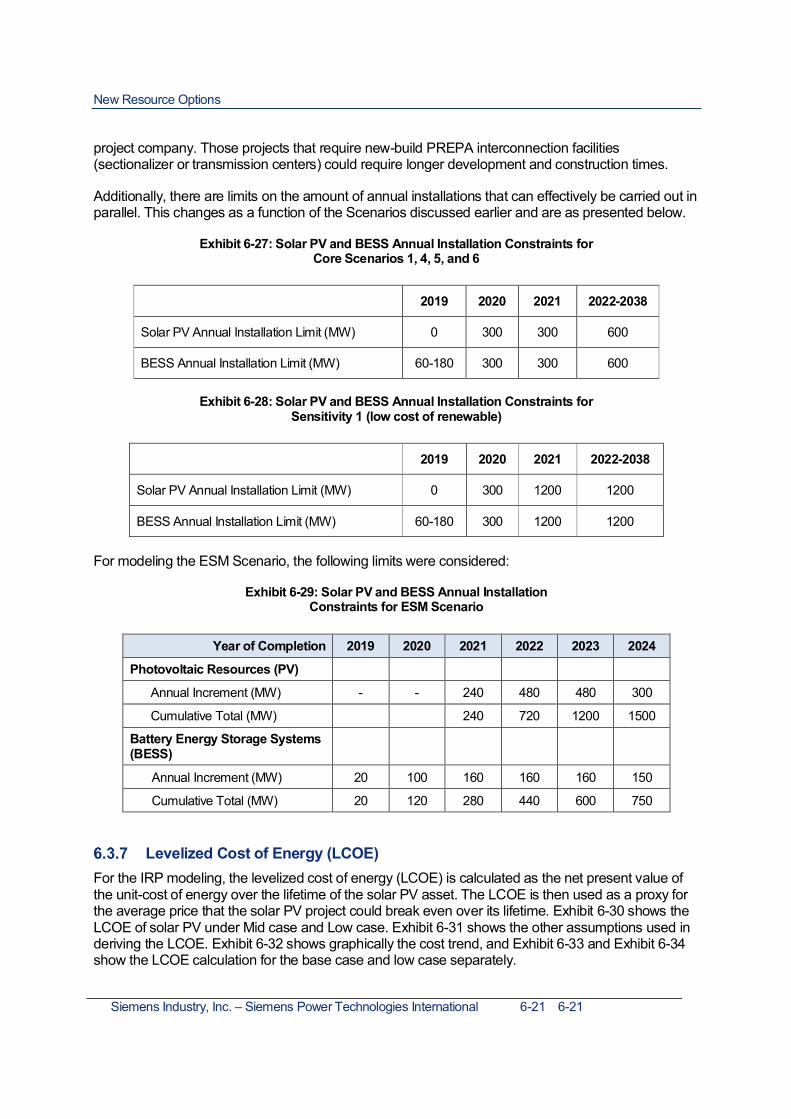
New Resource Options
Siemens Industry, Inc. – Siemens Power Technologies International 6-21 6-21
project company. Those projects that require new-build PREPA interconnection facilities(sectionalizer or transmission centers) could require longer development and construction times.
Additionally, there are limits on the amount of annual installations that can effectively be carried out inparallel. This changes as a function of the Scenarios discussed earlier and are as presented below.
Exhibit 6-27: Solar PV and BESS Annual Installation Constraints forCore Scenarios 1, 4, 5, and 6
2019 2020 2021 2022-2038
Solar PV Annual Installation Limit (MW) 0 300 300 600
BESS Annual Installation Limit (MW) 60-180 300 300 600
Exhibit 6-28: Solar PV and BESS Annual Installation Constraints forSensitivity 1 (low cost of renewable)
2019 2020 2021 2022-2038
Solar PV Annual Installation Limit (MW) 0 300 1200 1200
BESS Annual Installation Limit (MW) 60-180 300 1200 1200
For modeling the ESM Scenario, the following limits were considered:
Exhibit 6-29: Solar PV and BESS Annual InstallationConstraints for ESM Scenario
Year of Completion 2019 2020 2021 2022 2023 2024
Photovoltaic Resources (PV)
Annual Increment (MW) - - 240 480 480 300
Cumulative Total (MW) 240 720 1200 1500
Battery Energy Storage Systems(BESS)
Annual Increment (MW) 20 100 160 160 160 150
Cumulative Total (MW) 20 120 280 440 600 750
Levelized Cost of Energy (LCOE)For the IRP modeling, the levelized cost of energy (LCOE) is calculated as the net present value ofthe unit-cost of energy over the lifetime of the solar PV asset. The LCOE is then used as a proxy forthe average price that the solar PV project could break even over its lifetime. Exhibit 6-30 shows theLCOE of solar PV under Mid case and Low case. Exhibit 6-31 shows the other assumptions used inderiving the LCOE. Exhibit 6-32 shows graphically the cost trend, and Exhibit 6-33 and Exhibit 6-34show the LCOE calculation for the base case and low case separately.

New Resource Options
6-22 Siemens Industry, Inc. – Siemens Power Technologies International
Exhibit 6-30. Levelized Cost of Energy (LCOE) of Solar PV
Exhibit 6-31. Levelized Cost of Energy (LCOE) Assumptions
2018 69 622019 67 592020 63 562021 64 582022 67 602023 78 682024 77 672025 76 652026 76 632027 75 612028 74 592029 73 572030 72 552031 72 552032 71 542033 71 532034 70 522035 70 512036 69 502037 68 492038 68 48
Mid Case Solar PV2018$/MWh
Commercial On Line (COD)Year
Low Case Solar PV2018$MWh
Levelized Cost of Energy in Puerto Rico
Item Unit AssumptionDC / AC Conversion X 1.3Size MW 30Solar Capacity Factor % 22%Wind Capacity Factor % 25%Puerto Rico Solar Overnight Cost Adder % 16%Solar Construction Finance Factor % 101.5%Wind Construction Finance Factor % 102.5%Small Scale Adder % 0%Solar PV /Wind Capital Recovery Period year 30Battery Storage Capital Recovery Period year 20$2016 to $2018 Conversion X 1.035
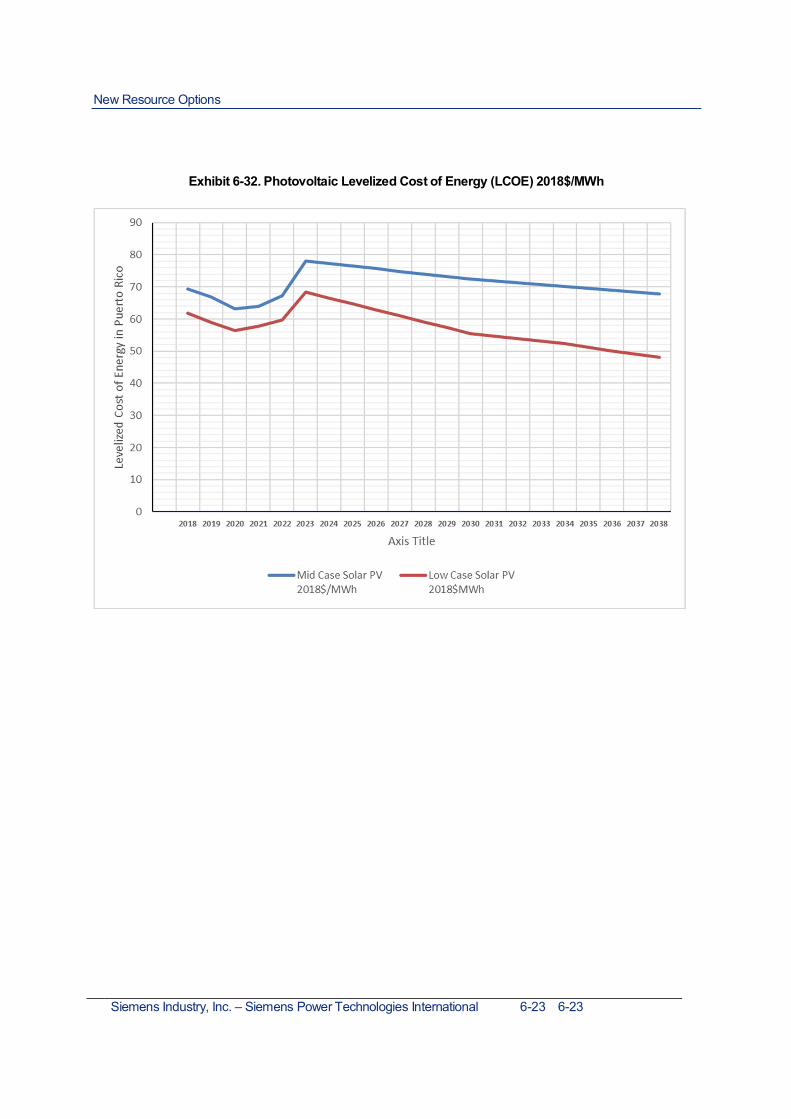
New Resource Options
Siemens Industry, Inc. – Siemens Power Technologies International 6-23 6-23
Exhibit 6-32. Photovoltaic Levelized Cost of Energy (LCOE) 2018$/MWh

New Resource Options
6-24 Siemens Industry, Inc. – Siemens Power Technologies International
Exhibit 6-33. Levelized Cost of Energy (LCOE) of Solar PV – Base Case
Commercial on line year 2019 2020 2021 2022 2023 2024 2025 2030 2035 2038Construction Start Year 2018 2019 2020 2021 2022 2023 2024 2029 2034 2037Capital and Operating CostsOvernight Cost, US National, 100 MW $2018/Wdc 1.05 0.98 0.93 0.92 0.91 0.90 0.89 0.84 0.80 0.78AC/DC Conversion X 1.30 1.30 1.30 1.30 1.30 1.30 1.30 1.30 1.30 1.30Puerto Rico Adder % 16% 16% 16% 16% 16% 16% 16% 16% 16% 16%Overnight Cost, Puerto Rico, 100 MW $2018/Wac 1.58 1.48 1.41 1.39 1.38 1.36 1.34 1.26 1.21 1.18IDC Cost Adder % 1.5% 1.5% 1.5% 1.5% 1.5% 1.5% 1.5% 1.5% 1.5% 1.5%All-In Cost, Puerto Rico, 100 MW, $/Wac $2018/Wac 1.60 1.51 1.43 1.41 1.40 1.38 1.36 1.28 1.23 1.19Small Scale Adder (30 MW) % 0% 0% 0% 0% 0% 0% 0% 0% 0% 0%Base Cost, Puerto Rico, 30 MW $2018/Wac 1.60 1.51 1.43 1.41 1.40 1.38 1.36 1.28 1.23 1.19Fixed O&M $2018/kW-yr 11.85 10.88 10.14 10.03 9.92 9.81 9.70 9.15 8.77 8.55
30 MW Solar PV Project ParametersCapacity MW 30 30 30 30 30 30 30 30 30 30Capacity Factor % 22% 22% 22% 22% 22% 22% 22% 22% 22% 22%Energy Produced MWh 57,816 57,816 57,816 57,816 57,816 57,816 57,816 57,816 57,816 57,816
Base Capital PV System $2018 thousand 48,033 45,207 42,853 42,369 41,885 41,401 40,917 38,498 36,835 35,837Interconnection Costs $2018 thousand 2,840 2,840 2,840 2,840 2,840 2,840 2,840 2,840 2,840 2,840Land Costs $2018 thousand 1,562 1,562 1,562 1,562 1,562 1,562 1,562 1,562 1,562 1,562Total PV System Capital Costs $2018 thousand 52,435 49,609 47,255 46,771 46,287 45,803 45,319 42,900 41,237 40,239
ITC % 30% 30% 26% 22% 10% 10% 10% 10% 10% 10%Income Tax % 32% 32% 32% 32% 32% 32% 32% 32% 32% 32%Capital Recovery Factor % 9.3% 9.3% 9.3% 9.3% 9.3% 9.3% 9.3% 9.3% 9.3% 9.3%Project Financing Factor % 71% 71% 76% 81% 97% 97% 97% 97% 97% 97%Construction Financing Factor % 1.02 1.02 1.02 1.02 1.02 1.02 1.02 1.02 1.02 1.02
Annualized PV Capital Costs $2018 thousand 3,510 3,321 3,392 3,584 4,220 4,176 4,132 3,911 3,759 3,668Fixed O&M $2018 thousand 355 327 304 301 297 294 291 274 263 256Total Base PV System Cost $2018 thousand 3,866 3,648 3,697 3,885 4,517 4,470 4,422 4,186 4,023 3,925Levelized Cost of Energy (PV Base) $2018/MWh 67 63 64 67 78 77 76 72 70 68

New Resource Options
Siemens Industry, Inc. – Siemens Power Technologies International 6-25 6-25
Exhibit 6-34. Levelized Cost of Energy (LCOE) of Solar PV – Low Case]
Commercial on line year 2019 2020 2021 2022 2023 2024 2025 2030 2035 2038Construction Start Year 2018 2019 2020 2021 2022 2023 2024 2029 2034 2037Capital and Operating CostsOvernight Cost, US National, 100 MW $2018/Wdc 0.91 0.87 0.83 0.81 0.79 0.76 0.74 0.62 0.56 0.53AC/DC Conversion X 1.30 1.30 1.30 1.30 1.30 1.30 1.30 1.30 1.30 1.30Puerto Rico Adder % 16% 16% 16% 16% 16% 16% 16% 16% 16% 16%Overnight Cost, Puerto Rico, 100 MW $2018/Wac 1.38 1.31 1.26 1.22 1.19 1.15 1.11 0.94 0.85 0.79IDC Cost Adder % 1.5% 1.5% 1.5% 1.5% 1.5% 1.5% 1.5% 1.5% 1.5% 1.5%All-In Cost, Puerto Rico, 100 MW, $/Wac $2018/Wac 1.40 1.33 1.28 1.24 1.20 1.17 1.13 0.95 0.86 0.80Small Scale Adder (30 MW) % 0% 0% 0% 0% 0% 0% 0% 0% 0% 0%Base Cost, Puerto Rico, 30 MW $2018/Wac 1.40 1.33 1.28 1.24 1.20 1.17 1.13 0.95 0.86 0.80Fixed O&M $2018/kW-yr 10.45 9.69 9.10 8.85 8.61 8.36 8.12 6.89 6.30 5.89
30 MW Solar PV Project ParametersCapacity MW 30 30 30 30 30 30 30 30 30 30Capacity Factor % 22% 22% 22% 22% 22% 22% 22% 22% 22% 22%Energy Produced MWh 57,816 57,816 57,816 57,816 57,816 57,816 57,816 57,816 57,816 57,816
Base Capital PV System $2018 thousand 41,885 39,933 38,273 37,189 36,105 35,021 33,937 28,517 25,935 24,116Interconnection Costs $2018 thousand 2,840 2,840 2,840 2,840 2,840 2,840 2,840 2,840 2,840 2,840Land Costs $2018 thousand 1,562 1,562 1,562 1,562 1,562 1,562 1,562 1,562 1,562 1,562Total PV System Capital Costs $2018 thousand 46,287 44,335 42,675 41,591 40,507 39,423 38,339 32,919 30,337 28,518
ITC % 30% 30% 26% 22% 10% 10% 10% 10% 10% 10%Income Tax % 32% 32% 32% 32% 32% 32% 32% 32% 32% 32%Capital Recovery Factor % 9.3% 9.3% 9.3% 9.3% 9.3% 9.3% 9.3% 9.3% 9.3% 9.3%Project Financing Factor % 71% 71% 76% 81% 97% 97% 97% 97% 97% 97%Construction Financing Factor % 1.02 1.02 1.02 1.02 1.02 1.02 1.02 1.02 1.02 1.02
Annualized PV Capital Costs $2018 thousand 3,099 2,968 3,064 3,187 3,693 3,594 3,495 3,001 2,766 2,600Fixed O&M $2018 thousand 314 291 273 266 258 251 243 207 189 177Total Base PV System Cost $2018 thousand 3,412 3,259 3,337 3,453 3,951 3,845 3,739 3,208 2,955 2,777Levelized Cost of Energy (PV Base) $2018/MWh 59 56 58 60 68 67 65 55 51 48

New Resource Options
6-26 Siemens Industry, Inc. – Siemens Power Technologies International
Minimum Technical Requirements (MTR)Renewable energy projects in Puerto Rico must comply with minimum technical requirements (MTR)to allow for their integration into the island’s grid. In addition to the frequency ride through, voltageride through and voltage regulation requirements, the MTR require the renewable generation tocontribute to frequency response and most importantly limits its ramps to 10% of the project’sContractual Capacity per minute for both increase and decreases in production. This last requirementis subject to the limitations of the Battery Energy Storage System (BESS) with a Nominal StorageCapacity (NSC) equal to 30% of the Contractual Capacity and an Effective Storage Capacity (ESC)of 45% of the Contractual Capacity, deliverable for up to 1 minute. The ramp control poses thehighest demands of active power and energy on the BESS and defines its size and cost.
The minimum energy requirements for ramp control could be assessed considering a situation wherea project is delivering 100% of its capacity and due to a rapid cloud cover the output drops topractically zero. In this case the requirement becomes the Effective Storage Capacity (ESC) for oneminute and then the Nominal Storage Capacity (NSC) for the balance of the time until the output istaken down to zero. However, from a practical perspective, an energy output equal to 10 min x 30%Project Capacity, would cover this requirement and leave some margin.
However, in the IRP Siemens expects that important levels of BESS will be installed in the systemwith the dual purpose of providing frequency regulation and shifting energy from day peak to nightpeak. Thus, modelling the frequency regulation and ramp rate control related MTRs in the IRPincluding the requirement for storage may result in inefficiencies particularly considering that: a) theinvestments in the balance of system (BOS) that includes the Power Conversion System (PCS) aresimilar regardless the energy storage is 10 minutes or 4 hours, making the second much morecompetitive and b) linking the renewable additions with a BESS may result in investments beyond theactual requirements for the system. Therefore, in the context of this IRP, the solar PV projects andthe storage projects are considered separately with the consideration that, during the Request forProposals (RFPs) to be issued during the implementation phase for solar PV projects, the requiredcomponent of storage for its integration shall be added, with the flexibility for bidders to bid on one orboth components.
PREPA should not commission neither allow the interconnection of PV solar or wind projects to thegrid until the required corresponding energy storage component be commissioned andinterconnected in full compliance with the energy storage technical requirements. It is also veryimportant to emphasize that the solar PV projects shall still comply with the MTRs related withfrequency ride through, voltage ride through, reactive power capability and voltage regulation inaddition to their full compliance with the frequency regulation and frequency response requirementsto be met by either separate or integrated energy storage. This approach is expected to fostercompetition and innovation while at the same time ensuring that the required regulation and energyshifting will be available for the PV integration before its interconnection.
Battery StorageThe goal of moving toward a low carbon future is leading to a proliferation of utility-scale solar PV andwind generation, and growing levels of distributed energy resources (DER) behind the meter. Thesedevelopments are challenging the historical centralized paradigm for how a utility should design, buildand manage an electricity system. Without the proper foundation of utility-integrated energy storageand software controls, renewable energy resources could face technical and operational challengesand curtailment of highly valued carbon-free electricity could be required in order for the utility tomaintain system stability and reliability.

New Resource Options
Siemens Industry, Inc. – Siemens Power Technologies International 6-27 6-27
Energy storage technologies can prove valuable to utilities in managing such change as thesetechnologies have the ability to decouple energy supply and demand, and thus provide a valuableresource to system operators. Energy storage could serve as generation or load and to produce orabsorb both real and reactive power. Currently, Li-ion batteries are the most relevant batterytechnology with wide applications in power electronics, electric vehicles (EVs), and stationary storage(grid-scale).
Installed Costs and ApplicationsWhile energy storage costs and performance data are global in nature, the results presented hereare most representative of the current U.S. energy storage market. The key individual costs makingup the total energy storage system costs are detailed below:
Capital costs: The capital costs are for the entirety of the Battery Energy Storage System(BESS), which comprises the battery cell, the Power Conversion System (PCS) costs, and therelated EPC costs. The battery energy storage system costs include the storage module (SM)and the balance of system (BOS) costs.
Augmentation costs: Augmentation costs represent the additional BESS equipment needed tomaintain the usable energy capability to cycle the unit according to the usage profile in theparticular use case, for the life of the system. Additional equipment is required in the followingcircumstances: (1) if the particular unit charges or discharges to a level less than its rated energycapacity (kWh) per cycle; (2) if the battery chemistry does not have the cycle-life needed tosupport the entire operating life of the use case; or (3) if the energy rating (kWh) of the batterychemistry degrades due to usage and can no longer support the intended application. This time-series of varying costs is then converted into a level charge over the life of the system to providegreater clarity for project developers.
Operating costs: These include the O&M costs, charging costs, and costs of extendedwarranties for the major equipment.
Other costs: These include financing costs (debt service payments), taxes paid, costs ofmeeting local and regional regulatory requirements, and warranty costs.
The costs of energy storage systems are based on specific selected grid applications and the powerrating and usage duration assumptions are given below:
Peaker replacement: Large-scale energy storage system designed to replace peaking gasturbine facilities; brought online quickly to meet rapidly increasing demand for power at peak; canbe quickly taken offline as power demand diminishes.
Distribution: Energy storage system designed to defer distribution upgrades, typically placed atsubstations or distribution feeder controlled by utilities to provide flexible peaking capacity, whilealso mitigating stability problems.
Microgrid: Energy storage system designed to support small power systems that can “island” orotherwise disconnect from the broader power grid (e.g., military bases, universities, etc.), toprovide energy shifting, ramping support to enhance system stability, and increase reliability ofservice (emphasis is on short-term power output vs. load shifting, etc.).
While the majority of installed capacity provides frequency regulation, recent projects have targetedalternative applications including peaking capacity, renewable integration, and peak shaving. Exhibit

New Resource Options
6-28 Siemens Industry, Inc. – Siemens Power Technologies International
6-35 shows the primary application for installed storage capacity in recent history. The primaryapplication is defined as the service that motivated the project, generally the highest-value or mostprofitable service. The category “other ancillary services” includes voltage support, black start, andoperating reserves; and the category “renewable integration” is primarily energy shifting.
Exhibit 6-35. U.S Installed Capacity (MW) by Primary Application
Source: Siemens, IHS Markit
Future Cost TrendsBattery costs ($/kWh) can be lowered either by reducing the cost of the battery modules and balanceof system (reducing $) or by improving the battery performances (increasing kWh) or by acombination of the two approaches.
Cost of batteries can be further reduced relative to where they are today by focusing on the batterymodules and battery parts. However, it should be noted that extracting further cost reductions for thebalance of system is going to prove increasingly difficult as the battery parts and materials becomeincreasingly commoditized. The following options can be pursued to reduce battery cost:
µ Using cheaper materials to build battery parts e.g. electrodes, electrolytes, separators, etc.µ Improving the supply chain and making the manufacturing processes for battery modules
more cost effectiveµ Increasing the scale of manufacturing to spread the capital and fixed O&M costs over a very
large number of modules produced
Battery performance can be further improved relative to where it is today, and this needs to beaccomplished while keeping the costs comparable to today’s technologies. The following avenuesare being pursued to improve battery performance:
µ Technological improvements, advances or breakthroughs, that lead to better performance,(e.g., cycle life, higher safety, more environmentally friendly, higher energy density,increasing voltage, and higher power density);
0
50
100
150
200
250
2010 2011 2012 2013 2014 2015 2016 2017
Frequency regulation Peaking capacity Other ancillary servicesRenewable integration T&D support Enhanced reliability

New Resource Options
Siemens Industry, Inc. – Siemens Power Technologies International 6-29 6-29
µ Using better, more stable materials to build battery parts, (e.g., electrodes, electrolytes, andseparators) that are able to deliver the better performance listed above;
µ Using more effective chemistries, formulations, or crystal structures that overcome some ofthe limitations of today’s technologies; and
µ Using more stable solid electrolytes that enable higher voltages, reduce flammability, andmake pure metal (e.g., lithium) anodes safer.
Li-ion Battery System Price ForecastLi-ion batteries are, and are expected to remain, the mainstream technology for electrochemicalenergy storage. The support this technology has gathered at both the policy and industrial level isstrong enough to keep it going for years to come. Multi-billion-dollar investments are already in placeand a quiet arms race is in place to take the place of established Japanese and Korean batterycompanies, with the biggest threat being from China. Though medium-term shortages of rawmaterials such as cobalt may increase this portion of the cost somewhat, the larger declines drivenby increased scale of production and intense worldwide competition, is likely to drive down the pricesoverall. As both the stationary energy storage and electric vehicle volumes begin to increase, newlow-cost manufacturing facilities will continue to be built, particularly in China, which is expected tohelp prices continue to fall, albeit at a more temperate rate (~ 10–20% per year) through 2022.Beyond 2022, as economies of scale are maximized and technology improvements slow, batteryprices are expected to approach the bottom and stabilize, limiting the decline to less than 5% a year.
The Exhibits below represent Siemens view of 4-hour 1 MW Li-Ion battery system price forecasts, in$/kW and $/kWh, respectively, in comparison with multiple other forecasts.
Exhibit 6-36-. 4-hour Li-ion Battery System Capital Cost Forecasts
Source: Siemens, IHS, Lazard, NYSERDA, NREL
0
500
1,000
1,500
2,000
2,500
3,000
2018
2019
2020
2021
2022
2023
2024
2025
2026
2027
2028
2029
2030
2031
2032
2033
2034
2035
2036
2037
2038
Capi
talC
ost,
2018
$/kW
Lazard V3.0 (Dec 2017) I.H.S Markit (Oct 2017)NYSERDA (March 2018) Siemens ForecastNREL 2018 ATB Base NREL 2018 ATB Low

New Resource Options
6-30 Siemens Industry, Inc. – Siemens Power Technologies International
Exhibit 6-37. 4-hour Li-ion Battery System Capital Cost Forecasts
Note: The capital cost ($/kW) is converted to LCOE ($/kWh) based on the 4-hour cycle of the battery storage.
Source: Siemens, IHS, Lazard, NYSERDA, NREL
Exhibit 6-38 and Exhibit 6-39 present the capital and operating costs assumptions of 2-hour, 4-hourand 6-hour storage in the base case and low case, respectively.
Exhibit 6-38. Li-Ion Battery System Capital Cost and Operating CostAssumptions – Base Case
Source: Siemens, NREL
0
100
200
300
400
500
600
2018
2019
2020
2021
2022
2023
2024
2025
2026
2027
2028
2029
2030
2031
2032
2033
2034
2035
2036
2037
2038
Capi
talC
ost,
2018
$/kW
h
Lazard V3.0 (Dec 2017) I.H.S Markit (Oct 2017)NYSERDA (March 2018) Siemens ForecastNREL 2018 ATB Base NREL 2018 ATB Low
2018 1,392 832 1,953 9.09 2.672019 1,218 734 1,703 8.96 2.602020 1,110 674 1,546 8.95 2.582021 1,041 635 1,447 8.81 2.512022 972 596 1,349 8.67 2.432023 936 576 1,296 8.54 2.362024 899 556 1,243 8.41 2.292025 861 534 1,188 8.40 2.282026 843 523 1,163 8.26 2.202027 825 512 1,138 8.12 2.132028 800 496 1,104 7.99 2.062029 782 485 1,079 7.86 1.992030 764 474 1,054 7.85 1.972031 746 462 1,031 7.71 1.902032 728 450 1,007 7.57 1.822033 717 443 992 7.44 1.752034 700 431 969 7.31 1.692035 682 419 945 7.30 1.672036 664 407 922 7.19 1.642037 647 395 898 7.08 1.622038 629 383 875 6.97 1.59
2-hour Li-ionBattery Storage
2018$/KW
6-hour Li-ionBattery Storage
2018$/KW
All-in Capital Costs Operating Costs4-hour Li-ion
Battery Storage2018$/KW
Fixed OperatingCosts
2018$/kW-year
Construction Year Variable OperatingCosts
2018$/MWh
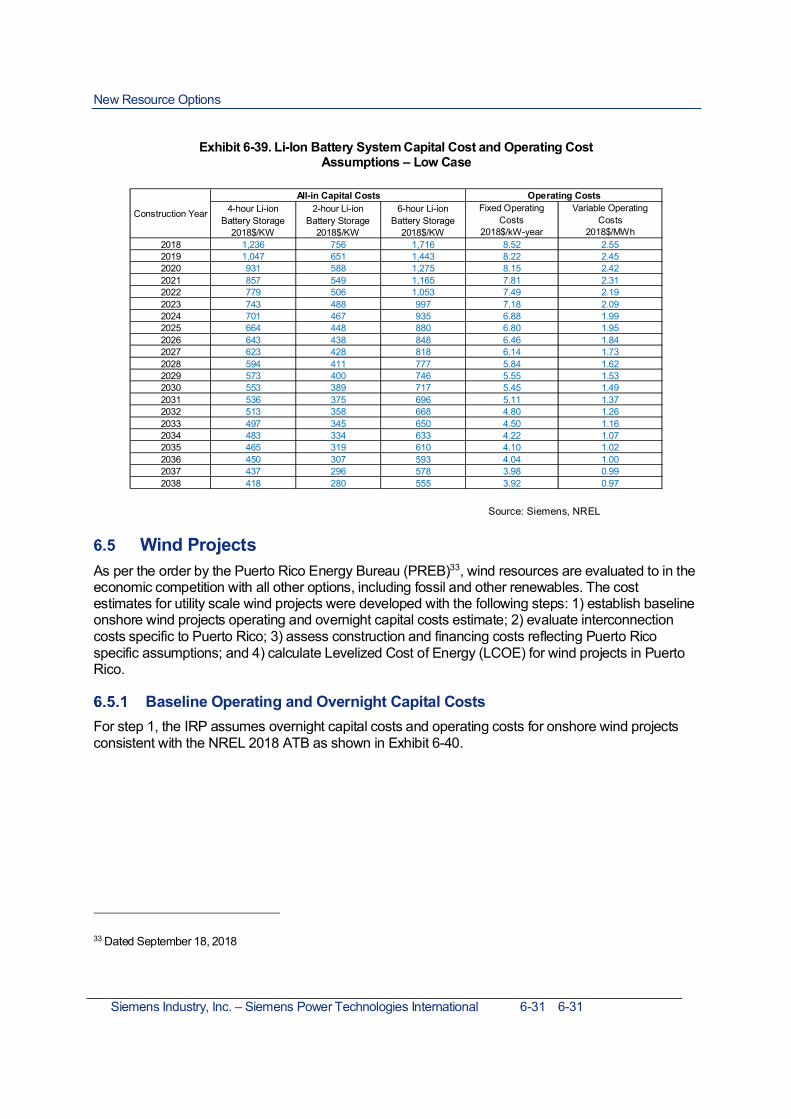
New Resource Options
Siemens Industry, Inc. – Siemens Power Technologies International 6-31 6-31
Exhibit 6-39. Li-Ion Battery System Capital Cost and Operating CostAssumptions – Low Case
Source: Siemens, NREL
Wind ProjectsAs per the order by the Puerto Rico Energy Bureau (PREB)33, wind resources are evaluated to in theeconomic competition with all other options, including fossil and other renewables. The costestimates for utility scale wind projects were developed with the following steps: 1) establish baselineonshore wind projects operating and overnight capital costs estimate; 2) evaluate interconnectioncosts specific to Puerto Rico; 3) assess construction and financing costs reflecting Puerto Ricospecific assumptions; and 4) calculate Levelized Cost of Energy (LCOE) for wind projects in PuertoRico.
Baseline Operating and Overnight Capital CostsFor step 1, the IRP assumes overnight capital costs and operating costs for onshore wind projectsconsistent with the NREL 2018 ATB as shown in Exhibit 6-40.
33 Dated September 18, 2018
2018 1,236 756 1,716 8.52 2.552019 1,047 651 1,443 8.22 2.452020 931 588 1,275 8.15 2.422021 857 549 1,165 7.81 2.312022 779 506 1,053 7.49 2.192023 743 488 997 7.18 2.092024 701 467 935 6.88 1.992025 664 448 880 6.80 1.952026 643 438 848 6.46 1.842027 623 428 818 6.14 1.732028 594 411 777 5.84 1.622029 573 400 746 5.55 1.532030 553 389 717 5.45 1.492031 536 375 696 5.11 1.372032 513 358 668 4.80 1.262033 497 345 650 4.50 1.162034 483 334 633 4.22 1.072035 465 319 610 4.10 1.022036 450 307 593 4.04 1.002037 437 296 578 3.98 0.992038 418 280 555 3.92 0.97
6-hour Li-ionBattery Storage
2018$/KW
4-hour Li-ionBattery Storage
2018$/KW
Fixed OperatingCosts
2018$/kW-year
Variable OperatingCosts
2018$/MWh
2-hour Li-ionBattery Storage
2018$/KW
All-in Capital Costs Operating Costs
Construction Year

New Resource Options
6-32 Siemens Industry, Inc. – Siemens Power Technologies International
Exhibit 6-40. U.S. Utility Scale Wind Projects Costs Assumptions
Source: NREL 2018 ATB, converted to $2018. (https://atb.nrel.gov/electricity/data.html)
Investment Tax Credit (ITC)Consistent with the current policy, the IRP assumes the following: wind facilities that commenceconstruction by December 31, 2018 will qualify for 18 percent ITC; wind facilities that commenceconstruction by December 31, 2019 will be reduced to 12 percent ITC; and zero percentafterwards. 34
Project Development and Construction TimeThe IRP assumes an accelerated timeline for wind projects similar to the solar PV projects, assuming12 months for the development period (request for proposal, bid evaluation, permitting, and financing)and 12 months for construction.
Levelized Cost of Energy (LCOE)For the IRP modeling, the levelized cost of energy (LCOE) is calculated as the net present value ofthe unit-cost of energy over the lifetime of the wind asset. The LCOE is then used as a proxy for theaverage price that the wind project could break even over its lifetime. Exhibit 6-41 shows the LCOE ofwind under Mid case and Low case, determined using an expected capacity factor or 25% which is inline with observed values in the two existing Puerto Rico wind projects.
34 http://programs.dsireusa.org/system/program/detail/658
Year Year
2018 1,731 52.36 2018 1,733 51.222019 1,733 51.98 2019 1,731 50.452020 1,736 51.60 2020 1,716 49.692021 1,738 51.22 2021 1,655 48.922022 1,741 50.83 2022 1,592 48.162023 1,744 50.45 2023 1,527 47.392024 1,747 50.07 2024 1,459 46.632025 1,749 49.69 2025 1,390 45.872026 1,752 49.31 2026 1,318 45.102027 1,755 48.92 2027 1,244 44.342028 1,758 48.54 2028 1,120 43.572029 1,761 48.16 2029 1,080 42.812030 1,764 47.78 2030 1,048 42.042031 1,768 47.39 2031 1,024 41.662032 1,771 47.01 2032 1,009 41.282033 1,774 46.63 2033 1,006 40.902034 1,777 46.25 2034 1,004 40.512035 1,781 45.87 2035 1,001 40.132036 1,784 45.48 2036 998 39.752037 1,788 45.10 2037 995 39.372038 1,792 44.72 2038 993 38.992039 1,795 44.34 2039 990 38.60
NREL 2018 Annual Technology Baseline (ATB) Mid Case NREL 2018 Annual Technology Baseline (ATB) Low CaseOnshore Wind Overnight Capital Costs
2018$/KWFixed Operating Costs
2018$/kW-yearOnshore Wind Overnight Capital Costs
2018$/KWFixed Operating Costs
2018$/kW-year

New Resource Options
Siemens Industry, Inc. – Siemens Power Technologies International 6-33 6-33
Exhibit 6-41. Levelized Cost of Energy (LCOE) of Wind
Exhibit 6-42 shows a comparison of the LCOE of wind with Solar PV. Note that even the Low Casefor Wind is expected to be above the Mid Case for Solar PV. Moreover, a capacity factor of 30%would be required for the Low Wind Case to reach the same levels as the Mid Case Solar PV andapproximately 40% for the Wind Low Case to reach the PV Low Case. Given that capacity factors at30% or above are not expected in Puerto Rico and the model is assuming 23% at this time, Siemensdoesn’t expect that AURORA’s LTCE will pick a wind alternative. Moreover, as shown in Exhibit 6-43,the wind generation in Puerto Rico is in general daytime peaking, making it correlated with Solar PVand reducing any diversity benefits.
Finally, Exhibit 6-44 and Exhibit 6-45 show the LCOE calculation for the Mid Case and Low Case,respectively, for Wind Turbine generation.
2018 104 1032019 111 1102020 118 1162021 132 1262022 132 1222023 132 1182024 132 1142025 132 1102026 132 1052027 132 1012028 132 932029 132 902030 132 882031 132 872032 132 862033 132 852034 132 852035 132 842036 131 842037 131 842038 131 83
Levelized Cost of Energy in Puerto RicoCommercial On Line (COD)
YearMid Case Wind
2018$/MWhLow Case Wind
2018$/MWh
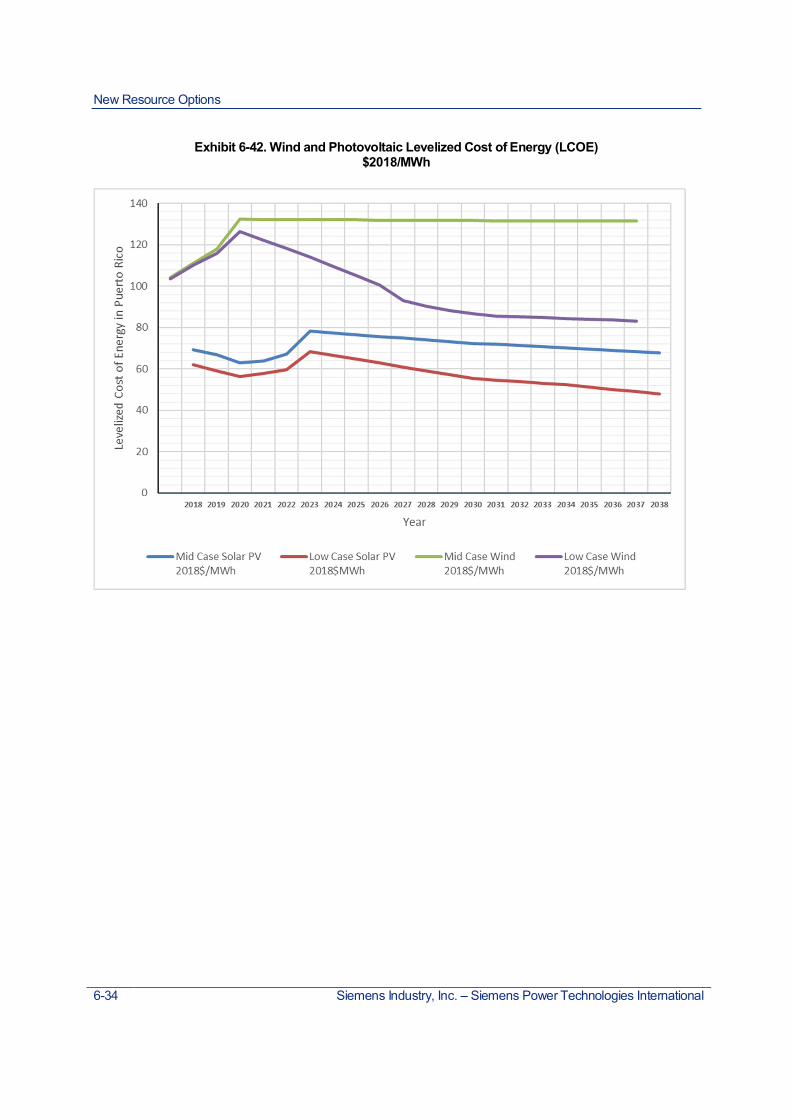
New Resource Options
6-34 Siemens Industry, Inc. – Siemens Power Technologies International
Exhibit 6-42. Wind and Photovoltaic Levelized Cost of Energy (LCOE)$2018/MWh
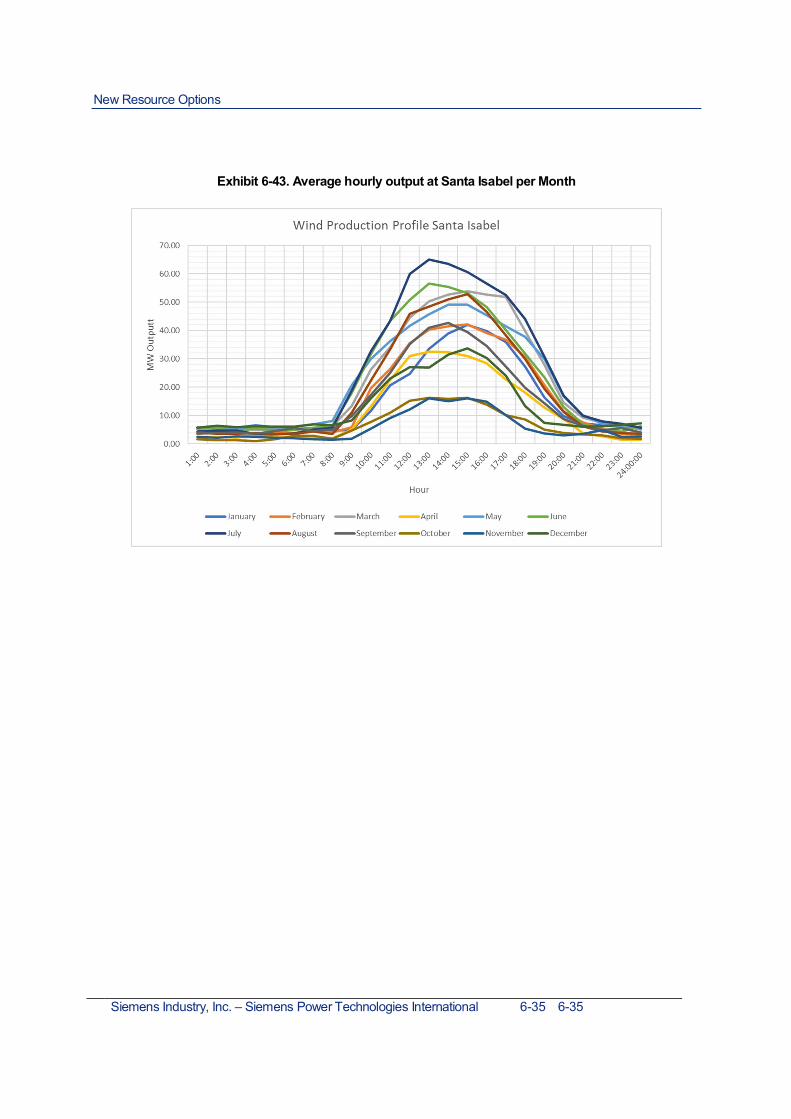
New Resource Options
Siemens Industry, Inc. – Siemens Power Technologies International 6-35 6-35
Exhibit 6-43. Average hourly output at Santa Isabel per Month

New Resource Options
6-36 Siemens Industry, Inc. – Siemens Power Technologies International
Exhibit 6-44. Levelized Cost of Energy (LCOE) of Wind Generation – Base Case
Commercial on line year 2019 2020 2021 2022 2023 2024 2025 2030 2035 2038Construction Start Year 2018 2019 2020 2021 2022 2023 2024 2029 2034 2037Capital and Operating CostsOvernight Cost, US National, 100 MW $2018/Watt 1.73 1.74 1.74 1.74 1.74 1.75 1.75 1.76 1.78 1.79Puerto Rico Adder % 16% 16% 16% 16% 16% 16% 16% 16% 16% 16%Overnight Cost, Puerto Rico, 100 MW $2018/Watt 2.01 2.01 2.02 2.02 2.02 2.03 2.03 2.05 2.07 2.08IDC Cost Adder % 2.5% 2.5% 2.5% 2.5% 2.5% 2.5% 2.5% 2.5% 2.5% 2.5%All-In Cost, Puerto Rico, 100 MW, $/Wac $2018/Watt 2.06 2.06 2.07 2.07 2.07 2.08 2.08 2.10 2.12 2.13Small Scale Adder (30 MW) % 0% 0% 0% 0% 0% 0% 0% 0% 0% 0%Base Cost, Puerto Rico, 30 MW $2018/Watt 2.06 2.06 2.07 2.07 2.07 2.08 2.08 2.10 2.12 2.13Fixed O&M $2018/kW-yr 67.58 67.08 66.58 66.08 65.59 65.09 64.59 62.11 59.63 58.13
30 MW Wind Project ParametersCapacity MW 30 30 30 30 30 30 30 30 30 30Capacity Factor % 25% 25% 25% 25% 25% 25% 25% 25% 25% 25%Energy Produced MWh 65,700 65,700 65,700 65,700 65,700 65,700 65,700 65,700 65,700 65,700
Base Capital System $2018 thousand 61,806 61,895 61,986 62,080 62,176 62,274 62,375 62,910 63,500 63,881Interconnection Costs $2018 thousand 2,840 2,840 2,840 2,840 2,840 2,840 2,840 2,840 2,840 2,840Total System Capital Costs $2018 thousand 64,646 64,735 64,827 64,920 65,016 65,115 65,215 65,750 66,341 66,722
ITC % 18% 12% 0% 0% 0% 0% 0% 0% 0% 0%Income Tax % 32% 32% 32% 32% 32% 32% 32% 32% 32% 32%Capital Recovery Factor % 9.3% 9.3% 9.3% 9.3% 9.3% 9.3% 9.3% 9.3% 9.3% 9.3%Project Financing Factor % 86% 94% 109% 109% 109% 109% 109% 109% 109% 109%Construction Financing Factor % 1.02 1.02 1.02 1.02 1.02 1.02 1.02 1.02 1.02 1.02
Annualized Capital Costs $2018 thousand 5,267 5,745 6,695 6,705 6,715 6,725 6,735 6,790 6,851 6,891Fixed O&M $2018 thousand 2,027 2,012 1,997 1,983 1,968 1,953 1,938 1,863 1,789 1,744Total Base System Cost $2018 thousand 7,295 7,757 8,692 8,687 8,682 8,677 8,673 8,654 8,640 8,635Levelized Cost of Energy (Base) $2018/MWh 111 118 132 132 132 132 132 132 132 131
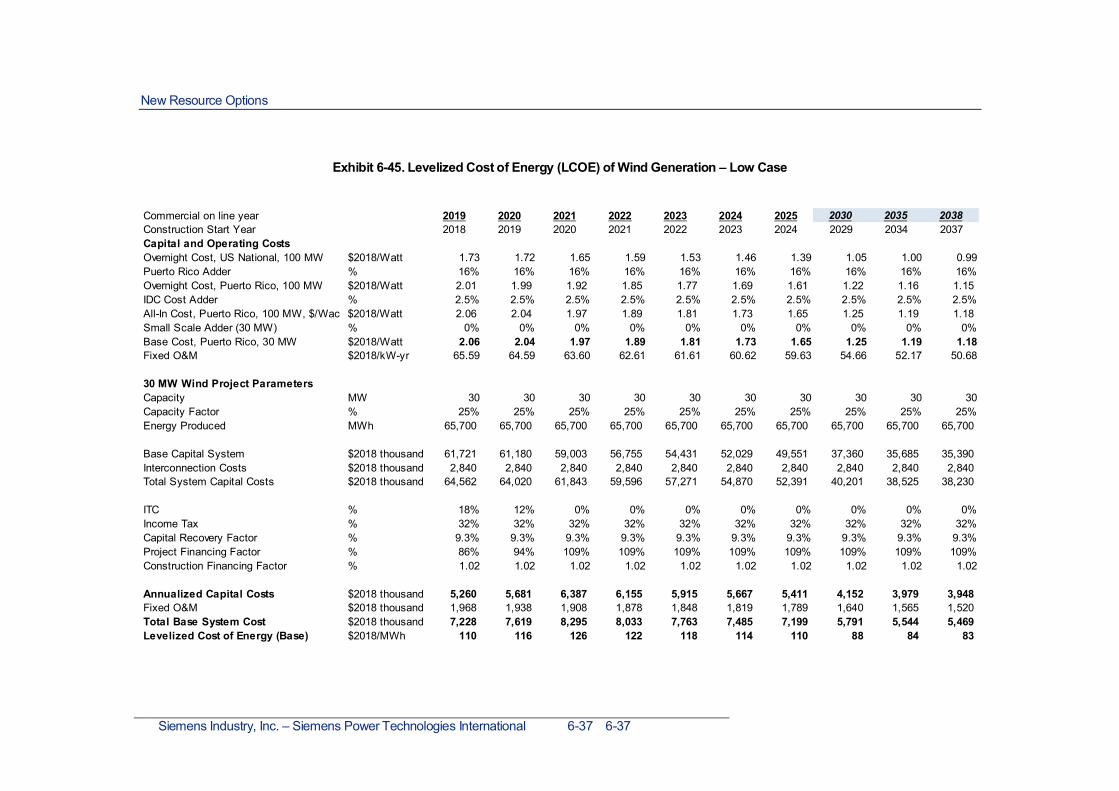
New Resource Options
Siemens Industry, Inc. – Siemens Power Technologies International 6-37 6-37
Exhibit 6-45. Levelized Cost of Energy (LCOE) of Wind Generation – Low Case
Commercial on line year 2019 2020 2021 2022 2023 2024 2025 2030 2035 2038Construction Start Year 2018 2019 2020 2021 2022 2023 2024 2029 2034 2037Capital and Operating CostsOvernight Cost, US National, 100 MW $2018/Watt 1.73 1.72 1.65 1.59 1.53 1.46 1.39 1.05 1.00 0.99Puerto Rico Adder % 16% 16% 16% 16% 16% 16% 16% 16% 16% 16%Overnight Cost, Puerto Rico, 100 MW $2018/Watt 2.01 1.99 1.92 1.85 1.77 1.69 1.61 1.22 1.16 1.15IDC Cost Adder % 2.5% 2.5% 2.5% 2.5% 2.5% 2.5% 2.5% 2.5% 2.5% 2.5%All-In Cost, Puerto Rico, 100 MW, $/Wac $2018/Watt 2.06 2.04 1.97 1.89 1.81 1.73 1.65 1.25 1.19 1.18Small Scale Adder (30 MW) % 0% 0% 0% 0% 0% 0% 0% 0% 0% 0%Base Cost, Puerto Rico, 30 MW $2018/Watt 2.06 2.04 1.97 1.89 1.81 1.73 1.65 1.25 1.19 1.18Fixed O&M $2018/kW-yr 65.59 64.59 63.60 62.61 61.61 60.62 59.63 54.66 52.17 50.68
30 MW Wind Project ParametersCapacity MW 30 30 30 30 30 30 30 30 30 30Capacity Factor % 25% 25% 25% 25% 25% 25% 25% 25% 25% 25%Energy Produced MWh 65,700 65,700 65,700 65,700 65,700 65,700 65,700 65,700 65,700 65,700
Base Capital System $2018 thousand 61,721 61,180 59,003 56,755 54,431 52,029 49,551 37,360 35,685 35,390Interconnection Costs $2018 thousand 2,840 2,840 2,840 2,840 2,840 2,840 2,840 2,840 2,840 2,840Total System Capital Costs $2018 thousand 64,562 64,020 61,843 59,596 57,271 54,870 52,391 40,201 38,525 38,230
ITC % 18% 12% 0% 0% 0% 0% 0% 0% 0% 0%Income Tax % 32% 32% 32% 32% 32% 32% 32% 32% 32% 32%Capital Recovery Factor % 9.3% 9.3% 9.3% 9.3% 9.3% 9.3% 9.3% 9.3% 9.3% 9.3%Project Financing Factor % 86% 94% 109% 109% 109% 109% 109% 109% 109% 109%Construction Financing Factor % 1.02 1.02 1.02 1.02 1.02 1.02 1.02 1.02 1.02 1.02
Annualized Capital Costs $2018 thousand 5,260 5,681 6,387 6,155 5,915 5,667 5,411 4,152 3,979 3,948Fixed O&M $2018 thousand 1,968 1,938 1,908 1,878 1,848 1,819 1,789 1,640 1,565 1,520Total Base System Cost $2018 thousand 7,228 7,619 8,295 8,033 7,763 7,485 7,199 5,791 5,544 5,469Levelized Cost of Energy (Base) $2018/MWh 110 116 126 122 118 114 110 88 84 83

Siemens Industry, Inc. – Siemens Power Technologies International 7-1 7-1
Part
7Assumptions and ForecastsThis Part provides two remaining aspects necessary for the IRP, fuel infrastructure forecastand an estimation of the Value of Lost Load (VOLL) for Puerto Rico.
Fuel Infrastructure and Forecast
Fuel Infrastructure OptionsThe purpose of this review is to identify the requirements for using or developing the fuelinfrastructure needed to support the generation options considered in the IRP. Specificobjectives include:
µ Identify current fuel infrastructure options;µ Evaluate sources of natural gas delivered to Puerto Rico such as liquefied natural gas
(LNG);µ Identify LNG or natural gas transport infrastructure needs relative to key generation
sites at Aguirre and Costa Sur in the south, San Juan and Palo Seco in the north,Mayagüez in the west, and Yabucoa in the east; and
µ Review alternative liquid fuels’ attractiveness and deliverability.
As a power generation fuel, natural gas is superior to petroleum products like diesel andresidual fuel oil because it has lower air emissions, higher efficiency, greater operatingflexibility, and lower costs. The inherent sulfur and particulate content of natural gasprocessed as LNG is extremely low. Carbon dioxide emissions from natural gas combustionare also lower relative to liquid fuels.35 With state-of-the-art controls such as low-NOx burners,NOx emissions can be lower as well. Natural gas allows the use of advanced combined cycletechnology (although diesel can be used as a fuel for less advanced combined cycletechnology), which is the most fuel-efficient thermal power generation technology availabletoday.36 Advanced gas turbines cannot fire residual fuel oil because of its high ash content. Inaddition, natural gas has been significantly less expensive since 2009 compared to premiumliquid fuels such as diesel and residual fuel oil, primarily due to the shale gas boom in theU.S. (see Exhibit 7-2). However, the benefits of natural gas can be realized only if it can bedelivered in a cost-effective manner to Puerto Rico and then distributed to power generationsites. The need to expand the island’s LNG import capability and natural gas distribution
35 According to the EIA (https://www.eia.gov/environment/emissions/co2_vol_mass.php), natural gas emits 67%,73%, and 84% of the CO2 as compared to residual fuel oil, diesel, and propane, respectively.36 The EIA (https://www.eia.gov/electricity/annual/html/epa_08_02.html) reports that current natural gas-firedcombined cycle plants have an average heat rate of 7,652 Btu/kWh vs. 9,179 Btu/kWh for internal combustion and11,214 Btu/kWh for gas turbine.

Assumptions and Forecasts
7-2 Siemens Industry, Inc. – Siemens Power Technologies International
pipelines would require significant new fuel infrastructure investments in order to realizePuerto Rico’s potential benefit from greater natural gas use for power generation.
The U.S. mainland currently has two LNG export terminals in operation and four more underconstruction; collectively representing 71.05 million tons per annum (MMtpa) of nameplatecapacity that will be online by 2021. More than 300 MMtpa of additional capacity has beenproposed, most of which will not be realized but some of which may constitute a secondwave of liquefaction capacity buildout in the mid- to late-2020s. Exhibit 7-1 below describesthe existing LNG capacity in the mainland U.S. The total contracted capacity is equal to 63.08MMtpa or 88.8% of nameplate capacity. While this leaves nearly 8 MMtpa of uncontractedcapacity that could potentially satisfy Puerto Rico’s LNG demand (estimated to be no higherthan 6.5 MMtpa), these U.S.-based LNG export facilities would require Jones Act-compliantships to ferry LNG to Puerto Rico. The Jones Act requires goods traveling between U.S. portsto do so on ships constructed and flagged in America, with primarily U.S. crews. However,there are not any Jones Act-compliant, large-scale U.S. vessels that can carry LNG in largeonboard tanks. In addition, no American shipyard has constructed an LNG carrier in nearlyfour decades (although there are U.S. vessels that could carry LNG in ISO containers). Thisreason, among others, is why Puerto Rico primarily receives its LNG supply from Trinidad &Tobago. Exhibit 7-1 summarizes total and contracted U.S. export facility capacity by terminal.
Exhibit 7-1. U.S. Mainland Large-Scale LNG Export Capacity(MMtpa)
LNG Facility Status NameplateCapacity
ContractedCapacity
Sabine Pass Operational 22.5 19.8
Dominion Cove Point Operational 5.3 4.6
Freeport Under Construction 15.3 13.6
Cameron Under Construction 12.0 12.0
Corpus Christi Under Construction 13.5 10.6
Elba Island Under Construction 2.5 2.5 Source: Siemens.
LNG terminals and infrastructure can play an important role in sourcing cleaner and lessexpensive LNG. Robust options for natural gas supply provide flexibility to enhance securityof supply (backup) to each generating site, as well as commercial value in negotiating andselecting the most advantageous pricing over time among various fuel suppliers.
The EcoEléctrica LNG Import Terminal has been operating successfully since 2000. In 2017,the Federal Energy Regulatory Commission (FERC) approved a change in operations toexpand the terminal’s natural gas send-out beyond its own 507 MW combined cycle unit toinclude supply to PREPA’s 820 MW Costa Sur generating plant. The terminal send-outcapacity was increased by 93 MMcf/d, from 186 MMcf/d to 279 MMcf/d, by putting intoservice an idle gasifier (the third such gasifier) and can be expanded by a further 93 MMcf/dby putting into service the remaining spare gasifier (the fourth such gasifier). EcoEléctricadelivers 186 MMcf/d of regasified LNG to the Costa Sur plant through a renegotiated contract(as of May 2018, Costa Sur is running exclusively on natural gas) while the remaining 93MMcf/d supplies its own combined cycle plant. Beyond the maximum send-out capacity of372 MMcf/d (if the fourth gasifier is put into service), a major increase in LNG terminal

Assumptions and Forecasts
Siemens Industry, Inc. – Siemens Power Technologies International 7-3 7-3
throughput could require some modifications, possibly including a second LNG storagetank37. It must be noted that EcoEléctrica is a private company and expanded natural gassupply from this terminal would require PREPA, at a minimum, to contractually commit to along-term natural gas processing and/or purchase agreement to justify infrastructureinvestments.
Fuel (including diesel and residual fuel oil) together with purchased power is the predominantcost and most volatile rate component for PREPA. Reducing dependence on oil for powergeneration has long been a top priority for PREPA. Although progress has been made, oilremains the main source of energy generation. An estimated 45% of generation is from oil,compared to the national average of 4%. PREPA has an aspirational goal of a 20-25% costreduction ($400-500 million) from fuel and purchased power under pre-storm conditions byFY 2023. One component, purchased power, is under two long-term Power PurchaseAgreements (PPAs) that extend through 2022 and 2027, respectively, and thus are not easilyaltered. Fuel prices are the other component and have been historically volatile, particularlyoil and its derivative diesel and residual fuel oil products. Prices have been increasing since arecent low point in 2016. Exhibit 7-2 below provides a comparison of the U.S. fuel prices from2000 to March 2018 on an energy-equivalent nominal $/MMBtu basis. Natural gas has beenthe least-cost of these five fuels consistently for nearly a decade and in more recent historyhas exhibited significantly less price volatility.
Exhibit 7-2. U.S. Fuel Prices (Nominal $/MMBtu)
37 A second LNG tank was included in the original permit but was not constructed, and the permit has expired. So,a new permitting effort would be required for such an expansion.
$0
$5
$10
$15
$20
$25
$30
2000
2001
2002
2003
2004
2005
2006
2007
2008
2009
2010
2011
2012
2013
2014
2015
2016
2017
2018
Nom
inal
$/M
MBt
u
Diesel Crude Oil (WTI) Residual Fuel OilPropane Natural Gas (Henry Hub)

Assumptions and Forecasts
7-4 Siemens Industry, Inc. – Siemens Power Technologies International
Source: Siemens, EIA.
Puerto Rico’s electrical infrastructure was critically damaged during September 2017, whenHurricanes Irma and Maria delivered back-to-back blows to the Island, resulting in a complexand prolonged disaster recovery effort. Hurricane Irma skirted the northern coast of the Islandfrom September 6–7, 2017 as a Category 5 storm, causing significant flooding, regionalpower and water outages, and other impacts to the Island’s infrastructure. Exactly 13 dayslater, on September 20th, and before Irma’s response operations had concluded, HurricaneMaria slammed into Puerto Rico, making a direct strike as a strong Category 4 storm causingwidespread devastation.
The following sections describe the pre-storm fuel infrastructure as well as proposed fuelinfrastructure during the recovery and rebuilding phases after the storms.
Pre-Storm Fuel Infrastructure
7.1.2.1 Residual Fuel Oil (No. 6 Fuel Oil)Puerto Rico has three steam-electric power plants which burn residual fuel oil. These arePalo Seco and San Juan in the north and Aguirre located on the south coast. The Costa Surplant, located on the southwestern coast, is dual-fuel, capable of burning either residual fueloil or natural gas. However, as of May 2018 it is burning exclusively natural gas. The SanJuan and Aguirre facilities have additional combined-cycle plants that burn diesel. Residualfuel oil is delivered to Puerto Rico by vessel. It is stored centrally at the formerCommonwealth Oil Refinery complex on the south-west side of the island. From there, it ispiped to the nearby Costa Sur plant and delivered by barge to the other three plants. Each ofthe three steam-electric plants has onsite storage for residual fuel oil. Palo Seco has capacityto store 450,000 barrels, San Juan 138,000 barrels, and Aguirre 780,000 barrels. Costa Surhas 800,000 barrels of storage that could be converted for other use. Based on 2013generation Exhibits, this storage capacity represents approximately a 36-day supply for PaloSeco, 14 day supply for San Juan, and 40 day supply for Aguirre. The plants typically hold atleast 15 days of fuel supply onsite.
7.1.2.2 Diesel (No. 2 Fuel Oil aka Distillate Fuel Oil)Diesel is used at the combined-cycle units at Aguirre and San Juan and the combustion-turbine units at Cambalache, Mayagüez, and nine other small facilities around the island.Diesel fuel is delivered to storage facilities at Yabucoa and Bayamon and from there isbarged to four larger stations (Aguirre, San Juan, Cambalache and Mayagüez). The nineother small facilities around the island operate infrequently and receive fuel deliveries by truckwhen required. The San Juan 2x200 MW combined cycle diesel-fired Units 5 and 6 have anattractive heat rate and could be converted to burn natural gas for a relatively modestinvestment of $10-30 million. If San Juan natural gas delivery is established, it is likely thatSan Juan Units 7, 8, 9, and 10 could be replaced with more efficient units. The Yabucoafacility has storage capacity for four million barrels of crude oil, fuel oil, and refined products.The Bayamon facility has storage capacity for 3.5 million barrels. A 2013 report indicates thatthere are two diesel fuel transfer lines between the Palo Seco and San Juan plants that are inservice. There is no information regarding onsite storage for diesel at any of the other plants.
7.1.2.3 Natural GasNatural gas is used at the privately-owned EcoEléctrica cogeneration facility and at the CostaSur steam plant, which are both located at Guayanilla Bay on the southwestern coast where

Assumptions and Forecasts
Siemens Industry, Inc. – Siemens Power Technologies International 7-5 7-5
the Peñuelas terminal and regasification facility is located. Natural gas is imported as LNG,mainly from Trinidad and Tobago (92% since 2010, under a 20-year contract for 0.5 MMtpaexpiring in 2019, according to Energy Velocity). The EcoEléctrica plant is adjacent to theregasification facility and the Costa Sur plant receives gas via a short pipeline. The 2017expansion of regasification facilities at EcoEléctrica LNG Import Terminal allows Costa Sur,which has dual-fuel units, to also be fully fired by LNG. As of May 2018, Costa Sur is nowburning exclusively natural gas. There is a substantial take-or-pay gas contract in place thatrequires significant generation from Costa Sur.
Storage for one million barrels of LNG is available at the regasification facility. Based on theoriginal FERC application, EcoEléctrica was approved to construct two, one-million-barrel(160,000 cubic meters) LNG storage tanks. However, the second storage tank was neverconstructed and FERC authorization to construct the second tank has lapsed. However, thespace remains available to construct the second tank if needed. Prior to 2017, the facility hadtwo spare regasifiers. In 2017, it obtained FERC approval to put one of them into continuousservice and to increase total sendout capacity from the import terminal to 279 MMcf/d. Thisincreased LNG cargo (ship) deliveries to 40 per year from 24 per year. The FERC approval ofthe third gasifier allowed the gas received by Costa Sur to double to 186 MMcf/d from 93MMcf/d. The remaining spare (fourth) gasifier also has a capacity of 93 MMcf/d, which wouldincrease total plant sendout to 372 MMcf/d if put into service. Some steps were taken prior to2013 to convert some of the other steam plants to natural gas, but these were put on holddue to uncertain gas supply following the hurricanes and cancellation of a cross-islandpipeline project. There are also pre-existing plans to build the Aguirre Offshore GasPort, afloating storage and regasification unit offshore near the Aguirre plant that would beoperational no later than January 1, 2022 and to convert the Aguirre plant to natural gas.
7.1.2.4 CoalThe privately-owned AES-Puerto Rico facility burns Colombian bituminous coal. The coal isdelivered to Puerto Rico at the Las Mareas Port, just south of the plant site and is transportedto the plant via covered conveyors. AES maintains a 30-day inactive coal storage supply toaddress potential delivery interruptions and a 20-day active storage supply.
7.1.2.5 Independent Power ProductionIPP generation contributions to the island is contracted through 2022 for EcoEléctrica’s 507MW and 2027 for AES’ 454 MW. Locations of the electric generating units in Puerto Rico arepresented in Exhibit 7-3.

Assumptions and Forecasts
7-6 Siemens Industry, Inc. – Siemens Power Technologies International
Exhibit 7-3. Current PREPA Generating Map
Source: PREPA, Siemens
7.1.2.6 Proposed Fuel Infrastructure and Natural Gas-Fired Generation ChangesCurrently, only 22 percent of PREPA-owned generation is natural gas-fired. In the aftermathof the hurricanes, PREPA is considering options for new infrastructure, including thepossibility to convert certain diesel or residual fuel oil units to natural gas. Such conversionswould help to meet the requirements under the U.S. Environmental Protection Agency’s(EPA) Mercury and Air Toxics Standards (MATS) regulations as well as to take advantage ofabundant and low-cost natural gas from the mainland. One such option is to convert SanJuan Units 5 and 6, which represent 400 MW of relatively new (2008) and reliable baseloadgeneration, from expensive diesel to cheaper natural gas in the form of LNG. The estimatedtotal annual fuel requirements for these two units would be on the order of 24-25 TBtu/yr.,assuming a heat rate of 7,652 Btu/kWh and a capacity factor of 89-93%. To facilitateconversion, the San Juan plant would require a natural gas receiving, storage, and supplysystem.
In addition to possible natural gas-fired generation changes, PREPA is considering severalfuel infrastructure options in its 2018 IRP. These options include the following, in no impliedpriority:
µ Aguirre Offshore GasPortµ Ship-based LNG at San Juan with pipeline to Palo Secoµ Land-based LNG at San Juan with pipeline to Palo Secoµ Ship-based LNG at Mayagüez (west)µ Ship-based LNG at Yabucoa (east)
Assumptions and Forecasts
Siemens Industry, Inc. – Siemens Power Technologies International 7-7 7-7
µ LNG or compressed natural gas (CNG) delivery to San Juan and potentially PaloSeco
µ Additional regasification capacity and new natural gas pipelines, first fromEcoEléctrica LNG Import Terminal to Aguirre and then to San Juan
µ No new gas infrastructure
This analysis reviews the many considerations surrounding these options withoutpresupposing that any option is a required solution for supporting projected electricitydemand or for compliance with any regulatory requirements. This section is followed by asection discussing these fuel infrastructure Scenarios and the issues and considerationsreflecting each Scenario.
7.1.2.7 Aguirre Offshore GasPortOn April 17, 2013, Aguirre Offshore GasPort, LLC (Aguirre LLC), a wholly-owned subsidiaryof Excelerate Energy, LP, filed an application with FERC to develop a floating offshore LNGregasification facility called Aguirre Offshore GasPort (AOGP) to supply natural gas toPREPA’s existing Aguirre Power Complex in Salinas, Puerto Rico. The AOGP facility wouldconsist of an offshore berthing platform, a floating storage and regasification unit (FSRU), anda 4-mile-long, 21-inch outside diameter subsea pipeline connecting to the Aguirre PowerComplex. AOGP was being developed with cooperation between Excelerate Energy, LP andPREPA.
Under the Aguirre LLC application, the AOGP would provide LNG storage capacity andsustained deliverability of natural gas to the Aguirre plant. The AOGP facility would assistPREPA’s plan to convert the Aguirre plant from a residual fuel oil- and diesel-only plant to afacility capable of burning diesel and natural gas for the combined cycle units and heavy fueloil and natural gas for the thermoelectric plant. The AOGP facility would have LNG storagecapacity of 3.2 Bcf (150,000 cubic meters) and a natural gas send out capacity of 500 MMcf/d(peaking deliverability of up to 600 MMcf/d) to the Aguirre plant. Based on data from AguirreLLC, the estimated total construction period for AOGP facility was approximately 12 months,and total capital cost of AOGP facility was estimated (inflated to 2018$) at $403 million(including onshore and offshore components, permits, financing costs, etc.). This estimationdoes not include the capital cost related to fuel conversion of the Aguirre power plant whichPREPA has estimated the annual fixed operating costs to be approximately $81.5 million,excluding debt service.
The existing Aguirre units include 1,462 MW of diesel- and residual fuel oil-fired generation. Ifconverted to natural gas, the expectation is that the maximum capacity of gas-firedgeneration would be 1,076 MW. The maximum daily volume of natural gas estimated to berequired for this converted capacity would equal 155 MMcf/d. For the purpose of forecastingdelivered natural gas prices to Aguirre, Siemens used an offtaker pricing formula similar tothose used by large-scale Gulf Coast LNG offtakers in order to represent the estimateddelivered cost to supply gas to Aguirre via AOGP. This pricing formula (= 1.15 * Henry Hub + 4.35), together with the average daily gas burn volume at an 80%generation capacity factor, gives a range from $423 million to $639 million in annual fuelsupply costs each year of operation. This gives a starting point for estimating the requiredrevenues the power generation plant would require supporting the capital, operating, andfinancing costs for AOGP.

Assumptions and Forecasts
7-8 Siemens Industry, Inc. – Siemens Power Technologies International
PREPA commissioned a detailed economic analysis of the AOGP project using four resourceplans and three price Scenarios38. The analysis concluded that the AOGP base priceScenario (where the base price is derived from the U.S. Energy Information Administration’sAnnual Energy Outlook 2017) demonstrated the benefits of AOGP as compared to the NoAOGP base price Scenario. The conclusion results from the AOGP base Scenario havinglower overall system costs on the order of $3.42 billion due to higher fuel costs incurredwithout AOGP. A similar benefit-cost analysis conclusion in favor of the AOGP project wasreached when using a high oil price Scenario both with and without full Renewable PortfolioStandard (RPS) compliance. However, the AOGP low oil price Scenarios both with andwithout full RPS compliance were found to have a higher system cost than without the AOGPproject. Based on these results, the economic analysis recommended proceeding with theAOGP project and associated Aguirre unit conversions.
Immediately following the second hurricane in September 2017, the Governor of Puerto Ricodeclared a state of emergency due to the devastation of Hurricane Maria. The widespreaddamage inflicted by Hurricane Maria, resulted in the Puerto Rico Energy Commission39
(PREC) issuing an order40 (dated April 26, 2018 for Case No. CEPR-AP-2017-0001) stayingall proceedings to allow PREPA to focus on restoring electric service, including theproceeding on the AOGP project. Prior to this event, in early July 2017, PREPA’s FiscalOversight and Management Board (FOMB) filed for protection under Title III of PROMESA.Later in July 2017, Excelerate Energy LP, the contractor for the AOGP project, announcedthat it had canceled its contracts with PREPA to construct the natural gas terminal. As aresult of these events, PREC delayed any consideration of AOGP until such time as PREPAdecides to pursue the project as part of its 2018 IRP. PREPA’s March 2018 draft fiscal planassumes AOGP is completed and Aguirre plants are converted to run on natural gas byJanuary 1, 2022. If AOGP does not proceed, PREPA may consider other LNG supplyoptions. In the meantime, residual fuel oil and diesel will continue to be primary fuels atAguirre at a higher cost than for power generated using LNG.
A March 2017 Siemens PTI fuel delivery assessment41 analyzed the feasibility ofcontainerized LNG or CNG to the Aguirre power station absent the AOGP project. Theassessment found that containerized LNG deliveries would require 193 ISO containers perday while CNG deliveries would require 617 containers per day to meet project demand atthe power plant. As a result, LNG delivery in ISO containers to Aguirre, absent AOGP, wasdetermined to be impractical due to the expected gas demand and the amount of containerhandling required on a daily basis and vessel deliveries required on an annual basis.
As mentioned earlier, the IRP will consider other LNG options to bring natural gas to theisland and the AOGP is not currently being studied as part of the core IRP. It remainsSiemens view that the possible benefits to the AOGP project (together with upgrades to theAguirre generating plant to use natural gas) include lower overall system costs compared tocurrent infrastructure in either a base case price or a high oil price Scenario. The AOGP
38 http://energia.pr.gov/wp-content/uploads/2017/05/PREPA-Ex-1.02-Part-1-Economic-Analysis-Report.pdf39 PREC is now known as the Puerto Rico Energy Bureau (PREB)40 http://energia.pr.gov/wp-content/uploads/2018/04/Final-Resolution-and-Order-CEPR-AP-2017-0001.pdf41 http://energia.pr.gov/wp-content/uploads/2017/05/PREPA-Ex-1-04-PREPA-Fuel-Delivery-Option-Assessment.pdf

Assumptions and Forecasts
Siemens Industry, Inc. – Siemens Power Technologies International 7-9 7-9
options brings the befits of lower carbon emissions from the Aguirre generation plant byburning more natural gas compared to current emissions, greater flexibility and security infuel supply options, the ability to repurpose AOGP infrastructure (the floating storage andregasification unit could be sold and moved), and the potential to increase PREPA-ownedgeneration as IPP contracts roll off in 2022 and 2027. However, the AOGP option brings therisks of potential of sustained low-oil prices could render AOGP uneconomic, new fuelinfrastructure that could be vulnerable to hurricanes, the possibility of a decreasing need forfossil generation as load decreases with further population out-migration or increases inenergy efficiency and renewable energy penetration, and continued dependence on south-to-north electricity transmission to reach load centers on the north side of the Island.
PREPA has addressed some of the concerns raised by PREC following the last IRP filed in2015. One such concern related to the overall economic benefit of AOGP, which wasaddressed in detail in the economic analysis mentioned previously42 and found to begenerally favorable. In addition, the present IRP addresses a second concern, namely thatPREPA must perform a comprehensive review of its options using a capacity expansionmodel that would test the AOGP against optimized portfolios that could achieve the samebenefits as the AOGP with a different set of resources. However, PREPA still requires aclearly defined plan to obtaining all necessary permits as well as a potential partner toconstruct the AOGP. With Excelerate’s cancellation of contracts in July 2017, PREPA wouldneed to solicit renewed interest in the project from potential partners.
7.1.2.8 Ship-based LNG (or CNG) at San Juan with Possible Pipeline to Palo SecoPREPA has studied a ship-based standard-scale LNG (and CNG) receiving terminal in theSan Juan area, including a ship-based (offshore) option known as a floating storage andregasification unit (FSRU). A June 2015 Galway Energy Advisors natural gas study forPREPA’s northern power plants (San Juan and Palo Seco) evaluated the feasibility andpotential fatal flaws of an import facility sized to handle 125,000 MMBtu per day. The studylooked at importing either LNG or CNG. Given the lack of CNG project examples in the U.S.and PREPA’s preference for 1-2 deliveries per month to limit traffic in the already busy SanJuan port, the fuel choice of the higher volume CNG was evaluated but was considered lessviable than LNG supplied via standard scale LNG ships delivering 2.0-3.6 million MMBtu pership.
The Galway study considered one ship-based (offshore) and three land-based (onshore)options with 14 configurations, including an LNG regasification barge, an LNG FSRU, anLNG floating storage unit (FSU) with onshore vaporization, LNG and CNG onshore storageand vaporization, and non-self-propelled vessels with onboard CNG storage. All of the foursite options would require one or more pipelines to deliver vaporized LNG or depressurizedCNG to the power plants. Several considerations were weighed for a ship-based LNGterminal. Concerns identified with this option included potential harm to environmentallysensitive zones where coral reefs, mangroves, sea grass beds, wetlands, critical wildlifeareas, rivers and streams, karst areas, and aquifers exist. In addition, harbor view impactswere considered, wherein the visual impact on residents was assessed. In general, an FSRUwould be sited approximately three miles offshore, but would need to be sited 13 miles ormore offshore to be completely out of sight of harbor residents. A location 13 miles offshore
42 http://energia.pr.gov/wp-content/uploads/2017/05/PREPA-Ex-1.02-Part-1-Economic-Analysis-Report.pdf

Assumptions and Forecasts
7-10 Siemens Industry, Inc. – Siemens Power Technologies International
would require a lengthy pipeline, with its own environmental risks and added costs, to bringsupply to the plants. The analysis reached the conclusion that among the 14 options, themost feasible option would be land-based (onshore) LNG storage and vaporization at awarehouse site adjacent to the San Juan power station and with standard scale LNG carrierdelivery directly to onshore tanks.
A separate 2018 study43 evaluated the economics of land-based (onshore) LNG storage andvaporization and compared to FSRU receiving terminals through the assessment of analysesperformed for Indonesia, an island nation best served by LNG. An FSRU terminal in Sorong,Indonesia was estimated to be $0.6 million per MMcf/d in capital costs versus $2.1 million perMMcf/d for a land-based option. The FSRU vs. land-based (onshore) LNG produced aninternal rate of return (IRR) of 13.77% vs. -0.27%, respectively, with the principle difference inIRR due to the difference in the 3.5:1 capital cost ratio. The study affirmed the use of a $4.35per MMBtu transportation adder (liquefaction + transportation + margin) for LNG from theGulf Coast, Trinidad & Tobago, or other nearby source. However, differences in volume andlocation-based costs exist between the Indonesian example and San Juan port, and this rule-of-thumb estimate predicts a lower capital cost estimate for the FSRU. A different 2017study44 estimated the cost for a new 30,000 m2 LNG tanker at $105 million, which is theExhibit used in this analysis (together with an additional $80 million in costs for regasification,jetty, piping, etc.). It is possible to reduce the capital cost for an FSRU by the utilization of aused LNG tanker, which could also reduce, by up to half, the time to implement the FSRUproject. A September 2018 announcement by TEMA LNG Terminal Co Ltd45 puts the cost ofan estimated small-scale 20,000 m2 FSU based in Ghana at $350 million with an 18 monthproject timeframe. In any event, the FSRU option is expected to remain the lower cost optionvs. land-based LNG to meet the fuel needs of San Juan and Palo Seco plants. The FSRUoption comes with the added benefit that it could potentially be repurposed, and the terminalmoved or sold to recover some of the initial capital investment.
New Fortress Energy proposed an offshore natural gas fuel supply option to provide SanJuan and Palo Seco with LNG. The company has signed a 20-year deal to supply natural gasto Jamaica and could use the country as a hub to sell LNG to Puerto Rico. The intent of theNew Fortress Energy proposal would provide for all-in fuel delivery to San Juan with optionalincluded conversion of San Juan units 5 and 6. The delivered LNG price would be negotiatedbut there would be no long-term commitment or upfront capital cost commitment. The capitalinvestment would be recovered through a calculated gas adder to the rate. Alternatively,Trinidad & Tobago is the primary supplier of LNG to Puerto Rico and since 2010 has shippedan average of 2.1 Bcf/month of natural gas to EcoEléctrica Inc. as well as additional LNG(since 2012) to Costa Sur via the same EcoEléctrica LNG Import Terminal.
43 “An Economic Evaluation of Onshore and Floating Liquefied Natural Gas Receiving Terminals: the Case Study ofIndonesia,” Giranza and Bergmann (2018), http://iopscience.iop.org/article/10.1088/1755-1315/150/1/012026/pdf
44 “Small Scale LNG: Emerging Technologies for Small-Scale Grids,” Tony Regan, DataFusion Associates,http://esi.nus.edu.sg/docs/default-source/doc/smallscale-lng---esi-roundtable.pdf?sfvrsn=2&_sm_au_=iVVVtq5FtZNFJDTM
45 Jiangnan to build regas barge for Ghana’s first LNG import project, Mike Corkhill, LNG Shipping World,https://www.lngworldshipping.com/news/view,jiangnan-to-build-regas-barge-for-ghanas-first-lng-import-project_54246.htm

Assumptions and Forecasts
Siemens Industry, Inc. – Siemens Power Technologies International 7-11 7-11
Ship-based LNG delivery to the San Juan region with ship-based or onshore LNG storageand vaporization is a viable fuel infrastructure option for PREPA. However, the most likelyScenario is a medium-scale LNG ship (30,000 m2) rather than a large-scale LNG carrier(85,000 m3 to 170,000 m3 or more), which would require dredging large quantities of materialfrom the San Juan harbor to create a channel suitable for the large-scale LNG carriers. Thepotential benefits of the option for medium-scale LNG carriers (with regasification eitherfloating or land-based) include efficient delivery of cost-competitive bulk LNG with minimalimpact from increased ship traffic, reduced carbon emissions by converting units at San Juanand Palo Seco to natural gas from residual fuel oil, and lower fuel costs compared to currentinfrastructure in either a base case price or a high oil price Scenario. Possible risks include asustained low-oil price future rendering operating costs higher using natural gas than residualfuel oil, the creation of new fuel infrastructure that could be vulnerable to hurricanes, supplychain vulnerability preventing timely delivery of LNG, and the possibility of a decreasing needfor fossil generation as load decreases with further population out-migration or as PREPAincreases energy efficiency programs and renewable energy penetration.
Onshore LNG storage offers advantages and disadvantage compared to ship-based offshorestorage (FSU) and/or regasification (FSRU) or regasification. The FSU and FSRU optionswould need to go through a permitting process with the Federal Energy RegulatoryCommission (FERC), the U.S. EPA, the U.S. Department of Transportation MaritimeAdministration, the U.S. Coast Guard, local agencies in Puerto Rico, and would be subject toregulatory siting challenges resulting from large exclusion zones in the harbor. Furthermore,several existing statutes would need to be navigated, including the Natural Gas Act, theClean Air Act, the Clean Water Act, the Deepwater Port Act, the National EnvironmentalPolicy Act, the Comprehensive Environmental Response, Compensation, and Liability Act,the Maritime Protection, Research, and Sanctuaries Act, the Resource Conservation andRecovery Act, the Rivers and Harbors Act, and others.46 All offshore pipelines would requirea subsea pipeline to both San Juan and Palo Seco power plants. By contrast, the onshoreLNG storage option would be co-located by the San Juan plant with a connecting pipeline toPalo Seco. This onshore option would avoid some of the regulatory requirements mentionedabove with the FSU and FSRU options but would be subject to its own regulatory challenges.The onshore LNG storage and FSU/FSRU options would likely be mutually exclusive due toland use and/or port lease issues as well as cost prohibitive due to duplicative infrastructurebuildout.
A ship-based FSRU would occupy one of two berths directly in front of the San Juan steamplant. Based on an estimated 350 MW gas-fired capacity at San Juan, the maximum dailygas volume requirement would not exceed 50.4 MMcf/d. However, if a pipeline to the PaloSeco plant is included, adding an incremental 302 MW of gas-fired capacity at Palo Seco, themaximum daily gas volume requirement would increase to 93.6 MMcf/d. The extantremaining regasifier (93 MMcf/d send-out capacity) at the EcoEléctrica LNG Import Terminalcould satisfy these needs if a pipeline were to be built from the import terminal to the north,either directly or routed via Aguirre.
46 https://www.epa.gov/sites/production/files/2015-08/documents/lng_regulatory_roadmap.pdf

Assumptions and Forecasts
7-12 Siemens Industry, Inc. – Siemens Power Technologies International
7.1.2.9 Land-based (onshore) LNG at San Juan with pipeline to Palo SecoAs mentioned previously, the Galway study reached the conclusion that among the 14options, the most feasible is land-based (onshore) LNG storage and vaporization at awarehouse site adjacent to San Juan power station on its east side and with standards scaleLNG carrier delivery directly to onshore tanks. The best option considered was immediatelyadjacent to San Juan plant in a warehouse district to the east. A second viable option for anonshore storage and vaporization system was considered further to the east of San Juanplant at a location known as Pier 15/16. However, Siemens notes that an onshore facility islikely to be costlier than an FSRU or FSU option. Furthermore, the Galway study did notconsider small- to medium-scale LNG carriers as a possible supply option for direct deliveryinto San Juan harbor. Instead the Galway study considered smaller-scale shuttle tankersbeing loaded from LNG ships via ship-to-ship transfer in the area of Guayanilla Canyon onthe protected south side of Puerto Rico).
Looking at the generation plants that an onshore LNG terminal would supply, it is expectedthat current generating units using residual fuel oil at San Juan and Palo Seco will bereplaced, retired or limited in use in several years to achieve MATS compliance. Thereplacement generation for these sites will be capable of natural gas and diesel firing. Anorthern LNG terminal could provide significant cost savings relative to diesel fuel. Based oninput from PREPA, a land-based (onshore) LNG terminal at San Juan would require anestimated $492 million in capital costs (2018$) including $457 million for the LNG terminaland $35 million for the pipeline from San Juan to Palo Seco. Note that the pipeline costs arelower than in the 2015 IRP due to the assumed use of an existing oil pipeline right-of-way toconstruct the 4.2 mile pipeline to Palo Seco. Annual fixed operating costs (OPEX) areconservatively assumed to be 5.2% of total capital expenditures (CAPEX), whereas thegeneral rule of thumb for OPEX is 2.5%-3% of CAPEX. The earliest online date would beJuly 1, 2022.
7.1.2.10 Ship-Based LNG to Mayagüez (west) and/or Yabucoa (east)Mayagüez is located on the western side of the island, where PREPA has a 4x50 MW (totalof 200 MW) diesel-fired generation. Yabucoa is located on the eastern side of the island,where PREPA has two combustion turbines (2x21 MW) also burning diesel. Siemens isinvestigating the possibility of one or more floating LNG and storage import terminals thatcould service the power generation plants at Mayagüez, Yabucoa, or both locations. Theexisting generation could be complemented with up to 302 MW of gas-fired generation, whichwould require a natural gas fuel supply solution. The proposed solution would most likely be aship-based (offshore) FSRU option, similar to what could be installed in the San Juan port forLNG supply to San Juan plant and/or Palo Seco plant and with similar capital expenditureand operating expenditure estimates. Accordingly, Siemens estimates the CAPEX for ship-based LNG delivery to Mayagüez and/or Yabucoa to be $185 million and the annual OPEXto be $9.6 million.
7.1.2.11 LNG/CNG Delivery via ISO Containers to Northern Power PlantsAlternatively, natural gas supply to the northern side of the island could be delivered in theform of LNG or CNG using ISO containers. This mode of LNG or CNG transport usesstandard, intermodal, 40 foot ISO containers that can be marine-shipped, trucked, handled,and stored much like a standard 40 foot cargo container. Each 40 foot LNG ISO container isan independent storage system with about an 858 MMBtu capacity for up to a 90 day storageperiod. Each 40 foot CNG ISO container has a capacity of about 267 MMBtu.

Assumptions and Forecasts
Siemens Industry, Inc. – Siemens Power Technologies International 7-13 7-13
There are numerous LNG and CNG suppliers available in the U.S. and internationally thatutilize these systems. LNG and CNG ISO containers potentially could be delivered to the SanJuan port and unloaded using standard container handling equipment, trucked to San Juan /Palo Seco sites using existing container tractor-trailers, and then directly connected to acommon regasification system feeding the fuel delivery piping of individual units. While thisdelivery method is generally more costly than bulk supply for large volumes of LNG, it couldbe a cost-effective option to fuel the new small CCs at Palo Seco. In addition, the LNG orCNG ISO containers could provide an interim solution that could deliver fuel to the San JuanUnits 5 and 6 CCs while long-term delivery infrastructure is being permitted and constructed.
The San Juan port that is directly adjacent to the San Juan power plant has a large capacitycontainer terminal that could potentially support daily full and empty LNG containermovements. About 50 of these containers per day could be loaded onto trucks for transport toPalo Seco, with empty containers carried back on the return trip. LNG or CNG containers47
also could be used to deliver natural gas to peaking sites such as Cambalache andMayagüez. The practicality of delivering the large volume of LNG or especially CNG requiredfor both Palo Seco CCs and San Juan CCs has been assessed.
The same March 2017 Siemens PTI fuel delivery assessment further developed this analysisof LNG / CNG to northern power plants and separately to Aguirre, estimating thatcontainerized LNG deliveries would require 40 ISO containers per day while CNG deliverieswould require 126 containers per day to meet project demand at the two northern powerplants (for Aguirre, it would be 193 and 617 containers, respectively). As a result, the studyconcluded that small-scale LNG / CNG delivery either as a bridge fuel or long-term solution isnot feasible given that small-scale LNG / CNG delivery costs to San Juan are prohibitivelyhigh and operational risks are too great. The study recommended further evaluation of bulkLNG delivery to San Juan and Palo Seco with onsite tank storage (the same conclusion asthe previously cited Galway study). Siemens does not recommend small-scale LNG or CNGdelivered via ISO containers as a viable solution for this IRP.
7.1.2.12 Pipeline Supply from EcoEléctrica LNG Import TerminalAn alternative to a northern LNG / CNG terminal and potentially also to the AOGP could be anatural gas pipeline that delivers natural gas from the existing EcoEléctrica LNG ImportTerminal to the San Juan and Palo Seco plants in San Juan. Such a pipeline could beconstructed to have one segment along the southern coast of Puerto Rico to serve theAguirre power plant (creating an alternative to the AOGP plant) before a second segmentturns north toward the San Juan plant with a lateral to Palo Seco. Alternatively, a pipelinecould be routed to go directly from the EcoEléctrica LNG Import Terminal to San Juan, whichwould not require additional regasification apart from bringing online the extant remaininggasifier. Any such project must consider the pipelines costs as well as permitting feasibility.
A past 2008n proposal to bring natural gas to the north (Gasoducto del Norte or GdN, alsoknown as Via Verde) by pipeline from EcoEléctrica LNG Import Terminal encounteredsignificant public opposition during permitting and was canceled. Several pipeline routes were
47 LNG tank trailers also can be used to transport LNG. With necessary permitting and commercial arrangements,trailer loading facilities could be located at any site with bulk LNG storage, such as EcoEléctrica, or at an onshoreLNG terminal at San Juan.

Assumptions and Forecasts
7-14 Siemens Industry, Inc. – Siemens Power Technologies International
considered but the option designated as preferred was generally north from EcoEléctrica toArecibo and then east to Palo Seco/San Juan. Laterals were considered to serve theCambalache and Mayagüez peaking units. A South-North pipeline from Aguirre to San Juanarea could be more practical than the preferred western routes considered earlier. A naturalgas pipeline between Costa Sur and Aguirre has been attempted in the past (Gasoducto delSur) and is technically feasible. Section 2.6.1 of the 2008 GdN study referenced aboveidentified two possible routes from Aguirre to the north. These routes’ lengths were about 50miles each, with about 600 acres of right-of-way including up to 64 acres of wetlands impact.One of these routes is close to an already-disturbed corridor for Route 52 and had the lowerwetlands impact. A pipeline route along the south coast, from Costa Sur to Aguirre, generallyis perceived as more practical and having less environmental and public impact than apipeline along the northern coast. This portion of a system to transport natural gas fromEcoEléctrica to the north may be less controversial than the South-North section.
The 2008 GdN report provided estimated costs for such a pipeline, confirmed by more recentestimates performed by Siemens. The Aguirre-San Juan overland route (not the route alongRoute 52) was about 52 miles long before adjustment for terrain. A 20 inch pipeline size wasassumed for a flow volume of 249 MMcf/d. Costs included route surveying, engineering,project management, inspection, materials, construction and restoration. The cost of this linein mid-2008 U.S. dollars was $206 million, or $238 million in 2018 dollars. This comports wellwith Siemens’ current estimate of a cost of $221 million for this South-North pipeline route,although Siemens estimated that a 16” pipe is sufficient to supply the combined 93.6 MMcf/ddemand from San Juan and Palo Seco after conversion to natural gas. Other assumptionsused by Siemens include a distance of 49 miles and $4.5 million per mile (2018$).Considering that a south coast pipeline (Costa Sur to Aguirre) has been budgeted in the past,PREPA should have reasonably accurate estimates of cost. The pipeline nominal length fromCosta Sur to Aguirre is 42 miles. Using a cost of about $5.1 million per mile (2018$) for 20”pipeline, which would carry 249 MMcf/d or sufficient gas volumes to supply Aguirre, San Juanand Palo Seco, this would cost approximately $214 million. The total cost for a pipeline fromEcoEléctrica LNG Import Terminal to Aguirre to San Juan is estimated to be $470 million,including $35 million for a short 4.2 mile pipeline to the Palo Seco plant.
Although a pipeline route has been attempted in the past, but was halted due to publicopposition, the aftermath of the storms represents an important inflection point in PuertoRico’s history. There is a potential window of opportunity to re-evaluate the pipeline optionduring this time of rebuilding. It is recommended that an updated cost and routing analysis beconducted on possible pipeline supply options to Aguirre and San Juan/Palo Seco.
7.1.2.13 Alternative FuelsPREPA received an unsolicited proposal from Puma Energy Caribe (Puma) and Aggreko inAugust 2017, which was approved for further consideration in October 2017. The proposalwas for a 100 MW power generation solution using LPG (liquefied petroleum gas, which ismostly propane) in Bayamón, Puerto Rico (just outside of San Juan). The proposal wouldsatisfy several important criteria that PREPA is looking for in power generation solutions,including a location in the north near load centers, a public/private partnership (P3) that wouldrequire no capital expenditure from PREPA and conforms to PREPA’s Fiscal Plan Part VII(Investment Program) requiring that P3 generation in year 2026 be approximately 30% of thetotal system generation, and a turnkey approach that can be implemented quickly. Theproposed solution would also have a relatively low heat rate (8,900 Btu/kWh) to provideefficient power generation, burn relatively clean LPG fuel to help meet MATS standards (and

Assumptions and Forecasts
Siemens Industry, Inc. – Siemens Power Technologies International 7-15 7-15
which is typically cheaper than diesel or residual fuel oil), have a fast start time of two minutesto 100% capacity, and be strategically located near existing Puma facilities where noadditional LPG storage would be needed beyond the existing 100,000 barrels of LPGstorage.
Siemens believes that LPG fuel will remain cost-competitive compared to diesel and residualfuel oil. This aspect, together with the other attributed enumerated above, lead to theconclusion that this project is worthy of further exploration as one solution among many todevelop new sources of power generation. The PUMA proposal that Siemens reviewed didnot include a pricing formula or forecast, so an LPG price forecast was developed using thehistorical price relationship with crude oil. This forecast is provided in the following forecastsection.
A coal price forecast is also provided for fuel supply costs to the AES plant, based onSiemens’ 2018 spring outlook and benchmarked to the EIA AEO 2018 forecast and others.
7.1.2.14 No New Natural Gas InfrastructureIf additional natural gas infrastructure and supplies cannot be developed, one option is tomaintain the status quo. This option ignores the potential fuel cost savings that could comefrom natural gas supply and may also increase the challenges with meeting MATSrequirements. This option should also be considered in the IRP planning process, pendingthe available generation options review.
Other potential liquid fuels such as propane, ethane and biofuels could be considered. Overthe past two years, propane has been about 2.5 times as costly as natural gas on anequivalent MMBtu basis. Propane when burned for power generation emits about 16% morecarbon dioxide than natural gas but is cleaner than residual fuel oil. While increases inpropane and ethane production associated with U.S. shale gas production have led to recentmarket imbalances that have depressed the prices of these products, prices have begun torise again as the market recovers. Siemens believes that in the long-term, propane andethane prices will maintain higher levels relative to diesel and certainly with respect to naturalgas. So, while there may be some interim opportunities to take advantage of such fuels,propane, ethane, and biofuels are not expected to be long-term cost-effective solutions.
7.1.2.15 Fuel Infrastructure Scenarios ComparisonAs discussed previously, there are a broad range of fuel infrastructure Scenarios. Theseinclude the following, in no particular order:
µ Aguirre Offshore Gas Port (AOGP)µ Land-based (onshore) LNG to the Northµ Ship-based (offshore) LNG to the Northµ Ship-based (offshore) LNG at Mayagüez (west)µ Ship-based (offshore) LNG at Yabucoa (east)µ Small-scale LNG and CNG to the North and Southµ Additional Regasification Capacity at EcoEléctrica LNG Import Terminal with a Costa
Sur-Aguirre-San Juan Pipelineµ No New Gas Infrastructure

Assumptions and Forecasts
7-16 Siemens Industry, Inc. – Siemens Power Technologies International
Each fuel infrastructure Scenario should be evaluated, at a minimum, on the broad categoriesof capital cost requirements, estimated operational costs, resiliency and reliability,environmental impact, and public concerns. Many other considerations are embedded withinthese categories, including technical complexity, permitting process, fuel supply options,regulatory compliance, commercial partnerships, etc. The following table provides a summaryevaluation of these infrastructure options.
Exhibit 7-4. Fuel Infrastructure Options Assessment
Infrastructure Option
CAPEX($MM)(2018$)
AnnualOPEX($MM)(2018$)
Max Daily GasVolume (MMcf/d)
Max Capacity(MW)
AnnualizedCAPEX($/kW)(2018$)
AnnualOPEX($/kW)(2018$)
AguirreOffshoreGasPort
GasPort=$403-AnnualO&M=$81.5(+fuel)
(1,076 MW)-(7,500Btu/kWh)-155MMcf/d
Increase reliabilityfrom flexibility to burngas or diesel(currently oil only).Resiliency could bechallenged byhurricane damage toAOGP or south-to-north powertransmission.
Carbon and otheremissions would bereduced with AOGPand conversion atAguirre to gas-firedgeneration.
Infrastructurewould belocated awayfrom populationbut concernsover cost andstranded fossilfuel plant.
N/A
Ship-basedLNG (FSRU) atSan Juan Portwith pipeline toboth plants
FSRU=$185-Pipeline toPaloSeco=$35-AnnualO&M=$11.4(+fuel)
(650 MW)-(7,500Btu/kWh)-93.6MMcf/d
Increase reliabilityfrom flexibility to burngas or diesel(currently oil only).Resiliency could bechallenged byhurricane damage toFSRU.
Carbon and otheremissions would bereduced with FSRUand gas-firedgeneration.Increased vesseltraffic could impactcoastal marine life.
Harborviewwould beimpacted byFSRU andpotentialdamage tomarineenvironmentfrom pipeline.
N/A
Ship-based LNG atMayagüez(west)
FSRU=$185-AnnualO&M=$9.6(+fuel)
(300 MW)-(7,500Btu/kWh)-43.2MMcf/d
Increase reliabilityfrom flexibility to burngas or diesel(currently oil only).Resiliency could bechallenged byhurricane damage toFSRU.
Carbon and otheremissions would bereduced with FSRUand gas-firedgeneration.Increased vesseltraffic could impactcoastal marine life.
Infrastructurewould belocated awayfrom populationbut concernsover cost andstranded fossilfuel plant.
N/A
Ship-based LNG atYabucoa (east)
FSRU=$185-AnnualO&M=$9.6(+fuel)
(300 MW)-(7,500Btu/kWh)-43.2MMcf/d
Increase reliabilityfrom flexibility to burngas or diesel(currently oil only).Resiliency could bechallenged byhurricane damage toFSRU.
Carbon and otheremissions would bereduced with FSRUand gas-firedgeneration.Increased vesseltraffic could impactcoastal marine life.
Infrastructurewould belocated awayfrom populationbut concernsover cost andstranded fossilfuel plant.
N/A
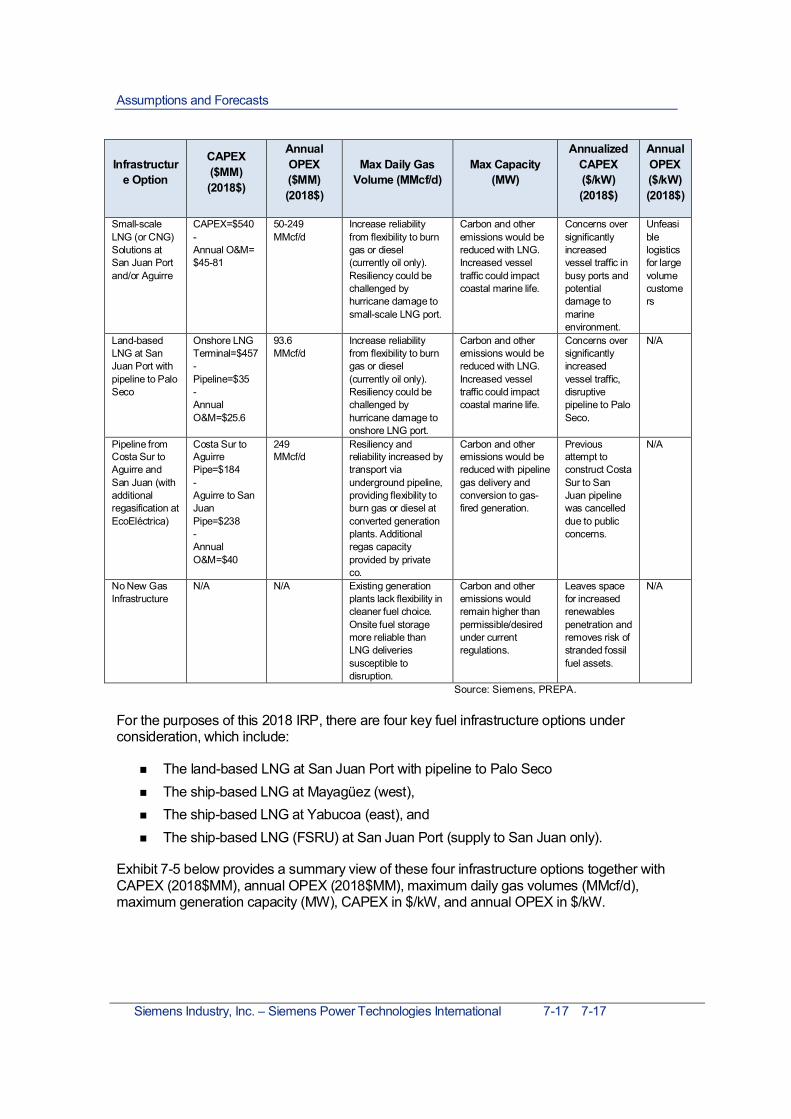
Assumptions and Forecasts
Siemens Industry, Inc. – Siemens Power Technologies International 7-17 7-17
Infrastructure Option
CAPEX($MM)(2018$)
AnnualOPEX($MM)(2018$)
Max Daily GasVolume (MMcf/d)
Max Capacity(MW)
AnnualizedCAPEX($/kW)(2018$)
AnnualOPEX($/kW)(2018$)
Small-scaleLNG (or CNG)Solutions atSan Juan Portand/or Aguirre
CAPEX=$540-Annual O&M=$45-81
50-249MMcf/d
Increase reliabilityfrom flexibility to burngas or diesel(currently oil only).Resiliency could bechallenged byhurricane damage tosmall-scale LNG port.
Carbon and otheremissions would bereduced with LNG.Increased vesseltraffic could impactcoastal marine life.
Concerns oversignificantlyincreasedvessel traffic inbusy ports andpotentialdamage tomarineenvironment.
Unfeasiblelogisticsfor largevolumecustomers
Land-basedLNG at SanJuan Port withpipeline to PaloSeco
Onshore LNGTerminal=$457-Pipeline=$35-AnnualO&M=$25.6
93.6MMcf/d
Increase reliabilityfrom flexibility to burngas or diesel(currently oil only).Resiliency could bechallenged byhurricane damage toonshore LNG port.
Carbon and otheremissions would bereduced with LNG.Increased vesseltraffic could impactcoastal marine life.
Concerns oversignificantlyincreasedvessel traffic,disruptivepipeline to PaloSeco.
N/A
Pipeline fromCosta Sur toAguirre andSan Juan (withadditionalregasification atEcoEléctrica)
Costa Sur toAguirrePipe=$184-Aguirre to SanJuanPipe=$238-AnnualO&M=$40
249MMcf/d
Resiliency andreliability increased bytransport viaunderground pipeline,providing flexibility toburn gas or diesel atconverted generationplants. Additionalregas capacityprovided by privateco.
Carbon and otheremissions would bereduced with pipelinegas delivery andconversion to gas-fired generation.
Previousattempt toconstruct CostaSur to SanJuan pipelinewas cancelleddue to publicconcerns.
N/A
No New GasInfrastructure
N/A N/A Existing generationplants lack flexibility incleaner fuel choice.Onsite fuel storagemore reliable thanLNG deliveriessusceptible todisruption.
Carbon and otheremissions wouldremain higher thanpermissible/desiredunder currentregulations.
Leaves spacefor increasedrenewablespenetration andremoves risk ofstranded fossilfuel assets.
N/A
Source: Siemens, PREPA.
For the purposes of this 2018 IRP, there are four key fuel infrastructure options underconsideration, which include:
µ The land-based LNG at San Juan Port with pipeline to Palo Secoµ The ship-based LNG at Mayagüez (west),µ The ship-based LNG at Yabucoa (east), andµ The ship-based LNG (FSRU) at San Juan Port (supply to San Juan only).
Exhibit 7-5 below provides a summary view of these four infrastructure options together withCAPEX (2018$MM), annual OPEX (2018$MM), maximum daily gas volumes (MMcf/d),maximum generation capacity (MW), CAPEX in $/kW, and annual OPEX in $/kW.
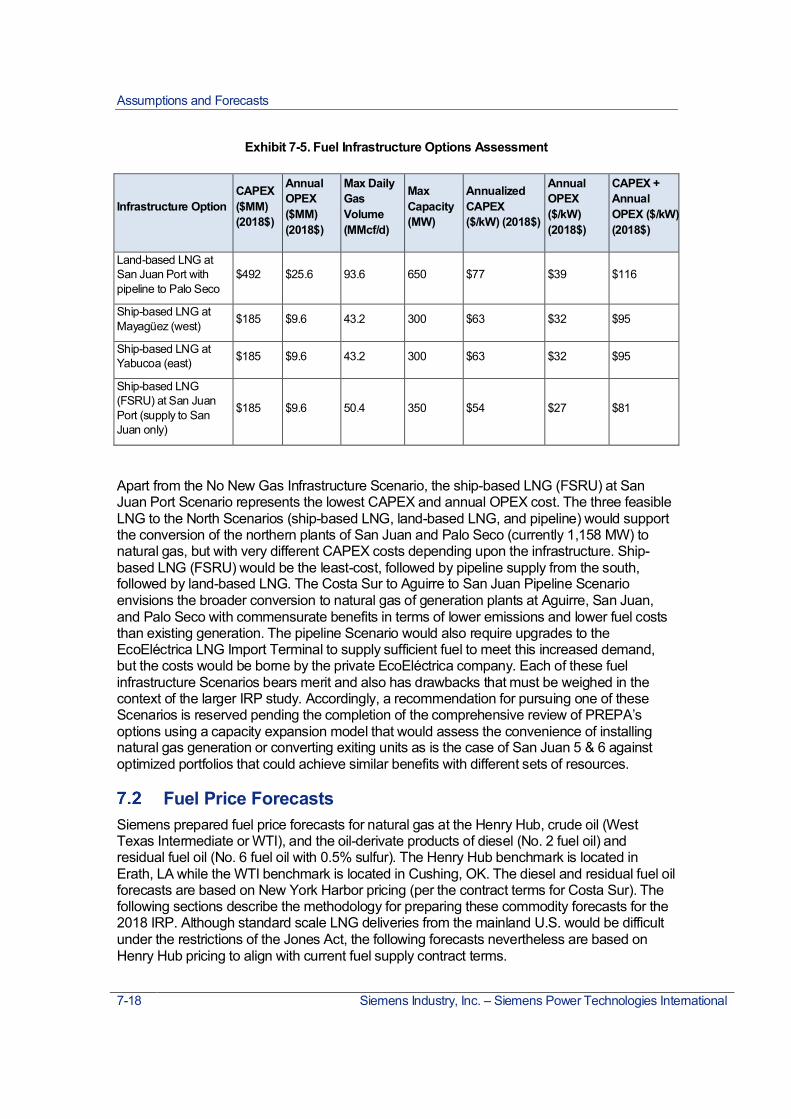
Assumptions and Forecasts
7-18 Siemens Industry, Inc. – Siemens Power Technologies International
Exhibit 7-5. Fuel Infrastructure Options Assessment
Infrastructure OptionCAPEX($MM)(2018$)
AnnualOPEX($MM)(2018$)
Max DailyGasVolume(MMcf/d)
MaxCapacity(MW)
AnnualizedCAPEX($/kW) (2018$)
AnnualOPEX($/kW)(2018$)
CAPEX +AnnualOPEX ($/kW)(2018$)
Land-based LNG atSan Juan Port withpipeline to Palo Seco
$492 $25.6 93.6 650 $77 $39 $116
Ship-based LNG atMayagüez (west) $185 $9.6 43.2 300 $63 $32 $95
Ship-based LNG atYabucoa (east) $185 $9.6 43.2 300 $63 $32 $95
Ship-based LNG(FSRU) at San JuanPort (supply to SanJuan only)
$185 $9.6 50.4 350 $54 $27 $81
Apart from the No New Gas Infrastructure Scenario, the ship-based LNG (FSRU) at SanJuan Port Scenario represents the lowest CAPEX and annual OPEX cost. The three feasibleLNG to the North Scenarios (ship-based LNG, land-based LNG, and pipeline) would supportthe conversion of the northern plants of San Juan and Palo Seco (currently 1,158 MW) tonatural gas, but with very different CAPEX costs depending upon the infrastructure. Ship-based LNG (FSRU) would be the least-cost, followed by pipeline supply from the south,followed by land-based LNG. The Costa Sur to Aguirre to San Juan Pipeline Scenarioenvisions the broader conversion to natural gas of generation plants at Aguirre, San Juan,and Palo Seco with commensurate benefits in terms of lower emissions and lower fuel coststhan existing generation. The pipeline Scenario would also require upgrades to theEcoEléctrica LNG Import Terminal to supply sufficient fuel to meet this increased demand,but the costs would be borne by the private EcoEléctrica company. Each of these fuelinfrastructure Scenarios bears merit and also has drawbacks that must be weighed in thecontext of the larger IRP study. Accordingly, a recommendation for pursuing one of theseScenarios is reserved pending the completion of the comprehensive review of PREPA’soptions using a capacity expansion model that would assess the convenience of installingnatural gas generation or converting exiting units as is the case of San Juan 5 & 6 againstoptimized portfolios that could achieve similar benefits with different sets of resources.
Fuel Price ForecastsSiemens prepared fuel price forecasts for natural gas at the Henry Hub, crude oil (WestTexas Intermediate or WTI), and the oil-derivate products of diesel (No. 2 fuel oil) andresidual fuel oil (No. 6 fuel oil with 0.5% sulfur). The Henry Hub benchmark is located inErath, LA while the WTI benchmark is located in Cushing, OK. The diesel and residual fuel oilforecasts are based on New York Harbor pricing (per the contract terms for Costa Sur). Thefollowing sections describe the methodology for preparing these commodity forecasts for the2018 IRP. Although standard scale LNG deliveries from the mainland U.S. would be difficultunder the restrictions of the Jones Act, the following forecasts nevertheless are based onHenry Hub pricing to align with current fuel supply contract terms.

Assumptions and Forecasts
Siemens Industry, Inc. – Siemens Power Technologies International 7-19 7-19
In accordance with the recommendation of the Transformation Advisory Council (TAC), whichadvocated for the use of a 10-year implied market volatility assumption for oil and natural gasin lieu of the 3-year volatility assumptions used in Siemens’ original stochastic pricesimulations, Siemens has taken into consideration the recommendation for oil price volatility.However, for natural gas price volatility, Siemens feels there is justification for a shorterhistorical lookback. The pricing graph in Exhibit 7-6 shows how natural gas prices havedeclined in each of two different shale eras. Price volatility has also declined along withabsolute prices. A potential return to higher price oil, which 2018 experienced for nearly thewhole year, would help to increase associated gas production and keep additional downwardprice pressure on natural gas.
Exhibit 7-6. Pricing Eras of the Shale Revolution
Sources: Siemens, EIA.
By contrast with natural gas, which is still a regional market, oil is much more a globalcommodity and its price and volatility have been less affected by U.S. oil shale productionthan U.S. shale gas. This is an argument for a longer historical lookback when calculating theimplied market volatility of oil, so Siemens took the TAC recommendation and recalculatedthe price distributions using a 10-year implied market volatility assumption. This allowed forthe comparison of the 10-year, 5-year, and 3-year implied market volatility, which are 2.04%,1.85%, and 1.83%, respectively. The result of the 10-year update was a higher short-termoutlook but relatively unchanged long-term outlook at the one standard deviation level (84.1st
percentile band). Although it is exceedingly rare as a Scenario, Siemens uses the twostandard deviation level (97.7th percentile band) as a high oil price boundary case, whichrepresents a future in which in only 23 out of 1,000 cases will have higher oil prices. Thiswould see oil prices reach $190/bbl in nominal dollars by the end of the forecast.
Henry Hub Natural GasSiemens develops an independent projection of regional fuel prices, in particular natural gas,crude oil and its derivative products (diesel, fuel oil, LPG, etc.). The natural gas priceprojections are developed using the GPCM® tool, is described in more detail in the
$0
$2
$4
$6
$8
$10
$12
$14
$16
0
10
20
30
40
50
60
70
80
90
Jan-
05Ju
n-05
Nov
-05
Apr
-06
Sep
-06
Feb-
07Ju
l-07
Dec
-07
May
-08
Oct
-08
Mar
-09
Aug
-09
Jan-
10Ju
n-10
Nov
-10
Apr
-11
Sep
-11
Feb-
12Ju
l-12
Dec
-12
May
-13
Oct
-13
Mar
-14
Aug
-14
Jan-
15Ju
n-15
Nov
-15
Apr
-16
Sep
-16
Feb-
17Ju
l-17
Dec
-17
May
-18
Hen
ryH
ubSp
otPr
ice
(Nom
inal
$/M
MB
tu)
U.S
.Dry
Nat
ural
Gas
Prod
uctio
n(B
cf/d
)
U.S. Dry Natural Gas Production Henry Hub Spot Price
Pre-Shale Era Gassy Shale Era Oily Shale Era
Jan-05 to Nov-08: $7.89 Dec-08 to Dec-14: $3.89 Jan-15 to Jun-18: $2.75

Assumptions and Forecasts
7-20 Siemens Industry, Inc. – Siemens Power Technologies International
Attachment A, includes the benchmark Henry Hub price hub as well as more than 60 liquidtrading hubs across North America. Siemens’s Henry Hub forecast incorporates updatedassumptions for natural gas demand, supply, and infrastructure and also benchmarks itsshort-term natural gas forecast to recent market forwards. Forwards are dated from June2018. These forwards were used explicitly for the first 18 months of the forecast (June-2018to Nov-2019), then blended into the fundamental forecast over the following 18 months. Thefirst three years of the forwards curve represent the most liquid part of the curve, when tradesand volumes are significantly higher than afterward. Exhibit 7-7 below provides a comparisonof Siemens’ forecast for Henry Hub prices with the AEO 2018 Henry Hub forecast as well asseveral other forecasts, for reference.
Exhibit 7-7. Henry Hub Forecast Comparison (nominal$/MMBtu)
Forecaster Siemens AEO 2018 Jun-18Futures
WorldBank
GLJ PetroleumConsultants
SprouleConsulting IHS
Unit nom$/MMBtu
nom$/MMBtu
nom$/MMBtu
nom$/MMBtu
nom$/MMBtu
nom$/MMBtu
nom$/MMBtu
Date Jun-18 Feb-18 Jun-18 Apr-18 Apr-18 May-18 Feb-18
2018 2.91 3.11 2.84 3.00 2.82 3.00 2.89
2019 2.72 3.51 2.72 3.10 2.90 3.25 2.87
2020 2.79 3.89 2.68 3.20 3.20 3.75 2.88
2021 3.16 3.92 2.69 3.20 3.48 3.82 3.09
2022 3.27 4.03 2.74 3.30 3.67 3.90 3.30
2023 3.49 4.25 2.81 3.40 3.82 3.55
2024 3.76 4.46 2.88 3.50 3.90 3.95
2025 3.98 4.69 2.95 3.60 3.97 4.01
2026 4.16 4.83 3.01 3.68 4.04 4.03
2027 4.24 4.98 3.07 3.76 4.12 4.16
2028 4.34 5.10 3.16 3.84 4.20 4.41
2029 4.39 5.28 3.92 4.80
2030 4.56 5.39 4.00 5.18
2031 4.61 5.49 5.09
2032 4.82 5.61 5.50
2033 4.97 5.71 5.78
2034 5.18 5.81 5.69
2035 5.39 5.91 5.79
2036 5.54 6.15 5.76
2037 5.74 6.29 6.09
2038 5.84 6.51 6.53
2039 5.90 6.70 6.79
2040 6.03 6.87 7.19

Assumptions and Forecasts
Siemens Industry, Inc. – Siemens Power Technologies International 7-21 7-21
Source: Siemens, various sources.
Siemens prepared a delivered natural gas price forecast for the Costa Sur, San Juan, andAguirre generation plants, as well as the Mayagüez and Yabucoa plants, each of which canor could receive natural gas as a fuel supply and which represent the four sides of the island.In the case of Costa Sur, which is currently under a fuel supply contract48, the adders arealready known and applied to derive a delivered natural gas forecast price. In the case ofAguirre and San Juan, the P2 pricing formula from the San Juan fuel supply contract wasused, which is equal to 115% of Henry Hub plus $5.95/MMBtu. The Mayagüez and Yabucoaplants are assumed to have a similar LNG price structure as San Juan.
EIA Annual Energy Outlook 2018The U.S. Department of Energy’s (DOE) EIA Annual Energy Outlook (AEO) 201849, issuedFebruary 2018, provides their latest forecast for natural gas prices at the benchmark HenryHub based on the key fundamentals of supply, demand, and infrastructure. The AEO 2018Reference case forecasts that natural gas production growth will outpace consumptiongrowth in every year to the forecast horizon of 2050. This driver, together with an estimatedincrease in lower-cost resources in the Permian and Appalachian basins, has resulted inHenry Hub prices that are 14% lower this year than last year’s AEO. In the Permian basin,associated natural gas production from tight oil production is supported by relatively high oilprices. In the Appalachian basin, the Marcellus and Utica plays (located in Pennsylvania,Ohio, and West Virginia) continue to drive most U.S. production growth as they have over thelast several years due to the substantial resource in-place with low production costsproximate to key demand centers in the U.S. Northeast. On the demand side, industrial andpower generation demand together drive natural gas consumption growth to 2050. Growth in
48 http://energia.pr.gov/wp-content/uploads/2018/08/Memorial-Explicativo-R-del-S-219-CEPR.pdf49 https://www.eia.gov/outlooks/aeo/
$0.00
$1.00
$2.00
$3.00
$4.00
$5.00
$6.00
$7.00
$8.00
2018
2019
2020
2021
2022
2023
2024
2025
2026
2027
2028
2029
2030
2031
2032
2033
2034
2035
2036
2037
2038
2039
2040
nom
inal
$/M
MBt
u
Siemens Jun-18 Futures World BankGLJ Petroleum Consultants Sproule Consulting IHSAEO 2018

Assumptions and Forecasts
7-22 Siemens Industry, Inc. – Siemens Power Technologies International
exports via liquefied natural gas (LNG) facilities is strong through 2030 and pipeline exports toMexico through 2025.
The AEO 2018 forecast for WTI, distillate fuel oil (diesel), and residual fuel oil is provided inExhibit 7-8 below.
Exhibit 7-8. AEO 2018 Price Outlook (nominal$/gallon)
Product WTI Diesel RFO
Unit nom$/gallon
nom$/gallon
nom$/gallon
2018 1.20 2.05 1.56
2019 1.30 2.19 1.78
2020 1.68 2.68 2.18
2021 1.88 2.93 2.36
2022 2.00 3.05 2.42
2023 2.09 3.15 2.47
2024 2.16 3.24 2.53
2025 2.26 3.31 2.59
2026 2.33 3.37 2.68
2027 2.42 3.46 2.77
2028 2.50 3.55 2.83
2029 2.60 3.68 2.93
2030 2.68 3.77 3.03
2031 2.77 3.89 3.14
2032 2.86 4.00 3.23
2033 2.96 4.13 3.32
2034 3.05 4.26 3.41
2035 3.15 4.36 3.51
2036 3.23 4.47 3.58
2037 3.37 4.66 3.72
2038 3.48 4.76 3.81
2039 3.57 4.90 3.92
2040 3.68 5.04 4.01
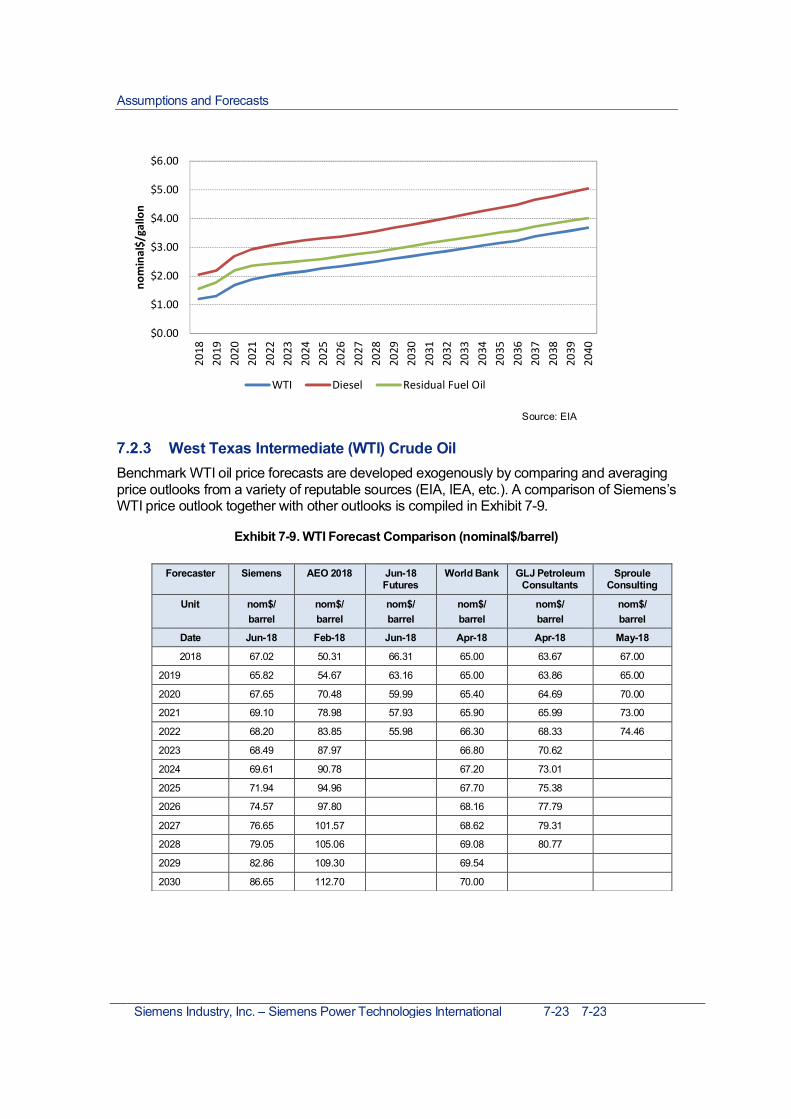
Assumptions and Forecasts
Siemens Industry, Inc. – Siemens Power Technologies International 7-23 7-23
Source: EIA
West Texas Intermediate (WTI) Crude OilBenchmark WTI oil price forecasts are developed exogenously by comparing and averagingprice outlooks from a variety of reputable sources (EIA, IEA, etc.). A comparison of Siemens’sWTI price outlook together with other outlooks is compiled in Exhibit 7-9.
Exhibit 7-9. WTI Forecast Comparison (nominal$/barrel)
Forecaster Siemens AEO 2018 Jun-18Futures
World Bank GLJ PetroleumConsultants
SprouleConsulting
Unit nom$/barrel
nom$/barrel
nom$/barrel
nom$/barrel
nom$/barrel
nom$/barrel
Date Jun-18 Feb-18 Jun-18 Apr-18 Apr-18 May-18
2018 67.02 50.31 66.31 65.00 63.67 67.00
2019 65.82 54.67 63.16 65.00 63.86 65.00
2020 67.65 70.48 59.99 65.40 64.69 70.00
2021 69.10 78.98 57.93 65.90 65.99 73.00
2022 68.20 83.85 55.98 66.30 68.33 74.46
2023 68.49 87.97 66.80 70.62
2024 69.61 90.78 67.20 73.01
2025 71.94 94.96 67.70 75.38
2026 74.57 97.80 68.16 77.79
2027 76.65 101.57 68.62 79.31
2028 79.05 105.06 69.08 80.77
2029 82.86 109.30 69.54
2030 86.65 112.70 70.00
$0.00
$1.00
$2.00
$3.00
$4.00
$5.00
$6.00
2018
2019
2020
2021
2022
2023
2024
2025
2026
2027
2028
2029
2030
2031
2032
2033
2034
2035
2036
2037
2038
2039
2040
nom
inal
$/ga
llon
WTI Diesel Residual Fuel Oil
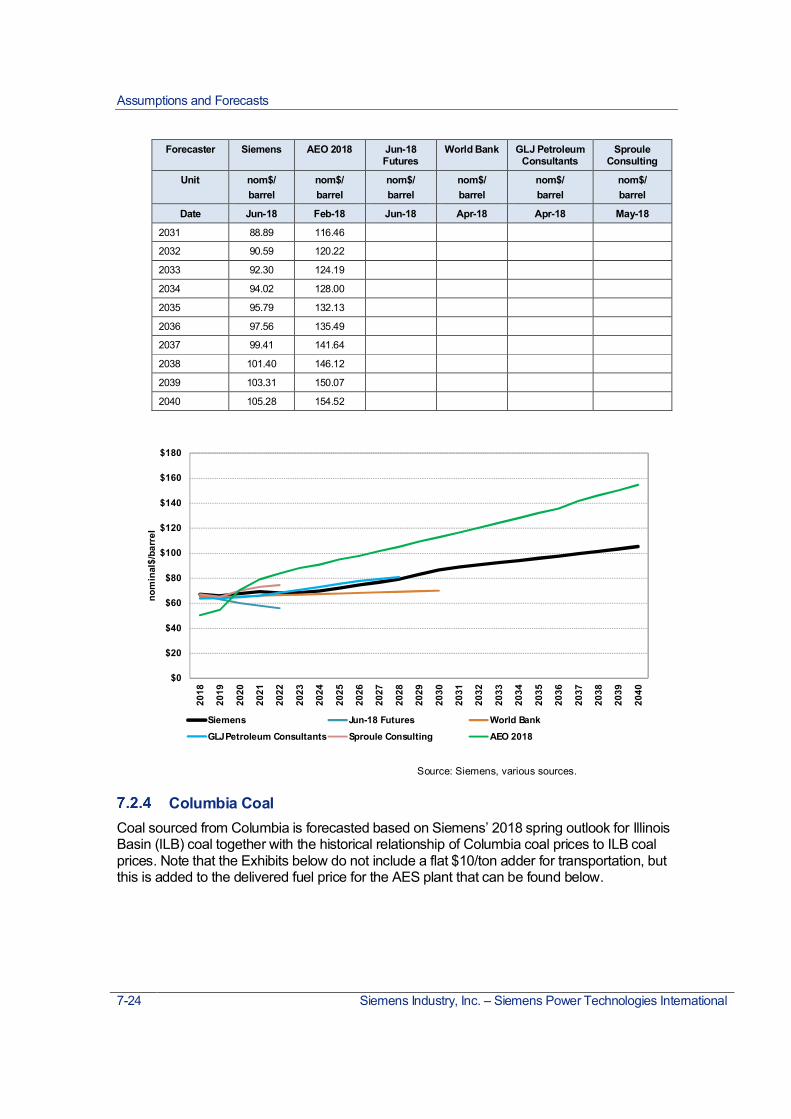
Assumptions and Forecasts
7-24 Siemens Industry, Inc. – Siemens Power Technologies International
Forecaster Siemens AEO 2018 Jun-18Futures
World Bank GLJ PetroleumConsultants
SprouleConsulting
Unit nom$/barrel
nom$/barrel
nom$/barrel
nom$/barrel
nom$/barrel
nom$/barrel
Date Jun-18 Feb-18 Jun-18 Apr-18 Apr-18 May-18
2031 88.89 116.46
2032 90.59 120.22
2033 92.30 124.19
2034 94.02 128.00
2035 95.79 132.13
2036 97.56 135.49
2037 99.41 141.64
2038 101.40 146.12
2039 103.31 150.07
2040 105.28 154.52
Source: Siemens, various sources.
Columbia CoalCoal sourced from Columbia is forecasted based on Siemens’ 2018 spring outlook for IllinoisBasin (ILB) coal together with the historical relationship of Columbia coal prices to ILB coalprices. Note that the Exhibits below do not include a flat $10/ton adder for transportation, butthis is added to the delivered fuel price for the AES plant that can be found below.
$0
$20
$40
$60
$80
$100
$120
$140
$160
$180
2018
2019
2020
2021
2022
2023
2024
2025
2026
2027
2028
2029
2030
2031
2032
2033
2034
2035
2036
2037
2038
2039
2040
nom
inal
$/ba
rrel
Siemens Jun-18 Futures World Bank
GLJ Petroleum Consultants Sproule Consulting AEO 2018

Assumptions and Forecasts
Siemens Industry, Inc. – Siemens Power Technologies International 7-25 7-25
Exhibit 7-10 Columbia Coal Mine Mouth Price Forecast(nominal$/ton)
Unit nom$/ton
Date Jul-182018 69.432019 62.242020 58.762021 59.022022 58.022023 58.412024 57.692025 58.512026 59.612027 60.732028 61.882029 63.052030 64.242031 65.462032 66.692033 67.952034 69.242035 70.552036 71.892037 73.282038 74.712039 76.172040 77.66
Forecast Delivered Fuel Prices at Key Power PlantsThe tables below provide Siemens’ outlook for delivered fuel prices to the four sides of PuertoRico (Aguirre, San Juan / Palo Seco, Costa Sur, EcoEléctrica, Mayagüez, and Yabucoa).The forecasts are built from Siemens’ base commodity prices for natural gas and crude oilprices, which are then adapted to diesel, residual fuel oil, and LPG based on a historicalregression analysis of the relationship between these petroleum products and WTI prices.Finally, cost adders are applied to the base commodity prices to derive delivered fuel prices.The adders were derived from current contractual obligations as provided by PREPA’s FuelsOffice. Delivered coal and LPG fuel prices are also included below.
The EcoEléctrica gas prices assumes that on 2022 the contract is renegotiated and all fixedcosts including regasification are blended in a renegotiated fixed payment. The gas prices2022 onwards reflects the cost of the commodity, liquefaction and transportation only andassume that the long-term contract that EcoEléctrica had for reduced natural gas pricesexpires.

Assumptions and Forecasts
7-26 Siemens Industry, Inc. – Siemens Power Technologies International
Exhibit 7-11. Delivered Aguirre Fuel Price Forecast(Nominal$/MMBtu)
Plant Aguirre Aguirre Aguirre Aguirre Aguirre Aguirre Aguirre Aguirre AguirreYear \Unit
NaturalGas
Gas @-1SD
Gas @+1SD
Diesel Diesel @-1SD
Diesel @+2SD
RFO RFO @-1SD
RFO @+2SD
2018 7.70 7.53 7.65 16.44 16.18 16.60 11.48 11.26 11.612019 7.48 7.14 7.52 16.18 15.29 16.81 11.26 10.53 11.792020 7.56 7.00 7.77 16.62 15.13 18.16 11.64 10.40 12.912021 7.99 7.17 8.46 16.98 14.58 19.79 11.94 9.96 14.272022 8.11 7.01 8.97 16.79 13.73 21.45 11.79 9.26 15.652023 8.37 6.75 9.81 16.88 12.95 24.57 11.87 8.62 18.242024 8.67 6.96 10.51 17.16 12.48 29.75 12.11 8.23 22.532025 8.93 7.17 10.63 17.72 12.57 31.58 12.57 8.32 24.052026 9.14 7.21 11.07 18.35 13.07 32.75 13.11 8.73 25.032027 9.23 7.31 11.10 18.84 13.37 32.72 13.52 8.99 25.012028 9.34 7.40 11.27 19.43 13.67 34.00 14.01 9.24 26.072029 9.40 7.36 11.37 20.33 14.22 35.49 14.76 9.70 27.312030 9.59 7.50 11.66 21.21 14.65 37.87 15.50 10.07 29.292031 9.65 7.25 11.80 21.76 14.98 38.74 15.96 10.35 30.012032 9.90 7.45 12.13 22.17 15.20 40.07 16.31 10.54 31.122033 10.07 7.60 12.32 22.59 15.54 40.55 16.66 10.82 31.532034 10.31 7.64 12.95 23.02 15.74 42.21 17.02 11.00 32.912035 10.55 7.88 13.25 23.45 15.71 42.99 17.39 10.98 33.562036 10.73 7.82 13.53 23.89 16.48 43.27 17.76 11.63 33.802037 10.96 8.14 13.85 24.35 16.79 44.11 18.15 11.89 34.512038 11.06 8.17 13.76 24.83 17.06 45.60 18.55 12.12 35.752039 11.15 8.00 13.76 25.31 17.24 46.00 18.96 12.28 36.092040 11.30 8.09 13.96 25.80 17.66 47.57 19.37 12.64 37.39
$0
$5
$10
$15
$20
$25
$30
$35
$40
$45
$50
2018
2020
2022
2024
2026
2028
2030
2032
2034
2036
2038
2040
Nom
inal
$/M
MBt
u
Diesel @ +2SD
Diesel
Diesel @ -1SD
RFO @ +2SD
RFO
RFO @ -1SD
Gas @ +1SD
Natural Gas
Gas @ -1SD
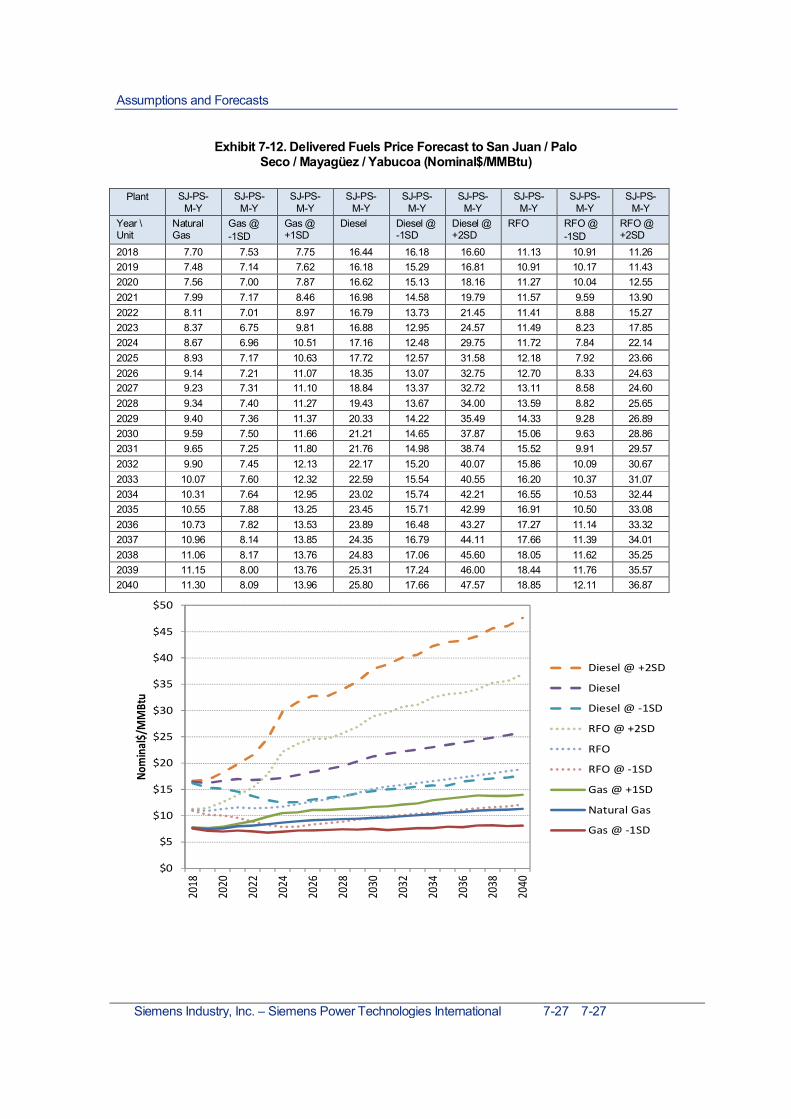
Assumptions and Forecasts
Siemens Industry, Inc. – Siemens Power Technologies International 7-27 7-27
Exhibit 7-12. Delivered Fuels Price Forecast to San Juan / PaloSeco / Mayagüez / Yabucoa (Nominal$/MMBtu)
Plant SJ-PS-M-Y
SJ-PS-M-Y
SJ-PS-M-Y
SJ-PS-M-Y
SJ-PS-M-Y
SJ-PS-M-Y
SJ-PS-M-Y
SJ-PS-M-Y
SJ-PS-M-Y
Year \Unit
NaturalGas
Gas @-1SD
Gas @+1SD
Diesel Diesel @-1SD
Diesel @+2SD
RFO RFO @-1SD
RFO @+2SD
2018 7.70 7.53 7.75 16.44 16.18 16.60 11.13 10.91 11.262019 7.48 7.14 7.62 16.18 15.29 16.81 10.91 10.17 11.432020 7.56 7.00 7.87 16.62 15.13 18.16 11.27 10.04 12.552021 7.99 7.17 8.46 16.98 14.58 19.79 11.57 9.59 13.902022 8.11 7.01 8.97 16.79 13.73 21.45 11.41 8.88 15.272023 8.37 6.75 9.81 16.88 12.95 24.57 11.49 8.23 17.852024 8.67 6.96 10.51 17.16 12.48 29.75 11.72 7.84 22.142025 8.93 7.17 10.63 17.72 12.57 31.58 12.18 7.92 23.662026 9.14 7.21 11.07 18.35 13.07 32.75 12.70 8.33 24.632027 9.23 7.31 11.10 18.84 13.37 32.72 13.11 8.58 24.602028 9.34 7.40 11.27 19.43 13.67 34.00 13.59 8.82 25.652029 9.40 7.36 11.37 20.33 14.22 35.49 14.33 9.28 26.892030 9.59 7.50 11.66 21.21 14.65 37.87 15.06 9.63 28.862031 9.65 7.25 11.80 21.76 14.98 38.74 15.52 9.91 29.572032 9.90 7.45 12.13 22.17 15.20 40.07 15.86 10.09 30.672033 10.07 7.60 12.32 22.59 15.54 40.55 16.20 10.37 31.072034 10.31 7.64 12.95 23.02 15.74 42.21 16.55 10.53 32.442035 10.55 7.88 13.25 23.45 15.71 42.99 16.91 10.50 33.082036 10.73 7.82 13.53 23.89 16.48 43.27 17.27 11.14 33.322037 10.96 8.14 13.85 24.35 16.79 44.11 17.66 11.39 34.012038 11.06 8.17 13.76 24.83 17.06 45.60 18.05 11.62 35.252039 11.15 8.00 13.76 25.31 17.24 46.00 18.44 11.76 35.572040 11.30 8.09 13.96 25.80 17.66 47.57 18.85 12.11 36.87
$0
$5
$10
$15
$20
$25
$30
$35
$40
$45
$50
2018
2020
2022
2024
2026
2028
2030
2032
2034
2036
2038
2040
Nom
inal$
/MM
Btu
Diesel @ +2SD
Diesel
Diesel @ -1SD
RFO @ +2SD
RFO
RFO @ -1SD
Gas @ +1SD
Natural Gas
Gas @ -1SD
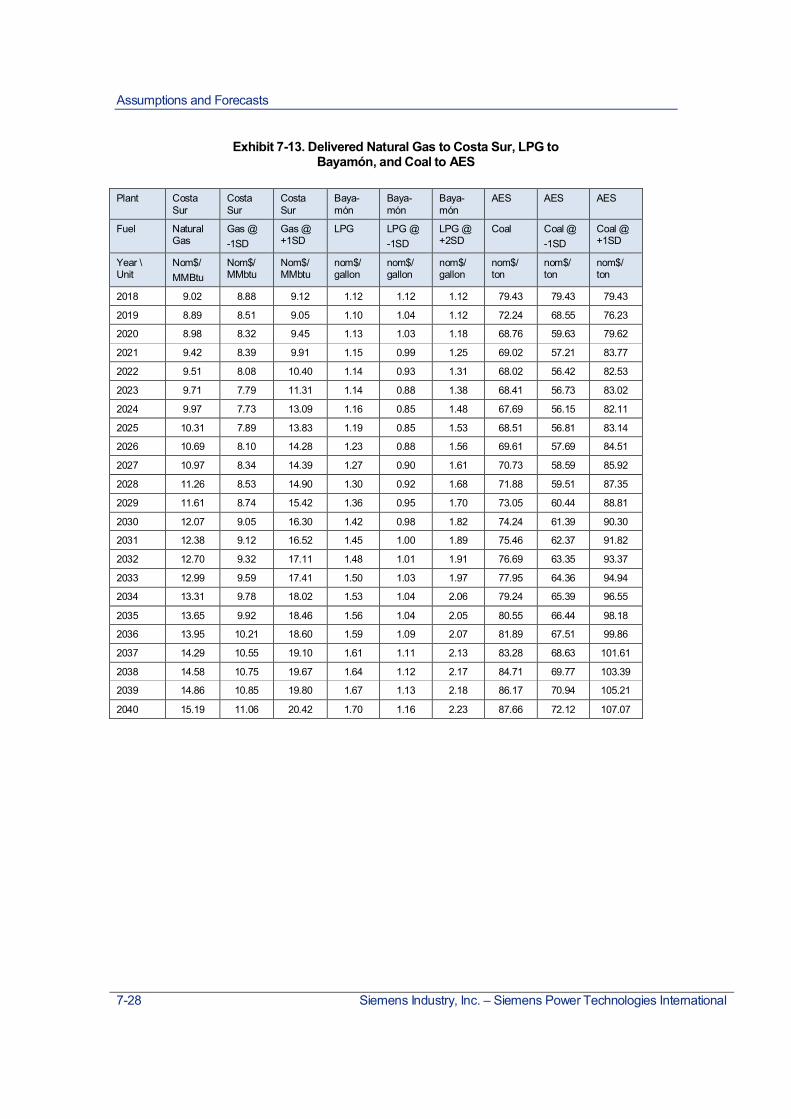
Assumptions and Forecasts
7-28 Siemens Industry, Inc. – Siemens Power Technologies International
Exhibit 7-13. Delivered Natural Gas to Costa Sur, LPG toBayamón, and Coal to AES
Plant CostaSur
CostaSur
CostaSur
Baya-món
Baya-món
Baya-món
AES AES AES
Fuel NaturalGas
Gas @-1SD
Gas @+1SD
LPG LPG @-1SD
LPG @+2SD
Coal Coal @-1SD
Coal @+1SD
Year \Unit
Nom$/MMBtu
Nom$/MMbtu
Nom$/MMbtu
nom$/gallon
nom$/gallon
nom$/gallon
nom$/ton
nom$/ton
nom$/ton
2018 9.02 8.88 9.12 1.12 1.12 1.12 79.43 79.43 79.43
2019 8.89 8.51 9.05 1.10 1.04 1.12 72.24 68.55 76.23
2020 8.98 8.32 9.45 1.13 1.03 1.18 68.76 59.63 79.62
2021 9.42 8.39 9.91 1.15 0.99 1.25 69.02 57.21 83.77
2022 9.51 8.08 10.40 1.14 0.93 1.31 68.02 56.42 82.53
2023 9.71 7.79 11.31 1.14 0.88 1.38 68.41 56.73 83.02
2024 9.97 7.73 13.09 1.16 0.85 1.48 67.69 56.15 82.11
2025 10.31 7.89 13.83 1.19 0.85 1.53 68.51 56.81 83.14
2026 10.69 8.10 14.28 1.23 0.88 1.56 69.61 57.69 84.51
2027 10.97 8.34 14.39 1.27 0.90 1.61 70.73 58.59 85.92
2028 11.26 8.53 14.90 1.30 0.92 1.68 71.88 59.51 87.35
2029 11.61 8.74 15.42 1.36 0.95 1.70 73.05 60.44 88.81
2030 12.07 9.05 16.30 1.42 0.98 1.82 74.24 61.39 90.30
2031 12.38 9.12 16.52 1.45 1.00 1.89 75.46 62.37 91.82
2032 12.70 9.32 17.11 1.48 1.01 1.91 76.69 63.35 93.37
2033 12.99 9.59 17.41 1.50 1.03 1.97 77.95 64.36 94.94
2034 13.31 9.78 18.02 1.53 1.04 2.06 79.24 65.39 96.55
2035 13.65 9.92 18.46 1.56 1.04 2.05 80.55 66.44 98.18
2036 13.95 10.21 18.60 1.59 1.09 2.07 81.89 67.51 99.86
2037 14.29 10.55 19.10 1.61 1.11 2.13 83.28 68.63 101.61
2038 14.58 10.75 19.67 1.64 1.12 2.17 84.71 69.77 103.39
2039 14.86 10.85 19.80 1.67 1.13 2.18 86.17 70.94 105.21
2040 15.19 11.06 20.42 1.70 1.16 2.23 87.66 72.12 107.07

Assumptions and Forecasts
Siemens Industry, Inc. – Siemens Power Technologies International 7-29 7-29
$0
$2
$4
$6
$8
$10
$12
$14
$16
$18
$20
$22
2018
2020
2022
2024
2026
2028
2030
2032
2034
2036
2038
2040
Nom
inal
$/M
MBt
uCosta Sur Delivered LNG Price
Gas @ +1SD
Natural Gas
Gas @ -1SD
$0.00
$0.50
$1.00
$1.50
$2.00
$2.50
2018
2020
2022
2024
2026
2028
2030
2032
2034
2036
2038
2040
Nom
inal
$/ga
llon
Bayamón Delivered LNG Price
LPG @ +2SD
LPG
LPG @ -1SD

Assumptions and Forecasts
7-30 Siemens Industry, Inc. – Siemens Power Technologies International
$0
$20
$40
$60
$80
$100
$120
2018
2020
2022
2024
2026
2028
2030
2032
2034
2036
2038
2040
Nom
inal
$/m
etric
tonn
eAES Delivered Coal Price
Coal @ +1SD
Coal
Coal @ -1SD

Assumptions and Forecasts
Siemens Industry, Inc. – Siemens Power Technologies International 7-31 7-31
Exhibit 7-14. Delivered EcoEléctrica Natural Gas Price Forecast(Nominal$/MMBtu)
Plant EcoEléctrica EcoEléctrica EcoEléctrica EcoEléctrica EcoEléctrica EcoEléctrica
Fuel Natural Gas Gas @ -1SD Gas @ +1SD Natural Gas Gas @ -1SD Gas @ +1SD
CapacityFactor
>=76% CF >=76% CF >=76% CF <76% CF <76% CF <76% CF
Year / Unit nom$/MMBtu
nom$/MMBtu
nom$/MMBtu
nom$/MMBtu
nom$/MMBtu
nom$/MMBtu
2018 9.02 8.88 9.02 5.04 5.04 5.04
2019 8.89 8.51 8.95 5.04 5.04 5.04
2020 8.98 8.32 9.36 4.96 4.96 4.96
2021 9.42 8.39 9.91 5.06 5.06 5.06
2022 8.11 7.01 8.97
2023 8.37 6.75 9.81
2024 8.67 6.96 10.51
2025 8.93 7.17 10.63
2026 9.14 7.21 11.07
2027 9.23 7.31 11.10
2028 9.34 7.40 11.27
2029 9.40 7.36 11.37
2030 9.59 7.50 11.66
2031 9.65 7.25 11.80
2032 9.90 7.45 12.13
2033 10.07 7.60 12.32
2034 10.31 7.64 12.95
2035 10.55 7.88 13.25
2036 10.73 7.82 13.53
2037 10.96 8.14 13.85
2038 11.06 8.17 13.76
2039 11.15 8.00 13.76
2040 11.30 8.09 13.96

Assumptions and Forecasts
7-32 Siemens Industry, Inc. – Siemens Power Technologies International
Value of Lost Load EstimationAs part of PREPA’s Integrated Resource Planning (IRP), Siemens performed a loss of loadanalysis to assess the likelihood that due to generation and/or transmission outages, thesystem will be unable to meet load for any period of time. The objective of the analysis is toidentify hours in which local or system wide supply may be inadequate to meet demand.
The analysis is performed using a Monte-Carlo simulation to capture loss of load hours(LOLH) and Energy Not Served (ENS) considering the expected performance of thegenerating fleet and the impact of normal transmission limitations. Additionally, for the impactof weather events two approaches are being considered:
Model a Scenario representative of system condition after a major storm that is expected tooccur with relative frequency (e.g. Category 1 Hurricane) and evaluate the LOLH and ENSfor a period of 1 month assuming that the system will stay in this condition.
Model a Scenario of the system condition after a major storm that is expected to occur moreinfrequently (e.g. a Cat 4 Hurricane) in which the system is split into the pre-designed regions(called MiniGrids). Each MiniGrid is assumed to operate in isolation for 1 month. Anestimation of load not served during MiniGrid formation can be included.
As part of this IRP, Siemens has estimated the value of lost load (VOLL) based onmethodologies applied in other countries or regions. To meet the IRP objectives, Siemenscomputed a VOLL adjustment for each of the portfolios to evaluate the expected total costincluding the cost of maintaining resiliency, which FERC defined as: “The ability to withstandand reduce the magnitude and/or duration of disruptive events, which includes the capability
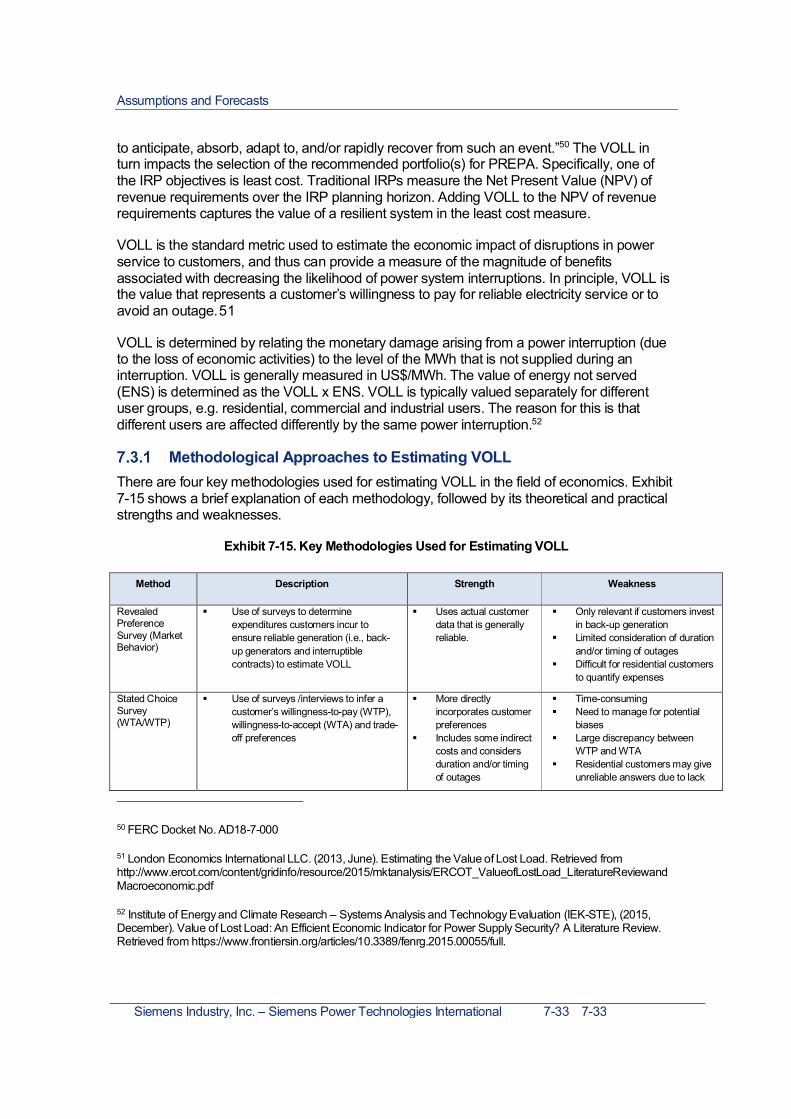
Assumptions and Forecasts
Siemens Industry, Inc. – Siemens Power Technologies International 7-33 7-33
to anticipate, absorb, adapt to, and/or rapidly recover from such an event.”50 The VOLL inturn impacts the selection of the recommended portfolio(s) for PREPA. Specifically, one ofthe IRP objectives is least cost. Traditional IRPs measure the Net Present Value (NPV) ofrevenue requirements over the IRP planning horizon. Adding VOLL to the NPV of revenuerequirements captures the value of a resilient system in the least cost measure.
VOLL is the standard metric used to estimate the economic impact of disruptions in powerservice to customers, and thus can provide a measure of the magnitude of benefitsassociated with decreasing the likelihood of power system interruptions. In principle, VOLL isthe value that represents a customer’s willingness to pay for reliable electricity service or toavoid an outage.51
VOLL is determined by relating the monetary damage arising from a power interruption (dueto the loss of economic activities) to the level of the MWh that is not supplied during aninterruption. VOLL is generally measured in US$/MWh. The value of energy not served(ENS) is determined as the VOLL x ENS. VOLL is typically valued separately for differentuser groups, e.g. residential, commercial and industrial users. The reason for this is thatdifferent users are affected differently by the same power interruption.52
Methodological Approaches to Estimating VOLLThere are four key methodologies used for estimating VOLL in the field of economics. Exhibit7-15 shows a brief explanation of each methodology, followed by its theoretical and practicalstrengths and weaknesses.
Exhibit 7-15. Key Methodologies Used for Estimating VOLL
Method Description Strength Weakness
RevealedPreferenceSurvey (MarketBehavior)
ƒ Use of surveys to determineexpenditures customers incur toensure reliable generation (i.e., back-up generators and interruptiblecontracts) to estimate VOLL
ƒ Uses actual customerdata that is generallyreliable.
ƒ Only relevant if customers investin back-up generation
ƒ Limited consideration of durationand/or timing of outages
ƒ Difficult for residential customersto quantify expenses
Stated ChoiceSurvey(WTA/WTP)
ƒ Use of surveys /interviews to infer acustomer’s willingness-to-pay (WTP),willingness-to-accept (WTA) and trade-off preferences
ƒ More directlyincorporates customerpreferences
ƒ Includes some indirectcosts and considersduration and/or timingof outages
ƒ Time-consumingƒ Need to manage for potential
biasesƒ Large discrepancy between
WTP and WTAƒ Residential customers may give
unreliable answers due to lack
50 FERC Docket No. AD18-7-000
51 London Economics International LLC. (2013, June). Estimating the Value of Lost Load. Retrieved fromhttp://www.ercot.com/content/gridinfo/resource/2015/mktanalysis/ERCOT_ValueofLostLoad_LiteratureReviewandMacroeconomic.pdf
52 Institute of Energy and Climate Research – Systems Analysis and Technology Evaluation (IEK-STE), (2015,December). Value of Lost Load: An Efficient Economic Indicator for Power Supply Security? A Literature Review.Retrieved from https://www.frontiersin.org/articles/10.3389/fenrg.2015.00055/full.
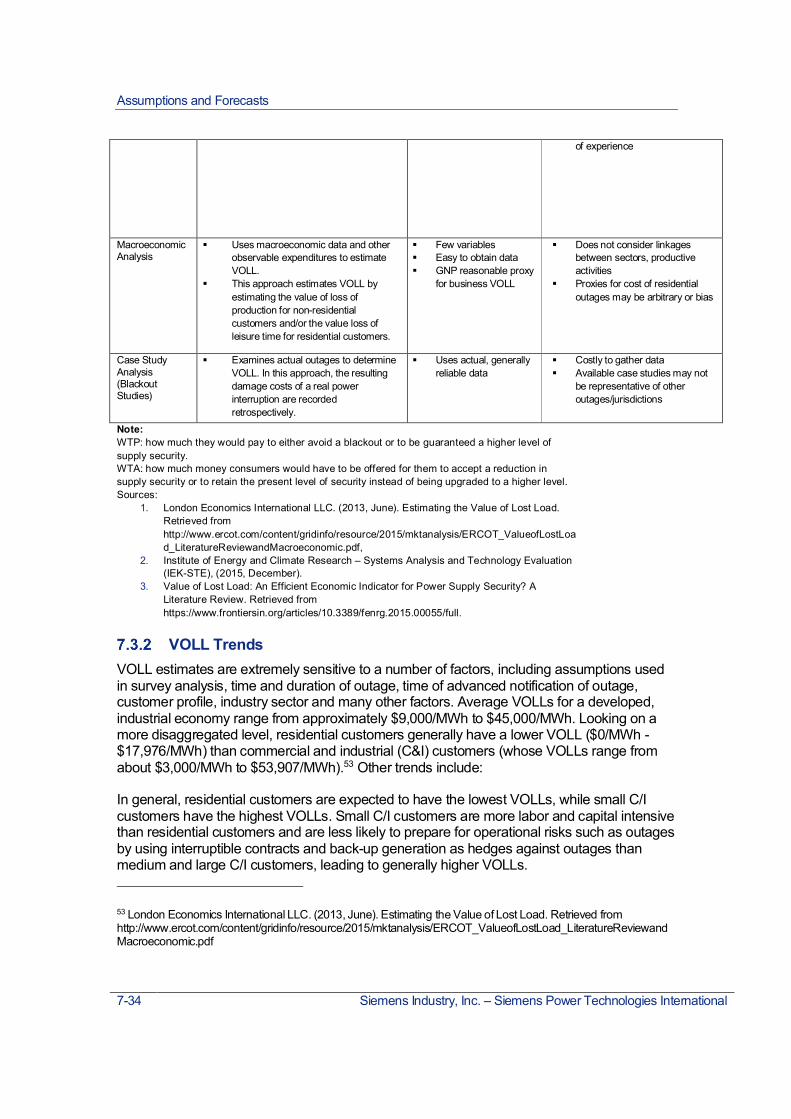
Assumptions and Forecasts
7-34 Siemens Industry, Inc. – Siemens Power Technologies International
of experience
MacroeconomicAnalysis
ƒ Uses macroeconomic data and otherobservable expenditures to estimateVOLL.
ƒ This approach estimates VOLL byestimating the value of loss ofproduction for non-residentialcustomers and/or the value loss ofleisure time for residential customers.
ƒ Few variablesƒ Easy to obtain dataƒ GNP reasonable proxy
for business VOLL
ƒ Does not consider linkagesbetween sectors, productiveactivities
ƒ Proxies for cost of residentialoutages may be arbitrary or bias
Case StudyAnalysis(BlackoutStudies)
ƒ Examines actual outages to determineVOLL. In this approach, the resultingdamage costs of a real powerinterruption are recordedretrospectively.
ƒ Uses actual, generallyreliable data
ƒ Costly to gather dataƒ Available case studies may not
be representative of otheroutages/jurisdictions
Note:WTP: how much they would pay to either avoid a blackout or to be guaranteed a higher level ofsupply security.WTA: how much money consumers would have to be offered for them to accept a reduction insupply security or to retain the present level of security instead of being upgraded to a higher level.Sources:
1. London Economics International LLC. (2013, June). Estimating the Value of Lost Load.Retrieved fromhttp://www.ercot.com/content/gridinfo/resource/2015/mktanalysis/ERCOT_ValueofLostLoad_LiteratureReviewandMacroeconomic.pdf,
2. Institute of Energy and Climate Research – Systems Analysis and Technology Evaluation(IEK-STE), (2015, December).
3. Value of Lost Load: An Efficient Economic Indicator for Power Supply Security? ALiterature Review. Retrieved fromhttps://www.frontiersin.org/articles/10.3389/fenrg.2015.00055/full.
VOLL TrendsVOLL estimates are extremely sensitive to a number of factors, including assumptions usedin survey analysis, time and duration of outage, time of advanced notification of outage,customer profile, industry sector and many other factors. Average VOLLs for a developed,industrial economy range from approximately $9,000/MWh to $45,000/MWh. Looking on amore disaggregated level, residential customers generally have a lower VOLL ($0/MWh -$17,976/MWh) than commercial and industrial (C&I) customers (whose VOLLs range fromabout $3,000/MWh to $53,907/MWh).53 Other trends include:
In general, residential customers are expected to have the lowest VOLLs, while small C/Icustomers have the highest VOLLs. Small C/I customers are more labor and capital intensivethan residential customers and are less likely to prepare for operational risks such as outagesby using interruptible contracts and back-up generation as hedges against outages thanmedium and large C/I customers, leading to generally higher VOLLs.
53 London Economics International LLC. (2013, June). Estimating the Value of Lost Load. Retrieved fromhttp://www.ercot.com/content/gridinfo/resource/2015/mktanalysis/ERCOT_ValueofLostLoad_LiteratureReviewandMacroeconomic.pdf

Assumptions and Forecasts
Siemens Industry, Inc. – Siemens Power Technologies International 7-35 7-35
Residential VOLLs in the U.S. are in the $1,000/MWh – $4,000/MWh range, while VOLLs ininternational jurisdictions tend to be much higher. This variation may be due to a variety offactors, including different consumption patterns and costs of electricity in the regions studied,as well as the different methodologies used to estimate VOLL in each study.
Long duration outages lead to higher VOLL as the indirect and induced costs of the outageincrease over time (loss of wages, loss of perishable goods, etc.).
Exhibit 7-16 shows the results of recent VOLL studies, broken down according tomethodology applied and end-user group. Due to the different degrees of differentiation, theVOLL results of the studies are shown as ranges. 54
Exhibit 7-16. Results of Recent VOLL Studies
Note: All values in 2012 US$/MWh
Sources: London Economics International LLC. (2013, June). Estimating the Value of Lost Load.Retrieved fromhttp://www.ercot.com/content/gridinfo/resource/2015/mktanalysis/ERCOT_ValueofLostLoad_LiteratureReviewandMacroeconomic.pdf
First Approach to Calculate Puerto Rico’s VOLLOne approach to calculate Puerto Rico’s VOLL is to understand which of the ninejurisdictional studies shown in Exhibit 7-16 has the most similarities to Puerto Rico. Theapplicability of the VOLL estimates from the nine jurisdictional studies to Puerto Rico isdetermined by considering the similarities between the studied geographic region/market andPuerto Rico. The metrics include: (1) economic and demographic (population and GNP,urban/rural, temperature); (2) electricity consumption patterns; and (3) market design. Themix of customer class also plays a role. In FY2016, residential, small C&I55, andmedium/large C&I56 customers represented approximately 38%, 13% and 50% respectively
54 London Economics International LLC. (2013, June). Estimating the Value of Lost Load. Retrieved fromhttp://www.ercot.com/content/gridinfo/resource/2015/mktanalysis/ERCOT_ValueofLostLoad_LiteratureReviewandMacroeconomic.pdf55 Small C&I= customers with an annual consumption under 50,000 kWh56 Medium/Large C&I = customers with an annual consumption over 50,000 kWh

Assumptions and Forecasts
7-36 Siemens Industry, Inc. – Siemens Power Technologies International
of PREPA’s total sales. As shown in Exhibit 7-17, the most applicable study to PREPA isNew Zealand, which has a system-wide VOLL of $41,269/MWh (Residential: $11,341/MWh,Commercial: $77,687/MWh, Industrial: $30,874/MWh) in 2012 dollar.
Exhibit 7-17. Proxy Estimates with Potential Applicability to PREPA
Economic andDemographicFactors
Puerto Rico New Zealand5 Ireland5 Victoria,Australia5 Australia5
Population Density(people/mile²)1 385 42 168 64 7.3
AverageTemperatures (°F) 3
Winter: 64Summer: 71
Winter:50-59Summer:68-86
Winter:42Summer:58
Winter:44-59Summer:57-79
Winter:33-91Summer:51-97
GNP per Capita(2011 USD$)2 35,093 38,563 48,423 59,378 60,979
Rural (%)3 1% rural 14% rural 38% rural 6.5% rural 11% rural
Electricity Consumption PatternsTotal AnnualConsumption(MWh)4
16,995,838 40,700,000 26,100,000 56,250,000 225,000,000
Peak Demand(MW)4 3,685 6,330 5,090 9,378 13,781
Market Design
Wholesale Market6 No Yes Yes Yes Yes
Retail Market6 No Yes Yes, but limited Yes YesConnection withother systems6 No No Yes, limited Yes No
OverallApplicability6 High High Moderate Moderate
Sources:1. Trading Economics. Retrieved from https://tradingeconomics.com/puerto-rico/population-
density-people-per-sq-km-wb-data.html2. World Bank (2015, April).
https://data.worldbank.org/indicator/NY.GDP.PCAP.PP.CD?order=wbapi_data_value_2013+wbapi_data_value+wbapi_data_value-last&sort=desc
3. NREL. (2015, March). Energy Transition Initiative. Retrieved fromhttps://www.nrel.gov/docs/fy15osti/62708.pdf
4. PREPA (FY2016-2017)5. London Economics International LLC. (2013, June). Estimating the Value of Lost Load.
Retrieved fromhttp://www.ercot.com/content/gridinfo/resource/2015/mktanalysis/ERCOT_ValueofLostLoad_LiteratureReviewandMacroeconomic.pdf
Adapting New Zealand’s VOLL estimates of each sector and using the expected unservedpower (kWh) per sector specific for Puerto Rico (using Puerto Rico’s reliability index57 andconsumer load consumption), Puerto Rico’s system wide VOLL results in $31,897/MWh in2018 dollar as shown in Exhibit 7-18.
57 See Exhibit 7-18 and Exhibit 7-19 for more detail on reliability index.

Assumptions and Forecasts
Siemens Industry, Inc. – Siemens Power Technologies International 7-37 7-37
Exhibit 7-18. 1st Approach VOLL Results Applicable to PREPA
Sector Number ofCustomers
UnservedEnergy
Cost PerAverage MWh Total Cost
MWh 2018$MWh 2018$Residential 1,335,643 10,345 12,269 126,926,034Small C&I 116,094 3,490 84,045 293,332,602
Medium and LargeC&I 11,707 13,650 33,401 455,926,165
Total 1,463,444 27,471 31,895 876,184,801Sources: Siemens, PREPA
Second Approach to Calculate Puerto Rico’s VOLLPuerto Rico's power grid is unique as it supports a large commercial and industrial load in atropical climate and a hurricane zone, with pharmaceuticals, textiles, petrochemicals, andelectronics being the major industries.
The Interruption Cost Estimate (ICE) calculator is a publicly available web-based tooldeveloped by Lawrence Berkeley National Laboratory (Berkeley Laboratory) designed toestimate economic costs of power interruptions where you can modify the specificparameters/inputs. It is based on more than 20 years of utility-sponsored surveys on thecosts of power interruptions to customers. To ensure its continued effectiveness, the toolcontinues to be augmented by research on the latest methods for collecting and developinginformation on the economic consequences of power interruptions on businesses,residences, and society at large. 58
As the first step, Siemens analyzed the reliability indices including System AverageInterruption Duration Index (SAIDI), System Average Interruption Frequency Index (SAIFI),and Customer Average Interruption Duration Index (CAIDI) provided by PREPA and shownin Exhibit 7-19. These indices include the effect of all outages including generationtransmission and distribution but not the effect of major event days (MED).
SAIDI index is based on the amount of time the average customers experience a sustainedoutage in a given year. From FY2013 to FY2016, the average SAIDI for Puerto Rico wasabout 683 minutes per customer per year.
SAIFI index represents the number of times the average customer experiences a sustainedoutage in a given year. From FY2013 to FY2016, the average SAIFI for Puerto Rico wasabout 4.2 events per customer per year.
CAIDI index represents the average restoration time when customers are impacted by asustained outage. It is determined by dividing SAIDI by SAIFI. From FY2013 to FY2016, theaverage CAIDI for Puerto Rico was 163 minutes per event per customer.
58 Berkeley Lab’s Electricity Markets & Policy Group (EMP Group). (2018). Interruption Cost Estimation (ICE)Calculator. Retrieved from https://icecalculator.com/interruption-cost

Assumptions and Forecasts
7-38 Siemens Industry, Inc. – Siemens Power Technologies International
Exhibit 7-19. Puerto Rico’s Reliability Indexes (SADI, SAIFI, andCAIDI)
Source: PREPA (IEEE Benchmark Report)
As the second step, Siemens introduced other inputs specific for Puerto Rico as presented inExhibit 7-20.
Exhibit 7-20. PREPA’s Parameters to Calculate theInterruption Costs
Parameter Description Units Value
Reliability Index1
SAIDI minute/year-customer 850
SAIFI events/year-customer 4.8
CAIDI minutes/event-customer 178
Annual Usage perCustomer2
Residential MWh/customer 5
Small C&I MWh/customer 19
Medium and Large C&I MWh/customer 721
Number of Customersper Class2
Residential Number 1,335,643
Small C&I Number 116,094
Medium and Large C&I Number 11,707
Industry Composition3
Construction % 5%
Manufacturing % 9%
Other Industries % 86%
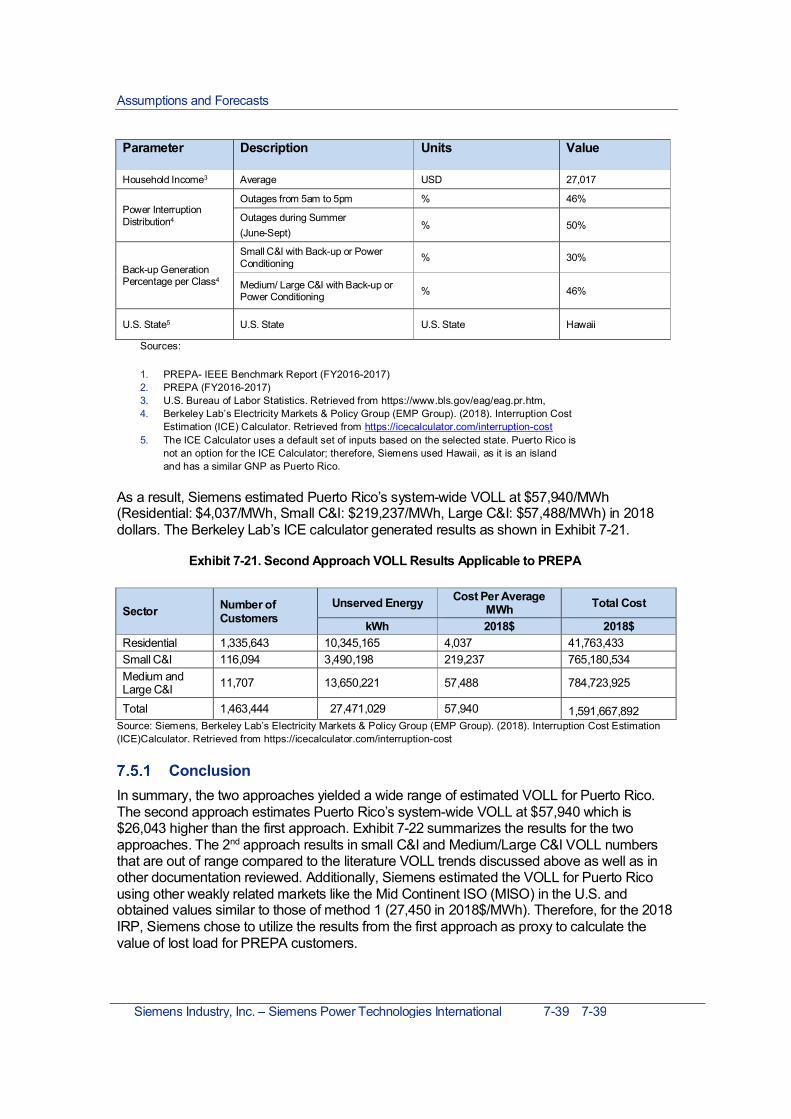
Assumptions and Forecasts
Siemens Industry, Inc. – Siemens Power Technologies International 7-39 7-39
Parameter Description Units Value
Household Income3 Average USD 27,017
Power InterruptionDistribution4
Outages from 5am to 5pm % 46%
Outages during Summer(June-Sept)
% 50%
Back-up GenerationPercentage per Class4
Small C&I with Back-up or PowerConditioning % 30%
Medium/ Large C&I with Back-up orPower Conditioning % 46%
U.S. State5 U.S. State U.S. State Hawaii
Sources:
1. PREPA- IEEE Benchmark Report (FY2016-2017)2. PREPA (FY2016-2017)3. U.S. Bureau of Labor Statistics. Retrieved from https://www.bls.gov/eag/eag.pr.htm,4. Berkeley Lab’s Electricity Markets & Policy Group (EMP Group). (2018). Interruption Cost
Estimation (ICE) Calculator. Retrieved from https://icecalculator.com/interruption-cost5. The ICE Calculator uses a default set of inputs based on the selected state. Puerto Rico is
not an option for the ICE Calculator; therefore, Siemens used Hawaii, as it is an islandand has a similar GNP as Puerto Rico.
As a result, Siemens estimated Puerto Rico’s system-wide VOLL at $57,940/MWh(Residential: $4,037/MWh, Small C&I: $219,237/MWh, Large C&I: $57,488/MWh) in 2018dollars. The Berkeley Lab’s ICE calculator generated results as shown in Exhibit 7-21.
Exhibit 7-21. Second Approach VOLL Results Applicable to PREPA
Sector Number ofCustomers
Unserved Energy Cost Per AverageMWh Total Cost
kWh 2018$ 2018$Residential 1,335,643 10,345,165 4,037 41,763,433Small C&I 116,094 3,490,198 219,237 765,180,534Medium andLarge C&I 11,707 13,650,221 57,488 784,723,925
Total 1,463,444 27,471,029 57,940 1,591,667,892Source: Siemens, Berkeley Lab’s Electricity Markets & Policy Group (EMP Group). (2018). Interruption Cost Estimation(ICE)Calculator. Retrieved from https://icecalculator.com/interruption-cost
ConclusionIn summary, the two approaches yielded a wide range of estimated VOLL for Puerto Rico.The second approach estimates Puerto Rico’s system-wide VOLL at $57,940 which is$26,043 higher than the first approach. Exhibit 7-22 summarizes the results for the twoapproaches. The 2nd approach results in small C&I and Medium/Large C&I VOLL numbersthat are out of range compared to the literature VOLL trends discussed above as well as inother documentation reviewed. Additionally, Siemens estimated the VOLL for Puerto Ricousing other weakly related markets like the Mid Continent ISO (MISO) in the U.S. andobtained values similar to those of method 1 (27,450 in 2018$/MWh). Therefore, for the 2018IRP, Siemens chose to utilize the results from the first approach as proxy to calculate thevalue of lost load for PREPA customers.
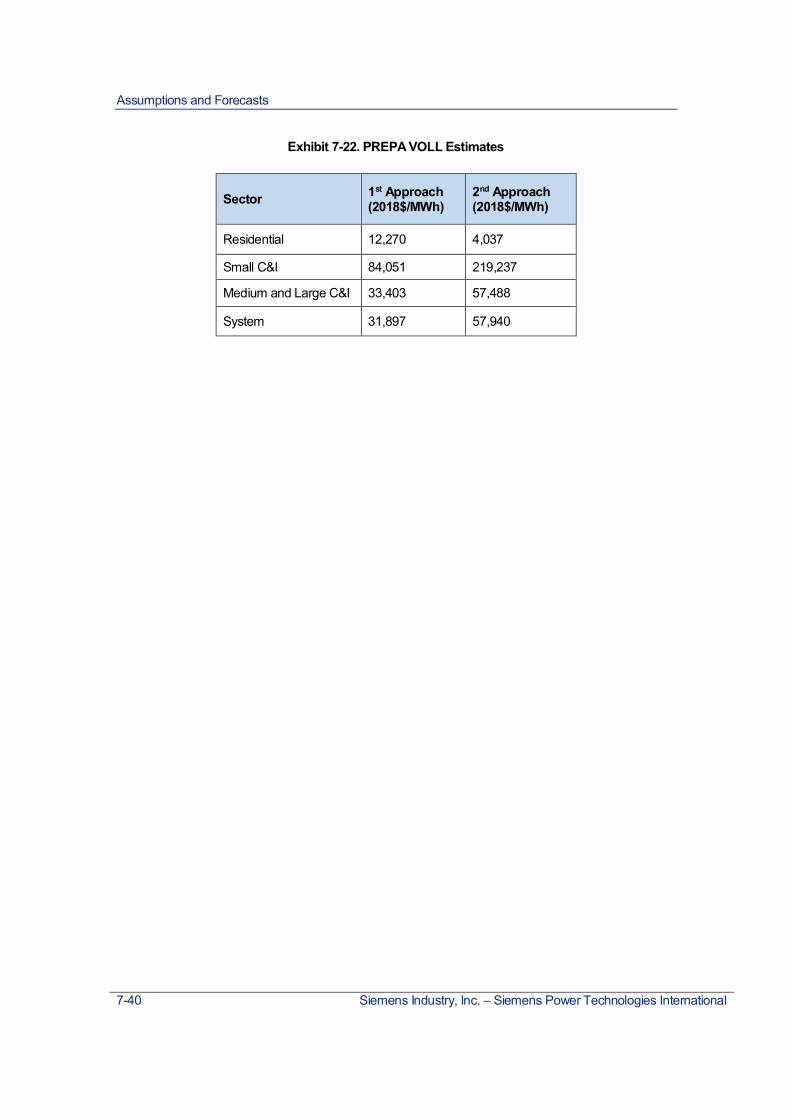
Assumptions and Forecasts
7-40 Siemens Industry, Inc. – Siemens Power Technologies International
Exhibit 7-22. PREPA VOLL Estimates
Sector 1st Approach(2018$/MWh)
2nd Approach(2018$/MWh)
Residential 12,270 4,037
Small C&I 84,051 219,237
Medium and Large C&I 33,403 57,488
System 31,897 57,940

Siemens Industry, Inc. – Siemens Power Technologies International 8-1
Part
8Resource Plan DevelopmentThis section presents the Scenarios, Strategies and Sensitivities described in Part 5, theresult of the assessment of the resulting generation plans, and metrics and conclusionsassociated with the plans.
Overview of Scenario ResultsSiemens investigated over 78 LTCE plans as potential resource plans for PREPA. Theseplans included numerous plausible generation portfolio options including those suggested bystakeholders. These different plans considered points that were critical for the final IRPincluding, among other issues:
µ Uncertainty associated with the future customer demandµ Future prices of generations technologies, e.g., wind, solar, battery storageµ Future prices of fuels, particularly natural gas and the potential availability of
infrastructure to deliver additional gas to the islandµ Prudent methods to increase resilience and reliabilityµ Practical limits to PREPA’s ability to interconnect new battery energy storage and
renewables generationµ Timing of new generation resource additions and the timing of retirements of existing
aged fossil fueled resources.
This initial screening of the over 78 LTCE plans resulted in the identification of a final set of 34LTCE plans59 that were assessed to identify the recommended resource plan and thecommon no regret / minimum regret elements across the plans with perceived merit.
Note that Scenario 2 is not included in the final 34 LTCE considered as it was dropped fromfurther analysis based on the results of the initial screen and in accordance with PREB’sOrders.
Exhibit 8-1 below provides the main results of the 34 LTCE plans with their Scenario,Strategy. For the determination of the NPV, we used a discount rate applicable to PREPA asa public utility; for this we selected we 9% (6.86% on a real dollar basis) as this was the samediscount rate used in the first IRP and it is based on the assumption that PREPA (or its
59 32 LTCE’s plans made it to the final analysis group and to this 2 more plans were added after assessing theresults; a plan based on post-processing of S4S2 to reduce the number of peaking generation technologies and aplan for the ESM to reach 50% renewable penetration by 2040.

Resource Plan Development
8-2 Siemens Industry, Inc. – Siemens Power Technologies International
successors) is able to resolve its current financial issues and can finance its capitalexpenditures at this rate.
The discount rate used in the NPV calculations above should not be confused with theweighted average cost of capital (WACC) for private parties which is used to determine thefixed costs PREPA would be charged for projects financed by private parties.
Other parameters presented include the average cost of generation (all in) for the period2019 to 2028 in $/MWh, the level of RPS compliance achieved by 2038, the present value ofthe value of the energy that would be lost in case that the system had to revert to MiniGridisolated operations for 1 month every 5 years (see further details in this section), the lowestreserve margin observed , a ratio of photovoltaic generation added to the system to the peakload as an indication of technology risk (i.e. potential challenges to manage generationwhose output can be much higher than the peak load), reduction in emissions and capitalcosts.
To help visualize the results in Exhibit 8-1 we provide below a color scorecard for the differentplans /scenarios under similar external conditions (load growth and cost of renewable) andwe compare graphically the NPV.

Resource Plan Development
Siemens Industry, Inc. – Siemens Power Technologies International 8-3
Exhibit 8-1: Summary of Plans Results
Count Case ID
Scen
ario
Stra
tegy
Sens
itivity
Load NPV @ 9% 2019-
2038 $000
Average2019-2028
2018$/MWhRPS 2038
NPV DeemedEnergy Not
Served MiniGridOps $000 (1)
LowestReserveMargin
PV / MaxDemand
EmissionsReductions
CapitalInvestment
Costs ($Millions)
1 S1S2B 1 2 Base 16,216,702 101.1 81% 235,982 44% (2025) 175% 86% 6,5792 S1S2H 1 2 High 17,903,791 101.7 89% 199,201 49% (2028) 178% 81% 7,6943 S1S2L 1 2 Low 14,748,153 99.7 71% 185,656 49%(2025) 170% 87% 5,7904 S1S3B 1 3 Base 16,076,200 100.4 76% 250,482 41%(2024) 175% 84% 6,6455 S1S3H 1 3 High 17,835,218 101.3 93% 410,097 30% (2032) 175% 83% 7,2876 S1S3L 1 3 Low 14,680,008 99.1 71% 265,850 39% (2028) 167% 87% 5,6687 S1S2S1B 1 2 1 Base 15,434,453 97.1 84% 273,910 41%(2025) 180% 87% 6,7188 S1S2S2B 1 2 2 Base 17,315,412 100.1 84% 338,854 51%(2033) 189% 81% 7,1159 S1S2S3B 1 2 3 Base 15,858,601 100.3 59% 126,327 45%(2028) 124% 91% 5,27510 S1S1B 1 1 Base 15,395,763 100.5 81% 594,235 50%(2025) 175% 86% 6,30811 S3S2B 3 2 Base 14,714,793 93 87% 80,098 41% (2024) 189% 53% 7,24712 S3S2H 3 2 High 16,141,041 94 99% 95,517 29%(2028) 188% 84% 7,93113 S3S2L 3 2 Low 13,596,756 92.8 76% 54,035 32%(2025) 180% 88% 6,28114 S3S3B 3 3 Base 14,749,058 93.3 87% 164,509 32%(2024) 186% 87% 7,05915 S3S3H 3 3 High 16,181,429 93.9 96% 136,258 33%(2025) 188% 84% 8,06516 S3S3L 3 3 Low 13,566,244 91.8 96% 173,547 33% (2025) 177% 88% 6,13717 S4S2B 4 2 Base 15,195,166 96.3 49% 228,285 42% (2028) 104% 76% 6,13118 S4S2B-M 4 2 Base 15,143,289 96.0 49% 226,360 42% (2028) 104% 76% 6,13219 S4S2H 4 2 High 17,046,702 99.0 57% 169,249 38% (2034) 106% 72% 7,53620 S4S2L 4 2 Low 14,094,994 96.6 48% 247,228 44% (2030) 108% 80% 5,46821 S4S3B 4 3 Base 15,290,245 96.4 54% 343,059 30% (2030) 110% 77% 6,61022 S4S3H 4 3 High 16,646,410 96.7 59% 452,412 32% (2028) 106% 72% 7,45423 S4S3L 4 3 Low 14,013,227 95.8 45% 332,614 42% (2029) 99% 78% 5,65624 S4S2S3B 4 2 3 Base 14,919,759 95.1 47% 262,528 37% (2026) 101% 54% 5,52325 S4S2S4B 4 2 4 Base 15,288,253 96.4 53% 482,855 35% (2037) 110% 77% 6,50926 S4S2S5B 4 2 5 Base 16,266,967 101.8 52% 195,783 47% (2037) 110% 75% 6,26427 S4S2S6B 4 2 6 Base 16,203,306 101.7 22% 166,167 42% (2028) 37% 72% 5,82128 S4S1B 4 1 Base 15,352,066 97.3 51% 476,701 29% (2034) 110% 74% 6,71729 S5S1B 5 1 Base 14,769,222 92.7 49% 1,142,452 30% (2026) 101% 77% 5,46830 S5S1S5B 5 1 5 Base 15,417,661 95.7 54% 1,027,570 32% (2030) 110% 76% 5,98731 ESM Plan 4 2 Base 15,186,419 95.4 24% 319,291 45% (2028) 42% 66% 4,09832 ESM high 4 2 High 16,589,582 95.8 40% 484,235 40% (2034) 69% 69% 4,95433 ESM low 4 2 Low 14,111,364 95.7 20% 330,499 49% (2029) 37% 71% 3,35534 ESM 50% RPS 4 2 Low 15,216,945 95.7 44% 306,724 47% (2028) 102% 75% 5,131

Resource Plan Development
Siemens Industry, Inc. – Siemens Power Technologies International 8-4
As can be observed in the exhibit below where the key metrics were normalized so thatgreen is the best outcome and red is the worse; Scenario 1 (no new gas) has the worstperformance in terms of costs and technology risk, but is the best on environmental and RPS.Scenario 4 and 5 with Strategy 1 and 3 have good to acceptable performance across mostvariables, but as expected Strategy 1 underperform with respect of the deemed cost ofenergy not served and S4S3 is acceptable (yellow) across all variables except in capital thatunderperforms. This analysis brings us to Scenario 4 Strategy 2 (Modified as described laterin this report S4S2-M) and the ESM Base and ESM with the option to extend to 50% RPS.As can be observed, the ESM with 50% RPS has them best outcomes followed by S4S2Band the base ESM.
Exhibit 8-2: Scorecard for Scenario 1, ESM, Scenario 4 and Scenario 5 for the ReferenceScenario (Base Load Growth, Renewable prices and fuel)
For the case of high load growth, we observe below that Scenario 4 Strategy 3 has the bestoutcomes followed by the ESM and Scenario 2 Strategy 2 . This results indicates that it is agood hedge to maintain the option of the CCGT at Mayagüez that this LTCE proposes inaddition to the CCGTs in Palo Seco and Yabucoa.
S1S
2B
S1S
3B
S1S
1B
ES
MP
lan
ES
M50
%R
PS
S4S
2B-M
S4S
1B
S4S
3B
S5S
1B
NPV @ 9% 2019-2038 $0009 .1 9 .2 9 .6 9 .7 9 .7 9 .8 9 .6 9 .7 1 0 .0
Average 2019-2028 2018$/MWh9 .2 9 .2 9 .2 9 .7 9 .7 9 .7 9 .5 9 .6 1 0 .0
Capital Investment Costs ($ Millions)6 .2 6 .2 6 .5 1 0 .0 8 .0 6 .7 6 .1 6 .2 7 .5
NPV Deemed Energy Not Served9 .6 9 .0 3 .8 7 .1 7 .4 1 0 .0 4 .7 6 .6 2 .0
RPS 20381 0 .0 9 .4 1 0 .0 3 .0 5 .4 6 .0 6 .3 6 .6 6 .0
Emissions Reductions1 0 .0 9 .8 1 0 .0 7 .7 8 .7 8 .8 8 .6 9 .0 9 .0
Technology risk (PV / Max Demand) 2 .4 2 .4 2 .4 1 0 .0 4 .1 4 .1 3 .8 3 .8 4 .2

Resource Plan Development
Siemens Industry, Inc. – Siemens Power Technologies International 8-5
Exhibit 8-3: Scorecard for Scenario 1, ESM, and Scenario 4 and Scenario 5 for theHigh Load Growth Case.
For low load both the ESM and S4S3 have the best results with the exception of the RPS inthe ESM, but as indicated earlier, the renewable additions for the ESM case can be easilymodified.
Exhibit 8-4: Scorecard for Scenario 1, ESM, and Scenario 4 and Scenario 5 for theLow Load Growth Case.
Scenario 3 is not compared in this way as it has lower cost of renewable and would renderthe comparison invalid, however we address Scenario 3 in the next comparison.
Finally, Exhibit 8-5 below provides a summary of the NPV results of the ten primary Scenarioand strategy combinations for the Base, High and Low load forecasts.
S1S
2H
S1S
3H
S4S
2H
ES
Mhi
gh
S4S
3H
NPV @ 9% 2019-2038 $000 9 .3 9 .3 1 0 .0 9 .7 1 0 .0
Average 2019-2028 2018$/MWh 9 .4 9 .4 1 0 .0 9 .7 9 .9
Capital Investment Costs ($ Millions) 6 .4 6 .8 1 0 .0 6 .6 6 .6
NPV Deemed Energy Not Served 8 .5 4 .1 3 .5 1 0 .0 3 .7
RPS 2038 9 .5 1 0 .0 4 .3 6 .1 6 .3
Emissions Reductions 9 .7 1 0 .0 8 .3 8 .6 8 .6
Technology risk (PV / Max Demand)4 3 .9 3 .9 1 0 .0 6 .5 6 .5
S1S
2L
S1S
3L
ES
Mlo
w
S4S
2L
S4S
3L
NPV @ 9% 2019-2038 $000 9 .5 9 .5 9 .9 9 .9 1 0 .0
Average 2019-2028 2018$/MWh 9 .6 9 .6 1 0 .0 9 .9 1 0 .0
Capital Investment Costs ($ Millions) 5 .8 5 .9 1 0 .0 6 .1 5 .9
NPV Deemed Energy Not Served 1 0 .0 7 .0 5 .6 7 .5 5 .6
RPS 2038 1 0 .0 1 0 .0 2 .8 6 .8 6 .3
Emissions Reductions 1 0 .0 1 0 .0 8 .1 9 .2 9 .0
Technology risk (PV / Max Demand)4 2 .2 2 .2 1 0 .0 3 .4 3 .8

Resource Plan Development
8-6 Siemens Industry, Inc. – Siemens Power Technologies International
Exhibit 8-5: Summary Scenarios
As can be seen in prior table and chart, Scenario 3 Strategy 2 (S3S2) and Scenario 3Strategy 3 (S3S3) provide the lowest ($14.71B) and second lowest ($14.75B) NPV for thebase load forecasts. These two plans assume a deeper reduction in the cost of renewableand storage (using the NREL Low for PV). However, these plans may have practicalimplementation issues given that the amounts of PV output over the long term is almostdouble the forecasted peak load. During periods of light load the PV output would be an evenhigher multiple of forecasted load. This large renewable capacity would strain the remainingresources on the system including the storage and could lead to unexpected curtailment. Forthis reason, we see this case as a guide to potential enhancements that can be considered ifboth the cost of PV declines faster than the base case and greater amounts of renewable canbe safely operated. However, Scenario 3 is not considered the preferred portfolio due to itsassumed deep reduction in renewable prices.
Scenario 5 Strategy 1 (S5S1) provides the second lowest NPV results ($14.77B) for the baseload forecast. This LTCE plan is based on a centralized strategy and was determined not tothe preferred resource plan, due to the high levels of load shedding that would be requiredduring a major storm that segments the island in the MiniGrids proposed, as was also shownbefore
The fourth and fifth lowest NPV were for the ESM plan ($15.19B) and Scenario 4 Strategy 2(S4S2) ($15.20B). These plans were determined to be practical and low cost plans thatcontain the recommended path forward. In fact, these plans also contain a common set of noregret / minimum regret elements in the near term plan that were shared by some of the otherLTCE plans with favorable results depending on the future conditions.
11,000
12,000
13,000
14,000
15,000
16,000
17,000
18,000
S1S1 S1S2 S1S3 S3S2 S3S3 S4S1 S4S2 S4S2-M S4S3 ESM S5S1
Net
Pres
entV
alue
($M
of20
18$)
Base Load Forecast High Load Forecast Low Load Forecast

Resource Plan Development
Siemens Industry, Inc. – Siemens Power Technologies International 8-7
The remainder of the LTCE plan (i.e., S1S1, S1S2, S1S3, S4S1, S4S3) had higher NPVcosts for the Base load forecast and no other differentiators that would have positioned themas more desirable than ESM and S4S2.
We discuss each of the Scenarios below.
Scenario 4 ResultsThe generation portfolio identified as Scenario 4 Strategy 2 (S4S2) result in a plan that meetsthe criteria of least cost, resilience and viability in terms of installation of solar and batterystorage, as well as added resilience and flexibility provided by local thermal generation withinthe MiniGrids. The Strategy 2 used for the formulation of the portfolio focused on distributedresources, which translate into a requirement that at least 80% of the peak demand needs tobe supplied locally. This strategy provides a distributed system of flexible generation andMiniGrids that is more resilient and locates supply resources closer to the customer. Theportfolio generation mix was also confirmed to be able to supply the forecasted levels ofcritical load.
The Scenario 4 considers the option of development of LNG terminals at Yabucoa (eastcoast) and Mayagüez (west coast) through ship-based LNG. The Scenario also includes gasin the north delivered through land-based LNG at San Juan. The Scenario uses the solar andstorage costs and availability based on reference case assumptions.
The following additional assumptions were also included in the simulation of this Scenario:
µ Load forecast is assessed at Base, High and Low casesµ The AES PPOA is assumed to expire in 2027 and EcoEléctrica is assumed to renew
in 2022 with a 55% reduction of the fixed payments (new 2022 payment $108 milliondown from 240 million the prior year) and the increased ability to cycle as required tosupport the integration of renewables.
µ San Juan Units 5 & 6 are converted to gas in June 2019. The cost of the conversionis assumed to be structured as a capacity payment of $5 million on an annual basisper unit ending on 06/30/2024.
µ San Juan units are subjected to fuel constraints of delivery to San Juan (ship-basedfuel constraints for July 2019-June 2025, and land-based LNG constraints from July2024 through the end of the forecast period.
µ Energy Efficiency programs are assumed to meet the requirement of Regulation No.9021, i.e., 2% per year of incremental savings attributable to new energy efficiencyprograms for 10 years.
µ The Scenario assumes solar and storage costs and availability based on referencecase assumptions. New PV installations are limited to 300 MW annually in 2020 and2021 and 600 MW annually thereafter. Storage installations are limited to 180 MWannually in 2019, 300 MW annually in 2020 and 2021, and 600 MW annuallythereafter.
µ Minimum RPS targets; 12% by 2022, 15% by 2027 and 20% by 2035. The planachieved much higher levels.
As indicated in Part 5, the Scenario 4 was evaluated considering three load growth levels(low, base and high) and two strategies (2 and 3). Strategy 1 with the base load growth was

Resource Plan Development
8-8 Siemens Industry, Inc. – Siemens Power Technologies International
also considered as well as two sensitivities; no land based LNG terminal in San Juan(sensitivity 4) and high cost of gas (sensitivity 5). Exhibit 8-6 has a summary of the generationexpansion under all cases considered for Scenario 4 that will be discussed in further detail inthe next sections. As can be observed there is significant agreement on results, which can beused to identify the preferred robust decisions; i.e. those that would minimize the regretshould future conditions be different than those anticipated in the assumptions (e.g. higherprices than expected, lower load, etc.).
Exhibit 8-6. Scenario 4 Summary of results
Capacity Additions and RetirementsThe economic simulation of Scenario 4 under strategy 2 results in 2,220 MW of utility scalePV additions over the study period with the first 300 MW added in 2020. A total of 1,200 MWis added in the first four years of the plan, by 2022, which is consistent across the high andlow load cases and it is also seen across the sensitivities that drive higher levels ofrenewable; high gas prices or lower costs of renewables (see Exhibit 8-6). Furthermore, evenin Sensitivity 6 with high capital costs for renewables, the amount of solar built is consistentwith 300 MW per year in 2020 and 2021.
The analysis of S4S2 and its sensitivities indicates that the recommendation to build at least1,200 MW of solar in the short to medium-term in Puerto Rico, is robust (minimum regret)provided that the capital cost for solar photovoltaic are as projected (see Part 6 of this report)and that PREPA is able to contract for and interconnect this aggressive level of new PVadditions. If the capital costs of solar photovoltaic projects result to be higher than forecasted,then smaller amounts of photovoltaic may be advisable (780 MW by 2022, as shown inExhibit 8-6 S4S2S6B – Sensitivity 6).
In Scenario 4, 1,080 MW of battery energy storage is built over the study period, primarily in2019-2022, when 900 MW is built. In the high and low load cases, 800 to 1,100 MW ofstorage is built, respectively, in the same period (see Exhibit 8-6). A robust decision is to builda minimum of 800 MW of storage by 2022, with the expected storage capital prices.However, since the benefits of the battery energy storage are largely drawn from its supportof renewables, should installations of renewables be less than expected, it may be desirableto slow the addition of the energy storage so that it better aligns with the rate of renewableadditions. With high storage prices, the recommended storage addition is reduced to 620 MWby 2022.
Case ID
F - ClassPaloSeco2025
F - ClassCosta
Sur 2025
F-ClassMayaguez 2028
F-ClassYabucoa
2025
SmallCCGT
(LPG/NG)North
F - ClassSan Juan
2029
MediumCCGT
Yabucoa2024
Peakers(small CC)2019-2022
NewSolar2019 -2022
BESS2019 -2022
NewSolar2023 -2028
BESS2023 -2028
NewSolarTotal
BESSTotal
S4S2B ✔ ✔ ✔ X X X X 372 1200 900 1020 40 2220 1080S4S2B-M ✔ ✔ ✔ X X X X 387 1200 900 1020 40 2220 1080S4S2H ✔ ✔ ✔ X X ✔ ✔ 479 1200 800 1380 0 2580 960S4S2L ✔ ✔ X X X X X 280 1200 1100 900 60 2100 1160S4S3B ✔ ✔ ✔ X X X X 388 1200 900 1140 160 2340 1540S4S3H ✔ ✔ ✔ ✔ X X X 440 1200 1000 1380 0 2580 1420S4S3L ✔ ✔ X ✔ (2028) X X X 280 1200 1080 720 0 1920 1080S4S2S3B ✔ ✔ X X X X X 303 1200 920 960 20 2160 1020S4S2S4B ✔ ✔ 2027 X ✔ X X X 327 1200 1160 1140 0 2340 1220S4S2S5B ✔ ✔ X X X X ✔ 591 1200 580 1140 80 2340 960S4S2S6B ✔ ✔ ✔ (2025) X X ✔ (2028) ✔ 204 720 620 0 0 780 620S4S1B ✔ ✔ ✔ X X X X 324 1200 900 1140 0 2340 1460
Strong no regret with no varation among cases that support decision being madeDecission common to multiple cases / little variation between scenarios that allow the decission to be takenDecission common to few scenarios that allow the decission to be takenDecission common to one scenario, PV / BESS: outlier or close follow up required.
Large & Medium CCGTs and peakers Renewable and storage

Resource Plan Development
Siemens Industry, Inc. – Siemens Power Technologies International 8-9
Exhibit 8-7:S2S2 Portfolio Base Load Forecast CapacityAdditions
Three large F-Class CCGTs are installed (302 MW each for a total of 906 MW) in Scenario 4under the base load forecast, one in Palo Seco (Bayamon) in 2025, one in Costa Sur (PonceWest) in 2025, and one is installed in 2028 in Mayagüez , after AES retirement. In the highload case, the same units are added, in addition to a fourth F-Class CCGT at in San Juan in2029 and a medium CCGT in Caguas (Yabucoa). With respect to this last high load case,and as will be shown below using Strategy 3, a plan was identified where a F-Class CCGT isinstalled at Caguas (Yabucoa) instead of the medium CCGT and the F-Class CCGT at SanJuan. This option results in lower costs and may indicate a preferred strategy if this high loadwere to happen.
In the low load case, the F-Class at Palo Seco and Costa Sur are added but not the F-Classin Mayagüez in 2028 (see Exhibit 8-6).
The F-Class CCGT at Palo Seco was also called for under all Scenarios that considered thata land-based LNG terminal could be developed at San Juan with a pipeline connecting to thePalo Seco plant; that is Scenario 3 and Scenario 5. The F-Class in Palo Seco was also calledfor in Scenario 2 that was dropped from further analysis after the initial runs. Moreover, inmost Scenarios this development should be carried out as soon a as possible (assumed tobe 2025 at the earliest) and only under Scenario 3, that assumes a deeper reduction in thecost of renewable, would the F-Class unit at Palo Seco be delayed to 2027 installation as
Technology / MW 2019 2020 2021 2022 2023 2024 2025 2026 2027 2028
Large CCGT's 0 0 0 0 0 0 604 0 0 302Medium CCGT's 0 0 0 0 0 0 0 0 0 0Small CCGT's 0 0 0 0 0 0 0 0 0 0Peaking Units 0 0 372 0 0 0 0 0 0 0BESS 180 300 300 120 0 40 0 0 0 0Total Distchable Additions 180 300 672 120 0 40 604 0 0 302Solar 0 300 300 600 600 240 180 0 0 0Total Additions 180 600 972 720 600 280 784 0 0 302

Resource Plan Development
8-10 Siemens Industry, Inc. – Siemens Power Technologies International
shown in Exhibit 8-6. Thus, Siemens considers that adding a F-Class CCGT at Palo Seco isa no regret decision.
Similarly, all Scenarios have a new F-Class CCGT needed at Costa Sur by 2025 withEcoEléctrica supply agreement allowed to expire. The decision to build an F-Class in CostaSur is least cost, with the only caveat that should the renegotiation of the EcoEléctrica supplyagreement yield a new agreement with lower fix payments and higher dispatch flexibility, itcould be possible to avoid the need for the F-Class CCGT at Costa Sur and maintainEcoEléctrica instead. Thus, a minimum regret decision is to advance both processes inparallel; the CCGT at Costa Sur and the negotiation with EcoEléctrica.
As will be presented below (Section 8.2.10), the base case for Strategy 3 has the samedecisions for the combined cycle generation and very similar decision for the renewables for(see Exhibit 8-6). Under the high load forecast Strategy 3 calls for an F-Class CCGT atCaguas (Yabucoa) and this results in lower cost than the corresponding case under Strategy2 (2% lower). For the low load, Strategy 3 also calls for the F-Class CCGT at Yabucoa but by2028 (rather and 2025 for Strategy 2) and reduces the amount of PV and storage ascompared with Strategy 2 (costs are about 1% lower).
Based on the results described above, the decision to build a large combined cycle atMayagüez and/or Yabucoa should be part of the least cost path and hence it isrecommended to start the preliminary engineering and environmental assessment for bothgenerating units and gas terminals.
In addition, Scenario 4 calls for 436 MW of peaking generation is added (133 MW diesel and303 MW gas fuel based - containerized) by 2038. Most of this generation is required to covercritical load and provide MiniGrid resiliency (Carolina, Caguas, Ponce East (Jobos), Cayeyand Mayagüez North).
As discussed previously, San Juan 5 & 6 converted to gas in 2019. San Juan 6 is then retiredby 2035 due to economics.
Capital ExpendituresWhile expressed as capital expenditures, we assumed that all new generation would beacquired though an RFP process for PPOAs and hence the capital investments will be madeby developers and covered in a fixed charge calculated using the WACC and the economiclife. The figure below shows the levels of capital expenditures required for the S4S2 Portfoliounder the Base Load forecast. These capital costs are all in and include interest duringconstruction but are expressed as a single capital expenditure in the year the plants comeonline (also known as overnight capital costs). We observe that the largest investment isrequired for the generation assets expected to be in service in 2021 ($1.16 billion), for newsolar, peaking generation and storage. Total capital investments reach $ 5.6 billion (US$2018) by 2038.

Resource Plan Development
Siemens Industry, Inc. – Siemens Power Technologies International 8-11
Exhibit 8-8: S4S2 Portfolio Base Load ForecastCapital Expenditure
Capacity RetirementsThe installation of the PV and Storage in 2020, together with the long-term reduction indemand allows for the economic retirement of Aguirre ST 1 and 2 (end of 2019), Palo SecoST 3 (end of 2023) and San Juan Steam units 7 & 8 (end of 2023 & 2021, respectively). PaloSeco ST 4 is retired by the end of 2024 due to the entry in 2025 of the new combined cycle atPalo Seco.
Even under high load conditions, the Aguirre units are retired by the end of 2019 (start on2020), but the Palo Seco 3&4 and San Juan 7&8 units stay online until the end 2024, whenthey are retired by the entry of the large combined cycle at Palo Seco. Under low loadconditions, the retirement plan stays mostly the same as under base case load.
EcoEléctrica is economically retired by the end of 2024, in spite of the reduction the fixedpayments, and assuming the unit has more flexibility by allowing it to cycle on a weekly basis.This retirement is triggered by the entry of a new CCGT at Costa Sur (F-Class) and happensirrespective of the load forecast.
Costa Sur 5 & 6 last year in service is 2020 as it could not compete with EcoEléctrica, underthe base load and low load forecast. Under the high load case, one of the units stays onlinelonger until the end of 2021.
CapEx $000 2018 2019 2020 2021 2022 2023 2024 2025 2026 2027 2028BESS 216,103 328,152 307,746 115,022 - 35,519 - - - -CCGT Large gas - - - - - - 585,827 - - -Large CCGT_gas - - - - - - - - - 288,353New Solar - 451,884 428,490 847,619 837,798 331,542 245,788 - - -Peaker_diesel - - 116,769 - - - - - - -Peaker_gas - - 312,088 (0) 0 - (0) 0 - (0)Grand Total 216,103 780,036 1,165,094 962,641 837,798 367,061 831,614 0 0 288,353

Resource Plan Development
8-12 Siemens Industry, Inc. – Siemens Power Technologies International
The Aguirre CC 1 is retired in 2025, but the other is maintained online for reserves.Cambalache units 2 & 3 retire in 2031 and 2023 respectively. The Aero Mayagüez peakersare all retired by the end of 2027 triggered by the entry of the new combined cycle in 2028under this Portfolio and base load forecast and high load forecast. On the low load forecastthe Aero Mayagüez is required (at least 100 MW), for local reserves to the end of theforecast.
AES is retired by 2028, not economically but by model input.
Exhibit 8-9: Scenario 4 Capacity Retirements (last year inservice
Finally, the natural gas converted San Juan 6 is retired by 2035. San Juan 5 remains onlineunder the base load forecast. Under a high load Scenario, both units are retired earlier (in2030 and 2032). In contrast, under a low load, both are maintained for the duration of theplanning period. Based on the above, it can be concluded that these units are expected toremain online once converted, at least through the end of the decade.
Overall, the steam units running on fuel oil have costs above those of the combination of PV+ Storage and their inflexibly would create renewable curtailment, hence al the steam unitsare retired.
Technology / MW 2019 2020 2021 2022 2023 2024 2025 2026 2027 2028
PREPA Steam (HFO) 862 0 95 0 300 0 0 0 0 0PREPA MATS Affected units remaining 206 0 0 0 0PREPA Costa Sur (Gas) 0 782 0 0 0 0 0 0 0 0PREPA Diesel CC & large GTs 0 0 0 0 50 0 257 0 150 0PREPA CC-converted (Gas) 0 0 0 0 0 0 0 0 0 0EcoElectrica 0 0 0 0 0 507 0 0 0 0AES 416 0

Resource Plan Development
Siemens Industry, Inc. – Siemens Power Technologies International 8-13
Future Generation Mix and ReservesAs shown in the exhibit below, the system transitions from one based on coal and oil to asystem dominated by natural gas, renewables and energy storage. By 2038, 68% of theinstalled capacity in the system consists of renewable generation or facilities in place for itsintegration (battery storage), including solar and CHP distributed generation. Total renewablegeneration accounts for 47% of the total by 2038 with gas generation accounting for 48% ofthe total (Exhibit 8-11). Most of the gas generation comes from the three new large CCGTsand San Juan conversions. As such, the development of the LNG terminals is critical to reachthe full potential of the new gas units.
As PREPA’s units and the thermal PPOA’s are phased out, the operating reserves declinefrom 79% in 2019 to a low of 44% by 2028 with the retirement of AES and three GTs atMayagüez , despite the addition of the new CCGT in Mayagüez . Operating reserves riseafterwards driven by the decline in load and the addition of 200 MW in peakers and storage inthe last ten years. The Planning Reserve Margin of 30% appears not to have been bindingconstraint on the LTCE plan formulation in this Scenario with the reserve margin of atminimum 37% through the forecast.
Exhibit 8-10: Scenario 4 Installed Capacity Mix

Resource Plan Development
8-14 Siemens Industry, Inc. – Siemens Power Technologies International
Exhibit 8-11: Scenario 4 Future Generation Production Mix
Fuel DiversityIn line with the change in the energy supply matrix, the system moves away from heavy fueloil and coal to natural gas along with a sharp drop in overall fuel consumption and associatedcosts with the implementation of the plan. Fuel consumption declines with the retirementsEcoEléctrica in 2024, old gas and heavy fuel oil units and the peakers. Overall fuelconsumption continues to fall through 2038 despite the new CCGTs in Palo Seco, Costa Surand Mayagüez coming online in 2025-2028. Total fuel consumption drops 77% by 2038 withnatural gas dominating this remaining fuel consumption.
Exhibit 8-12: Scenario 4 Fuel Consumption Trends

Resource Plan Development
Siemens Industry, Inc. – Siemens Power Technologies International 8-15
Fuel costs decline in line with the fall in fuel consumption to $445 million by 2027 (55% below2019 levels). Fuel costs increase in 2028 with the F-class CCGT built in Mayagüez , despitethe retirement of AES in the same year. Fuel costs stay relative stable after 2028, on averageat $645 million in the last ten years of the study period.
Exhibit 8-13: Scenario 4 Fuel Costs
RPS and Environmental ComplianceThe Scenario 4 plan is MATS compliant after 2024 and achieves 51% RPS compliance by2038 under the base case load forecast (57% under high load and 47% under low loadgrowth).
The renewable portfolio standard targets of 12% by 2022, 15% by 2027 and 20% by 2035are all met and exceeded in the Scenario 4 base case, as well as the high and low loadcases and under all strategies. The plan achieved 51% renewable penetration by 2038,reaching proposed regulatory target than the 50% renewable generation by 2040 two yearsearlier than the target. Under the high load Scenario, 57% of all generation comes fromrenewables with 2,580 MW of solar installations, while in the low load Scenario 48% of allgeneration comes from renewables with 2,100 MW of solar installations. The base load caseincludes 2,220 MW of solar installations.

Resource Plan Development
8-16 Siemens Industry, Inc. – Siemens Power Technologies International
Exhibit 8-14: Renewable Portfolio Standards
CO2 emissions for PREPA’s fleet fall in the first ten years of the forecast driven by theretirement of the older fuel oil, diesel and gas units along with increased penetration of solargeneration. Emissions fall 50% by 2027 and further 20% more in 2028 with AES coalretirement. Emissions continue falling in after 2028 reaching a 76% reduction by 2038. Theemission rate for the fleet falls from 1,343 lbs./MWh in 2019 to 495 lbs./MWh in 2038. Asexpected the most efficient units, the CCGTs have the lowest emission rates at 820lbs./MWh. San Juan units converted to natural gas also show lower emissions rates ataround 850 lbs./MWh as well as EcoEléctrica prior to retirement. The unit with the highestCO2 emission rates is AES coal at 2,155 lbs./MWh.
Exhibit 8-15: CO2 Emissions PREPA System

Resource Plan Development
Siemens Industry, Inc. – Siemens Power Technologies International 8-17
Exhibit 8-16: CO2 Emissions by Unit Type
System CostsThe total cost of supply in real dollars including annualized capital costs, fuel costs, fixed andvariable O&M is projected to decline with the implementation of the plan from $102/MWh in2019 to $90.5/MWh by 2027 (real $2018), prior to AES Coal retirement, primarily due to theaddition of solar and storage and the retirement of older generation. The costs increased in2028, with AES retirement and the addition of the new CCGT, and then later decline due tofalling fuel costs to reach $93.1/MWh by 2038. Customer rates are expected to declinethrough 2027 under this plan.
The net present value of all operating costs reaches $10.4 billion for 2019-2028 (nominal @9% rate). Over the study period, the NPV is $14.5 billion. Note that the 9% discount rate(6.86% on a real dollar basis), is the same discount rate used in the first IRP and it is basedon the assumption that PREPA (or its successors) is able to resolve its current financialissues and can borrow the capital at this rate. It should not be confused with the WACCwhich the weighted cost of capital for private parties that are assumed to invest in theresource additions.
Exhibit 8-17: Scenario 4 Production Costs
lb/MWh 2019 2020 2021 2022 2023 2024 2025 2026 2027 2028AES 2,154 2,155 2,154 2,154 2,154 2,155 2,155 2,155 2,155 -EcoElectrica 876 876 876 877 879 881 - - - -Costa Sur 5&6 1,248 1,252 - - - - - - - -Existing Fleet (HFO) 1,426 1,721 1,666 1,664 1,690 1,660 - - - -Diesel CC (LFO) 93 - 1,335 1,335 1,335 1,335 1,334 1,335 1,335 1,335Existing GTs (LFO) 1676 1759 0 1562 1611 1641 1488 0 0 0SJ 5&6 With NG 857 852 851 850 849 850 849 851 850 851New CCGT's 0 0 0 0 0 0 823 822 821 822New Peaker gas 0 0 1200 1197 1206 1203 1202 1196 1194 1203New Peaker diesel 0 0 2043 1894 1895 1799 1806 0 2043 1761Total System 1,343 1,298 1,261 1,158 1,084 999 918 919 884 538

Resource Plan Development
8-18 Siemens Industry, Inc. – Siemens Power Technologies International
Exhibit 8-18: System Costs High and Low Load Cases
Scenario NPV @ 9%2019-2038$Millions
Average 2019-20282018$/MWh
NPV DeemedEnergy Not Served
MiniGrid Ops$Millions
NPV + ENS $Millions
Scenario 4 Base Load 15,195 96.3 228 15,423
Scenario 2 High load 16,995 99.0 169 17,164
Scenario 2 Low load 14,142 96.6 247 14,389
* Total system costs include generation, fuel, EE and regasification costs
Under the high load case, the production costs increase by $2.7/MWh on average with anNPV of $17.0 billion, $1.8 billion higher than the base case. This is driven by an additionalCCGT F-Class in San Juan build in 2029 to meet incremental loads in the north and amedium CCGT in Yabucoa in 2024. As discussed earlier, we are of the opinion that in thecase the Strategy 3 expansion plan identified a better strategy.
Under the low load case, the average system costs are slightly higher compared to the basecase but the overall NPV of the portfolio is lower at $14.1 billion. The reduction in costs ismostly driven by not building the Mayagüez F-Class in 2028, under the low load case.
Resiliency (MiniGrid Considerations)A critical component of the formulation of the 2018 Integrated Resource Plan (IRP) is theidentification of electrical islands or “MiniGrid” into which the system may be segregated aftera major atmospheric event (e.g. hurricane). In other words, the MiniGrids are regions of thesystem that are interconnected with the rest of the electric power system via lines that maytake over a month to recover after a major event, and should be able to operate largelyindependently, with minimum disruption for the extended period of time that would take torecover full interconnection. In addition to the MiniGrids, there are also microgrids locatedwithin some of the MiniGrids that will be isolated from the MiniGrid after a major event. Themethodology for the initial definition of the MiniGrids and Microgrids is described on Appendix1.
The Siemens team evaluated the potential cost of energy not served in the case of ahurricane impacting the island and placing the system under a mini-grid operation for onemonth while the transmission network is repaired. This cost is NOT a forecast of future cost,but rather a high-level determination of how the different portfolios resulting from thecombination of Scenarios and strategies would perform if every 5 years starting in 2022 amajor hurricane impacted the island resulting in the operation of the MiniGrids for one month(“Deemed Energy Not Served”). The Deemed Energy Not Served was determined based onthe total forecasted load at each MiniGrid, including critical, priority and balance, and thegeneration that would be available from thermal and renewable resources, complemented bystorage. For the costs of energy not served we took into consideration that during gridisolated operation the load shedding will be on an announced and rotating basis andtargeting loads where the impact would be the least (typically residential loads), with limitedduration. The Siemens team used a value of $ 2,000/MWh for costs of energy not served,about half of the lower expected cost for Puerto Rico (see Exhibit 7-22) and in line with thecosts seen in another jurisdiction (see Exhibit 7-16).

Resource Plan Development
Siemens Industry, Inc. – Siemens Power Technologies International 8-19
As shown in Exhibit 8-20, the net present value of the overall portfolio costs under the basecase would increase by $228 million due to deemed energy not served. Under the high loadcase, the increase in portfolio costs is $186 million, and in the low load case $225 million. Inthe high case, the additional CCGT installations at San Juan and Yabucoa support mini-gridoperation in these regions and reduce the overall potential costs of energy not servedcompared to the base case.
In Scenario 4, the critical and priority loads for the MiniGrid regions of Carolina, Caguas,Cayey, Arecibo, Mayagüez North and San Juan-Bayamon are not met with local generationwhile the plan is being developed in 2019 through 2022, as shown below for the CarolinaMiniGrid. The total thermal maximum energy available including solar PV does not meet thecritical, priority and balance loads through 2024 in Carolina (see Appendix 1 for more detailson load generation balance and design of the MiniGrids).
Exhibit 8-19: Carolina Energy Coverage under a MinigridOperation
Exhibit 8-20 summarizes the present value of the cost of the “Deemed Energy Not Served” by MiniGridregion for Scenario 4 Strategy 2 and base load forecast.

Resource Plan Development
8-20 Siemens Industry, Inc. – Siemens Power Technologies International
Exhibit 8-20: Present Value of Cost of Deemed Energy NotServed by MiniGrids
The largest potential costs are for Caguas and Carolina, followed by Arecibo and Cayey.
Scenario 4. Strategy 2 – Expert ReviewThe Siemens team performed an expert review of the results of Scenario 4 andrecommended changes to the plan which we designated S4S2-Modified (or S4S2-M). Thechanges include replacing the two RICE 16 MW RICE units the plan calls for at Mayagüezwith two 23 MW mobile peakers in Mayagüez North. In addition the single 21 MW LM2500peaker the plan calls for at Carolina should be replaced with an additional 23 MW mobilepeaker at the same location. The mobile peakers provide more flexibility at the mini-grid levelfor the Mayagüez North and Carolina regions. In addition, installing the same technology(mobile) ,rather than the three technologies that were called for in the original results, willprovide benefits in the form of common maintenance practices, common spare partsinventory and the ability to relocate these units if needed in the future. The mobile peakersuse containerized LNG as a fuel option. These are after the fact adjustments to the long-termcapacity expansion plan developed by the Aurora model to make the Scenario 4 more amore practical plan for PREPA to implement and maintain.
In addition, the present value of the production costs resulting from these modifications are$51.8 million lower than the pre-modified plan, with similar potential costs of energy notserved at the minigrid level. The modified plan provides 15 MW more peaking capacity with387 MW built by 2022 and 451 MW by 2038 in total. There is no significant change inemissions reductions, renewable curtailments or reserve margins through the study period.
Exhibit 8-21: System Costs Scenario 4 Modified
Case IDNPV @ 9%2019-2038$Millions
Average SystemProduction Costs
2019-20282018$/MWh
NPV DeemedEnergy Not
Served MiniGridOps $Millions
NPV + ENS $Millions
CO2EmissionsReductions
CapitalInvestment
Costs ($Millions)
S4S2B 15,195 96.3 228 15,423 76% 6,131
S4S2B-Modified 15,143 96.0 226 15,370 76% 6,132
MiniGrid NPV Cost ($000)San Juan-Bayamon 8,874$Ponce -$Carolina 40,737$Caguas 127,850$Arecibo 25,110$Mayaguez-North 518$Mayaguez-South -$Cayey 25,196$Total 228,285$

Resource Plan Development
Siemens Industry, Inc. – Siemens Power Technologies International 8-21
Considerations under Strategy 3Under strategy 3, at least 50% of the peak demand needs to be supplied with localgeneration. Under this strategy, the economic simulation yields a very similar expansion planto Strategy 2. However, this strategy provides less flexibility and resiliency at the mini-gridlevel and for this reason has higher potential costs from energy not served, in case of a majordisruptive hurricane.
Under Strategy 3 and Base load forecast, the expansion plan is very similar with 1,200 MW ofsolar PV build in 2019-2022, maximizing the level of available solar PV capacity additions inthis period. A total of 2,340 MW of solar PV is built during the study, only 120 MW higher thanstrategy 2 (see Exhibit 8-6).
There is 900 MW of battery storage built in 2019-2022 (in line with Strategy 2). In the long-term, there is an incremental 460 MW of battery storage built under this strategy. Two F-classCCGTs at Palo Seco and Costa Sur are built in 2025 along with an additional F-Class CCGTat Mayagüez , the same as Strategy 2. In addition, 388 MW of peakers are built in 2019-2022(likewise Strategy 2) with 471 MW in total over the study period.
Under the high case, an additional F-Class CCGT at Yabucoa is built in 2025, the same forthe low case but in 2028. This is the major difference with respect of Strategy 2. In the lowcase, the F-Class CCGT at Mayagüez is not built.

Resource Plan Development
8-22 Siemens Industry, Inc. – Siemens Power Technologies International
Exhibit 8-22: Capacity Additions Scenario 4, Strategy 3
Retirements follow the same schedule of units retired as strategy 2, with the economicretirement of Aguirre ST 1 and 2 at the end of 2019, Palo Seco ST 3 and ST4 by the end of2023 and 2024, respectively. San Juan units ST 7 & 8 are retired by the end of 2023 & 2021,respectively).
EcoEléctrica is economically retired by the end of 2024. Likewise, this retirement is triggeredby the entry of a new CCGT at Costa Sur (F-Class) and happens irrespective of the loadforecast. Costa Sur 5 & 6 last year in service is 2020 and 2021, respectively.
Capacity by Technology MW 2019 2020 2021 2022 2023 2024 2025 2026 2027 2028
Large CCGT's 0 0 0 0 0 0 604 0 0 302Medium CCGT's 0 0 0 0 0 0 0 0 0 0Small CCGT's 0 0 0 0 0 0 0 0 0 0Peaking Generation 0 0 356 0 0 0 0 0 60 55BESS 180 300 300 120 0 0 0 0 0 40Total Distchable Additions 180 300 656 120 0 0 604 0 60 397Solar 0 300 300 600 540 360 240 0 0 0Total Additions 180 600 956 720 540 360 844 0 60 397
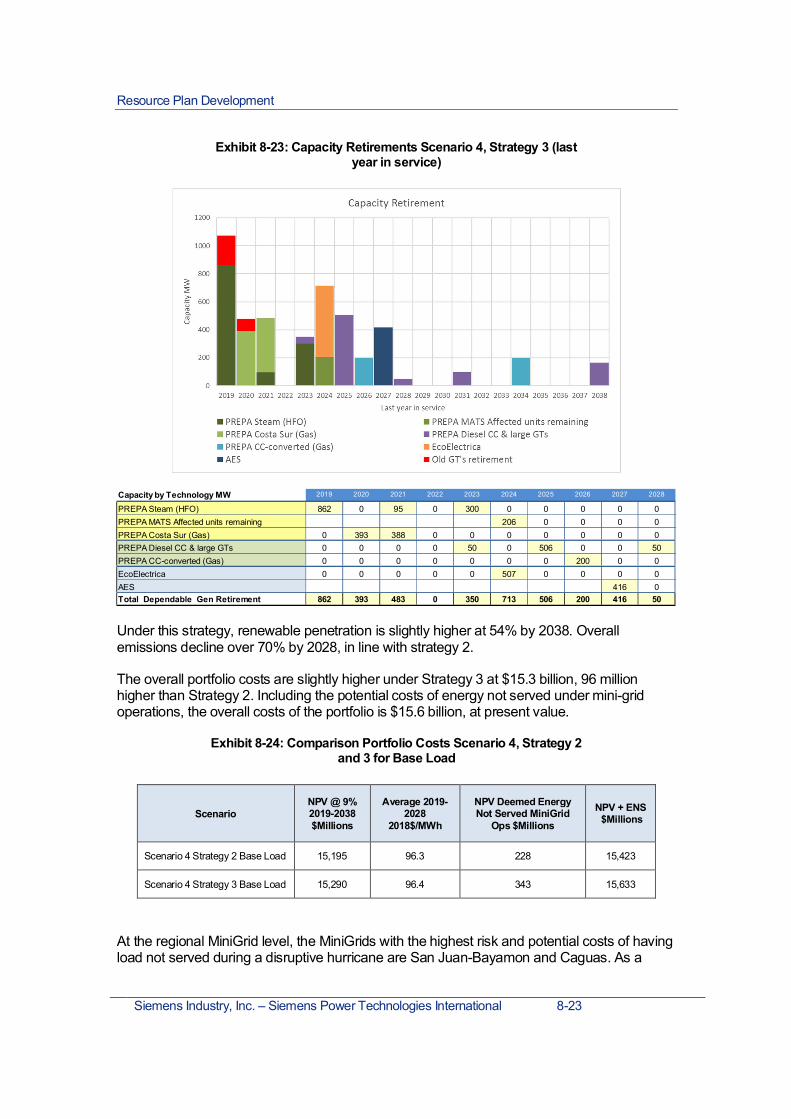
Resource Plan Development
Siemens Industry, Inc. – Siemens Power Technologies International 8-23
Exhibit 8-23: Capacity Retirements Scenario 4, Strategy 3 (lastyear in service)
Under this strategy, renewable penetration is slightly higher at 54% by 2038. Overallemissions decline over 70% by 2028, in line with strategy 2.
The overall portfolio costs are slightly higher under Strategy 3 at $15.3 billion, 96 millionhigher than Strategy 2. Including the potential costs of energy not served under mini-gridoperations, the overall costs of the portfolio is $15.6 billion, at present value.
Exhibit 8-24: Comparison Portfolio Costs Scenario 4, Strategy 2and 3 for Base Load
ScenarioNPV @ 9%2019-2038$Millions
Average 2019-2028
2018$/MWh
NPV Deemed EnergyNot Served MiniGrid
Ops $Millions
NPV + ENS $Millions
Scenario 4 Strategy 2 Base Load 15,195 96.3 228 15,423
Scenario 4 Strategy 3 Base Load 15,290 96.4 343 15,633
At the regional MiniGrid level, the MiniGrids with the highest risk and potential costs of havingload not served during a disruptive hurricane are San Juan-Bayamon and Caguas. As a
Capacity by Technology MW 2019 2020 2021 2022 2023 2024 2025 2026 2027 2028
PREPA Steam (HFO) 862 0 95 0 300 0 0 0 0 0PREPA MATS Affected units remaining 206 0 0 0 0PREPA Costa Sur (Gas) 0 393 388 0 0 0 0 0 0 0PREPA Diesel CC & large GTs 0 0 0 0 50 0 506 0 0 50PREPA CC-converted (Gas) 0 0 0 0 0 0 0 200 0 0EcoElectrica 0 0 0 0 0 507 0 0 0 0AES 416 0Total Dependable Gen Retirement 862 393 483 0 350 713 506 200 416 50
Resource Plan Development
8-24 Siemens Industry, Inc. – Siemens Power Technologies International
result, the present value cost of deemed energy not served is $343 million, $124 millionhigher than Strategy 2. For this reason, Strategy 2 provides a lower cost plan with higherresiliency and reliability at the mini-grid level.
Under the high load case, strategy 3 is a lower cost strategy compared to the high load caseunder strategy 2 without the development of an additional CCGT as San Juan in 2029, asshown under strategy 2. Thus, the overall portfolio cost is $117 million lower, despite agreater potential cost from energy not served in the event a disruptive hurricane.
Considerations under Strategy 1Strategy 1 is a centralized plan with no minimum generation requirements at the MiniGridlevel. The Strategy produces an expansion plan that is slightly more expensive than strategy2, which is Siemens’ recommended plan, even before the cost of lack of resiliency isconsidered. A centralized plan has a greater risk and potential costs for unserved energyafter a disruptive hurricane. The expansion plan is very similar to strategies 2 and 3 with moresolar and battery storage generation (see Exhibit 8-6 S4S1B).
The expansion plan is very similar with 1,200 MW of solar PV build in 2019-2022, maximizingthe level of available solar PV capacity additions in this period. A total of 2,340 MW of solarPV is built during the study period, only 120 MW higher than strategy 2.
There is 900 MW of battery storage build in 2019-2022 (in line with Strategy 2). In the long-term, there is an incremental 340 MW of battery storage build under this strategy. Two F-Class CCGTs at Palo Seco and Costa Sur are built in 2025 along with an additional F-Classat Mayagüez in 2028, in line with Strategy 2. In addition, 324 MW of peakers are built in2019-2022 64 MW lower than Strategy 2 with 500 MW in total over the study period.
Retirements follow the same schedule of units retired as strategy 2, with the economicretirement of Aguirre ST 1 and 2 at the end of 2019, Palo Seco ST 3 and ST4 by the end of2024 and 2021, respectively. San Juan units 7 and 8 units are retired by the end of 2024.
EcoEléctrica is economically retired by the end of 2023, a year earlier compared to Strategy2. Likewise, this retirement is triggered by the entry of a large CCGT at Costa Sur (F-Class) in2025. Costa Sur 5 & 6 last year in service is 2020 and 2022 as it could not compete withEcoEléctrica.

Resource Plan Development
Siemens Industry, Inc. – Siemens Power Technologies International 8-25
Exhibit 8-25: Capacity Additions Scenario 4, Strategy 1
Exhibit 8-26: Capacity Retirements Scenario 4, Strategy 1
The overall portfolio costs are higher under this strategy driven by higher operating costs andpotential costs from Deemed Energy Not Served under a mini grid operation in the event of amajor hurricane. Portfolio costs are $405 million higher, compared to strategy 2 and $195million higher, compared to strategy 3.
The potential for unserved energy arises in most MiniGrid regions, except for San Juan-Bayamon and Ponce. The regions with highest potential costs from unserved energy underMiniGrid operations are Carolina, Caguas and Arecibo.
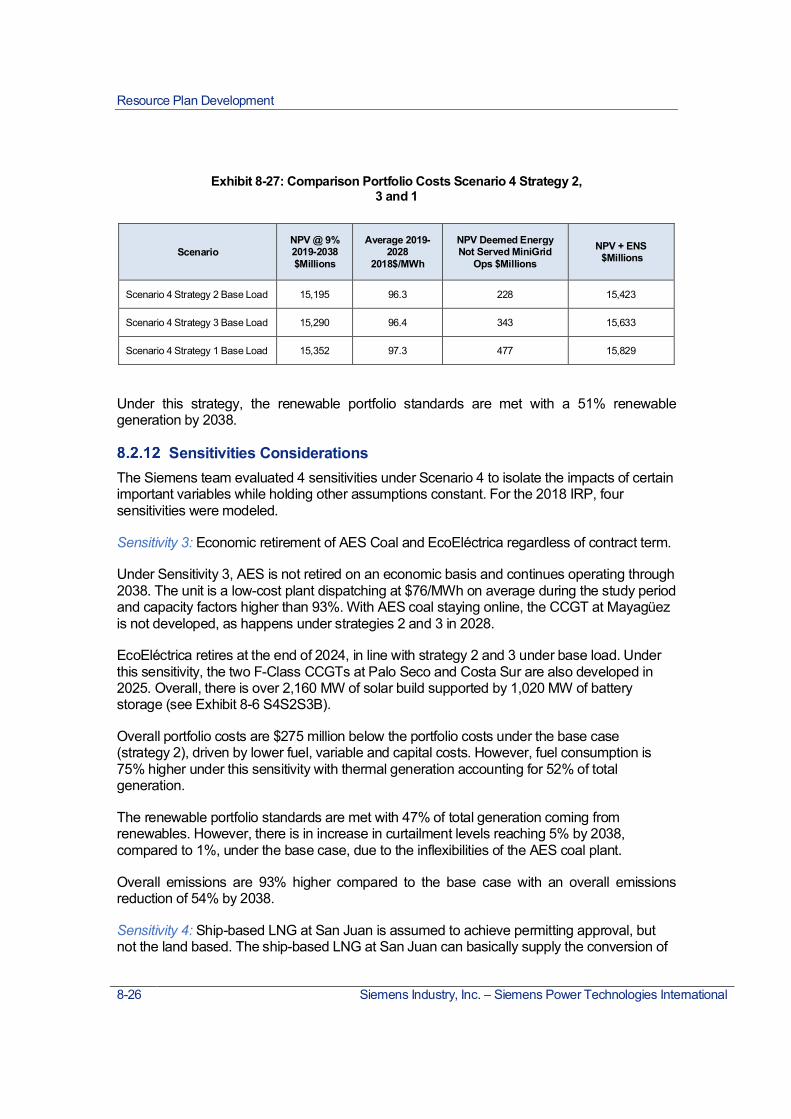
Resource Plan Development
8-26 Siemens Industry, Inc. – Siemens Power Technologies International
Exhibit 8-27: Comparison Portfolio Costs Scenario 4 Strategy 2,3 and 1
ScenarioNPV @ 9%2019-2038$Millions
Average 2019-2028
2018$/MWh
NPV Deemed EnergyNot Served MiniGrid
Ops $Millions
NPV + ENS $Millions
Scenario 4 Strategy 2 Base Load 15,195 96.3 228 15,423
Scenario 4 Strategy 3 Base Load 15,290 96.4 343 15,633
Scenario 4 Strategy 1 Base Load 15,352 97.3 477 15,829
Under this strategy, the renewable portfolio standards are met with a 51% renewablegeneration by 2038.
Sensitivities ConsiderationsThe Siemens team evaluated 4 sensitivities under Scenario 4 to isolate the impacts of certainimportant variables while holding other assumptions constant. For the 2018 IRP, foursensitivities were modeled.
Sensitivity 3: Economic retirement of AES Coal and EcoEléctrica regardless of contract term.
Under Sensitivity 3, AES is not retired on an economic basis and continues operating through2038. The unit is a low-cost plant dispatching at $76/MWh on average during the study periodand capacity factors higher than 93%. With AES coal staying online, the CCGT at Mayagüezis not developed, as happens under strategies 2 and 3 in 2028.
EcoEléctrica retires at the end of 2024, in line with strategy 2 and 3 under base load. Underthis sensitivity, the two F-Class CCGTs at Palo Seco and Costa Sur are also developed in2025. Overall, there is over 2,160 MW of solar build supported by 1,020 MW of batterystorage (see Exhibit 8-6 S4S2S3B).
Overall portfolio costs are $275 million below the portfolio costs under the base case(strategy 2), driven by lower fuel, variable and capital costs. However, fuel consumption is75% higher under this sensitivity with thermal generation accounting for 52% of totalgeneration.
The renewable portfolio standards are met with 47% of total generation coming fromrenewables. However, there is in increase in curtailment levels reaching 5% by 2038,compared to 1%, under the base case, due to the inflexibilities of the AES coal plant.
Overall emissions are 93% higher compared to the base case with an overall emissionsreduction of 54% by 2038.
Sensitivity 4: Ship-based LNG at San Juan is assumed to achieve permitting approval, butnot the land based. The ship-based LNG at San Juan can basically supply the conversion of

Resource Plan Development
Siemens Industry, Inc. – Siemens Power Technologies International 8-27
San Juan 5 and 6 and provide limited gas to other developments. It has reduced capacity incomparison to the land-based LNG option.
Under Sensitivity 4, there is more gas generation added to the system. The Sensitivityinstalls, in addition to the CCGT’s for the base case (S4S2), one additional F-Class CCGTs atYabucoa in 2025 and the CCGT at Costa Sur in 2027. Solar and battery storage installationsare slightly higher with 120 MW and 140 MW more, respectively by 2038 (see Exhibit 8-6S4S2S4B).
With more availability of gas, the Aguirre CC2 stays online through the study period, as wellthe San Juan unit 5 conversion. San Juan 6 retires in 2035 as in the base case.
Overall portfolio costs are about 93.0 million higher under this sensitivity, driven by higherCapEx and fuel costs. This case also has higher potential costs from unserved energy duringa hurricane event.
Sensitivity 5: High gas prices.
As in the base case, both the F-Class at Palo Seco and Costa Sur are found economic to bein place in 2025. Under this sensitivity, the simulation favors the development of 393 MW ofadditional gas-fired peakers (90% more), in addition to a medium CCGT at Yabucoa. Themedium CCGT is developed, instead of a large CCGT at Mayagüez . Solar and batterystorage installations are similar to the base case (see Exhibit 8-6 S4S2S5B).
Under a high gas price Scenario, EcoEléctrica stays online through the study period. Both ofAguirre CCs are retired as well as both of San Juan converted units, the last of which retiresin 2036. AES is scheduled to be retired in 2027 but if it would not under a high gas priceScenario, the economics will be more robust.
Overall portfolio costs are $1 billion higher under a high gas price Scenario at $16.2 billionover the study period (at present value). The increase is driven by higher fuel costs, thecontinuation of EcoEléctrica and capital payments with the development of more peakers.The risk to the portfolio from higher gas prices is significant.
Sensitivity 6: High cost of renewables
Under this sensitivity, there is a significant reduction in solar installations with only 780 MW ofsolar PV installed over the study period, 1,400 MW below the base case. Batteries to supportthe solar developments are reduced as well by 460 MW to 620 MW in total. The RPS targetsare met through 2035 but the plan will fall short of the proposed long-term target of 50% by2040 reaching only 22% renewable penetration by 2038 (compliance with current regulationsis achieved). CO2 emissions in this case are 38% higher compared to the base case by 2038with overall emissions reductions falling by 67% over the study period.
There is more gas capacity installed with 1,200 MW of new large CCGTs installed, includingan F-Class at Mayagüez in 2025 (3 years earlier than the base case) and an F-Class in SanJuan in 2028 (installation only seen in high load cases). In addition, there is a medium CCGTdeveloped in Yabucoa in 2024 (see Exhibit 8-6 S4S6S6B).
Overall portfolio costs are $1 billion higher compared to the base case, mostly driven by $1.1billion more in fuel costs and capital expenditures, partially offset by lower variable and fixed

Resource Plan Development
8-28 Siemens Industry, Inc. – Siemens Power Technologies International
costs. The potential costs from energy not served under MiniGrid operation is lower by $62million, compared to the base case with more gas available locally in some regions.
Exhibit 8-28: Scenario 4, Sensitivity 6 System Costs
Exhibit 8-29: Comparison Portfolio Costs Scenario 4Sensitivities
ScenarioNPV @ 9%2019-2038$Millions
Average 2019-2028
2018$/MWh
NPV Deemed EnergyNot Served MiniGrid
Ops $Millions
NPV + ENS $Millions
Scenario 4 Strategy 2 Base Load 15,195 96.3 228 15,423
Sensitivity 3 14,919 95.1 263 15,182
Sensitivity 4 15,288 96.4 483 15,771
Sensitivity 5 16,267 101.8 196 16,463
Sensitivity 6 16,203 101.7 166 16,369
* System costs includes generation costs, EE programs, fuel and regasification costs
Rate ImpactIn the sections above, we presented the composition of least cost portfolio formulated underScenario 4. In this section we estimate the potential impact of the S4S2B portfolio on the finalrates to customers and compare the resulting final rates with the possible costs that the

Resource Plan Development
Siemens Industry, Inc. – Siemens Power Technologies International 8-29
customers would incur for self-supply as described in Appendix 4 Demand-Side Resourcesand that basically include:
a) Residential Solar Photo-Voltaic (PV), use of net-meteringb) Grid-Defection; PV plus storage at levels that allowing become an autonomous
self-supplier.c) Combined Heat and Power (CHP)d) Diesel Generator
8.2.13.1 Rate ComponentsWe provide below a high-level description of the individual components that make up the finalrates resulting from the S4S2 generation portfolio.
The final customer rate can be broken down into at least three basic components:
a) Generation cost of energy delivered to the customers (generation)b) Non-generation utility component (transmission & distribution)c) Balance non-bypassable component (charges for legacy liabilities)
The generation rate component is directly dependent upon the Capital, Fixed Operating andMaintenance (FO&M), Regasification, Fuel, and Variable Operating and Maintenance(VO&M) costs incurred in building and operating the generation portfolio. This component isportfolio specific and will change as the generation asset mix changes. Also, this rate reflectsthe total generation needed to serve the customer load accounting for the technical and non-technical losses in the transmission and distribution network and PREPA’s internal self-consumption. The Portfolio includes a certain amount of customer self-supply and the totalgeneration is reduced by this self-supply for the purposes of calculating the costs.
The non-generation utility component is PREPA’s Non-Fuel and Power Purchase (non-F&PP) rate less the non-bypassable component included in the non-F&PP rate. Thiscomponent reflects the transmission and distribution costs and is held constant acrossgeneration portfolios and was provided by PREPA’s advisors for this analysis; it has anaverage value of nominal 14.2 cents per kWh for the next 10 years and considers thereduction in load and energy efficiency effects.
Finally, the third basic component is PREPA’s Non-Bypassable Non-F&PP rate that reflectsPREPA’s charges for legacy liabilities such as pension and debt . The amount included isapproximately 3 cents per kWh for debt service and 2 cents per kWh for pension funding in$2018 terms (6.2 cents per kWh nominal average for the next 10 years considering thereduction in load and energy efficiency effects). This component is static and does notchange with the portfolio asset mix.
The final resulting rate for the case is computed as the sum of the three individualcomponents described above and is then compared with the cost of customer-basedalternatives.
8.2.13.2 Results of Comparison to Customer Based AlternativesIn this section we describe the results of the analysis we performed comparing the final S4S2rates to unit costs for customer-based alternatives.
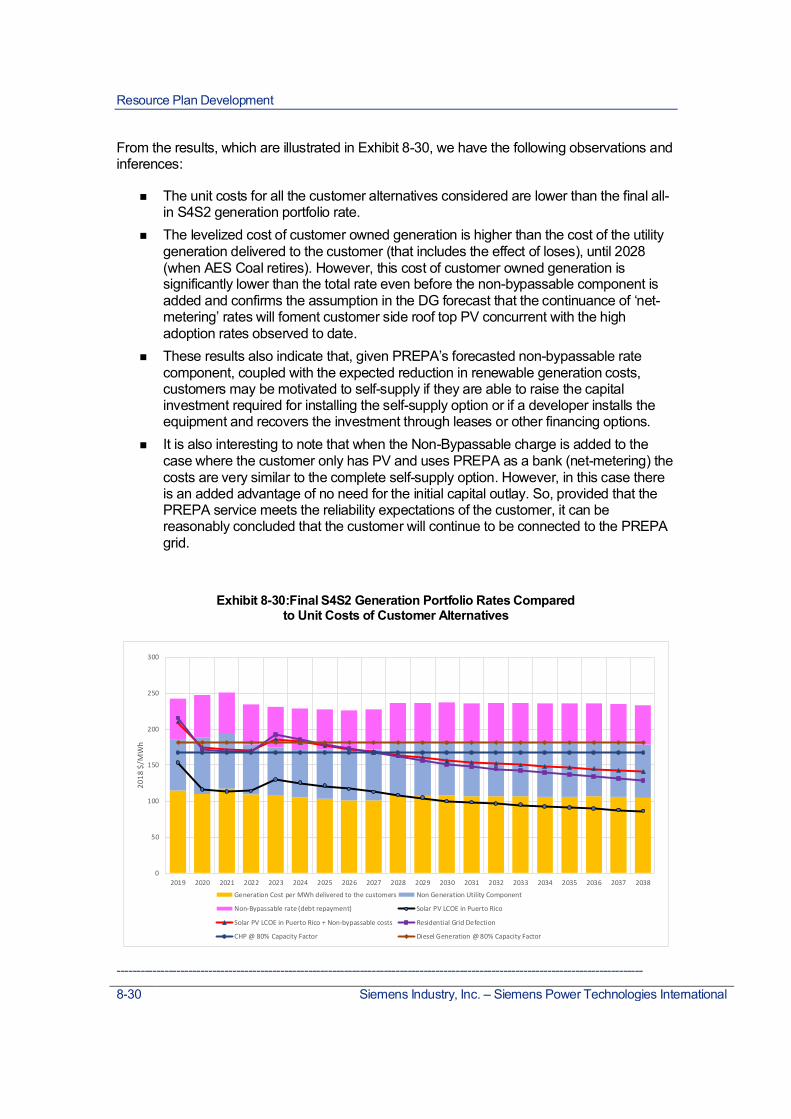
Resource Plan Development
8-30 Siemens Industry, Inc. – Siemens Power Technologies International
From the results, which are illustrated in Exhibit 8-30, we have the following observations andinferences:
µ The unit costs for all the customer alternatives considered are lower than the final all-in S4S2 generation portfolio rate.
µ The levelized cost of customer owned generation is higher than the cost of the utilitygeneration delivered to the customer (that includes the effect of loses), until 2028(when AES Coal retires). However, this cost of customer owned generation issignificantly lower than the total rate even before the non-bypassable component isadded and confirms the assumption in the DG forecast that the continuance of ‘net-metering’ rates will foment customer side roof top PV concurrent with the highadoption rates observed to date.
µ These results also indicate that, given PREPA’s forecasted non-bypassable ratecomponent, coupled with the expected reduction in renewable generation costs,customers may be motivated to self-supply if they are able to raise the capitalinvestment required for installing the self-supply option or if a developer installs theequipment and recovers the investment through leases or other financing options.
µ It is also interesting to note that when the Non-Bypassable charge is added to thecase where the customer only has PV and uses PREPA as a bank (net-metering) thecosts are very similar to the complete self-supply option. However, in this case thereis an added advantage of no need for the initial capital outlay. So, provided that thePREPA service meets the reliability expectations of the customer, it can bereasonably concluded that the customer will continue to be connected to the PREPAgrid.
Exhibit 8-30:Final S4S2 Generation Portfolio Rates Comparedto Unit Costs of Customer Alternatives
------------------------------------------------------------------------------------------------------------------------------------
0
50
100
150
200
250
300
2019 2020 2021 2022 2023 2024 2025 2026 2027 2028 2029 2030 2031 2032 2033 2034 2035 2036 2037 2038
2018
$/M
Wh
Generation Cost per MWh delivered to the customers Non Generation Utility Component
Non-Bypassable rate (debt repayment) Solar PV LCOE in Puerto Rico
Solar PV LCOE in Puerto Rico + Non-bypassable costs Residential Grid Defection
CHP @ 80% Capacity Factor Diesel Generation @ 80% Capacity Factor

Resource Plan Development
Siemens Industry, Inc. – Siemens Power Technologies International 8-31
We analyzed another case where we reduced the non-technical losses to typical valuesobserved in the US (0.5% or less). The resulting final rate for the S4S2 generation portfolio,also reduces, but not to the extent that our observations and inferences discussed abovechange. This updated comparison chart is given in the exhibit below.
Exhibit8-31: Final S4S2 Generation Portfolio Rates AssumingReduced Losses
Nodal Analysis Scenario 4, Strategy 2The Siemens team evaluated the least cost plan under Scenario 4 using a nodal simulation.The objective is to identify the effects of transmission on the key metrics of technical losses,production costs, renewable curtailment and energy not served.
The results of the nodal runs show that in the first 10 years (2019 – 2028) the productioncosts of the nodal runs match very closely with those of the zonal runs used for the LTCEassessment (see Exhibit 8-32). The losses in each of the nodal cases was less than that ofthe zonal runs used, due to the more accurate modeling of the transmission system. Onaverage the reduction in losses is 0.8% as shown in Exhibit 8-33.
The amount of curtailment observed for the new solar generation was higher in the Nodalruns towards the end of the model period as shown in Exhibit 8-32, but this was found to benot related with transmission but rather with differences in the strategies for the dispatch ofthe storage used in the nodal runs.
There was no energy not served in the nodal runs, which is in line with the results of the zonalruns.
0
50
100
150
200
250
300
2019 2020 2021 2022 2023 2024 2025 2026 2027 2028 2029 2030 2031 2032 2033 2034 2035 2036 2037 2038
2018
$/M
Wh
Generation Cost per MWh delivered to the customers Non Generation Utility Component
Non-Bypassable rate (debt repayment) Solar PV LCOE in Puerto Rico
Solar PV LCOE in Puerto Rico + Non-bypassable costs Residential Grid Defection
CHP @ 80% Capacity Factor Diesel Generation @ 80% Capacity Factor
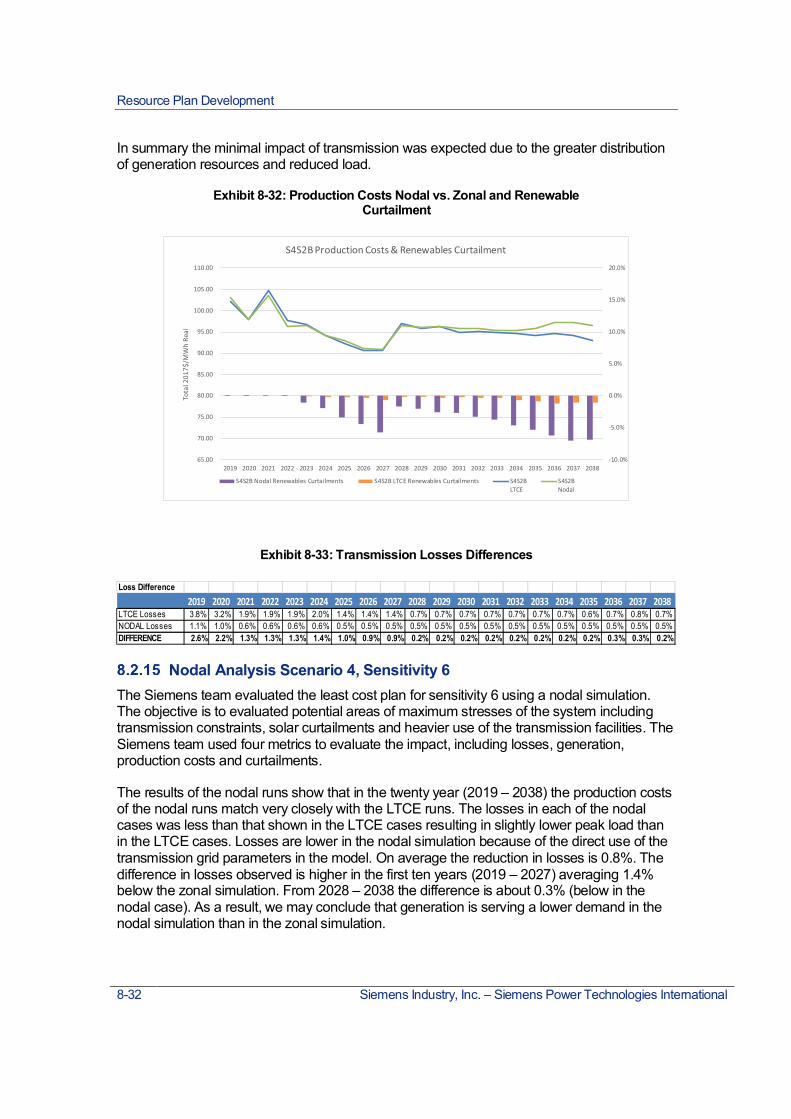
Resource Plan Development
8-32 Siemens Industry, Inc. – Siemens Power Technologies International
In summary the minimal impact of transmission was expected due to the greater distributionof generation resources and reduced load.
Exhibit 8-32: Production Costs Nodal vs. Zonal and RenewableCurtailment
Exhibit 8-33: Transmission Losses Differences
Nodal Analysis Scenario 4, Sensitivity 6The Siemens team evaluated the least cost plan for sensitivity 6 using a nodal simulation.The objective is to evaluated potential areas of maximum stresses of the system includingtransmission constraints, solar curtailments and heavier use of the transmission facilities. TheSiemens team used four metrics to evaluate the impact, including losses, generation,production costs and curtailments.
The results of the nodal runs show that in the twenty year (2019 – 2038) the production costsof the nodal runs match very closely with the LTCE runs. The losses in each of the nodalcases was less than that shown in the LTCE cases resulting in slightly lower peak load thanin the LTCE cases. Losses are lower in the nodal simulation because of the direct use of thetransmission grid parameters in the model. On average the reduction in losses is 0.8%. Thedifference in losses observed is higher in the first ten years (2019 – 2027) averaging 1.4%below the zonal simulation. From 2028 – 2038 the difference is about 0.3% (below in thenodal case). As a result, we may conclude that generation is serving a lower demand in thenodal simulation than in the zonal simulation.
-10.0%
-5.0%
0.0%
5.0%
10.0%
15.0%
20.0%
65.00
70.00
75.00
80.00
85.00
90.00
95.00
100.00
105.00
110.00
2019 2020 2021 2022 2023 2024 2025 2026 2027 2028 2029 2030 2031 2032 2033 2034 2035 2036 2037 2038
Tota
l201
7$/M
Wh
Real
S4S2B Production Costs & Renewables Curtailment
S4S2B Nodal Renewables Curtailments S4S2B LTCE Renewables Curtailments S4S2BLTCE
S4S2BNodal
Loss Difference2019 2020 2021 2022 2023 2024 2025 2026 2027 2028 2029 2030 2031 2032 2033 2034 2035 2036 2037 2038
LTCE Losses 3.8% 3.2% 1.9% 1.9% 1.9% 2.0% 1.4% 1.4% 1.4% 0.7% 0.7% 0.7% 0.7% 0.7% 0.7% 0.7% 0.6% 0.7% 0.8% 0.7%NODAL Losses 1.1% 1.0% 0.6% 0.6% 0.6% 0.6% 0.5% 0.5% 0.5% 0.5% 0.5% 0.5% 0.5% 0.5% 0.5% 0.5% 0.5% 0.5% 0.5% 0.5%DIFFERENCE 2.6% 2.2% 1.3% 1.3% 1.3% 1.4% 1.0% 0.9% 0.9% 0.2% 0.2% 0.2% 0.2% 0.2% 0.2% 0.2% 0.2% 0.3% 0.3% 0.2%

Resource Plan Development
Siemens Industry, Inc. – Siemens Power Technologies International 8-33
The energy demand was unchanged. The transmission losses in the Nodal run aredetermined by the transmission model.
From a transmission point of view there were no binding constraints of the transmissionsystem in the nodal runs.
The installed battery to solar ratio benefits the efficiency of the storage system as well as thelevel of curtailment of solar.
Exhibit 8-34: Production Costs Nodal vs. Zonal andRenewable Curtailment
Exhibit 8-35: Transmission Losses Differences
In summary the minimal impact of transmission was expected due to the greater distributionof generation resources and reduced load.
-5%
0%
5%
10%
15%
20%
65.00
70.00
75.00
80.00
85.00
90.00
95.00
100.00
105.00
110.00
115.00
2019 2020 2021 2022 2023 2024 2025 2026 2027 2028 2029 2030 2031 2032 2033 2034 2035 2036 2037 2038
Tota
l201
7$/M
Wh
Real
S4S2S6B Production Costs & Renewable Curtailment
S4S2S6B Nodal Curtailment ESM LTCE Curtailment S4S2S5B Nodal S4S2S5B LTCE
Loss Difference2019 2020 2021 2022 2023 2024 2025 2026 2027 2028 2029 2030 2031 2032 2033 2034 2035 2036 2037 2038
LTCE Losses 3.8% 3.2% 2.5% 1.9% 2.0% 2.1% 1.6% 1.5% 1.5% 0.7% 0.7% 0.7% 0.7% 0.7% 0.7% 0.7% 0.7% 0.6% 0.6% 0.6%NODAL Losses 1.1% 1.0% 0.8% 0.6% 0.6% 0.7% 0.5% 0.5% 0.5% 0.4% 0.4% 0.4% 0.4% 0.4% 0.4% 0.4% 0.4% 0.4% 0.4% 0.4%DIFFERENCE 2.6% 2.2% 1.8% 1.3% 1.4% 1.4% 1.1% 1.0% 0.9% 0.3% 0.3% 0.3% 0.3% 0.3% 0.3% 0.3% 0.2% 0.2% 0.2% 0.2%

Resource Plan Development
8-34 Siemens Industry, Inc. – Siemens Power Technologies International
The ESM PlanThe Energy System Modernization Plan (ESM) is a plan developed by PREPA based onseveral generation expansion additions. The purpose of the ESM Plan is to expedite theimplementation of a preferred plan utilizing procurement options presented by the PublicPrivate Partnership Authority, identify the pricing structure necessary to retain existingnatural-gas fired generation in the south, consider locational alternatives for new large scaleCCGTs, and ensure reliable capacity in the San Juan area. The corresponding least costlong term capacity expansion plan (LTCE) is developed taking into consideration some pre-defined decisions as described below. Siemens compared the ESM plan to the applicableleast cost plan (Scenario 4, strategy 2) under base load forecast.
The ESM is based on the following fixed decisions:
µ Replace all 18 existing Frame 5 GT’s at optimized locations with new mobile unitsGTs (23 MW each) or equivalent, as a fixed decision to come online by 2021 and withcontainerized LNG as a fuel option (418 MW total).
µ Develop an LNG terminal at Yabucoa (Caguas) and a 302 MW F-Class CCGT inJune 2025 to be built as a fixed decision.
µ Develop an F-Class CCGT at Palo Seco by 2025 fueled by a land-based LNG at SanJuan
µ Develop new ship-based LNG at Mayagüez and conversion to dual fuel of the AeroMayagüez units (4x50MW) as a fixed decision. In addition, as an option, the caseincludes the possibility of building a 302 MW F-Class CCGT at Mayagüez . The lastoption was not selected by the LTCE.
µ Develop a new 114 MW thermal plant (combined cycle assumed 3x38 MW) burningnatural gas or LPG in the San Juan area. The actual technology to be used will bedetermined via an RFP process and the modeled plant is not prescriptive and only aconservative assumption.
The following assumptions were also included in the simulation of this Scenario:
µ Load Forecast is treated via a Base, High and Low case.µ EcoEléctrica is assumed to stay in service but with the fixed payment reduced to 60%
(new 2022 payment $88 million down from $240 million the prior year). This reductionis enough for it to be competitive with the CCGT option. The unit is assumed to befully flexible for cycling.
µ AES is assumed to expire in 2027, in line with the least cost plan.µ Solar and storage costs and availability based on reference case assumptions. Solar
PV addition is limited to 240 MW in 2021, 480 MW in 2022-2023, 300 MW in 2024and 480 MW after 2024. Storage addition is limited to 20 MW in 2019, 100 MW in2021 and 160 MW onwards.
µ San Juan units 5 & 6 are converted to natural gas in June 2019 (in line with the leastcost plan). San Juan units are subjected to a capacity payment of $5 million per unituntil 06/30/2024, on an annual basis. Afterwards, the capacity payment is zero. SanJuan units are subjected to fuel constraints at San Juan (ship-based fuel constraint

Resource Plan Development
Siemens Industry, Inc. – Siemens Power Technologies International 8-35
for July 2019-June 2025, and land-based LNG constraint from July 2024 through theend of the planning period.
µ Energy Efficiency is assumed to meet the requirement of Regulation No. 9021, i.e.,2% per year of incremental savings attributable to new energy efficiency programs for10 years.
µ Minimum RPS targets of 12% by 2022, 15% by 2027 and 20% by 2035.
Generating AdditionsThe economic simulation of the ESM case results in 900 MW of utility scale PV additions overthe planning period, 1,320 MW below Scenario 4. Most of solar PV installations happen in2020-2022, with 720 MW installed (in line with the maximum annual limits set for the ESMcase). Under the high demand case, 1,680 MW of solar PV is installed over the study period,with the incremental load primarily supplied from 780 MW of additional solar PV. There is nochange in terms of solar PV additions in the 2020-2022 period, as the predefined maximumlevels are installed. In contrast, under the low demand case 720 MW of solar PV is installed(180 MW less than the base case), with all the PV installed in the 2020-2022 period.
800 MW of battery energy storage is built over the planning period, about one half of the totalis installed in 2019-2022. The ratio of solar PV to battery storage is much higher in the ESMcase compared to the least cost plan under Scenario 4 (0.88 MW per 1 MW of solar in ESMvs. 0.4 MW per 1 MW in the least cost plan). A similar amount of battery storage is installedunder the high demand case. Under the low demand case 640 MW of battery storage isinstalled by 2038, 160 MW less than the base load.
The thermal additions are largely the ones identified as an input to the plan, with theexception of a medium diesel CCGT (141 MW) installed in Ponce East by 2035. The plandoes not develop a new CCGT at Costa Sur, due to the assumed continued operation ofEcoEléctrica. Under the high demand case, the medium diesel CCGT at Ponce East is notinstalled but instead a small 29 MW gas-fired CCGT in San Juan is installed and two dieselpeakers (39 MW each) at Carolina and CAYMG are installed. Other thermal additions are thesame as the base case, including the mobile gas-fired peaking capacity and Mayagüezconversions in the South. Overall, there is a net reduction in fast ramping capacity of 63 MWin the high demand case60. Under the low demand case, a small CCGT in Ponce is builtinstead of the medium diesel CCGT in the base case with a net reduction of fast rampingcapacity of 113 MW.
The mobile peakers provide MiniGrid resiliency, in particular for Carolina, Caguas, Cayey,Ponce (Jobos) and Mayagüez North.
60 The amount of battery and gas-fired peaking capacity to support over 1,600 MW of solar PV under the highdemand case may need further refinement.

Resource Plan Development
8-36 Siemens Industry, Inc. – Siemens Power Technologies International
Exhibit 8-36: ESM Plan Capacity Additions
Capacity RetirementsThe installation of the PV and Storage in 2020 allows for the economic retirement of AguirreST 1 and 2 (end of 2019 & 2020), Palo Seco ST 3 & 4 in 2024 and San Juan ST 7 & 8 in2023.
EcoEléctrica is modelled to remain in service with an adjustment to the contract that wasdefined to be competitive with a CCGT. The fixed payments are reduced to about 40% ofcurrent values and the unit is assumed to be able to cycle as required to accommodate therenewable generation production variations. This reductions were determined to makeEcoEléctrica competitive with the CCGT.
Costa Sur 5 & 6 last year in service are 2021 and 2020, respectively, retired by the fall in loadand the entry of solar PV and Storage.
AES is retired at the end of 2027, not economically but by defined model input.
The Aguirre CCGT unit 1 is retired in 2025 and unit 2 later in 2034. Under the high demandcase, Aguirre CCGT unit 2 is not retired and stay online through the study period. Under thelow demand case there is no change in capacity retirements or their timing.
Capacity by Technology MW 2019 2020 2021 2022 2023 2024 2025 2026 2027 2028 2029
Large CCGT's 0 0 0 0 0 0 604 0 0 0 0Medium CCGT's 0 0 0 0 0 0 0 0 0 0 0Small CCGT's (LPG enabled) 0 0 0 114 0 0 0 0 0 0 0Peakers (diesel) CT's and CCGTs 0 0 418 0 0 0 0 0 0 0 0BESS 20 100 160 160 160 0 0 0 0 20 60Total Distchable Additions 20 100 578 274 160 0 604 0 0 20 60Solar 0 0 240 480 180 0 0 0 0 0 0Total Additions 20 100 818 754 340 0 604 0 0 20 60
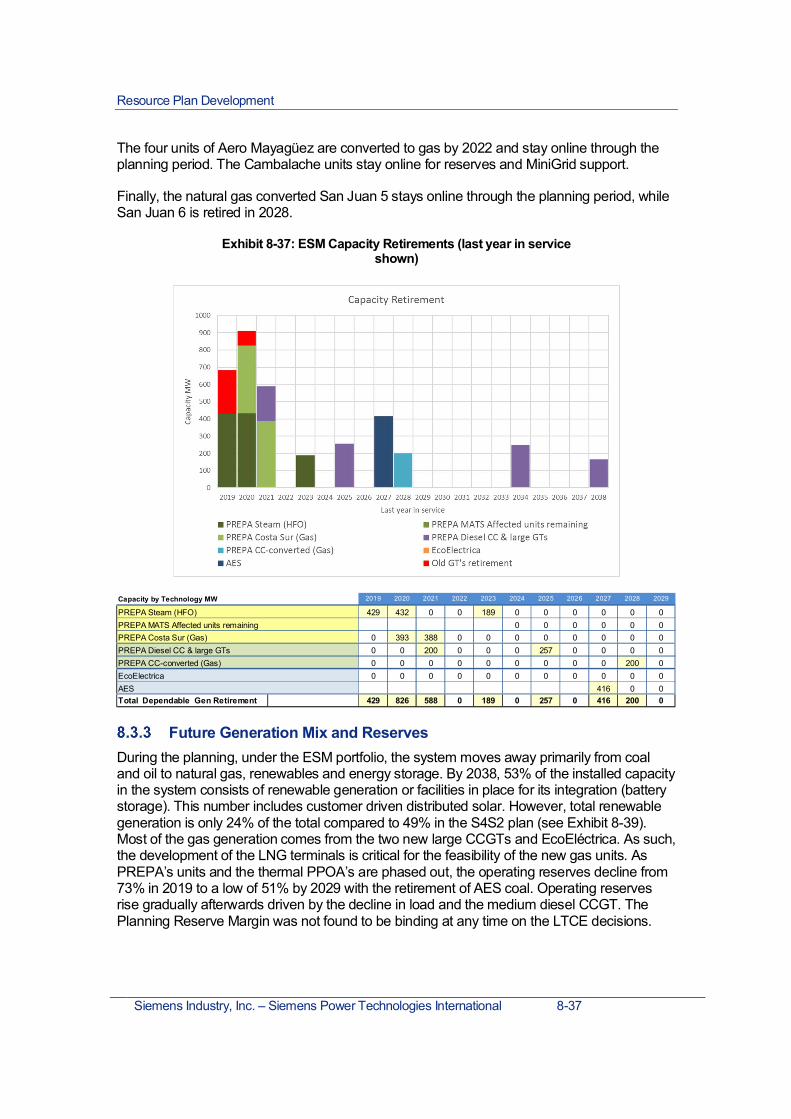
Resource Plan Development
Siemens Industry, Inc. – Siemens Power Technologies International 8-37
The four units of Aero Mayagüez are converted to gas by 2022 and stay online through theplanning period. The Cambalache units stay online for reserves and MiniGrid support.
Finally, the natural gas converted San Juan 5 stays online through the planning period, whileSan Juan 6 is retired in 2028.
Exhibit 8-37: ESM Capacity Retirements (last year in serviceshown)
Future Generation Mix and ReservesDuring the planning, under the ESM portfolio, the system moves away primarily from coaland oil to natural gas, renewables and energy storage. By 2038, 53% of the installed capacityin the system consists of renewable generation or facilities in place for its integration (batterystorage). This number includes customer driven distributed solar. However, total renewablegeneration is only 24% of the total compared to 49% in the S4S2 plan (see Exhibit 8-39).Most of the gas generation comes from the two new large CCGTs and EcoEléctrica. As such,the development of the LNG terminals is critical for the feasibility of the new gas units. AsPREPA’s units and the thermal PPOA’s are phased out, the operating reserves decline from73% in 2019 to a low of 51% by 2029 with the retirement of AES coal. Operating reservesrise gradually afterwards driven by the decline in load and the medium diesel CCGT. ThePlanning Reserve Margin was not found to be binding at any time on the LTCE decisions.
Capacity by Technology MW 2019 2020 2021 2022 2023 2024 2025 2026 2027 2028 2029
PREPA Steam (HFO) 429 432 0 0 189 0 0 0 0 0 0PREPA MATS Affected units remaining 0 0 0 0 0 0PREPA Costa Sur (Gas) 0 393 388 0 0 0 0 0 0 0 0PREPA Diesel CC & large GTs 0 0 200 0 0 0 257 0 0 0 0PREPA CC-converted (Gas) 0 0 0 0 0 0 0 0 0 200 0EcoElectrica 0 0 0 0 0 0 0 0 0 0 0AES 416 0 0Total Dependable Gen Retirement 429 826 588 0 189 0 257 0 416 200 0

Resource Plan Development
8-38 Siemens Industry, Inc. – Siemens Power Technologies International
Exhibit 8-38: ESM Future Installed Capacity Mix
Exhibit 8-39: ESM Future Generation Mix

Resource Plan Development
Siemens Industry, Inc. – Siemens Power Technologies International 8-39
Fuel DiversityIn line with the change in the energy supply matrix, the system moves away from heavy fueloil and coal to natural gas. There is a significant decline in the overall fuel consumption andassociated costs with the implementation of the plan. Fuel consumption declines 44% by2038 with the retirements of old Steam gas, heavy fuel oil and coal units. Under the highdemand case, fuel consumption is 6% higher compared to the base load, driven by higherdemand and Aguirre CCGT unit 2 staying online. Under the low demand case, fuelconsumption is 10% lower driven by lower generation, peaking capacity and small CCGT inPonce instead of a medium diesel CCGT in the base load.
However, fuel consumption is 95% higher compared to the least cost plan under Scenario 4.
Exhibit 8-40: ESM Plan Fuel Consumption
Fuel costs decline in line with the overall fall in fuel consumption falling to a low of $659million by 2027 (55% below 2019 levels) with all the retirements, including AES. Fuel costsincrease in 2028 due to increase generation from EcoEléctrica and San Juan unit 5, after theretirement of AES. Fuel costs stay relative stable after 2028, on average at $787 million in thelast ten years of the planning period. Overall, fuel costs decline 36% by 2038. Under the highdemand case, fuel costs are 8% higher compared to the base load case. In contrast, fuelcosts are 11% lower under the low demand case.
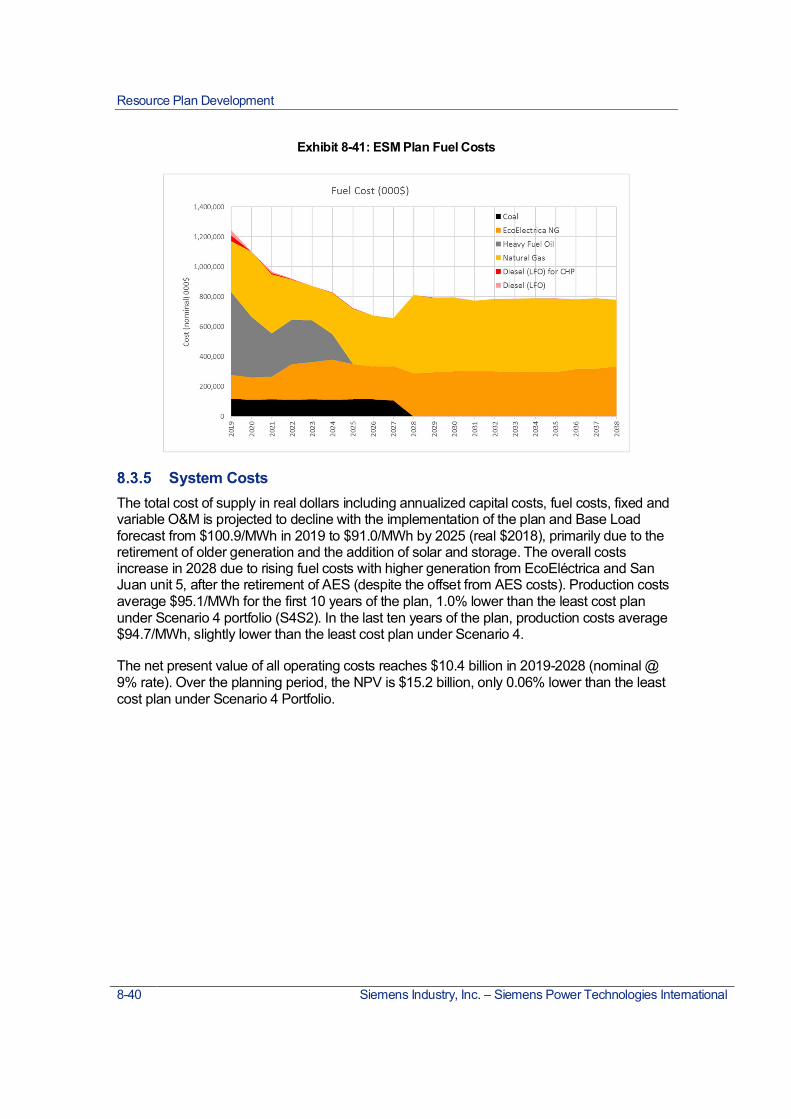
Resource Plan Development
8-40 Siemens Industry, Inc. – Siemens Power Technologies International
Exhibit 8-41: ESM Plan Fuel Costs
System CostsThe total cost of supply in real dollars including annualized capital costs, fuel costs, fixed andvariable O&M is projected to decline with the implementation of the plan and Base Loadforecast from $100.9/MWh in 2019 to $91.0/MWh by 2025 (real $2018), primarily due to theretirement of older generation and the addition of solar and storage. The overall costsincrease in 2028 due to rising fuel costs with higher generation from EcoEléctrica and SanJuan unit 5, after the retirement of AES (despite the offset from AES costs). Production costsaverage $95.1/MWh for the first 10 years of the plan, 1.0% lower than the least cost planunder Scenario 4 portfolio (S4S2). In the last ten years of the plan, production costs average$94.7/MWh, slightly lower than the least cost plan under Scenario 4.
The net present value of all operating costs reaches $10.4 billion in 2019-2028 (nominal @9% rate). Over the planning period, the NPV is $15.2 billion, only 0.06% lower than the leastcost plan under Scenario 4 Portfolio.
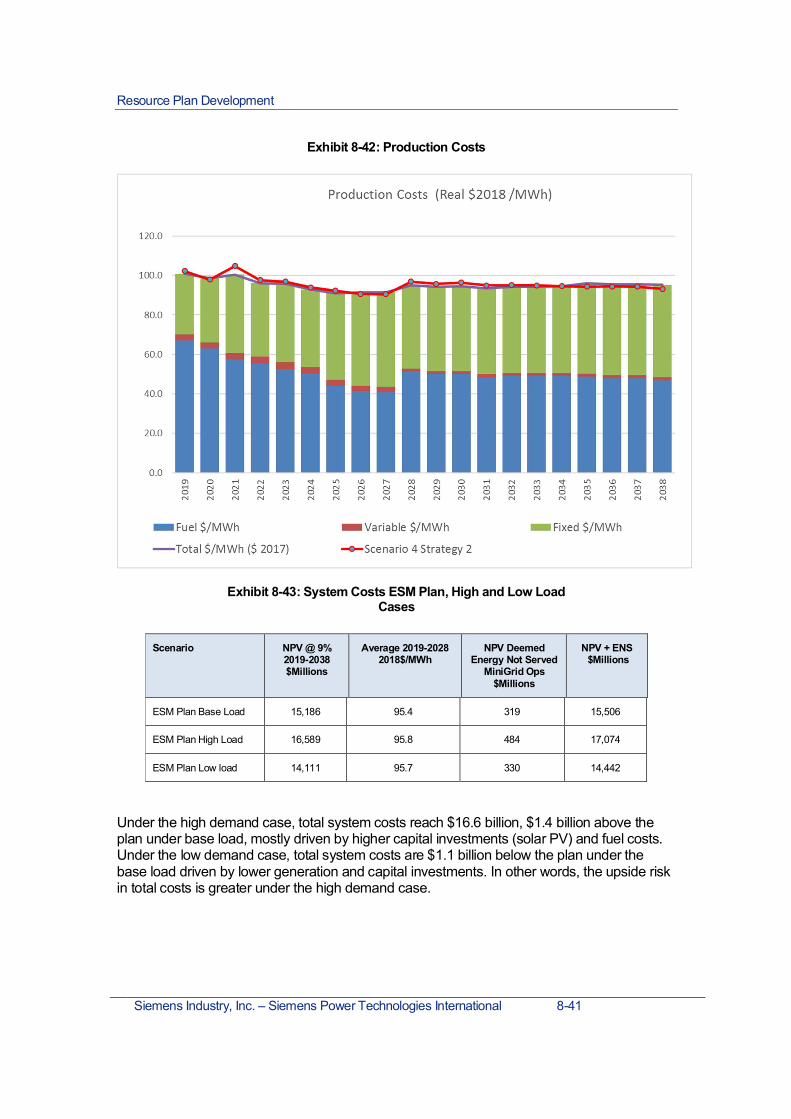
Resource Plan Development
Siemens Industry, Inc. – Siemens Power Technologies International 8-41
Exhibit 8-42: Production Costs
Exhibit 8-43: System Costs ESM Plan, High and Low LoadCases
Scenario NPV @ 9%2019-2038$Millions
Average 2019-20282018$/MWh
NPV DeemedEnergy Not Served
MiniGrid Ops$Millions
NPV + ENS $Millions
ESM Plan Base Load 15,186 95.4 319 15,506
ESM Plan High Load 16,589 95.8 484 17,074
ESM Plan Low load 14,111 95.7 330 14,442
Under the high demand case, total system costs reach $16.6 billion, $1.4 billion above theplan under base load, mostly driven by higher capital investments (solar PV) and fuel costs.Under the low demand case, total system costs are $1.1 billion below the plan under thebase load driven by lower generation and capital investments. In other words, the upside riskin total costs is greater under the high demand case.

Resource Plan Development
8-42 Siemens Industry, Inc. – Siemens Power Technologies International
Resiliency (Mini Grid Considerations)In the ESM plan, the critical loads are fully met with local generation by 2021, however thebalance of the load is not fully covered while the plan is being developed in 2019 through2022. After 2022, it varies depending on the MiniGrid region.
Siemens estimated the costs from unserved energy in the case of a major hurricaneimpacting the transmission system61. It is assumed that a major hurricane occurs every fiveyears impacting major interconnection transmission lines and placing the system intoMiniGrids operation for 1 Month, starting in 2022. It is based on a $2000/MWh value forunserved energy, which considers that the load shedding will be rotated to minimize impact.The $2000 is consistent with the cost of unserved energy for residential customers62.
Exhibit 8-20 summarizes the economic costs by MiniGrid region for the ESM plan. Thelargest potential costs are for Caguas and Carolina, followed by Arecibo and Cayey. Overall,there is an incremental 319 million in potential costs from unserved energy in the case of amajor hurricane impacting the island under this plan. This compares to $228 million for theleast cost plan under Scenario 4 due to the fact that this plan has greater amounts ofdistributed solar resources. Considering the approximations made to determine these costsof Deemed Energy Not Served, the differences, however, are not considered material as theimpact in the NPV of the Total Costs when the effect of the Deemed Energy Not Served isadded, is about 82 million (0.6%).
Exhibit 8-44: Cost of Energy Not Served by MiniGrids
In Caguas, the total thermal energy available (inclusive of solar PV) covers the critical loadsbut not the priority loads through 2024 under the ESM case. The deployment of 115 MW ofpeakers (mobile) in 2021 seeks to cover the critical loads in this region under a MiniGridoperation (see Exhibit 8-45). The balance load is met in 2025 and onwards with the additionof a 302 MW F-Class CCGT in 2025 in Caguas. There is excess generation in this MiniGridregion afterwards.
61 This cost is NOT a forecast of future cost, but rather a high-level determination of how the different portfoliosresulting from the combination of Scenarios and strategies would perform if every 5 years starting in 2022 a majorhurricane impact the island resulting in the operation of the MiniGrids for one month (“Deemed Energy Not Served”)62 This value is much lower compared to the VOLL determined for PR, in the range of $30,000/MWh
MiniGridESM
NPV Cost ($000)Scenario 4
NPV Cost ($000)
San Juan-Bayamon 15,228$ 8,874$Ponce -$ -$Carolina 77,508$ 40,737$Caguas 103,020$ 127,850$Arecibo 63,825$ 25,110$Mayaguez-North 12,868$ 518$Mayaguez-South 12,837$ -$Cayey 34,004$ 25,196$Total 319,291$ 228,285$

Resource Plan Development
Siemens Industry, Inc. – Siemens Power Technologies International 8-43
Exhibit 8-45: Caguas Energy Coverage under a MinigridOperation
RPS and Environmental Compliance
8.3.7.1 Renewable ComplianceThe renewable portfolio standard targets of 12% by 2022, 15% by 2027 and 20% by 2035are all met in the ESM case. The plan achieved 24% renewable penetration by 2038, abovethe current regulation. Under the high demand case, the Plan reaches 40% renewablepenetration due to the incremental solar PV with most of the incremental demand met withsolar generation. Under the low load demand case, the Plan achieves 20% renewablepenetration, somewhat lower than the base demand case.
The ESM plan may need to be revisited in the late 2020s if the proposed regulation of 50%renewable generation by 2040 is implemented. To assess the impact of this eventuality,Siemens ran a sensitivity analysis with a 50% renewable penetration by 2040, for which theresults are provided in section 8.3.8.

Resource Plan Development
8-44 Siemens Industry, Inc. – Siemens Power Technologies International
Exhibit 8-46: Renewable Portfolio Standards
8.3.7.2 Environmental ProgressCO2 emissions for PREPA’s fleet fall in the first ten years of the forecast driven by theretirement of the older fuel oil, diesel and gas units along with increased penetration of solargeneration. Emissions fall 39% by 2027 and further by 60% a year later with AES coalretirement in 2028. Emissions continue falling but more gradually after 2028 reaching a 66%reduction by 2038. The emission rate for the fleet falls from 1,334 lbs./MWh in 2019 to 687lbs./MWh in 2038. Total emissions under the ESM plan are 39% higher compared to theleast cost plan under Scenario 4.
Under the high demand case, overall CO2 emissions decline by 69% with more solar in themix. Under the low demand case, emissions decline further 71% by 2038 due to overall lowerdemand and fossil generation.
The new CCGTs have the lowest emission rates at 820 lbs./MWh. San Juan units convertedto natural gas also show low emissions rates at around 850 lbs./MWh. EcoEléctrica is also alow emitter at 877 lbs./MWh. The small 144 MW CCGT unit in the North has higheremissions rate at 918 lbs./MWh, which is shown in the total for CCGTs below prior to 2025when the new CCGTs are in place. The unit with the highest CO2 emission rates is AES coalat 2,155 lbs./MWh.
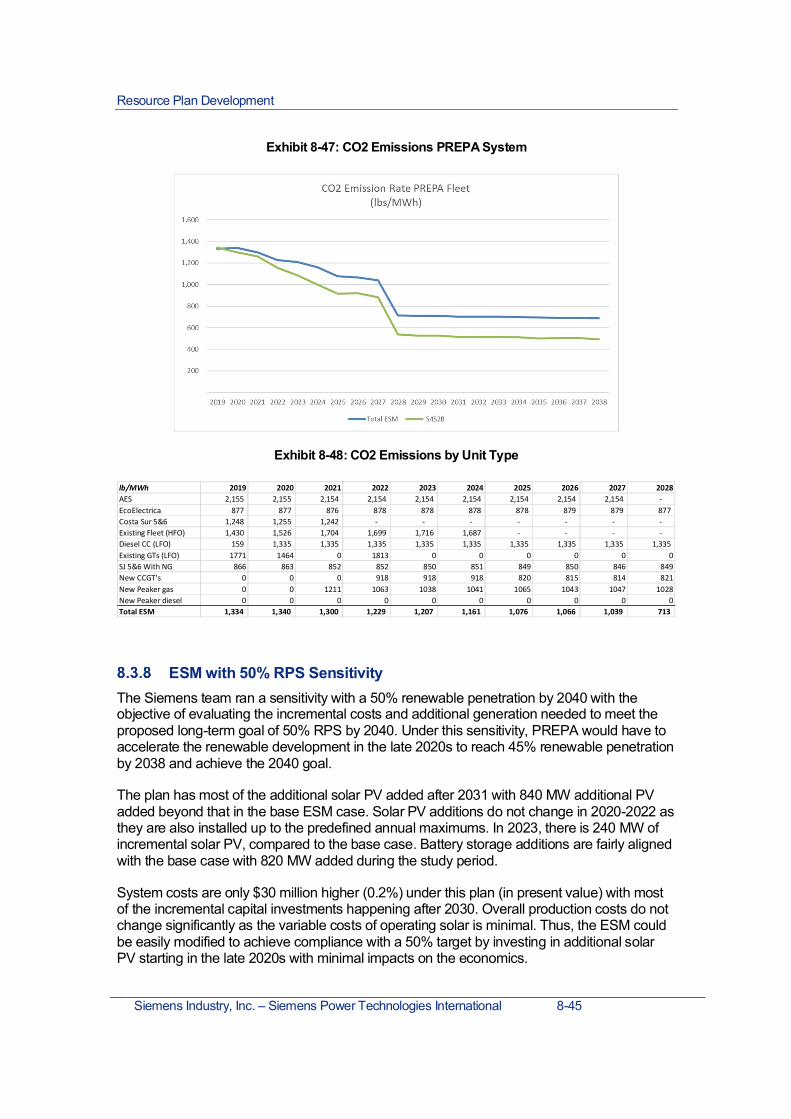
Resource Plan Development
Siemens Industry, Inc. – Siemens Power Technologies International 8-45
Exhibit 8-47: CO2 Emissions PREPA System
Exhibit 8-48: CO2 Emissions by Unit Type
ESM with 50% RPS SensitivityThe Siemens team ran a sensitivity with a 50% renewable penetration by 2040 with theobjective of evaluating the incremental costs and additional generation needed to meet theproposed long-term goal of 50% RPS by 2040. Under this sensitivity, PREPA would have toaccelerate the renewable development in the late 2020s to reach 45% renewable penetrationby 2038 and achieve the 2040 goal.
The plan has most of the additional solar PV added after 2031 with 840 MW additional PVadded beyond that in the base ESM case. Solar PV additions do not change in 2020-2022 asthey are also installed up to the predefined annual maximums. In 2023, there is 240 MW ofincremental solar PV, compared to the base case. Battery storage additions are fairly alignedwith the base case with 820 MW added during the study period.
System costs are only $30 million higher (0.2%) under this plan (in present value) with mostof the incremental capital investments happening after 2030. Overall production costs do notchange significantly as the variable costs of operating solar is minimal. Thus, the ESM couldbe easily modified to achieve compliance with a 50% target by investing in additional solarPV starting in the late 2020s with minimal impacts on the economics.
lb/MWh 2019 2020 2021 2022 2023 2024 2025 2026 2027 2028AES 2,155 2,155 2,154 2,154 2,154 2,154 2,154 2,154 2,154 -EcoElectrica 877 877 876 878 878 878 878 879 879 877Costa Sur 5&6 1,248 1,255 1,242 - - - - - - -Existing Fleet (HFO) 1,430 1,526 1,704 1,699 1,716 1,687 - - - -Diesel CC (LFO) 159 1,335 1,335 1,335 1,335 1,335 1,335 1,335 1,335 1,335Existing GTs (LFO) 1771 1464 0 1813 0 0 0 0 0 0SJ 5&6 With NG 866 863 852 852 850 851 849 850 846 849New CCGT's 0 0 0 918 918 918 820 815 814 821New Peaker gas 0 0 1211 1063 1038 1041 1065 1043 1047 1028New Peaker diesel 0 0 0 0 0 0 0 0 0 0Total ESM 1,334 1,340 1,300 1,229 1,207 1,161 1,076 1,066 1,039 713
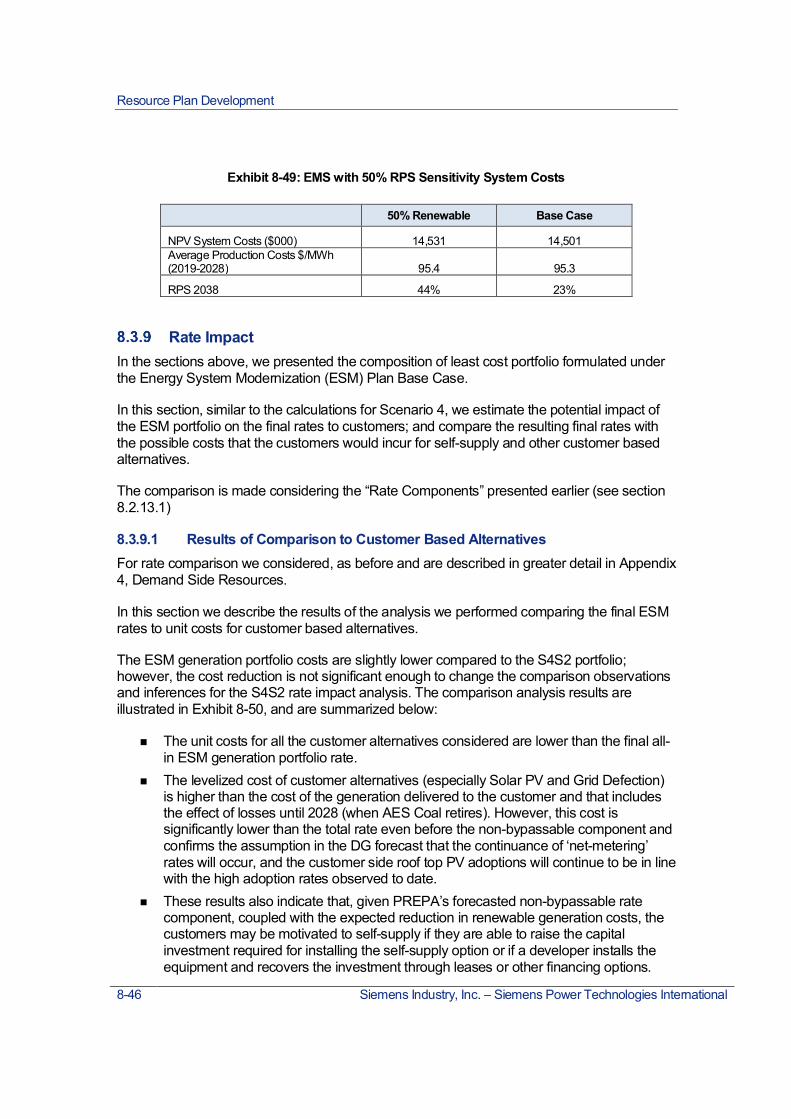
Resource Plan Development
8-46 Siemens Industry, Inc. – Siemens Power Technologies International
Exhibit 8-49: EMS with 50% RPS Sensitivity System Costs
50% Renewable Base Case
NPV System Costs ($000) 14,531 14,501Average Production Costs $/MWh(2019-2028) 95.4 95.3
RPS 2038 44% 23%
Rate ImpactIn the sections above, we presented the composition of least cost portfolio formulated underthe Energy System Modernization (ESM) Plan Base Case.
In this section, similar to the calculations for Scenario 4, we estimate the potential impact ofthe ESM portfolio on the final rates to customers; and compare the resulting final rates withthe possible costs that the customers would incur for self-supply and other customer basedalternatives.
The comparison is made considering the “Rate Components” presented earlier (see section8.2.13.1)
8.3.9.1 Results of Comparison to Customer Based AlternativesFor rate comparison we considered, as before and are described in greater detail in Appendix4, Demand Side Resources.
In this section we describe the results of the analysis we performed comparing the final ESMrates to unit costs for customer based alternatives.
The ESM generation portfolio costs are slightly lower compared to the S4S2 portfolio;however, the cost reduction is not significant enough to change the comparison observationsand inferences for the S4S2 rate impact analysis. The comparison analysis results areillustrated in Exhibit 8-50, and are summarized below:
µ The unit costs for all the customer alternatives considered are lower than the final all-in ESM generation portfolio rate.
µ The levelized cost of customer alternatives (especially Solar PV and Grid Defection)is higher than the cost of the generation delivered to the customer and that includesthe effect of losses until 2028 (when AES Coal retires). However, this cost issignificantly lower than the total rate even before the non-bypassable component andconfirms the assumption in the DG forecast that the continuance of ‘net-metering’rates will occur, and the customer side roof top PV adoptions will continue to be in linewith the high adoption rates observed to date.
µ These results also indicate that, given PREPA’s forecasted non-bypassable ratecomponent, coupled with the expected reduction in renewable generation costs, thecustomers may be motivated to self-supply if they are able to raise the capitalinvestment required for installing the self-supply option or if a developer installs theequipment and recovers the investment through leases or other financing options.

Resource Plan Development
Siemens Industry, Inc. – Siemens Power Technologies International 8-47
µ It is also interesting to note that when the Non-Bypassable charge is added to thecase where the customer only has PV and uses PREPA as a bank (net-metering) thecosts are very similar to the complete self-supply option. However, in this case thereis an added advantage of no need for the initial capital outlay. So, provided that thePREPA service meets the reliability expectations of the customer, it can bereasonably concluded that the customer will continue to be connected to the PREPAgrid.
We analyzed another case where we reduced the non-technical losses to typical valuesobserved in the US (0.5% or less). Note that the distribution technical losses are within theexpected values of PREPA’s peers and account for the reduction in losses due to theincreased penetration of distributed generation. Keeping all else the same, the resulting finalrate for the ESM generation portfolio, also reduces, but not to the extent that our aboveobservations and inferences change. This updated comparison chart is given in the exhibitbelow.
Exhibit 8-50: Final ESM Generation Portfolio Rates Comparedto Unit Costs of Customer Alternatives
0
50
100
150
200
250
300
2019 2020 2021 2022 2023 2024 2025 2026 2027 2028 2029 2030 2031 2032 2033 2034 2035 2036 2037 2038
2018
$/M
Wh
Generation Cost per MWh delivered to the customers Non Generation Utility Component
Non-Bypassable rate (debt repayment) Solar PV LCOE in Puerto Rico, 2018 $/MWh (right axis)
Non-bypassable costs, 2018 $/MWh (right axis) Residential Grid Defection Cost, $/MWh
CHP @ 80% Capacity Factor Diesel Generation @ 80% Capacity Factor
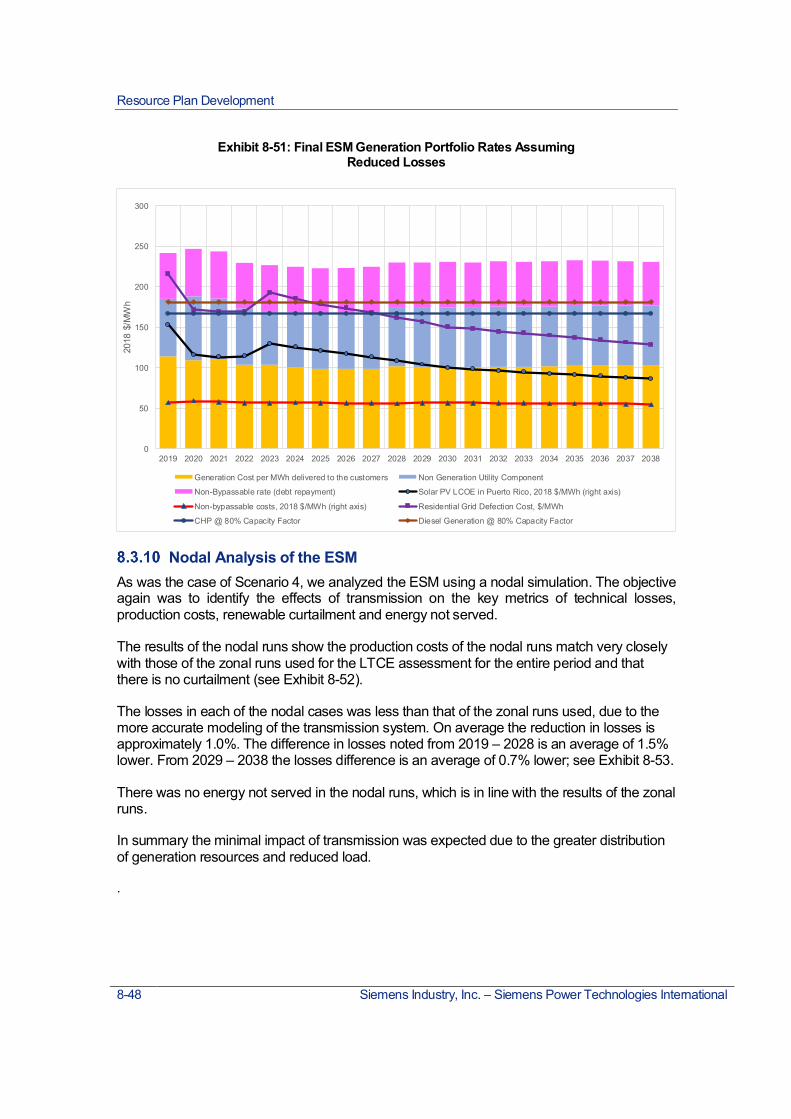
Resource Plan Development
8-48 Siemens Industry, Inc. – Siemens Power Technologies International
Exhibit 8-51: Final ESM Generation Portfolio Rates AssumingReduced Losses
Nodal Analysis of the ESMAs was the case of Scenario 4, we analyzed the ESM using a nodal simulation. The objectiveagain was to identify the effects of transmission on the key metrics of technical losses,production costs, renewable curtailment and energy not served.
The results of the nodal runs show the production costs of the nodal runs match very closelywith those of the zonal runs used for the LTCE assessment for the entire period and thatthere is no curtailment (see Exhibit 8-52).
The losses in each of the nodal cases was less than that of the zonal runs used, due to themore accurate modeling of the transmission system. On average the reduction in losses isapproximately 1.0%. The difference in losses noted from 2019 – 2028 is an average of 1.5%lower. From 2029 – 2038 the losses difference is an average of 0.7% lower; see Exhibit 8-53.
There was no energy not served in the nodal runs, which is in line with the results of the zonalruns.
In summary the minimal impact of transmission was expected due to the greater distributionof generation resources and reduced load.
.
0
50
100
150
200
250
300
2019 2020 2021 2022 2023 2024 2025 2026 2027 2028 2029 2030 2031 2032 2033 2034 2035 2036 2037 2038
2018
$/M
Wh
Generation Cost per MWh delivered to the customers Non Generation Utility Component
Non-Bypassable rate (debt repayment) Solar PV LCOE in Puerto Rico, 2018 $/MWh (right axis)
Non-bypassable costs, 2018 $/MWh (right axis) Residential Grid Defection Cost, $/MWh
CHP @ 80% Capacity Factor Diesel Generation @ 80% Capacity Factor

Resource Plan Development
Siemens Industry, Inc. – Siemens Power Technologies International 8-49
Exhibit 8-52: Production Costs Nodal vs. Zonal and RenewableCurtailment
Exhibit 8-53: Transmission Losses Differences
Scenario 1 ResultsScenario 1 is a portfolio in which there is no new LNG terminals can be developed in theisland. Only existing gas at the Cost Sur LNG terminal is available. The Scenario alsoconsiders base case assumptions for solar and storage costs and availability.
Scenario 1 was simulated under the base high and low load forecast and under threestrategies, strategy 2 (decentralized 80% of demand met by local resources base case),strategy 3 (50% of demand met with local generation) and strategy 1 (centralized system).
Three sensitivities were run also with this Scenario; Sensitivity 1; low cost of renewable,Sensitivity 2 low levels of energy efficiency (1% reduction for 10 year) and Sensitivity 3(Economic retirement of AES)
In general Scenario 1 result in a plan that has higher production costs compared to otherplans including Scenario 4 and the ESM. Most of the increase in costs comes from a muchlarger development of solar and storage required to meet the load. Scenario 1 achievesmuch higher levels of renewable penetration in the order of 82% that requires intensive useof the storage and could be challenging to operate (3846 MW on a system that could havepeak load little over 2,000 MW).
Resiliency at the MiniGrid level is comparable to the Scenario 4.
Exhibit 8-54 below provides a summary of the investments results for Scenario 1 and the keycost metrics in comparison with the S4S2B and the ESM case. Sensitivity 3 is being revisedas of this writing as the AES plant was retired and this is inconsistent.
-5%
0%
5%
10%
15%
20%
65.00
70.00
75.00
80.00
85.00
90.00
95.00
100.00
105.00
2019 2020 2021 2022 2023 2024 2025 2026 2027 2028 2029 2030 2031 2032 2033 2034 2035 2036 2037 2038
Tota
l201
7$/M
Wh
Real
ESM Production Costs & Renewable Curtailment
ESM Nodal Curtailment ESM LTCE Curtailment ESM Nodal ESM LTCE
Loss Difference2019 2020 2021 2022 2023 2024 2025 2026 2027 2028 2029 2030 2031 2032 2033 2034 2035 2036 2037 2038
LTCE Losses 3.7% 3.2% 2.6% 2.6% 2.0% 2.1% 2.0% 2.0% 1.9% 1.1% 1.0% 1.0% 0.9% 0.9% 0.9% 0.9% 0.8% 0.8% 0.8% 0.7%NODAL Losses 1.1% 1.0% 0.8% 0.7% 0.6% 0.5% 0.6% 0.6% 0.5% 0.6% 0.5% 0.5% 0.5% 0.5% 0.5% 0.5% 0.5% 0.5% 0.5% 0.5%DIFFERENCE 2.6% 2.2% 1.8% 1.8% 1.4% 1.6% 1.4% 1.5% 1.4% 0.6% 0.5% 0.5% 0.4% 0.4% 0.4% 0.3% 0.3% 0.3% 0.3% 0.2%
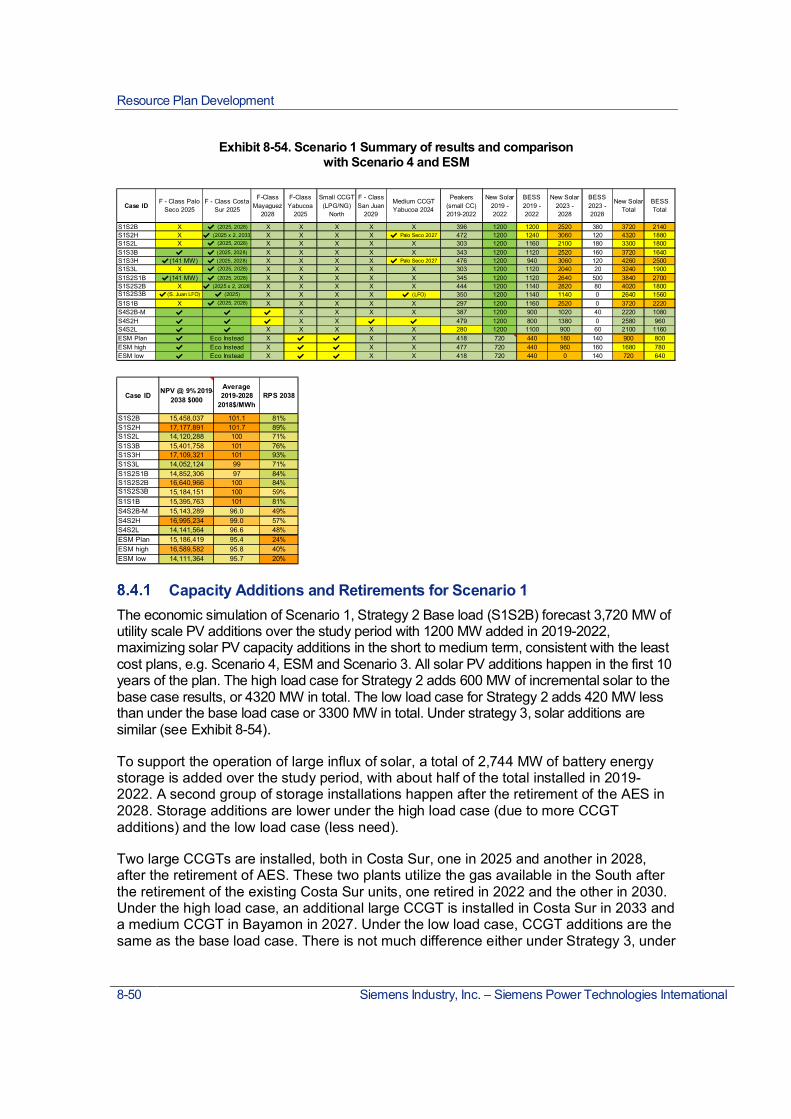
Resource Plan Development
8-50 Siemens Industry, Inc. – Siemens Power Technologies International
Exhibit 8-54. Scenario 1 Summary of results and comparisonwith Scenario 4 and ESM
Capacity Additions and Retirements for Scenario 1The economic simulation of Scenario 1, Strategy 2 Base load (S1S2B) forecast 3,720 MW ofutility scale PV additions over the study period with 1200 MW added in 2019-2022,maximizing solar PV capacity additions in the short to medium term, consistent with the leastcost plans, e.g. Scenario 4, ESM and Scenario 3. All solar PV additions happen in the first 10years of the plan. The high load case for Strategy 2 adds 600 MW of incremental solar to thebase case results, or 4320 MW in total. The low load case for Strategy 2 adds 420 MW lessthan under the base load case or 3300 MW in total. Under strategy 3, solar additions aresimilar (see Exhibit 8-54).
To support the operation of large influx of solar, a total of 2,744 MW of battery energystorage is added over the study period, with about half of the total installed in 2019-2022. A second group of storage installations happen after the retirement of the AES in2028. Storage additions are lower under the high load case (due to more CCGTadditions) and the low load case (less need).
Two large CCGTs are installed, both in Costa Sur, one in 2025 and another in 2028,after the retirement of AES. These two plants utilize the gas available in the South afterthe retirement of the existing Costa Sur units, one retired in 2022 and the other in 2030.Under the high load case, an additional large CCGT is installed in Costa Sur in 2033 anda medium CCGT in Bayamon in 2027. Under the low load case, CCGT additions are thesame as the base load case. There is not much difference either under Strategy 3, under
Case IDF - Class Palo
Seco 2025F - Class Costa
Sur 2025
F-ClassMayaguez
2028
F-ClassYabucoa
2025
Small CCGT(LPG/NG)
North
F - ClassSan Juan
2029
Medium CCGTYabucoa 2024
Peakers(small CC)2019-2022
New Solar2019 -2022
BESS2019 -2022
New Solar2023 -2028
BESS2023 -2028
New SolarTotal
BESSTotal
S1S2B X ✔ (2025, 2028) X X X X X 396 1200 1200 2520 380 3720 2140S1S2H X ✔ (2025 x 2, 2033) X X X X ✔ Palo Seco 2027 472 1200 1240 3060 120 4320 1880S1S2L X ✔ (2025, 2028) X X X X X 303 1200 1160 2100 180 3300 1800S1S3B ✔ ✔ (2025, 2028) X X X X X 343 1200 1120 2520 160 3720 1640S1S3H ✔(141 MW) ✔ (2025, 2028) X X X X ✔ Palo Seco 2027 476 1200 940 3060 120 4260 2500S1S3L X ✔ (2025, 2028) X X X X X 303 1200 1120 2040 20 3240 1900S1S2S1B ✔(141 MW) ✔ (2025, 2028) X X X X X 345 1200 1120 2640 500 3840 2700S1S2S2B X ✔ (2025 x 2, 2028) X X X X X 444 1200 1140 2820 80 4020 1800S1S2S3B ✔(S. Juan LFO) ✔ (2025) X X X X ✔ (LFO) 350 1200 1140 1140 0 2640 1560S1S1B X ✔ (2025, 2028) X X X X X 297 1200 1160 2520 0 3720 2220S4S2B-M ✔ ✔ ✔ X X X X 387 1200 900 1020 40 2220 1080S4S2H ✔ ✔ ✔ X X ✔ ✔ 479 1200 800 1380 0 2580 960S4S2L ✔ ✔ X X X X X 280 1200 1100 900 60 2100 1160ESM Plan ✔ Eco Instead X ✔ ✔ X X 418 720 440 180 140 900 800ESM high ✔ Eco Instead X ✔ ✔ X X 477 720 440 960 160 1680 780ESM low ✔ Eco Instead X ✔ ✔ X X 418 720 440 0 140 720 640
Case ID NPV @ 9% 2019-2038 $000
Average2019-2028
2018$/MWhRPS 2038
S1S2B 15,458,037 101.1 81%S1S2H 17,177,891 101.7 89%S1S2L 14,120,288 100 71%S1S3B 15,401,758 101 76%S1S3H 17,109,321 101 93%S1S3L 14,052,124 99 71%S1S2S1B 14,852,306 97 84%S1S2S2B 16,640,966 100 84%S1S2S3B 15,184,151 100 59%S1S1B 15,395,763 101 81%S4S2B-M 15,143,289 96.0 49%S4S2H 16,995,234 99.0 57%S4S2L 14,141,564 96.6 48%ESM Plan 15,186,419 95.4 24%ESM high 16,589,582 95.8 40%ESM low 14,111,364 95.7 20%

Resource Plan Development
Siemens Industry, Inc. – Siemens Power Technologies International 8-51
the high load case except for a small CCGT at Palo Seco in 2025 and a medium CCGTin Bayamon (see Exhibit 8-54).
The need for peaking capacity is somewhat larger compared to Scenario 4 over the planningperiod due to the higher renewable penetration, with an incremental 242 MW more ofpeakers (over the period 2019 -2022 values are similar). San Juan 5 & 6 are not converted togas since in this Scenario assumes no new gas terminals are added to the island. San Juan6 is retired in 2023 and San Juan 5, ten years later in 2033, under the base load case.
Under strategy 1 (a centralized plan), the expansion plan is very similar, both in terms of solarPV and storage additions, as well as CCGT capacity. Overall system costs are slightly lowerbut the risk and costs from unserved energy due to a disruptive hurricane are larger (seeExhibit 8-54).
The plan is MATS compliant after 2024 and achieves 81% RPS compliance by 2038 (muchhigher than Scenario 4 or the ESM, with most of the new capacity coming from solar andstorage.
Exhibit 8-55: Scenario 1 Base Load Capacity Additions
Capcacity by technology MW 2019 2020 2021 2022 2023 2024 2025 2026 2027 2028 2029
Large CCGT's 0 0 0 0 0 0 302 0 0 302 0Medium CCGT's 0 0 0 0 0 0 0 0 0 0 0Small CCGT's 0 0 0 0 0 0 0 0 0 0 0Peakers 0 0 373 23 23 62 0 0 0 39 23BESS 180 300 300 340 0 40 0 0 0 0 20Total Distchable Additions 180 300 673 363 23 102 302 0 0 341 43Solar 0 300 300 600 600 600 600 180 0 540 0Total Additions 180 600 973 963 623 702 902 180 0 881 43

Resource Plan Development
8-52 Siemens Industry, Inc. – Siemens Power Technologies International
Exhibit 8-56: Scenario 1 Base Load Capacity Retirements
Exhibit 8-57: Scenario 1, Future Capacity Mix
Capcacity by technology MW 2019 2020 2021 2022 2023 2024 2025 2026 2027 2028 2029
PREPA Steam (HFO) 862 0 300 0 301 0 0 0 0 0 0PREPA MATS Affected units remaining 0 0 0 0 0 0PREPA Costa Sur (Gas) 0 0 0 339 0 0 0 0 0 0 0PREPA Diesel CC & large GTs 257 249 0 0 200 0 0 0 0 0 0PREPA CC-converted (Gas) 0 0 0 0 0 0 0 0 0 0 0EcoElectrica 0 0 0 0 0 507 0 0 0 0 0AES 416 0 0Total Dependable Gen Retirement 1119 249 300 339 501 507 0 0 416 0 0

Resource Plan Development
Siemens Industry, Inc. – Siemens Power Technologies International 8-53
As PREPA’s units and the thermal PPOA’s are phased out, the operating reserves declinefrom 77% in 2019 to a low of 46% by 2025. The Planning Reserve Margin of 30% appearsnot to have been binding constraint on the LTCE plan formulation in this Scenario andobserves a minimum of 41% in 2025.
8.4.1.1 Sensitivity ConsiderationsThe Siemens team evaluated sensitivities under Scenario 1 to isolate the impacts of certainimportant variables while holding other assumptions constant. For the 2018 IRP, threesensitivities were modeled: low costs of solar and storage, low energy efficiency andeconomic retirements of AES.
Under low costs of renewables, there is a modest increase of 120 MW in solar additions and560 MW from storage. This illustrates that even with lower costs of solar; an optimal amountof solar is installed under the base load case. In the case with low EE penetration, there is300 MW of additional solar but 300 MW less storage.
Fuel DiversityIn line with the change in the energy supply matrix, the system moves away from heavyfuel oil and coal to natural gas and diesel along with a sharp drop in overall fuelconsumption and associated costs with the implementation of the plan. By 2038, 80% ofthe generation is coming from renewables.
Fuel consumption declines with the retirement of old gas and heavy fuel oil units and peakersalong with EcoEléctrica’s retirement by the end of 2024. Overall fuel consumption continuesto fall through 2038 despite the new CCGTs install in Costa Sur in 2025-2028. Total fuelconsumption drops to 20% by 2038 with most of the fuel used coming from natural gas.
Fuel costs decline in line with the overall fall in fuel consumption falling to a low of $484million by 2038 (60% below 2019 levels) with all the retirements, including AES. In thisScenario, 16% of the total fuel costs still come from diesel generation by 2038.
Exhibit 8-58: Scenario 1 Fuel Consumption

Resource Plan Development
8-54 Siemens Industry, Inc. – Siemens Power Technologies International
Exhibit 8-59: Scenario 1 Fuel Costs
System CostsThe total cost of supply in real dollars including annualized capital costs, fuel costs, fixed andvariable O&M is projected to decline with the implementation of the plan from $ 103.4/MWh in2019 to $99.5/MWh by 2026 (real $2018), prior to AES Coal retirement, with the addition ofsolar and storage and the retirement of older generation. The costs increased in 2028 to$108.6/MWh with the addition of the new CCGT. The, system costs decline with falling fuelcosts to reach $100.0/MWh by 2038.
The net present value of all operating costs reaches $10.9 billion for 2019-2028 (nominal @9% rate). Over the study period, the NPV is $15.4 billion. This plan is $917 million moreexpansive compared to the reference Scenario 4, primarily due to higher capital investmentcosts with a lot more renewables and fuel costs with more diesel in the mix.

Resource Plan Development
Siemens Industry, Inc. – Siemens Power Technologies International 8-55
Exhibit 8-60: Scenario 1 Production Costs
RPS ComplianceThe renewable portfolio standard targets of 12% by 2022, 15% by 2027 and 20% by 2035are all met and exceeded in the Scenario 1 base case under all strategies. The plan achieved81% renewable penetration by 2038, far exceeding the proposed regulatory goal of 50%renewable generation by 2040. This plan achieves much higher renewable contribution thanScenario 4.
Exhibit 8-61: Scenario 1 RPS Compliance

Resource Plan Development
8-56 Siemens Industry, Inc. – Siemens Power Technologies International
Rate ImpactIn the sections above, we presented the composition of least cost portfolio formulated underthe Scenario 1, Strategy 2 (S1S2) Base Case.
In this section and as was done before, we estimate the potential impact of the ESM portfolioon the final rates to customers; and compare the resulting final rates with the possible coststhat the customers would incur for self-supply and other customer based alternatives.
The comparison is made considering the “Rate Components” presented earlier (see Scenario4 Rate Impact)
Results of Comparison to Customer Based AlternativesIn this section we describe the results of the analysis we performed comparing the final S1S2rates to unit costs for customer based alternatives.
The S1S2 generation portfolio costs are higher than those of the S4S2 costs, but thecomparison observations and inferences remain largely the same as those for the S4S2 rateimpact analysis. The comparison analysis results are illustrated in Exhibit 8-62, and aresummarized below:
µ The unit costs for all the customer alternatives considered are lower than the final all-in S1S2 generation portfolio rate.
µ The levelized cost of customer alternatives (especially Solar PV and Grid Defection)is higher than the cost of the generation delivered to the customer and that includesthe effect of losses until 2028 (when AES Coal retires). However, this cost issignificantly lower than the total rate.
µ These results also indicate that, given PREPA’s forecasted non-bypassable ratecomponent, coupled with the expected reduction in renewable generation costs, thecustomers may be motivated to self-supply if they are able to raise the capitalinvestment required for installing the self-supply option or if a developer installs theequipment and recovers the investment through leases or other financing options.
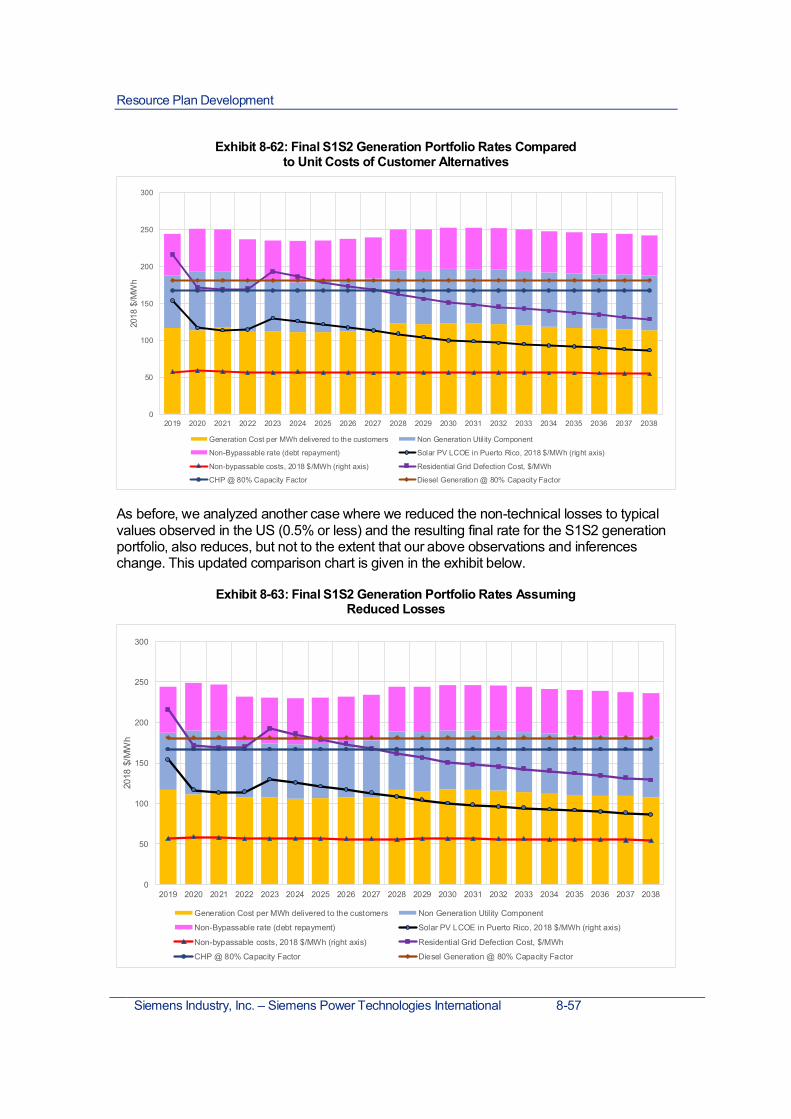
Resource Plan Development
Siemens Industry, Inc. – Siemens Power Technologies International 8-57
Exhibit 8-62: Final S1S2 Generation Portfolio Rates Comparedto Unit Costs of Customer Alternatives
As before, we analyzed another case where we reduced the non-technical losses to typicalvalues observed in the US (0.5% or less) and the resulting final rate for the S1S2 generationportfolio, also reduces, but not to the extent that our above observations and inferenceschange. This updated comparison chart is given in the exhibit below.
Exhibit 8-63: Final S1S2 Generation Portfolio Rates AssumingReduced Losses
0
50
100
150
200
250
300
2019 2020 2021 2022 2023 2024 2025 2026 2027 2028 2029 2030 2031 2032 2033 2034 2035 2036 2037 2038
2018
$/M
Wh
Generation Cost per MWh delivered to the customers Non Generation Utility Component
Non-Bypassable rate (debt repayment) Solar PV LCOE in Puerto Rico, 2018 $/MWh (right axis)
Non-bypassable costs, 2018 $/MWh (right axis) Residential Grid Defection Cost, $/MWh
CHP @ 80% Capacity Factor Diesel Generation @ 80% Capacity Factor

Resource Plan Development
8-58 Siemens Industry, Inc. – Siemens Power Technologies International
Nodal Analysis of the S1S2BThe nodal assessment highlighted the difficulty to manage the storage to integrate the largeamounts of renewable in the case and potentially lead to large curtailment. The nodal runsused a different strategy to dispatch the storage that resulted in high levels of curtailment andincrease in costs. We are not of the opinion that the results below are realistic and to beexpected, but rather highlight this difficulty and risk. We are reviewing the dispatch logic andas a follow up of this report, we will provide an update. We expect that the curtailment will bein line with the long term capacity expansion plan and/or more storage will be required for theintegration. The technical loss reduction was also noted with values similar as before.
Exhibit 8-64: Production Costs Nodal vs. Zonal and RenewableCurtailment
Scenario 3 Base Case Results
Capacity Additions and RetirementsThe generation portfolio identified as Scenario 3 Strategy 2 (S3S2) result in a plan that haslower production costs as compared to the Scenario 4 and the ESM. The portfolio has a goodbalance of resources for a distributed system on a minigrid level capable of supplying thecritical and priority loads for the customer in an event of a major disruptive hurricane.
However, the implementation of 4,020 MW of solar in a system with a 2,200 MW peakdemand would be a significant challenge and could be difficult to achieve for practicalreasons. The operation of the system would be a challenge with such a high level of solarpenetration and its natural variability, increasing the risk of curtailment (that would negatesome of the perceived economies) and putting strain and reliance on the energy storage.
The Scenario assumes lower capital investment costs for solar and storage (NREL LowCase) coupled with high availability of renewables (early ramp up). It also assumes gasavailable at Yabucoa (east) and Mayagüez (west) through ship-based LNG, in addition to gas
-40%
-20%
0%
20%
40%
60%
80%
50.00
60.00
70.00
80.00
90.00
100.00
110.00
120.00
130.00
2019 2020 2021 2022 2023 2024 2025 2026 2027 2028 2029 2030 2031 2032 2033 2034 2035 2036 2037 2038
Tota
l201
7$/M
Wh
Real
S1S2B Production Costs & Renewable Curtailment
NODAL Curtailment LTCE Curtailment S1S2BNODAL
S1S2BLTCE
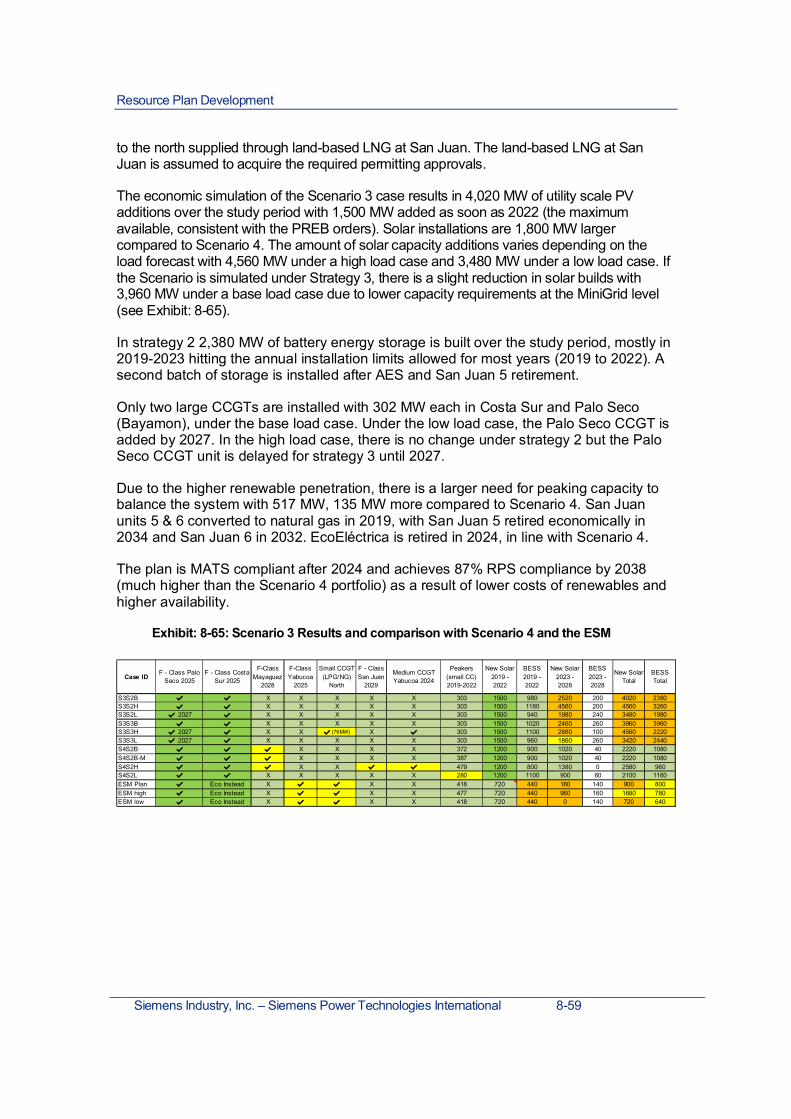
Resource Plan Development
Siemens Industry, Inc. – Siemens Power Technologies International 8-59
to the north supplied through land-based LNG at San Juan. The land-based LNG at SanJuan is assumed to acquire the required permitting approvals.
The economic simulation of the Scenario 3 case results in 4,020 MW of utility scale PVadditions over the study period with 1,500 MW added as soon as 2022 (the maximumavailable, consistent with the PREB orders). Solar installations are 1,800 MW largercompared to Scenario 4. The amount of solar capacity additions varies depending on theload forecast with 4,560 MW under a high load case and 3,480 MW under a low load case. Ifthe Scenario is simulated under Strategy 3, there is a slight reduction in solar builds with3,960 MW under a base load case due to lower capacity requirements at the MiniGrid level(see Exhibit: 8-65).
In strategy 2 2,380 MW of battery energy storage is built over the study period, mostly in2019-2023 hitting the annual installation limits allowed for most years (2019 to 2022). Asecond batch of storage is installed after AES and San Juan 5 retirement.
Only two large CCGTs are installed with 302 MW each in Costa Sur and Palo Seco(Bayamon), under the base load case. Under the low load case, the Palo Seco CCGT isadded by 2027. In the high load case, there is no change under strategy 2 but the PaloSeco CCGT unit is delayed for strategy 3 until 2027.
Due to the higher renewable penetration, there is a larger need for peaking capacity tobalance the system with 517 MW, 135 MW more compared to Scenario 4. San Juanunits 5 & 6 converted to natural gas in 2019, with San Juan 5 retired economically in2034 and San Juan 6 in 2032. EcoEléctrica is retired in 2024, in line with Scenario 4.
The plan is MATS compliant after 2024 and achieves 87% RPS compliance by 2038(much higher than the Scenario 4 portfolio) as a result of lower costs of renewables andhigher availability.
Exhibit: 8-65: Scenario 3 Results and comparison with Scenario 4 and the ESM
Case IDF - Class Palo
Seco 2025F - Class Costa
Sur 2025
F-ClassMayaguez
2028
F-ClassYabucoa
2025
Small CCGT(LPG/NG)
North
F - ClassSan Juan
2029
Medium CCGTYabucoa 2024
Peakers(small CC)2019-2022
New Solar2019 -2022
BESS2019 -2022
New Solar2023 -2028
BESS2023 -2028
New SolarTotal
BESSTotal
S3S2B ✔ ✔ X X X X X 303 1500 980 2520 200 4020 2380S3S2H ✔ ✔ X X X X X 303 1500 1180 4560 200 4560 3260S3S2L ✔ 2027 ✔ X X X X X 303 1500 940 1980 240 3480 1980S3S3B ✔ ✔ X X X X X 303 1500 1020 2460 260 3960 3960S3S3H ✔ 2027 ✔ X X ✔(76MW) X ✔ 303 1500 1100 2880 100 4560 2220S3S3L ✔ 2027 ✔ X X X X X 303 1500 960 1860 260 3420 2440S4S2B ✔ ✔ ✔ X X X X 372 1200 900 1020 40 2220 1080S4S2B-M ✔ ✔ ✔ X X X X 387 1200 900 1020 40 2220 1080S4S2H ✔ ✔ ✔ X X ✔ ✔ 479 1200 800 1380 0 2580 960S4S2L ✔ ✔ X X X X X 280 1200 1100 900 60 2100 1160ESM Plan ✔ Eco Instead X ✔ ✔ X X 418 720 440 180 140 900 800ESM high ✔ Eco Instead X ✔ ✔ X X 477 720 440 960 160 1680 780ESM low ✔ Eco Instead X ✔ ✔ X X 418 720 440 0 140 720 640
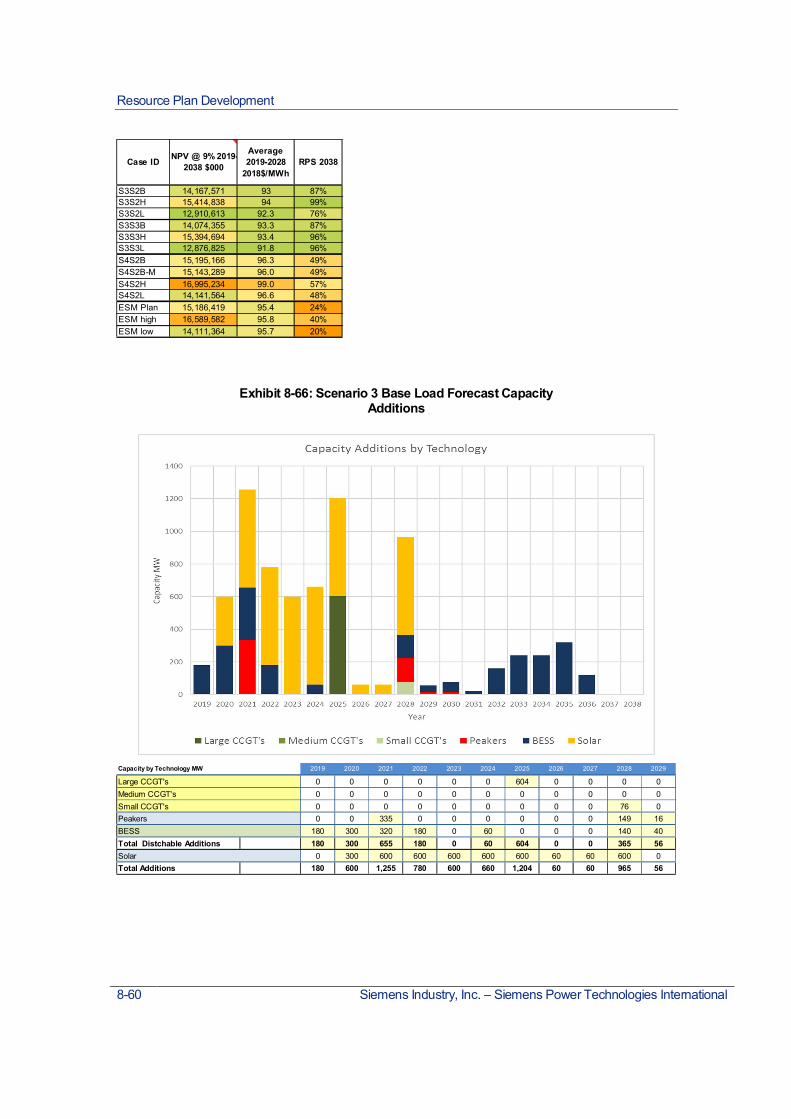
Resource Plan Development
8-60 Siemens Industry, Inc. – Siemens Power Technologies International
Exhibit 8-66: Scenario 3 Base Load Forecast CapacityAdditions
Case ID NPV @ 9% 2019-2038 $000
Average2019-2028
2018$/MWhRPS 2038
S3S2B 14,167,571 93 87%S3S2H 15,414,838 94 99%S3S2L 12,910,613 92.3 76%S3S3B 14,074,355 93.3 87%S3S3H 15,394,694 93.4 96%S3S3L 12,876,825 91.8 96%S4S2B 15,195,166 96.3 49%S4S2B-M 15,143,289 96.0 49%S4S2H 16,995,234 99.0 57%S4S2L 14,141,564 96.6 48%ESM Plan 15,186,419 95.4 24%ESM high 16,589,582 95.8 40%ESM low 14,111,364 95.7 20%
Capacity by Technology MW 2019 2020 2021 2022 2023 2024 2025 2026 2027 2028 2029
Large CCGT's 0 0 0 0 0 0 604 0 0 0 0Medium CCGT's 0 0 0 0 0 0 0 0 0 0 0Small CCGT's 0 0 0 0 0 0 0 0 0 76 0Peakers 0 0 335 0 0 0 0 0 0 149 16BESS 180 300 320 180 0 60 0 0 0 140 40Total Distchable Additions 180 300 655 180 0 60 604 0 0 365 56Solar 0 300 600 600 600 600 600 60 60 600 0Total Additions 180 600 1,255 780 600 660 1,204 60 60 965 56

Resource Plan Development
Siemens Industry, Inc. – Siemens Power Technologies International 8-61
Exhibit 8-67: Scenario 3 Base Load Forecast CapacityRetirements
As PREPA’s units and the thermal PPOA’s are phased out the operating reserves declinefrom 87% in 2019 to a low of 41% by 2024, after EcoEléctrica’s retirement. The PlanningReserve Margin of 30% appears not to have been binding constraint on the LTCE planformulation in this Scenario and observes a minimum of 38% in 2024.
Capacity by Technology MW 2019 2020 2021 2022 2023 2024 2025 2026 2027 2028 2029
PREPA Steam (HFO) 1050 0 206 0 206 0 0 0 0 0 0PREPA MATS Affected units remaining 0 0 0 0 0 0PREPA Costa Sur (Gas) 0 393 0 388 0 0 0 0 0 0 0PREPA Diesel CC & large GTs 0 257 249 0 250 0 0 0 0 0 0PREPA CC-converted (Gas) 0 0 0 0 0 0 0 0 0 0 0EcoElectrica 0 0 0 0 0 507 0 0 0 0 0AES 416 0 0Total Dependable Gen Retirement 1050 650 455 388 456 507 0 0 416 0 0

Resource Plan Development
8-62 Siemens Industry, Inc. – Siemens Power Technologies International
Exhibit 8-68: Scenario 3 Future Capacity Mix
Fuel diversityIn line with the change in the energy supply matrix, the system moves away from heavy fueloil and coal to natural gas along with a sharp drop in overall fuel consumption and associatedcosts with the implementation of the plan. By 2038, 82% of the generation is coming fromrenewables.
Fuel consumption declines with the retirements of old gas and heavy fuel oil units andpeakers along with EcoEléctrica’s retirement by the end of 2024. Overall fuel consumptioncontinues to fall through 2038 despite the new CCGTs in Palo Seco and Costa Sur in 2025.Total fuel consumption drops 85% by 2038 with most of the fuel used coming from naturalgas.

Resource Plan Development
Siemens Industry, Inc. – Siemens Power Technologies International 8-63
Exhibit 8-69: Scenario 3 Fuel Consumption
Fuel costs decline in line with the overall fall in fuel consumption falling to a low of $307million by 2038 (74% below 2019 levels) with all the retirements, including AES.
Exhibit 8-70: Scenario 3 Fuel Consumption
RPS ComplianceThe renewable portfolio standard targets of 12% by 2022, 15% by 2027 and 20% by 2035are all met and exceeded in the Scenario 3 base case under all strategies. The plan achieved87% renewable penetration by 2038, far exceeding the proposed regulatory goal of 50%renewable generation by 2040.

Resource Plan Development
8-64 Siemens Industry, Inc. – Siemens Power Technologies International
Exhibit 8-71: RPS Compliance Scenario 3
System CostsThe total cost of supply in real dollars including annualized capital costs, fuel costs, fixed andvariable O&M is projected to decline with the implementation of the plan from $ 102.5/MWh in2019 to $89.8/MWh by 2027 (real $2018), prior to AES Coal retirement. The costs increasedin 2028 with the addition of 600 MW of new solar and 126 MW of peakers to fall again in the2030s due to falling fuel costs to reach $87.7/MWh by 2038.
The net present value of all operating costs reaches $10.1 billion for 2019-2028 (nominal @9% rate). Over the study period, the NPV is $14.1 billion. This plan is 2.5% lower in costsover the study horizon.

Resource Plan Development
Siemens Industry, Inc. – Siemens Power Technologies International 8-65
Exhibit 8-72: Scenario 3 Production Costs
Resiliency (Mini Grid Considerations)In Scenario 3 plan, the critical loads are met by 2021. After 2022, both critical and priorityloads are met for most MiniGrid regions.
Siemens estimated the potential costs from unserved energy in the case of a major hurricaneimpacting the transmission system63. It is assumed that a major hurricane occurs every fiveyears impacting major interconnection transmission lines and placing the system intoMiniGrids operation for 1 Month, starting in 2022. It is based on a $2000/MWh cost fromunserved energy, which considers that the load shedding will be rotated to minimize impact.The $2000 is consistent with the cost of unserved energy for residential customers64.
Exhibit 8-20 summarizes the economic costs by MiniGrid region for Scenario 3. There arepotential costs for San Juan-Bayamon and Caguas and to a lesser extend in MayagüezNorth. Overall, there is an incremental 80 million in potential costs from unserved energy inthe case of a major hurricane impacting the island under this plan. This is much lowercompared to $228 million for Scenario 4.
63 This cost is NOT a forecast of future cost, but rather a high-level determination of how the different portfoliosresulting from the combination of Scenarios and strategies would perform if every 5 years starting in 2022 a majorhurricane impact the island resulting in the operation of the MiniGrids for one month (“Deemed Energy Not Served”)
64 This value is much lower compared to the VOLL determined for PR, in the range of $30,000/MWh

Resource Plan Development
8-66 Siemens Industry, Inc. – Siemens Power Technologies International
Exhibit 8-73: Cost of Energy Not Served by MiniGrids
Scenario 5 Base Case ResultsScenario 5 is a case requested by the Energy Bureau to evaluate how the capacityexpansion would look with minimal restrictions. For this Scenario, in addition to the LNGterminal considered in Scenario 4, the Aguirre Offshore Gas Port (AOGP) is assumed toachieve full permitting and regulatory approval and can move forward. In line with the minimalrestriction approach, the Scenario reflects a traditional and centralized energy program thatemphasizes economic and reliability on a system integrated basis (Strategy 1) withoutminimum generation requirements to meet peak demand on a regional basis.
Other assumptions in the simulation of this Scenario includes gas to Yabucoa (east) andMayagüez (west) through ship-based LNG, as well as gas to the north through land-basedLNG at San Juan. The Scenario uses the base case assumption of solar and storage costsand availability. In addition, a larger combined cycle (H-class) could be built in this Scenario.
The generation portfolio identified as Scenario 5 Strategy 1 result in a plan that has lowerproduction costs as compared to Scenario 4, about $426 million below. However, thepotential costs reductions could be fully offset if the transmission network is impacted by amajor hurricane placing the system into MiniGrid operations (the system is segmented inareas). A high-level estimate of the impact shows $1.1 billion of potential costs from energynot served during a month while the transmission system is repaired.
Capacity Additions and RetirementsThe economic simulation of the Scenario 5 results in 2,160 MW of utility scale PV additionsover the study period, only 60 MW below Scenario 4 plan. There is 1,200 MW in 2019-2022,hitting allowed yearly limits, in line with Scenario 4.
In this Scenario, 1,020 MW of battery energy storage is built over the study period, mostly in2019-2022, reaching the annual installation limits in that period, in line with the plan forScenario 4.
MiniGrid NPV Cost ($000) Strategy 2San Juan-Bayamon 32,101$ 8,874$Ponce -$ -$Carolina -$ 40,737$Caguas 46,423$ 127,850$Arecibo -$ 25,110$Mayaguez-North 1,573$ 518$Mayaguez-South -$ -$Cayey -$ 25,196$Total 80,098$ 228,285$
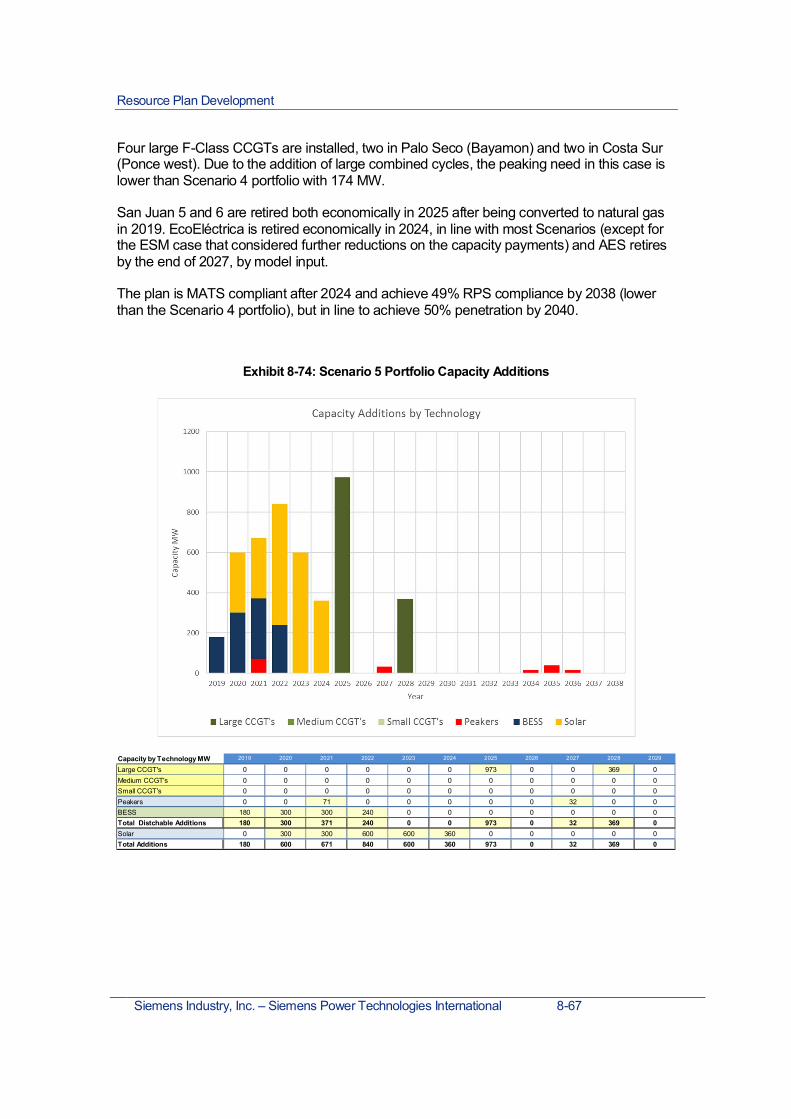
Resource Plan Development
Siemens Industry, Inc. – Siemens Power Technologies International 8-67
Four large F-Class CCGTs are installed, two in Palo Seco (Bayamon) and two in Costa Sur(Ponce west). Due to the addition of large combined cycles, the peaking need in this case islower than Scenario 4 portfolio with 174 MW.
San Juan 5 and 6 are retired both economically in 2025 after being converted to natural gasin 2019. EcoEléctrica is retired economically in 2024, in line with most Scenarios (except forthe ESM case that considered further reductions on the capacity payments) and AES retiresby the end of 2027, by model input.
The plan is MATS compliant after 2024 and achieve 49% RPS compliance by 2038 (lowerthan the Scenario 4 portfolio), but in line to achieve 50% penetration by 2040.
Exhibit 8-74: Scenario 5 Portfolio Capacity Additions
Capacity by Technology MW 2019 2020 2021 2022 2023 2024 2025 2026 2027 2028 2029
Large CCGT's 0 0 0 0 0 0 973 0 0 369 0Medium CCGT's 0 0 0 0 0 0 0 0 0 0 0Small CCGT's 0 0 0 0 0 0 0 0 0 0 0Peakers 0 0 71 0 0 0 0 0 32 0 0BESS 180 300 300 240 0 0 0 0 0 0 0Total Distchable Additions 180 300 371 240 0 0 973 0 32 369 0Solar 0 300 300 600 600 360 0 0 0 0 0Total Additions 180 600 671 840 600 360 973 0 32 369 0

Resource Plan Development
8-68 Siemens Industry, Inc. – Siemens Power Technologies International
Exhibit 8-75: Scenario 5 Portfolio Capacity Retirements
As PREPA’s units and the thermal PPOA’s are phased out the operating reserves declinefrom 64% in 2019 to a low of 31% by 2028 with the retirement of AES. The Planning ReserveMargin of 30% appears to have a binding constraint on the LTCE plan formulation in thisScenario with reserve margins for the system falling near this threshold in 2027-2028 and2035, however only in 2035 we observe new peaking generation being committed.
Capacity by Technology MW 2019 2020 2021 2022 2023 2024 2025 2026 2027 2028 2029
PREPA Steam (HFO) 862 0 301 0 300 0 0 0 0 0 0PREPA MATS Affected units remaining 0 0 0 0 0 0PREPA Costa Sur (Gas) 0 393 0 388 0 0 0 0 0 0 0PREPA Diesel CC & large GTs 0 0 50 0 165 50 307 0 0 0 0PREPA CC-converted (Gas) 0 0 0 0 0 0 400 0 0 0 0EcoElectrica 0 0 0 0 0 507 0 0 0 0 0AES 416 0 0Total Dependable Gen Retirement 862 393 351 388 465 557 707 0 416 0 0

Resource Plan Development
Siemens Industry, Inc. – Siemens Power Technologies International 8-69
Exhibit 8-76: Scenario 5 Capacity Mix
Fuel DiversityIn line with the change in the energy supply matrix, the system moves away from heavy fueloil and coal to natural gas along with a sharp drop in overall fuel consumption and associatedcosts with the implementation of the plan. Fuel consumption declines with the retirements ofold gas and heavy fuel oil units and peakers along with EcoEléctrica’s retirement by the endof 2024. Total fuel consumption drops 69% by 2038 with most of the fuel used coming fromnatural gas.
Fuel costs decline in line with the overall fall in fuel consumption falling to a low of $592million by 2038 (51% below 2019 levels) with all the retirements, including AES.

Resource Plan Development
8-70 Siemens Industry, Inc. – Siemens Power Technologies International
Exhibit 8-77: Scenario 5 Fuel Mix
Exhibit 8-78: Scenario 5 Fuel Costs
RPS ComplianceThe renewable portfolio standard targets of 12% by 2022, 15% by 2027 and 20% by 2035are all met and exceeded in Scenario 5. The plan achieves 49% renewable penetration by2038, in line to reach the proposed 50% renewable generation by 2040.

Resource Plan Development
Siemens Industry, Inc. – Siemens Power Technologies International 8-71
Exhibit 8-79: Scenario 5 RPS Compliance
System CostsThe total cost of supply in real dollars including annualized capital costs, fuel costs, fixed andvariable O&M is projected to decline with the implementation of the plan from $102/MWh in2019 to $86.2/MWh by 2026 (real $2018), prior to AES Coal retirement, with the addition ofsolar and storage and the retirement of older generation. The costs increased in 2028 withAES retirement and the addition of the new CCGT. System costs fall in the last 10 yearsprimarily due to falling fuel costs to reach $88.6/MWh by 2038.
The net present value of all operating costs reaches $10.1 billion for 2019-2028 (nominal @9% rate). Over the study period, the NPV is $14.09 billion. This plan is 3% lower in costs overthe study horizon compared to Scenario 4.
Exhibit 8-80: Scenario 5 System Costs

Resource Plan Development
8-72 Siemens Industry, Inc. – Siemens Power Technologies International
Resiliency (Mini Grid Considerations)In Scenario 5 plan, the critical loads are not met with thermal resources on most MiniGrids,are not met with local generation while the plan is being developed in 2019 through 2022.After 2022, both loads are met for most MiniGrid regions.
Siemens estimated the potential costs from unserved energy in the case of a major hurricaneimpacting the transmission system65. It is assumed that a major hurricane occurs every fiveyears impacting major interconnection transmission lines and placing the system intoMiniGrids operation for 1 Month, starting in 2022. It is based on a $2000/MWh cost fromunserved energy, which considers that the load shedding will be rotated to minimize impact.The $2000 is consistent with the cost of unserved energy for residential customers66.
Exhibit 8-81 summarizes the economic costs by MiniGrid region for Scenario 5. There arepotential costs for most regions, in particular Caguas, Arecibo and Mayagüez North showingthe latest potential impact and costs. Total costs for the system are north of $1.1 billion, $914million higher than Scenario 4, basically illustrating the risks to the system of going into acentralized system.
Exhibit 8-81: Cost of Energy Not Served by MiniGrids (NPVCosts $000)
Considerations Under High Gas PricesThe Siemens team simulated Scenario 5 under a high gas price case. This resulted in lowergas-fired capacity additions with only two CCGTs being developed, one in Palo Seco and theother one in Costa Sur, both in 2025. Under the high gas case, there is also more peakersadded to the system with 374 MW in the planning period, 200 MW higher compared to casewith reference gas prices.
65 This cost is NOT a forecast of future cost, but rather a high-level determination of how the different portfoliosresulting from the combination of Scenarios and strategies would perform if every 5 years starting in 2022 a majorhurricane impact the island resulting in the operation of the MiniGrids for one month (“Deemed Energy Not Served”)
66 This value is much lower compared to the VOLL determined for PR, in the range of $30,000/MWh
MiniGrid Scenario 5 Scenario 4San Juan-Bayamon 238,176$ 8,874$Ponce -$ -$Carolina 79,227$ 40,737$Caguas 365,690$ 127,850$Arecibo 210,830$ 25,110$Mayaguez-North 110,049$ 518$Mayaguez-South 71,954$ -$Cayey 66,526$ 25,196$Total 1,142,452$ 228,285$

Resource Plan Development
Siemens Industry, Inc. – Siemens Power Technologies International 8-73
There is 180 MW of incremental solar capacity additions supported by an additional 380 MWof battery storage. Solar additions do not change in 2019-2022 with 1,200 MW added.
The overall portfolio costs $648 million higher compared to the simulation with reference gasprices, making the overall portfolio more expensive than Scenario 4. The risk of havingunserved load under MiniGrid operations is somewhat reduced with more peakers with anestimated $799 million in costs from unserved energy, $115 million below the simulation withreference gas prices.
Planning Reserve Margin Considerations
IntroductionThe purpose of this subsection is to discuss Planning Reserve Margin (PRM) in more depth.
As was illustrated above the adopted PRM of 30% was found not to be binding under mostconditions and in particular for the plans that are considered to contain the recommendeddecisions; Scenario 4 Strategy 2 with modifications and the ESM plan. However, in thissection we review those conditions in which PRM was binding and resulted in new builds. Inaddition, we provide indication of values to which this PRM could be lowered in the future.
To identify Scenarios where PRM was binding, the reserve margin for all Scenarios andcases was investigated for all years. For cases where the reserves level was close to 30%(PRM) we evaluated if new peaker units were built in response to the low reserve levels. Itshould be noted here that for the preferred portfolios, S4S2B-M and ESM, PRM was never abinding constraint, i.e. it did not explicitly trigger new peaker units builds. The cases wherePRM was a binding constraint are discussed below.
Binding Planning Reserve Margin CasesAmong all the available portfolios, the following cases were found to have binding PRMconditions, which resulted in new builds.
8.7.2.1 S3S3BIn this portfolio, the PRM level dropped to 31.6% in 2024, taking into consideration demandresponse with a value of 2.6% of peak demand. This drop can be explained due to theretirement of steam (HFO) and diesel CCGT units; a total of 606 MW. In 2025, EcoEléctrica(507 MW) is retired and two (2) new large CCGT gas units (604 MW) were added. Inaddition, two (2) reciprocating diesel units, 16 MW each, were added in 2025. Because ofthese additions, the PRM level increased to 39.6% in 2025 (including a demand response of2.8% of peak demand). It is possible that the peakers were triggered by the reduction inreserves, however most of the additions are economic, as in 2025 new CCGT’s can comeonline.
As indicated earlier, Scenario 3 is a low cost Scenario, as compared with Scenario 4, but itcontains levels of renewable generation that will be hard to integrate and assumes deeperreduction on renewable. Hence the entry or not of the peakers above did not change theopinion on this case.

Resource Plan Development
8-74 Siemens Industry, Inc. – Siemens Power Technologies International
8.7.2.2 S3S3HIn this portfolio, the PRM level was reported as 32.9% in 2026, including a demand responseof 2.9% of peak demand. In 2027 and 2028 AES units (454 MW) were retired and one (1)new large CCGT gas unit (302 MW) was added. In addition, ten (10) peaker units with a totalof 213 MW were added in the years 2027 and 2028, bringing the PRM to 43.7% in 2028(including a demand response of 3.1% of peak demand). Again, the PRM could have beenbinding, but the addition of the CCGT is triggered by economics and retirement of AES.
As indicated earlier Scenario 3 is a low cost Scenario, as compared with Scenario 4, but itcontains levels of renewable generation that will be hard to integrate and assumes deeperreduction on renewable. Hence the entry or not of the peakers above did not change theopinion on this case.
8.7.2.3 S4S3BIn the existing S4S3B portfolio, from year 2025 into year 2028 there was a total of 1160 MWof thermal generation retirements at San Juan 6 CC, AES 1&2, and diesel CCGT units, whileone (1) new large CCGT gas unit (302 MW) was added. In addition, four (4) peaker units witha total of 115 MW were added in the years 2026 to 2028, bringing the PRM to 31.1% in 2028(including a demand response of 3.1% of peak demand). In this case the PRM was bidingand was investigated further as described below.
8.7.2.4 S4S1BIn this portfolio, in year 2032 there was a total of 514 MW of thermal generation retirements atPREPA’s existing diesel CCGT and GT units. The only thermal new units added in 2032 wasa 16 MW diesel reciprocal unit, which brings the PRM to 33.2% in 2032, including a demandresponse of 3.5% of peak demand. The effect is marginal and towards the end of the period.Also, strategy 1 does not provides adequate levels of local reserves for resiliency.
8.7.2.5 S5S1BIn the existing S5S1B portfolio, in 2027 AES was retired and new generation was added.capacity of 38 MW at AES units, in addition to adding two (2) diesel reciprocating engineswith a total capacity of 32 MW. As a result, PRM was reported as 33.6% in 2027, including ademand response of 3.0% of peak demand.
Planning Reserve Margin Sensitivity AnalysisPRM was a binding constraint and triggered new peaker unit additions in limited cases. Formost of the years PRM was not binding despite of the relatively low reserve levels for reasonsdiscussed in the previous subsection. To examine the impact of reductions in the PRM, thesame portfolio discussed above, S4S3B was assessed for the year 2028 with reduced levelsof reserves, as discussed below:
1. Control Case: this case represents the original conditions in portfolio S4S3B, i.e. nochanges made. As mentioned previously, the PRM level is 31.1% (including 3.1% ofdemand response) and without any unserved load reported.
2. The new peaking units built in 2027 and 2028 were removed 115 MW. The unitsinclude:
Resource Plan Development
Siemens Industry, Inc. – Siemens Power Technologies International 8-75
a. Two (2) Aero LM6000 units: each unit has a capacity of 39 MW and theywere added in 2027 and 2028.
b. One (1) Aero GE LM2500 unit: this peaker unit has a capacity of 21 MWand was built in 2027.
c. One (1) RICE: this unit has a capacity of 16 MW and was built in 2028.
Because of not building these four peaking units, the PRM level dropped to26.9%. However, no unserved load was reported. Hence in principle a 27% PRMcould have been selected and he units above possibly may not have been built.
3. In addition to not including the generation above, the Cambalache CT2 and CT3 wereretired earlier (165 MW) in 2028. As a result, the PRM level dropped to 23.2%, andan unserved load of 102 MWh over 8 hours was reported. The total reported savingsfor this case is estimated to be $31.3 million, while the unserved energy cost is $3.1million. However, PREPA’s planning limit of 4 loss of load hours (LOLH) is exceeded.It should be noted that for this case, all the unserved load is reported in CarolinaArea. Based on the above a PRM of 23% would be aggressive.
4. In this final test two (2) peaker GTs (100 MW) at Mayagüez were also removed. Thereserve dropped under 20% and there was 3621 MWh of unserved load over 123hours. Not only the unserved duration greatly exceeds the 8 hour limit, but also theunserved load cost ($109 million) exceeds the potential savings ($35.3 million). Forthis case, the entire unserved load is reported in Carolina and Bayamon Areas(mostly in Carolina).
Siemens is of the opinion that the PRM of 30% was adequate for this study, however, it wasdesired to investigate the impact of lower PRM in the LTCE optimal calculations to identifyconditions in which PRM becomes a binding constraint. Therefore, analysis was conductedagain for portfolio S4S3B with a PRM target value of 20%.
The LTCE resulting from this optimization had in fact higher levels of reserves reportedcompared to previous solutions in which the PRM target was set to 30%. This increase inreserve levels despite using lower PRM target is mainly caused by the optimization algorithmthat was able to find an slightly better solution in which the PRM again is not a bindingconstraint and confirmed that it had minimal impact on the overall results. Further review ofthis run identified that in the years 2026 to 2030 there was a net capacity increase of 197MW, which resulted in increasing the PRM level from 44% to 54%. On the other hand, in theyears 2030 to 2032 there was a net capacity reduction of 477 MW in the form of retirements,which resulted in reducing the PRM level from 54% to 30%.
Based on the sensitivity analysis results presented above, it can be concluded that PRMdoes not have a noticeable impact on the overall solution even when PRM target is reducedto relatively low values, e.g. 20%. The higher reserve levels and lower overall total cost,which were achieved with the 20% PRM target imply that PRM was not a binding constraintand did not trigger new builds.

Caveats and Limitations
Siemens Industry, Inc. – Siemens Power Technologies International 9-1
Part
9Caveats and LimitationsAs was explained before in this report, the 2019 IRP is not a classical IRP designed toidentify the least cost approach to address the expected gap between load and resourcesand maintaining a desired Planning Reserve Margin (PRM), but rather produce a plan thatsatisfies the objectives of providing a service that is customer centric, financially viable, isreliable and resilient, and promotes economic growth. These objectives are to be satisfied ona context of significant declines in the load and of PREPA’s current fiscal situation as a debtorunder the Title III of the PROMESA Act, which requires PREPA to follow a path to complywith healthy financial utility practices. In addition, the devastation to Puerto Rico’s electricalinfrastructure from the 2017 Hurricanes forced PREPA to rethink its entire system design,including resources planning addressing the following:
∂ Existing aging generation infrastructure that burns mostly heavy fuel oil, has poorreliability, does not meet all environmental regulations (e.g. MATS), and is inflexible,which limits the incorporation of renewable resources.
∂ Current and forecasted industry trends showing a reduction in the cost of renewableresources, especially solar photovoltaic (PV) and bulk battery storage.
∂ Achieve compliance with the Renewable Portfolio Standard (RPS) mandate.
∂ Shift from centralized generation located in the south of the island to a moredecentralized generation mix, particularly for achieving a more resilient electricservice.
Taking in consideration the above, through input received during a series of StakeholderWorkshops, discussion with PREPA staff, and Siemens own knowledge and experience withresource planning, the PREPA and Siemens project team defined a number of aspects thatthe resource planning resulting from this IRP must address. These aspects are contained inthe definition of the Strategies, Scenarios and Sensitivities presented in this IRP. Thedevelopment of these strategies, scenarios and sensitivities required the formulation ofassumptions and forecasts, which are also presented in this report.
It is noted that the modeling done as part of this IRP was performed following electric industrystandards and using industry accepted resource planning tools, like AURORAxmp.However, the IRP analyses considered a large number of options and uncertainties, takinginto consideration formal and informal input from both PREPA and a large number ofstakeholders. The inputs used for these analyses, simulations and modeling were based onthe aforementioned assumptions and forecasts. Hence, the modeling results will be validwhile the assumptions are achieved, and the forecasts are fulfilled.

Caveats and Limitations
9-2 Siemens Industry, Inc. – Siemens Power Technologies International
Considering the conditions mentioned above, there are a series of main caveats andlimitations of the IRP, which are summarized in this part. Following, we present a list of thesekey caveats and limitations:
1. The IRP evaluates the highest public good and the protection of the interests of theresidents of Puerto Rico, which may not necessarily be identical to the interests ofPREPA if viewed from a narrow utility perspective.
2. The IRP does not directly address specific asset technology, asset optimization, fueloptimization, procurement, interconnection issues, new contracts, contract re-negotiation, collective bargaining rights, site specifics, or ownership.
3. The IRP does not set rate structures.
4. The IRP does not directly address the debt restructuring process or privatizationplans.
5. The implementation of the Puerto Rico Electric System Transformation Act is aseparate process outside the accelerated timeline of developing the IRP.
6. The IRP was conducted with extensive inputs from a broad group of stakeholdersincluding the public, the customers, under an accelerated timeline and in parallel withmany other related activities but may not consider or fully consider all externalitiesthat are critical for the Preferred Resource Plan implementation or execution.
7. From the Stakeholder Workshops, it was found that stakeholders generally preferreda strategy founded on distributed (Strategy 2) rather than centralized (Strategy 1)supply resources for Puerto Rico’s situation because it provides a more resilient grid,as the supply is located closer to the load. Participants viewed Strategy 3(combination of centralized and distributed generation) as a short- or medium-termstep to Strategy 2. Following the preferences of the stakeholders, the IRP analysesfocused on Strategies 2 and 3 and only one case was run with Strategy 1. It is notedthat the larger centralized resources aligned with Strategy 1 usually provide lowercosts of energy than distributed resources, but depend on the reliability of thetransmission system during a major event like a hurricane. Considering theexperience with the 2017 hurricanes in Puerto Rico, a distributed resources strategywas selected for providing resiliency to the electric service, even though it could resultin higher costs.
8. The load served by PREPA is expected to significantly decline over the IRP’splanning horizon due to a combination of expected base load reduction (driven bypopulation and economic changes), energy efficiency gains, and demand sideresources. Even though the modeling was performed considering three load forecastlevels (High, Base and Low) and the Preferred Resource Plan is expected to workwell in all of them, a drastic change in these assumptions could affect the IRP resultsand require significant changes in such plan. Hence, it is important to review the IRPplan in the term of three years stated by Act 57-2014 for verifying these assumptions.
9. The main sources of data used for the load forecast included Moody’s Analytics, theInternational Monetary Fund, World Bank, the U.S. Census Bureau, Federal Reserveof Economic Data of St. Louis (FRED), and Puerto Rico’s Federal Management
Caveats and Limitations
Siemens Industry, Inc. – Siemens Power Technologies International 9-3
Oversight Board (FOMB). In particular, Siemens used FOMB historical andforecasted data for GNP and population for the IRP load forecast. Siemens assumedthat the data from these sources is reliable and correct. If, in the future, it is found thatthis data or any part of it is incorrect, a revision of the load forecast, and the IRPmodeling shall be done for correcting the IRP results.
10. The environmental regulations determined by Siemens and PREPA to be potentiallysignificant and factored into the IRP analysis include federal air regulations, waterregulations, and local policy dictating targets for renewable and alternative energy. .A significant change in these assumptions could affect the IRP results and requirechanges in such plan. Therefore, it is important to review the IRP plan in the term ofthree years stated by Act 57-2014 for verifying these assumptions.
11. The conventional generation technologies (CCGTs, GTs, RICE, etc.) included in theIRP are considered representative and selected for modeling purposes. There aremultiple developers that can provide equivalent equipment and the findings in the IRPshould not be considered prescriptive of a particular generation design. Thistechnologies selection was the result of Siemens screening of available newgeneration resources that allow for system flexibility and reliability, including theintegration of large blocks of renewable capacity, primarily solar.
12. The location of the peaking generation is a function of the needs for local support,which in turn are a function of the available generation and load. If there are changeswith respect of the assumptions in this document, PREPA should have the flexibilityto adjust and redeploy these units.
13. The IRP considers that all new renewable generation will have market prices adjustedto Puerto Rico conditions. This implies that all the pre-existing contracts associatedwith projects that have not started construction, are voided and new fully competitiveRFP processes are advanced. For the projects in operation or pre-operation,Siemens assumed fixed price conditions based on current contracts prices. If thesemarked prices for new generation are not achieved, the LTCE plans are directlyaffected, probably resulting in much lower integration of renewables with the system.
14. The IRP assumes an accelerated timeline for solar and storage projects, assumingfast track of permitting, proper submittal of project design for evaluation by PREPA,and securing the land for the interconnection line and facilities. In addition tounforeseen events that could delay these tasks, this timeline could be delayed bylimitations on the amount of annual installations that can effectively be carried out inparallel maintaining the continuous operation of the power system.
15. In the case of utility scale storage, it is noted that the amount recommended in theIRP is much higher than the total capacity currently installed in the whole UnitedStates. This represents an installation never done before in a power grid, especiallynor in an isolated system like the one in Puerto Rico. Hence, it is foreseen that thefirst storage projects will take more time to be developed and integrated with thepower system, as they will be the pilot projects of very large bulk storage in PuertoRico and the main land. Particularly, the learning curve will be defined with thoseprojects that have to be developed maintaining the reliability and continuity of theservice in Puerto Rico.
Caveats and Limitations
9-4 Siemens Industry, Inc. – Siemens Power Technologies International
16. For maintaining the reliability of the system, PREPA should not commission neitherallow the interconnection of PV solar or wind projects to the grid until the requiredcorresponding energy storage component be commissioned and interconnected infull compliance with the energy storage technical requirements. The solar PVprojects shall still comply with the MTRs related with frequency ride through, voltageride through, reactive power capability and voltage regulation in addition to their fullcompliance with the frequency regulation and frequency response requirements to bemet by either separate or integrated energy storage. This approach is expected tofoster competition and innovation while at the same time ensuring that the requiredregulation and energy shifting will be available for the PV integration before itsinterconnection.
17. The IRP recommends the retirement of the existing steam generating fleet at differenttimes, including the Aguirre 1 & 2 units in 2019. However, these recommendationsare based on other prerequisite developments which include the forecasted reductionin load, assumed levels of reliability of the remaining of the existing fleet at the time ofretirement, and the commissioning of the new generation resources. Hence, theretirement of existing generating units shall be only implemented after all theseprerequisites have been met, especially that all new resources are fully operational,and is evidenced by the low to zero dispatch of the generation.
18. All project descriptions, schedules and cost estimates should be considered a bestestimate at this point in time. Most of the recommended projects are at verypreliminary stages of scope formulation and as such have a high degree ofuncertainty associated with the estimates. In addition, PREPA may recommendchanging these action items in future years should new units not become operationalin time to support the planned retirements, or if customer energy consumption, orvendor responses to solicitations substantially differ from those anticipated anddescribed in this IRP.
19. The provided installation dates for equipment are a function of multiple assumptionsincluding permitting, engineering and construction times. For those cases that theequipment is committed by the earliest assumed entry, the dates should be read asthe reported date or earlier.
20. FOMB’s “critical project” process under Section 503 of PROMESA is a separateprocess outside the accelerated timeline of the IRP development.
21. All new Distributed Generation connected to the system was assumed to complyand must comply with the new IEEE Standard 1547-2018 (IEEE Standard forInterconnection and Interoperability of Distributed Energy Resources with AssociatedElectric Power Systems Interfaces)
22. The IRP is a planning tool to be used as a guide for the development of futureresources in Puerto Rico and may not have all the details necessary for the actualRFP issuance, contracting, and implementation.
23. The IRP is not a Distribution Master Plan that would require a level of effort similar tothe development of this IRP. Thus, distribution investments are considered at a veryhigh representative level.

Action Plan
Siemens Industry, Inc. – Siemens Power Technologies International 10-1
Part
10Action PlanThis section summarizes the recommended actions that the Energy Bureau should approveand PREPA should undertake in the period from 2019 to 2023 to implement the PreferredPlan identified in the IRP (Action Plan). This plan describes an ambitious program ofinvestment and restructuring of the entire PREPA utility system to better prepare the island towithstand and recover from future weather and service disruption events and to position theisland to adapt to future changes to the islands economic conditions and power requirements.The Action Plan is divided into four subsections for:
1. Supply Resources – including new and existing generation, purchased power,energy storage and fuel infrastructure.
2. Transmission System – including changes to the system to support the hardeningof the transmission system and the enable the MiniGrids.
3. Distribution – including changes to the system to support the hardening of thetransmission system and the enable the MiniGrids and the incorporation of rooftopPV.
4. Energy Efficiency and Demand Response – including recommended programsand benefits.
Each subsection describes the principle actions, timetables, capital expenditures, permittingissues and other regulatory approvals that are required to implement the plan. All projectdescriptions, schedules and cost estimates should be considered a best estimate at this pointin time. Most of the recommended projects are at very preliminary stages of scopeformulation and as such have a high degree of uncertainty associated with the estimates. Inaddition, PREPA may recommend changing these action items in future years should newunits not become operational in time to support the planned retirements, or if customerenergy consumption, or vendor responses to solicitations substantially differ from thoseanticipated and described in this IRP. Please refer to the Caveats and Limitations section inPart 9 of this IRP for additional details.
PREPA currently plans to solicit bids from vendors for PPOAs, facilities lease agreements, orsimilar commercial structures where the bidders would Design, Build and Finance, or Design,Build, Finance, Operate and Maintain the projects and sell power or use of the project toPREPA. The estimated overnight capital expenditures are provided for most of the projectslisted. These estimated capital expenditures provide an indication of the magnitude of theinvestments that would be financed by potential vendors. The vendors financing costs wouldthen be paid through the proceeds from a PPOA or other commercial agreement andultimately become part of PREPA’s operating expenses, as opposed to PREPA capitalexpenditures.

Action Plan
10-2 Siemens Industry, Inc. – Siemens Power Technologies International
Supply Resources
Overview and Principal RecommendationsTwo resource plans provided virtually identical NPV results, the least cost ESM plan and theS4S2 plan which have an NPV difference of less than $9 million ($8,747,000 difference forthe NPV base cases). While these plans had a number of identical elements, they also hadmaterial differences. In order to create a no regrets/minimum regrets Action Plan, it isrecommended that PREPA follow the ESM resource plan and add preliminary activities fromselective elements of the S4S2 plan that will provide greater flexibility than either plan aloneand a hedge against potential issues that may arise with the planned development newresources, the continued reliance on PREPA’s aging generation fleet and the changes in thefuture system demand that must be served. The following supply resource actionssummarize the ESM plan action and then, separately, the recommended additions drawnfrom the S4S2 plan. The action plans include new generation and fuel infrastructureresources, modifications to existing resources, including modifications to the existing PPOAwith EcoEléctrica.
All the new generation additions will be solicited as PPOAs. The capital expenditurespresented below are provided as a reference of estimated overnight capital expenditurescosts of a PPOA developer.
10.1.1.1 Solar Photovoltaics (install 900 MW to 1800 MW)PREPA plans to install at least 900 MW and up to 1,800 MW of solar PV in the first 5 years ofthe plan (2019 to 2023). RFPs will be issued for blocks of approximately 250 MW of solar PV.We expect that responses to each RFP block will include multiple projects of varyingcapacity. The actual amount installed will depend on the bid pricing received and PREPA’sinternal ability to interconnect the projects. PREPA plans to solicit the solar PV projects asPPOAs and may solicit additional, alternative commercial options. In addition, PREPA plansto consider potentially soliciting the solar PV as a standalone project, solar PV plus BESS in acombined bid and BESS as a standalone bid. A further discussion of the battery solicitationsis discussed in the next sections.
The minimum planned solar PV addition of 900 MW aligns with the results from the LTCE forthe ESM plan. The solar PV addition of 1800 MW addition aligns with the S4S2 plan. If thePREPA determines that it can practically install more than the planned 900 MW and it findsthat solar PV bid prices are at or below the forecasted prices, and remain favorable relative tothe fossil fuel pricing, PREPA will attempt to install up to the 1800 in the first four years of thisplan as called for in the S4S2 LTCE plan. The annual PV additions from the ESM plan arenoted in the Exhibit below. These values should be considered the minimum targetedinstallation.
Exhibit 10-1: ESM Annual Solar PV Additions
2019 2020 2021 2022 2023Solar PV Additions (MW) 0 0 240 480 180Cumulative Additions (MW) 0 0 240 720 900Capital Expenditures ($M) - - $343 $678 $251

Action Plan
Siemens Industry, Inc. – Siemens Power Technologies International 10-3
The annual PV additions from the S4S2 plan are noted in the Exhibit 10-2 below. Thesevalues should be considered an upper limit to the targeted installation. Scenario 3 thatconsidered a deeper reduction in cost of renewable and high capability to interconnect hadhigher values (see Part 8), but these are considered unlikely to be feasible.
Exhibit 10-2: S4S2 Annual Solar PV Additions
2019 2020 2021 2022 2023Solar PV Additions (MW) 0 300 300 600 600Cumulative Additions (MW) 0 300 600 1200 1800Capital Expenditures ($M) - $452 $428 $848 $837
The ESM plan under base load forecast achieved 24% RPS compliance by 2038, should theregulation in Puerto Rico change and require 50% RPS compliance by 2040 a minor changewould be required for the ESM case and in 2023 approximately 430 MW of solar PV wouldbe required instead of 180 MW. The rest of the required changes to meet the 50% targetwould occur beyond the 5 year timeframe of the action plan.
10.1.1.2 Battery Energy Storage (install 600 MW to 900 MW)PREPA plans to install at least 600 MW and up to 900 MW of BESS in the next five years.The amounts of BESS which will be installed is correlated to the capacity of solar PV installedand the resources required for the MiniGrids. RFPs will be issued for blocks of BESS ofapproximately of 150 to 200 MW. As noted in the prior Solar PV discussion, PREPA plans toconsider potentially soliciting the BESS as a standalone project, solar PV plus BESS in acombined bid and solar PV as a standalone bid. The annual BESS additions from the ESMplan are noted in the Exhibit below. These values should be considered the minimumtargeted installation.
Exhibit 10-3: ESM Annual BESS Additions
2019 2020 2021 2022 2023BESS Additions (MW) 20 100 160 160 160Cumulative Additions (MW) 20 120 280 440 600Capital Expenditures ($M) $24 $109 $163 $153 $147
The annual BESS additions from the S4S2 plan are noted in the Exhibit below. These valuesshould be considered an upper limit to the targeted installation.
Exhibit 10-4: S4S2 Annual BESS Additions
2019 2020 2021 2022 2023BESS Additions (MW) 180 300 300 120 0Cumulative Additions (MW) 180 480 780 900 900Capital Expenditures ($M) $216 $328 $308 $115 -
There is no difference on the installations on the ESM case if the target RPS is changed to50% RPS by 2040.

Action Plan
10-4 Siemens Industry, Inc. – Siemens Power Technologies International
Modify and Retire Existing Resources
San Juan 5&6 Combined Cycle (CC) Conversion to Natural Gas (2x200MW)This conversion was considered a committed action in developing this IRP and is currently anongoing activity. The fuel conversion of San Juan 5&6 will use a ship-based liquefied naturalgas (LNG) terminal. This project includes a supporting fuel infrastructure project. Each ofthese units has a capacity of 200 MW with a combined capacity of both units of 400 MW.This action is recommended in both the ESM and the S4S2 plans. Based on the currentproject schedule, the converted units are expected to reach commercial operation by June2019. There are no capital expenditures for the conversion as the contract for conversion wasstructured as a capacity payment.
Mayagüez 1, 2, 3, 4 Peaker Conversion to LNG Natural Gas (4x50MW)This conversion was considered a committed action in developing this IRP and is currently anongoing activity. The existing aeroderivative Peakers, Mayagüez 1, 2, 3, 4 (4 units at 50MWeach) are to be converted to use natural gas. The use of natural gas will require the additionof LNG infrastructure for a ship-based liquefied natural gas (LNG) delivered to a newMayagüez terminal. The conversion of these four existing units was included in the ESM planas well as the installation of four new, containerized natural gas fueled mobile peakers (23MW each and installed by 2021), but these units will be deployed in the north in support ofthe Mayagüez North MiniGrid. While the S4S2 plan did not include the conversion of theaeroderivative units, the conversion of these units would be a minor adjustment to the S4S2plan and it would allow an early use of the available LNG prior to the commissioning of the302 MW CCGT unit that this plan recommends. Based on the current project schedule, theconverted units are expected to reach commercial operation in 2022 with an estimated capitalexpenditure for the conversion of the four units of $5 million.
EcoEléctrica Contract Renegotiation and Extension
The PPOA contract renegotiation with EcoEléctrica is considered a committed action indeveloping this IRP and is currently an ongoing activity. PREPA must renegotiate the PPOAto both modify the commercial terms and the operational flexibility of this PPOA in order tomake the EcoEléctrica PPOA an economic resource in the future PREPA system that willinclude increasing amounts of renewable generation. However, there is no assurance thatthe contract can be successfully renegotiating and extending the current contract which is setto expire in 2022. The best alternative to replace the EcoEléctrica resource, should therenegotiation and extension not be successful, is with a new gas fueled 302 MW CCGT plantat Costa Sur described below under new resources. This action is recommended for both theESM plan while the S4S2. However, the ESM plan assumed a successful negotiation andextension of the contract and the S4S2 plan assumed the contract could not be successfullyrenegotiated and was replaced by a new 302 MW CCGT unit at Costa Sur.
San Juan Generator Conversions to Synchronous Condensers
With the retirement of PREPA older steam units and the introduction of greater inverter basedgeneration, studies carried out under this IRP (see Appendix 1) indicate that the PREPAsystem may require synchronous condensers to increase the short-circuit level and provideminimum levels of voltage stiffness for the inverter based resources to operate reliably. Thisis assessed in the Industry by determining the Short Circuit Ratio as the ratio of the shortcircuit level in the system to the installed inverter based resources and typically values below

Action Plan
Siemens Industry, Inc. – Siemens Power Technologies International 10-5
1.5 are problematic. Without the synchronous condensers the ratio may be under 1.0 forPREPA resulting in an unstable system.
San Juan 9 and 10 are assumed out of service for this IRP analysis and designated for eitherretirement or limited use. Both units are candidates for potential immediate conversion tosynchronous condensers. Within the next 5 years, the ESM plan also calls for the retirementof San Juan 7 and 8. Palo Seco 3 and 4 are designated for retirement in the ESM plan in2024. After retirement, all these units will be considered candidates for potential conversion tosynchronous condensers. The specific units selected for conversion the schedule for theirconversion and the costs of conversion will require additional study. Dependent on the resultsof a study of the synchronous condenser needs and costs, PREPA expects to potentiallyconvert one and possibly both of San Juan 9 and 10 to synchronous condensers within thefirst five years of this plan (by 2023). The estimated time to convert a unit is approximately sixmonths. Without the benefit of the results of the study, Siemens has estimated thecommercial operation date of the conversion of San Juan 10 in January 2022 and theconversion of San Juan 9 in 2023. Siemens has also developed a very high-level capitalexpenditure estimate of $9 million per unit for the conversion based on an EPRI study67.
Unit RetirementsIn the ESM the following unit retirements are recommended in the first five years of the plan,subject to the availability of the new generation resources, and the realization of the otherassumptions in the capacity expansion plan. Please see Part 8 for more details.
Exhibit 10-5: Unit Retirements
Unit Last Year inService
Frame 5 Peakers 2019 to 2021Aguirre ST 1 2019Aguirre ST 2 2020Costa Sur 6 2020Costa Sur 5 2021San Juan 7&8 2023
Install New ResourcesPalo Seco CCGT (302 MW F-Class)
The ESM, S4S2 plans call for a new natural gas fueled 302 MW CCGT at Palo Seco byJanuary 2025. January 2025 is also the earliest practical date the unit could be in service.This unit is also applied to all but select cases of Scenario 1 cases (no new gas). However, tomeet this operation date the project would need to begin immediately. The commercialoperation for this unit is estimated to be January 2025 with an estimated capital expenditureof $291 million.
67 Turbine-Generator Topics for Power Plant Engineers: Converting a Synchronous Generator for Operation as aSynchronous Condenser. EPRI, Palo Alto, CA: 2014. 3002002902.
Action Plan
10-6 Siemens Industry, Inc. – Siemens Power Technologies International
Costa Sur CCGT (302 MW F-Class)
Under all cases, including the ESM, unless the contract with EcoEléctrica is successfullyrenegotiated and extended, it is recommended that EcoEléctrica supply be replaced by anew natural gas fueled 302 MW CCGT at Costa Sur. However, the EcoEléctrica PPOA isscheduled to expire in 2022 and it has been estimated that the earliest that a CCGT could bein service at Costa Sur is January 2025. Therefore, to preserve this earliest potentialoperation date for the CCGT, PREPA must start immediately and proceed with thepreliminary activities for developing the CCGT in parallel with the efforts to renegotiate theEcoEléctrica PPOA. If the EcoEléctrica PPOA renegotiation is successful, the need for thisunit will be reevaluated based on the load growth and the progress of the other generationdevelopment projects. The commercial operation for this unit is estimated to be January 2025and an estimated capital expenditure of $291 million.
Yabucoa CCGT (302 MW F-Class)
The ESM plan calls for a new natural gas fueled 302 MW CCGT at Yabucoa by January2025. January 2025 is also the earliest practical date the unit could be in service. This unit isalso called for in two Scenario 4 cases and it is needed if the land based LNG cannot bedeveloped for the San Juan plant or the high load growth materializes. However, to meet thisoperation date the project would need to begin immediately. The commercial operation forthis unit is estimated to be January 2025 and an estimated capital expenditure of $291million.
Mayagüez CCGT (302 MW F-Class)
The ESM plan does not call for the development of a combined cycle plant at Mayagüez.However under various situations, Scenario 4 calls for a new 302 MW natural gas fueledCCGT at this site by 2028. It is recommended to advance preliminary engineering andpermitting of this option as a hedge against inability to develop the generation at other sitesand to take advantage that under the ESM a ship-based LNG is developed here.
San Juan Small CCGT – LPG/NG (3x38MW)
These units are needed to provide generation in the North as a hedge against any of theexisting aging generation units in the North (Palo Seco 3&4 or San Juan units 7, 8 and 9) failprematurely, prior to their planned retirements, as did San Juan 10. The units will bedesigned and permitted to burn either LPG or natural gas providing additional fuel flexibility.The units will be located in the North in the San Juan area but may be located at a site otherthan the San Juan plant. Preliminary discussion with vendors indicated these units can bepermitted and constructed very rapidly with an estimated commercial operation date ofJanuary 2022. The estimated capital expenditure for the three units is $203 million, but thereis uncertainty with respect of the actual technology to be deployed as offers reviewed varywidely.
Mobile Gas Turbine Peaking Units (18x23 MW)
The ESM plan calls for installation of 18 GTs, of 23 MW each, distributed at five different plantlocations around the island with preference for those locations where the exiting Frame 5 21MW units are located. These new units will be capable of burning containerized natural gasdelivered by truck with onsite tankage. The units are required to provide reliable distributed

Action Plan
Siemens Industry, Inc. – Siemens Power Technologies International 10-7
generation to serve critical and priority loads within the MiniGrids. The S4S2 case also calledfor 16 of these 18 units at the same plant locations. Since these, are mobile generator units,the additional two units recommended with the ESM case will provide PREPA greaterflexibility to move the units to other MiniGrids if needed. The units will be distributed as shownin Exhibit 10-6 below:
Exhibit 10-6: Locations of Mobile 23 MW GTsLocation Number of Units
Jobos 2Mayagüez North 4Carolina (Daguao) 5Caguas (Yabucoa) 5Cayey 2
Total 18
These small GTs should be placed in service as soon as practical. The ESM and S4S2 plansassume a January 2021 commercial operation date and an estimated capital expenditure forall 18 units of $384 million.
10.1.4.1 New Natural Gas InfrastructureSan Juan Land-Based LNG Terminal
This new LNG terminal is recommended as a preferred option for supplying large quantitiesof natural gas to San Juan and Palo Seco Plant. The project would provide a land-based(onshore) LNG storage and vaporization facility near the San Juan plant supplied with LNGcarrier delivery directly to onshore tanks. The project also includes a natural gas pipeline tothe Palo Seco Plant to support the new 302 MW CCGT recommended for the site. The ESMplan assumes operations by 2025 with delivery to the San Juan plant and via pipeline to thePalo Seco plant. Any delays in the development of the land-based LNG supply is assumed tobe covered by ship-based LNG. Based on input from PREPA, the estimated capital cost ofthis land-based facility, with a pipeline to Palo Seco, is $492 million. Siemens has assumedthe LNG terminal is being developed to supply 650 MW of generation and Note that in asmuch as the generation may use only a portion of the available terminal capacity, it wasassumed to bear only its portion of the total terminal costs.
Yabucoa Ship-Based LNG Terminal
The addition of an LNG terminal at Yabucoa is part of the least cost ESM plan that calls forthe development of a 302 MW CCGT and the LNG terminal at the site. As noted previously,the LNG terminal and the new CCGT are also called for in multiple S4S2 cases. Thecommercial operation of the terminal would coincide with the commercial operation of thenew CCGT unit in January of 2025. However, to meet this operation date the project wouldneed to begin immediately. Siemens estimates the capital expenditures for ship-based LNGdelivery to Yabucoa to be $215 million.
Mayagüez Ship-Based LNG Terminal
The addition of a LNG terminal at Mayagüez is recommended to allow the conversion of theexisting Aeroderivative GTs in place to burn natural gas. In addition, the infrastructure isrecommended as a hedge against problems with development of the new generation at other

Action Plan
10-8 Siemens Industry, Inc. – Siemens Power Technologies International
locations that require the development of a new 302 MW natural gas fueled CCGT at thissite. Finally, the LNG terminal and CCGT were called for as part of the S4S2 plan. Therecommended commercial operation date adopted the date called for in the S4S2 plan ofJanuary 2028. Siemens estimates the capital expenditures for ship-based LNG delivery toMayagüez to be $215 million.
Summary TimetableA summary timetable for the projects discussed above is shown in the Exhibit 10-7 below.
Exhibit 10-7: Summary Schedule
Summary of Capital ExpendituresA summary of the estimated overnight capital costs is provided in the Exhibit 10-8 below.
Q1 Q2 Q3 Q4 Q1 Q2 Q3 Q4 Q1 Q2 Q3 Q4 Q1 Q2 Q3 Q4 Q1 Q2 Q3 Q4 Q1 Q2 Q3 Q4 Q1 Q2 Q3 Q4
Solar Photovoltaics
Battery Energy Storage
San Juan 5 & 6 Conversion
Mayagüez 1-4 Conversion
San Juan 9 Sync. Cond. Conversion
San Juan 10 Sync. Cond. Conversion
Palo Seco CCGT
Costa Sur CCGT
Yabucoa CCGT
San Juan Small LPG / NG CCGT
Mobile GT
San Juan Land-Based LNG
Yabucoa Ship-Based LNG
Mayagüez Ship-Based LNG
Frame 5 Peaker Retirements
Aguirre ST 1
Aguirre ST 2
Palo Seco ST 3&4
San Juan 7&8
Costa Sur 5
Costa Sur 6
Aguirre CC1
Developing, Permitting, Financing
Engineering, Procurement and Construction
Retirements
2024 20252019 2020 2021 2022 2023

Action Plan
Siemens Industry, Inc. – Siemens Power Technologies International 10-9
Exhibit 10-8: Summary of Capital Expenditures for 2019 to 2023
Values in table are in current millions of dollars
Project 2019 2020 2021 2022 2023
Solar Photovoltaics - - $343 $678 $251Battery Energy Storage $24 $109 $163 $153 $147San Juan 5 & 6 Gas Conversion - - - - -Mayagüez 1-4 Gas Conversion $5 - - - -San Juan 10 Sync. Cond.Conversion - - - $9 -
San Juan 9 Sync. Cond.Conversion - - - - $9
Palo Seco CCGT - - - - -Costa Sur CCGT - - - - -Yabucoa CCGT - - - - -San Juan Small LPG / NG CCGT - - - - -Mobile GT - - $384 $104 $73San Juan Land-Based LNG - - - - -Yabucoa Ship-Based LNG - - - - -Mayagüez Ship-Based LNG - - - - -Total $29 $109 $890 $944 $480
Total for all Projects 2019 to 2023 $2,452
Permitting and Regulatory ActivitiesThis IRP require that all major expenditures and contracts commitments referenced in thisdocument, the approval from the PREB.
In addition, the action plan described above will require a host of additional approvals fromthe government of Puerto Rico and federal government agencies. The approval includes air,water and land use permits associated with the design, construction and operation of thegenerating projects. A partial list of likely permits associated with the new resources and gasinfrastructure include:
µ EPA and EQB review of New Source Review (NSR) for air emission permittingµ EPA National Pollutant Discharge Elimination System (NPDES) for water permittingµ EQB Water Quality Certificationµ Environmental Assessment (EA) or Environmental Impact Statement (EIS) reviewed
by various Puerto Rico and federal agenciesµ Puerto Rico Office of Permits Management (OGPe) Construction Permits
While PREPA will need to support these applications and permits for all the projects listed,PREPA expects the project bidders will provide vast majority of the work and expensesassociated with any required permits.

Action Plan
10-10 Siemens Industry, Inc. – Siemens Power Technologies International
Transmission SystemIn this section, Siemens assessed the capital investments on PREPA’s transmission system,and determined the implementation action plan including project priorities, capital investmentschedules, and timetables.
Overview and Principal RecommendationsPREPA has identified a comprehensive list of transmission system related projects to bothbring the existing transmission facilities up to current or new standards as well as the newconstruction and infrastructure hardening of transmission lines (underground cables) andtransmission substations for MiniGrid operations. This forms a large portfolio of transmissioncapital investments for which a prioritized implementation plan and an estimated timeline isessential.
The projects are mainly focused on enabling PREPA’s transmission system to operate asmultiple MiniGrids during or shortly after a major event, and before the infrastructure can berestored to integrated system operations.
All projects are categorized by various technical justifications, most of which are directlyassociated with the formation of MiniGrids, i.e. MiniGrid Main Backbone, MiniGrid BackboneExtension, Interconnection of Critical loads, and Interconnection of MiniGrids. There aresome projects under existing infrastructure hardening category and aging infrastructurereplacement that are related to the reliable operation of the MiniGrids. Most of thetransmission substation projects are related to converting the existing substations into gasinsulated substations.
In addition to the MiniGrid directed projects, there is a second major category of projects; thetransmission reliability investments that are necessary to bring back PREPA system up tocurrent or new Standards, reconstruct aging infrastructure and allow reliable day to dayoperations.
Total of five (5) groups of priority; Priority 1 through Priority 5, have been determined byPREPA and assigned to each project. Critical operational and field related constructionlogistical aspects, such as the possible scheduling Scenarios for the transmission lineclearances, were considered by PREPA to assign the projects in their corresponding prioritygroups related to scheduling. Projects deemed Priority 1 will be assumed to have theengineering/permitting/outage scheduling work start as early as July 2019, with engineering,procurement and construction (EPC) start early 2020, and commercial in-service data assoon as March 2021. Projects in Priority 2 group will start upon completion of EPC work of allPriority 1 projects, with in-service date from 2023 to 2024, and continuing for the remainingpriority groups. The above timeline assumption should be considered a high level estimate atthis time and should be refined with detailed planning that considers which project tasks canbe carried out in parallel without compromising the reliability of the system. The detailed planalso should identify when long lead time items should be ordered, and our current workingassumption is that this will occur during the engineering/permitting phase and ahead of EPCstart. The action plan focuses mainly on the first 5 years for investment implementation;therefore, the detail list of projects will only show projects identified with Priority 1 andPriority 2.
The confidential Attachment B provides the detailed list of Priority 1 and Priority 2transmission line and substation investment projects.

Action Plan
Siemens Industry, Inc. – Siemens Power Technologies International 10-11
Schedule of Capital ExpendituresThe exhibits below show the schedule of 115 kV and above transmission capitalexpenditures for MiniGrids over the next 10 years. EPC work starts in 2020 for Priority 1group projects followed by Priority 2 group projects in 2023 and so on. We have spread thecapital investment into three years for Priority 1 projects due to its large total amount of$2,048 million (Avg. $683 million per year). EPC work for Priority 2 group projects will start in2023 and spread into two years, totaling $322 million (Avg. $161 million per year).
For the PREPA’s transmission system to be operable in MiniGrid mode, and as discussed indetail in Appendix 1 Transmission & Distribution Design of this IRP, additional microgridcontrollers and communication infrastructure for Minigrid control system is necessary. Theinvestment expenditure is very small ($0.135 million per microgrid controller for each MiniGridor microgrid) compared to the capital investment on transmission projects, and thus will notbe listed separately in this section. However, the investment on microgrid control systemshould be assigned as Priority 1 group so that they will be implemented as early as possible.
Exhibit 10-9. 115 kV MiniGrid Transmission Investment, 2018 $ million
Priority 1 Priority 2 Priority 3 Priority 4 Priority 5Technical Justification 2020-2022 2023-2024 2025-2026 2027 2028
Interconnection of Critical Loads 87.9 31.7 36.0 0.0 0.0Interconnection of Minigrids 66.8 0.0 6.8 0.0 0.0Minigrid Backbone Extensions 70.4 0.0 0.0 0.0 0.0Minigrid Main Backbone 1615.7 220.2 59.1 101.9 70.3Existing Infrastructure Hardening for Reliability - MG 80.9 31.5 100.3 20.8 11.1Aging Infrastructure Replacement-MG 126.0 38.8 11.3 15.5 5.0
Total 2047.7 322.2 213.5 138.3 86.4

Action Plan
10-12 Siemens Industry, Inc. – Siemens Power Technologies International
Exhibit 10-10. 115 kV MiniGrid Transmission Investment,2018 $ million
Exhibits below show the schedule of 38 kV transmission capital expenditures for MiniGridsover the next 10 years. EPC work starts in 2020 for Priority 1 group project followed byPriority 2 group projects in 2023 and so on. Again, we have spread the capital investment intothree years for Priority 1 projects due to its large total investment of $1,821 million (Avg. $607million per year). EPC work for Priority 2 group projects will start in 2023 and spread into twoyears, totaling $619.4 million (Avg. $310 million per year).

Action Plan
Siemens Industry, Inc. – Siemens Power Technologies International 10-13
Exhibit 10-11. 38 kV MiniGrid Transmission Investment,$ million
Exhibit 10-12. 38 kV MiniGrid Transmission Investment,$ million
Exhibits below show the schedule for the transmission reliability upgrades capitalexpenditures that are required for reliable of normal operation and not related to the MiniGrid.EPC work starts in 2020 for Priority 1 group project followed by Priority 2 group projects in2023 and so on. Once again, we have spread the capital investment into two years forPriority 1 projects, totaling $383.1 million (Avg. $191.6 million per year). EPC work for Priority2 group projects will start in 2022 and spread through two years, totaling $408.1 million (Avg.$ 204 million per year).
Exhibit 10-13 Transmission Reliability Investment, $ million
Priority 1 Priority 2 Priority 3 Priority 4 Priority 5Technical Justification 2020-2022 2023-2024 2025-2026 2027 2028
Interconnection of Critical Loads 1678.5 413.1 212.8 75.3 33.1Interconnection of Minigrids 24.7 20.9 9.7 0.0 13.6Minigrid Backbone Extensions 38.9 49.0 18.9 28.5 0.0Minigrid Main Backbone 28.7 0.0 6.9 0.0 0.0Existing Infrastructure Hardening for Reliability - MG 49.9 136.4 64.3 101.3 42.4
Total 1820.6 619.4 312.6 205.1 89.2
Priority 1 Priority 2 Priority 3 Priority 4 Priority 5Technical Justification 2020-2021 2022-2023 2024-2025 2026-2027 2028
Aging Infrastructure Replacement 28.8 0.0 0.0 0.0 0.0Existing Infrastructure Hardening for Reliability 354.4 408.1 359.8 448.6 279.8
Total 383.1 408.1 359.8 448.6 279.8

Action Plan
10-14 Siemens Industry, Inc. – Siemens Power Technologies International
Exhibit 10-14. Transmission Reliability Investment, $ million
TimetablesThe Exhibit below shows the timetables of 115 kV and above MiniGrid transmissioninvestment implementation for both the engineering/permitting/outage scheduling phase andEPC phase.
Priority 1 and 2 projects are estimated to be completed before 2024, and all projects areassumed to be in service by 2028.
Figure 10-15. 115 kV MiniGrid Transmission Investmenttimeline

Action Plan
Siemens Industry, Inc. – Siemens Power Technologies International 10-15
The exhibit below shows the timetables of 38 kV transmission line and 115/38 kV substationsMiniGrid transmission investment implementation for both the engineering/permitting/outagescheduling phase and EPC phase.
Similarly, Priority 1 and 2 projects are estimated to be completed before 2024, and allprojects are assumed to be in-service by 2028.
Exhibit 10-16. 38 kV MiniGrid Transmission Investment, timeline
The Exhibit below shows the timetables of transmission reliability upgrades not related toMiniGrid investment implementation for both the engineering/permitting/outage schedulingphase and EPC phase.
Priority 1 and 2 projects are estimated to be completed before 2023, and all projects areassumed to be in-service by 2028.
Exhibit 10-17. Transmission Reliability Investment, timeline

Action Plan
10-16 Siemens Industry, Inc. – Siemens Power Technologies International
Permitting and Regulatory ActivitiesThe action plan described above will require a host of additional approvals from the PuertoRico and federal government authorities and agencies.
Permitting: The approval includes air, water and land use permits associated with thedesign, construction and operation of the transmission projects. Environmental Assessment(EA) or Environmental Impact Statement (EIS) reviewed by various Puerto Rico and federalagencies and Puerto Rico Office of Permits Management (OGPe) and construction permits.
Siting Approval: Most high-voltage transmission projects will require the state sitingapproval. Project sponsors will need to carry out environmental and detailed engineeringwork in order to establish a highly-detailed project plan to support the application.
Wetlands and Waterways: Any proposed project should be sited to avoid and minimizeimpacts to wetlands or other areas of environmental concerns. If the project cannot avoidsuch impact, it is expected to be subject to regulations certain additional permitting programs,namely Section 401 and Section 404 of the Clean Water Act, Section 10 of the Rivers andHarbors Act. Detailed analyses will be conducted for siting and routing for the specific permit.
Other Minor Permits: In addition to the above, some other minor permits may be requiredfor any construction. These include permits related to airspace clearance, stormwater/erosionand sedimentation control, road crossings, and utility and railroad crossings.
While PREPA will need to support these applications and permits for all the projects listed,PREPA expects the project bidders will provide vast majority of the work and expensesassociated with any required permitting activities.
Distribution SystemThe investments in the distribution system are designed to achieve the following objectives:
a) Ensure resiliency of supply to the end customer at a level consistent with theimprovements made at the generation and transmission levels for the formation ofthe MiniGrids and with initial focus on Critical and Priority Loads.
b) Support the integration of distributed energy resources and, in particular, roof topsolar.
To achieve these objectives Siemens, with the collaboration of PREPA, assessed the typesof load (Critical, Priority or Balance) served by each of the feeders in PREPA’s system andcreated a priority conversion index based on the criticality of the load served and thecondition of the assets serving the load.
With the procedure above, we identified the air insulated substations that should be upgradedto GIS to ensure their survivability from a major hurricane and that were served bytransmission substations that were either going to be upgraded, according to the investmentplan discussed earlier, or already had an adequate level of reliability and needed no upgrade.Further, Siemens coordinated the timing of the upgrade at the transmission and distributionlevels so that the projects would be done in parallel as much as possible. Finally, in theconversion to GIS, priority was given to those substations with voltages under 13.2 kV, as thesystem should be normalized to that voltage and there is a strong correlation of aginginfrastructure, particularly those at the lowest primary distribution system voltage of 4.16 kV.

Action Plan
Siemens Industry, Inc. – Siemens Power Technologies International 10-17
The CapEx for substations was estimated using PREPA’s 3 main designs depending on loadserved, as shown in the exhibit below.
Exhibit 10-18. PREPA’s preferred substation designs(MV – 13.2 kV)
MVA Cost GIS Transformer
InstallationLabor+
Material+Overhead +Testing &
commissioning
Total
S/S 1 22.4 530,661 651,300 354,588 1,536,549
S/S 2 33.6 530,661 976,950 452,283 1,959,894
S/S 3 44.8 530,661 1,302,600 549,978 2,383,239
For the feeders we followed a similar procedure as for the substations, and in this case, weidentified the feeders that, given the criticality of the load served, should have their mainlines(also called backbone or trunk-lines) rebuilt from overhead to underground cables. As before,priority was given to feeders with voltages under 13.2 kV and that were associated tosubstations that were going to be upgraded to GIS or already had adequate levels ofreliability.
For the estimation of the investments, we considered maintaining the overall ampacity of themainline using PREPA’s standardized underground cables as shown in the exhibit below. NoCapEx for voltage conversion to 13.2 kV was provided as this is highly dependent on theassets on site.
Exhibit 10-19. PREPA’s Mainline Conductor Replacement
Ratings (amps) Ratings (amps)PREPA O/H Conductors Normal Emergency Replacement Normal1/0 AAAC 212 239 4/0 XLPE 3051/0 ACSR 221 243 4/0 XLPE 3052/0 ACSR 252 278 4/0 XLPE 3053/0 SPACER 15 KV 265 298 4/0 XLPE 3051/0 CU 269 303 4/0 XLPE 3053/0 AAAC 284 321 4/0 XLPE 3053/0 ACSR 289 318 4/0 XLPE 3052/0 CU 311 352 500 XLPE 4854/0 ACSR 328 361 500 XLPE 4853/0 CU 360 407 500 XLPE 4853/0 CU XLP 15 KV 360 407 500 XLPE 485266 ACSR SPACER 382 436 500 XLPE 485266 ACSR 418 466 500 XLPE 485250 CU 461 523 500 XLPE 485336 ACSR 483 540 500 XLPE 485336 SPACER 483 540 500 XLPE 485300 CU 500 550 750 XLPE 584556 SPACER 600 700 750 XLPE 584556 ACSR 650 700 750 XLPE 584652.4 AAAC 651 450 750 XLPE 584500 CU XLP 15 KV 709 808 750 XLPE 584795 ACSR 824 925 750 XLPE 584

Action Plan
10-18 Siemens Industry, Inc. – Siemens Power Technologies International
Unit Costs $2016
Conductor Ducts Total Total $2018
US$/Mile US$/Mile US$/Mile US$/Mile
4/0 XLPE 240,298 220,104 460,402 484,000
500 XLPE 366,699 276,673 643,372 676,000
750 XLPE 465,084 276,673 741,756 779,000
For the incorporation of photovoltaic (PV) systems, Siemens conducted a high levelestimation of the possible impact of the projected rooftop PV growth in the next five yearsconservatively, assuming that it occurs in the feeders where there are already installations.This analysis identified those feeders where it is possible that there would be voltageregulation issues, localized overloads or the risk of reverse power flows to the transmissionsystem.
For the screening of feeders where there could be a risk of voltage regulation issues (possiblyrequiring installation of voltage regulation equipment), we identified those feeders whereeither the aggregated rooftop generation was close to (90% threshold assumed) or exceededthe noon time load on the feeder, or where it represented more than 30% of the feedercapacity, as determined considering the nominal voltage and the conductor at the substationexit.
For the determination of those feeders where overload could be possible and should beinvestigated, we identified those feeders where, if the aggregated PV was locateddownstream of the smallest mainline conductor and lowest feeder voltage68, there would bean overload and the mainline would need to be upgraded.
Finally, we identified those feeders where, during noon-time light load conditions, there wouldbe a risk of reverse power flow, necessitating the upgrade of the protection equipment andsettings and, under some situations, the addition of voltage regulation equipment.
With this approach, we identified a group of 4.16 kV feeders that are strong candidates toupgrade to 13.2 kV.
It is important to point out that the distribution analysis above can only be used for screeningpurposes and it is not a substitute for the necessary detailed system studies that mustconsider the feeder topology, assets in service, and location of the load and PV systems.This future detailed analysis, which is beyond the scope of this evaluation, must include anevaluation of the expected performance of equipment; refinement of the definition of thenecessary improvements, capital expenditures, and timing to implement the projects.
68 PREPA’s Voltage Conversion Policy requires upgrading the distribution system primary voltage to 13.2 kV. Aspart of this voltage conversion process, PREPA has feeders that operate at multiple primary distribution voltages.For example, it has feeders with a source voltage of 13.2 kV that include step-down power transformers to supplyloads at lower voltages (8.32 kV, 7.2 kV and 4.16 kV).

Action Plan
Siemens Industry, Inc. – Siemens Power Technologies International 10-19
Similar to the transmission investments mentioned above, for distribution substation andfeeder upgrades, a total of four (4) groups of priority, Priority 1 through Priority 4, have beenselected considering the priority (timing) of the associated transmission projects and theintrinsic importance of the distribution investment for a reliable and resilient electricity supplyof the critical and priority loads. As was the case in the transmission system evaluation,Priority 1 projects will be assumed to have the engineering/permitting/outage scheduling workstart as early as July 2019, with engineering, procurement and construction (EPC) startingearly 2020, and commercial in-service data as soon as March 2021. Projects in Priority 2group will start upon completion of EPC work of all Priority 1 projects, with in-service datefrom 2023 to 2024. The above timeline is a high level estimation at this time and will berefined once the necessary distribution studies have been carried out. The action planfocuses mainly on the first 5 years for investment implementation, therefore, we providebelow a list of Priority 1 and Priority 2 substations and feeders that were identified as targetsfor upgrade by our resiliency screening assessment. This screening does not include anevaluation of the actual assets of the distribution system, the particular operational limitations,nor a thorough on-site assessment.Error! Reference source not found.Exhibit B-7 in theconfidential Attachment B, contains the substations identified for upgrade considering thethree PREPA’s standardized sizes and designs as presented earlier. Also, the first 19substations in the list have already been identified by PREPA and FEMA forupgrade/relocation. The balance is sorted in order of importance (see Appendix 1 for detailson the determination of the Priority of Conversion Index (PoCI)).
Exhibit B-8 in the confidential Attachment B, provides an overview of the feeders identified forundergrounding of the mainline based on the criticality of the load served and other aspectsdiscussed above. See Appendix 1 for details on the sorting of the feeders.
Finally, 45 feeders were identified as potentially having issues with the interconnection of PVsystems in the next 5 years, of which 30 (66%) have at least one section at 4.16 kV and itwould highly benefit from upgrading to 13.2 kV. The exhibit below shows the total number offeeders identified as candidates for requiring upgrades for the integration of distributedgeneration (Appendix 1 provides additional details).
Exhibit 10-20. Number of Feeders with potential issues forintegration of rooftop PV systems in the next 5 years
Min NominalVoltage (1)
Voltage IssuesPossible (2)
Overload IssuesPossible (3)
Reverse Flow Possible(4)
4.16 21 10 237.2 1 1 0
8.32 4 1 413.2 9 1 8
(1) If there are two voltages on a feeder this is the lowest voltage and it is used to determine the potential foroverload (e.g. the DG is downstream of the step down transformer)
(2) Voltage issues could happen if the PV is greater than 30% of the feeder capacity at the s/s exit (highestnominal voltage and largest conductor) or if greater than 90% of the light load
(3) Calculated using the smallest conductor section at the mainline and lowest voltage (i.e. the DG isdownstream)
(4) If the DG is greater than 80% of the light load.

Action Plan
10-20 Siemens Industry, Inc. – Siemens Power Technologies International
Schedule of Capital ExpendituresThe exhibits below show the schedule for substation conversion to GIS and undergroundingof feeders for the next 10 years. EPC work starts in 2020 for Priority 1 group projects,followed by Priority 2 group projects in 2022, and so on. The timing is selected to match thetransmission system investments.
Exhibit 10-21. Distribution Investments, 2018$ million
Priority 1 Priority 2 Priority 3 Priority 42020 -2022 2023-2024 2025 2026 Total
Substations GIS 81.17 52.40 21.94 21.67 177.17Feeder 367.89 214.59 118.93 32.90 734.31Total 449.06 266.99 140.86 54.57 911.48
Exhibit 10-22. Distribution Investment, 2018$ million
TimetablesThe Exhibit below shows the timetables for the distribution investments (GIS substationconversion and feeders). It is noted that both Group 1 and 2 are expected to be completed by2024, which is an aggressive timeline, but in line with the importance of these investments.

Action Plan
Siemens Industry, Inc. – Siemens Power Technologies International 10-21
Exhibit 10-23. Distribution Investment timeline
Permitting and Regulatory ActivitiesThe action plan described above will require a host of additional approvals from the PuertoRico and federal government authorities and agencies. These are expected to be similar tothose for transmission albeit of lesser scope and faster timelines. The main challenge fordistribution will be the scheduling of multiple projects and the coordination with transmission.

Action Plan
Siemens Industry, Inc. – Siemens Power Technologies International A-1
Attachment
AGas Pipeline Competition ModelGas Pipeline Competition Model (GPCM®)
Siemens utilizes the Gas Pipeline Competition Model (GPCM®) to provide rigorous naturalgas market evaluations. GPCM® is an industry-leading modeling tool that Siemens licenseand adapt to include the most up-to-date assumptions on supply, demand, and infrastructure.These assumptions are updated every quarter, with a full review of inputs in the spring andfall (coordinated with Siemens power market modeling work) and a short-term calibrationevery summer and winter. With GPCM® Siemens cover the entire interconnected NorthAmerican natural gas market, including the evolving Mexican natural gas (and related power)market.
For inputs, Siemens utilize leading data sources such as DrillingInfo’s ProdCast® tool fornatural gas production forecasting. ProdCast® allows Siemens to input its oil and gas priceassumptions into the model, providing an iterative calibration opportunity to better refine thesupply outlook. On the demand side, Siemens develop its outlook from primary sources,including its own electricity market modeling for power sector natural gas demand. Finally,Siemens regularly monitor updates in pipeline infrastructure in-service dates, capacities, andregulatory requirements to ensure Siemens have the latest outlook for pipeline buildout in itsmodeling.
As an output from GPCM®, Siemens provide short-term and long-term price and basisforecasting for all major natural gas market and supply area liquid trading points in NorthAmerica as well as economic pipeline flow analysis. Minor, illiquid, or retired natural gastrading points can also be modeled, upon request. Siemens National model outlook can becustomized in the model in many different ways to test variables such as a pipelinecancellation, an unexpected growth or decline trend in production from a particular play, theimpact of a new major LNG export facility, or any other number of Scenarios.
GPCM® Model Structure and CapabilitiesMathematically, GPCM® is a network model that can be diagrammed as a set of "nodes" and"arcs". Nodes represent production regions, pipeline zones, interconnects, storage facilities,delivery points, and customers or customer groups. The connections between these nodesare called arcs, which represent transactions and flows. Some of these are supplier deliveriesto pipelines, transportation across zones and from one zone to another, transfers of gas byone pipeline to another, delivery of gas into storage, storage of gas from one period toanother, withdrawal of gas from storage, and pipeline deliveries of gas to customers.
GPCM® dynamically solves for economic rents, allowing cheaper supplies to be used beforemore expensive supplies and enabling customers willing to pay more to be served beforethose willing to pay less. By including the entire system of North American gas production,

Gas Pipeline Competition Model
A-2 Siemens Industry, Inc. – Siemens Power Technologies International
transmission, storage, consumption, and imports/exports, GPCM® optimizes gas flows in aneconomically sensible order to produce an economically efficient, market-clearing solution.GPCM® contains more than 200 existing and proposed pipelines, 400 storage areas, 85production areas, 15 liquefied natural gas (LNG) import/export terminals, and nearly 500demand centers.
The output from GPCM® consists of the following types of items, which can be exported toan Excel spreadsheet for further analysis and reporting:
µ Production and spot market prices by regionµ Pipeline receipts from producers by zoneµ Pipeline flows from zone to zoneµ Transportation prices and discounting by pipeline and zoneµ Transfers between pipelines at interconnectsµ Injections into and withdrawals from storageµ Deliveries by pipelines to customersµ Gas supply available to each customer in each regionµ Market clearing prices in each region
GPCM® Geography and GranularityGPCM® covers the North American natural gas market, including the continental UnitedStates, Canada, and Mexico. GPCM® also contains a graphical display system to visuallyanalyze interconnections, flows, and other output from the model. Demand forecasts can bemanipulated by sector and by state. Supply sources can be manipulated by basin or play.Output data is provided on a monthly basis but can be aggregated up to annual averages.The forecasting horizon extends out to December 2040.

Gas Pipeline Competition Model
Siemens Industry, Inc. – Siemens Power Technologies International A-3
Figure A-1. GPCM® and Integration withPower Market Model (AURORAxmp®)
Source: Siemens
GPCM® Power-Gas Model IntegrationThe integration of the AURORAxmp® and GPCM® modeling frameworks is one of thecornerstones of Siemens’s modeling. At a high level, the GPCM® modeling frameworkreceives inputs from AURORAxmp® on current and expected power sector gas demandbased on expected generation capacity additions, coal-gas switching, coal plant retirements,impacts of carbon regime etc. The AURORAxmp® model in turn receives gas pricing inputsbased on the supply economics, pipeline expansion plans, and all natural gas consumingsectors of the economy, including power. The final “equilibrated level” is such that gas pricelevels and the implied power sector gas demand levels are consistent across both models.
It is important to note that initially Siemens develops each of its fundamental market forecastsfor natural gas (GPCM®) and power (AURORAxmp®) independently. Once complete, theseindependent forecasts are then harmonized through the iterative feedback process. Monthlynatural gas prices at the benchmark Henry Hub and 60+ major liquid natural gas trading hubsthroughout North America developed in GPCM® are used as inputs to the AURORAxmp®model. The output from the power model is then segmented into monthly state level data onnatural gas consumption in the power sector. This forecast is then used as an input to thenatural gas model, by setting demand targets for power sector gas consumption and bysetting the price elasticity of power sector gas demand to zero. When a new set of gas pricesand basis forecasts have been computed, a full iteration has been completed. For the secondand third iterations, a weighted average of previous iterations is used to dampen oscillationsbetween cycles (for example, a low gas price would encourage high gas burn, which would

Gas Pipeline Competition Model
A-4 Siemens Industry, Inc. – Siemens Power Technologies International
raise prices, which would lower gas burn, and so forth). Typically, after 3-4 iterations, themodels are sufficiently calibrated such that further iterations are not needed.
It should be noted that prior to the harmonization efforts between GPCM® andAURORAxmp®, the gas model undergoes its own balancing with the supply assumptions.DrillingInfo’s ProdCast® tool for natural gas production forecasting allows Siemens to input itsown crude oil and natural gas price assumptions into the model, providing an iterativecalibration opportunity to better refine the natural gas supply outlook. Also, at the macro-economic level, both GPCM® and AURORAxmp® follow internally consistent assumptionsaround GNP growth rate and the electrical sector demand tied to the GNP growth rate. TheGPCM® model also has separate growth rates for the other sectors of the economy.

Siemens Industry, Inc.Siemens Power Technologies International400 State Street • P.O. Box 1058Schenectady, New York 12301-1058 USATel: +1 (518) 395-5000 • Fax: +1 (518) 346-2777
www.siemens.com/power-technologies