Embed Size (px)
Citation preview

Published by BUSINESS MONITOR INTERNATIONAL LTD
Including 5-year and 10-year industry forecasts
© 2009 Business Monitor International. All rights reserved.All information, analysis, forecasts and data provided by Business Monitor International Ltd is for the exclusive use of subscribing persons or organisations (including those using the service on a trial basis). All such content is copyrighted in the name of Business Monitor International, and as such no part of this content may be reproduced, repackaged, copied or redistributed without the express consent of Business Monitor International Ltd.
All content, including forecasts, analysis and opinion, has been based on information and sources believed to be accurate and reliable at the time of publishing. Business Monitor International Ltd makes no representation of warranty of any kind as to the accuracy or completeness of any information provided, and accepts no liability whatsoever for any loss or damage resulting from opinion, errors, inaccuracies or omissions affecting any part of the content.
Business Monitor InternationalMermaid House, 2 Puddle DockLondon EC4V 3DS UKTel: +44 (0)20 7248 0468Fax: +44 (0)20 7248 0467email: [email protected]: http://www.businessmonitor.com
United Arab EmiratesOil & GasReport Q3 2009 ISSN: 1748-4332

Business Monitor International Mermaid House, 2 Puddle Dock, London, EC4V 3DS, UK Tel: +44 (0) 20 7248 0468 Fax: +44 (0) 20 7248 0467 email: [email protected] web: http://www.businessmonitor.com
© 2009 Business Monitor International. All rights reserved. All information contained in this publication is copyrighted in the name of Business Monitor International, and as such no part of this publication may be reproduced, repackaged, redistributed, resold in whole or in any part, or used in any form or by any means graphic, electronic or mechanical, including photocopying, recording, taping, or by information storage or retrieval, or by any other means, without the express written consent of the publisher.
DISCLAIMER All information contained in this publication has been researched and compiled from sources believed to be accurate and reliable at the time of publishing. However, in view of the natural scope for human and/or mechanical error, either at source or during production, Business Monitor International accepts no liability whatsoever for any loss or damage resulting from errors, inaccuracies or omissions affecting any part of the publication. All information is provided without warranty, and Business Monitor International makes no representation of warranty of any kind as to the accuracy or completeness of any information hereto contained.
UAE Oil & Gas Report Q3 2009 Including 5-year and 10-year industry forecasts by BMI
Part of BMI's Industry Survey & Forecasts Series
Published by: Business Monitor International
Publication date: July 2009

United Arab Emirates Oil & Gas Report Q3 2009
© Business Monitor International Ltd Page 2

United Arab Emirates Oil & Gas Report Q3 2009
© Business Monitor International Ltd Page 3
CONTENTS
Executive Summary .........................................................................................................................................7
SWOT Analysis.................................................................................................................................................9
United Arab Emirates Political SWOT .................................................................................................................................................................. 9 United Arab Emirates Economic SWOT .............................................................................................................................................................. 10 United Arab Emirates Business Environment SWOT........................................................................................................................................... 11
UAE Energy Market Overview.......................................................................................................................12
Regional Energy Market Overview ...............................................................................................................14
Oil Supply And Demand............................................................................................................................................................................................ 14 Table: Middle East Oil Consumption (000b/d) .................................................................................................................................................... 15 Table: Middle East Oil Production (000b/d) ....................................................................................................................................................... 16
Oil: Downstream ...................................................................................................................................................................................................... 17 Table: Middle East Oil Refining Capacity (000b/d)............................................................................................................................................. 17
Gas Supply And Demand .......................................................................................................................................................................................... 18 Table: Middle East Gas Consumption (bcm) ....................................................................................................................................................... 18 Table: Middle East Gas Production (bcm) .......................................................................................................................................................... 19
Liquefied Natural Gas............................................................................................................................................................................................... 20 Table: Middle East LNG Exports/(Imports) (bcm)............................................................................................................................................... 20
Business Environment Ranking ...................................................................................................................21
Middle East Region................................................................................................................................................................................................... 21 Composite Scores................................................................................................................................................................................................. 21 Table: Regional Upstream Business Environment Rating.................................................................................................................................... 22 Table: Regional Downstream Business Environment Rating ............................................................................................................................... 23 Upstream Scores.................................................................................................................................................................................................. 23 Downstream Scores ............................................................................................................................................................................................. 23 UAE Upstream Rating – Overview ...................................................................................................................................................................... 24 UAE Upstream Rating – Potential Returns.......................................................................................................................................................... 24 UAE Upstream Rating – Risks to Potential Returns............................................................................................................................................. 24 UAE Downstream Rating – Overview.................................................................................................................................................................. 24 UAE Downstream Rating – Potential Returns ..................................................................................................................................................... 25 UAE Downstream Rating – Risks to Potential Returns........................................................................................................................................ 25
Business Environment ..................................................................................................................................26
Legal Framework...................................................................................................................................................................................................... 26 Infrastructure....................................................................................................................................................................................................... 28
Labour Force............................................................................................................................................................................................................ 28 Foreign Investment Policy ........................................................................................................................................................................................ 30
Tax Regime .......................................................................................................................................................................................................... 31 Security Risk ........................................................................................................................................................................................................ 31
Industry Forecast Scenario...........................................................................................................................32
Oil and Gas Reserves................................................................................................................................................................................................ 32 Oil Supply and Demand............................................................................................................................................................................................ 32 Gas Supply and Demand........................................................................................................................................................................................... 34 LNG .......................................................................................................................................................................................................................... 35

United Arab Emirates Oil & Gas Report Q3 2009
© Business Monitor International Ltd Page 4
Refining and Oil Products Trade .............................................................................................................................................................................. 36 Revenues/Import Costs.............................................................................................................................................................................................. 37
Table: UAE Oil & Gas – Historical Data & Forecasts ....................................................................................................................................... 38 Other Energy ............................................................................................................................................................................................................ 39
Table: UAE Other Energy – Historical Data & Forecasts .................................................................................................................................. 40 Key Risks To BMI’s Forecast Scenario..................................................................................................................................................................... 40 Long-Term Oil & Gas Outlook ................................................................................................................................................................................. 41
Macroeconomic Outlook ...............................................................................................................................42
Table: United Arab Emirates – Economic Activity, 2006 – 2013......................................................................................................................... 44
Competitive Landscape .................................................................................................................................45
Table: Key Domestic & Foreign Companies In The UAE Oil And Gas Sector .................................................................................................... 46 Overview/State Role.................................................................................................................................................................................................. 46
Table: Key Upstream Players .............................................................................................................................................................................. 47 Table: Key Downstream Players ......................................................................................................................................................................... 48
Company Monitor...........................................................................................................................................49
Abu Dhabi National Oil Company (ADNOC) ........................................................................................................................................................... 49 Dolphin Energy Ltd (DEL) ....................................................................................................................................................................................... 53 Emarat – Emirates General Petroleum Corporation ................................................................................................................................................ 56 Emirates National Oil Company Limited (ENOC).................................................................................................................................................... 58
BP – Summary ..................................................................................................................................................................................................... 60 Total – Summary.................................................................................................................................................................................................. 60 ConocoPhillips – Summary.................................................................................................................................................................................. 60 ExxonMobil – Summary....................................................................................................................................................................................... 61 Shell – Summary .................................................................................................................................................................................................. 61 Dana Gas – Summary .......................................................................................................................................................................................... 62 Occidental Petroleum – Summary........................................................................................................................................................................ 62 Japan Oil Development Co (JODCO) – Summary............................................................................................................................................... 63 Cosmo Oil – Summary ......................................................................................................................................................................................... 63 Abu Dhabi National Energy Company (TAQA) – Summary................................................................................................................................. 63
Glossary of Terms..........................................................................................................................................65
Oil & Gas Ratings: Revised Methodology ...................................................................................................66
Introduction .............................................................................................................................................................................................................. 66 Ratings Overview...................................................................................................................................................................................................... 66
Table: BMI Oil & Gas Business Environment Ratings: Structure ....................................................................................................................... 67 Indicators.................................................................................................................................................................................................................. 68
Table: BMI Oil & Gas Business Environment Upstream Ratings: Methodology................................................................................................. 68 Table: BMI Oil & Gas Business Environment Downstream Ratings: Methodology ............................................................................................ 69
Oil & Gas Outlook: Long-Term Forecasts ...................................................................................................71
Regional Oil Demand ............................................................................................................................................................................................... 71 Table: Middle East Oil Consumption (000b/d) .................................................................................................................................................... 71
Regional Oil Supply .................................................................................................................................................................................................. 72 Table: Middle East Oil Production (000b/d) ....................................................................................................................................................... 72
Regional Refining Capacity ...................................................................................................................................................................................... 73 Table: Middle East Oil Refining Capacity (000b/d)............................................................................................................................................. 73
Regional Gas Demand .............................................................................................................................................................................................. 74 Table: Middle East Gas Consumption (bcm) ....................................................................................................................................................... 74

United Arab Emirates Oil & Gas Report Q3 2009
© Business Monitor International Ltd Page 5
Regional Gas Supply................................................................................................................................................................................................. 75 Table: Middle East Gas Production (bcm) .......................................................................................................................................................... 75
UAE Country Overview ............................................................................................................................................................................................ 75 Methodology & Risks To Forecasts .......................................................................................................................................................................... 76
BMI Forecast Modelling.................................................................................................................................77
How we generate our industry forecasts ................................................................................................................................................................... 77 Energy Industry ........................................................................................................................................................................................................ 78 Cross checks ............................................................................................................................................................................................................. 78 Sources ..................................................................................................................................................................................................................... 78

United Arab Emirates Oil & Gas Report Q3 2009
© Business Monitor International Ltd Page 6

United Arab Emirates Oil & Gas Report Q3 2009
© Business Monitor International Ltd Page 7
Executive Summary
The latest United Arab Emirates (UAE) Oil & Gas Report from BMI forecasts that the country will
account for 4.52% of Middle Eastern (ME) regional oil demand by 2013, while providing 11.36% of
supply. Regional oil use of 8.24mn barrels per day (b/d) in 2001 rose to an estimated 10.86mn b/d in
2008. It should average 11.09mn b/d in 2009 and then rise to around 12.08mn b/d by 2013. Regional oil
production was 22.87mn b/d in 2001, and in 2008 averaged an estimated 25.94mn b/d. It is set to rise to
28.99mn b/d by 2013. Oil exports are growing steadily, because demand growth is lagging the pace of
supply expansion. In 2001, the region was exporting an average 14.63mn b/d. This total had risen to an
estimated 15.18mn b/d in 2008 and is forecast to reach 16.58mn b/d by 2013. Iraq has the greatest
production growth potential, followed by Qatar.
As regards natural gas, the region in 2008 consumed an estimated 386bn cubic metres (bcm), with
demand of 511bcm targeted for 2013, representing 32.3% growth. Production of an estimated 407bcm in
2008 should reach 625bcm in 2013 (+53.8%), which implies net exports rising to 115bcm by the end of
the period. The UAE in 2008 consumed an estimated 12.44% of the region’s gas, with its market share
forecast at 12.35% by 2013. It contributed an estimated 14.26% to 2008 regional gas production and, by
2013, will account for 14.39% of supply.
In terms of the OPEC basket of crudes, the average price in Q109 was an estimated US$45.78 per barrel
(bbl), down 13% from the US$52.51/bbl recorded during the previous three months. During the second
quarter, there has been little change to our view of oil market developments. BMI is forecasting an
average OPEC basket price of US$51.30/bbl, with the March gains being retained in April, before further
recovery to a possible US$57.00 is seen by June. For 2009, we are still assuming an average OPEC basket
price of US$52.00/bbl (-45% year-on-year). The BMI full year forecast implies Brent crude at US$53.73,
WTI averaging US$54.90/bbl and Urals at US$52.66 for 2009.
For the whole of 2009, the BMI assumption for gasoline is an average US$56.89/bbl, with the price
peaking at a forecast monthly average of US$64.75 in December 2009. The overall y-o-y fall in 2009
gasoline prices is put at 44.1%. For gasoil in 2009, the BMI forecast is for an average price of
US$69.35/bbl, assuming a monthly high of US$94.48/bbl in December. The full-year outturn represents a
42.8% fall from the 2008 level. The monthly average jet fuel price is forecast to range from US$53.75 in
February to US$96.76/bbl in December, proving an annual level of US$71.78/bbl. This compares with
US$124.95/bbl in 2008.
The UAE’s real GDP is forecast by BMI to fall by 1.7% in 2009, following growth of 6.7% in 2008. We
are assuming 3.9% growth in 2010, 4.8% in 2011, 3.9% in 2012, followed by 5.3% in 2013. We expect
oil demand to rise from an estimated 468,000b/d in 2008 to 535,000b/d in 2013, lagging our underlying

United Arab Emirates Oil & Gas Report Q3 2009
© Business Monitor International Ltd Page 8
economic assumptions. State-owned Abu Dhabi National Oil Company (ADNOC) is the biggest
national oil company, working in partnership with major international oil companies (IOCs) to deliver an
estimated 2.80mn b/d of 2009 oil and liquids production, rising to 3.23mn b/d by the end of the forecast
period – subject to OPEC quota policy. Gas production should reach at least 90bcm by 2013, up from an
estimated 58bcm in 2008. Consumption is expected to rise from 48bcm to 63bcm by the end of the
forecast period, allowing exports of 27bcm.
Between 2008 and 2018, we are forecasting an increase in UAE oil production of 24.0%, with volumes
rising steadily to 3.70mn b/d by the end of the 10-year forecast period. Oil consumption between 2008
and 2018 is set to increase by 35.7%, with growth slowing to an assumed 3.0% per annum towards the
end of the period and the country using 635,000b/d by 2018. Gas production is expected to rise from
58bcm to 110bcm by the end of the period. With 2008-2018 demand growth of 83.4%, this provides
export potential rising from 10bcm to 22bcm over the period. Details of BMI’s 10-year forecasts can be
found in the appendix to this report.
UAE is ranked a relatively close second place in BMI’s updated Upstream Business Environment rating,
thanks largely to its significant oil and gas resource base, and investor-friendly climate. It stands seven
points clear of Iraq, so appears secure at least over the medium term. It is unlikely, however, to mount a
near-term challenge on Qatar, four points above it. UAE’s score reflects the country’s gas reserves, high
RPR, plus non-state competition, established licensing framework and generally encouraging country risk
factors. The country is well up the league table in BMI’s Downstream Business Environment rating, with
several high scores and further progress up the rankings possible over the longer term. It is ranked second
behind only Turkey, thanks largely to high scores for oil and gas demand, refining capacity expansion,
and nominal GDP.

United Arab Emirates Oil & Gas Report Q3 2009
© Business Monitor International Ltd Page 9
SWOT Analysis
United Arab Emirates Political SWOT
Strengths Standards of living are high for nationals, which has dampened any demands for greater political representation.
The monarchy enjoys strong support nationwide.
Weaknesses Lack of democracy poses long-term risks given trends towards greater popular participation elsewhere in the region.
Sheikh Khalifa bin Zayed assumed the presidency after the death of Sheikh Zayed al-Nahayan. He is equally conservative and is unlikely to make concerted efforts to address constitutional issues.
The succession lineage is somewhat opaque, raising concerns about longer-term stability.
Opportunities The UAE co-operates closely with other GCC states in security and economic policy.
The UAE is typically a 'dove' within OPEC, sympathetic to the needs of consumer states, which is good for its relations with the West.
Dubai enjoyed a smooth political succession following the death of former ruler Sheikh Maktoum bin Rashid al-Maktoum in January 2006, with new ruler Sheikh Mohammed bin Rashid al-Maktoum welcomed by most of the public.
Threats There is a long-running territorial dispute with Iran, which continues to affect bilateral relations.
Relatively poor living conditions among some foreign workers have led to strikes and demonstrations. Given the size of the expatriate community, this poses some threat to domestic stability.

United Arab Emirates Oil & Gas Report Q3 2009
© Business Monitor International Ltd Page 10
United Arab Emirates Economic SWOT
Strengths The UAE is a member of the Gulf Co-operation Council, which, as well as being a common market, is targeting a common currency by 2010.
The UAE has one of the most liberal trade regimes in the Gulf, and attracts strong capital flows from across the region.
In common with most Gulf states, there are a high number of expatriate workers at all levels of the economy, making up for the otherwise small workforce.
The UAE is progressively diversifying its economy, minimising vulnerability to oil price movements
Weaknesses The UAE's currency is pegged to the dollar, giving it minimal control over monetary policy and reducing its ability to tackle inflationary pressure.
The state's location in a volatile region means that its risk profile is, to some extent, affected by events elsewhere. US concerns about regional militant groups and Iranian WMD programmes could affect investor perceptions.
Opportunities Oil prices are expected to stay high (by historical standards) over the forecast period.
Economic diversification into gas, tourism, financial services and high-tech industry offers some protection against volatile oil prices.
The construction, tourism and financial sectors are growing rapidly, driven by domestic and foreign investment.
Threats Heavy subsidies on utilities and agriculture and an outdated tax system have contributed to persistent fiscal deficits in the past, although rising oil revenues have masked the problem in recent years.
Some bottlenecks have been forming in the construction sector and there is a chance of delays in several high-profile construction projects.

United Arab Emirates Oil & Gas Report Q3 2009
© Business Monitor International Ltd Page 11
United Arab Emirates Business Environment SWOT
Strengths The UAE is a member of the Gulf Co-operation Council, a six member common market, and has been a member of the WTO since 1996.
The state has invested large amounts in infrastructure, and will continue to do so over the next 10 years.
The UAE's diversified economy reduces risks from volatile oil prices. Oil and gas reserves are vast and under-utilised, providing a high reserves-
to-production ratio (RPR) that facilitates medium- to long-term production growth.
Weaknesses Due to the state's federal nature, regulations can vary considerably across
the emirates. The regional economy is oil-dependent. This has historically been very
cyclical, which increases risks for long-term projects. Growth in oil production is subject to OPEC policy and substantial ongoing
investment that can be guaranteed only with continuing IOC participation.
Opportunities Large number of free trade zones offering tax holidays and full foreign ownership.
Comparatively relaxed rules on expatriate employment. The UAE's social stability and relative prosperity means that there is far less
concern for security than in some other Gulf states. The UAE is set to upgrade two refineries by end-2011 in order to meet rising
domestic demand for refined products.
Threats The state is bureaucratic relative to regional peers. Strong oil prices have massively increased liquidity in the region. This has
resulted in strong financial inflows, increasing risks that projects of lower investment potential are currently being funded.
Abu Dhabi in particular has less near- to medium-term oil and gas production upside potential than other Gulf States and investment opportunities elsewhere in the region could make IOCs less enthusiastic regarding longer-term UAE participation.

United Arab Emirates Oil & Gas Report Q3 2009
© Business Monitor International Ltd Page 12
UAE Energy Market Overview
The collection of states that forms the UAE has proven oil reserves estimated at 97.8bn barrels (bbl) (BP
Statistical Review of World Energy, June 2008), or nearly 10% of the world total. The same total is
recorded in the December 2008 Oil & Gas Journal (OGJ) survey. It also houses the world’s fifth largest
natural gas reserves at 6,090bcm at end-2007 and exports significant amounts of liquefied natural gas
(LNG) to Japan. It is also importing gas from Qatar. Abu Dhabi dominates the UAE oil and gas sector,
with 94% of its oil (over 92bn bbl). Dubai contains just 4bn bbl of reserves, followed by Sharjah and Ras
al-Khaimah, with 1.5bn bbl and 100mn bbl respectively.
The UAE is a member of OPEC and it has recently (March 2009) been producing 2.25mn b/d, against
sustainable productive capacity estimated at 2.85mn b/d. Output was reduced in support of OPEC policy,
with the December 2008 meeting allocating a quota of 2.22mn b/d to the Gulf producer. There are also
significant volumes of gas liquids that are exempt from OPEC quotas. Foreign minister Sheikh Abdullah
bin Zayed al-Nahyan announced in April 2007 that UAE oil production capacity will increase to 5mn b/d
by 2014, increasing the UAE’s profile in the Gulf region. Given the probable impact of lower oil prices
on spending plans, this target is unlikely to be met.
There are five operational refineries providing end-2008 capacity of approximately 781,000b/d, according
to the December 2008 OGJ annual survey. UAE oil consumption is estimated at 468,000b/d, while its gas
demand of 48bcm falls short of production at an estimated 58bcm.
For the UAE, gas was in 2007 the dominant fuel, accounting for 63.8% of primary energy demand (PED),
followed by oil at 36.2%. Regional energy demand is forecast to reach 853mn tonnes of oil equivalent
(toe) by 2013, representing 19.6% growth over the period since 2008. The UAE’s estimated 2008 market
share of 9.26% is set to climb to 9.70% by 2013. Electricity generation in the UAE is based on gas and
oil. Gas provides an estimated 97.8% and oil 2.2% of generated electricity.
It is estimated that the UAE electricity sector will require about US$8bn in investment over the next eight
years to meet growing demand, and the government has plans to expand its approximate 10 gigawatts
(GW) of installed capacity by more than 50% during the next decade. It is believed that Dubai alone will
have to invest to boost its power generating capacity to 9.5GW by 2010.
According to BMI calculations, end-2008 installed generating capacity in UAE was around 9GW, all of
which came from conventional thermal sources. In 2008, UAE generated an estimated 78TWh and
consumed an estimated 72TWh of electricity. Since 2000, electricity generation has risen by 50% and
consumption by almost 70%.

United Arab Emirates Oil & Gas Report Q3 2009
© Business Monitor International Ltd Page 13
Under the UAE’s constitution, each emirate controls its own oil production and resource development.
Although Abu Dhabi joined OPEC in 1967 (four years before the UAE was formed), Dubai does not
consider itself part of OPEC or bound by its quotas.
The UAE is considering revising its system of oil and gas concessions to spur technological development
and introduce more competition into its upstream segment. Having concluded its sour gas licensing round
with IOCs, it is expected that ADNOC will focus on reforming the concessions system as it seeks to boost
production capacity.
Several options are being considered for the concessions, including splitting them into their individual
fields and issuing competitive tenders for the fields’ development. Although the concessions are not due
to expire until 2014 at the earliest, it is expected that renegotiations will begin early. This may provide the
opportunity for smaller players to get a toehold into the UAE’s upstream segment and may open the door
for national oil companies (NOCs), particularly from Asia, to get involved. Nevertheless, the UAE is
unlikely to take any action which will put at risk its solid relationship with existing IOC partners.
Pipelines
The start-up of a planned 320km oil pipeline from the Habshan fields to the port of Fujairah has been
delayed by two years, according to a May 2009 statement by Dieter Blauberg, the director of the project.
The project was originally due to come onstream in 2009, but start-up had already been delayed until
2010. Blauberg said in early May 2009 that the project had now been pushed back to August 2011. The
delays have been attributed to the current ‘market conditions’. The pipeline is aimed at bypassing the
Strait of Hormuz. It will initially have a capacity of 1.5mn b/d, which could be increased to 1.8mn b/d at a
later stage. The pipeline will be supplied with oil from the Habshan fields, which are operated by
ADNOC.
China National Petroleum Corporation (CNPC) signed a US$3.29bn deal in November 2008 with the
IPIC to build the oil pipeline. Under the EPC contract for the Abu Dhabi Crude Oil Pipeline, CNPC’s two
pipeline engineering and construction units China Petroleum Pipeline Bureau (CPPB) and China
Petroleum Engineering & Construction Corporation (CPECC) will jointly build the 48-inch diameter
pipeline. The pipeline project will also include the construction of a 12mn bbl oil storage facility at
Fujairah and export terminal facilities. Further, the construction of a refinery at Fujairah is also being
considered by International Petroleum Investment Company (IPIC), but such plans are still at an early
stage, according to Blauberg.

United Arab Emirates Oil & Gas Report Q3 2009
© Business Monitor International Ltd Page 14
Regional Energy Market Overview
The Arabian Gulf states will continue to dominate oil supply, backed by huge and largely untapped
reserves. Gas is another important export product for the region, mainly in the form of LNG. The Gulf
plays a growing role in the supply of the world’s gas. Large parts of the region remain off limits to IOCs,
thanks to state control in the major Gulf states. Iraq is formulating oil laws that may result in foreign
partnerships, however. Investment in Iran by IOCs has come under increasing pressure thanks to the
nuclear standoff. Refinery investment opportunities do exist for IOC partners, with the region building a
substantial surplus with which to meet demand growth in Asia, Europe and North America.
Oil Supply And Demand
Thanks to the Gulf producers, this remains the key region in terms of supply – and has an increasingly
significant role to play as a consumer of oil. Oil- and gas-based wealth creation has stimulated regional
economies, triggering an unwelcome surge in fuel demand that could ultimately have a negative impact
on the export capabilities of Iran and others. The recent fall in crude prices may undermine investment
plans, with some risk of capacity expansion targets being missed. OPEC policy and a relatively high level
of quota adherence points to a meaningful downturn in 2009 regional supply.
Iraq remains the region’s ‘wild card’, having medium-term production potential of at least 3.30mn b/d,
with the government still targeting longer-term supply of up to 6.0mn b/d. For the immediate future,
volumes look set to continue recovering in spite of the uncertain political climate – as well as a lack of
investment in developing new reserves. For the region as a whole, we expect to see output reach 28.39mn
b/d by 2013, representing a gain of 9.04% over 2008. Apart from likely dramatic growth in Iraq, the big
supply winner will be Qatar, with Egypt the most significant loser. With regional consumption set to
reach 11.81mn b/d in 2013, the growing export capability is clearly vast. Some 16.58mn b/d is likely to
be exported in 2013, up from an estimated 13.70mn b/d in 2009.

United Arab Emirates Oil & Gas Report Q3 2009
© Business Monitor International Ltd Page 15
Table: Middle East Oil Consumption (000b/d)
Country 2006 2007 2008e 2009f 2010f 2011f 2012f 2013f
Bahrain 39 40 41 42 44 45 46 48
Iran 1,625 1,621 1,675 1,670 1,687 1,712 1,738 1,772
Iraq 570 620 700 780 850 900 975 1,024
Israel 281 285 285 280 284 288 293 297
Kuwait 275 276 282 284 287 291 297 309
Oman 59 62 63 64 67 71 74 78
Qatar 79 95 98 100 104 110 117 124
Saudi Arabia 2,005 2,154 2,218 2,240 2,285 2,354 2,401 2,485
Turkey 655 666 673 670 683 700 714 736
UAE 419 450 468 473 482 494 516 535
BMI universe 6,007 6,269 6,503 6,604 6,774 6,966 7,172 7,407
Other ME 4,319 4,336 4,345 4,345 4,358 4,371 4,384 4,406
Regional total 10,326 10,605 10,848 10,949 11,132 11,337 11,556 11,813
e/f = estimate/forecast. Historical data: BP Statistical Review of World Energy, June 2008/BMI. All forecasts: BMI.
Middle East regional oil use of 8.24mn b/d in 2001 rose to an estimated 10.85mn b/d in 2008. It should
average 10.95mn b/d in 2009 and then rise to around 11.81mn b/d by 2013. The UAE accounted for an
estimated 4.31% of 2008 regional consumption, with its market share expected to be 4.52% by 2013.

United Arab Emirates Oil & Gas Report Q3 2009
© Business Monitor International Ltd Page 16
Table: Middle East Oil Production (000b/d)
Country 2006 2007 2008e 2009f 2010f 2011f 2012f 2013f
Bahrain 50 49 48 50 55 58 60 57
Iran 4,388 4,401 4,300 4,100 4,200 4,250 4,300 4,450
Israel na na na na na na na na
Kuwait 2,682 2,626 2,750 2,600 2,650 2,750 2,900 3,050
Oman 752 718 730 730 730 725 720 710
Qatar 1,110 1,197 1,280 1,365 1,499 1,609 1,648 1,656
Saudi Arabia 10,853 10,413 10,830 9,850 10,100 10,500 11,000 11,350
Turkey 42 40 41 37 35 33 30 27
UAE 2,971 2,915 2,985 2,800 2,850 2,950 3,100 3,225
BMI universe 22,848 22,359 22,964 21,532 22,119 22,875 23,758 24,525
Iraq 1,999 2,145 2,350 2,400 2,550 2,700 2,950 3,100
Syria 417 397 377 358 340 323 307 292
Yemen 390 317 310 326 374 393 413 433
Other ME 32 33 34 34 35 36 37 38
Regional total 25,687 25,251 26,034 24,650 25,419 26,327 27,465 28,389
e/f = estimate/forecast. na = not applicable. Historical data: BP Statistical Review of World Energy, June 2008/BMI. Forecasts: BMI.
Regional oil production was 22.87mn b/d in 2001, and in 2008 averaged an estimated 26.03mn b/d. It is
set to rise to 28.39mn b/d by 2013. The UAE in 2008 accounted for an estimated 11.47% of regional oil
supply, and its market share is expected to be 11.36% by the end of the forecast period.
Oil exports are growing steadily, because demand growth is lagging the pace of supply expansion. In
2001, the region was exporting an average 14.63mn b/d. This total had risen to an estimated 15.18mn b/d
in 2008 and is forecast to reach 16.58mn b/d by 2013. Iraq has the greatest production growth potential,
followed by Qatar.

United Arab Emirates Oil & Gas Report Q3 2009
© Business Monitor International Ltd Page 17
Oil: Downstream
Table: Middle East Oil Refining Capacity (000b/d)
Country 2006 2007 2008e 2009f 2010f 2011f 2012f 2013f
Bahrain 249 262 262 262 262 262 262 262
Iran 1,732 1,857 1,857 1,900 2,000 2,000 2,000 2,000
Iraq 666 674 674 750 750 1,000 1,150 1,200
Israel 220 220 220 220 220 220 320 320
Kuwait 905 905 905 990 990 990 1,150 1,150
Oman 85 85 85 235 235 235 235 235
Qatar 200 200 350 350 350 550 720 720
Saudi Arabia 2,100 2,100 2,100 2,450 2,530 2,630 2,630 3,430
Turkey 613 613 613 613 613 763 763 800
UAE 620 620 781 1,000 1,000 1,000 1,000 1,150
BMI universe 7,390 7,536 7,847 8,770 8,950 9,650 10,230 11,267
Other ME 694 729 729 765 765 765 803 843
Regional total 8,084 8,265 8,576 9,535 9,715 10,415 11,033 12,110
e/f = estimate/forecast. Historical data: BP Statistical Review of World Energy, June 2008/BMI. All forecasts: BMI.
Refining capacity for the region was 7.46mn b/d in 2001, rising gradually to an estimated 8.58mn b/d in
2008. Oman, Qatar, Iraq, Saudi Arabia, the UAE are all expected to increase significantly their domestic
refining capacity, with the region’s total capacity forecast to reach 12.11mn b/d by 2013 – well ahead of
oil demand, therefore implying substantial net exports of refined products. The UAE’s share of regional
refining capacity in 2008 was an estimated 9.11%, and its market share is set to rise to 9.50% by 2013.
United Arab Emirates Oil & Gas Report Q3 2009
© Business Monitor International Ltd Page 18
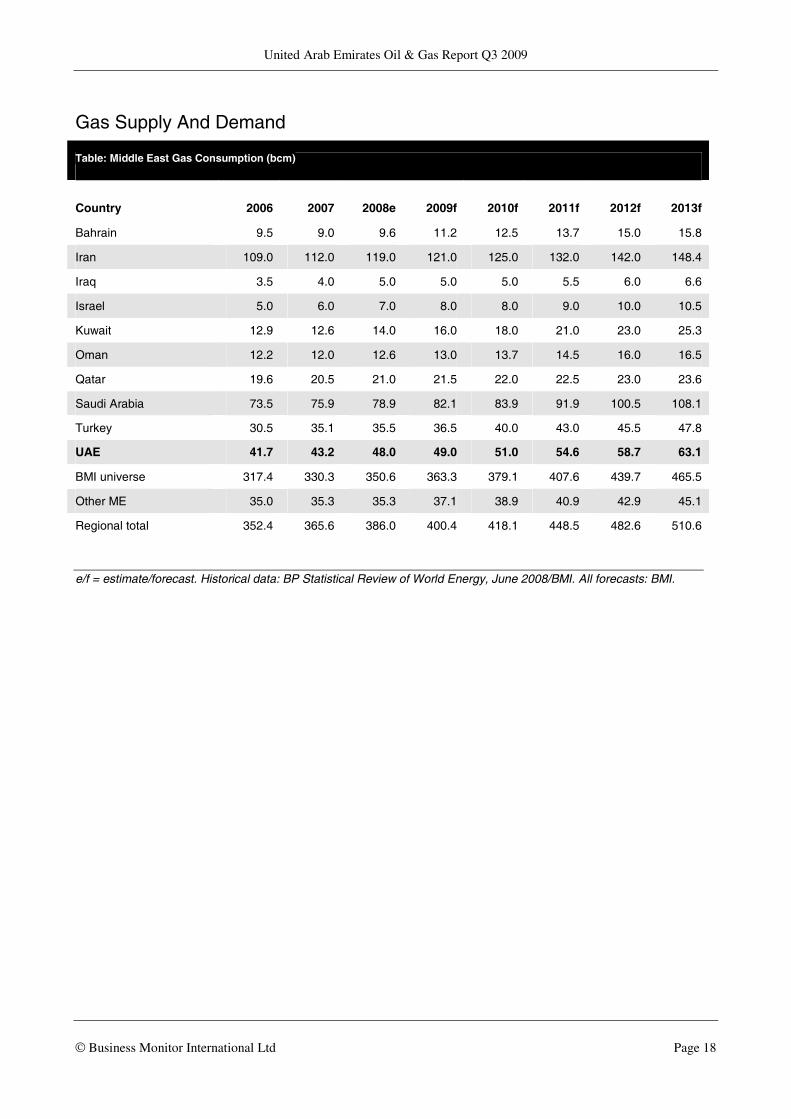
Gas Supply And Demand
Table: Middle East Gas Consumption (bcm)
Country 2006 2007 2008e 2009f 2010f 2011f 2012f 2013f
Bahrain 9.5 9.0 9.6 11.2 12.5 13.7 15.0 15.8
Iran 109.0 112.0 119.0 121.0 125.0 132.0 142.0 148.4
Iraq 3.5 4.0 5.0 5.0 5.0 5.5 6.0 6.6
Israel 5.0 6.0 7.0 8.0 8.0 9.0 10.0 10.5
Kuwait 12.9 12.6 14.0 16.0 18.0 21.0 23.0 25.3
Oman 12.2 12.0 12.6 13.0 13.7 14.5 16.0 16.5
Qatar 19.6 20.5 21.0 21.5 22.0 22.5 23.0 23.6
Saudi Arabia 73.5 75.9 78.9 82.1 83.9 91.9 100.5 108.1
Turkey 30.5 35.1 35.5 36.5 40.0 43.0 45.5 47.8
UAE 41.7 43.2 48.0 49.0 51.0 54.6 58.7 63.1
BMI universe 317.4 330.3 350.6 363.3 379.1 407.6 439.7 465.5
Other ME 35.0 35.3 35.3 37.1 38.9 40.9 42.9 45.1
Regional total 352.4 365.6 386.0 400.4 418.1 448.5 482.6 510.6
e/f = estimate/forecast. Historical data: BP Statistical Review of World Energy, June 2008/BMI. All forecasts: BMI.

United Arab Emirates Oil & Gas Report Q3 2009
© Business Monitor International Ltd Page 19
Table: Middle East Gas Production (bcm)
Country 2006 2007 2008e 2009f 2010f 2011f 2012f 2013f
Bahrain 11.1 11.5 10.6 10.0 10.0 11.0 11.0 13.0
Iran 109.0 112.0 130.0 135.0 142.0 155.0 165.0 190.0
Iraq 3.5 4.0 5.0 8.0 10.0 13.0 15.0 17.0
Israel 5.0 6.0 7.0 7.0 7.0 7.0 7.0 7.0
Kuwait 12.9 12.6 14.1 14.3 14.5 16.2 19.9 20.6
Oman 23.7 24.1 27.0 30.0 30.0 30.0 33.0 35.0
Qatar 50.7 59.8 70.0 88.0 110.0 125.0 133.0 135.0
Saudi Arabia 73.5 75.9 78.9 82.1 83.9 91.9 100.5 108.1
Turkey na na na na na na na na
UAE 47.4 49.2 58.0 63.0 70.0 80.0 85.0 90.0
BMI universe 336.8 355.1 400.6 437.4 477.4 529.0 569.4 615.7
Other ME 5.6 5.5 6.0 6.6 7.3 8.0 8.8 9.7
Regional total 342.4 360.6 406.7 444.0 484.7 537.1 578.3 625.4
e/f = estimate/forecast. na = not applicable. Historical data: BP Statistical Review of World Energy, June 2008/BMI. Forecasts: BMI.
In terms of natural gas, the region in 2008 consumed an estimated 386bcm, with demand of 511bcm
targeted for 2013, representing 32.3% growth. Production of an estimated 407bcm in 2008 should reach
625bcm in 2013 (+53.8%), which implies net exports rising to 115bcm by the end of the period. The
UAE in 2008 consumed an estimated 12.44% of the region’s gas, with its market share forecast at 12.35%
by 2013. It contributed an estimated 14.26% to 2008 regional gas production and, by 2013, will account
for 14.39% of supply.

United Arab Emirates Oil & Gas Report Q3 2009
© Business Monitor International Ltd Page 20
Liquefied Natural Gas
Table: Middle East LNG Exports/(Imports) (bcm)
Country 2006 2007 2008e 2009f 2010f 2011f 2012f 2013f
Iran na na na na na na na 10.0
Oman 11.5 12.2 13.0 15.5 15.0 14.0 16.0 17.0
Qatar 31.0 38.5 43.0 49.5 69.5 82.5 90.0 91.4
Turkey (5.7) (6.0) (6.5) (6.5) (6.5) (6.5) (6.5) (12.0)
UAE 7.1 7.6 8.0 8.0 8.0 9.0 10.0 10.0
Regional total 43.9 52.3 57.5 66.5 86.0 99.0 109.5 116.4
e/f = estimate/forecast. na = not applicable. Historical data: BP Statistical Review of World Energy, June 2008/BMI. All forecasts: BMI.
The leading LNG exporter by 2013 will be Qatar (+112.6% from 2008). Iran has significant longer-term
gas export potential, although the first volumes have yet to flow. The country is signing gas supply deals,
which point to rising LNG sales from 2013. Turkey is set to be a key gas importer, although LNG
volumes will be modest as the country raises pipeline supplies from the likes of Azerbaijan and Iran.

United Arab Emirates Oil & Gas Report Q3 2009
© Business Monitor International Ltd Page 21
Business Environment Ranking
Middle East Region
This updated regional Business Environment scoring system incorporates many more industry-specific
elements and a more sophisticated approach to political and economic risk assessment. The enlarged
scoring matrix is broken down into Upstream and Downstream segments, providing a more detailed
analysis of the growth outlook and market conditions for both major elements of the oil and gas industry.
The Middle East region comprises 10 countries, including all key Gulf states. State influence remains
very high, with limited privatisation activity. Oil production growth for the period to 2013 ranges from a
negative 34% for Turkey (where absolute numbers are already small) to a positive 54% in Iraq, while oil
demand growth ranges from 6% to 46% across the region. Increases in gas output range from zero to
240% across the region over the period to 2013. The spread of gas demand growth estimates ranges from
10% to 64%. The political and economic environment varies, depending partly on market maturity and
specific factors such as the uncertainty in Iraq and the nuclear-inspired stand-off in Iran.
Composite Scores
The UAE and Saudi Arabia now occupy the top and bottom slots of the regional league table. The
composite Upstream and Downstream combined scores are 62 points and 45 points respectively, out of a
possible 100. Qatar now shares first place with the UAE, having as expected retaken Turkey. Turkey
remains well clear of the midfield pack, which comprises Iraq, Israel, Oman and Iran. Iraq is clearly
capable of moving much higher once licensing terms have been established and IOC activity picks up.
Kuwait has remained ahead of Saudi Arabia near the foot of the table. Bahrain has eased away from the
bottom slot, but still appears vulnerable.

United Arab Emirates Oil & Gas Report Q3 2009
© Business Monitor International Ltd Page 22
Table: Regional Upstream Business Environment Rating
Limits of Potential Returns Risks to the Realisation of
Potential Returns
Upstream
Market Country
Structure Limits Industry
Risks Country
Risk Risks Upstream
Rating Rank
Qatar 70 85 74 65 78 69 72 1
UAE 61 80 66 70 80 74 68 2
Iraq 90 35 76 30 14 24 61 3
Turkey 26 90 42 85 61 77 53 4
Iran 69 35 60 20 53 31 52 5
Oman 26 55 33 90 80 86 49 6
Israel 16 75 31 90 77 85 47 7=
Bahrain 21 60 31 85 81 84 47 7=
Kuwait 63 15 51 10 84 36 46 9
Saudi Arabia 56 10 45 10 67 30 40 10
Scores are out of 100 for all categories, with 100 the best. The Upstream Business Environment Rating is the principal rating. It comprises two sub-ratings 'Limits of potential returns' and 'Risks to realisation of returns', which have a 70% and 30% weighting, respectively. In turn, the 'Limits' rating comprises 'Upstream market' and 'Country structure', which have a 75% and 25% weighting, respectively. They are based on the oil and gas resource base/growth outlook and sector maturity (Upstream) and the broader industry competitive environment (Country). The 'Risks' rating comprises 'Industry risks' and 'Country risk', which have a 65% and 35% weighting, respectively, and are based on a subjective evaluation of licensing terms and liberalisation (Industry) and the industry's broader country risk exposure (Country), which is based on BMI's proprietary Country Risk Ratings. The ratings structure is aligned across all the industries for which BMI provides Business Environment Ratings, and is designed to enable clients to consider each rating individually or as a composite. For a list of the data/indicators used, please consult the Methodology section at the end of the report. Source: BMI

United Arab Emirates Oil & Gas Report Q3 2009
© Business Monitor International Ltd Page 23
Table: Regional Downstream Business Environment Rating
Limits of Potential Returns Risks to the Realisation of
Potential Returns
Downstream
Market Country
Structure Limits Industry
Risks Country
Risk Risks Downstream
Rating Rank
Turkey 47 88 57 80 51 69 60 1
UAE 58 46 55 50 72 59 56 2
Israel 33 60 40 100 69 87 54 3
Oman 48 42 46 60 73 65 52 4
Qatar 62 32 55 20 80 44 51 5
Saudi Arabia 61 48 58 10 67 33 50 6
Bahrain 41 48 43 60 71 64 49 7=
Iran 61 48 58 10 58 29 49 7=
Kuwait 52 46 51 15 83 42 48 9
Iraq 56 40 52 10 31 18 42 10
Scores are out of 100 for all categories, with 100 the best. The Downstream Business Environment Rating is the principal rating. It comprises two sub-ratings 'Limits of potential returns' and 'Risks to realisation of returns', which have a 70% and 30% weighting, respectively. In turn, the 'Limits' rating comprises 'Downstream market' and 'Country structure', which have a 75% and 25% weighting, respectively. They are based on the downstream refining capacity/product growth outlook/import dependence (Downstream) and the broader socio-demographic and economic context (Country). The 'Risks' rating comprises 'Industry risks' and 'Country risk', which have a 60% and 40% weighting, respectively, and are based on a subjective evaluation of regulation and liberalisation (Industry) and the industry's broader country risk exposure (Country), which is based on BMI's proprietary Country Risk Ratings. The ratings structure is aligned across all the industries for which BMI provides Business Environment Ratings, and is designed to enable clients to consider each rating individually or as a composite. For a list of the data/indicators used, please consult the Methodology section at the end of the report. Source: BMI
Upstream Scores
Qatar and Saudi Arabia remain the best and worst performers in this segment, showing that the overall
pecking order is quite different to that for combined scores. The UAE is a comfortable second, itself
having a useful seven-point lead over Iraq. However, Iraq has the long-term potential to overtake the
UAE. Turkey, Iran and Oman vie for the middle ground, with Iran having the greatest potential to break
free if the risk outlook improves. The foot of the table is dominated by Bahrain, Kuwait and Saudi Arabia,
in spite of the epic hydrocarbon resources of two of these state-dominated laggards. Saudi has
accumulated less than 60% of the points allocated to Qatar.
Downstream Scores
Turkey and Iraq still bracket the remaining eight ME states in the Downstream rankings, with the former
driven by the size of the fuels market, privatisation moves and the competitive landscape, plus a
reasonable Country Risk rating. Israel has slipped back behind the UAE, in spite of its privatised and

United Arab Emirates Oil & Gas Report Q3 2009
© Business Monitor International Ltd Page 24
deregulated oil market. Oman is now only one point clear of Qatar in fourth place, with the latter under
long-term threat from Saudi Arabia below. There is currently little to choose between Bahrain and Iran,
although either could ultimately be displaced by Kuwait.
UAE Upstream Rating – Overview
UAE is ranked a relatively close second place in BMI’s updated Upstream Business Environment rating,
thanks largely to its significant oil and gas resource base, and investor-friendly climate. It stands seven
points clear of Iraq, so appears secure at least over the medium term. It is unlikely, however, to mount a
near-term challenge on Qatar, four points above it. UAE’s score reflects the country’s gas reserves, high
RPR, plus non-state competition, established licensing framework and generally encouraging country risk
factors.
UAE Upstream Rating – Potential Returns
Upstream Market: On the basis of upstream data alone, UAE ranks fifth, just behind Kuwait, in the ME
region. The country ranks fifth and fourth respectively in terms of proven oil and gas reserves. Its oil and
gas production growth outlook are third and fourth, while the oil and gas RPR are third and fifth
respectively.
Country Structure: Influencing UAE’s third place in the ‘Limits to Potential Returns’ section is the
third-placed country structure, behind Qatar. UAE ranks third by the number of non-state operators in the
upstream sector, and equal third in terms of state ownership of assets.
UAE Upstream Rating – Risks to Potential Returns
Industry Risks: UAE is ranked fifth in the ‘Risks to Realisation of Potential Returns’ section of our
ratings, behind Turkey. Its fifth position for ‘Industry Risks’ is due to a joint first-placed licensing
environment and fifth-placed privatisation trend.
Country Risks: Its broader Country Risk environment is more impressive, ranking UAE equal third with
Oman. The best score is for long-term policy continuity, while corruption fares relatively well. Would-be
investors are also faced with respectable scores for physical infrastructure and rule of law.
UAE Downstream Rating – Overview
The UAE is well up the league table in BMI’s Downstream Business Environment rating, with several
high scores and further progress up the rankings possible over the longer term. It is ranked second behind
only Turkey, thanks largely to high scores for oil and gas demand, refining capacity expansion, and
nominal GDP.

United Arab Emirates Oil & Gas Report Q3 2009
© Business Monitor International Ltd Page 25
UAE Downstream Rating – Potential Returns
Downstream Market: On the basis of downstream data alone, the UAE ranks fourth among the region’s
10 countries, behind Iraq. This score reflects the region’s fifth-ranked refining capacity and oil demand,
third-placed gas consumption and third-placed refining capacity expansion plans.
Country Structure: UAE ranks equal fourth with Qatar in terms of the ‘Limits to Potential Returns’
section, although its Country Structure holds equal sixth place in the region, alongside Kuwait.
Population and nominal GDP rank the country sixth and fourth respectively, while growth in GDP per
capita is the third-highest. State ownership of assets is ranked equal fourth.
UAE Downstream Rating – Risks to Potential Returns
Industry Risks: In the ‘Risks to Realisation of Potential Returns’ section of our ratings, UAE is ranked
fifth, behind Bahrain. Its fifth place for ‘Industry Risks’ reflects the fifth-placed regulatory regime and
fifth-ranked score for privatisation of government-held assets.
Country Risks: Its broader Country Risk environment is good, ranked fourth just behind Oman. The best
and optimum score is for short-term economic external risk, followed closely by short-term policy
continuity. High scores are awarded for rule of law, short-term economic growth risk and physical
infrastructure. Operational risks for private companies are raised only by the state’s legal framework.

United Arab Emirates Oil & Gas Report Q3 2009
© Business Monitor International Ltd Page 26
Business Environment
Legal Framework
The UAE legal system is based on civil law concepts and common law principles – such as adopting
previous court judgments as legal precedent – are usually not recognised.
The legal system follows the federal structure of the UAE, but the constitution acknowledges the right of
individual emirates to opt out of the federal court system, which Dubai and Ras al-Khaimah have done.
These two emirates have their own court systems, which are not subject to the federal Supreme Court.
There are three main branches within the court structure: civil, criminal and shari’a law. The court
structure comprises the following:
The Court of First Instance – which includes the Civil Court, the Criminal Court and the shari’a Court.
This hears all claims, including commercial matters. Commercial disputes involving foreign parties tend
to come before the civil courts, although shari’a law is applicable in all kinds of cases involving both
Muslims and non-Muslims.
The Court of Appeal.
The Court of Cassation – whose judgment is final. Dubai has its own Court of Cassation.
The 1971 constitution established the independence of judiciary. However, in practice, independence is
minimal as all judges are appointed by the government. The five judges of the Federal Supreme Court, for
example, are appointed by the Supreme Council of Rulers, while other judges are appointed by the
Ministry of Justice. Furthermore, judges’ decisions are subject to review by the executive, meaning that
any politically unpopular rulings can be overturned.
Commercial disputes involving foreign companies are usually heard before the federal civil courts, with a
panel of three judges presiding. All cases involving banks and financial institutions must be heard by civil
courts. In Abu Dhabi, all non-arbitration commercial disputes are first taken to the Abu Dhabi
Conciliation Department and if the parties cannot settle, they start legal proceedings in the court of first
instance.
With the UAE now firmly established as a regional business hub, arbitration is now the preferred mode of
dispute resolution involving foreign companies. Yet dispute resolution can be an arduous and uncertain
process and enforcing arbitration judgments can be difficult since court certification is also required. The
judicial process can sometimes take years to conclude. Some companies are reportedly unwilling to resort
to arbitration out of concern that it could affect their future business opportunities in the UAE.

United Arab Emirates Oil & Gas Report Q3 2009
© Business Monitor International Ltd Page 27
In 2006, the UAE ratified the 1958 New York Convention on the Recognition and Enforcement of
Foreign Arbitral Awards – one of the last countries in the region to become a signatory to the convention.
This enables UAE courts to enforce arbitration decisions made in a foreign country. However, the federal
Supreme Court says that a foreign arbitration clause in a registered commercial agency agreement is
invalid, since the Commercial Agency Law states that UAE courts have jurisdiction over commercial
agency disputes. Nevertheless, smoother arbitration should ensure that disputes are handled more quickly
than in the court system.
Although investment laws and regulations are undergoing a period of evolution and becoming more
conducive to foreign investment, at present the regulatory and legal framework still favours local over
foreign nationals. Foreign ownership of land and stocks is restricted, although specific rules vary between
emirates. Dubai and Abu Dhabi have opened up some areas for freehold and leasehold property
investments. Ras al-Khaimah also offers freehold land to offshore companies in designated areas. In Abu
Dhabi, non-GCC nationals can own buildings in certain investment areas but cannot own the land.
However, investors should be aware of impediments to the exercise of rights over property. In Dubai, for
example, foreign owners of ‘freeholds’ cannot register titles with the Dubai Land Department, which
would allow them access to the full range of legal protections and transactions that property ownership
requires. Freeholds are a new phenomenon in Dubai and very few court precedents exist, so there is still
considerable ambiguity concerning property rights and inheritance laws.
The UAE is a regional leader in the protection of intellectual property rights (IPR), with improving
enforcement of copyright, trademark, and patent laws. Anecdotal evidence suggests that the federal
government is enforcing these laws, which were passed in 2002. The rate of software piracy in the UAE
is regarded as one of the lowest in the Middle East. However, enforcement of anti-piracy measures can
vary between emirates, with Dubai seen as the best performer. More could be done in other emirates,
while the UAE still remains a major centre for the trans-shipment of counterfeit goods.
Corruption is not endemic to UAE business life and the country ranks 35th out of 180 states in
Transparency International’s 2008 Corruption Perception Index, second only to Qatar in the Middle East.
Nevertheless, large state-owned enterprises continue to control large swathes of the economy and are not
subject to extensive scrutiny. Furthermore, those convicted of corruption have often escaped effective
punishment – in 2001, the former head of the Dubai Customs and Port Authority was convicted of
corruption and embezzlement and sentenced to 27 years in prison, but was quickly pardoned by the Dubai
government and released. A law passed in 2005 now stipulates minimum sentencing requirements for
public officials found guilty of corruption.
Under its WTO membership obligations, the UAE has undertaken measures to reduce red tape
surrounding the foreign investment approval process. Investors are now exempt from obtaining a Ministry
United Arab Emirates Oil & Gas Report Q3 2009
© Business Monitor International Ltd Page 28
of Labour card in addition to an Immigration Department visa and investors no longer need to appear in
person to inquire about the status of business applications; a new automated service allows them to
receive information about their business licences over the telephone.
Infrastructure
The UAE has around 1,000km of paved roads linking all the emirates, mainly along the coast. The
motorway between Abu Dhabi and the Al-Ain oasis has been upgraded and sections of the road linking
Abu Dhabi and Dubai are also being upgraded. Road is the major means of transport between the
emirates given that there is no railway system.
However, much of the UAE’s international trade is done by sea and all seven emirates have modern port
facilities. Dubai dominates the cargo and re-export markets thanks to the size of its two ports, Port Rashid
and Jebel Ali Port. The former is one of the busiest ports in the Gulf region and has 35 berths, while the
latter has 63 berths and is part of a free economic zone. Abu Dhabi’s Mina Zayed port has been upgraded
to 21 deepwater berths, which has helped eliminate waiting times. All three aforementioned ports have
warehouse facilities that provide storage for imports, with no storage charges for the first 20 days.
Other emirates are seeking a share of the re-export business, although their facilities are currently smaller
than those available in Dubai or Abu Dhabi. Sharjah is the only emirate with ports on both the Persian
Gulf and the Indian Ocean, which offers it significant advantages; international cargo ships can save
around 24 hours in a trip from East Asia to Europe by not having to join the queue to enter the busy Gulf.
Avoiding the Gulf also results in significant insurance savings.
The UAE is home to two major airline carriers; Gulf Air (owned jointly by Abu Dhabi, Bahrain, Oman
and Qatar) and Emirates Air (owned by Dubai). The latter flies to around 80 destinations across Europe,
the Middle East, Australia, Africa and the Indian subcontinent.
Mobile phone use in the UAE is among the highest in the Middle East and indeed the world, with services
provided by two carriers: Etisalat and newcomer Du. Fixed-line services are less popular and although it
is now gaining in popularity – broadband penetration grew from under 3% in 2005 to 5.1% in 2006 –
broadband networks are not as developed as in some neighbouring states, such as Bahrain. Customers
have complained of high prices and poor service quality, although this should improve as Du expands its
services nationwide (the newcomer is currently present only in the free zones).
Labour Force
The total population exceeded 5mn in 2007. A census has been carried out which will determine the
actual size of the labour force, but estimates put it at about 60% of the total population.

United Arab Emirates Oil & Gas Report Q3 2009
© Business Monitor International Ltd Page 29
Exact data on the number of foreign workers in the UAE is not available from the federal government, but
it is estimated that more than 80% of the UAE workforce is expatriate, with as much as 98% of private
sector workers thought to be non-UAE nationals. Most UAE nationals seek employment opportunities in
the public sector, due to the higher salaries, greater benefits, shorter working hours and job security on
offer. The construction sector is a major employer of foreign labour, mainly from the Indian subcontinent.
In recent years, the federal and emirate governments have implemented a number of measures to increase
the cost of hiring expatriate workers, as part of an effort to bring more UAE nationals into the private
sector. ‘Emiratisation’ of the UAE workforce is a government objective, though less rigorously enforced
than in other Gulf States. Compulsory hiring of nationals has been limited to sectors such as banking
(which has a 4% quota), insurance (5%) and trade (2% for companies employing 50 workers or more). In
2006, the government added Emiratisation requirements that all secretaries and PR officers must also be
UAE nationals.
The government continues to try and regulate the labour market, in mid-2007 granting a three-month
amnesty to illegal expatriate workers and their employers, who had either to adjust their status or to leave
the country without incurring penalties. By mid-July, 74,800 people had applied for the amnesty. Calls for
reform of labour laws, including the right to create trade unions, are growing louder. The US insisted on
this during negotiations over its free trade agreement with the UAE. The current law does not specifically
give workers the right to engage in collective bargaining neither do labour laws cover government
employees, domestic servants, and agricultural workers.
Industrial unrest is growing, particularly amongst construction workers, the vast majority of whom come
from the Indian subcontinent. In November 2007, nearly 40,000 labourers working for the country’s
largest construction firm Arabtec went on strike, in a high-profile protest. Whereas previous protests had
called for better living conditions, the most recent wave of unrest has centred on the falling real value of
wages, in light of high UAE inflation and the falling value of the dirham against Asian currencies.
In the wake of those protests, the labour ministry has drawn up new laws, which should come into force
in early 2008. These include the mandatory use of electronic payment systems for unskilled workers,
increased fines for companies found to be employing illegal workers, and compulsory health cover, which
is already in place in Abu Dhabi but will be extended to the other emirates. The ministry has also drawn
up a series of standards for worker accommodation to cover all industry sectors. It is unclear whether the
new rules will extend to domestic servants and agricultural workers. The former currently face
considerable difficulty in negotiating employment contracts because mandatory requirements in the
labour law do not apply to them.
Nevertheless, the minister of labour, Dr Ali bin Abdullah al-Ka’abi, has ruled out any possibility of
expatriates being awarded citizenship, no matter how long they have worked in the emirates or their level

United Arab Emirates Oil & Gas Report Q3 2009
© Business Monitor International Ltd Page 30
of expertise in their field. Furthermore, the UAE is one of the main supporters of the 3+3 labour law that
will be discussed by the GCC in 2008. The law proposes that expatriates’ term of residency within any
GCC country be limited to three years, with a possible three-year extension.
Foreign Investment Policy
The UAE’s investment climate is becoming more clement for foreign direct investors: the federal
government, led by Abu Dhabi, has made significant headway in the past five years in increasing the role
of the private sector. Yet the overall legal framework continues to favour local over foreign investors – a
fact that partly reflects the benign macro environment in light of the country’s substantial oil revenue
windfall. This has endowed local and regional Gulf investors with substantial liquidity, discouraging the
search for new FDI sources from outside the region.
Change may be on the way. In June 2008, the government said a new companies’ law would open some
areas within the services sector to full foreign ownership while also allowing greater foreign participation
in other areas – up to 100% – such as financial services. This is likely to be enacted in 2008. At present,
foreign shareholders may only hold up to a 49% equity interest in limited liability companies; indeed, all
companies established in the UAE are required to have a minimum of 51% national ownership, although
profits may be divided differently. In the insurance sector, companies must be 75%-owned by a UAE
national or 100% by a UAE corporation.
Full foreign ownership is generally only allowed within economic free zones. In order to do business in
the UAE outside the free zones, a foreign business must usually have a UAE national sponsor, agent or
distributor which, once chosen, has exclusive rights. In order to bid for federal projects, a contractor must
be at least 51%-owned by UAE nationals, and tenders must be accompanied by a bid bond – an
unconditional bank guarantee for 5% of the value of the bid. However, government tendering practices do
not live up to international standards and re-tendering is common.
On the positive side, the absence of income tax compensates for the restrictive investment environment.
FDI figures remain difficult to verify, though data from UNCTAD claims that FDI inflows totalled
US$8.4bn in 2006, with much of it attracted to the booming real estate and construction sectors. The UAE
is now the Gulf’s second biggest FDI destination after Saudi Arabia. Perhaps even more impressive,
given the massive investments made by UAE firms and individuals outside the emirates, the country has
more inward FDI stock by foreigners than nationals’ outward FDI stock in foreign countries. According
to a Dubai Chamber of Commerce & Industry report in 2007, during 1997-2006, the average net inward
FDI flows as percentage of gross fixed capital formation was 17% for UAE.
Until now, the main destinations for FDI have been ICT and software, tourism and textiles. The main
sources of FDI are the UK, the US and India.
United Arab Emirates Oil & Gas Report Q3 2009
© Business Monitor International Ltd Page 31
Tax Regime
The UAE’s substantial hydrocarbons resource revenues means government has no pressing need to raise
income via direct taxes.
Only banks and oil companies pay corporate tax, at a rate of 50% (55% in Dubai) for oil companies. Oil
companies also pay royalties on oil and gas they produce. Net taxable income of foreign banks is subject
to tax at a flat rate of 20%, implemented in Abu Dhabi and Dubai. Alongside all the other benefits
enjoyed by companies operating in the free trade zones, there is no corporate tax for 15 years, renewable
for an additional 15 years.
There is no income tax on individuals resident in the UAE. There is no VAT in the UAE, but the federal
government, under the advice of the IMF, is discussing the introduction of a VAT system. This is unlikely
to be introduced in the near term, however. There are no withholding or capital taxes. Business properties
pay a municipal tax set at 10% of annual rental value. Double taxation agreements exist with France,
Pakistan, Poland, Turkey, China, Romania, Italy, Egypt, Germany, Singapore, Malaysia, Indonesia and
India.
Security Risk
While there remains a generalised threat of terrorism throughout the Middle East, the UAE has not yet
been the target of a major attack. Given the large number of expatriate workers and the high visibility of
Western businesses in the country, particularly in Abu Dhabi and Dubai, authorities have stepped up
security measures in recent years. However, unlike neighbouring Saudi Arabia, the UAE has no known
domestic groups operating on its territory and the Emirates rank top in BMI’s regional risk ratings and
state terrorism vulnerability index for the Middle East.
Risks to physical safety are also relatively low, despite the large number of foreign non-citizens. The vast
majority are Muslim, coming from south Asia or other Arab states, and work in low-paid, unskilled jobs.
Those that are more attractive targets for criminal gangs, namely highly-paid expatriates from Europe and
other Western states, tend to live in well-guarded compounds. Furthermore, security and police forces are
well-equipped and well-trained.
Some visitors have run into trouble with Iranian Coast Guard forces for alleged violation of Iranian
territorial waters around the island of Abu Musa, located around 20 miles from Dubai city. The UAE and
Iran are locked in a long-running dispute over the jurisdiction of Abu Musa and two other islands in the
Gulf, and sailing in these waters can result in the seizure of vessels and detention of passengers in Iran.

United Arab Emirates Oil & Gas Report Q3 2009
© Business Monitor International Ltd Page 32
Industry Forecast Scenario
Oil and Gas Reserves
Our view is that the UAE’s proven oil reserves will slip gradually over the period to 2013, dropping to
92.6bn bbl from the current 97.8bn. Exploration and development activity is now on the rise, but may not
be sufficient to maintain the current reserves position while delivering rising output. However, we see
scope for some expansion of gas reserves, perhaps to 6,135bcm over the next five years.
Oil Supply and Demand
UAE crude supply averaged 2.25mn b/d
in March 2009 and is thought to have
slipped below 2.20mn b/d in April, as the
UAE brought supplies down to its agreed
OPEC quota level. Sustainable capacity
is estimated at 2.85mn b/d.
Longer-term supply expansion from Abu
Dhabi is likely to shift offshore, to the
Upper Zakum and Umm Shaif fields. The
impact of these projects is likely to be felt
only at the end of the forecast period.
Several projects to upgrade infrastructure
at existing oil fields are on the cards or
under way. There is a US$300mn project to increase the capacity of the onshore Bu Hasa field. The goal
is to increase capacity to 480,000b/d. A gas re-injection project is also planned for the onshore Bab field,
which is expected to increase capacity to 350,000b/d. Upgrades planned for the onshore Asab field should
boost capacity from 280,000b/d to 310,000b/d. These projects are part of an overall goal of raising the
UAE’s capacity to 3.5mn b/d by 2010, a target that is considered by BMI to be barely achievable.
ADNOC will spend US$10bn on field developments, according to media sources in June 2008.
The offshore oil and gas production unit of ADNOC is aiming to boost oil production by two-thirds to
1mn b/d by 2019. Abu Dhabi Marine Operating Company (ADMOC), in which Total, BP and Japan’s
Inpex are shareholders, will raise oil output by 50% ‘within the next few years’, said Ali al-Jarwan,
general manager of ADNOC in the company’s house magazine in April 2008.
UAE Oil Production, Consumption & Exports
(2000-2013)
0
500
1000
1500
2000
2500
3000
3500
2000
2001
2002
2003
2004
2005
2006
2007
2008
e20
09f
2010
f20
11f
2012
f20
13f
0
500
1000
1500
2000
2500
3000
oil production, 000 b/doil consumption, 000 b/doil exports, 000 b/d (RHS)
e/f = estimate/forecast; Source: Historical data - BP Statistical Review of World Energy, June 2008; Forecasts - BMI

United Arab Emirates Oil & Gas Report Q3 2009
© Business Monitor International Ltd Page 33
ADNOC in June 2004 brought in ExxonMobil as a strategic partner in the development of the Upper
Zakum field, with a 28% ownership stake. ExxonMobil is set to undertake a programme of upgrades to
the Upper Zakum field to raise its capacity from the current 750,000b/d to 1.2mn b/d by 2010. In late
March 2009, ExxonMobil announced that it is looking at ways to cut development costs at the Upper
Zakum oil field project.
Occidental Petroleum agreed in October 2008 to pay ADNOC US$500mn to acquire the rights to
explore and develop two oil and gas fields, Jarn Yaphour and Rahman, in the emirate. Occidental will
operate and hold a 100% interest in hydrocarbons output from the fields. The company’s total capital
expenditure in both projects is expected to be around US$500mn over the next three to four years. First
production from the Jarn Yaphour field, located onshore near the capital city of Abu Dhabi, is expected in
2009, with initial output seen at around 10,000 barrels of oil equivalent per day (boe/d). Potential output
from Rahman is also estimated at 10,000boe/d, according to Occidental, with a likely 2011 start date.
The start-up of a planned 320km oil pipeline from the Habshan fields to the port of Fujairah has been
delayed by two years, according Dieter Blauberg, the director of the project. The project was originally
due to come on stream in 2009, but start-up had already been delayed until 2010. Blauberg said in early
May 2009 that the project had now been pushed back to August 2011. The delays have been attributed to
the current ‘market conditions’. The pipeline is aimed at bypassing the Strait of Hormuz. It will initially
have a capacity of 1.5mn b/d, which could be increased to 1.8mn b/d at a later stage. The pipeline will be
supplied with oil from the Habshan fields, which are operated by ADNOC.
Overall UAE crude production could reach 3.23mn b/d by 2013. We are assuming total 2009 production
averaging 2.80mn b/d (including gas liquids), providing exports of 2.33mn b/d. This represents a 6.5%
decline from the estimated 2008 level, thanks to OPEC policy.

United Arab Emirates Oil & Gas Report Q3 2009
© Business Monitor International Ltd Page 34
Gas Supply and Demand
Over the last decade, gas consumption in
Abu Dhabi has doubled. The
development of gas fields also results in
increased production and exports of
condensates, which are not subject to
OPEC production quotas. Dubai’s gas
consumption has been growing by nearly
10% annually, due to the expansion of
the emirate’s industrial sector, a switch to
gas by its power stations, and the need
for an enhanced oil recovery (EOR)
system based on gas injection for its
mature oilfields. The UAE imports and
exports gas, using a growing regional
pipeline system and LNG. Overall UAE
gas consumption is forecast to reach 63.1bcm by 2013. Production of gas is on the rise, with 90.0bcm
achievable by 2013 – providing exports of 26.9bcm.
According to French oil company Total, the UAE’s sour gas reserves, which ADNOC will develop in a
JV with IOCs, are only expected to produce 10.2bcm per annum, a third of the original estimate of
31bcm. Although some of the largest IOCs, including BP, ConocoPhillips and Total, have confirmed
their interest in the project, it remains to be seen whether their enthusiasm will diminish due to the
apparently lower production levels. In May 2007, ADNOC’s Onshore Division Manager Mohamed Bin
Juma confirmed Total’s prediction, stating that production could lie anywhere between 5.1bcm and over
10.2bcm per annum. The project is still expected to cost about US$10bn. ADNOC asked IOCs to make
bids based on different production plateau rates, as costs will depend on how much gas is produced.
July 2008 saw US major ConocoPhillips sign a contract to develop the Shah sour gas field. The gas in the
Shah field has a content of around 30% hydrogen sulphide, which is highly toxic, making production
much more testing and expensive than conventional gas development. Despite this, as technology has
improved over recent years and oil and gas prices have risen, the exploitation of sour gas reserves has
become economically profitable. The tender for the Shah field followed the cancellation of an earlier
tender in July 2007 for both the Shah and Bab fields, after a period of escalating cost projections and a
downgrading of the potential output volumes from the project.
The project will involve the construction of a new 10.3bcm gas processing plant at the Shah gas field,
new gas and liquid pipelines and sulphur-exporting facilities at Ruwais. ConocoPhillips will hold a 40%
UAE Gas Production, Consumption & Exports
(2000-2013)
0
20
40
60
80
100
2000
2001
2002
2003
2004
2005
2006
2007
2008
e
2009
f
2010
f
2011
f
2012
f
2013
f
0
5
10
15
20
25
30
Gas Production, bcm LHSGas Consumption, bcm LHSGas Exports, bcm RHS
e/f = estimate/forecast; Source: Historical data - BP Statistical Review of World Energy June 2008; Forecasts – BMI.
United Arab Emirates Oil & Gas Report Q3 2009
© Business Monitor International Ltd Page 35
share in the Shah field, while Abu Dhabi Gas Industries Co (Gasco) will retain the remaining 60%. The
two companies will share development costs and although ADNOC did not reveal the value of the
agreement, it is expected that the project will cost at least US$10bn. While no further details have been
released, the deal is expected to allow Conoco to book new reserves from the Shah field, in line with
similar deals between ADNOC and other majors such as ExxonMobil and BP.
On October 31, 2008, Abu Dhabi-based Dolphin Energy began exporting gas to Oman from Qatar’s
North Field, after the project incurred several delays due to technical difficulties on Oman’s side. With
the pipeline now on stream, the first stage of the US$3.5bn project to connect the Arab Gulf region
through a gas network has been implemented successfully, connecting Qatar with the UAE and Oman.
Dolphin has been supplying the UAE with an annualised 20.7bcm of gas since February 2008. The
company has said that eventually the North field will supply the UAE with as much as 33bcm per year.
Crescent Petroleum, based in the UAE, has said that it is optimistic that it will finalise a gas import deal
with Iran, despite opposition from Mohammad-Reza Rahimi, Iran’s vice president for parliamentary
affairs. Crescent Petroleum and Iran have been negotiating terms over gas supplies from Iran to UAE
since 2006. According to Hamid Zaheri, Crescent’s general manager in Iran, the two sides continue to
disagree over the price and volume of gas exports. Crescent has been looking to buy gas from Iran’s
offshore Salman field since 2006.
LNG
Abu Dhabi Gas Liquefaction Company (Adgas) – a joint venture (JV) between ADNOC, Japan’s
Mitsui, and oil majors BP and Total – in November 2005 invited contractors to submit technical and
commercial bids for a feasibility study contract to suggest options for replacing two of its ageing LNG
trains at Das Island with one ‘mega-train’. Companies invited to bid included the UK’s Costain Oil, Gas
& Process, Australia’s WorleyParsons, US companies Foster Wheeler and Fluor, as well as Japan’s
Chiyoda. For its new ‘mega-train’, Adgas is looking for a base capacity option of 5-8mn tonnes per
annum (tpa).
Dubai in 2008 began the construction of its US$1bn LNG storage facility. The Dubai Multi Commodities
Centre (DMCC) hopes that the facility, which will be located at Techno Park in Dubai, will be used to
launch an LNG derivatives market. The project is operated by a JV between DMCC and LNG Impel,
which was formed in May 2006. DMCC, as an equity-providing owner, will only hold a 10% stake in the
project. Impel will own around 20-30%, with customers having the right to buy equity stakes.
The project is expected to eventually have a storage capacity of between 1.1bcm and 1.8bcm, depending
on how many customers the facility will have. No regasification facilities have been planned. DMCC will
select about 10 companies, which will use the facilities on a long-term basis. In November 2006, the

United Arab Emirates Oil & Gas Report Q3 2009
© Business Monitor International Ltd Page 36
project attracted its first five customers, which allows the initial construction of 11 tanks, each holding
200,000 cubic metres. The three-stage project is set to be completed by 2013.
Royal Dutch Shell has signed a 15-year agreement with Dubai, under which it will sell Dubai 1.5mn tpa
of LNG in the peak demand summer period from 2010. According to Shell, much of the LNG will be
sourced from Qatar, while some volumes will come from elsewhere in Shell’s portfolio.
Refining and Oil Products Trade
The UAE has four refineries: two in Abu Dhabi operated by ADNOC, one in Dubai operated by ENOC
and one in Sharjah operated by Sharjah Oil Refining. By far the largest is the Ruwais plant in Abu
Dhabi, which originally had capacity of 120,000b/d. An upgrade project to expand capacity to 350,000b/d
was completed in 2005, including refits of existing units and expansion of units for production of
unleaded gasoline and low-sulphur fuel oil. The plant produces light products mainly for export to Japan
and elsewhere in Asia. Fuel oil from Ruwais is sold as bunkers by ADNOC and also used for domestic
electric power generation. The Umm al-Nar refinery, also owned by ADNOC, has a capacity of
150,000b/d. Since its construction in 1976, the Umm al-Nar plant has undergone de-bottlenecking, as
well as a recent expansion.
The UAE is set to upgrade two refineries by end-2011 in order to meet rising domestic demand for
refined products. According to the IEA’s timetable for scheduled upgrades in global refining capacity,
published in December 2008, the two refineries to be upgraded are the Ruwais refinery and the Jebel Ali
refinery in Dubai. The IEA report says the upgrade is scheduled to be completed in Q411. The Jebel Ali
refinery has a 70,000b/d LPG-naphtha hydrotreater and a 36,000b/d crude catalytic reformer. The
expansion is due to be completed in Q109.
Abu Dhabi’s investment arm IPIC and ConocoPhillips signed a deal in 2006 for a new refinery with
500,000b/d capacity. Conoco pulled out in 2007 citing rising costs and IPIC announced in March 2008
that the plant’s capacity would be reduced to less than 200,000b/d. Since then it has been looking for a
new European partner for the project but has reported no progress. The global financial crisis and
concerns over the rate of Asian growth mean this project may not proceed. The Ruwais project upgrade
looks more secure, although it is uncertain as to whether capacity will be expanded to as much as
817,000b/d. In addition, it may make sense to delay the project in order to take advantage of falling
construction costs, meaning there could be some risk to the completion date of Q411 being achieved.
Quality Energy Petro Holding International, which is owned by a member of Abu Dhabi’s al-Otaiba
family, announced plans in February 2008 to build a US$13bn oil refinery in the UAE and seek Iranian
crude as feedstock. This would dramatically increase the refining capacity of the emirates, as well as
strengthening links with Iran. Quality Energy intends to build a 500,000b/d complex with the government

United Arab Emirates Oil & Gas Report Q3 2009
© Business Monitor International Ltd Page 37
of Russia’s Chelyabinsk region, in which the company plans to invest US$100bn between now and 2012,
according to Chairman Adil al-Otaiba. He explained that the Chelyabinsk government is negotiating with
Iranian authorities to provide the crude for the UAE plant. Quality Energy is in talks with the rulers of
one of the UAE’s northern emirates about building the plant, he said, without giving a date for the start of
construction or a final location. This suggests that plans are at a very early stage and may not come to
fruition, given the complex multi-party nature of the proposal.
Revenues/Import Costs
The BMI base case assumption see the OPEC basket oil price average US$52.00/bbl in 2009, US$58 in
2010, US$65/bbl in 2011 and US$70/bbl in 2012-13. With the volume trend discussed above, these
assumptions imply an increase in estimated crude export revenues from US$44.17bn in 2009 to
US$68.74bn by 2013. As gas production is expected to provide net exports of 26.9bcm by 2013, there
will be additional revenues of US$6.14bn, taking the end-period total for hydrocarbons exports to
US$75.25bn.

United Arab Emirates Oil & Gas Report Q3 2009
© Business Monitor International Ltd Page 38
Table: UAE Oil & Gas – Historical Data & Forecasts
2006 2007 2008e 2009f 2010f 2011f 2012f 2013f
Oil Proven Reserves, bn bbl 97.8 97.8 97.8 97.0 95.9 94.9 93.7 92.6
Oil Production, 000b/d 2,971 2,915 2,985 2,800 2,850 2,950 3,100 3,225
Oil Consumption, 000b/d 419 450 468 473 482 494 516 535
Oil Refinery Capacity, 000b/d (EIA/BMI) 620 620 781 1,000 1,000 1,000 1,000 1,150
Oil Exports, 000b/d (BMI) 2,552 2,465 2,517 2,327 2,368 2,456 2,584 2,690
Oil Price, US$/bbl, OPEC basket 61.1 69.1 94.1 52.0 58.0 65.0 70.0 70.0
Value of Petroleum Exports, US$mn (BMI base case) 57,970 63,396 89,469 46,610 53,901 63,980 72,361 75,246
Value of Oil Exports, US$mn (BMI base case) 56,895 62,153 86,427 44,172 50,128 58,264 66,010 68,742
Value of Oil Exports at constant US$50/bbl – US$mn 46,574 44,986 45,935 42,474 43,214 44,819 47,150 49,102
Value of Oil Exports at constant US$100/bbl – US$mn 93,148 89,973 91,871 84,947 86,427 89,637 94,300 98,203
Value of Petroleum Exports at constant US$50/bbl – US$mn 47,518 45,908 47,552 44,818 46,467 49,215 51,687 53,747
Value of Petroleum Exports at constant US$100/bbl – US$mn 95,037 91,817 95,104 89,635 92,933 98,431 103,374 107,495
Refined Petroleum Products Exports, 000b/d (BMI) 139 108 235 427 418 406 384 500
Gas Proven Reserves, bcm 6,110 6,090 6,050 6,050 6,300 6,300 6,220 6,135
Gas Production, bcm 47.4 49.2 58.0 63.0 70.0 80.0 85.0 90.0
Gas Consumption, bcm 41.7 43.2 48.0 49.0 51.0 54.6 58.7 63.1
Gas Exports, bcm (BMI) 5.7 6.0 10.0 14.0 19.0 25.4 26.3 26.9
Value of Gas Exports, US$mn (BMI base case) 1,076 1,243 3,042 2,438 3,773 5,716 6,351 6,504
Value of Gas Exports at constant US$50/bbl – US$mn 944 922 1,617 2,344 3,253 4,397 4,537 4,646
Value of Gas Exports at constant US$100/bbl – US$mn 1,889 1,844 3,234 4,688 6,506 8,793 9,073 9,291
LNG Exports, bcm 7.1 7.6 8.0 8.0 8.0 9.0 10.0 10.0
LNG Price, US$/mn BTU 7.14 7.73 10.53 5.82 6.49 7.27 7.83 7.83
LNG Revenues, US$mn (BMI) 1,419 1,645 2,358 1,303 1,454 1,833 2,193 2,193
e/f = estimate/forecast. Source: Historical data - BP Statistical Review of World Energy June 2008, Forecasts - BMI.

United Arab Emirates Oil & Gas Report Q3 2009
© Business Monitor International Ltd Page 39
Other Energy
The Emirates International Bank in 2007 carried out a survey to ascertain whether the UAE will be
able to cope with increased electricity demand. It concluded that the UAE’s generating capacity will have
to increase by 60% in just four years, with the Dubai market growing most rapidly.
It is estimated that the UAE electricity sector will require at least US$8bn in investment over the next six
to eight years to meet growing demand, and the government has plans to expand its approximate 10GW
of installed capacity by more than 50% during the next decade. It is believed that Dubai alone will have to
boost its power generating capacity to 9.5GW by 2010. DEWA continues to invest heavily to raise power
generation and desalination capacity to match demands, as a result of the boom in residential and
commercial development, and recently unveiled the new 1.3GW power and desalination project in Jebel
Ali. Abu Dhabi had 1.05GW of new capacity at Taweelah come on stream in 2008, but has
decommissioned an older 850MW unit at Umm al-Nar. DEWA expects a 2GW expansion at Jebel Ali by
2010 and is seeking bids for a 3GW plant at the same location for 2012 start-up.
BMI estimates suggest that end-2008 installed generating capacity of approximately 9GW could increase
to around 12GW by 2013, although government targets are considerably higher.
Conventional thermal sources are expected to remain the dominant fuel for electricity generation in the
coming years, with most power projects under construction or planned using gas. There is a long-term
possibility of diversification into nuclear, while other options are being considered in order to cap gas
usage.
The country’s power consumption is expected to increase from an estimated 72TWh in 2008 to 95TWh
by the end of the forecast period, representing a broadly balanced market if the country delivers the
assumed 6.1% annual growth in electricity generation. Gross UAE power generation in 2008 was an
estimated 78TWh, having grown 9.5% over the 2007 level. BMI is forecasting an average 6.1% annual
increase to 101TWh by 2013 – all of which will be thermal.
The UAE has officially begun its venture into nuclear power, after it invited bids for the project
management contract for its nuclear facilities. The company which wins this contract will initially
conduct the feasibility study and environmental impact assessment. According to Emirates Business, the
bids for this very initial stage were due to close in July 2008, while the final contract will not be finalised
until at least the end of the year. Britain’s Amec, providers of technical consultancy and engineering
services for the energy, utilities and mining sectors, is one of the nine bidders that have been shortlisted
for the contract, a company spokesperson said. The UK’s Independent newspaper reported on June 22
that other nuclear players tipped by industry insiders to be on the shortlist include the US’s CH2M Hill,

United Arab Emirates Oil & Gas Report Q3 2009
© Business Monitor International Ltd Page 40
Bechtel and Fluor. The UAE’s nuclear programme will see investments of up to US$40bn, for the
construction and operation of 14 nuclear facilities.
The government issued a White Paper on nuclear power in April 2008, which reaffirms the government’s
commitment to peaceful nuclear power development, as well as an enhanced regulatory and secure
environment for such development to take place. The White Paper is introduced by a statement saying
that ‘the UAE’s interest in evaluating nuclear energy is motivated by the need to develop additional
sources of electricity to meet future demand projections’.
Despite considerable solar generating potential, renewable energy is not expected to contribute
significantly to overall generation during the forecast period. The government of Abu Dhabi is expected
to publish a broad energy policy which will emphasise its commitment that renewable energy will
represent 7% of the total power generation capacity by 2020.
Table: UAE Other Energy – Historical Data & Forecasts
2006 2007 2008e 2009f 2010f 2011f 2012f 2013f
Coal Reserves, mn tonnes na na na na na na na na
Coal Production, mn tonnes na na na na na na na na
Coal Consumption, mn toe na na na na na na na na
Electricity Generation, TWh 66.2 70.8 77.5 78.7 81.0 87.0 94.0 101.1
Thermal Power Generation, TWh 66.2 70.8 77.5 78.7 81.0 87.0 94.0 101.1
Hydroelectric Power Generation, TWh na na na na na na na na
Consumption of Hydroelectric Power, TWh na na na na na na na na
Consumption of Nuclear Energy, TWh na na na na na na na na
Primary Energy Consumption, mn toe 58.0 60.9 66.0 67.0 69.5 73.0 78.0 82.7
e/f = estimate/forecast; na = not applicable. Source: Historical data - BP Statistical Review of World Energy June 2008, Forecast - BMI.
Key Risks To BMI’s Forecast Scenario
The impact of oil prices on export revenues is considerable. Dependent on OPEC output policy, our
production forecasts look realistic, so fluctuations in the price of crude represent the biggest risk for the
UAE. Assuming a flat US$50/bbl OPEC basket price, oil and gas export revenues in 2013 could be as
United Arab Emirates Oil & Gas Report Q3 2009
© Business Monitor International Ltd Page 41
low as US$53.75bn. However, a US$100/bbl oil price scenario boosts petroleum export revenues to
US$107.50bn in 2013.
Long-Term Oil & Gas Outlook
Details of BMI’s 10-year forecasts can be found in the appendix to this report. Between 2008 and 2018,
we are forecasting an increase in UAE oil production of 24.0%, with volumes rising steadily to 3.70mn
b/d by the end of the 10-year forecast period. Oil consumption between 2008 and 2018 is set to increase
by 35.7%, with growth slowing to an assumed 3.0% per annum towards the end of the period and the
country using 635,000b/d by 2018. Gas production is expected to rise from 58bcm to 110bcm by the end
of the period. With 2008-2018 demand growth of 83.4%, this provides export potential rising from 10bcm
to 22bcm over the period.
United Arab Emirates Oil & Gas Report Q3 2009
© Business Monitor International Ltd Page 42
Macroeconomic Outlook
Downturn Raises Employment Questions
BMI View: We are forecasting recession for the UAE in 2009, with lower oil prices and reduced
investment spending two of the key culprits. The downturn will bring employment regulations to the fore,
as the government balances the need to encourage continued immigration while protecting the
employment of UAE citizens.
While recently released figures from the Ministry of Economy confirmed the UAE’s strong economic
expansion in 2008, we believe that government bullishness regarding the effectiveness of its fiscal rescue
package is somewhat misplaced. We remain bearish regarding the country’s growth prospects this year;
indeed, we are now forecasting an outright recession, with the economy expected to contract by 1.7%. In
our view, government spending will limit the downside and stave off job losses in key sectors, but will
not be sufficient to counteract fully the contraction in trade volumes, the slowing of consumer spending
on the back of population losses and the severe cutting back of investment plans.
Good Times Are Past
A recent statement by Sultan bin Saeed al-Mansouri, the UAE Minister of Economy, put real GDP
growth at 7.4% in 2008, slightly above our 6.9% estimate for the year. While we are still awaiting a full
breakdown of GDP by expenditure from the ministry or the central bank, the minister’s statement
confirmed a number of key trends that we were following throughout the year. Most important of these
was the surge in oil revenues as prices peaked in the middle of the year. Overall, the contribution of the
oil sector to GDP rose from 35.9% in 2007 to 37.9% in 2008. The second trend was the sharp upswing in
investment spending, much of which was ploughed into real estate developments.
Both these trends have already witnessed a sharp reversal. On the oil front, we are forecasting an average
price of US$52/bbl for the OPEC basket in 2009, not much more than half the 2008 average of
US$94.08/bbl. Oil prices are likely to creep up again as global demand recovers in the second half of this
year and from 2010 onwards, but we a return to 2008 levels is unlikely in the foreseeable future.
Lower oil prices, combined with stricter lending requirements by banks and greater caution among
investors whose fingers have been burned (or are still getting burnt) by the collapse in real estate prices
will also translate into less exuberant investment plans. We see real growth in gross fixed capital
formation (GFCF) remaining in single digits over the next two to three years, rather than the rates of 15-
20% (or likely even higher in 2008) seen over the past three, as plans for many real estate projects are
shelved, others are scaled back and the government begins to play a more central role in infrastructure
development.

United Arab Emirates Oil & Gas Report Q3 2009
© Business Monitor International Ltd Page 43
Acknowledging The Problem
While the economy ministry is painting a bullish picture, comments from elsewhere in the ruling elite
suggest that the government does recognise the magnitude of the challenge facing the UAE economy this
year. In mid-March, the central bank governor, Sultan bin Nasser al-Suweidi, admitted that growth was
likely to slow to low single digits, or could even turn negative, this year. He promised interest rate cuts to
stimulate growth, although as is the case around the world, the real problem is translating central bank
cuts into lower market rates for consumers and businesses. At the time of writing, the UAE interbank
offered rate (AEIBOR) stood at 2.9188%, compared with a central bank repo rate of 1%.
Another key area where the government is sitting up and taking notice is population growth. We have
long argued that a steady expansion of the population is essential to the UAE’s growth plans.
Immigration, by both highly skilled white collar workers and unskilled labourers, has fuelled the
country’s recent boom. Highly skilled migrants have brought experience and expertise in key non-oil
sectors such as financial services and construction, while labourers from south Asia have provided the
manpower for the bulk of construction projects. On top of this, steady population expansion has driven
increases in consumer spending and fuelled demand for housing, particularly in Dubai, the first emirate to
allow foreign ownership of property.
With many construction sites now lying untouched, large numbers of labourers have lost their jobs, and
redundancies have spread to office workers in the real estate and financial sectors. With most visas for
foreign workers tied to employment, those that lose their jobs often have only a few weeks in which to
find new employment before being forced to leave the country. The scale of recent emigration is
unknown; the ministry of labour has insisted that thousands of new work permits are still being issued,
although it is not clear what proportion of these are simply renewals of existing permits.
In 2009, we are currently forecasting a 1% contraction in the total population to 4.67mn. However, the
government is reportedly re-examining its immigration regulations, with a view to making it easier for
unemployed expatriates to remain in the country while they search for new jobs. Without changes to the
current system, Dubai – probably the emirate most reliant on foreign labour – has little chance of
achieving its 3% workforce growth target in 2009 (even with these changes, we think this figure is
optimistic).
Employment Nationalism
At the same time as it tries to retain foreign workers, the UAE is also keen to shield its native population
from the impact of the economic downturn. Dubai recently launched another ‘Emiratisation’ drive, aimed
this time at increasing the proportion of UAE citizens employed in the public sector (previous initiatives
have tended to focus on encouraging private firms to take on more local staff). Recent research by the
UAE University found that among over 120 private firms surveyed, less than 1% of their employees were
Emirati. Figures were much higher in the public sector, but still not high enough according to Sheikh
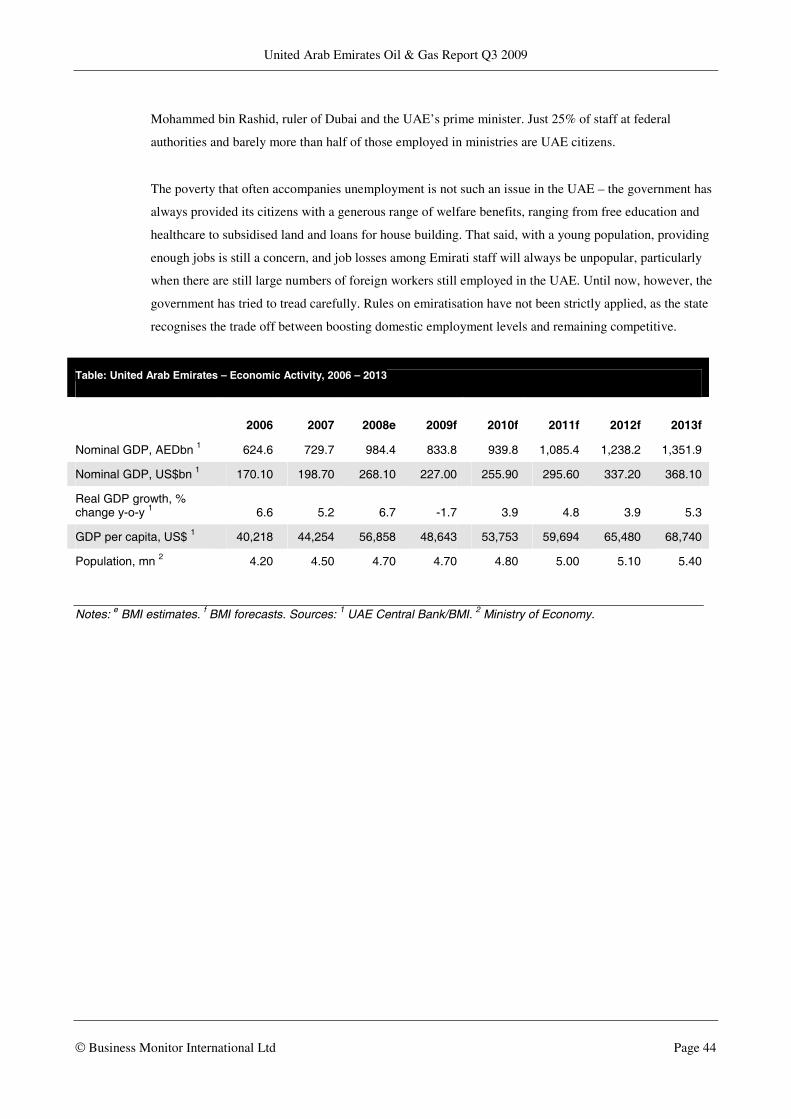
United Arab Emirates Oil & Gas Report Q3 2009
© Business Monitor International Ltd Page 44
Mohammed bin Rashid, ruler of Dubai and the UAE’s prime minister. Just 25% of staff at federal
authorities and barely more than half of those employed in ministries are UAE citizens.
The poverty that often accompanies unemployment is not such an issue in the UAE – the government has
always provided its citizens with a generous range of welfare benefits, ranging from free education and
healthcare to subsidised land and loans for house building. That said, with a young population, providing
enough jobs is still a concern, and job losses among Emirati staff will always be unpopular, particularly
when there are still large numbers of foreign workers still employed in the UAE. Until now, however, the
government has tried to tread carefully. Rules on emiratisation have not been strictly applied, as the state
recognises the trade off between boosting domestic employment levels and remaining competitive.
Table: United Arab Emirates – Economic Activity, 2006 – 2013
2006 2007 2008e 2009f 2010f 2011f 2012f 2013f
Nominal GDP, AEDbn 1 624.6 729.7 984.4 833.8 939.8 1,085.4 1,238.2 1,351.9
Nominal GDP, US$bn 1 170.10 198.70 268.10 227.00 255.90 295.60 337.20 368.10
Real GDP growth, % change y-o-y 1 6.6 5.2 6.7 -1.7 3.9 4.8 3.9 5.3
GDP per capita, US$ 1 40,218 44,254 56,858 48,643 53,753 59,694 65,480 68,740
Population, mn 2 4.20 4.50 4.70 4.70 4.80 5.00 5.10 5.40
Notes: e BMI estimates. f BMI forecasts. Sources: 1 UAE Central Bank/BMI. 2 Ministry of Economy.

United Arab Emirates Oil & Gas Report Q3 2009
© Business Monitor International Ltd Page 45
Competitive Landscape
The main government vehicle is ADNOC, which dominates the Abu Dhabi upstream oil sector. It accounts for
almost half of the UAE’s oil production and 36% of refining capacity. It operates as part of JVs with IOCs. Other
major state companies are downstream participants Emarat and ENOC.
IOC upstream involvement is extensive, and set to rise as more Abu Dhabi upstream projects are offered. Foreign
groups are active in oil production, gas exports, lubricants supply and petrochemicals schemes.
BP has stakes in Abu Dhabi upstream companies ADMA-OPCO and ADCO, plus the ADGAS gas export
business. Production net to BP in 2008 was 210,000b/d of oil. BP has its regional downstream hub in Dubai and a
lubricants blending plant in Jebel Ali. The BP Sharjah business is the largest private producer, processor and seller
of natural gas in the UAE, in partnership with the Sharjah government. Output in 2008 was around 0.75bcm.
Total holds 9.5% of onshore producer ADCO, has a 13.3% interest in offshore producer ADMA-OPCO and owns
15% of GASCO, a processor of associated and non-associated gas. It also shares in LNG company ADGAS and
has 24.5% of the integrated US$3.5bn Dolphin project. Total’s production was 10,000b/d of oil and 0.1bcm of gas
in 2008.
ConocoPhillips is a partner in the Dubai Petroleum JV. The company’s Fateh, Southwest Fateh, Falah and Rashid
oilfields are located about 97km offshore in the Arabian Gulf. It is considering a new refinery build with Abu
Dhabi’s IPIC.
ExxonMobil has a 9.5% stake in an onshore concession operated by ADCO and is a major supplier of lubricating
oils in the emirates. It should shortly begin work on raising the output of the giant Upper Zakum field from
550,000b/d. Exxon has a 28% stake in the project. UAE production net to Exxon in 2008 was 284,000b/d.
Fuels marketing in the UAE is dominated by Emarat and EPPCO, a 60:40 JV between ENOC and Caltex. ENOC
operates a 120,000b/d condensates refinery in Dubai, accounting for three quarters of Dubai’s capacity.
Shell’s regional HQ for the upstream and oil products divisions is located in Dubai. The group holds a 15% stake in
GASCO and 9.5% of ADCO. In 2008 the group produced 146,000b/d net in Abu Dhabi.
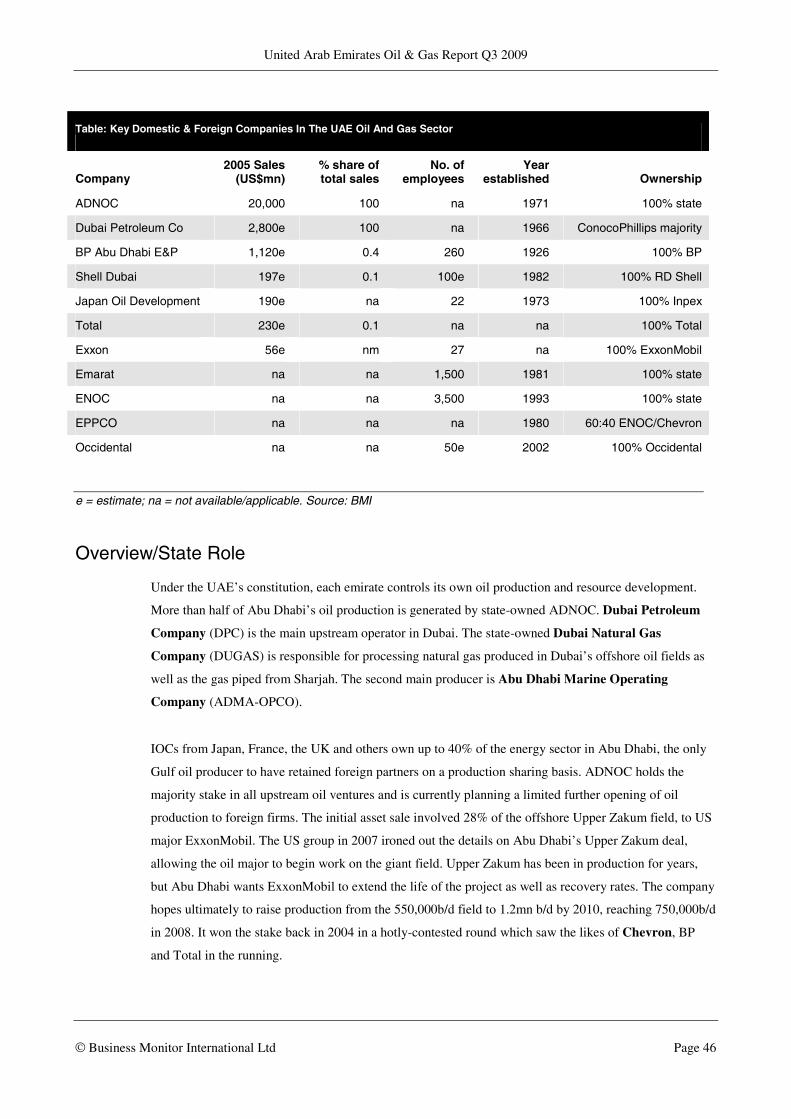
United Arab Emirates Oil & Gas Report Q3 2009
© Business Monitor International Ltd Page 46
Table: Key Domestic & Foreign Companies In The UAE Oil And Gas Sector
Company 2005 Sales
(US$mn) % share of total sales
No. of employees
Year established Ownership
ADNOC 20,000 100 na 1971 100% state
Dubai Petroleum Co 2,800e 100 na 1966 ConocoPhillips majority
BP Abu Dhabi E&P 1,120e 0.4 260 1926 100% BP
Shell Dubai 197e 0.1 100e 1982 100% RD Shell
Japan Oil Development 190e na 22 1973 100% Inpex
Total 230e 0.1 na na 100% Total
Exxon 56e nm 27 na 100% ExxonMobil
Emarat na na 1,500 1981 100% state
ENOC na na 3,500 1993 100% state
EPPCO na na na 1980 60:40 ENOC/Chevron
Occidental na na 50e 2002 100% Occidental
e = estimate; na = not available/applicable. Source: BMI
Overview/State Role
Under the UAE’s constitution, each emirate controls its own oil production and resource development.
More than half of Abu Dhabi’s oil production is generated by state-owned ADNOC. Dubai Petroleum
Company (DPC) is the main upstream operator in Dubai. The state-owned Dubai Natural Gas
Company (DUGAS) is responsible for processing natural gas produced in Dubai’s offshore oil fields as
well as the gas piped from Sharjah. The second main producer is Abu Dhabi Marine Operating
Company (ADMA-OPCO).
IOCs from Japan, France, the UK and others own up to 40% of the energy sector in Abu Dhabi, the only
Gulf oil producer to have retained foreign partners on a production sharing basis. ADNOC holds the
majority stake in all upstream oil ventures and is currently planning a limited further opening of oil
production to foreign firms. The initial asset sale involved 28% of the offshore Upper Zakum field, to US
major ExxonMobil. The US group in 2007 ironed out the details on Abu Dhabi’s Upper Zakum deal,
allowing the oil major to begin work on the giant field. Upper Zakum has been in production for years,
but Abu Dhabi wants ExxonMobil to extend the life of the project as well as recovery rates. The company
hopes ultimately to raise production from the 550,000b/d field to 1.2mn b/d by 2010, reaching 750,000b/d
in 2008. It won the stake back in 2004 in a hotly-contested round which saw the likes of Chevron, BP
and Total in the running.

United Arab Emirates Oil & Gas Report Q3 2009
© Business Monitor International Ltd Page 47
For Abu Dhabi itself, the Upper Zakum project is key to its capacity expansion plans, with ADNOC
planning to spend US$10bn over the next few years to boost oil production capacity by 1.25mn b/d.
Iran and Bahrain agreed on a framework deal in October 2008 that will see Iran export 10.3bcm of gas to
Bahrain, according to Iran’s oil minister Gholamhossein Nozari, quoted by local media sources. He
declined to give any details of the deal. Bahrain started discussions with Iran over importing gas in May
2007, leading the two countries to sign a memorandum of understanding (MoU) in November of that
year. Nozari has said that a new MoU was signed during his visit to Bahrain on October 15. While Nozari
did not give any details as to when gas is expected to start flowing to Bahrain, last year Bahrain’s oil
minister had named 2015 as a start date. The natural gas will be sourced from Iran’s South Pars field,
according to Nozari.
In November 2008, CNPC signed a US$3.29bn deal with the UAE’s oil-related foreign investment arm
IPIC to build a 400km oil pipeline from the Habshan oil field in Abu Dhabi to the emirate of Fujairah.
CNPC’s two pipeline engineering and construction units will jointly build the 48-inch diameter pipeline,
which will have capacity of 1.5mn b/d. The project will also include one connecting station, one initial
station, one intermediate station, one terminal station and three offshore single-point-mooring devices.
Trial operations of the pipeline are expected to start in Q410 and the project should be fully operational
by August 2011, according to CNPC.
Table: Key Upstream Players
Company Oil production
(000b/d) Market share (%) Gas production
(bcm) Market share (%)
ADNOC 1,200e 40 na na
Dubai Petroleum Co 280e 9 na na
BP Abu Dhabi E&P/BP 210 7 0.75 1.5
ExxonMobil 284 9.5 na na
Japan Oil Development 26 1 na na
Total (net output) 10 0.3 0.1 0.2
GASCO na na 49e 98
Royal Dutch Shell 146 5 na na
e = estimate; na = not available/applicable. Source: BMI

United Arab Emirates Oil & Gas Report Q3 2009
© Business Monitor International Ltd Page 48
Table: Key Downstream Players
Company Refining capacity
(000b/d) Market share (%) Retail outlets Market share (%)
ADNOC 234e 36 na na
ENOC 120e 19 166 na
Metro Oil 90e 14 na na
Sharjah Oil Refining Co 72e 11 na na
Emarat na na 171 na
e = estimate; na = not available/applicable. Source: BMI

United Arab Emirates Oil & Gas Report Q3 2009
© Business Monitor International Ltd Page 49
Company Monitor
Abu Dhabi National Oil Company (ADNOC)
Company Analysis
ADNOC has considerable experience in working alongside IOCs in upstream
oil projects, with Abu Dhabi being the most mature Middle Eastern OPEC
state in terms of JVs. The upside potential over the near term is arguably less
than that for other regional producers, suggesting slower growth in terms of
volumes and revenues than seen in neighbouring Gulf States. However, the
low-risk nature of the UAE and the strong relationships between the state and
foreign entities should mean continuing involvement of the IOCs in JV
development projects.
SWOT Analysis
Strengths: Major domestic oil and gas producer;
Unrivalled access to exploration acreage;
Well-established partnerships with IOCs;
Substantial share of downstream oil segment;
Downstream gas and petchems diversification.
Weaknesses: Limited financial or operational freedom;
Some cost and efficiency disadvantages.
Opportunities: Untapped upstream production potential;
Petchems/refinery expansion opportunities;
Large areas of under-explored territory.
Threats: Lack of medium-term oil output growth;
Changes in OPEC/national energy policy.
Address
Abu Dhabi National Oil Company (ADNOC) PO Box 898 Abu Dhabi United Arab Emirates
Tel: +971 (2) 602 0000
Fax: +971 (2) 602 3389
www.adnoc.co.ae
Operating Statistics
Year established: 1971

United Arab Emirates Oil & Gas Report Q3 2009
© Business Monitor International Ltd Page 50
Market Position
ADNOC is an integrated oil company established in 1971 by the emirate of Abu Dhabi, the site of 94% of
the county’s crude reserves. The company and its subsidiaries are responsible for the E&P of oil and gas,
providing support services to the hydrocarbons industry, the operation of oil refineries and gas processing
facilities, chemicals and petrochemicals plants and the storage and distribution of refined products. The
emirate’s target was for an increase in total crude output from 2.3mn b/d to 3mn b/d in 2008. According
to its website, it currently manages and oversees production of more than 2.7mn b/d.
There are several projects either on the cards or underway to upgrade infrastructure at existing oil fields,
leading to a boost in capacity. The Murban field capacity should be raised to 1.5mn b/d from 1.3mn b/d in
Q208, while there is a US$300mn project to up capacity at the Bu Hasa field to almost 500,000b/d.
Upgrades planned for the onshore Asab field should boost capacity to 310,000b/d.
Offshore oil and gas fields in the emirate are operated by Abu Dhabi Marine Operating Company
(ADMOC), which is jointly owned by ADNOC (60%), BP (14.6%), Total (13.3%) and JODCO (12%).
The company’s main assets are the Umm Shaif and Zakum oilfields, with the latter ranked among the 10
largest fields in the world. Onshore oil exploration is managed by the Abu Dhabi Company for
Onshore Oil Operations (ADCO), which is jointly owned by ADNOC (60%), while BP, Shell, Total
and ExxonMobil each hold 9.5% stakes and Portugal’s Partex owns the remaining 2%.
Group subsidiary Abu Dhabi Oil Refining Company (Takreer) operates two refineries, the 145,000b/d
Ruwais refinery, which produces light products chiefly for export to Japan and India, and the 90,000b/d
Umm Al Nar facility.
Abu Dhabi Gas Industries Ltd (GASCO) is responsible for processing associated and non-associated
gas from the Emirate’s onshore oil production, with production in excess of 40.8bcm of gas, 140,000b/d
of condensate and 4,000 tonnes of sulphur. It is jointly owned by ADNOC (68%), Total (15%), Shell
(15%) and Partex (2%). Gas is supplied to around 20 customers including power plants, ADNOC’s group
companies and the entire Ruwais industrial estate.
In the petrochemicals sector, ADNOC’s 60:40 JV with Denmark’s Borealis, Borouge is implementing a
two-phase expansion programme set to boost annual production from 450,000 tonnes of polyethylene
(PE) to 1.2mn tonnes by the end of 2007. Commercial production at the JV’s US$1.2bn plant started in
October 2002 and the facility includes a 600,000 tonne ethylene cracker and two PE plants, each capable
of producing 225,000 tonnes of high, medium and low-density products.

United Arab Emirates Oil & Gas Report Q3 2009
© Business Monitor International Ltd Page 51
Strategy
ADNOC should see solid rather than spectacular growth over coming years, with a number of gas
projects planned with IOC partners. Rocketing domestic demand is providing the impetus behind a huge
boom in Abu Dhabi’s gas industry. The company plans to boost domestic gas supplies by 80% in 2009,
according to a senior official quoted by Reuters. The manager of ADNOC’s gas processing division,
Ismail al-Ramahi, said the company aims to supply 37.2bcm to the national grid next year, up from
present domestic sales of around 20.7bcm. If Abu Dhabi continues to follow this trend it is on course to
become one of the world’s largest gas producers.
The firm had plans to pour US$10bn into various projects over 2005-2008, including the Upper Zakum
development, hoping to boost oil production capacity to 1.25mn b/d. ADNOC aims to boost offshore oil
production by two-thirds to 1mn b/d by 2019.
Downstream, Takreer plans to double capacity at the Ruwais refinery, adding an additional 417,000b/d to
the existing 400,000b/d of capacity. Jasem Ali al-Sayegh, the general manager of ADNOC’s refining unit
Takreer, has said that the engineering and design study for the expansion should be completed by Q109.
The planned completion date is 2013, although this was acknowledged as ambitious. Once expanded,
Ruwais will be integrated with a petrochemicals complex and a new oil lubricants plant, which is
currently being built by Takreer with Finland’s Neste and Austria’s OMV, and is due onstream in 2012.
As well as providing for 1.1mn tpa of feedstock supply to the nearby Borough petrochemicals plant, new
units at Ruwais will allow the company to reduce the sulphur content in its diesel, which, along with
gasoline, makes up around 35% of Takreer’s output.
Latest Developments
ADNOC has issued service tenders for the development of the Shah sour gas field, the company’s CEO
Yousef Omair bin Yousef announced at the Abu Dhabi Gastech 2009 conference on May 25 2009. The
four EPC deals for the Shah field are planned to be awarded by end-2009 or in early 2010, Ismail al
Ramahi, ADNOC’s top gas manager, was quoted as saying at the conference by Dow Jones Newswires.
The EPC contracts will cover the field’s upstream development, sulphur recovery units, utilities and
processing facilities, al Ramahi added. Scheduled to come onstream in 2012, Shah is expected to produce
10.3bcm of gas per annum. Like most of Abu Dhabi’s gas reserves, the Shah field’s gas has a high
sulphur content of around 30%, requiring costly special transportation and processing facilities.
According to Bin Yousef, the Shah contracts form part of the US$35-50bn-worth of energy deals that
ADNOC is planning to award in 2009 and 2010. He added that the world economic crisis had ‘created a
window of opportunity’ to achieve significant cost savings on energy projects. Al Ramahi stated that
ADNOC was expecting to cut 30-50% of Shah’s original price tag. The project’s cost is now expected to
be around US$10bn, down from earlier projections of US$13bn. In Q109, ADNOC told Reuters that it

United Arab Emirates Oil & Gas Report Q3 2009
© Business Monitor International Ltd Page 52
had already negotiated with service providers a 20% discount for the crude capacity expansion projects
being carried out in 2009. It has also been mooted that the company may delay works at the Ruwais and
Fujairah refinery projects to maximise the benefits from falling service costs.
An unnamed industry source quoted by Reuters indicated that ADNOC’s Shah partner ConocoPhillips,
which holds 40% of the project, would probably have preferred to withhold the EPC tenders for longer,
until input prices have bottomed out. The source added that ADNOC and Conoco could just be testing the
waters, claiming that issuing tenders did not necessarily mean that they would be awarded.
In March 2009, a unit of ADNOC awarded an AED2.95bn (US$805mn) EPC contract to South Korea's
SK Engineering to install gas compressors at the Bab field. SK Engineering will build three gas
compression units at the onshore oil field, with construction scheduled to be complete in April 2010. The
compressors will allow greater volumes of natural gas to be injected into the Bab field, with the aim of
boosting oil production from around 350,000b/d to 435,000b/d.
In November 2008, ADNOC signed an MoU with Royal Dutch Shell to jointly explore, develop and
produce gas from fields offshore Abu Dhabi.
In August 2008, GASCO said it was looking at developing the offshore Hail sour gas field, according to a
report in the Middle East Economic Digest (MEED). The report added that the company was not looking
to involve foreign companies in the initial planning stages. Under current plans, the Hail field, which falls
into the concession of ADCO, will be developed by GASCO. According to conservative estimates,
reported by MEED, the Hail field could produce some 5.2bcm per annum. No details of when the field
could potentially come onstream have been released.
July 2008 saw ConocoPhillips sign a landmark deal to develop the UAE’s Shah field in partnership with
GASCO (60%), with Conoco holding the remaining 40%. The strong level of competition between IOCs
keen to participate in the development of the Shah field, even with such high cost projections,
demonstrates their positive assessment of potential returns in this area. The IOCs that lost out in the
development of the Shah field will be following the developments of the Hail field closely, particularly
whether the project will be opened to foreign participation in the later stages of its development.

United Arab Emirates Oil & Gas Report Q3 2009
© Business Monitor International Ltd Page 53
Dolphin Energy Ltd (DEL)
Company Analysis
DEL is in a unique position as a regional gas provider, as it links several
Gulf States with the surplus fuel available in Qatar. The company will
become a leading supplier to the region’s power industry. The project also
allows Gulf States to focus their domestic gas resources on the lucrative
LNG export sector. By linking into certain of the regional gas distribution
grids, DEL is creating a Gulf gas hub capable of being expanded to
handle larger volumes as domestic economies grow and more power
generation switches over to natural gas.
SWOT Analysis
Strengths: Key regional gas supplier;
Involved in gas transportation systems;
Multi-state and IOC involvement;
Substantial volume growth potential.
Weaknesses: Substantial near-term expenditure required.
Opportunities: Scope for other nations to joint project;
Substantial scope for long-term volume expansion.
Threats: Need for ongoing, high-level investment;
Changes in national energy policy.
Address
Dolphin Energy Limited (DEL) Abu Dhabi Trade Centre Building East Tower, 2nd & 3rd Floor PO Box 33777 Abu Dhabi United Arab Emirates
Tel: +971 (2) 699 5500
Fax: +971 (2) 644 6090
www.dolphinenergy.com
Operating Statistics
Year established: 1999
No. of employees: 150

United Arab Emirates Oil & Gas Report Q3 2009
© Business Monitor International Ltd Page 54
Market Position
Dolphin Energy is a US$3.5bn long-term energy project developing gas fields in Qatar and Oman, which
will supply customers in the UAE. This is the first cross-border gas project in the Arab Gulf region. The
company is a JV between the state-owned Mubadala Development Company (51%), France’s Total
(24.5%) and the US’s Occidental Petroleum (24.5%).
Having come onstream in 2006, gas from Qatar’s giant North Dome field is being transported to the
company’s new gas gathering and processing plant in Ras Laffan and then transited to markets in the
UAE via a 440km pipeline to Taweelah, Abu Dhabi and Jebel Ali, Dubai. Dolphin has been supplying the
UAE with 56.6mn cubic metres per day (Mcm/d), or an annualised 20.7bcm, of gas since February 2008.
The company has said that eventually the North Field will supply as much as 91Mcm/d to the UAE,
equivalent to 33bcm per year. The long-term customers for Dolphin gas from Qatar are ADWEA (Abu
Dhabi Water & Electricity Authority), UWEC (Union Water & Electricity Authority), DUSUP (Dubai
Supply Authority) and from 2008, Oman Oil Company (OOC). Each has signed a 25-year gas supply
agreement with Dolphin Energy.
Strategy
Dolphin is taking advantage of the region’s gradual switch towards gas and appears to be outpacing this
growth with its own expansion initiatives.
Latest Developments
Dolphin held talks in June 2009 with Qatar over receiving additional gas to meet demand in the UEA.
The company said in an emailed statement that additional gas volumes of 8.5-14.2Mcm/d could be made
available on an interruptible basis. It also confirmed that the plant at Ras Laffan is operating at full
throughput.
At the end of October 2008, Dolphin finally started exporting gas to Oman from the giant North Field in
Qatar, after the project incurred several delays due to technical difficulties on Oman’s side. Oman had
failed to complete the needed infrastructure for the pipeline to come onstream earlier in 2008, which
meant that in May the start date was pushed back until August/September and then to October/November.
According to Dolphin Energy, first gas started flowing on October 31. With the pipeline now onstream,
the first stage of the US$3.5bn project to connect the Arab Gulf region through a gas network has been
successfully implemented, connecting Qatar with the UAE and Oman.
July 2008 saw Dolphin award Russia’s Stroytransgaz a US$418mn construction contract to build the
Taweelah-Fujairah gas pipeline, which will link the company’s receiving facilities at Taweelah in Abu
Dhabi with Fujairah on the UAE’s eastern coast. The pipeline will supply gas to the planned Fujairah 2
Power and Desalination Plant, which will be built next to the existing Fujairah 1 plant at Qidfa. Fujairah 1

United Arab Emirates Oil & Gas Report Q3 2009
© Business Monitor International Ltd Page 55
already receives gas from Dolphin via the company’s al Ain-Fujairah pipeline. According to Dolphin,
construction at the pipeline will begin during Q308 and the pipeline will be commissioned in 2010. The
steel for the pipeline will be supplied by Germany’s Salzgitter Mannesmann International. Dolphin
and Salzgitter signed a US$200mn contract in December 2007 for the supply of 120,000 tonnes of coated
line pipes, the first shipment of which has already arrived in Abu Dhabi, according to Salzgitter.
Dolphin started producing natural gas from its wells in Qatar’s North field at the end of June 2008 and
started exporting gas from Qatar to the UAE in July. According to Reuters, Dubai will import between
16.99Mcm/d and 22.65Mcm/d once full exports begin. Dolphin Energy is currently holding talks with
Qatar over the possibility of increasing the flow of gas to the pipeline’s maximum capacity of
99.11Mcm/d. However, Qatar wants to temporarily halt new North Field projects, so as to study the
impact rapid development of the field will have.

United Arab Emirates Oil & Gas Report Q3 2009
© Business Monitor International Ltd Page 56
Emarat – Emirates General Petroleum Corporation
Company Analysis
As the dominant regional fuels distributor, Emarat is in an unrivalled
position to exploit the local oil demand growth trend and is able to
diversify internationally. Good relationships with IOCs and other regional
operators have provided exposure to new projects such as pipeline
operation and storage/blending facilities. Emarat is also establishing a
strong position in gas distribution infrastructure. It is an ideal candidate
for privatisation over the medium to long term.
SWOT Analysis
Strengths: Dominant share of fuels retail segment;
Major role in downstream oil supply infrastructure;
Growing share of gas infrastructure operation.
Weaknesses: No refining or upstream involvement;
Highly competitive lubricants market.
Opportunities: Domestic/regional growth in oil demand;
Infrastructure expansion opportunities.
Threats: Changes in national/regional energy policy.
Address Emarat - Emirates General
Petroleum Corporation Sheikh Zayed Road PO Box 9400 Dubai United Arab Emirates
Tel: +971 (4) 343 4444 Fax: +971 (4) 343 3393 www.emarat.co.ae
Operating Statistics
Year established: 1981
No. of employees: 1,500
Service stations: 171

United Arab Emirates Oil & Gas Report Q3 2009
© Business Monitor International Ltd Page 57
Market Position
Founded by the federal government of the UAE in 1981, Emarat markets and distributes petroleum
products throughout the country. The firm is the dominant regional fuels distributor and is looking to
expand into other downstream markets.
Emarat operates a network of approximately 170 service stations as well as retailing aviation fuels and
lubricants. Emarat’s share of the lubricants market is approximately 18% and its products are exported to
Lebanon, Bahrain, Oman, Afghanistan, Jordan and Pakistan. The company directly manages oil terminals
with a combined storage capacity of 383,000 cubic metres in Jebel Ali, Dubai, Sharjah, Ras Al-Khaimah
and Fujairah. It also manages two storage units with international partners, with combined capacity of
285,000 cubic metres.
The company also operates 360km of underground gas pipelines, supplying customers including power
plants and other industrial users throughout the five Northern Emirates with gas from the Sajaa field.
Strategy
The marketing and distribution of oil products remains the core focus of Emarat’s operations, but the
company has recently embarked on a new strategy of expanding and diversifying its investment base. To
this end, Emarat is keen to enter new partnerships with foreign partners that can provide expertise for
projects.
Latest Developments
In May 2009, Emarat started work on expanding the Fujairah storage unit for storing and distribution gas
oil, fuel, gasoline and jet fuel. The project will expand capacity from 50,000 to 250,000 cubic metres as
part of a broader AED250mn initiative to boost storage volumes across the UAE.
June 2008 saw Emarat and Dana Gas complete the construction of the Middle East’s first common-user
gas pipeline in Sharjah. The partners, along with the three end-users – the Federal Electricity and Water
Authority (FEWA), Sharjah Electricity and Water Authority (SEWA) and Crescent Natural Gas Company
(a Dana subsidiary) – signed an MoU for the construction of the pipeline in January 2006. The first phase
of the project was completed in May 2006 and is delivering gas to the Sewa power station at Hamriyah.
The main pipeline, which is now onstream, is 32km long and connects the Sharjah gas hub at Sajaa to
Hamriyah, with annual capacity of 10.3bcm. Dana Gas and Emarat each have a 50% interest in the
construction, ownership and operation of the pipeline.
United Arab Emirates Oil & Gas Report Q3 2009
© Business Monitor International Ltd Page 58
Emirates National Oil Company Limited (ENOC)
Company Analysis
As a partly integrated oil company with IOC involvement, ENOC is an
efficient operator in the growing regional energy market, with significant
potential to expand through investment and local demand. It has good
exposure to the retail segment, while ENOC’s stake in Dragon Oil brings
with it some growing upstream volumes from Turkmenistan. Refining
capacity can be upgraded and enlarged, while a significant role in LPG
supply provides another source for revenue expansion.
SWOT Analysis
Strengths: Significant domestic oil refiner;
Substantial fuels market share;
Equity investment in Dragon Oil.
Weaknesses: No direct local oil/gas production;
Rising investment requirement.
Opportunities: Rising local/regional energy demand;
Refinery upgrade/expansion;
Increasing share of fuels retail segment.
Threats: Developing regional refining capacity surplus;
Changes in national/regional energy policy.
Address
Emirates National Oil Company Limited (ENOC) PO Box 6442 ENOC Complex, Sheikh Rashid Road Dubai United Arab Emirates
Tel: +971 (4) 337 4400
Fax: +971 (4) 313 4102
www.enoc.com
Operating Statistics
Year established: 1993
No. of employees: 3,500
Refining capacity: 120,000b/d
Service stations: 166

United Arab Emirates Oil & Gas Report Q3 2009
© Business Monitor International Ltd Page 59
Market Position
ENOC is a diversified conglomerate, wholly owned by the emirate of Dubai. It operates 30 active
subsidiaries and JVs in the oil and gas sector in the UAE and overseas. ENOC also holds interests in the
shipping, aviation, real estate, IT, food and travel sectors.
Upstream interests include Dubai Natural Gas Company (DUGAS), which started commercial
production of LPG in 1980 and is in charge of LPG exports, as well as sending dry fuel gas offshore as
fuel for Dubai Petroleum Company (DPC) and DUGAS production platforms. LPG is distributed
domestically through Emirates Gas, which owns bottling plants in Jebel Ali, Ajman and Fujairah, and
distribution centres in Dubai and Umm Al Quwain.
ENOC also has a 52% shareholding in Dragon Oil, which is developing the Cheleken Block in
Turkmenistan. Dragon Oil is currently producing around 32,000b/d of crude at the offshore field, where
2P reserves were estimated at around 651mn bbl of oil/condensate (Dragon share 324mn bbl) plus
96.3bcm of gas at end-2007.
In the downstream segment, ENOC Processing Company LLC (EPCL) operates the company’s
120,000b/d refinery in Jebel Ali. The plant processes light crude and condensate into LPG, naphtha, jet
fuel, diesel oil and fuel oil for domestic and export markets. A US$850mn project to add a reformer and
hydrotreater is currently being implemented at the plant. The company’s international refining and
marketing subsidiaries include crude sourcing and trading units in Singapore and the UK.
Downstream unit ENOC Retail operates a network of 166 ENOC- and EPPCO-branded service stations
throughout Dubai and the northern emirates, as well as storage terminals in Jebel Ali and Fujairah.
Another downstream unit EPPCO Projects was formed in 1996 to expand into aviation refuelling and
lubricants manufacturing and marketing in the UAE. The first of its two divisions, EPPCO Aviation,
supplies UAE airports and operates a 60km jet fuel pipeline that runs from Jebel Ali to Dubai
International Airport. The second, EPPCO Lubricants, is a JV between ENOC and Chevron al Khaleej
and markets ENOC and Caltex-branded lubricants and greases in the UAE.
Strategy
The firm’s recent moves indicate a concentration on the downstream, where we expect the company to
make most progress. There is potential for growth in refining and LPG operations. ENOC is also
diversifying internationally and is aiming for rapid expansion in the Asia Pacific region. Dragon Oil is
also seeking to acquire interests in other upstream assets overseas, so ENOC could have an opportunity to
boost its production in future via that route.

United Arab Emirates Oil & Gas Report Q3 2009
© Business Monitor International Ltd Page 60
BP – Summary
BP has various interests in the UAE, with its upstream assets concentrated largely in Abu Dhabi,
including stakes in ADMA-OPCO (14.67%), ADCO (9.5%), ADGAS (10%) and Bunduq Company
(33.3%). ADMA-OPCO is the operator of the Umm Shaif and Zakum oilfields. ADCO produces crude
from the Asab, Bab, Bu Hasa, Sahil and Shah oil fields and is partly owned by BP, Shell, ExxonMobil
and Total – each with 9.5%. Production net to BP in 2008 was 210,000b/d of oil. ADGAS operates three
LNG trains capable of producing over 5mn tpa.
In refining and marketing, BP has its regional hub located in Dubai as well as operating a blending plant
in Jebel Ali. The BP Sharjah business is the largest private producer, processor and seller of natural gas in
the UAE, in partnership with the Sharjah government. It operates three gas fields, a processing plant, gas
compression facilities and two liquid export terminals (condensate and LPG). Gas and NGLs are
produced from the Sajaa, Moveyeid and Kahaif fields. Unit Air BP supplies aviation fuel and lubricants
to Dubai and Sharjah international airports.
Total – Summary
Total has been present in the UAE since 1939. The French firm has a 75% operating interest in the Abu
Al Bu Khoosh field and it holds 9.5% of the onshore producer ADCO, which operates the Asab, Bab, Bu
Hasa, Sahil and Shah oil fields, the five major onshore fields in Abu Dhabi. It has a 13.3% interest in
offshore producer ADMA-OPCO, the operator of the offshore Umm Shaif and Zakum oil fields. Total
also has a 15% interest in GASCO, a processor of associate and non-associate gas from the emirate’s
onshore oil fields. ADGAS, in which the French major holds a 5% stake, set up the region’s first LNG
plant and also produces LPG and condensates. Total also has 24.5% of the integrated US$3.5bn Dolphin
project and is a major distributor of lubricants. In 2008, Total’s net production in the UAE was 10,000b/d.
In April 2009 Total signed an agreement to extend its 15% participation in GASCO by 20 years.
ConocoPhillips – Summary
US major ConocoPhillips in July 2008 signed a landmark deal to develop sour gas reserves in the UAE.
Conoco will hold a 40% stake in the project to develop the Shah field, with ADNOC unit GASCO
holding the remaining 60%. The two companies will share development costs and although ADNOC did
not reveal the value of the agreement, it is expected that the project will cost at least US$10bn. While no
further details have been released, the deal is expected to allow Conoco to book new reserves from the
Shah field, in line with similar deals between ADNOC and other majors such as ExxonMobil and BP.
The finalisation of the deal marks a leap forward in Conoco’s upstream market position in the Middle
East and the company will be very pleased to have emerged triumphant in the competition for the
lucrative contract, having beaten Exxon and Royal Dutch Shell, as well as US independent Occidental
Petroleum.

United Arab Emirates Oil & Gas Report Q3 2009
© Business Monitor International Ltd Page 61
Conoco had been active in the Dubai upstream oil sector through the DPC JV but handed over all
operations to the government of Dubai in April 2007.
ExxonMobil – Summary
ExxonMobil has stakes in two upstream concessions in the UAE and is also a major supplier of
lubricating oils in the emirates. It has a 9.5% stake in an onshore concession operated by ADCO, which
produced a net 130,000b/d of oil in 2008. The company is also working on the giant Upper Zakum field,
which has been in production for years, but Abu Dhabi wants ExxonMobil to extend the life of the project
as well as recovery rates. The field had around 50bn bbl originally in place, with only around 10% of that
produced to date, according to Exxon. The company has a 28% stake in the 550,000b/d field, which it
won back in 2004 in a hotly contested round which saw the likes of Chevron, BP and Total in the
running. Exxon hopes to harness reservoir management technologies with the aim of ultimately raising
output to 1.2mn b/d by 2010, with a 750,000b/d target for 2008. The field produced 154,000b/d net to
Exxon in 2008.
Exxon was one of four IOCs to submit a bid to ADNOC to develop the Shah sour gas field but missed out
to Conoco, which was awarded the contract in July 2008.
Exxon announced in April 2009 that it was looking at ways to cut development costs at the Upper Zakum
oil field. Exxon’s regional vice president Richard Vierbuchen has not specified when he believes the
additional capacity could be brought onstream nor how much it is likely to cost.
Shell – Summary
The regional headquarters for the upstream and oil products divisions is located in Dubai, while the Abu
Dhabi office is responsible for Shell’s various investments in the emirate. Shell holds minority stakes in
two production JVs in Abu Dhabi, including a 15% stake in GASCO and 9.5% of ADCO.
In May 2008, Shell signed a 15-year agreement with Dubai to sell the country 1.5mn tpa of LNG in the
peak demand summer period from 2010. According to Shell, much of the LNG will be sourced from
Qatar, while some volumes will come from elsewhere in Shell’s portfolio.
Shell was one of four IOCs to submit a bid to ADNOC to develop the Shah sour gas field but missed out
to Conoco, which was awarded the contract in July 2008. In November 2008 Shell signed an MoU with
ADNOC to explore, develop and produce gas from offshore fields in Abu Dhabi.
Shell produced 146,000b/d of oil in Abu Dhabi in 2008, the same level as 2007.

United Arab Emirates Oil & Gas Report Q3 2009
© Business Monitor International Ltd Page 62
Dana Gas – Summary
Private domestic gas company Dana Gas was awarded a 25-year E&P licence for the Western Offshore
concession off Sharjah in March 2008. Dana paid US$120mn for the agreement with the development
phase of the project expected to cost some US$55mn and the exploration costs estimated at around
US$65mn. This is the company’s first offshore upstream asset in the Middle East. The company plans to
spend over US$500mn in 2008 on its projects in northern Iraq, Egypt and the UAE.
The concession covers over 1,000sq km and includes the development of the Zora gas field, which was
discovered in 1979. In its exploration programme Dana will undertake seismic studies, geological
evaluation studies and exploration drilling. The development programme will include the completion of
drilling work, resuming the drilling of two horizontal wells that were originally drilled by Crescent
Petroleum, the installation of offshore platforms and the construction of a 25km offshore pipeline. Dana
plans to award offshore service contracts soon, so that the field can come onstream in 2009.
Dana was in a good position to be awarded the contract, following an agreement at the beginning of
March 2008 that saw Dana and Emarat agree to form a JV to own, manage and operate the Middle East’s
first common-user gas pipeline in the UAE. The Hamriyah Gas Pipeline Project, which was completed in
June 2008, connects the Sharjah gas hub at Sajaa to the industrial area at Hamriyah. The 32km pipeline
has a capacity of 10.3bcm. The JV partners signed an MoU in 2006 with three end-users – Federal
Electricity and Water Authority (FEWA), Sharjah Electricity and Water Authority (SEWA) and Crescent
Natural Gas Company (a subsidiary of Dana). According to Hamed Jafar, Dana’s executive chairman, the
E&P licence complements the ‘company’s assets and activities in the processing, transportation and
marketing of natural gas’.
Occidental Petroleum – Summary
In October 2008, Occidental Petroleum (Oxy) agreed to pay the ADNOC US$500mn to acquire the rights
to explore and develop two oil and gas fields, Jarn Yaphour and Rahman, in the emirate of Abu Dhabi.
Occidental will operate and hold a 100% interest in hydrocarbons output from the fields. The Los
Angeles-based company’s total capital expenditure (capex) in both projects is expected to be around
US$500mn over the next three to four years.
First production from the Jarn Yaphour field, located onshore near the capital city of Abu Dhabi, is
expected in 2009, with initial output seen at around 10,000boe/d. The Ramhan discovery, located in very
shallow water near the Abu Dhabi refinery, was tested in 1992 and flowed at a combined test rate of
1,750b/d and 0.4Mcm/d from one well. If that field is technically and commercially viable, production
could begin as soon as 2011. Potential output from Ramhan is also estimated at 10,000boe/d.

United Arab Emirates Oil & Gas Report Q3 2009
© Business Monitor International Ltd Page 63
Occidental Petroleum is expanding its operations in the Middle East and North Africa (Libya). Prior to
the deal to develop Jarn Yaphour and Rahman, Oxy was already active in the UAE through its 24.5%
share in DEL, which operates the Dolphin gas project. Occidental paid US$310mn in 2002 to acquire
Enron’s 24.5% stake in the project. Dolphin began production in the summer of 2007 and reached full
operation in February 2008.
Oxy was one of four IOCs to submit a bid to ADNOC to develop the Shah sour gas field but missed out
to Conoco, which was awarded the contract in July 2008.
Japan Oil Development Co (JODCO) – Summary
Previously owned by Japan National Oil Corporation (JNOC), JODCO is now a 100% unit of Inpex.
JODCO entered the UAE in 1973 by acquiring a stake in the ADMA concession from BP (now 12%).
Between then and 1980 it acquired stakes in the development of the Upper Zakum field (12%), the Umm
Al-Dalkh field (12%) and the Satah field (40%).
Cosmo Oil – Summary
Japan’s fourth-largest refiner, Cosmo Oil, was the first non-Western company to enter the UAE’s energy
market. It has now been operating in Abu Dhabi since 1967 and has formed a strong mutually beneficial
relationship with its rulers. In January 2009 it was awarded a 20-year extension for its concession
offshore Abu Dhabi. The extension of the company’s operating rights followed a September 2007
acquisition of 20% of Cosmo’s shares by IPIC, the emirates’ investment arm. According to a Cosmo
official quoted by Reuters, the contract prolongation may also entail additional exploration rights,
although this was not confirmed by the company.
Abu Dhabi National Energy Company (TAQA) – Summary
TAQA is an energy investment company established in June 2005 as a public joint stock company. The
government of Abu Dhabi through ADWEA owns 51%; ADWEA transferred 24.1% of its shareholding
to the Fund for the Support of Farm Owners in the Emirate of Abu Dhabi to provide farmers with an
income stream and provide longer-term support to farming in the emirate of Abu Dhabi.
TAQA intends to make strategic and financial investments in energy, water, infrastructure and mining
sector companies and projects, whether within the UAE or abroad. TAQA in early March 2008 wrapped
up its US$4.6bn takeover of Calgary-based PrimeWest Energy Trust. The Abu Dhabi energy group said
in September 2007 that it planned to grow into a US$60bn company over the next five years, with one-
third of its operations in Canada. In May 2007, it paid US$2bn for Calgary-based Northrock Resources.
It also bid US$540mn for Pioneer Natural Resources Canada.

United Arab Emirates Oil & Gas Report Q3 2009
© Business Monitor International Ltd Page 64
TAQA published its Q109 financial results on May 15 2009. The company reported revenues of
AED4.2bn (US$1.14bn) and net profit of AED40mn (US$10.89mn). Revenues increased from AED4bn
(US$1.09bn) in Q108, while profits were down 90% y-o-y. Revenue from the electricity and water
business, excluding supplemental fuel, was up 14% y-o-y to AED1.4bn (US$0.38bn), mainly due to the
expansion of Taweelah B water and power project.
In March 2009, TAQA revised its 2008 earnings downward from previously reported figures because of
falling energy prices and impairment charges on US and Canadian investments. TAQA reported revised
Q408 net profits of AED233mn (US$63.43mn), revised down from AED360mn reported in its
preliminary earnings statement in February. In Q407, TAQA reported net profit of AED653mn, according
to a company statement.
Full year profits were revised down to AED1.8bn (US$497.1mn) from AED1.952bn previously reported
in February. Profit increased y-o-y from AED1bn in 2007. The company reported revenues of
AED16.8bn (US$4.6bn) in 2008, an increase from AED8.3bn (US$2.3bn) in 2007.

United Arab Emirates Oil & Gas Report Q3 2009
© Business Monitor International Ltd Page 65
Glossary of Terms AOR Additional Oil Recovery KCTS Kazakh Caspian Transport System
APA Awards for Predefined Areas km kilometres
API American Petroleum Institute LAB Linear Alkyl Benzene
bbl Barrel LDPE low density polypropylene
bcm billion cubic metres LNG liquefied natural gas
b/d barrels per day LPG liquefied petroleum gas
bn Billion m metres
boe barrels of oil equivalent mcm thousand cubic metres
BTC Baku-Tbilisi-Ceyhan Pipeline Mcm mn cubic metres
BTU British Thermal Unit MEA Middle East and Africa
CBM coal bed methane mn million
CEE Central and Eastern Europe MoU Memorandum of Understanding
CGP Carpentaria Gas Pipeline mt metric tonne
CPC Caspian Pipeline Consortium MW megawatts
CSG coal seam gas na not available/ applicable
DoE US Department of Energy NGL natural gas liquids
EC European Commission NOC national oil company
EEZ exclusive economic zone OECD Organisation for Economic Cooperation &
e/f estimate/forecast OPEC Organisation of the Petroleum Exporting Countries
EIA US Energy Information Administration PE polyethylene
ELP Escravos-Lagos Pipeline PP polypropylene
EM emerging markets PSA production sharing agreement
EOR enhanced oil recovery PSC production sharing contract
E&P exploration and production q-o-q quarter-on-quarter
EPSA exploration and production sharing R&D research and development
FBR fast-breeder reactor R/P reserves/production
FDI foreign direct investment RPR reserves to production ratio
FEED front end engineering & design SGI strategic gas initiative
FTA free trade agreement SoI Statement of Intent
FTZ free trade zone SPA Sale and Purchase Agreement
GDP gross domestic product SPR Strategic Petroleum Reserve
G&G geological and geophysical t/d tonnes per day
GoM Gulf of Mexico tcm trillion cubic metres
GS geological survey toe tonnes of oil equivalent
GTL gas-to-liquids conversion tpa tonnes per annum
GW gigawatts TRIPS Trade-Related Aspects of Intellectual Property
GWh gigawatt hours trn trillion
HDPE high density polyethylene T&T Trinidad and Tobago
HoA Heads of Agreement TTPC Trans-Tunisian Pipeline Company
IEA International Energy Agency TWh terawatt hours
IGCC Integrated Gasification Combined Cycle UAE United Arab Emirates
IOC international oil company USGS US Geological Survey
IPI Iran-Pakistan-India Pipeline WAGP West African Gas Pipeline
IPO initial public offering WIPO World Intellectual Property Organisation
JOC joint operating company WTI West Texas Intermediate
JPDA Joint Petroleum Development Area WTO World Trade Organisation
JV joint venture y-o-y year-on-year

United Arab Emirates Oil & Gas Report Q3 2009
© Business Monitor International Ltd Page 66
Oil & Gas Ratings: Revised Methodology
Introduction
BMI has revised the methodology of its Oil & Gas Business Environment Ratings. Our approach has
been threefold. First, we have disaggregated the upstream (oil/gas E&P) and downstream (oil refining and
marketing, gas processing and distribution), enabling us to take a more nuanced approach to analysing the
potential within each segment, and the different risks along the value chain. Second, we have identified
objective indicators that may serve as proxies for issues/trends that were previously evaluated on a
subjective basis. Finally, we have used BMI’s proprietary Country Risk Ratings (CRR) in a more refined
manner in order to ensure that only those risks most relevant to the industry have been included. Overall,
the new ratings system – which is now integrated with those of all 16 industries covered by BMI – offers
an industry-leading insight into the prospects/risks for companies across the globe.
Ratings Overview
Conceptually, the new ratings system is organised in a manner that enables us clearly to present the
comparative strengths and weaknesses of each state. As before, the headline Oil & Gas BER is the
principal rating. However, the differentiation of Upstream/Downstream and the articulation of the
elements that comprise each segment enable more sophisticated conclusions to be drawn, and also
facilitate the use of the ratings by clients, who will have varying levels of exposure and risk appetite for
their operations.
Oil & Gas Business Environment Rating: This is the overall rating, which comprises 50% Upstream BER
and 50% Downstream BER:
Upstream Oil & Gas Business Environment Rating: This is the overall Upstream rating which is
composed of limits/risks (see below);
Downstream Oil & Gas Business Environment Rating: This is the overall Downstream rating which
comprises limits/risks (see below).
Both the Upstream BER and Downstream BER are composed of Limits/Risks sub-ratings, which
themselves comprise industry-specific and broader Country Risk components:
Limits of Potential Returns: Evaluates the sector’s size and growth potential in each state, and also
broader industry/state characteristics that may inhibit its development;

United Arab Emirates Oil & Gas Report Q3 2009
© Business Monitor International Ltd Page 67
Risks to Realisation of those Returns: Evaluates both Industry-specific dangers and those emanating from
the state’s political/economic profile that call into question the likelihood of expected returns being
realised over the assessed time period.
Table: BMI Oil & Gas Business Environment Ratings: Structure
Component Details
Oil & Gas Business Environment Rating Overall rating
- Upstream BER 50% of O&G BER
-- Limits of Potential Returns - 70% of Upstream BER
--- Upstream Market -- 75% of Limits
--- Country Structure -- 25% of Limits
-- Risks to Realisation of Potential Returns - 30% of Upstream BER
--- Industry Risks -- 65% of Risks
--- Country Risks -- 35% of Risks
- Downstream BER 50% of O&G BER
-- Limits of Potential Returns - 70% of Downstream BER
--- Upstream Market -- 75% of Limits
--- Country Structure -- 25% of Limits
-- Risks to Realisation of Potential Returns - 30% of Downstream BER
--- Industry Risks -- 60% of Risks
--- Country Risks -- 40% of Risks
Source: BMI

United Arab Emirates Oil & Gas Report Q3 2009
© Business Monitor International Ltd Page 68
Indicators
The following indicators have been used. Overall, the rating uses three subjectively measured indicators,
and 41 separate indicators/datasets.
Table: BMI Oil & Gas Business Environment Upstream Ratings: Methodology
Indicator Rationale
Upstream BER: Limits to potential returns
Upstream Market
Resource base
- Proven oil reserves (mn bbl) Indicators used to denote total market potential. High values are given better scores.
- Proven gas reserves (bcm)
Growth outlook
- Oil production growth (2006-2012) Indicators used as proxies for BMI’s market assumptions, with strong growth accorded higher scores.
- Gas production growth (2006-2012)
Market maturity
- Oil reserves/ production
Indicator used to denote whether industries are frontier/emerging/developed or mature markets. Low existing exploitation in relation to potential is accorded higher scores.
- Gas reserves/ production
- Current oil production vs. peak
- Current gas production vs. peak
Country structure
State ownership of assets, % Indicator used to denote opportunity for foreign NOCs/IOCs/Independents. Low state ownership scores higher.
Number of non-state companies Indicator used to denote market competitiveness. Presence (and large number) of non-state companies scores higher.
Upstream BER: Risks to potential returns
Industry Risks
Licensing terms Subjective evaluation of government policy towards sector against BMI-defined criteria. Protectionist states are marked down.
Privatisation trend Subjective evaluation of government industry orientation. Protectionist states are marked down.
Country Risk
Physical Infrastructure Rating from BMI’s CRR. It evaluates the constraints imposed by power, transport & communications infrastructure.
Long Term Policy Continuity Risk Rating from BMI’s CRR It evaluates the risk of a sharp change in the broad direction of government policy.

United Arab Emirates Oil & Gas Report Q3 2009
© Business Monitor International Ltd Page 69
Table: BMI Oil & Gas Business Environment Upstream Ratings: Methodology
Indicator Rationale
Rule of Law Rating from BMI’s CRR. It evaluates the government’s ability to enforce its will within the state.
Corruption
Rating from BMI’s CRR, to denote risk of additional illegal costs/possibility of opacity in tendering/business operations affecting companies’ ability to compete.
Source: BMI
Table: BMI Oil & Gas Business Environment Downstream Ratings: Methodology
Indicator Rationale
Downstream BER: Limits to potential returns
Downstream Market
Market
- Refining capacity (000b/d) Indicator denotes existing domestic oil processing capacity. High capacity is considered beneficial.
- Oil demand (000b/d) Indicator denotes size of domestic oil/gas market. High values are accorded better scores.
- Gas demand (bcm)
- Retail outlets/1,000 people Indicator denotes fuels retail market penetration; low penetration scores highly.
Growth outlook
- Oil demand growth (2006-2012) Indicators used as proxies for BMI’s market assumptions, with strong growth accorded higher scores.
- Gas demand growth (2006-2012)
- Refining capacity growth (2006-2012)
Import dependence
- Refining capacity vs. oil demand, % (2006-2012)
Indicators denote reliance on imported oil products and natural gas. Greater self-sufficiency is accorded higher scores.
- Gas demand vs. gas supply, % (2006-2012)
Country structure
State ownership of assets, % Indicator used to denote opportunity for foreign NOCs/IOCs/Independents. Low state ownership scores higher.
No. of non-state companies Indicator used to denote market competitiveness. Presence (and large number) of non-state companies scores higher.
Population, mn Data from BMI’s CR team. Indicators used as proxies for overall market size and future potential.
Nominal GDP, US$bn
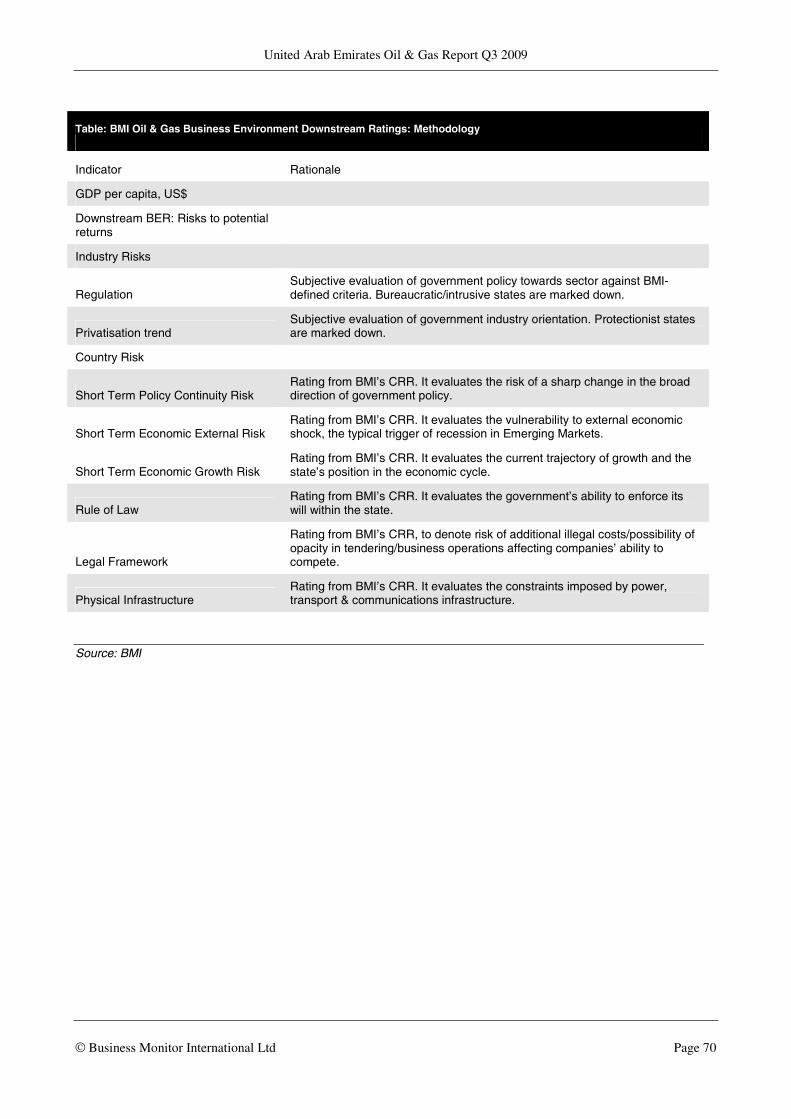
United Arab Emirates Oil & Gas Report Q3 2009
© Business Monitor International Ltd Page 70
Table: BMI Oil & Gas Business Environment Downstream Ratings: Methodology
Indicator Rationale
GDP per capita, US$
Downstream BER: Risks to potential returns
Industry Risks
Regulation Subjective evaluation of government policy towards sector against BMI-defined criteria. Bureaucratic/intrusive states are marked down.
Privatisation trend Subjective evaluation of government industry orientation. Protectionist states are marked down.
Country Risk
Short Term Policy Continuity Risk Rating from BMI’s CRR. It evaluates the risk of a sharp change in the broad direction of government policy.
Short Term Economic External Risk Rating from BMI’s CRR. It evaluates the vulnerability to external economic shock, the typical trigger of recession in Emerging Markets.
Short Term Economic Growth Risk Rating from BMI’s CRR. It evaluates the current trajectory of growth and the state’s position in the economic cycle.
Rule of Law Rating from BMI’s CRR. It evaluates the government’s ability to enforce its will within the state.
Legal Framework
Rating from BMI’s CRR, to denote risk of additional illegal costs/possibility of opacity in tendering/business operations affecting companies’ ability to compete.
Physical Infrastructure Rating from BMI’s CRR. It evaluates the constraints imposed by power, transport & communications infrastructure.
Source: BMI
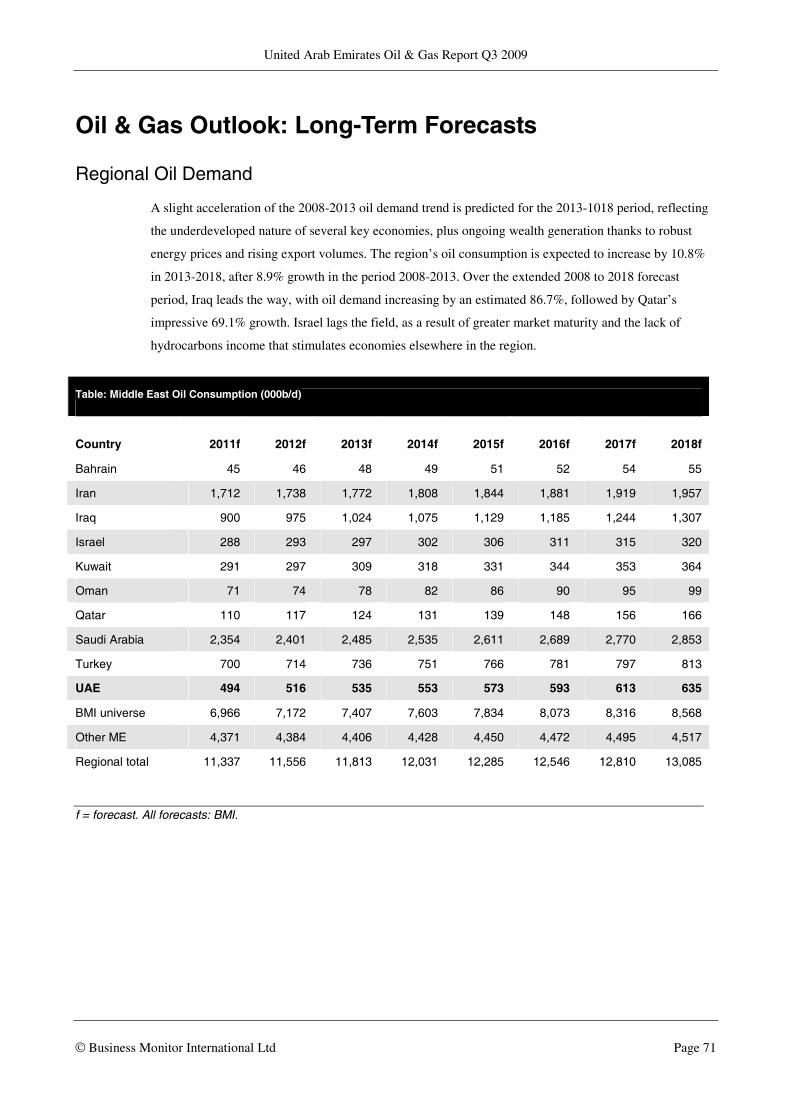
United Arab Emirates Oil & Gas Report Q3 2009
© Business Monitor International Ltd Page 71
Oil & Gas Outlook: Long-Term Forecasts
Regional Oil Demand
A slight acceleration of the 2008-2013 oil demand trend is predicted for the 2013-1018 period, reflecting
the underdeveloped nature of several key economies, plus ongoing wealth generation thanks to robust
energy prices and rising export volumes. The region’s oil consumption is expected to increase by 10.8%
in 2013-2018, after 8.9% growth in the period 2008-2013. Over the extended 2008 to 2018 forecast
period, Iraq leads the way, with oil demand increasing by an estimated 86.7%, followed by Qatar’s
impressive 69.1% growth. Israel lags the field, as a result of greater market maturity and the lack of
hydrocarbons income that stimulates economies elsewhere in the region.
Table: Middle East Oil Consumption (000b/d)
Country 2011f 2012f 2013f 2014f 2015f 2016f 2017f 2018f
Bahrain 45 46 48 49 51 52 54 55
Iran 1,712 1,738 1,772 1,808 1,844 1,881 1,919 1,957
Iraq 900 975 1,024 1,075 1,129 1,185 1,244 1,307
Israel 288 293 297 302 306 311 315 320
Kuwait 291 297 309 318 331 344 353 364
Oman 71 74 78 82 86 90 95 99
Qatar 110 117 124 131 139 148 156 166
Saudi Arabia 2,354 2,401 2,485 2,535 2,611 2,689 2,770 2,853
Turkey 700 714 736 751 766 781 797 813
UAE 494 516 535 553 573 593 613 635
BMI universe 6,966 7,172 7,407 7,603 7,834 8,073 8,316 8,568
Other ME 4,371 4,384 4,406 4,428 4,450 4,472 4,495 4,517
Regional total 11,337 11,556 11,813 12,031 12,285 12,546 12,810 13,085
f = forecast. All forecasts: BMI.

United Arab Emirates Oil & Gas Report Q3 2009
© Business Monitor International Ltd Page 72
Regional Oil Supply
A 12.6% gain in Middle Eastern oil production during the 2013-2018 period represents an improvement
on the 9.0% rate of expansion seen in 2008-2013, and owes much to the likely gains delivered by OPEC
member states. Iraq is by far the biggest contributor to growth, with output forecast to rise by 66.0%
between 2008 and 2018. Its nearest rival, at 38.1%, is Qatar, with gas liquids volumes moving higher as a
result of increased dry gas volumes.
Table: Middle East Oil Production (000b/d)
Country 2011f 2012f 2013f 2014f 2015f 2016f 2017f 2018f
Bahrain 58 60 57 52 50 46 43 40
Iran 4,250 4,300 4,450 4,500 4,500 4,600 4,600 4,650
Israel 0 0 0 0 0 0 0 0
Kuwait 2,750 2,900 3,050 3,125 3,250 3,400 3,550 3,700
Oman 725 720 710 700 679 645 613 582
Qatar 1,609 1,648 1,656 1,679 1,702 1,739 1,759 1,768
Saudi Arabia 10,500 11,000 11,350 11,600 11,900 12,250 12,500 12,800
Turkey 33 30 27 20 16 15 12 10
UAE 2,950 3,100 3,225 3,300 3,400 3,550 3,600 3,700
BMI universe 22,875 23,758 24,525 24,976 25,497 26,245 26,677 27,250
Iraq 2,700 2,950 3,100 3,250 3,500 3,600 3,750 3,900
Syria 323 307 292 277 263 250 237 226
Yemen 393 413 433 455 478 502 527 553
Other ME 36 37 38 40 41 42 43 45
Regional total 26,327 27,465 28,389 28,998 29,778 30,639 31,235 31,973
f = forecast. All forecasts: BMI.

United Arab Emirates Oil & Gas Report Q3 2009
© Business Monitor International Ltd Page 73
Regional Refining Capacity
The Middle East is set for a near-doubling of crude distillation capacity between 2008 and 2018,
dominating the expansion of the world’s over-stretched refining industry. Cheap and plentiful local crude
supplies make it the region of choice for refinery investment. Iraq, Oman, Qatar and the UAE have
particularly ambitious plans, with even Turkey expected to see 122.4% capacity growth if all plans come
to fruition. The region’s importance as a net exporter of refined products will rise rapidly, as capacity
growth is more rapid than the expansion of domestic oil markets.
Table: Middle East Oil Refining Capacity (000b/d)
Country 2011f 2012f 2013f 2014f 2015f 2016f 2017f 2018f
Bahrain 262 262 262 302 302 302 302 302
Iran 2,000 2,000 2,000 2,250 2,400 2,650 2,650 2,800
Iraq 1,000 1,150 1,200 1,300 1,300 1,450 1,650 1,650
Israel 220 320 320 320 320 320 350 350
Kuwait 990 1,150 1,150 1,415 1,415 1,615 1,615 1,765
Oman 235 235 235 235 300 300 300 300
Qatar 550 720 720 720 750 750 750 810
Saudi Arabia 2,630 2,630 3,430 3,500 3,500 3,750 3,750 4,000
Turkey 763 763 800 963 963 1,163 1,163 1,363
UAE 1,000 1,000 1,150 1,250 1,500 1,500 1,700 1,950
BMI universe 9,650 10,230 11,267 12,255 12,750 13,800 14,230 15,290
Other ME 765 803 843 886 930 976 1,025 1,076
Regional total 10,415 11,033 12,110 13,141 13,680 14,776 15,255 16,366
f = forecast. All forecasts: BMI.

United Arab Emirates Oil & Gas Report Q3 2009
© Business Monitor International Ltd Page 74
Regional Gas Demand
Gas demand growth could slow appreciably between 2013 and 2018, when compared with the 32.3% rate
expected for the 2008-2013 period. There is still likely to be some 24.2% gas market expansion in the
region in the final five years of the period. Expansion of gas consumption is expected to be at its greatest
in Kuwait, Iraq, Israel and Bahrain. Iran, Turkey, Qatar and Oman are likely to lag the field, but still
consume between 33% and 52% more gas by the end of the forecast period.
Table: Middle East Gas Consumption (bcm)
Country 2011f 2012f 2013f 2014f 2015f 2016f 2017f 2018f
Bahrain 13.7 15.0 15.8 16.5 17.4 18.2 19.1 20.1
Iran 132.0 142.0 148.4 154.3 160.5 166.9 173.6 180.5
Iraq 5.5 6.0 6.6 7.3 8.0 8.8 9.7 10.6
Israel 9.0 10.0 10.5 11.0 11.6 12.2 12.8 13.4
Kuwait 21.0 23.0 25.3 27.3 30.1 33.1 36.0 38.9
Oman 14.5 16.0 16.5 17.0 17.5 18.0 18.5 19.1
Qatar 22.5 23.0 23.6 24.4 25.0 26.5 27.5 28.0
Saudi Arabia 91.9 100.5 108.1 114.9 117.1 119.7 121.5 123.7
Turkey 43.0 45.5 47.8 49.2 50.7 52.0 53.0 54.1
UAE 54.6 58.7 63.1 67.8 72.2 76.9 82.3 88.0
BMI universe 407.6 439.7 465.5 489.7 509.9 532.2 554.1 576.5
Other ME 40.9 42.9 45.1 47.3 49.7 52.2 54.8 57.5
Regional total 448.5 482.6 510.6 537.1 559.6 584.4 608.8 634.0
f = forecast. All forecasts: BMI.

United Arab Emirates Oil & Gas Report Q3 2009
© Business Monitor International Ltd Page 75
Regional Gas Supply
A production increase of 28.7% is forecast for the Middle East region in 2013-2018, representing a
significant deceleration compared with the 53.8% predicted during the 2008-13 period. Qatar’s explosive
growth in the first half of the forecast period is not sustainable, although its volumes could still rise 20.0%
in 2013-2018, compared with 92.9% in 2008-2013. Oman is likely to see gas production in decline over
the 2013-2018 period, while Bahrain volumes are set to rise only slowly.
Table: Middle East Gas Production (bcm)
Country 2011f 2012f 2013f 2014f 2015f 2016f 2017f 2018f
Bahrain 11.0 11.0 13.0 15.0 15.0 15.0 14.0 14.0
Iran 155.0 165.0 190.0 210.0 230.0 255.0 265.0 280.0
Iraq 13.0 15.0 17.0 20.0 23.0 27.0 30.0 35.0
Israel 7.0 7.0 7.0 7.0 7.0 7.0 7.0 7.0
Kuwait 16.2 19.9 20.6 21.0 23.6 24.3 27.0 27.8
Oman 30.0 33.0 35.0 35.0 35.0 32.0 30.0 30.0
Qatar 125.0 133.0 135.0 140.5 146.0 155.0 160.0 162.0
Saudi Arabia 91.9 100.5 108.1 114.9 117.1 119.7 121.5 123.7
Turkey na na na na na na na na
UAE 80.0 85.0 90.0 90.0 92.0 97.0 100.0 110.0
BMI universe 529.0 569.4 615.7 653.4 688.7 732.0 754.5 789.4
Other ME 8.0 8.8 9.7 10.7 11.8 12.9 14.2 15.7
Regional total 537.1 578.3 625.4 664.1 700.5 744.9 768.8 805.1
na = not available/applicable. f = forecast. All forecasts: BMI.
UAE Country Overview
Between 2008 and 2018, we are forecasting an increase in UAE oil production of 24.0%, with volumes
rising steadily to 3.70mn b/d by the end of the 10-year forecast period. Oil consumption between 2008
and 2018 is set to increase by 35.7%, with growth slowing to an assumed 3.0% per annum towards the
end of the period and the country using 635,000b/d by 2018. Gas production is expected to rise from
58bcm to 110bcm by the end of the period. With 2008-2018 demand growth of 83.4%, this provides
export potential rising from 10bcm to 22bcm over the period.

United Arab Emirates Oil & Gas Report Q3 2009
© Business Monitor International Ltd Page 76
Methodology & Risks To Forecasts
In terms of oil and gas supply, as well as refining capacity, the projections are wherever possible based on
known development projects, committed investment plans or stated government/company intentions. A
significant element of risk is clearly associated with these forecasts, as project timing is critical to volume
delivery. Our assumptions also take into account some third-party estimates, such as those provided by
the US-based Energy Information Administration (EIA), the International Energy Agency (IEA), the
Organisation of the Petroleum Exporting Countries (OPEC) and certain consultants’ reports that are in the
public domain. Reserves projections reflect production and depletion trends, expected exploration activity
and historical reserves replacement levels.
We have assumed flat oil and gas prices throughout the extended forecast period, but continue to provide
sensitivity analysis based on higher and lower price scenarios. Investment levels and production/reserves
trends will of course be influenced by energy prices. Oil demand has provide itself to be less sensitive to
pricing than expected, but will still have some bearing on consumption trends. Otherwise, we have
assumed a slowing of GDP growth for all countries beyond our core forecast period (to 2012) and a
further easing of demand trends to reflect energy-saving efforts and fuels substitution away from
hydrocarbons. Where available, government and third-party projections of oil and gas demand have been
used to cross check our own assumptions.

United Arab Emirates Oil & Gas Report Q3 2009
© Business Monitor International Ltd Page 77
BMI Forecast Modelling
How we generate our industry forecasts
BMI’s industry forecasts are generated using the best-practice techniques of time-series modelling. The
precise form of time-series model we use varies from industry to industry, in each case being determined,
as per standard practice, by the prevailing features of the industry data being examined. For example, data
for some industries may be particularly prone to seasonality, meaning seasonal trends. In other industries,
there may be pronounced non-linearity, whereby large recessions, for example, may occur more
frequently than cyclical booms.
Our approach varies from industry to industry. Common to our analysis of every industry, however, is the
use of vector autoregressions. Vector autoregressions allow us to forecast a variable using more than the
variable's own history as explanatory information. For example, when forecasting oil prices, we can
include information about oil consumption, supply and capacity.
When forecasting for some of our industry sub-component variables, however, using a variable's own
history is often the most desirable method of analysis. Such single-variable analysis is called univariate
modelling. We use the most common and versatile form of univariate models: the autoregressive moving
average model (ARMA).
In some cases, ARMA techniques are inappropriate because there is insufficient historical data or data
quality is poor. In such cases, we use either traditional decomposition methods or smoothing methods as a
basis for analysis and forecasting.
It must be remembered that human intervention plays a necessary and desirable part of all our industry
forecasting techniques. Intimate knowledge of the data and industry ensures we spot structural breaks,
anomalous data, turning points and seasonal features where a purely mechanical forecasting process
would not.

United Arab Emirates Oil & Gas Report Q3 2009
© Business Monitor International Ltd Page 78
Energy Industry
There are a number of principal criteria that drive our forecasts for each Energy indicator.
Energy supply
Supply of crude oil, natural gas, refined oil products and electrical power is determined largely by
investment levels, available capacity, plant utilisation rates and national policy. We therefore examine:
• national energy policy, stated output goals and investment levels,
• company-specific capacity data, output targets and capital expenditures, using national, regional and multinational company sources,
• international quotas, guidelines and projections, such as OPEC, IEA, US Energy Information Administration (EIA),
Energy consumption
A mixture of methods is used to generate demand forecasts, applied as appropriate to each individual
country:
• underlying economic (GDP) growth for individual countries/regions, sourced from BMI published estimates. Historical relationships between GDP growth and energy demand growth at an individual country are analysed and used as the basis for predicting levels of consumption,
• government projections for oil, gas and electricity demand,
• third party agency projections for regional demand, such as IEA, EIA, OPEC.
• extrapolation of capacity expansion forecasts, based on company- or state-specific investment levels.
Cross checks
Whenever possible, we compare government and/or third party agency projections with the declared
spending and capacity expansion plans of the companies operating in each individual country. Where
there are discrepancies, we use company-specific data as physical spending patterns to ultimately
determine capacity and supply capability. Similarly, we compare capacity expansion plans and demand
projections to check the energy balance of each country. Where the data suggest imports or exports, we
check that necessary capacity exists or that the required investment in infrastructure is taking place.
Sources
Sources include those international bodies mentioned above, such as OPEC, IEA, and EIA, as well as
local energy ministries, official company information, and international and national news agencies.