Embed Size (px)
Citation preview
Published 27 April 2017
Offender Management Statistics Bulletin, England and Wales
Quarterly October to December 2016 Annual 2016 Prison population: 31 March 2017
Main points
The prison population has been relatively stable for the past five years. This differs to the
increasing prison population trend that was observed between the 1950’s and early 2000’s
(see Figure 1). Our most recent extracts indicate that there were:
85,513 prisoners in
England and Wales as at
31 March 2017
The total prison population is virtually unchanged (0.1%
increase), compared to the same point in the previous
year.
34,617 admissions of
which 20,719 were first
receptions into prison in
the latest quarter
This is a decrease of 3% and 5% respectively on the
previous quarter and a decrease of 9% and 8%
respectively on the same quarter last year.
171,518 adjudication
outcomes in the last year
This is an increase of 16% on the previous year. A total
of 16,756 additional days were added to prisoner’s
sentences.
267,146 offenders on
probation as at 31
December 2016
The number of offenders on probation at the end of
December 2016 was 11% higher than same point in the
previous year.
5,278 offenders recalled
to prison in the latest
quarter
This is a reduction of 5% on the previous quarter and a
9% reduction on the same quarter in 2015.
73,560 releases of which
72,613 were from
determinate sentences in
the last year
The number of releases has remained relatively stable
with a slight decrease of 1% compared with the same
point in the previous year.
This publication provides offender management quarterly statistics for the latest date
available and provides comparisons to the previous year. This publication also contains
annual information for prison receptions and probation starts, as well as releases from
prison and probation terminations. For full and detailed commentary which looks into longer
term trends in the prison population, please refer to the prison population annual
publication, published in July, and ‘The Story of the Prison Population: 1993 - 2016’. For
technical detail please refer to the accompanying guide, ‘Guide to offender management
statistics’.

Page 2
1. Prison Population
The prison population stood at 85,513 on 31 March 2017
The sentenced prison population stood at 74,623 (87%), the remand prison population
stood at 9,419 (11%), and the non-criminal prison population stood at 1,471 (2%).
Figure 1: Prison population, 31 March 1997 to 2017 (Source: Table 1.1)
Remand
The remand population is 6% (647) lower than the same point 12 months earlier. The number of males remanded in custody fell by 7% (to 8,842) whilst the number of females increased by 9% (to 577).
The reduction in the overall remand population is consistent with the decreasing number of outstanding cases for the Crown Court (see Criminal Court Statistics Quarterly).
However, there is evidence that the long-term decreasing trend (most noticeably since mid-2014) is starting to level off; the remand population has been around 9,500 at many of the month-end snapshots during mid-2016 and early 2017 (See Table 1.1).
More than half of those remanded in custody were being held for either: Violence Against the Person (22% of those on remand), Theft Offences (16%) or Drug Offences (16%).
Sentenced
In line with the long term trend, the sentenced population has increased by 698 (1%) in the
year leading up to 31 March 2017. Broadly speaking, there have been decreases in the
number of prisoners serving shorter determinate sentences, and increases in those serving
longer determinate sentences.
However, the numbers of prisoners serving sentences of ‘Greater than six months, but less than 12 months’ increased by 12% over the previous 12 month period.
0
10,000
20,000
30,000
40,000
50,000
60,000
70,000
80,000
90,000
100,000
Mar-1997 Mar-1999 Mar-2001 Mar-2003 Mar-2005 Mar-2007 Mar-2009 Mar-2011 Mar-2013 Mar-2015 Mar-2017
Prison p
opula
tio
n
Total (including non-criminals) Sentenced Remand

Page 3
Sex offenders
The rise in the long determinate sentenced population is in line with the increasing number
of sentenced sex offenders. As at 31 March 2017 there were 13,246 prisoners serving
sentences for sexual offences, representing 15% of the total prison population.
The number of prisoners serving immediate custodial sentences for sexual offences is now
at its highest level since at least 2002. This is consistent with the latest ONS ‘Crime in
England and Wales’ bulletin which reports on the number of sexual offences recorded by
the police in the year ending June 2016.
‘Violence Against the Person (VATP)’ and ‘Possession of Weapons’ offences
One in every four sentenced prisoners is in prison for a VATP offence. This proportion has
remained stable over the past 12 months. The number of those sentenced to a Possession
of Weapons offence increased by 12% (to 2,317) compared to the same time last year. This
substantial increase can be attributed to a range of factors, including more targeted police
operations against knife crime. However this offence group only accounts for 3% of the
prison population.
Extended Determinate Sentences (EDS)
EDSs were made available for courts to impose from 13 April 2015. On 31 March 2017, 3,594 prisoners were serving such sentences; this is a 7% increase compared to the previous quarter and a 34% increase compared to the same time last year.
Indeterminate sentences
As at 31 March 2017, there were 10,803 (10,449 male; 354 female) indeterminate sentenced prisoners (those serving Imprisonment for Public Protection (IPP) sentences and life sentences) in the prison population. This represents an annual decrease of 6%.
There were 3,528 IPP prisoners as at 31 March 2017 which represents a decrease of 15% in the last 12 months. This figure has fallen by 42% since the June 2012 peak of 6,080, however, the number of IPP prisoners who have been recalled to custody continues to increase; in the past year the recalled IPP population has increased by 26% (to 711).
The proportion of the IPP population post-tariff continues to increase; as at 31 March 2017, 85% of IPP prisoners were post-tariff compared to 81% at the same time last year.
The number of life sentenced prisoners (7,275) has dropped slightly (by 1%) compared to 31 March 2016. There were 59 whole-life prisoners at the end of March 2017, with five additional whole life prisoners being treated in secure hospitals.
Recall to custody
The prison population who have been recalled to custody (6,554 prisoners) remained stable
over the year leading up to 31 March 2017. On this date, there were 1,073 prisoners
recorded as being in custody following a recall under the Offender Rehabilitation Act 2014
(ORA); representing 16% of the total recall population.
Foreign National Offenders (FNOs)
There were 9,791 (1,650 remand, 6,735 sentenced and 1,406 non-criminal) foreign nationals held in custody and HMPPS-operated Immigration Removal Centres (IRCs) as at 31 March 2017; representing 11% of the total prison population. The number of FNOs in the prison and HMPPS IRC population has decreased by 2% compared to 31 March 2016.
The most common nationalities after British Nationals in prisons are Polish (894), Irish (773), Albanian (636), Romanian (619) and Jamaican (517).

Page 4
2. Prison receptions and admissions
Summary of annual statistics
In total there were 144,030 admissions to custody in the last year.
55,577 remand admissions, 67,524 sentenced admissions, 20,729 recall admissions and
200 civil non-criminal admissions.
The number of sentenced admissions in 2016 (67,524) was 3% lower than in 2015 and had a broadly similar distribution of custodial sentence lengths between the years, with nearly half serving sentences less than or equal to 6 months (2015: 48%, 2016: 47%).
The number of determinate sentences of less than 2 years decreased by 4%, whilst the number of determinate sentences of 2 years or longer increased by 2%. The number of admissions serving an indeterminate sentence increased by 19%. This continues the trend for decreased numbers of short determinate sentences and increased numbers of longer determinate sentences over the last five years.
Part of the increase in sentenced admissions on to longer determinate sentences can be attributed to legislative changes in 2012 which abolished the IPP (Imprisonment for Public Protection) sentence and replaced it with a new Extended Determinate Sentence (EDS).
There was an overall reduction in admissions receiving an immediate custodial sentence of 3% in 2016 relative to 2015. The biggest reductions in the number of those receiving an immediate custodial sentence were for robbery (13%) and theft offences (11%). By comparison, the number of those admitted under an immediate custodial sentence for possession of weapons was 22% higher in 2016 than 2015. Direct comparison is not available beyond 2015 due to changes in the reporting of offence groups.
The number of adult untried admissions fell by 15% when compared to the previous year, a much larger drop than the 2% fall in adult sentenced admissions. The only age category to see an increase in immediate custodial sentenced admissions was 30-39 year olds, which increased by 2%. The younger age groups decreased the most, with the number of 15-17 year old admissions for immediate custodial sentences falling by 9%.
Young adult (18-20 years olds) remand (untried or convicted unsentenced) and sentenced admissions saw a larger decline than adults over the previous year. In particular, for 18 to 20 year olds, untried admissions fell by 21% and sentenced admissions by 7% when compared to the previous year. The fall in sentenced admissions is largely attributable to the fall in sentenced admissions on to determinate sentences of less than 2 years. The recent pattern of steep decreases for the prison admissions in this age group has continued and can also be observed in the lower proportion of the prison population being attributed to young adults.
86,258 offenders were received into custody as first receptions in the last year.
44,585 remand first receptions, 41,496 sentenced first receptions and 177 civil non-
criminal first receptions.
Page 5
Summary of quarterly statistics
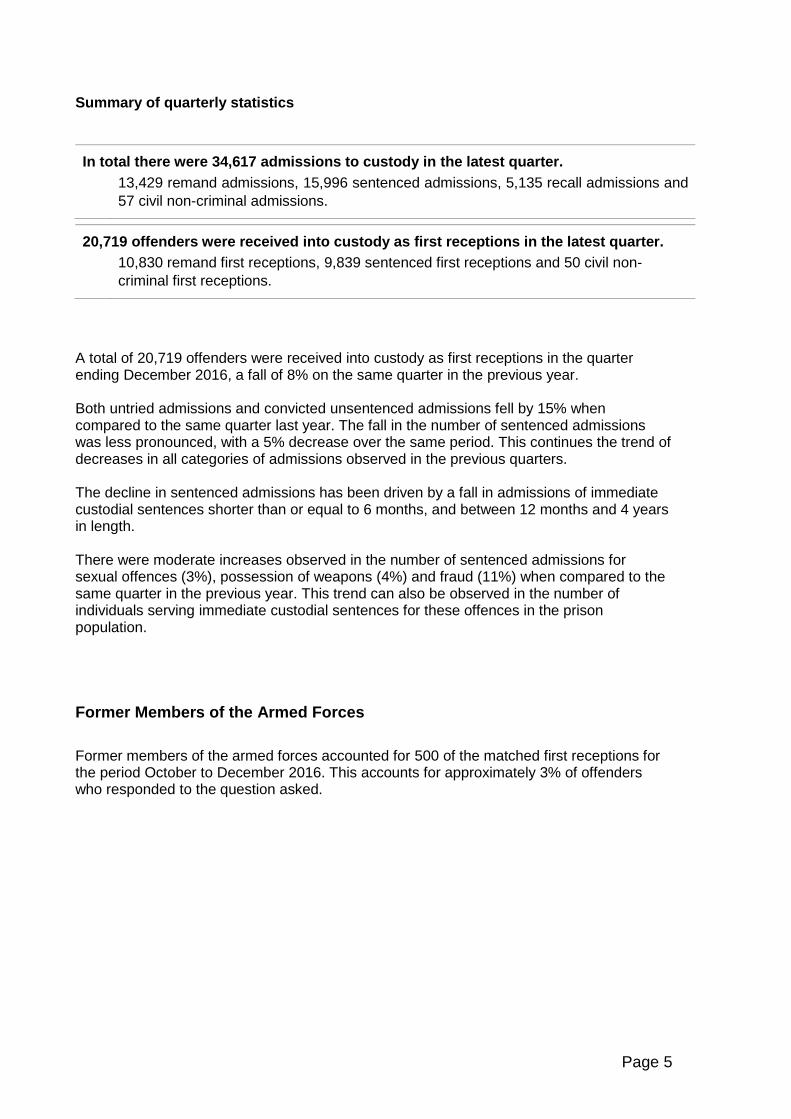
In total there were 34,617 admissions to custody in the latest quarter.
13,429 remand admissions, 15,996 sentenced admissions, 5,135 recall admissions and
57 civil non-criminal admissions.
A total of 20,719 offenders were received into custody as first receptions in the quarter ending December 2016, a fall of 8% on the same quarter in the previous year.
Both untried admissions and convicted unsentenced admissions fell by 15% when compared to the same quarter last year. The fall in the number of sentenced admissions was less pronounced, with a 5% decrease over the same period. This continues the trend of decreases in all categories of admissions observed in the previous quarters.
The decline in sentenced admissions has been driven by a fall in admissions of immediate custodial sentences shorter than or equal to 6 months, and between 12 months and 4 years in length.
There were moderate increases observed in the number of sentenced admissions for sexual offences (3%), possession of weapons (4%) and fraud (11%) when compared to the same quarter in the previous year. This trend can also be observed in the number of individuals serving immediate custodial sentences for these offences in the prison population.
Former Members of the Armed Forces
Former members of the armed forces accounted for 500 of the matched first receptions for the period October to December 2016. This accounts for approximately 3% of offenders who responded to the question asked.
20,719 offenders were received into custody as first receptions in the latest quarter.
10,830 remand first receptions, 9,839 sentenced first receptions and 50 civil non-
criminal first receptions.
Page 6
3. Adjudications Summary of annual statistics
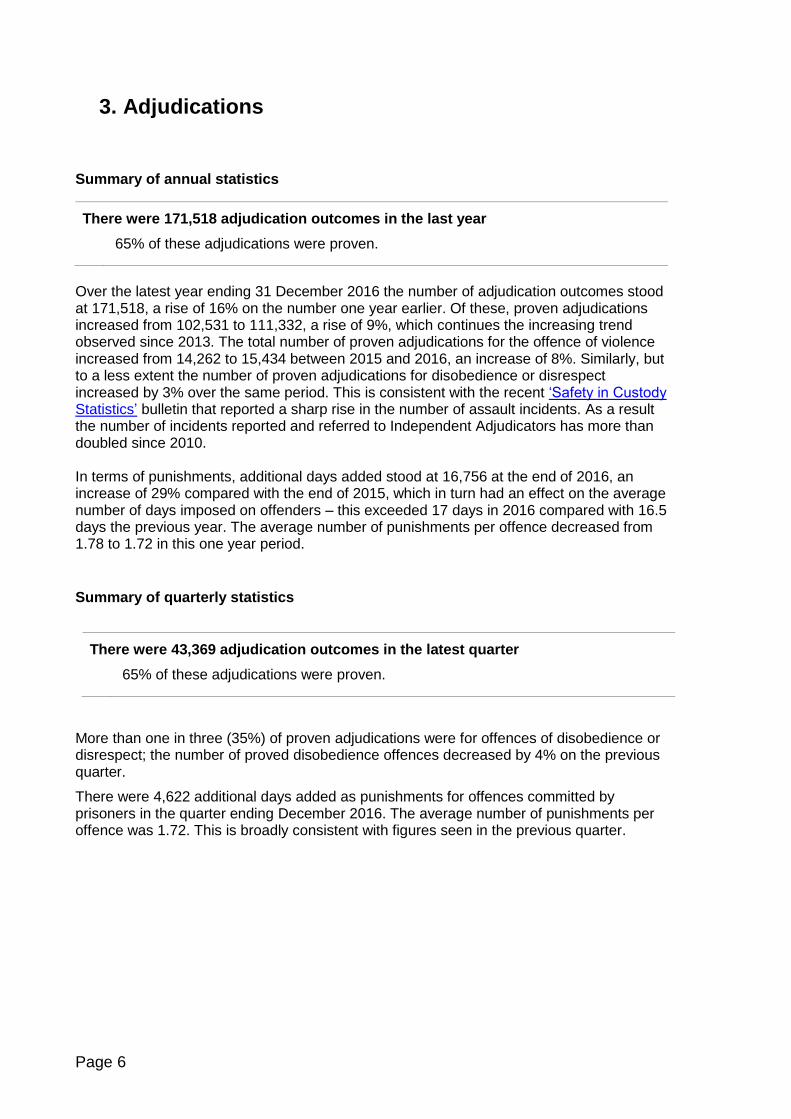
Over the latest year ending 31 December 2016 the number of adjudication outcomes stood at 171,518, a rise of 16% on the number one year earlier. Of these, proven adjudications increased from 102,531 to 111,332, a rise of 9%, which continues the increasing trend observed since 2013. The total number of proven adjudications for the offence of violence increased from 14,262 to 15,434 between 2015 and 2016, an increase of 8%. Similarly, but to a less extent the number of proven adjudications for disobedience or disrespect increased by 3% over the same period. This is consistent with the recent ‘Safety in Custody Statistics’ bulletin that reported a sharp rise in the number of assault incidents. As a result the number of incidents reported and referred to Independent Adjudicators has more than doubled since 2010. In terms of punishments, additional days added stood at 16,756 at the end of 2016, an increase of 29% compared with the end of 2015, which in turn had an effect on the average number of days imposed on offenders – this exceeded 17 days in 2016 compared with 16.5 days the previous year. The average number of punishments per offence decreased from 1.78 to 1.72 in this one year period.
Summary of quarterly statistics
There were 43,369 adjudication outcomes in the latest quarter
65% of these adjudications were proven.
More than one in three (35%) of proven adjudications were for offences of disobedience or disrespect; the number of proved disobedience offences decreased by 4% on the previous quarter.
There were 4,622 additional days added as punishments for offences committed by prisoners in the quarter ending December 2016. The average number of punishments per offence was 1.72. This is broadly consistent with figures seen in the previous quarter.
There were 171,518 adjudication outcomes in the last year
65% of these adjudications were proven.

Page 7
4. Prison Releases
Prison releases from custodial sentences Summary of annual statistics
In 2016, a total of 72,613 offenders were released from determinate sentences, a slight fall of 1% from 2015. The number of males released from determinate sentences fell by 2% between 2015 and 2016, whereas the number of females released increased by 2%. Until the change of data source in 2015(1), the number of releases from determinate sentences had been falling since 2008. Much of this fall could be attributed to a falling number of prison receptions for shorter determinate sentences (less than 12 months) throughout the period. However these figures are not comparable with 2016 onwards.
947 offenders were released from indeterminate sentences in 2016 – 576 from IPP sentences and 371 from life sentences. Summary of quarterly statistics
The total number of releases during the quarter ending December 2016 represents a 5%
decrease compared to the same quarter in 2015, with a 10% decrease in the number of
releases of offenders serving determinate sentences of 12 months to less than 2 years.
There were 248 releases from indeterminate sentences between October and December, a
15% increase from the same period in 2015, mainly due to a rise in the number of offenders
released from Imprisonment for Public Protection (IPP) sentences which were introduced in
2005 and abolished in 2012.
Home Detention Curfew
The number of releases on Home Detention Curfew in 2016 increased by 5% to 9,041 when compared to the number of releases in 2015. To be considered for release under HDC an offender must be serving a sentence of between 3 months and less than 4 years.
Of those released on HDC in 2016, 471 (5%) were recalled to custody during their HDC period by 31 December 2016. Those serving sentence lengths of 2 years to less than 4 years (42%) were the largest proportion of individuals recalled.
(1) For more information about the change of data source, see the Changes to Offender Management Statistics document
73,560 offenders were released from custody in the last year.
72,613 releases from determinate sentences and 947 from indeterminate sentences.
18,361 offenders were released from custody in the latest quarter.
18,113 releases from determinate sentences and 248 from indeterminate sentences.

Page 8
Release on temporary licence
Summary of annual statistics
In 2016, there were 332,776 incidences of prisoners being released on temporary licence; a similar figure to 2015.
Prior to the change of data source in 2015, there was a trend of significantly falling numbers of incidences of ROTL since 2013, where the number of incidences recorded was at its highest level. This continuous fall can likely be attributed to remedial action to tighten ROTL processes following serious failures in 2013.
In 2016, 7,036 individuals received ROTL, an increase of 4% when compared to the previous year. However, the average number of release incidences per individual remained at a broadly similar level with each prisoner receiving approximately 47 releases. In total there were 251 recorded Temporary Release Failures (TRFs) in the year 2016. Furthermore, there were 75 failures per 100,000 incidences of release.
Summary of quarterly statistics
There were 88,602 incidences of ROTL during the quarter ending December 2016, the highest number of ROTL incidences within a quarter since the start of 2015. Compared to the quarter ending December 2016, the number of ROTL incidences increased by 12% for males but decreased by 1% for females. The number of individuals given at least one incidence of ROTL between October and December 2016 was 3,985, which represents an increase of 13% since the same quarter of the previous year. There were 65 recorded Temporary Release Failures (TRFs) between October and December 2016. This is similar to the previous quarter, but 16 more than the same period the previous year. TRFs as a proportion of temporary release incidences remain at a low level, with approximately only 1 in every 1,400 incidences of temporary release resulting in a failure between October and December 2016.
Prisoner transfers
There were a total of 95,130 incidences of prisoner transfer in 2016, with a substantial amount (69%) being recorded as routine inter-prison transfers whilst 1,694 (2%) incidences of transfer were a result of overcrowding drafts. Further, 60,466 prisoners had at least once incidence of transfer in 2016.

Page 9
5. Probation Summary of annual statistics
The total annual probation caseload increased by 39% between 2000 and 2008 to 243,434. Since then the probation caseload fell year on year, reaching 217,359 at the end of 2014. However, at the end of December 2016, the total caseload stood at 267,146. This recent rise is mainly due to statutory supervision on release from prison for all offenders given custodial sentences of more than one day.
The total court order caseload (offenders on community orders (COs) and suspended sentence orders (SSOs)) fell 17% between 2010 and 2015, largely reflecting the fall in community orders. However, in the last year the court order caseload rose by 12% to reach 124,643, reflecting increases in both the CO and SSO caseloads. For those starting supervision, the number of court order starts fell by 24% between 2010 and 2016, largely reflecting the fall in community orders. This fall in starts also reflects that seen in community orders given as sentences by the courts in England and Wales over the past six years.
The number of court reports prepared by the Probation Service fell by 32% between 2009 and 2016 to reach 148,296, reflecting the long-term downward trend in the number of cases being dealt with by the courts.
Figure 2: Number of offenders under Probation Service supervision at end of December, 2006-2016 (Source: Table 4.14)
The total number of offenders on probation was 267,146 at the end of 2016.
This was an 11% increase in the total probation caseload (court orders and pre and
post-release supervision) compared with one year earlier and an increase of 14%
compared to December 2006.
0
50,000
100,000
150,000
200,000
250,000
300,000
2006 2007 2008 2009 2010 2011 2012 2013 2014 2015 2016
Nu
mb
er
of
off
en
ders
Community sentences Suspended sentences Pre-release supervision Post-release supervision
Page 10
Summary of quarterly statistics
Looking at the most recent quarterly trends, the court order caseload rose by 12%, with the CO caseload rising by 9% and the SSO caseload rising by 17% between the quarters ending December 2015 and 2016. The number of offenders starting COs fell by 12% over this period, while starts of SSOs with requirements fell by 11%. The caseload of offenders supervised before or after release from prison increased by 12% between the end of December 2015 and 2016, with offenders supervised on post release increasing by 15% alone. This is due to the introduction of the ORA on 1st February 2015 (see Guide). With regard to the number of requirements started under court orders, there have been particular increases in the combination of the rehabilitation requirement with both the unpaid work and curfew requirements for offenders starting SSOs. There has also been a significant increase in the use of the electronic monitoring requirement across both court orders. Of the court orders terminated in the quarter ending December 2016, 73% of Community
Orders were terminated successfully (i.e. ran their full course or were terminated early for
good progress); for the supervision periods of Suspended Sentence Orders, 71% were
terminated successfully over this period.
The volume of court reports decreased by 16% between the quarters ending December 2015 and 2016, falling from 39,801 to 33,557. Around 73% of immediate custodial sentences proposed in Pre-Sentence Reports resulted in that sentence being given in the latest 12 month period.
The total number of offenders on probation was 267,146 as at 31 December 2016.
There was an 11% increase in the total probation caseload compared with 31 December 2015.

Page 11
6. Licence recalls Summary of annual statistics
The number of licence recalls over 2016 was 21,559.
This remained at a stable level when compared with 2015, increasing by only 92
recalls.
Over the whole of 2016, 21,559 offenders were recalled for breaching the conditions of their licence. Excluding those with a sentence of under 12 months, recalls would have fallen by 17% between 2015 and 2016. In contrast, the number of offenders that were recalled for original sentences of less than 12 months increased by 57% between 2015 and 2016.
The most common reason for offenders being recalled during 2016 was as a result of being charged with a further offence, with 45% of recalls having a further charge attributed as one of the reasons for their recall.
Summary of quarterly statistics
The number of licence recalls between October and December 2016 was 5,278.
This was 9% lower than in the same period in 2015.
Between October and December 2016, 5,278 offenders were recalled for breaching the conditions of their licence, representing a decrease of 9% compared with the same period in 2015. Of these recalls, 2,031 were for offenders serving a sentence of less than 12 months.
The most common reason for offenders being recalled in this period was non-compliance, with 55% of recalls having non-compliance recorded as one of the reasons for recall. Summary of licence recall time series
Between April 1999 and December 2016, 229,500 of those released on licence were recalled to custody for breaching the conditions of their licence, e.g. failing to report to their probation officer. Of all those recalled over this period, 99.3% were returned by the end of March 2017. Of all those released on licence and recalled to custody due to breaching the conditions of their licence between April 1999 and December 2016, there were 1,498 who had not been returned to custody by the end of March 2017. This means the proportion of prisoners not returned to custody over this period is 0.7%, which is constant compared to previous years. A further 18 offenders had not been returned to custody as of 31 March 2017 after recall between 1984 and April 1999, meaning the total number of offenders not returned to custody at the end of March 2017 was 1,516. These figures include some offenders believed to be dead or living abroad but who have not been confirmed as dead or deported. Of the 1,516 not returned to custody by 31 March 2017, 218 had originally been serving a prison sentence for violence against the person offences and a further 48 for sexual offences.

Page 12
Further information
This publication presents quarterly data trends. For annual figures, and longer-term trends,
please refer to our annual bulletin published in July each year.
Accompanying files
As well as this bulletin, the following products are published as part of this release:
A ‘Guide to Offender Management Statistics’, which provides comprehensive
information about data sources and quality, as well as key legislative changes.
A document outlining the ‘Users of Offender Management Statistics’
A set of data tables, covering each section of this bulletin, including a prison population
data tool.
National Statistics status
National Statistics status means that official statistics meet the highest
standards of trustworthiness, quality and public value.
All official statistics should comply with all aspects of the Code of Practice for
Official Statistics. They are awarded National Statistics status following an
assessment by the Authority’s regulatory arm. The Authority considers whether the statistics
meet the highest standards of Code compliance, including the value they add to public
decisions and debate.
It is the Ministry of Justice’s responsibility to maintain compliance with the standards
expected for National Statistics. If we become concerned about whether these statistics are
still meeting the appropriate standards, we will discuss any concerns with the Authority
promptly. National Statistics status can be removed at any point when the highest standards
are not maintained, and reinstated when standards are restored.
Contact
Press enquiries should be directed to the Ministry of Justice press office:
Tel: 020 3334 3536
Email: [email protected]
Other enquiries about these statistics should be directed to the Justice Statistics Analytical
Services division of the Ministry of Justice:
Nick Mavron, Head of Prison, Probation, Reoffending and PbR Statistics
Ministry of Justice, 7th Floor, 102 Petty France, London, SW1H 9AJ
Email: [email protected]
Next update: 27 July 2017
URL: https://www.gov.uk/government/collections/offender-management-statistics-quarterly
© Crown copyright
Produced by the Ministry of Justice
Alternative formats are available on request from [email protected]


![Thug in Prison Cannot Shoot Your Sister: Ohio Appears ...€¦ · Fail/Winter 1995] "A THUG IN PRISON CANNOT SHOOT YOUR SISTER" 255 dangerous and repetitive offender statutes, 4 recidivist](https://img.dokumen.tips/doc/110x75/5e995912488391758413b95d/thug-in-prison-cannot-shoot-your-sister-ohio-appears-failwinter-1995-a.jpg)