Embed Size (px)
Citation preview

Publication of Statistical Linked Open Data in Japan
Yu Asano1, Yusuke Takeyoshi2, Junichi Matsuda1, and Shoki Nishimura3
1 Hitachi, Ltd., Tokyo, Japan {yu.asano.ko, junichi.matsuda.ru}@hitachi.com
2 Oracle Corporation Japan, Tokyo, Japan [email protected]
3 National Statistics Center, Tokyo, Japan [email protected]
Abstract. In 2016, the Japanese Statistics Center published a large-scale statistical linked open data (LOD) site consisting of approximately 300 million triples. The LOD simplify processing data, such as filtering, aggregation, and integration of data. The aim of this action is to promote domestic and international utilization of the statistics. In this paper, we introduce publishing processes and a use case of statistical LOD. Afterwards, we show our approach to speed up the SPARQL search for the vast number of LOD.
Keywords: Statistics, Linked Open Data, RDF, RDF Data Cube Vocabulary
1 Introduction
The Japanese Statistics Bureau1 and the Statistics Center2 publish approximately 500 kinds of governmental statistics by one stop in a portal site3 of the official statistics of Japan called e-Stat. Most of the statistics are in Microsoft® Excel®, but the main statistics are published via a database and API. The target data are being expanded. However, processing the data, such as by filtering, aggregating, and integrating them, may prove difficult because the structure and vocabulary of the statistical data are not unified. The unionization of the structure and vocabulary is time consuming.
By providing statistical LOD that use a unified structure and vocabulary, we aim to promote domestic and international utilization of the statistics. To accomplish these purposes, we generate statistical LOD in consideration of the following.
(A) Use of a unified structure (B) Use of a unified vocabulary For (A), we use the RDF Data Cube Vocabulary [1], which is a World Wide Web
(W3C) recommendation standard to express statistical data in a resource description framework (RDF). The vocabulary is meant to publish multi-dimensional data in such a way that the data are linked to related data. The concrete application method is in
1 http://www.stat.go.jp/english/ 2 http://www.nstac.go.jp/en/ 3 http://www.e-stat.go.jp/
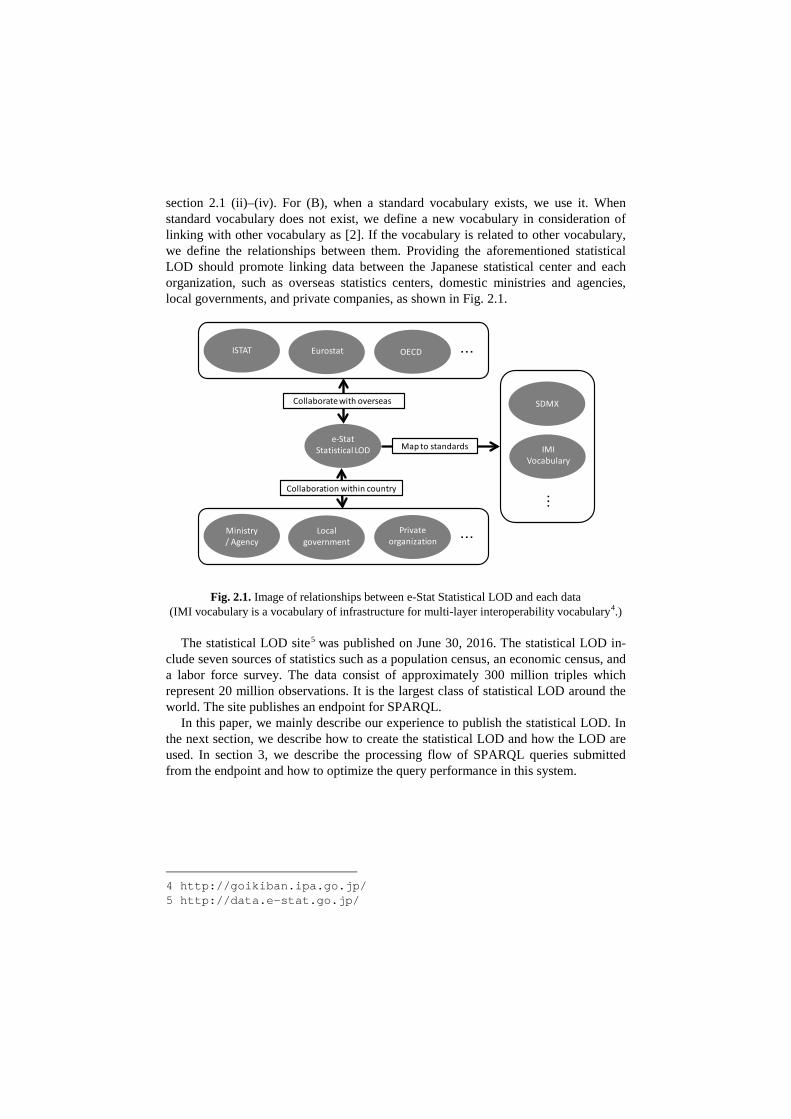
section 2.1 (ii)–(iv). For (B), when a standard vocabulary exists, we use it. When standard vocabulary does not exist, we define a new vocabulary in consideration of linking with other vocabulary as [2]. If the vocabulary is related to other vocabulary, we define the relationships between them. Providing the aforementioned statistical LOD should promote linking data between the Japanese statistical center and each organization, such as overseas statistics centers, domestic ministries and agencies, local governments, and private companies, as shown in Fig. 2.1.
Fig. 2.1. Image of relationships between e-Stat Statistical LOD and each data (IMI vocabulary is a vocabulary of infrastructure for multi-layer interoperability vocabulary4.)
The statistical LOD site5 was published on June 30, 2016. The statistical LOD in-clude seven sources of statistics such as a population census, an economic census, and a labor force survey. The data consist of approximately 300 million triples which represent 20 million observations. It is the largest class of statistical LOD around the world. The site publishes an endpoint for SPARQL.
In this paper, we mainly describe our experience to publish the statistical LOD. In the next section, we describe how to create the statistical LOD and how the LOD are used. In section 3, we describe the processing flow of SPARQL queries submitted from the endpoint and how to optimize the query performance in this system.
4 http://goikiban.ipa.go.jp/ 5 http://data.e-stat.go.jp/
e-StatStatistical LOD
SDMX
Ministry / Agency
Local government
Private organization
・・・
・・・
ISTAT Eurostat OECD ・・・
IMIVocabulary
Collaboration within country
Map to standards
Collaborate with overseas

2 Publication and utilization of statistical LOD
We pushed forward a publication of statistical LOD for promoting the utilization of the statistics both domestically and internationally. For the publication of statistical LOD, we need to prepare the RDF data and interface to access them. In this section, we introduce how to create and publish the LOD and how the LOD are used.
2.1 Generating method of statistical LOD
In our effort, we generate statistical LOD by converting original statistical data in a relational data base (RDB) into RDF based on the process in Fig. 2.2. The RDF data is represented by using three components (triples), consisting of the subject, predicate, and object. We use the RDF Data Cube Vocabulary mentioned in section 1 for the conversion. (i) Data selection: Decide the target statistical data to convert into RDF. (ii) Preparation of ontology: List necessary items for expressing the target data as
LOD. When a standard vocabulary exists, we use it. When any standard vocab-ulary does not exist, we define a new vocabulary as an ontology.
(iii) Definition of dataset and data structure definition (DSD): Define the dataset and DSD of the target statistical data.
(iv) Conversion of observations: Convert each observation in RDB into RDF.
Fig. 2.2. Process to convert statistical data in RDB into RDF
We show the overviews of each process in the following.
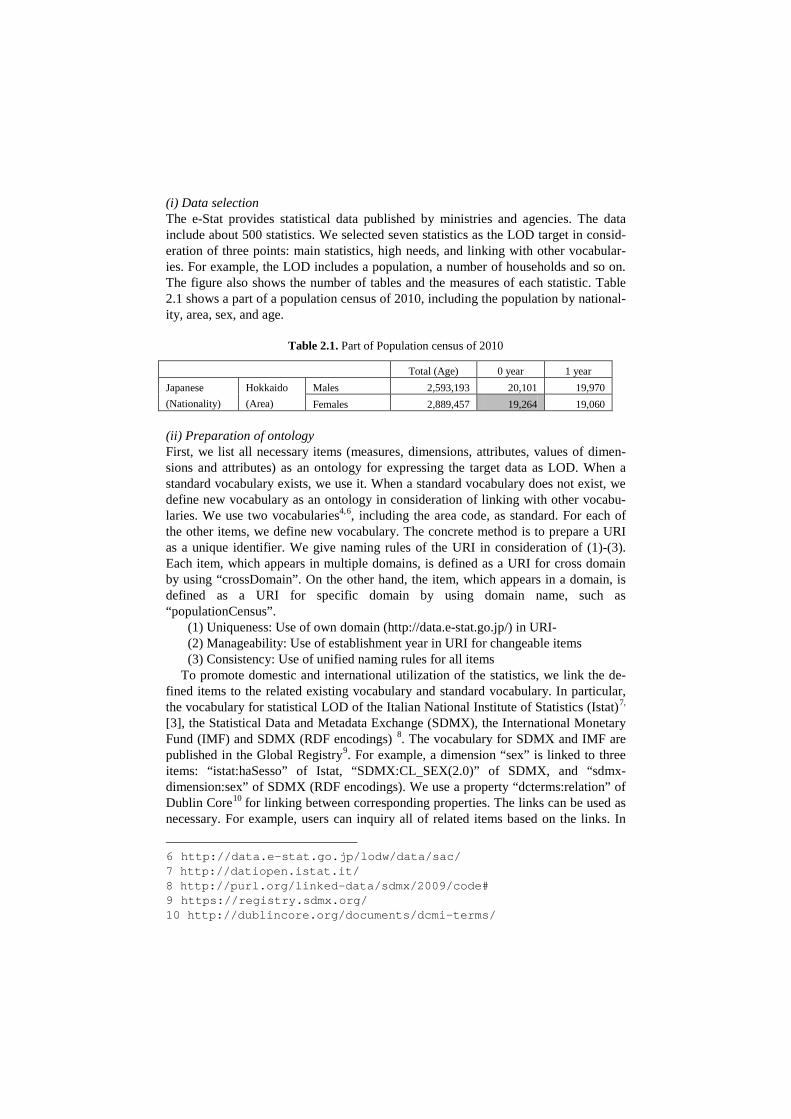
(i) Data selection The e-Stat provides statistical data published by ministries and agencies. The data include about 500 statistics. We selected seven statistics as the LOD target in consid-eration of three points: main statistics, high needs, and linking with other vocabular-ies. For example, the LOD includes a population, a number of households and so on. The figure also shows the number of tables and the measures of each statistic. Table 2.1 shows a part of a population census of 2010, including the population by national-ity, area, sex, and age.
Table 2.1. Part of Population census of 2010
Total (Age) 0 year 1 year Japanese (Nationality)
Hokkaido (Area)
Males 2,593,193 20,101 19,970 Females 2,889,457 19,264 19,060
(ii) Preparation of ontology First, we list all necessary items (measures, dimensions, attributes, values of dimen-sions and attributes) as an ontology for expressing the target data as LOD. When a standard vocabulary exists, we use it. When a standard vocabulary does not exist, we define new vocabulary as an ontology in consideration of linking with other vocabu-laries. We use two vocabularies4,6, including the area code, as standard. For each of the other items, we define new vocabulary. The concrete method is to prepare a URI as a unique identifier. We give naming rules of the URI in consideration of (1)-(3). Each item, which appears in multiple domains, is defined as a URI for cross domain by using “crossDomain”. On the other hand, the item, which appears in a domain, is defined as a URI for specific domain by using domain name, such as “populationCensus”.
(1) Uniqueness: Use of own domain (http://data.e-stat.go.jp/) in URI- (2) Manageability: Use of establishment year in URI for changeable items (3) Consistency: Use of unified naming rules for all items To promote domestic and international utilization of the statistics, we link the de-
fined items to the related existing vocabulary and standard vocabulary. In particular, the vocabulary for statistical LOD of the Italian National Institute of Statistics (Istat)7, [3], the Statistical Data and Metadata Exchange (SDMX), the International Monetary Fund (IMF) and SDMX (RDF encodings) 8. The vocabulary for SDMX and IMF are published in the Global Registry9. For example, a dimension “sex” is linked to three items: “istat:haSesso” of Istat, “SDMX:CL_SEX(2.0)” of SDMX, and “sdmx-dimension:sex” of SDMX (RDF encodings). We use a property “dcterms:relation” of Dublin Core10 for linking between corresponding properties. The links can be used as necessary. For example, users can inquiry all of related items based on the links. In
6 http://data.e-stat.go.jp/lodw/data/sac/ 7 http://datiopen.istat.it/ 8 http://purl.org/linked-data/sdmx/2009/code# 9 https://registry.sdmx.org/ 10 http://dublincore.org/documents/dcmi-terms/
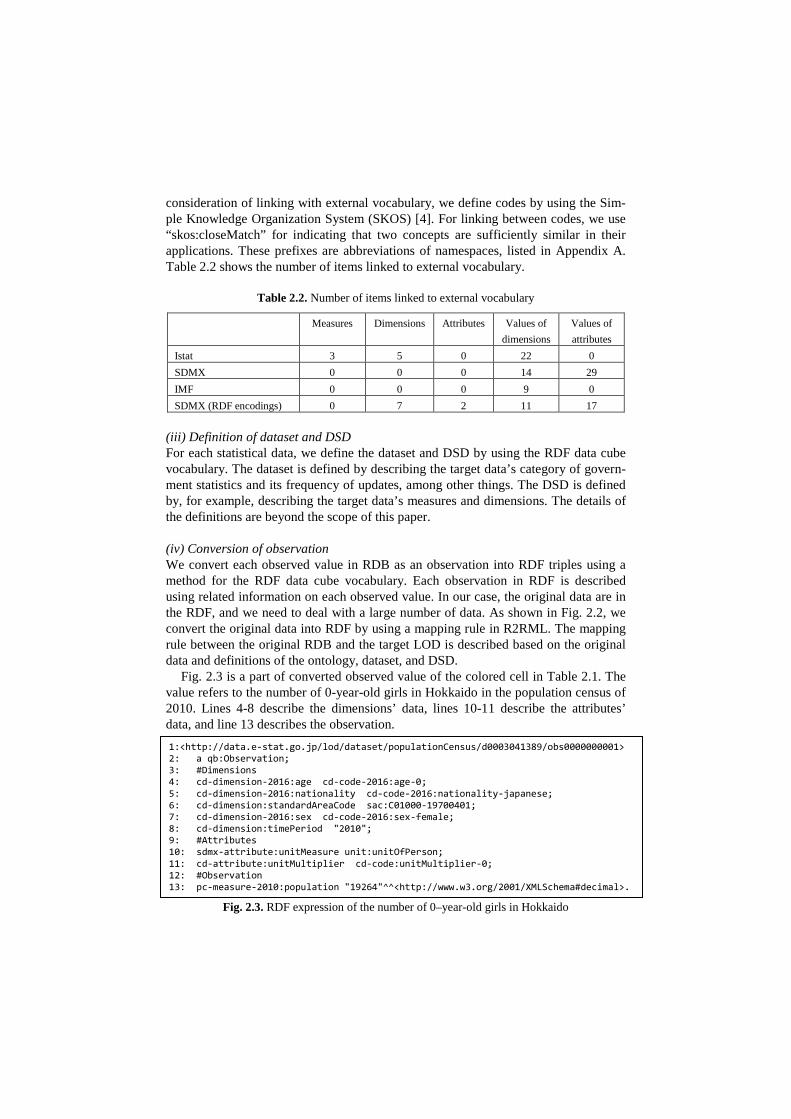
consideration of linking with external vocabulary, we define codes by using the Sim-ple Knowledge Organization System (SKOS) [4]. For linking between codes, we use “skos:closeMatch” for indicating that two concepts are sufficiently similar in their applications. These prefixes are abbreviations of namespaces, listed in Appendix A. Table 2.2 shows the number of items linked to external vocabulary.
Table 2.2. Number of items linked to external vocabulary
Measures Dimensions Attributes Values of dimensions
Values of attributes
Istat 3 5 0 22 0 SDMX 0 0 0 14 29 IMF 0 0 0 9 0 SDMX (RDF encodings) 0 7 2 11 17
(iii) Definition of dataset and DSD For each statistical data, we define the dataset and DSD by using the RDF data cube vocabulary. The dataset is defined by describing the target data’s category of govern-ment statistics and its frequency of updates, among other things. The DSD is defined by, for example, describing the target data’s measures and dimensions. The details of the definitions are beyond the scope of this paper.
(iv) Conversion of observation We convert each observed value in RDB as an observation into RDF triples using a method for the RDF data cube vocabulary. Each observation in RDF is described using related information on each observed value. In our case, the original data are in the RDF, and we need to deal with a large number of data. As shown in Fig. 2.2, we convert the original data into RDF by using a mapping rule in R2RML. The mapping rule between the original RDB and the target LOD is described based on the original data and definitions of the ontology, dataset, and DSD.
Fig. 2.3 is a part of converted observed value of the colored cell in Table 2.1. The value refers to the number of 0-year-old girls in Hokkaido in the population census of 2010. Lines 4-8 describe the dimensions’ data, lines 10-11 describe the attributes’ data, and line 13 describes the observation.
Fig. 2.3. RDF expression of the number of 0–year-old girls in Hokkaido
1:<http://data.e-stat.go.jp/lod/dataset/populationCensus/d0003041389/obs0000000001> 2: a qb:Observation; 3: #Dimensions 4: cd-dimension-2016:age cd-code-2016:age-0; 5: cd-dimension-2016:nationality cd-code-2016:nationality-japanese; 6: cd-dimension:standardAreaCode sac:C01000-19700401; 7: cd-dimension-2016:sex cd-code-2016:sex-female; 8: cd-dimension:timePeriod "2010"; 9: #Attributes 10: sdmx-attribute:unitMeasure unit:unitOfPerson; 11: cd-attribute:unitMultiplier cd-code:unitMultiplier-0; 12: #Observation 13: pc-measure-2010:population "19264"^^<http://www.w3.org/2001/XMLSchema#decimal>.
2.2 Publication and Utilization of statistical LOD
We introduce both the publication and utilization of statistical LOD in this section.
2.2.1 Publication of statistical LOD The statistical LOD consist of 300 million triples. The following two publishing methods were used. We can access them via the statistical LOD site5.
(1) SPARQL endpoint: We publish the SPARQL endpoint and example queries. (2) Definitions of components: We publish the definitions of datasets, DSDs, di-
mensions, measures, attributes, and codes (values of dimensions, values of at-tributes). These are necessary for issuing queries. The formats of the defini-tions are HTML and Turtle.
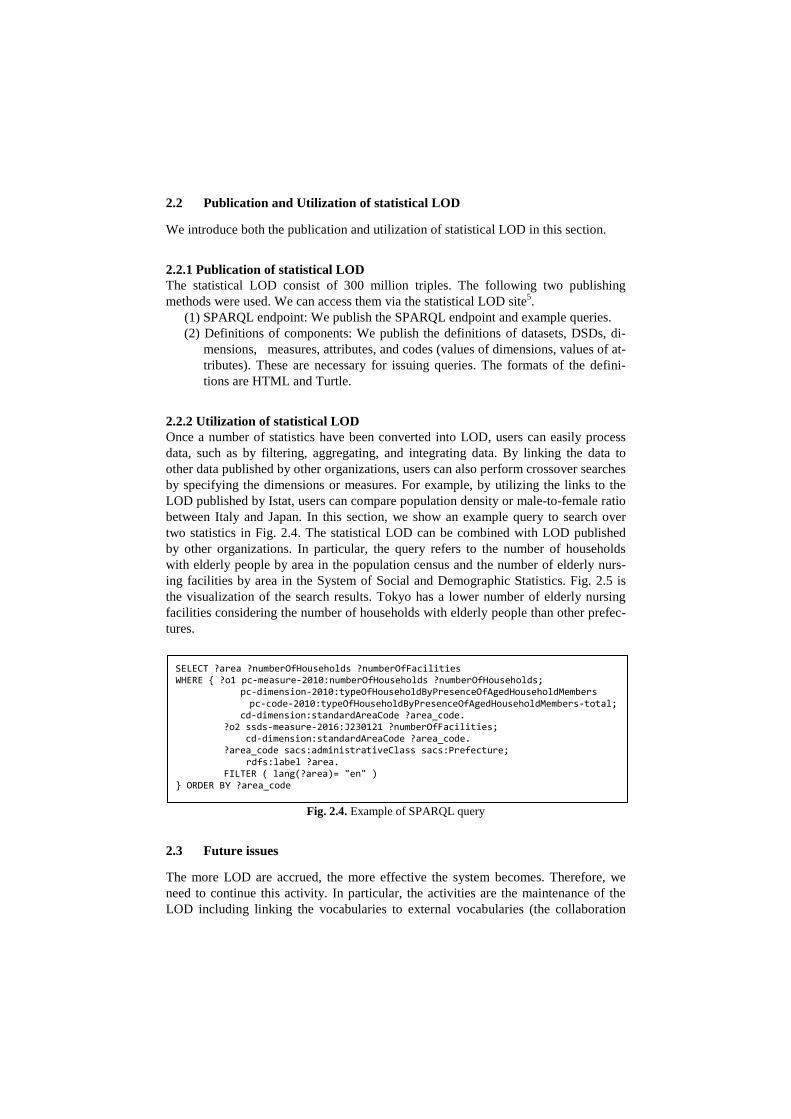
2.2.2 Utilization of statistical LOD Once a number of statistics have been converted into LOD, users can easily process data, such as by filtering, aggregating, and integrating data. By linking the data to other data published by other organizations, users can also perform crossover searches by specifying the dimensions or measures. For example, by utilizing the links to the LOD published by Istat, users can compare population density or male-to-female ratio between Italy and Japan. In this section, we show an example query to search over two statistics in Fig. 2.4. The statistical LOD can be combined with LOD published by other organizations. In particular, the query refers to the number of households with elderly people by area in the population census and the number of elderly nurs-ing facilities by area in the System of Social and Demographic Statistics. Fig. 2.5 is the visualization of the search results. Tokyo has a lower number of elderly nursing facilities considering the number of households with elderly people than other prefec-tures.
\\\\\\\\\\\\\\\\\\\\\\\\\\\\\\\\\\\\\\
Fig. 2.4. Example of SPARQL query
2.3 Future issues
The more LOD are accrued, the more effective the system becomes. Therefore, we need to continue this activity. In particular, the activities are the maintenance of the LOD including linking the vocabularies to external vocabularies (the collaboration
SELECT ?area ?numberOfHouseholds ?numberOfFacilities WHERE { ?o1 pc-measure-2010:numberOfHouseholds ?numberOfHouseholds;
pc-dimension-2010:typeOfHouseholdByPresenceOfAgedHouseholdMembers pc-code-2010:typeOfHouseholdByPresenceOfAgedHouseholdMembers-total;
cd-dimension:standardAreaCode ?area_code. ?o2 ssds-measure-2016:J230121 ?numberOfFacilities; cd-dimension:standardAreaCode ?area_code. ?area_code sacs:administrativeClass sacs:Prefecture; rdfs:label ?area. FILTER ( lang(?area)= "en" )
} ORDER BY ?area_code
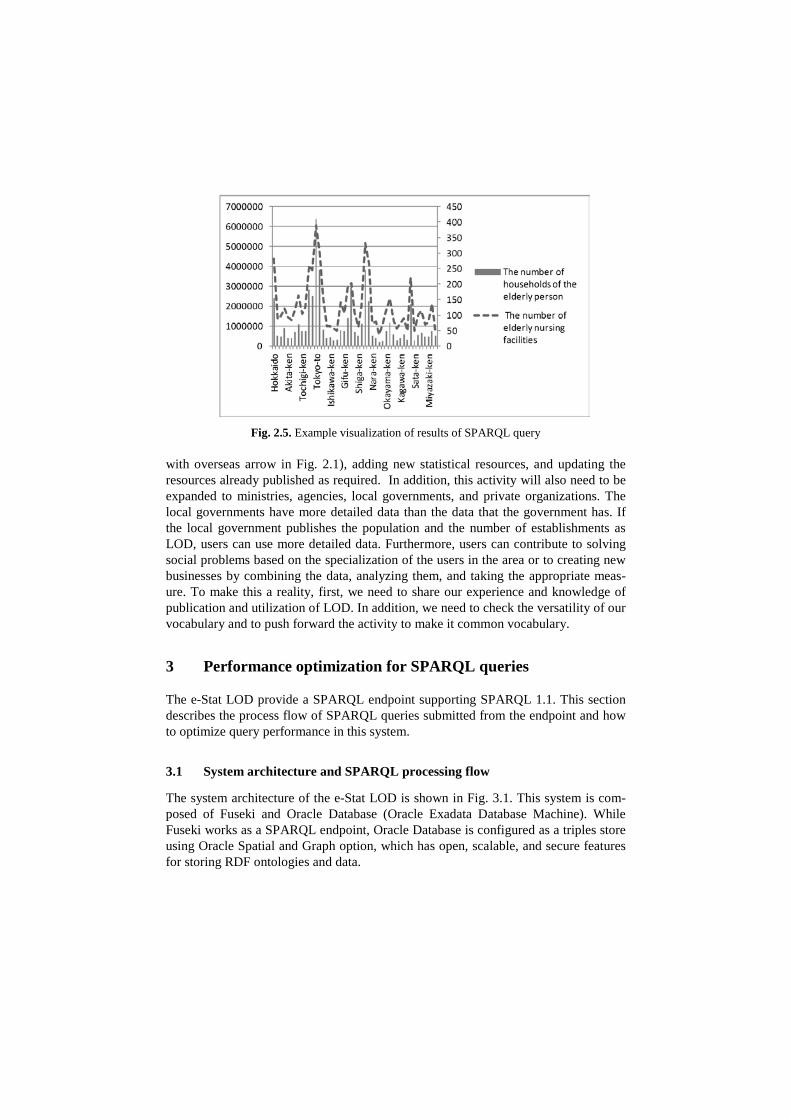
Fig. 2.5. Example visualization of results of SPARQL query
with overseas arrow in Fig. 2.1), adding new statistical resources, and updating the resources already published as required. In addition, this activity will also need to be expanded to ministries, agencies, local governments, and private organizations. The local governments have more detailed data than the data that the government has. If the local government publishes the population and the number of establishments as LOD, users can use more detailed data. Furthermore, users can contribute to solving social problems based on the specialization of the users in the area or to creating new businesses by combining the data, analyzing them, and taking the appropriate meas-ure. To make this a reality, first, we need to share our experience and knowledge of publication and utilization of LOD. In addition, we need to check the versatility of our vocabulary and to push forward the activity to make it common vocabulary.
3 Performance optimization for SPARQL queries
The e-Stat LOD provide a SPARQL endpoint supporting SPARQL 1.1. This section describes the process flow of SPARQL queries submitted from the endpoint and how to optimize query performance in this system.
3.1 System architecture and SPARQL processing flow
The system architecture of the e-Stat LOD is shown in Fig. 3.1. This system is com-posed of Fuseki and Oracle Database (Oracle Exadata Database Machine). While Fuseki works as a SPARQL endpoint, Oracle Database is configured as a triples store using Oracle Spatial and Graph option, which has open, scalable, and secure features for storing RDF ontologies and data.
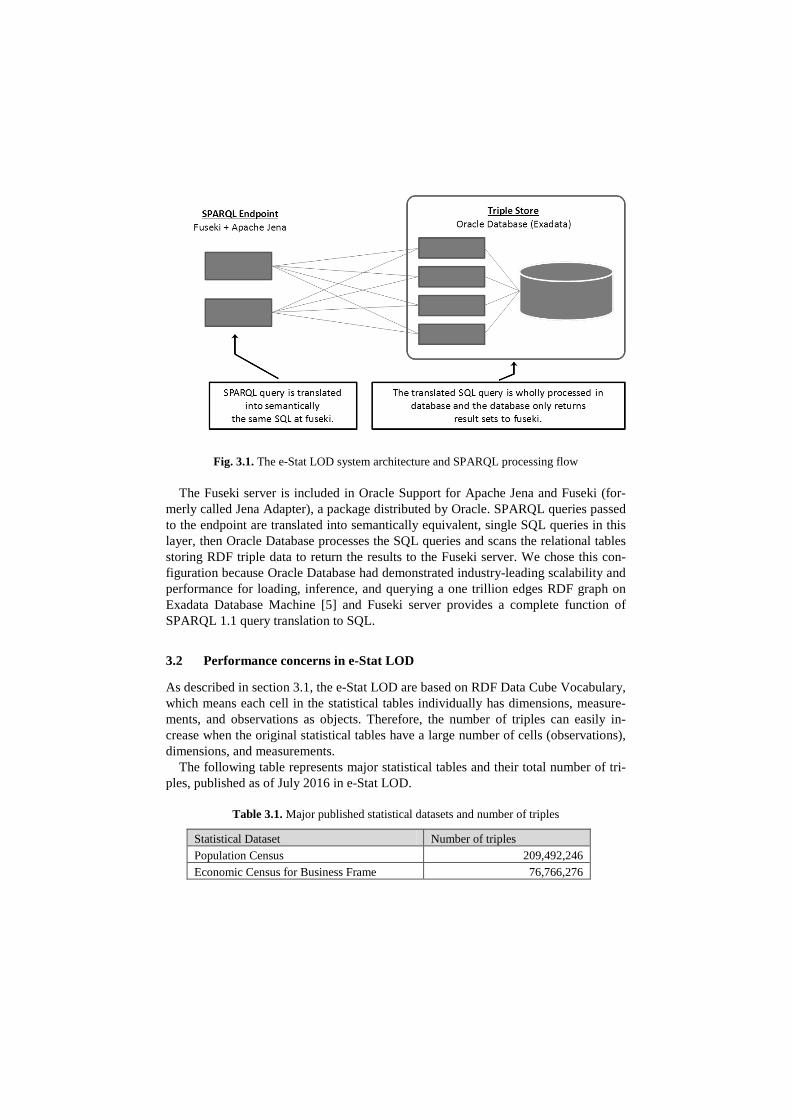
Fig. 3.1. The e-Stat LOD system architecture and SPARQL processing flow
The Fuseki server is included in Oracle Support for Apache Jena and Fuseki (for-merly called Jena Adapter), a package distributed by Oracle. SPARQL queries passed to the endpoint are translated into semantically equivalent, single SQL queries in this layer, then Oracle Database processes the SQL queries and scans the relational tables storing RDF triple data to return the results to the Fuseki server. We chose this con-figuration because Oracle Database had demonstrated industry-leading scalability and performance for loading, inference, and querying a one trillion edges RDF graph on Exadata Database Machine [5] and Fuseki server provides a complete function of SPARQL 1.1 query translation to SQL.
3.2 Performance concerns in e-Stat LOD
As described in section 3.1, the e-Stat LOD are based on RDF Data Cube Vocabulary, which means each cell in the statistical tables individually has dimensions, measure-ments, and observations as objects. Therefore, the number of triples can easily in-crease when the original statistical tables have a large number of cells (observations), dimensions, and measurements.
The following table represents major statistical tables and their total number of tri-ples, published as of July 2016 in e-Stat LOD.
Table 3.1. Major published statistical datasets and number of triples
Statistical Dataset Number of triples Population Census 209,492,246 Economic Census for Business Frame 76,766,276
While the total number of statistical tables published in the e-Stat LOD is expected to grow, an explosive increase in the number of triples could make SPARQL query re-sponse slower.
3.3 Database design to improve SPARQL query performance
We adopted the following three methods to achieve acceptable SPARQL performance even when more than billions of triples are stored.
(i) Storing each statistical dataset triples in different “models” (ii) In-database multi-process parallel processing for a single SPARQL query (iii) Daily automatic performance tuning for SPARQL queries slower than the cri-teria The details for each method are as follows.
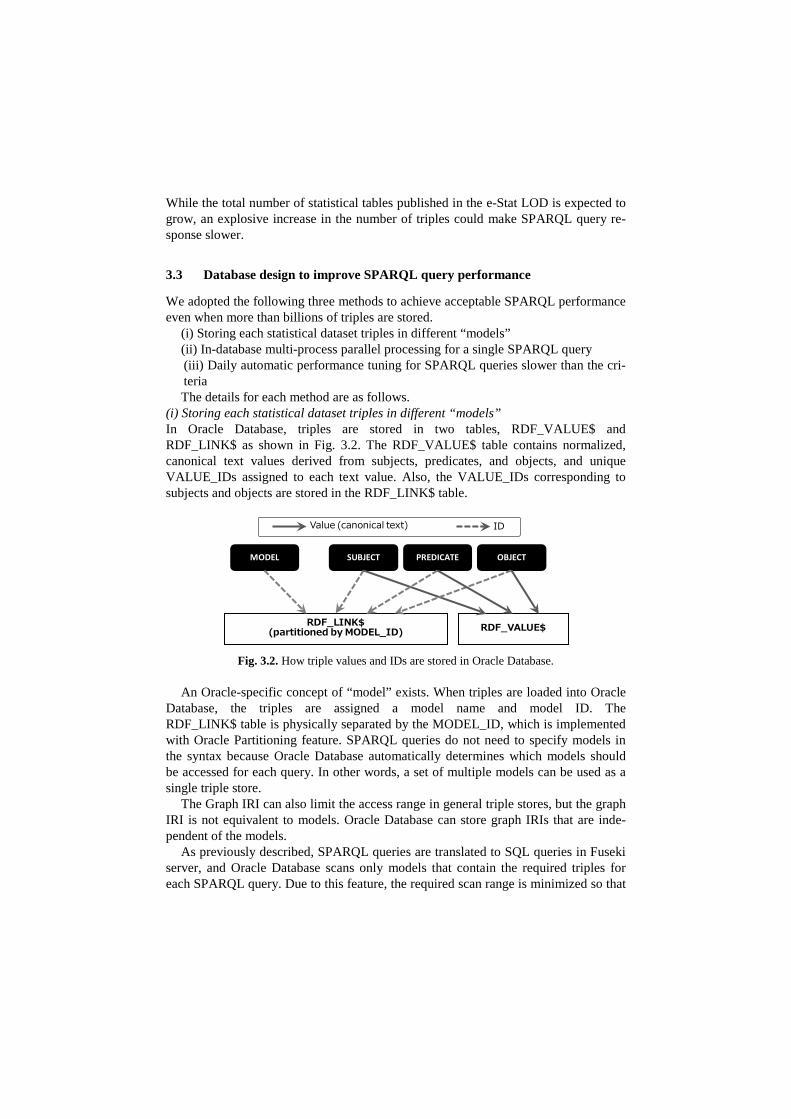
(i) Storing each statistical dataset triples in different “models” In Oracle Database, triples are stored in two tables, RDF_VALUE$ and RDF_LINK$ as shown in Fig. 3.2. The RDF_VALUE$ table contains normalized, canonical text values derived from subjects, predicates, and objects, and unique VALUE_IDs assigned to each text value. Also, the VALUE_IDs corresponding to subjects and objects are stored in the RDF_LINK$ table.
Fig. 3.2. How triple values and IDs are stored in Oracle Database.
An Oracle-specific concept of “model” exists. When triples are loaded into Oracle Database, the triples are assigned a model name and model ID. The RDF_LINK$ table is physically separated by the MODEL_ID, which is implemented with Oracle Partitioning feature. SPARQL queries do not need to specify models in the syntax because Oracle Database automatically determines which models should be accessed for each query. In other words, a set of multiple models can be used as a single triple store.
The Graph IRI can also limit the access range in general triple stores, but the graph IRI is not equivalent to models. Oracle Database can store graph IRIs that are inde-pendent of the models.
As previously described, SPARQL queries are translated to SQL queries in Fuseki server, and Oracle Database scans only models that contain the required triples for each SPARQL query. Due to this feature, the required scan range is minimized so that
RDF_LINK$(partitioned by MODEL_ID) RDF_VALUE$
MODEL SUBJECT PREDICATE OBJECT
Value (canonical text) ID
SPARQL response hardly slows even when billions of triples are stored. In addition, semantic indexes are also configured in each model.
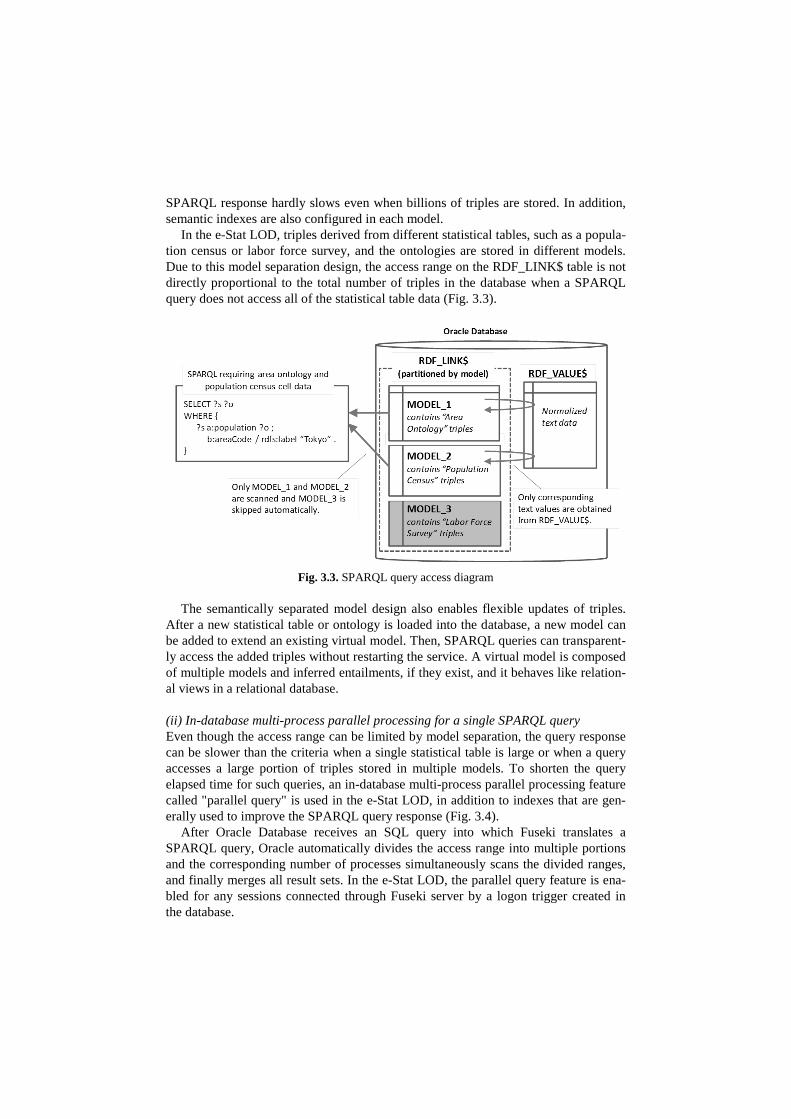
In the e-Stat LOD, triples derived from different statistical tables, such as a popula-tion census or labor force survey, and the ontologies are stored in different models. Due to this model separation design, the access range on the RDF_LINK$ table is not directly proportional to the total number of triples in the database when a SPARQL query does not access all of the statistical table data (Fig. 3.3).
Fig. 3.3. SPARQL query access diagram
The semantically separated model design also enables flexible updates of triples. After a new statistical table or ontology is loaded into the database, a new model can be added to extend an existing virtual model. Then, SPARQL queries can transparent-ly access the added triples without restarting the service. A virtual model is composed of multiple models and inferred entailments, if they exist, and it behaves like relation-al views in a relational database.
(ii) In-database multi-process parallel processing for a single SPARQL query Even though the access range can be limited by model separation, the query response can be slower than the criteria when a single statistical table is large or when a query accesses a large portion of triples stored in multiple models. To shorten the query elapsed time for such queries, an in-database multi-process parallel processing feature called "parallel query" is used in the e-Stat LOD, in addition to indexes that are gen-erally used to improve the SPARQL query response (Fig. 3.4).
After Oracle Database receives an SQL query into which Fuseki translates a SPARQL query, Oracle automatically divides the access range into multiple portions and the corresponding number of processes simultaneously scans the divided ranges, and finally merges all result sets. In the e-Stat LOD, the parallel query feature is ena-bled for any sessions connected through Fuseki server by a logon trigger created in the database.
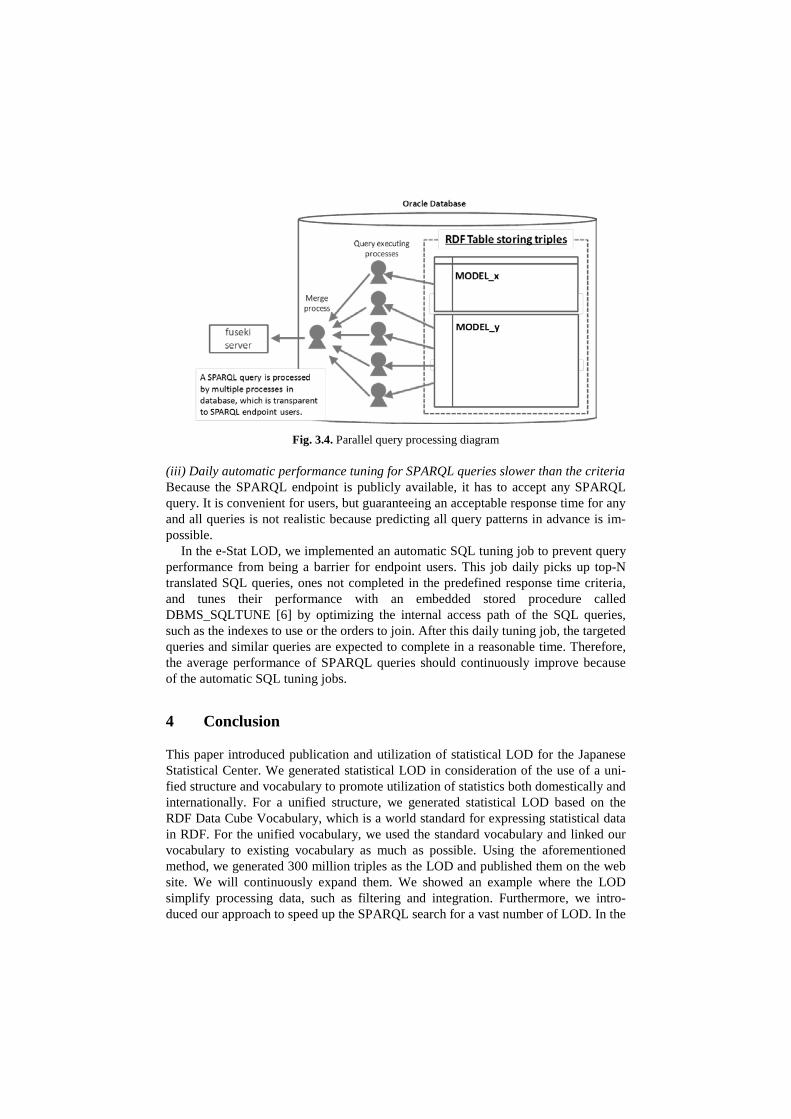
Fig. 3.4. Parallel query processing diagram
(iii) Daily automatic performance tuning for SPARQL queries slower than the criteria Because the SPARQL endpoint is publicly available, it has to accept any SPARQL query. It is convenient for users, but guaranteeing an acceptable response time for any and all queries is not realistic because predicting all query patterns in advance is im-possible.
In the e-Stat LOD, we implemented an automatic SQL tuning job to prevent query performance from being a barrier for endpoint users. This job daily picks up top-N translated SQL queries, ones not completed in the predefined response time criteria, and tunes their performance with an embedded stored procedure called DBMS_SQLTUNE [6] by optimizing the internal access path of the SQL queries, such as the indexes to use or the orders to join. After this daily tuning job, the targeted queries and similar queries are expected to complete in a reasonable time. Therefore, the average performance of SPARQL queries should continuously improve because of the automatic SQL tuning jobs.
4 Conclusion
This paper introduced publication and utilization of statistical LOD for the Japanese Statistical Center. We generated statistical LOD in consideration of the use of a uni-fied structure and vocabulary to promote utilization of statistics both domestically and internationally. For a unified structure, we generated statistical LOD based on the RDF Data Cube Vocabulary, which is a world standard for expressing statistical data in RDF. For the unified vocabulary, we used the standard vocabulary and linked our vocabulary to existing vocabulary as much as possible. Using the aforementioned method, we generated 300 million triples as the LOD and published them on the web site. We will continuously expand them. We showed an example where the LOD simplify processing data, such as filtering and integration. Furthermore, we intro-duced our approach to speed up the SPARQL search for a vast number of LOD. In the
future, the publication of LOD needs to be expanded to ministries, agencies, local governments, private companies, and other organizations. It is necessary for us to spread the defined vocabulary so that it is used in others.
References
1. Cyganiak, R., Reynolds, D. (eds.): The RDF Data Cube Vocabulary. W3C Recommenda-tion 16 January 2014, http://www.w3.org/TR/vocab-data-cube/, World Wide Web Consor-tium, (accessed 2016-07-15)
2. Albert Meroño-Peñuela. : LSD Dimensions: Use and Reuse of Linked Statistical Data In: Proceedings of the 19th International Conference on Knowledge Engineering and Knowledge Management, EKAW 2014. LNCS 8982, Springer. Linköping, Sweden (2014)
3. Aracri, R., Francisci, D., A., Pagano, A., Scannapieco, M., Tosco, L., Valentino, L.,: Pub-lishing the 15th Italian Population and Housing Census as Linked Open Data. In: Second International Workshop on Semantic Statistics, https://semstats2014.files.wordpress.com/ 2014/10/semstats2014_submission_7.pdf (2014)
4. Miles, A., Bechhofer, S.: SKOS Simple Knowledge Organization System Namespace Document - HTML Variant. W3C Recommendation 18 August 2009, https://www.w3.org/ 2009/08/skos-reference/skos.html, World Wide Web Consortium, (accessed 2016-07-15)
5. Oracle: Oracle Spatial and Graph: Benchmarking a Trillion Edges RDF Graph, http://download.oracle.com/otndocs/tech/semantic_web/pdf/OracleSpatialGraph_RDFgraph_1_trillion_Benchmark.pdf, (accessed 2016-07-15)
6. Oracle: Database PL/SQL Packages and Types Reference - DBMS_SQLTUNE, https://docs.oracle.com/database/121/ARPLS/d_sqltun.htm#ARPLS220, (accessed 2016-07-15)
Appendix
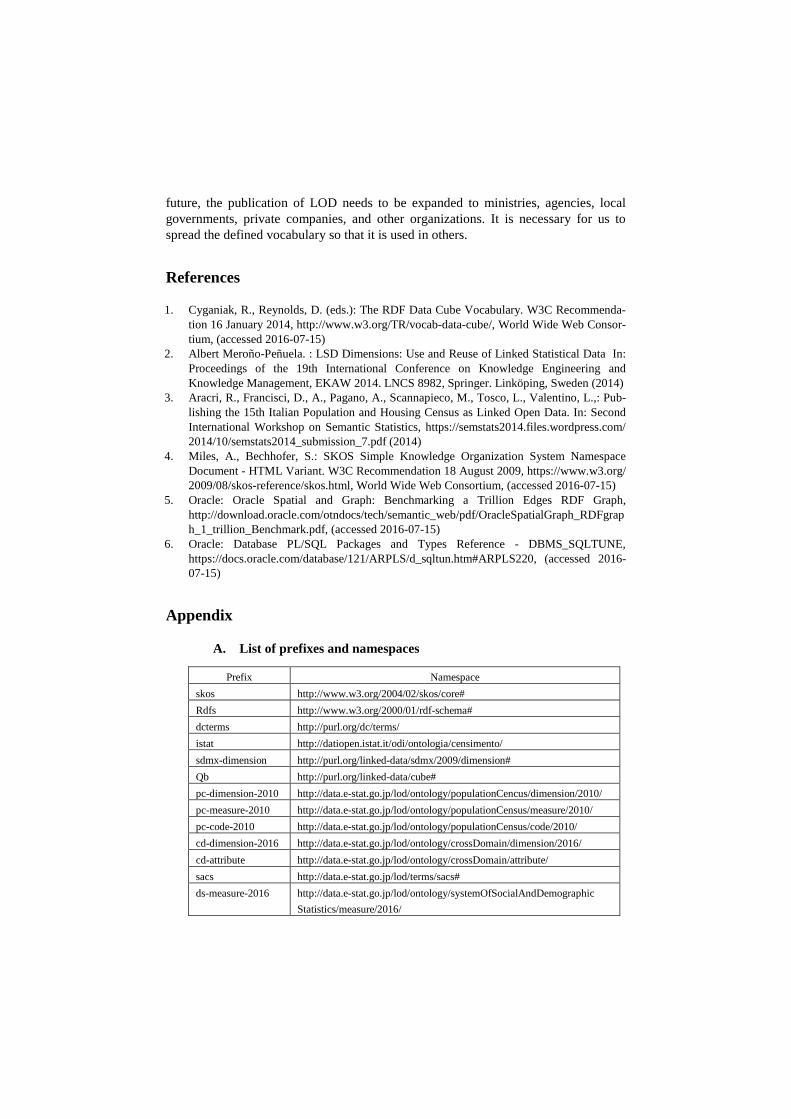
A. List of prefixes and namespaces
Prefix Namespace skos http://www.w3.org/2004/02/skos/core# Rdfs http://www.w3.org/2000/01/rdf-schema# dcterms http://purl.org/dc/terms/ istat http://datiopen.istat.it/odi/ontologia/censimento/ sdmx-dimension http://purl.org/linked-data/sdmx/2009/dimension# Qb http://purl.org/linked-data/cube# pc-dimension-2010 http://data.e-stat.go.jp/lod/ontology/populationCencus/dimension/2010/ pc-measure-2010 http://data.e-stat.go.jp/lod/ontology/populationCensus/measure/2010/ pc-code-2010 http://data.e-stat.go.jp/lod/ontology/populationCensus/code/2010/ cd-dimension-2016 http://data.e-stat.go.jp/lod/ontology/crossDomain/dimension/2016/ cd-attribute http://data.e-stat.go.jp/lod/ontology/crossDomain/attribute/ sacs http://data.e-stat.go.jp/lod/terms/sacs# ds-measure-2016 http://data.e-stat.go.jp/lod/ontology/systemOfSocialAndDemographic
Statistics/measure/2016/