Embed Size (px)
Citation preview

1
Public Utilities: Power & RailwaysCutting the Gordian Knot
Module 11
Contemporary Themes in India’s
Economic Development and the Economic Survey
Arvind Subramanian
Chief Economic Adviser
16-06-2017
MINISTRY OF FINANCE
GOVERNMENT OF INDIA

2
Overview
• Public Utilities
• Power
• Railways

3
Public Utilities- Natural Monopolies
• E.g. – Electricity, Water, Railways, Roadways, Telecom, Internet, Data
etc.
• Require Large Capital Investments
• High fixed costs, Economies of Scale & Long gestation period
• Network effects- Becomes more useful as more people use it (Facebook,
Messaging Apps)
• Hence, tend to be natural monopolies
• Dilemma
• If Public Sector- Inefficiency
• If Private Sector- Monopoly Profits and High Prices

4
Public Utilities-From government ownership to Regulation• Public ownership resulted in efficiency decline (Industrial Policy Resolution,1956)
• Thatcher, Pinochet, Reagan revolution - Public Sector inefficiency + technological
development changed thinking
• Solution to Dilemma: Less Ownership with effective regulation
• Sectors unbundled and opened for private sector but under the aegis of a regulator
• Regulator has to balance the social welfare maximization vs. the profit maximization for the
operator of the business
• Social Welfare involves fairness and equity as well
• Information Asymmetry – Gold Plating & Moral Hazard- Too big to fail
• Standards of Performance

5
2012 2016
https://www.nasa.gov/feature/goddard/2017/new-night-lights-maps-open-up-possible-real-time-applications

6
Achievements
• 76577 MW (31%) -Generation Capacity Addition in last 3 years
• Transmission lines length increase from 2,91,336 circuit KM (ckm)
2014 to 3,66,634 ckm in 2017
• Energy Shortage brought down to 0.7 % from 4.2 % in 2014
• UDAY scheme launched for financial turnaround of Discoms
• 13,123 villages electrified out of 18,441 unelectrified ones

7
Section 1Power

8
Overview
• Interesting facts
• Power Sector Structure
• Contracts Structure
• Challenges
• UDAY

9
Some Interesting Facts• India is the world's third largest electricity producer (1368 BU*)– After China
(5682 BU) and USA (4324 BU)
• India is also the fourth largest consumer of electricity – 1135 BU
• Per capita electricity consumption is low despite cheap electricity tariffs- 1010
kWh vs 12973 kWh for USA
• India accounts for over 300 million of the world’s total 1.4 billion people with
no access to electricity
*BU = Billion Units 1 Unit = 1 kWh
Sources: Central Electricity Authority (CEA), USA Energy Information Administration (EIA)

10
Electricity Generation Capacity addition at a CAGR of 8.7% since 1947
Source: CEA Website
0
50
100
150
200
250
300
350
0
200
400
600
800
1000
12001
947
1950
1956
1961
1966
19
69
1974
1979
1980
1985
1990
1992
19
97
2002
2007
2012
2013
2014
2015
20
16
Insta
lled C
ap
acity (
‘000 M
W)
Per
Capita C
onsum
ption (
kW
h)
Installed Capacity (MW) Per Capita Consumption (kWh)

11
Electricity Access: India still far behind its BRICS peers
0
10
20
30
40
50
60
70
80
90
100T
ZA
KE
N
MM
R
NG
A
BG
D
IND
SA
S
NP
L
ZA
F
LK
A
IDN
PA
K
ME
X
IRN
BR
A
EG
Y
BT
N
CH
N
RU
S
Perc
ent
of P
opula
tion
Source: WDI database
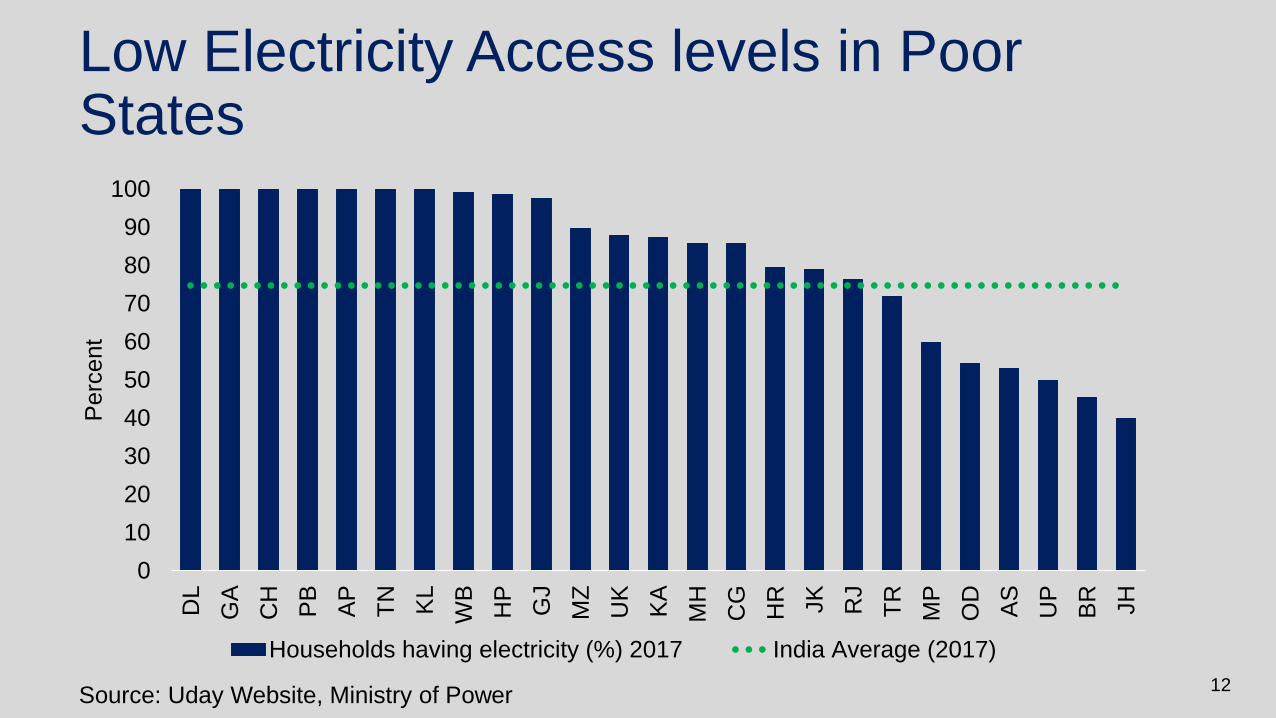
12
Low Electricity Access levels in Poor States
0
10
20
30
40
50
60
70
80
90
100D
L
GA
CH
PB
AP
TN
KL
WB
HP
GJ
MZ
UK
KA
MH
CG
HR JK
RJ
TR
MP
OD
AS
UP
BR
JH
Perc
ent
Households having electricity (%) 2017 India Average (2017)
Source: Uday Website, Ministry of Power

13
T&D* Losses-Far away from BRICS peers
0
5
10
15
20
25
30
35
40
45
CHN ZAF IDN RUS EGY BGD LKA BRA NGA PAK KEN TZA IND MMR NPL
Perc
ent
2000 2014
* Transmission and Distribution Losses. They are a measure of the technical efficiency and losses due to
electricity theft

14
AT&C* losses for 2014-15- Still very high in poorer states
0
10
20
30
40
50
60
AP DL TL HP GJ PB KL KA UK MH TN AS CG RJ MP HR UP WB OR BR JH JK
Percent
• Aggregate Technical and Commercial Losses. They include technical losses, theft and commercial losses due
to non-payment of electricity bills by consumers
• Source: Ministry of Power

15
Power Sector –Sources- Still dominated by Thermal But future in Renewables
Fuel MW % of Total
Total Thermal 220,570 67%
Coal 194,403 59%
Gas 25,329 8%
Oil 838 0%
Hydro (Renewable) 44,594 14%
Nuclear 6,780 2%
Renewable Energy Sources 57,260 17%
Total 329,205
Total Installed Capacity as on 30th Apr 2017
Source: CEA Website
Sector MW % of Total
State Sector 81,167 24.70%
Central Sector 1,04,447 31.70%
Private Sector 143,590 43.60%
Total 329,205

16
Transmission lines 230-500 kV
r
Generator
Transmission subs
66-115 kV lines
Distribution subs
Distribution lines
Electricity Supply Segments: Generation, Transmission, Distribution

17
G
T
D/R
Consumers
No Competition
• No Choice
• Government makes decisions
G
D/R
Consumers
G G G EG
T/MO
Wholesale Competition
• Distribution/retail companies have choice
G
Consumers
G G G EG
D/R
T/MO
Retail Competition
• Consumers have choice
Evolving Industry Structure- Last Mile Still Left!
MO = Market Operator
EG = Embedded Generator/Captive
= Who has choice
Before Electricity Act 2003 After Electricity Act 2003 Future
Natural Monopolies
D = Distribution Network Owner
T = Transmission Network Owner
R = Retailer
G = Generator

18
Institutional Structure- Both Centre and State involved
in governance
State Gencos STUs
Generation
CPSU (NTPC) CTU
(POWERGRID)
IPPs(Tata)
Private
Licensees
(Delhi &
Mumbai)
Agricultural
Domestic
Commercial
Industrial
Others
Captive Plants
(Essar)Captive
Transmission Distribution Consumption
Power Trading
Companies and Power
Exchanges
Open Access
State DISCOMS

19
Contracts Structure- Dominated by long term Power Purchase Agreements (PPAs)
• Specific Seller and Buyer
• Pricing based on cost of asset and socialized over all beneficiaries
Long Term –12 - 25 years
• Specific Seller and Buyer set
• Pricing arrived at as a percentage of long term transmission pricing
• Earnings used to reduce cost of asset for long term consumers
Short Term –Up to 3 months
• Access for trades through Power Exchanges - Collective transactions
• Charges regulated by the Commission
Day Ahead Market– For the next day
only
Contract Type Share (in percent)
Long Term Contracts 91
Short Term Contracts 5
Day Ahead Market 4
Source: CEA website

20
Challenges

21
1. Complex tariff schedules; One price for petroleum but 100 prices for power
Consumer Category
Energy
Charge
(Rs /Unit)
Consumer Category
Energy
Charge
(Rs /Unit)
Consumer Category
Energy
Charge
(Rs /Unit)
LT-I:DOMESTIC (Telescopic) LT-V:AGRICULTURE ** SEASONAL INDUSTRIES (off season Tariff)
LT I(A):Upto 50 Units/Month 1.45 LT-V(A):AGRICULTURE WITH DSM
MEASURES
11 kV 7.25
LT I(B):>50 and upto 100 Units/Month Corporate Farmers & IT Assesses 2.50 33 kV 6.59
First 50 Units 1.45 Wet Land Farmers (Holdings >2.5 acre) 0.50 132 kV & Above 6.33
51-100 Units 2.60 Dry Land Farmers (Connections > 3 nos.) 0.50 TIME OF DAY TARIFFS (6 PM to 10 PM)
LT I(C):>100 and upto 200 Units/Month Wet Land Farmers (Holdings ≤ 2.5 acre) 0.00 11 kV 7.07
First 50 2.60 Dry Land Farmers (Connections ≤ 3 nos.) 0.00 33 kV 6.62
51-100 2.60 LT-V(B):AGRICULTURE WITHOUT DSM
MEASURES
132 kV & Above 6.20
101-150 3.60 Corporate Farmers & IT Assesses 3.50 HT-I(B):FERRO ALLOY UNITS
151-200 3.60 Wet Land Farmers (Holdings >2.5 acre) 1.00 11 kV 5.68
LT I(D):Above 20 0 Units/Month Dry Land Farmers (Connections > 3 nos.) 1.00 33 kV 5.23
First 50 2.60 Wet Land Farmers (Holdings ≤ 2.5 acre) 0.50 132 kV & Above 4.81
51-100 3.25 Dry Land Farmers (Connections ≤ 3 nos.) 0.50 HT-II:OTHERS
101-150 4.88 LT-V(C):OTHERS 11 kV 7.25
151-200 5.63 Salt farming units upto 15HP 3.70 33 kV 6.59
201-250 6.70 Rural Horticulture Nurseries upto 15HP 3.70 132 kV & Above 6.33
251-300 7.22 LT-VI:STREET LIGHTING AND PWS TIME OF DAY TARIFFS (6 PM to 10 PM)
301-400 7.75 LT-VI(A):STREET LIGHTING 11 kV 8.30
401-500 8.27 Panchayats 5.64 33 kV 7.64
Above 500 8.80 Municipalities 6.16 132 kV & Above 7.38
LT-II:NON DOMESTIC/COMMERCIAL Municipal Corporations 6.69 HT-III:AIRPORTS,BUS STATIONS AND RAILWAY
STATIONSLT II(A):Upto 50 Units/Month 5.40 LT-VI(B):PWS SCHEMES 11 kV 6.91
LT II(B):Above 50 Units/Month Panchayats 4.59 33 kV 6.31
First 50 6.63 Municipalities 5.64 132 kV & Above 6.01
51-100 7.38 Municipal Corporations 6.16 TIME OF DAY TARIFFS (6 PM to 10 PM)
101-300 8.54 LT-VI(C):NTR Sujala Padhakam 4.00 11 kV 7.96
301-500 9.06 LT-VII:GENERAL 33 kV 7.36
Above 500 9.59 LT-VII(A):GENERAL PURPOSE 6.86 132 kV & Above 7.06
LT II(C):ADVERTISEMENT HOARDINGS 11.58 LT-VII(B):RELIGIOUS PLACES (CL ≤ 2 KW) 4.70 HT-IV: Govt., LIFT IRRIGATION, AGRICULTURE
AND CPWSLT-III:INDUSTRY LT-VIII: TEMPORARY SUPPLY 9.90 Govt. Lift Irrigation & Agriculture 5.64
Industry (General) 6.38 HT-I:INDUSTRY Composite Water Supply Schemes 4.61
Seasonal Industries (off season) 7.09 HT-I(A): INDUSTRY GENERAL HT-V:RAILWAY TRACTION 6.68
Pisciculture/Prawn culture 4.63 11 kV 6.02 HT-VI:TOWNSHIPS AND RESIDENTIAL COLONIES 5.96
Sugarcane crushing 4.63 33 kV 5.57 HT-VII:GREEN POWER 11.32
Poultry farms 5.63 132 kV & Above 5.15 HT-VIII:TEMPORARY
Mushroom & Rabbit Farms 5.63 INDUSTRIAL COLONIES RURAL ELECTRIC CO-OPERATIVES
Floriculture in Green House 5.63 11 kV 5.96 Kuppam 0.24
LT-IV:COTTAGE INDUSTRIES & OTHERS 33 kV 5.96 Anakapally 1.38
a) Cottage Industries upto 10 HP 3.75 132 kV & Above 5.96 Chipurupally 0.22
b) Agro Based Activity upto 10 HP 3.75
Source: Andhra Pradesh Tariff order

22
2. Distribution Companies Losses- Rs 65000 crore in 2014-15
-2000
0
2000
4000
6000
8000
10000
12000
14000
16000
18000
UP
RJ
TN
MP
JK
TL
AP
HR
KL
CG
PB
BR
OD
AS
UK
HP
JH
KA
WB
GJ
DL
MH
Rs.
Cro
re

23
Tariffs per unit: 2013-14Subsidies
3. Cross-Subsidies hurting Make in India
0
5
10
15
20
25
30
35
40
45
5020
12
-13
2013-1
4
2014-1
5
Rs
(thousands o
f cro
res)
0
1
2
3
4
5
6
7
8
Ag
ricu
ltu
re
Do
mestic
Indu
str
ial
Railw
ays
Com
merc
ial
Rupees
Sources: PFC Status of Power Utilities Report & Planning Commission State Discoms Report

24
3. Expensive and Low quality electricity supply to Industry
AustraliaAustria
Bangladesh
Belgium
Chile
Czech Republic
Denmark
France
Hungary
India
Indonesia
ItalyJapan
Luxembourg
Mexico
PortugalSlovenia
South Africa
Switzerland
Turkey
USA
Australia
Austria
Bangladesh
Belgium
Chile
Czech Republic
Denmark
France
Hungary
India
Indonesia
ItalyJapan
Luxembourg
Mexico
Portugal Slovenia
South Africa
Switzerland
Turkey
USA
(300) (200) (100) 0 100 200 300 400
Pe
r C
ap
ita
GD
P
PPP Exchange RatesMarket Exchange Rates
More Expensive More Expensive
Colours represent the quality of electricity supply (on a scale of 1 to 7)
Source: World Economic Forum-Global Competitiveness Report 2015-16
(score >6)
(4< score <6)
(score <4)

25
3. Cross-Subsidies and Poor quality of electricity supply affect Make in India
APBR
CH
DLGJ
HP
HRJH
JK
KA
KL
MH
MP
OR
PBRJ TN
UP
UT
WB
IND
60
70
80
90
100
110
120
130
Industr
ial Tariff (
US
D/M
Wh)
Per Capita GSDP
(response <10%)
(10%< response <20%)
(response >20%)
Colours highlight the share of firms (in %) identifying electricity as a major constraint in their state
Source: World Bank’s Enterprise Survey of Industries (2013-14). Industrial tariffs are from the Planning
Commission/Niti Aayog

26
0
0.5
1
1.5
2
2.5
3
3.5
TN AP WB HR MP DL GJ TL MH OR KA PB CH BR UT JH UP HP RJ KL JK
Rs/k
Wh
4. India still not one market for power: States impose exorbitant taxes on purchase from other states
Cross Subsidy Surcharge imposed by states for purchasing
electricity from power exchange, 2015-16

27
5. New Challenge: Declining Renewable Energy Prices But threat to Thermal Power
0
2
4
6
8
10
12
14
16
18
20
201
1
201
1
2012
201
2
201
2
201
3
201
3
201
3
201
4
201
4
201
4
2015
201
5
201
5
201
5
201
7
201
7
Rs/k
Wh
State Rate (Rs /kWh)
Andhra
Pradesh
4.84
Gujarat 4.19
Karnataka 4.5
Madhya
Pradesh
4.78
Maharashtra 3.82-5.56
Rajasthan 5.76-6.04
Tamil Nadu 4.16
Feb 2017 Bid 3.46
SOLAR WIND
Sources: MNRE

28
Perils of Long Term PPAs-Problem of Incomplete Contracts, Federalism, Power,
Banking, Coal, Railways and Institutional Capacity combine: Tata Power Mundra UMPP
case study
Procurer and Generator sign a 25
year long term PPA after
competitive bidding
Generator builds the plant and
starts supplying electricityHit by external
shock: Increase in
coal prices
Generator approaches Regulator
& Appellate Tribunal(APTEL) for
relief
Regulator & APTEL provide relief
to the generator and allow for
compensatory tariff for coal price
increase.
Procurer appeals against the
relief in Supreme Court
Supreme Court overturns
Regulator & APTEL
compensatory tariff relief stating
that there is no such provision

29
5. New challenge: Power Generators’ Viability Threatened
Given large cost over-runs, break even tariff is well above current merchant rates*
*: Tariffs are in Rs./kWh and on shown in RHS. Costs are in Rs. Million.
0
1
2
3
4
5
6
7
8
9
0
20
40
60
80
100
120
140
160G
VK
- A
lakna
nda
Unlis
ted C
om
p
GM
R -
Raik
hed
a
GV
K -
Go
ind
wal S
ah
ib
Ja
ype
e -
Nig
rie
Lan
co
- A
ma
rkan
tak
Lan
co
- B
aba
ndh
Lan
co
- V
ida
rbh
a
Ja
ype
e -
Ba
ra I
Unlis
ted C
om
p
Relia
nce -
Sasa
n
Re
lian
ce -
Butib
ori
JS
W -
Raj W
est
GM
R -
Ka
mala
ng
a -
I
Original Cost per MW (Rs mn) Cost overrun per MW (Rs mn)
Required Tariff (Rs/KwH) (RHS) Current Merchant tariff (Rs/KwH) (RHS)
Sources: Credit Suisse Report

30
6. Excess Demand and Excess Supply at the same time
0
10
20
30
40
50
60
70
80
90
100
DL
GA
CH
PB
AP
TN
KL
WB
HP
GJ
MZ
UK
KA
MH
CG
HR JK
RJ
TR
MP
OD
AS
UP
BR
JH
Pe
rce
nt
Households having electricity (%) 2017 India Average (2017)
0
10
20
30
40
50
60
70
80
20
09
-10
20
10
-11
20
11
-12
20
12
-13
20
13
-14
20
14
-15
20
15
-16
20
16
-17
Pe
rce
nt
Plant Load Factors

31
• Financial Assistance to States…
• States will take over 75% of the DISCOM debt as on Sept 30, 2015
• 50% in FY 2015-16 and 25% in FY 2016-17
• But conditional on Reforms by Discoms
• Reduce AT&C losses to 15 % by 2019
• Eliminate financial losses by 2019
• Feeder and Distribution Transformer metering by 2017
• Smart metering for Consumers
UDAY-Government Response

32

33
Overview
• History
• Interesting facts
• Jaitley-Prabhu Dilemma
• Subsidies
• Costs
• Way Forward

34
Indian Railways network- 1860 to 1930 to Present
Source: Dave Donaldson, 2010, “Railroads of the Raj: Estimating the Impact of Transportation Infrastructure”

35
Social Engineering by Railways: The Freight Equalization Scheme
• Subsidized long-distance transport of key inputs (iron, steel, fertilizers, cement, and petroleum) to achieve geographical spread of industrialization
• States closer to natural resources (Eastern states) experienced slower growth of manufacturing than distant states (Punjab-- distant from markets and inputs--even had a steel plant!)
(Firth and Liu (2017), forthcoming)

36
Indian Railways Today: Facts
More than 13000 passenger trains and 9000 goods trains run
daily
4th largest rail network in the world (after US,
China and Russia).
3rd largest under single management.
Carried 8.1 billion passengers and 11.1
billion tones of freight in 2015-16.
Employee count- 14 lakh. 8th biggest
employer in the world and largest in India.

37
The Jaitley-Prabhu Dilemma: Public Sector behemoth squeezed on both its core business by private sector competition
44
66
51
65
44
33
0 20 40 60 80
Australia
Canada
China
Russia
US
India*
Modal share of railways in domestic freight (%)
Competition from Air-Travel:
New Delhi Kolkata AC2tier Fare in
Rajdhani: ~Rs. 3000 per person.
New Delhi Kolkata Economy Class
Air-Fare : Rs. 3500 per person.

38
Complex Bureaucratic Structure Total 10 Grade A
Services

39
Chronic Under investment in Railways
0
2
4
6
8
10
12
14
16
18
Up to 5thPlan
6th Plan 7th Plan 8th Plan 9th Plan 10th Plan11th Plan12th Plan
Pe
rce
nt o
f To
tal P
lan
Resource Allocation in Transport Sector and Railways
Transport sector as percentage of total plan Railways as percentage of total plan
Share of IR in total
plan outlay only 5.5
per cent vis-à-vis
about 11 per cent
for the other
transport sectors
• Share of IR in overall development expenditure low, at below 2 percent over the past decade.

40
Low Investment leading to lack of Capacity Addition
90
110
130
150
170
190
210
230
250
1991
1993
1995
1997
1999
2001
2003
2005
2007
2009
2011
2013
2015
roadindex railindex
‘Railindex’ is an index of running track kilometers over the
period 1991 to 2012 with base 1991. ‘Roadindex’ is an
index of length of roads in kilometers inclusive of national
& state highways, urban & rural roads.
55
65
75
85
95
105
115
125
1990 1995 2000 2005 2010 2012 2013 2014 2015
China
India
Addition to capacity measured by addition of RKM in
000’s.

41
Consequence: High CongestionOn HDN routes over 65% of sections operating at > 100% capacity

42
Shouldering the Social Responsibility: Cross subsidy from freight to passengers
50
100
150
200
250
300
350
400
450
500
19
93
-94
19
94
-95
19
95
-96
19
96
-97
19
97
-98
19
98
-99
19
99
-00
20
00
-01
20
01
-02
20
02
-03
2003-0
4
20
04
-05
20
05
-06
20
06
-07
20
07
-08
20
08
-09
20
09
-10
20
10
-11
20
11
-12
20
12
-13
20
13
-14
20
14
-15
20
15
-16
Ind
ex
Consumer Prices and Passenger Rates
Passenger Rate Index CPI(IW)
50
100
150
200
250
300
350
400
450
500
19
93
-94
1994-9
5
19
95
-96
19
96
-97
19
97
-98
19
98
-99
19
99
-00
20
00
-01
20
01
-02
2002-0
3
20
03
-04
20
04
-05
20
05
-06
20
06
-07
20
07
-08
20
08
-09
20
09
-10
20
10
-11
20
11
-12
20
12
-13
20
13
-14
20
14
-15
20
15
-16
Ind
ex
Wholesale Prices and Freight Rates
Freight Rate Index WPI
The price indices and those of passenger and freight rates are constructed with 1993-94 as
base.

43
Subsidies (2014-15)
Category Subsidies
(in crore)
All AC Categories 1,115
Sleeper Class Category
(mail and executive class)9,002

44
Costs of Under-Provided Railways Services
• Large opportunity cost as railways has strong linkages. The railways multiplier effect is around 5 or more: a Re. 1 increase in railways investment would increase economy-wide output by about 5 rupees.
• Environmental Damage :
• Rail transport emits 17 gram CO2 equivalent per PKM as compared to 84 gram per PKM in case of road transport.
• Rail transport emits 28 gram CO2 equivalent per NTKM as compared to 64 gram per NTKM in case of road transport. (Source: NTDPC Report 2013).
45
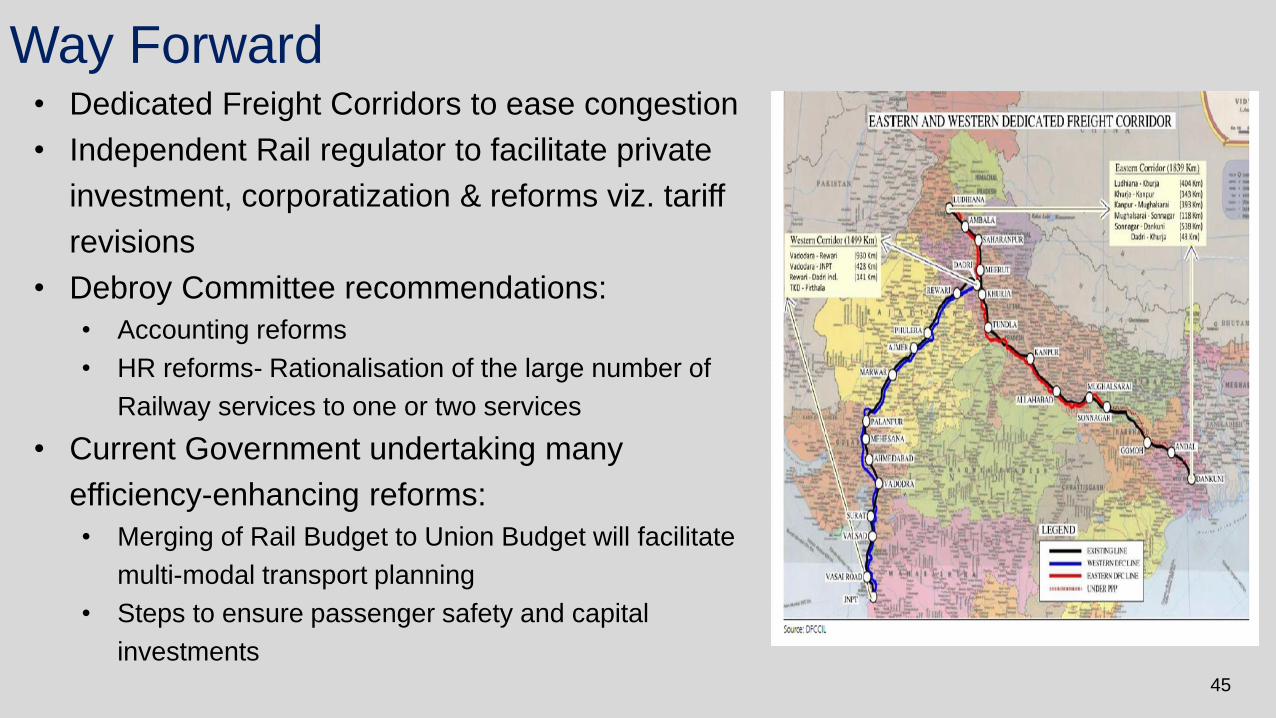
Way Forward• Dedicated Freight Corridors to ease congestion
• Independent Rail regulator to facilitate private
investment, corporatization & reforms viz. tariff
revisions
• Debroy Committee recommendations:
• Accounting reforms
• HR reforms- Rationalisation of the large number of
Railway services to one or two services
• Current Government undertaking many
efficiency-enhancing reforms:
• Merging of Rail Budget to Union Budget will facilitate
multi-modal transport planning
• Steps to ensure passenger safety and capital
investments

46
Recommended Material
• Economic Survey 2015-16, Chapter 11, Powering One India
• Katiyabaaz/Powerless (2013) – Movie on Electricity Supply Situation
in Kanpur City of Uttar Pradesh
• Economic survey 2014-15, Chapter 6, Putting Public Investment on
Track: The Rail Route to Higher Growth
• Bibek Debroy Committee Report on Mobilization of Resources for
Major Railway Projects and Restructuring of Railway Ministry and
Railway Board
• National Transport Development Policy Committee (NTDPC) Report