Embed Size (px)
Citation preview

Chart 1: Filings by State of Residence
Filings by State of Residence
Table 1 Registration Forms Claims
State FormSubmitted % Form
Submitted %
1. Alabama 50,471 17.3% 63,569 16.3%2. Florida 88,342 30.3% 105,914 27.1%3. Louisiana 84,413 29.0% 122,938 31.5%4. Mississippi 38,192 13.1% 45,376 11.6%5. Texas 13,173 4.5% 19,916 5.1%6. Other 16,889 5.8% 33,070 8.5%7. Total 291,480 100.0% 390,783 100.0%
Number of Claims by Claim Type
Table 2 Claim Type Claims Unique Claimants
Form Submitted % with Form Submitted
1. Seafood Compensation Program 24,959 6.4% 10,544
2. Individual Economic Loss 60,816 15.6% 58,615
3. Individual Periodic Vendor or Festival Vendor Economic Loss 390 0.1% 384
4. Business Economic Loss 135,569 34.7% 93,741
5. Start-Up Business Economic Loss 7,931 2.0% 6,276
6. Failed Business Economic Loss 5,915 1.5% 4,935
7. Coastal Real Property 42,234 10.8% 28,658
8. Wetlands Real Property 31,512 8.1% 4,514
9. Real Property Sales 3,069 0.8% 1,610
10. Subsistence 67,864 17.4% 67,322
11. VoO Charter Payment 8,960 2.3% 6,290
12. Vessel Physical Damage 1,564 0.4% 1,309
13. Total 390,783 100.0% 261,726
Claims Administrator Patrick Juneau has announced that the Settlement Program began issuing payments on July 31, 2012, and has been issuing outcome Notices since July 15, 2012. The Program will issue Notices on a rolling basis as we complete reviews, and they will include Eligibility Notices, Incompleteness Notices, and Denial Notices. Each Notice will provide information explaining the outcome. We will post Notices on the secure DWH Portal for any law firm or unrepresented claimant who uses the DWH Portal. We will notify firms and unrepresented claimants by email at the end of each day if we have posted a Notice that day. Firms and unrepresented claimants may then log onto the DWH Portal to see a copy of the Notice(s). Law Firms or claimants who do not use the DWH Portal will receive Notices in the mail. Claimants who receive an Eligibility Notice and qualify for a payment will receive that payment after all appeal periods have passed, if applicable, and the claimant has submitted all necessary paperwork, including a fully executed Release and Covenant Not to Sue.
Page 1 of 5
Public Statistics for the Deepwater Horizon Economic and Property Damages SettlementMay 18, 2018

Chart 2: Number of Claims by Claim Type
Notices Issued
Table 3Claim Type Eligible - Eligible - No Incomplete
DenialTotal Claims
Payable Payment Exclusion Denials
Prior GCCFRelease
Causation Denials
Other Denials
Incomplete Denials
Opt-Outs Withdrawn Closed Issued Notice
1. Seafood Compensation Program 18,992 2,683 0 52 2,415 0 1,208 4,624 1,164 3,259 2,130 36,527
2. Individual Economic Loss 8,741 2,149 58 3,549 2,507 123 4,680 31,746 756 5,180 3,401 62,890
3. Individual Periodic Vendor or Festival Vendor Economic Loss 10 0 0 10 28 0 83 192 3 102 45 473
4. Business Economic Loss 52,377 1,829 109 1,309 889 8,706 4,916 21,441 959 25,205 18,253 135,993
5. Start-Up Business Economic Loss 1,553 80 21 65 56 948 1,160 2,136 113 1,022 849 8,003
6. Failed Business Economic Loss 247 285 7 86 142 532 1,657 1,697 104 430 784 5,971
7. Coastal Real Property 29,392 70 0 14 957 0 5,836 1,698 379 1,188 2,886 42,420
8. Wetlands Real Property 15,450 18 0 43 95 0 9,557 207 92 1,759 4,236 31,457
9. Real Property Sales 862 7 0 11 88 37 684 103 20 1,123 178 3,113
10. Subsistence 42,745 492 0 36 2,354 0 8,190 10,066 279 1,373 2,351 67,886
11. VoO Charter Payment 7,116 16 0 16 0 0 608 792 91 83 186 8,908
12. Vessel Physical Damage 843 28 0 7 0 0 173 285 19 82 123 1,560
13. Total 178,328 7,657 195 5,198 9,531 10,346 38,752 74,987 3,979 40,806 35,422 405,201
Page 2 of 5
Public Statistics for the Deepwater Horizon Economic and Property Damages SettlementMay 18, 2018

Payment Information
Table 4Claim Type
Eligibility Notices Issued with Payment Offer Accepted Offers Payments Made
Number Amount Number Amount Number Amount Unique Claimants Paid
1. Seafood Compensation Program 18,992 $2,235,323,013 18,991 $2,235,142,673 18,961 $2,234,723,510 5,383
2. Individual Economic Loss 8,741 $133,790,466 8,719 $132,701,732 8,688 $128,040,526 8,688
3. Individual Periodic Vendor or Festival Vendor Economic Loss 10 $93,497 10 $93,497 10 $93,497 10
4. Business Economic Loss 52,377 $8,625,298,502 52,012 $8,080,825,360 51,722 $7,636,547,980 46,272
5. Start-Up Business Economic Loss 1,553 $229,546,445 1,535 $222,716,928 1,525 $216,034,072 1,435
6. Failed Business Economic Loss 247 $32,570,244 241 $28,858,079 234 $28,695,765 232
7. Coastal Real Property 29,392 $162,066,907 29,387 $162,054,360 29,367 $162,011,046 22,990
8. Wetlands Real Property 15,450 $279,976,154 15,371 $275,204,249 15,336 $273,932,039 3,070
9. Real Property Sales 862 $40,460,484 862 $40,460,484 862 $40,460,484 764
10. Subsistence 42,745 $528,785,414 42,719 $528,388,233 42,673 $527,896,981 42,673
11. VoO Charter Payment 7,116 $283,167,969 7,116 $283,167,969 7,115 $283,163,169 5,409
12. Vessel Physical Damage 843 $12,881,455 843 $12,881,455 843 $12,881,455 775
13. Totals on DWH Releases 178,328 $12,563,960,551 177,806 $12,002,495,020 177,336 $11,544,480,525 130,937
14. 40% Request 3,552 $60,663,858 3,552
15. 6% Refund 3,011 $7,962,317 2,546
16. Total Payments 183,899 $11,613,106,700 135,487
Appeals Received
Table 5 Resolved Appeals
Appeal Status BP Appeals Claimant Appeals Total Appeals
1. Resolved by Panel Decision 4,332 4,905 9,237
2. Discretionary Court Review Granted 220 398 618
3. Resolved by Parties 2,053 162 2,215
4. Withdrawn 547 361 908
5. Administratively Closed 1,452 888 2,340
6. Inactive Under Reconsideration/Re-Review 583 0 583
7. Remand to Claims Administrator 609 1,127 1,736
8. Return for Review Under Policy 495 1,444 90 1,534
9. Total 11,240 7,931 19,171
Pending Appeals
10. In “Baseball” Process 70 17 87
11. In “Non-Baseball” Process 0 56 56
12. Submitted to Panel 16 98 114
13. Under Discretionary Court Review 96 151 247
14. Total 182 322 504
Grand Total
15. 11,422 8,253 19,675
Page 3 of 5
Public Statistics for the Deepwater Horizon Economic and Property Damages SettlementMay 18, 2018
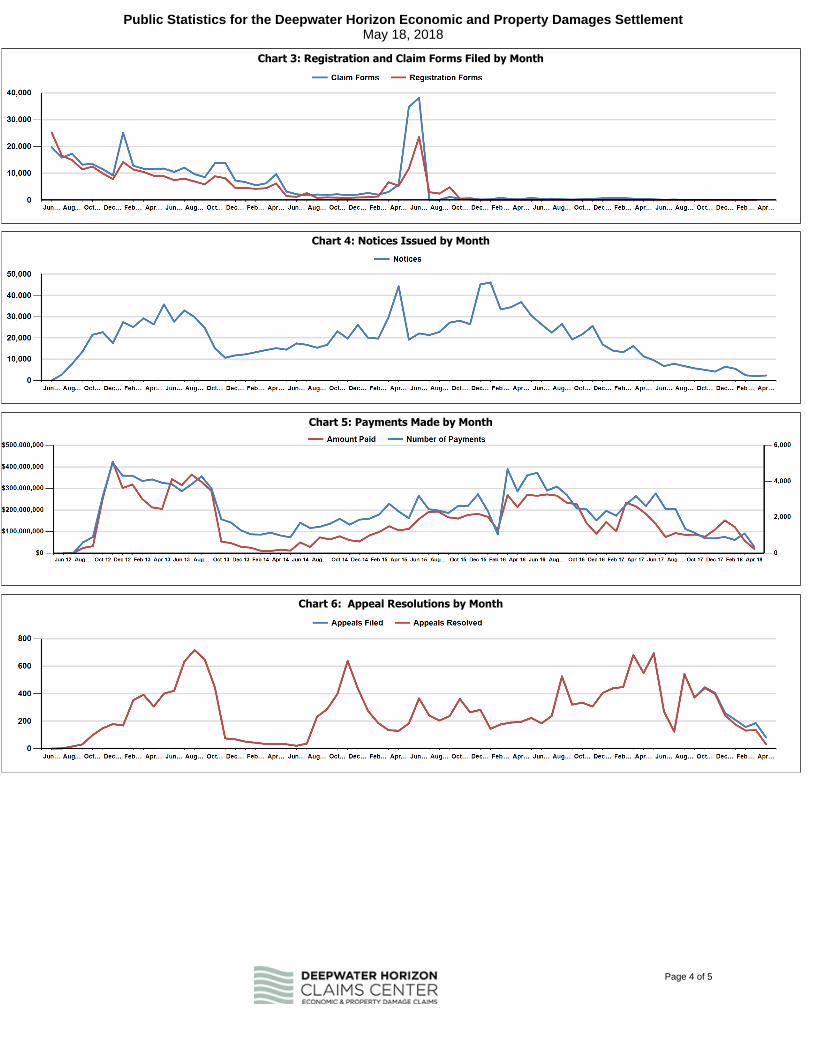
Chart 3: Registration and Claim Forms Filed by Month
Chart 4: Notices Issued by Month
Chart 5: Payments Made by Month
Chart 6: Appeal Resolutions by Month
Page 4 of 5
Public Statistics for the Deepwater Horizon Economic and Property Damages SettlementMay 18, 2018

Legend:
1. Form Submitted – Includes electronically file registration or claim forms after the claimant or his attorney completes the electronic signature and clicks the Submit button. This definition also includes hard copy registration or claim forms where the DWH Intake Team has completed both the linking of scanned images and the data entry on that form.
2. Unique Claimants with Form Submitted – Counts the unique number of claimants with at least one Claim Form Submitted for each Claim Type. Because claimants may file claims for more than one Claim Type, the sum of all Claim Types will not equal the count of total unique claimants.
3. Notices Issued – The Seafood Compensation Program row (row 1) of Table 3 includes Seafood Supplemental Distribution Claims. The count of Notices Issued in Table 3 counts each unique claim issued a Notice only once. For claims issued multiple Notices, this report uses the following hierarchy when counting the claim: (1) Eligibility Notice if the claim has been paid; (2) Most recent active Notice if the claim has not been paid; (3) If the claim has been closed it will not be counted as an Eligibility Notice unless the claim has been paid. The count of Notices Issued in Chart 4 counts all Notices Issued and reports claims with multiple Notices once for each Notice issued. Because of this, the totals reported in Table 3 do not match the totals reported in Chart 4.
4. Payment Information – The timing of payment can be affected by a number of factors. Even after the DHECC receives a Release, delay in receipt of a W-9, or in receipt of the Attorney Fee Acknowledgment Form can delay payment. In addition, any alterations or omissions on the Release Form, or an assertion of a third-party lien against an award amount, can delay payment. As a result, this report will show a higher number of Accepted Offers than Amounts Paid. The Seafood Compensation Program row (row 1) of Table 4 includes Seafood Supplemental Distribution Claims.
5. Appeals Received – Excludes Appeals closed pursuant to 4/24/13 Court Order.
6. Note: The Claims Administrator continually monitors the status of all claim filings. Through this process, the Claims Administrator may find duplicate claims from the same claimant. In such cases, the Claims Administrator will close the duplicate claim and only process the remaining valid claim. This report excludes duplicate claims from all counts of claims filed.
7. Note: The Seafood Supplemental Distribution Notices are included in the Exhibit A as appropriate.
8. Note: The final deadline for filing all claims other than those that fall into the Seafood Compensation Program was 6/8/15.
9. Note: Claims Received includes all damage categories but does not include timely claim forms that have been received in hard copy but have yet to be recorded electronically into the system of record.
10. As to Table 3, the Total Claims Issued Notice figure contains 3,610 Notices of Withdrawal, Closure, and Denial which had previously been issued to claimants prior to the finalization and submissions of their associated Claim Forms. The partially completed Claim Forms associated with these Notices are not included within the total population of Claim Forms Submitted in Table 1.
Page 5 of 5
Public Statistics for the Deepwater Horizon Economic and Property Damages SettlementMay 18, 2018