Embed Size (px)
Citation preview

Norman Flynn &Alberto Asquer
MANAGEMENTPUBLIC SECTOR
7th Edition
00_FLYNN_ASQUER_PRELIMS.indd 3 11/1/2016 12:57:40 PM

SAGE Publications Ltd1 Oliver’s Yard 55 City RoadLondon EC1Y 1SP
SAGE Publications Inc.2455 Teller RoadThousand Oaks, California 91320
SAGE Publications India Pvt LtdB 1/I 1 Mohan Cooperative Industrial AreaMathura RoadNew Delhi 110 044
SAGE Publications Asia-Pacific Pte Ltd3 Church Street#10-04 Samsung HubSingapore 049483
Editor: Natalie AguileraEditorial assistant: Delayna SpencerProduction editor: Katie ForsytheCopyeditor: Christine BittenProofreader: Mary DaltonIndexer: Adam PoznerMarketing manager: Sally RansomCover design: Stephanie GuyazTypeset by: C&M Digitals (P) Ltd, Chennai, IndiaPrinted in the UK
Norman Flynn and Alberto Asquer 2017
Fifth edition published 2007. Reprinted 2008 (three times) and 2012Sixth edition published 2012. Reprinted 2014 and 2015This seventh edition first published 2017
Apart from any fair dealing for the purposes of research or private study, or criticism or review, as permitted under the Copyright, Designs and Patents Act, 1988, this publication may be reproduced, stored or transmitted in any form, or by any means, only with the prior permission in writing of the publishers, or in the case of reprographic reproduction, in accordance with the terms of licences issued by the Copyright Licensing Agency. Enquiries concerning reproduction outside those terms should be sent to the publishers.
Library of Congress Control Number: 2016947014
British Library Cataloguing in Publication data
A catalogue record for this book is available from the British Library
ISBN 978-1-4739-2517-5ISBN 978-1-4739-2518-2 (pbk)
At SAGE we take sustainability seriously. Most of our products are printed in the UK using FSC papers and boards. When we print overseas we ensure sustainable papers are used as measured by the PREPS grading system. We undertake an annual audit to monitor our sustainability.
00_FLYNN_ASQUER_PRELIMS.indd 4 11/1/2016 12:57:40 PM
1The Public Sector in the United Kingdom in a Global Context
Learning Points
• The boundary between the public and private sectors is both permeable and changeable.
• The institutional forms that the state takes vary in the constituent countries of the United Kingdom.
• Governments reorganise structures very frequently. • The UK is simultaneously decentralised in the cases of Scotland,
Wales and Northern Ireland, but very centralised when it comes to central government control of local authorities, especially in England.
• The public sector represents a large part of the national economy and employment and was, until recently, growing.
This chapter starts with a discussion of the definition of the private and public sectors and how the boundary between the two has changed over time. It looks at the argument that there are ‘public goods’ that are distinct from other goods and services and explains the extent of the public sector. It then looks at the specific characteristics of the public sector in the United Kingdom: the devolution of powers to Scotland, Wales and Northern Ireland, and the fact that there is persistent and continuous reorganisation
to the structures of the public sector, especially in the NHS and central government. It then describes the main institutions of the state: central government, the NHS, local authorities and their rela-
tionship with central government. It ends with a brief discussion of whether recent changes have resulted in a ‘hollow state’ as some theorists argue.
01_FLYNN_ASQUER_CH_01.indd 1 11/1/2016 12:59:49 PM

2 Public Sector Management
Private and Public SectorsThe boundary between the public and private sectors changes with time and circumstances. During the period of post-war reconstruction industries such as coal-mining, steel-making, motor manufacturing, shipbuilding, public transport including buses and trains, telecommunications, aircraft manu-facturing, harbours, airports, oil, gas and electricity extraction, production and distribution were all publicly owned. In the same period, healthcare was taken into public ownership and the production of new housing was dominated by local authorities.
At the beginning of the 1980s there was a reversal of the process, as the state divested itself of industries and returned them to the private sector. There were a range of reasons for the privatisations – ideological, fiscal and pragmatic. There had always been politicians who opposed state ownership as a matter of principle, the principle that the profit motive was the only acceptable motive for business. At the end of the 1970s the Conservative governments were dominated by politicians who held this view and the sale of state assets started, first with Cable and Wireless, then British Aerospace, British Petroleum, British Telecom, and later in the 1980s British Gas, the water industry in 1989, followed by elec-tricity in 1990. The fiscal motivations were also important, as the cash raised from selling state assets could reduce the need for taxation, while the divestiture of (sometimes) loss-making industries reduced the burden of subsidy. The fiscal motivation contributed to the pragmatism of asset sales: even if there was not a strong ideological motive, faced with a choice between raising taxation or bor-rowing and making money by selling an asset, it would take a strong pro-public ownership ideology to resist the temptation. And so it proved through the 1990s, and into the Labour governments at the end of the 1990s; there was a growing consensus in favour of privatisation.
How the assets are owned and governed has an impact on decisions about asset acquisition, disposal and use. The estate, the land and buildings that an organisation has in ownership is an important element of any buildings-based service. Universities, for example, during the expansion period, acquired and disposed of land and buildings as part of their planned service delivery; some acquired assets far from their ‘home’ base and the resultant configuration of the estate had a fundamental impact on the types of research and teaching they could do, as well as how big they could be. Education authorities have had a responsibility to provide school places for the school-age population of their territories and have had to respond to the ebb and flow of pupils on the tides of demography and migration. Land acquisition and disposal has been an essential element of that response. The same is true of the health service, the prison ser-vice, the military and any service provided through land and buildings. Flexibility and responsiveness of asset use is greatly affected by the nature of the owner-ship: long leases under Public–Private Partnerships, for example, lock the organisation into the asset for the period of the lease, however the requirement might change. Profits from changes in land values have traditionally provided public bodies with capital to make investments, an opportunity that only comes with unfettered land ownership.
01_FLYNN_ASQUER_CH_01.indd 2 11/1/2016 12:59:49 PM
The Public Sector in the UK in a Global Context 3
In addition to the sale of assets, the boundary between the public and the private was also pushed back in favour of the private by the sale of council houses to tenants through the ‘right to buy’ scheme, whereby tenants were offered big discounts and easy loans to buy the properties they lived in. This was largely an ideological and political choice, the judgement being that home-owners were likely to be more conservative than council tenants.
The third change in the boundary came with the increasing use of contracting with the private sector to provide services that remained public, such as highway maintenance, street cleaning, refuse collection. Beginning at the same time as the privatisations, the beginning of the 1980s, first local and health authorities and later the civil service were instructed to put out to tender an increasing list of services. This process of compulsory competitive tendering was extended to an increasing use of private finance and private management in new investment, especially in schools, hospitals and highways, through a process of ‘Public–Private Partnerships’, which we will examine in detail in Chapter 9. This process resulted, by 2011, in around 30% of all public expenditure being used to finance contracts for goods and services from the private sector. A government review (Julius, 2008) estimated that by 2008 outsourced public services accounted for 6% of GDP and employed 1.2 million people, with a turnover of £79 billion, up from £31 billion in 1995–96. The growth in outsourcing continued and acceler-ated under the Coalition and Conservative governments.
The result of the three processes – privatisation, council house sales and outsourcing – shrank the numbers employed in the public sector by about 2 million in the two decades from 1980, from 7 million to 5 million. Of these reductions, 1,355,000 were in the ‘nationalised industries’, 321,000 in local government and 200,000 in the civil service.
The shrinkage was reversed at the end of the 1990s, as the Labour govern-ments increased public spending and public employment, especially in the NHS and education, but also in the civil service. From 1998 public sector employment rose every year to 2005, when it stood at 5,882,000, or 719,000 more than in 1998 and almost back to where it was before the great reductions started. The biggest increase was in the NHS, which put on 300,000 jobs.
This period of growth, which could be seen as a period of extending the boundary of the state, came to an end at the end of the 2000s, as fiscal deficits began to make the Labour governments look for reductions in numbers through greater use of Information and Communication Technology and increased effi-ciency and productivity. With the change of government in 2010 and a fiscal deficit that the government decided to attack by cuts in spending as well as increases in taxation, the trend towards cutting the size of the state accelerated, as the Treasury called for cuts of 20–25% with their resulting cuts in jobs. While the details of these changes will be discussed in Chapter 4, a rough calculation of the scale of the spending cuts and the average cost of a public sector job puts the reduction of public employment between 2010 and 2014 at between 500,000 and 600,000, almost but not quite reversing the growth in employment implemented by the Labour governments between 1998 and 2008.
These ebbs and flows of employment numbers are the result of political and fiscal choices, but they do not explain the underlying issues about the boundary
01_FLYNN_ASQUER_CH_01.indd 3 11/1/2016 12:59:49 PM

4 Public Sector Management
between the public and the private sectors. Public expenditure in the United Kingdom accounts for about 40% of Gross Domestic Product. This is not an entirely satisfactory definition of the scale of the public sector, since half of that spending is on transfers, subsidies and benefits which are not counted in the GDP figure. Expenditure on public services accounts for about 20% of GDP. Over the long term, is there an explanation for what is ‘public’ and what is ‘private’?
Public goods and public servicesThere are four elements to the definition of what is public and what is private. The first is that certain things are ‘public goods’. One feature of such goods and services is that they produce ‘externalities’, or benefits that accrue to people other than those who benefit directly. For example, education is said to benefit everyone living in a society of skilled and educated people. The other feature is that people cannot be excluded from certain benefits. Everyone benefits from clean air or street lighting. Because no one can be excluded, people should pay for such services collectively rather than individually. Even those politicians who believe that the state should do the minimum possible are normally willing to concede that these categories of services should be carried out by the public sector. Some people believe that no services are better provided by government and that even clean air is best achieved by property rights in air.
As a justification for the public sector, the ‘public goods’ argument suggests that the public sector should provide services where the market fails to do so, and the goods or services are required collectively, a decision made through the political process. As an explanation of what is public and what is private it is less convincing, since different services are in the public and private sectors in different societies and at different stages of development. Examples of the dif-ferences include the extensive provision of education through religious organisations but financed by the state in the Netherlands, the private provision of ambulances and fire protection in Denmark, public ownership of airlines in various countries. History and politics have more convincing explanations than a theory about public goods. Britain went through a period in which the ruling Conservative Party had an instinctive suspicion of public provision and prefer-ence for markets and the private sector. The Labour party abandoned its belief in state ownership as part of its modernisation programme and claims to be pragmatic in its approach to what should be private and what should be public.
The second distinction is how services are financed. Services are public ser-vices if they are financed mainly by taxation, rather than by direct payments by individual customers. One characteristic of most public services is that they are not available for sale and people cannot necessarily have more if they pay more. Even those services that are ‘commercial’, in the sense that money is exchanged at the point of consumption, are still public services in the sense that they are controlled through the political process and accountability for service delivery is through politicians to the public rather than to shareholders.
The distinction is no longer absolute. People who receive homecare, for exam-ple, may pay for extra hours beyond those for which they are assessed as needing. School children who do not pay for school visits may be left at school.
01_FLYNN_ASQUER_CH_01.indd 4 11/1/2016 12:59:49 PM

The Public Sector in the UK in a Global Context 5
Some public services are subject to charging: leisure facilities and car parks are normally charged for at cost or close to it. The NHS has charged for drugs since 1952 and patients in England and Scotland pay about 10% of the cost of drugs to the NHS.1 NHS Trusts have private wings in which patients who pay may receive quicker treatment and better facilities than NHS patients. A high propor-tion of public services are ‘free’, at least at the point at which they are used: most of education and health, social security, criminal justice.2
A third difference is who owns the facilities and by whom are the service providers employed. Traditionally public services were provided by public employees using publicly owned assets. Again, such a distinction is not abso-lute, after a period of contracting out and privatisation. Take public transport. In the United Kingdom outside London, bus transport is privately owned and deregulated. But there are still public service features. Everyone benefits from there being a public transport system, even car users whose freedom to drive is enhanced by having passengers on buses. In London, buses are privately owned, but the routes are regulated by Transport for London and some routes are sub-sidised. Or, take refuse collection. Where private companies have won the right to collect rubbish, their employees are not public employees, the vehicles may or may not be owned by the local authorities but the details of the service are determined by the local authority.
The main defining characteristic is whether goods and services are sold only to people who pay for them and whether anyone with money can access them while other people are excluded. For people running and providing the services this distinction is important. In a business, the task is to attract customers, per-suade them to pay a price that produces a profit and satisfy them enough to persuade them to remain customers. Public services have to attract people to use them, but they also have to enforce eligibility criteria where scarce resources have to be rationed in a way which does not apply in the private sector where scarce services are rationed by price. In the public sector, resources are rarely deliberately rationed by price. Prescription charges for drugs may deter poor people from taking medication, but there are safeguards to try to ensure that people in need do not have to pay and are not deterred. Nor do the managers and workers of public services have to satisfy people enough to persuade them to return. In those cases, where the service is a monopoly, the service users have no choice. Even if they have a choice, it is not always the case that attracting more service users creates benefits for the organisation or its workers; often it just means more work. The motivation for satisfying customers is not to per-suade them to return and generate more profit, but the value of public service.
It is really this last feature, the lack of a direct connection between ability to pay and access to the service and the fact that there is not always a direct benefit to the organisation from attracting customers that makes management in the public sector distinct: marketing to generate sales is mostly irrelevant, unless artificial markets are created. Customer satisfaction as expressed by repeat business is not a relevant measure of success, nor is profitability. Motivations for good service are not themselves based on profit.
If these differences did not exist, then managing in the private and public sectors would be identical. Of course there are similarities: people’s motivations
01_FLYNN_ASQUER_CH_01.indd 5 11/1/2016 12:59:49 PM
6 Public Sector Management
in both sectors may have no connection with the well-being of the organisation or its customers; services in both sectors need to be designed and managed in similar ways; organisations have to be created to support the service process. Underlying these techniques, however, are the important differences in values and definitions of success.
Outsourcing, partnerships and the changing public–private boundaryWhile central and national government have a long history of outsourcing there has been an acceleration of the process since 2010. We will examine the manage-ment implications of running public services through companies in Chapter 8, but here we set out the elements of services and infrastructure that are shared between the government, private companies, social enterprises and non-government organisations. The elements include the ownership of the assets, the employment of the staff, design of services, financing of investment and service delivery and mode of regulation of the activities. Table 1.1 lists these elements and illustrates the different arrangements using examples of the Work Programme, the Probation Service, Academy schools and Community Care. The table illustrates the way in which services are organised and delivered once the decision is made to privatise. The management problems of the public bodies are delegated to the contractors, as are obligations for pay, pensions and other benefits. One side effect is that if we try to measure the scale of the public sector by counting the number of employees, all of those working for the contractors are classified as being in the private sector, including teachers in Trust Academies and lecturers in colleges, who were reclassified to the private sector in 2011. Many of the reductions in public employment reported in official statistics occur as a result of these reclassifications.
Devolution and DifferenceAs well as being careful to define what we mean by the public sector, and to recognise the fact that the scale changes with time and that the boundaries are permeable, with cash flowing between the public and private sectors, we also need to consider the differences among the parts of the UK. The process of devo-lution has resulted in differences in policies, in institutional forms and policy and management processes in the constituent parts of the United Kingdom.
Scotland, Wales and Northern Ireland have their own national parliamentary and governmental institutions: only England has direct rule from Westminster, and no parliament or government of its own. The current devolution arrange-ments were brought in by Labour at the beginning of its first term of office. Referendums were held in Scotland and Wales in 1997 and by 1999 Scotland had a Parliament and Wales an Assembly. Similar plans were made for regional assemblies in England but when the first proposal was rejected in its referendum the plans were dropped. Scotland first had an Executive, then a Government, Wales a ‘Welsh Assembly Government’, since 2005. Northern Ireland has an Assembly and an Executive, whose membership represents the proportions of
01_FLYNN_ASQUER_CH_01.indd 6 11/1/2016 12:59:49 PM

The Public Sector in the UK in a Global Context 7
Table 1.1 The mixed economy of public services
Work Programme
Probation Service
Academy Schools
Community Care
Asset ownership
Public Mixed Public Mixed, residential care predominantly private3
Staff employment
Private companies, ‘third sector’
Mostly private companies, 12% residual employment in Probation Service for difficult and complex cases. Third sector sub-contractors
Classified as public
Private, public employment of social workers making assessments
Service design
Mixed Public National curriculum but freedom to vary
Specified by commissioners in public sector
Service delivery
Private Mostly private companies and third sector
Private Mostly private
Revenue for services
Tax funded Tax funded Tax funded Tax funded, topped up by fees in some cases
Regulation Through contract
By legislation and through the contract
Inspection by OfSTED
Inspection
parties represented in the Assembly. The Scottish Parliament and Welsh Assembly are elected by proportional representation, unlike the UK parliament. The powers allocated to the three devolved governments vary.
The Scotland Act of 1998 set out a list of reserved powers,4 which were not to be devolved to Scotland. These included international relations, defence, trea-son, fiscal, economic and monetary policy, immigration and nationality, betting and gaming, emergency powers, various aspects of trade and industry and social security (except social welfare services). The exceptions left a wide range of pow-ers for local decision, including the control over the big spending services, health and education, and most of the justice system. There was even provision for Scottish variation in income tax rates, a power that has not yet been used.
The National Assembly for Wales and the executive branch, the Welsh Assembly Government have their fields of competence defined in the Government of Wales Act of 2006.5 There are 20 ‘fields’ for which they are responsible:
01_FLYNN_ASQUER_CH_01.indd 7 11/1/2016 12:59:49 PM

8 Public Sector Management
agriculture forestry and fishing; ancient monuments and buildings; culture; economic development; education; environment; fire and rescue; food; health and social services; highways and transport; housing; local government; the National Assembly; public administration; social welfare; sport and recreation; tourism; town and country planning; water and flood defence; the Welsh language. The main difference between Scotland and Wales is the omission of criminal justice from the Wales competencies.
The Northern Ireland Assembly and Northern Ireland Executive were created after the Belfast Agreement on devolution of powers and constitutional arrange-ments for the government of Northern Ireland. The Northern Ireland Act of 19986 set out a series of ‘excepted’ and ‘reserved’ matters, broadly similar to those in Scotland, with the exception of the criminal justice system. The Northern Ireland Act of 2009 transferred policing powers to the Assembly.
The devolution of powers to the three jurisdictions has created many differ-ences in domestic policies and in governance and management arrangements. The differences include the structure of the health and social welfare services, the ownership and governance of the water and power systems, entitlements to services for elderly people, the payment of university fees, the structure, includ-ing the distribution of functions, of local government, institutions and policies for economic development.
Devolution has incidentally created a constitutional anomaly, in that members of the UK parliament representing Scottish, Welsh and Northern Irish constituen-cies can pass legislation affecting English citizens, but that English MPs have no votes in the Scottish, Welsh and Irish Assemblies.
We will see in Chapter 4 that the budget processes in the devolved administra-tions are concerned only with expenditure, since fiscal policy is a reserved power for the Westminster government, with some marginal exceptions, and the aggre-gate amount of spending is decided outside the devolved administrations. This breaks the connection between taxation and elections: national politicians can blame the Westminster government for lack of funds (although spending per head in the devolved administrations is generally higher than that in England), rather than being compelled to ask the electorate for revenues to pursue policies and provide services. Since devolution does not include fiscal policy it frees politicians from choices about the connection between revenue and expenditure.
Permanent Structural ChangeOne hazard of writing a book about the public sector in the United Kingdom is that there will most likely have been another reorganisation between the comple-tion of the manuscript and its publication. Since the mid-1970s reorganisation has been the chosen solution to a variety of problems, for example, in 1974/75 local government was diagnosed as inefficient, so it was reorganised into bigger units to create economies of scale. The NHS has been in a constant state of reor-ganisation since 1947, with Regional Health Authorities created and then destroyed, funds given to General Practitioners to manage, then taken away from them and given to Primary Care Trusts, which in turn came up for destruction and funds given back (again) to consortia of GPs to manage. New institutions are
01_FLYNN_ASQUER_CH_01.indd 8 11/1/2016 12:59:49 PM

The Public Sector in the UK in a Global Context 9
set up with very swift and cursory preparation, such as Education Action Zones or Strategic Partnerships, and as swiftly dismantled and forgotten. Ministries are amalgamated, split, re-named, abolished or created apparently at will. One of the first acts of the Gordon Brown premiership was to reorganise the departments. The Coalition set about abolishing organisations, including the Audit Commission and government regional offices, for example, among its first acts on taking power. It also proposed yet another reorganisation of the NHS, to continue the long tradition of never leaving the NHS alone.
The National Audit Office report on central government reorganisation in 2010 found: ‘There have been over 90 reorganisations of central government departments and their arm’s length bodies between May 2005 and June 2009: over 20 a year on average. We estimate the gross cost of the 51 reorganisations covered by our survey to be £780 million, equivalent to £15 million for each reorganisation and just under £200 million a year’ (2010a: 4). This estimate excludes another 42 small reorganisations in the same period. The report also records: ‘Central government has always reorganised, even though its funda-mental activities change little. Since 1980, 25 departments have been created, including 13 which no longer exist’ (2010a: 4).
Apart from creating a lot of work for Human Resources departments, the constant reorganisation has consequences for public services. First, it diverts people’s attention from the outside to the inside, from the service users to the organisation. Individuals’ attention is focused on the possibility of being made redundant, of possible promotion, of likely relocation. Second, it confuses people who use the services: if the NHS, for example, creates, merges then abolishes Primary Care Trusts, how can patients or citizens relate to the PCTs or even understand which one is looking after their services or what they do? Some reorganisations are designed to improve customer service, for example by merging services that individuals receive but access to which previously required visits to two or more locations.
To some extent the very front line may be less affected than the middle managers and upper reaches of the organisations, whose jobs are more likely to change. One of the authors of this book interviewed a civil engineer who had been through many reorganisations of the bodies responsible for highways maintenance. His view was that what happened above his level had little impact on the technical activity of maintaining the highways, as opposed to the struc-tures of resource allocation and accountability above that level. Large parts of public service and the way they are managed and delivered is relatively con-stant: benefits get assessed and paid; schools have classes, pupils and teachers; doctors and other medical professionals treat patients; police arrest, courts sit and prisons detain. Changes in the processes of management have big impacts on the way people work; changes in organisation structures rarely do.
This is a common phenomenon in reorganisations, whereby the levels or tiers above those of service delivery are reorganised, redefined, funded in new ways, told to produce strategies and plans in new ways while the business of providing services is still relatively unchanged at what has become known as the ‘front line’.
The regime in prisons, for example, is set by custom and policy and is con-strained by the resources, especially staff resources available in each prison.
01_FLYNN_ASQUER_CH_01.indd 9 11/1/2016 12:59:49 PM

10 Public Sector Management
Outside, or ‘above’ the prison in organisational terms, there have been many changes over the years: the Prison Service has had reorganisations, most recently consisting of a merger with the Probation Service into the National Offender Management Service.
Central GovernmentCentral government in England and the devolved administrations consists of Departments, responsible for policy and high level management control, Executive Agencies, responsible for the delivery of services (except in Northern Ireland), a range of non-departmental bodies with a variety of functions and a set of inspectors, auditors and regulators with varying degrees of autonomy from central government.
At the centre of government are politicians doing jobs as ministers of various ranks in their departments and an elite civil service. The 2015 distribution of civil servants by grade is shown in Table 1.2.
Table 1.2 Numbers of civil servants by grade, 2015
Senior Civil Service 4,852
Grades 6/7 37,782
Executive grades 215,665
Administrative grades 178,918
Not reported 2,725
Total 439,942
There were 19 Ministerial departments and 20 non-ministerial departments and about 65 Executive Agencies. The Agencies were created from 1990 as executive bodies separate from policy-making functions of the civil service and they still employ the majority of civil servants. There were some reversals of this policy of creating agencies, as ministers re-established more direct control by bringing agencies back under departmental control, including the Border Agency which reverted to the Home Office and was rebranded ‘Border Force’ in 2013 followed by the Passport Office in 2014.
There were 450 Non-Departmental Public Bodies7 sponsored by the UK Government, after a policy of abolishing and merging these bodies reduced their number from 766 in 2009. In 2014 the NDPBs employed 87,449 people.
Over 60% of the 439,000 civil servants work in the five biggest big organisations, as shown in Table 1.3. These are big organisations by any standards, with all the management issues and problems that come from size.
Unlike many neighbouring countries’ civil services (see European Commission, 2013), the way that UK civil servants are paid and managed is decentralised and devolved. Since the early 1990s8 departments and agencies have been responsible for their own recruitment and have a degree of autonomy over pay. Civil serv-ants are subject to the same employment law as workers in the private sector, rather than having special privileges and constitutional protection. In this basic
01_FLYNN_ASQUER_CH_01.indd 10 11/1/2016 12:59:49 PM

The Public Sector in the UK in a Global Context 11
respect, management of these large organisations is similar to managing people in large private organisations.
For these large groups of staff, especially Jobcentre Plus and HMRC, the man-agement issues are probably akin to those in businesses such as supermarkets or banks: large numbers of staff in very dispersed locations; a set of activities that have to be governed by rules with small degrees of discretion for the service deliv-ery workers; and staff unlikely to be highly motivated by the job itself, because it is routine and boring. The way the work is done is designed by management and monitored by technology, whether length and number of phone calls, key strokes on computers, or items scanned with the barcode scanner.
The National Health ServiceThe NHS is reputed to be the largest organisation in Europe. In 2011, the health services in England, Scotland and Wales (and Health and Social Care Services in Northern Ireland) employed just under 1.5 million people, as shown in Table 1.4.
The NHS has been reviewed and reorganised many times since it was founded. Organisational form has been used to solve many continuing dilemmas: what should be controlled locally and what centrally? How should local peo-ple be represented in decision-making? Should the doctors be controlled by somebody other than doctors and if so how should this be done? How can access be organised so that people have the same chances of getting treated wherever they live? How should resources be allocated, to populations or to hospitals and other services? Resource allocation has always struggled with the
Table 1.3 Employment in the five biggest departments, 2015
Work and Pensions 90,020
Revenue and Customs 64,310
Defence 47,620
National Offender Management Service 46,440
Home Office 29,840
Total of these 278,230
Table 1.4 Employment in National Health Service, 2015–16, headcount
NHS England 1,164,546
NHS Scotland 160,897
NHS Wales 73,958
Health and Social Care,
Northern Ireland 54,458
Total employees 1,453,859
01_FLYNN_ASQUER_CH_01.indd 11 11/1/2016 12:59:49 PM

12 Public Sector Management
fact that hospitals and doctors have been concentrated in the cities while the population is more dispersed and many formulas have been designed to preserve or correct that imbalance.
The answers to these questions have been varied. There have been hierar-chies of health authorities and various other bodies between the Department of Health and the patients. Local people have been represented on health authorities, although never through direct elections, and on community health councils. The mechanisms that have been used to control the doctors have been some form of management through which someone other than a doctor has tried to tell them what to do, changes to doctors’ contracts and administered markets.
The evolution of the NHS has left different structures in the four countries of the UK. The differences are partly a result of scale: Scotland has unified health boards overseeing all health services in Scotland. In Northern Ireland health and social services are managed as one entity. Wales and England have hierarchical geographical structures and a separation of primary care from hospital care.
The NHS and Social Care Act of 2011 brought yet another reorganisation of the NHS, continuing the process of ‘commissioning’, whereby the services provided by hospitals were defined and ‘purchased’ by someone other than those who run the hospitals. This time, though, those charged with purchasing or commissioning services were to be allowed a freer choice of provider, sub-ject to European competition laws and regulation by an independent regulator, with powers similar to those of the regulators of the public utilities and power industries.
This was an attempt to change the boundary between public and private sectors in the NHS, in the same way that it had previously been redefined by the privatisations and outsourcing in local government and the civil service.
Take the 2011 reorganisation of the NHS, the before and after of which is represented in Figure 1.1. If you look at the top three quarters of the charts you will see big changes: Strategic Health Authorities disappear, ‘Healthwatch’ was created as a channel for patients’ opinions, the Care Quality Commission licensed providers, GP consortia take over almost all funding. Look at the bot-tom of the chart, and there are health professionals carrying on doing what health professionals have always done. The only change between the left and the right is that all NHS trusts become ‘Foundation Trusts’.
General Practitioners, working in a one-to-one way with their registered patients, have been run as independent businesses, then working to Primary Care Trusts, themselves likely to be abolished in the current phase of reforms. One has to ask how much the re-arrangement of the middle and top tiers of organisations affects the everyday behaviour of the professionals working in the services and the people for whom the services are provided. The changes in management arrangements and structures are usually described as ‘reforms’, whatever type they are. Whether a change of name, a reorganisation, a merger or demerger is in reality a ‘reform’ should be subject to two tests: did the change make any measurable difference to the quantity or quality of service delivered to the users of the service? Did the change make any measurable or provable
01_FLYNN_ASQUER_CH_01.indd 12 11/1/2016 12:59:49 PM

Cu
rren
t st
ruct
ure
Dep
artm
ent
of
Hea
lth
Arm
’s le
ng
thb
od
ies
Lo
cal a
uth
ori
ties
(150
) re
ceiv
e fu
ndin
g fr
om th
e D
epar
tmen
t of
Com
mun
ities
and
Loca
l Gov
ernm
ent
• re
gula
te
F
ound
atio
n
Trus
ts
Pro
vid
ers:
GP
pro
vide
rs, d
entis
ts, o
ptic
ians
, ph
arm
acis
ts, w
alk-
in c
entr
es, c
omm
unity
se
rvic
es, a
cute
and
men
tal h
ealth
NH
S tr
usts
,ca
re tr
usts
, Ind
epen
dent
Sec
tor T
reat
men
t C
entr
es, a
mbu
lanc
e tr
usts
Fou
nd
atio
n
Tru
sts
(129
)
Fund
ing
Acc
ount
abili
ty
Pro
po
sed
str
uct
ure
Dep
artm
ent
of
Hea
lth
Arm
’s le
ng
thb
od
ies
• ra
tiona
lised
Hea
lth
wat
ch
En
gla
nd
and
Lo
cal H
ealt
h
Wat
chN
HS
Co
mm
issi
on
ing
Bo
ard
com
mis
sion
GP,
den
tistr
y,
phar
mac
y, m
ater
nity
and
sp
ecia
list s
ervi
ces
Lo
cal a
uth
ori
ties
GP
con
sort
ia
Car
e Q
ual
ity
Co
mm
issi
on
• lic
ensi
ng•
insp
ectio
n
Mo
nito
r•
licen
sing
&
econ
omic
regu
lato
r
Pro
vid
ers:
GP
pro
vide
rs, d
entis
ts, o
ptic
ians
, ph
arm
acis
ts, w
alk-
in c
entr
es, c
omm
unity
se
rvic
es, I
ndep
ende
nt S
ecto
r Tre
atm
ent C
entr
es,
ambu
lanc
e tr
usts
Fou
nd
atio
n T
rust
s•
all N
HS
trus
ts
(>
200
)
• D
epar
tmen
t fun
ding
for
heal
th im
prov
emen
t•
Dire
ctor
of P
ublic
Hea
lth•
insp
ectio
n
Car
e Q
ual
ity
Co
mm
issi
on
Mo
nito
rP
rim
ary
Car
eTr
ust
s (1
52)
com
mis
sion
lo
cal s
ervi
ces
Str
ateg
ic H
ealt
hA
uth
ori
ties
(10
)
Fig
ure
1.1
Sou
rce:
NA
O,
2011
a
01_FLYNN_ASQUER_CH_01.indd 13 11/1/2016 12:59:50 PM

14 Public Sector Management
change to the behaviours of the staff delivering the service? If the change fails these tests, it should not be defined as a reform.
It is interesting to ask why successive governments feel the urge to reorganise. One reason lies in the unwritten constitution, which makes it relatively easy for governments to change organisational structures at national and local level. Other European states have constitutional protection for both sub-national gov-ernments and for civil servants; protection that is designed to stop arbitrary actions by governments. But this only explains why governments can make these changes, not why they do. The explanation probably lies in the very centralised nature of the UK system of government: ministers are remote from the detail and often have no experience of running organisations, including local authorities. Structural change, because it is easy and is visible, seems an attractive option, whether or not it is likely to produce the desired outcomes, or indeed whether specific outcomes were ever defined.
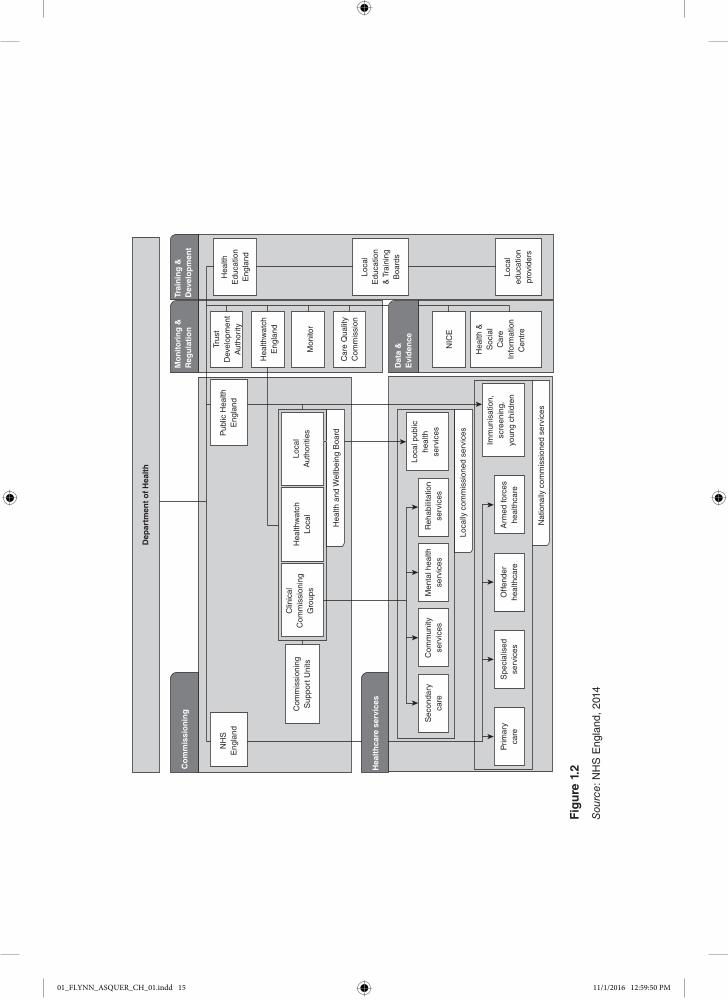
The NHS reorganisation of 2011 lasted less than two years. The Health and Social Care Act of 2012 produced yet another structure in England, shown in Figure 1.2.
The new feature of the 2014 structure is the Clinical Commissioning Groups, consisting mainly of General Practitioners, which are responsible for commissioning secondary healthcare from ‘any qualified provider’, whether public or private. This approach to organising healthcare is not applied in Wales or Scotland where the purchaser–provider split was abolished, and was never used in Northern Ireland. We will see how well this arrangement in England works as a financing method in Chapter 4.
Politicians often claim that the NHS is in some ways better than other countries’ health systems. While such a judgement can only be based on outcomes, in terms of the scale of the health service, the UK is below some of its equivalent neighbours. The NHS Confederation published these comparisons in 2016:
• Current health expenditure in the UK was 8.46% of GDP in 2013. This compares to 16.43% in the USA, 11.12% in the Netherlands, 10.98% in Germany, 10.95% in France, 10.40% in Denmark, 10.16% in Canada and 8.77% in Italy.
• Current expenditure per capita (using purchasing power parity) for the UK was $3,235 in 2013. This can be compared to $8,713 in the USA, $5,131 in the Netherlands, $4,819 in Germany, $4,553 in Denmark, $4,351 in Canada, $4,124 in France and $3,077 in Italy.
• The UK had 2.8 physicians per 1,000 people in 2013, compared to 4.1 in Germany, 3.9 in Italy, 3.8 in Spain, 3.4 in Australia, 3.3 in France, 2.8 in New Zealand and 2.6 in Canada.
• The UK had 2.8 hospital beds per 1,000 people in 2013, compared to 8.3 in Germany, 6.3 in France, 3.1 in Denmark, 3.0 in Spain and 2.8 in New Zealand.
• Average length of stay for all causes in the UK was 7.0 days in 2013. This compares to 17.2 in Japan, 9.1 in Germany, 7.7 in Italy, 7.6 in New Zealand, 6.6 in Spain and 5.6 in France.
01_FLYNN_ASQUER_CH_01.indd 14 11/1/2016 12:59:50 PM
Dep
artm
ent
of
Hea
lth
Co
mm
issi
on
ing
Hea
lth
care
ser
vice
s
NH
SE
ngla
nd
Com
mis
sion
ing
Sup
port
Uni
ts
Clin
ical
Com
mis
sion
ing
Gro
ups
Hea
lthw
atch
Loca
l
Hea
lthw
atch
Eng
land
Hea
lth &
Soc
ial
Car
eIn
form
atio
nC
entr
e
Arm
ed fo
rces
heal
thca
re
Loca
l pub
liche
alth
serv
ices
Hea
lth a
nd W
ellb
eing
Boa
rd
Loca
lly c
omm
issi
oned
ser
vice
s
Nat
iona
lly c
omm
issi
oned
ser
vice
s
Reh
abili
tatio
nse
rvic
esM
enta
l hea
lthse
rvic
esC
omm
unity
serv
ices
Sec
onda
ryca
re
Of fe
nder
heal
thca
reS
peci
alis
edse
rvic
esP
rimar
yca
re
Mon
itor
Car
e Q
ualit
yC
omm
issi
onLo
cal
Edu
catio
n&
Tra
inin
gB
oard
s
Loca
led
ucat
ion
prov
ider
s
NIC
E
Loca
lA
utho
ritie
s
Trus
tD
evel
opm
ent
Aut
horit
y
Pub
lic H
ealth
Eng
land
Hea
lthE
duca
tion
Eng
land
Dat
a &
Evi
den
ce
Mo
nito
rin
g &
Reg
ula
tio
nTr
ain
ing
&D
evel
op
men
t
Imm
unis
atio
n,sc
reen
ing,
youn
g ch
ildre
n
Fig
ure
1.2
Sou
rce:
NH
S E
ngla
nd,
2014
01_FLYNN_ASQUER_CH_01.indd 15 11/1/2016 12:59:50 PM

16 Public Sector Management
Of course, the NHS Confederation is a bargaining and campaigning body and chooses its comparators accordingly, but they are instructive. Expenditure on health as a percentage of GDP is a relevant indicator only if accompanied by some data on efficiency but one of the targets of the Blair and Brown govern-ments was to spend the European average percentage of GDP on healthcare, when the European average was around 9%. The doctor to population ratios and hospital beds per unit of population are a useful comparison of resources available and these comparisons show the UK well behind Germany and France. Length of stay may be dependent on policies on treatment, but again show dis-parities with the European neighbours.
Local GovernmentLocal government has not been subject to reorganisation in England to the same extent as the NHS. Apart from the creation of the London Authority and the London Mayoralty in 2000, the structure of the English system has been stable since the series of restructurings in the 1970s. Scottish and Welsh local govern-ment was reorganised following a review in 1995, abolishing the old system of tiered local authorities and replacing it with ‘unitary’ authorities, responsible for all services. The current set up varies by jurisdiction, with a single tier in Wales and Scotland, a single tier plus Area Boards for health and social services in Northern Ireland and mixture of single tier and two-tier authorities in England. The arrangements are summarised in Table 1.5.
At the end of 2015, 2,229,000 people were employed in local authorities in the UK, a fall of 3.4% on the previous year (Office for National Statistics, 2016). The main change to local government during the Labour governments was to the internal organisation, with a move from the use of Committees to the Cabinet system, with a smaller executive group and, where local electorates voted for it, an elected Mayor, acting in an executive capacity, unlike the largely ceremonial mayoralty in traditional local authorities.
The Coalition government proclaimed a policy of ‘localism’ but continued the direct control of local government financing and service delivery. The Conservative government made local authority expenditure reduction a priority.
Table 1.5 Local Government Structure in the United Kingdom
England46 Unitary authorities in urban areas36 Metropolitan District Councils32 London Boroughs and the Corporation of the City of London34 County Councils in rural areas238 District Councils in rural areas plus Parish and Town Councils1 Greater London Authority (Mayor and London Assembly)
Wales22 Unitary authorities
Scotland32 Unitary authorities
Northern Ireland26 District Councils9 Area Boards for Health and Social Services
01_FLYNN_ASQUER_CH_01.indd 16 11/1/2016 12:59:50 PM

The Public Sector in the UK in a Global Context 17
The system, by comparison with other European countries, gives very little autonomy to the local authorities, which are controlled both financially and mana-gerially by central government, including the governments of Wales and Scotland.
An experiment in devolution within England devolved some health and com-munity care budgets to a combination of local authorities in Greater Manchester, initially in 2011 and then with more powers in November 2014. The Greater Manchester Combined Authority was created to deal mostly with transport and economic development in 2011, but health and social care funding to the value of £6 billion was devolved from 2015 (Lowndes and Gardner, 2016).
Local Authority FundingLocal authority spending is almost all directly controlled by central government. There is a formula by which the Department of Environment calculates a spending level for each service for each local authority, the amount which the government says would provide a standard level of service (the Standard Spending Assessment or SSA). This level is then used to distribute the business rate, which is aggregated nationally and redistributed, the revenue support grant and the amount of council tax which authorities are expected to raise. Council Tax accounts on average for about 20% of local authority spending. Business rates are collected locally but pooled and redistributed according to population size. Revenue Support Grant is allocated on a formula and there are various grants dedicated to particular services, such as the Standards Fund for education and monies for such things as services for asylum seekers. Successive govern-ments increased the proportion of the total central government support that is ear-marked (‘ring-fenced’ is the normal metaphor) in this way, including education expenditure. Capital expenditure is subject to direct control, through a process of application, approval and now competition.
There has been a policy to increase the proportion of funding from retained revenue and reduce the proportion of spending financed by grants, culminating in 2016 in all non-domestic rates being retained locally.
Figure 1.3 gives a picture of the sources of revenue of local authorities in England. It shows a very centralised funding system.
Table 1.6 Budgeted net current expenditure by service for local government in England, 2015–16
£ million Net current expenditure 2015–16
Education 34,976
Highways and transport 4,922
Social care, of which: 21,779
Children and families social care 7,698
Adult social care 14,081
Public Health 3,321
(Continued)
01_FLYNN_ASQUER_CH_01.indd 17 11/1/2016 12:59:50 PM

18 Public Sector Management
Retained incomefrom BusinessRate RetentionScheme 11.8%
GovernmentGrants63.9%
Council TaxRequirement
25.0%
RevenueExpenditure£95.9 billion
Figure 1.3 Financing local government expenditure 2014–15, England
Source: Department for Communities and Local Government, 2015
Housing (excluding Housing Revenue Account) 1,742
Cultural, environment and planning, of which: 8,695
Cultural 2,496
Environmental 5,048
Planning and development 1,151
Police 10,951
Fire and rescue 2,080
Central services 3,112
Other services 281
Mandatory Housing Benefits, of which: 21,094
Rent Allowances 16,156
Rent Rebates to Non-HRA Tenants 542
Rent rebates to HRA tenants 4,396
Non-Mandatory housing benefits 10
Parish precepts 409
Levies 56
Trading account adjustments and other adjustments −339
Total net current expenditure 113,089
Table 1.6 (Continued)
01_FLYNN_ASQUER_CH_01.indd 18 11/1/2016 12:59:50 PM

The Public Sector in the UK in a Global Context 19
Direct controlsAs well as control over spending there are many aspects of policy and mana-gement through which central government controls local authorities. The legislation forcing competition determined the answer to one of the questions any organisation has to ask: how much of what we do should we consider contracting out? Changes in education legislation determined the proportion of the budget that education authorities can spend on activities other than that which goes on inside schools. Planning controls have been weakened by a process of upholding a greater proportion of appeals against local authority planning decisions. House building by local authorities has virtually stopped and housing management is subject to outsourcing.9
These direct controls have affected the way in which local authorities are managed. As individual departments and services are to a large extent controlled by regulations, managers have low discretion and are increasingly concerned with implementing national policies rather than managing the interface between local politicians and their organisations. In turn this leads to fragmentation of decision-making within the authorities.
Overall allocation of resources among the services is still subject to some local discretion. While SSAs are published for each service, these figures are only indicative. Within services decisions are circumscribed and this means that there is a reduced possibility for overall planning and management of the organisation as a corporate whole, which in any case is fragmented as a result of outsourcing. Contracts operate for a variety of services, whether they are carried out by the private sector or an in-house team. The contracting process makes the contracted parts relatively independent and subject to specific constraints. For example, if there is a five-year contract that specifies how a service is to be delivered, it is difficult to make any fundamental decisions about that service until the contract is up for renewal. The competition process also sets constraints. If the price for the contract is set through competition, management must ensure that costs are at or below the contract price. This has implications for staffing levels, wage and salary levels and, often, conditions of service: some of the major areas of managerial discretion are therefore dictated by the market, itself created by legislation and regulations.
Quangos and corporationQuango, or quasi non-governmental public body, is a term used to define those public bodies that are not elected, that are technically independent but whose members are appointed either directly or indirectly by government.
The Cabinet Office defined one category of such organisations:
A non-departmental public body is a body which has a role in the processes of national government, but is not a government department or part of one, and accordingly operates to a greater or lesser extent at arm’s length from Ministers. (Cabinet Office Agencies and Public Bodies Team, 2005: vi)
They include 211 executive Non-Departmental Public Bodies (NDPBs), 458 advisory NDPBs and 42 tribunals. As well as these, the category of quango
01_FLYNN_ASQUER_CH_01.indd 19 11/1/2016 12:59:50 PM

20 Public Sector Management
includes 26 NHS bodies and 861 NDPBs, none of which are elected, plus, school boards of governors (about one thousand grant maintained schools, accountable to the Department for Education and Employment (DfEE)) and the 650 boards of further and higher education colleges and universities. Around 21,000 people are appointed to these non-elected bodies.
In many cases the quango is legally established as a company but carries out functions which would otherwise have been carried out by a department or by local authorities. Housing Action Trusts refurbish housing and estates. The use of companies for these functions has eroded local democracy in the sense that people are appointed rather than elected; it also fragments the actions taken by the state at local level since each body carries out its own mandate.
These arrangements have important implications for managers. One results from the authority and accountability of board members. Local authority mem-bers are directly elected and have a legitimacy as a result. Paid officials are accountable to them and understand where responsibility for decisions lies. Similarly, the relationship between civil servants and ministers may cause occa-sional problems but generally people understand who is responsible for what. When working for an appointed board, the relationships are not so clear. Board members may be removed by ministers, for example, so a manager must take account of the minister’s wishes as well as the board’s. In some cases, the boards are very part-time, so their relationship with the managers is not hierarchical, as between a company board and company managers; it can be more advisory with the paid managers having most of the power. Some school boards have this relationship with head teachers.
There is another form of organisation, the Public Corporation, governed by a Board. The most visible of these is the British Broadcasting Corporation.
Shrinking State?The Coalition government from 2010 had a fiscal policy of retrenchment, as we shall see in Chapter 4. One of its aims, and of the subsequent Conservative government from 2015 was to reduce the size of the public sector and reduce the number of public sector jobs. The policy was successful in terms of numbers employed, as shown in Table 1.7.
The reduction was not proportional across the parts of the public sector.
Table 1.7 Public and Private Employment, UK 2010–2015 (,000)
Public % Private %
2010 6,317 21.5 23,008 78.5
2011 6,107 20.8 23,238 79.2
2012 5,767 19.4 23,979 80.6
2013 5,701 19.0 24,298 81.0
2014 5,417 17.7 25,265 82.3
2015 5,358 17.2 25,737 82.8
01_FLYNN_ASQUER_CH_01.indd 20 11/1/2016 12:59:50 PM
The Public Sector in the UK in a Global Context 21
2000
1600
1200
800
400
02000 2002 2004 2006 2008 2010 2012 2014
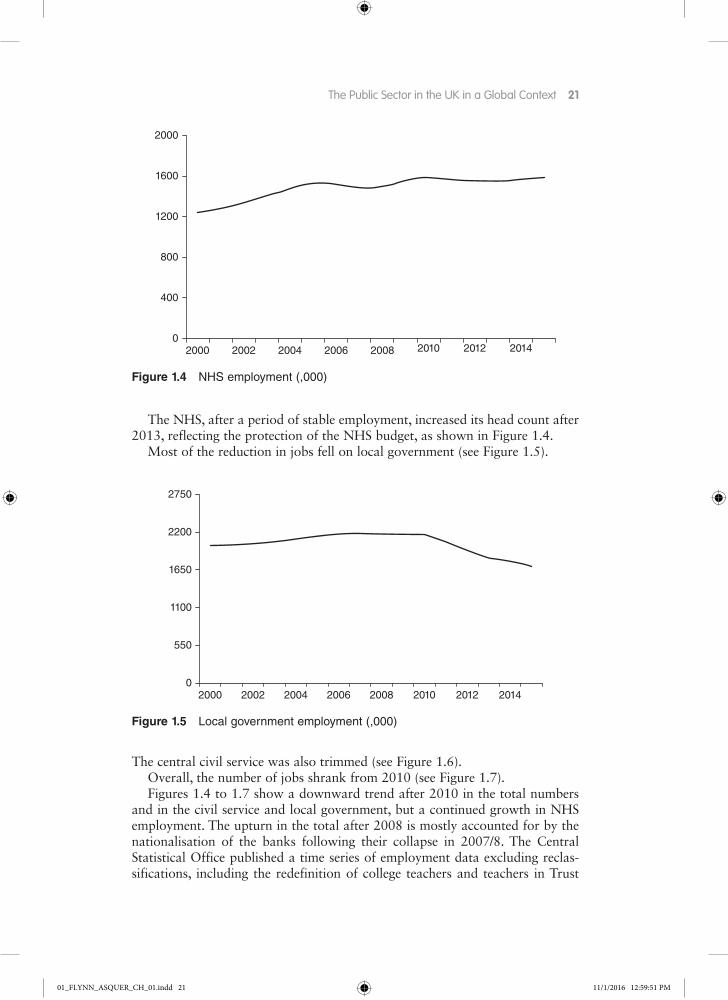
Figure 1.4 NHS employment (,000)
The NHS, after a period of stable employment, increased its head count after 2013, reflecting the protection of the NHS budget, as shown in Figure 1.4.
Most of the reduction in jobs fell on local government (see Figure 1.5).
2750
2200
1650
1100
550
02000 2002 2004 2006 2008 2010 2012 2014
Figure 1.5 Local government employment (,000)
The central civil service was also trimmed (see Figure 1.6).Overall, the number of jobs shrank from 2010 (see Figure 1.7).Figures 1.4 to 1.7 show a downward trend after 2010 in the total numbers
and in the civil service and local government, but a continued growth in NHS employment. The upturn in the total after 2008 is mostly accounted for by the nationalisation of the banks following their collapse in 2007/8. The Central Statistical Office published a time series of employment data excluding reclas-sifications, including the redefinition of college teachers and teachers in Trust
01_FLYNN_ASQUER_CH_01.indd 21 11/1/2016 12:59:51 PM

22 Public Sector Management
5400
5175
4275
4050
4725
4950
4500
38252000 2002 2004 2006 2008 2010 2012 2014
Figure 1.7 Total public sector employment (,000)
600
450
300
150
02000 2002 2004 2006 2008 2010 2012 2014
Figure 1.6 Civil service employment (,000)
Academy schools to the private sector and the definition of nationalised bank staff as well as the transfer of Royal Mail status to private sector. The resulting table is shown in Table 1.8.
Table 1.8 shows peak public sector employment in 2005, and a reduction over the following decade of 42,600 or 7.5%, almost all of the reduction occur-ring under the Coalition and Conservative governments from 2010. In 2015 public sector jobs accounted for 17% of the total jobs in the United Kingdom.
ConclusionsWe have seen that the public sector in the United Kingdom has a large number of varied institutions, and that the forms of organisation are different in each of the constituent countries. Governments have used structural reorganisation as a
01_FLYNN_ASQUER_CH_01.indd 22 11/1/2016 12:59:51 PM

The Public Sector in the UK in a Global Context 23
Table 1.8 Public employment without the effects of reclassification, UK
Year Thousands of employees
2000 5,089
2001 5,178
2002 5,269
2003 5,466
2004 5,588
2005 5,688
2006 5,660
2007 5,615
2008 5,594
2009 5,660
2010 5,668
2011 5,484
2012 5,364
2013 5,319
2014 5,306
2015 5,262
Source: Central Statistical Office, 2016
way of trying to bring about change, especially in the NHS and the civil service. These changes have important implications for managers in the public sector as they have to respond frequently not just to new structures but to new govern-ance arrangements.
Further Reading
June, B. and Piper, R. (2008) Britain’s Modernised Civil Service. London: Palgrave Macmillan. A history of the process and structural changes in the UK civil service.
Ham, C. (2009) Health Policy in Britain. London: Palgrave Macmillan. Christopher Ham has been a lifelong student of health policy and organisation in the UK.
Wilson, D. and Game, C. (2011) Local Government in the United Kingdom. London: Palgrave Macmillan. Analysis of the politics and organisation of local government.
Deacon, R. and Sandry, A. (2007) Devolution in the United Kingdom. Edinburgh: Edinburgh University Press. Looks at the process of devolution and the impact on policy differences in the devolved administrations.
(Continued)
01_FLYNN_ASQUER_CH_01.indd 23 11/1/2016 12:59:51 PM

24 Public Sector Management
Discussion Points
• Why are certain activities and services in the public sector and others in the private sector?
• Why do governments keep trying to make structural changes to the public sector?
• Are local authorities autonomous bodies?
Notes1. Prescriptions are free in Wales and Northern Ireland.2. There was a brief period during which defendants had to pay court fees, but this
was reversed after protests and resignations by magistrates.3. In 2015 there were 450,000 residents in care homes and nursing homes in England,
of whom fewer than 1000 lived in local authority care homes (NICE briefing, 2015).4. Scotland Act 1998, Schedule 5.5. Government of Wales Act 2006, Schedule 5.6. Northern Ireland Act, 1998, Schedule 2 Excepted matters, Schedule 3 Reserved
matters7. For details of government bodies and their functions, go to Public Bodies, published
periodically by the Cabinet Office. Figures here come from the 2014 edition.8. Civil Service Order in Council 1991 extended departmental and agency responsibilities
for staff to 95% of recruitment. Civil Service (Management Functions) Act 1992 gave delegated authorities to Agencies and office holders in charge of departments.
9. This choice has a measure of local democratic control – tenants can vote for outsourcing or to stay with local authority management.
(Continued)
01_FLYNN_ASQUER_CH_01.indd 24 11/1/2016 12:59:51 PM