Embed Size (px)
Citation preview

C E N T E R O N J A P A N E S E E C O N O M Y A N D B U S I N E S S
Working Paper Series February 2017, No. 1
This paper is available online at www.gsb.columbia.edu/cjeb/research
C O L U M B I A U N I V E R S I T Y I N T H E C I T Y O F N E W Y O R K
PROGRAM ON PUBLIC PENSION AND SOVEREIGN FUNDS
Public Sector Investment Funds: How the Best-in-Breed Evolved
Andrew Rozanov

Public Sector Investment Funds:
How the Best‐in‐Breed Evolved
Andrew Rozanov
Telephone: +44 75153 92910
E‐mail: [email protected]
Abstract
This paper looks at the evolution of ten public pension and sovereign wealth funds which have been
on the cutting edge of innovation and best practice with respect to governance and investment
management. The analysis is based on an inductive approach, proceeding from specific observations
to general principles. In particular, we review ten case studies of individual funds from three regions
– Northern Europe, Canada and Australasia. We look at three funds in Canada and one each in
Australia, the Netherlands, Denmark, Norway, New Zealand, Singapore, and Sweden, using the same
template for each entity.
We start with a brief description of the fund and explicate its liability profile, covering the source of
funding and the intended use for the assets. We then review the fund’s current governance
arrangements, with a particular emphasis on how these may have helped or hindered the fund’s
investment professionals in their activity. We then look at the evolution of the fund’s investment
strategy, focusing in particular on asset allocation and portfolio construction. We conclude each case
by highlighting a feature unique to the fund in question, which we believe is worthy of further study
and emulation by their less advanced peers.
At the end, we bring all of these separate strands together, with a view to formulating some general
observations about how the best‐in‐breed public pension and sovereign wealth funds within our
universe have evolved with respect to governance and investment strategy. Specifically, we try to
determine whether the ten funds in question have been converging onto one model, or whether their
experiences suggest increasing divergence. This section can effectively be viewed as a distillation of
some preliminary recommendations for the less advanced funds, based on what we believe to be an
emerging consensus around ‘best practice’ in public sector fund management.

2
Introduction
This paper looks at the evolution of ten public pension and sovereign wealth funds which have been
on the cutting edge of innovation and best practice with respect to governance and investment
management. It builds on the author’s previous paper on this subject, which was published in the
Asian Economic Policy Review journal in July 2015.1 In that paper, we posed a simple question: if one
were to start from a blank page, unburdened by any legacy issues or constraints, how would one go
about building an ‘ideal’ pension fund? We tackled that question in a deductive manner, working from
general principles to specific conclusions. We reviewed the core principles of good governance and
discussed the need to formulate a set of explicit and coherent investment beliefs. We then proceeded
to compare and contrast three stylised models of institutional fund management – the Norway model,
the Yale Endowment / Australia Future Fund model, and the Canada model.
We demonstrated that Norway stood out in terms of the highly political nature of its governance
process and a strong preference for broad exposures to public markets and liquid securities, whereas
the other two models were characterised by independent boards and strong preferences for private
markets and illiquid securities. At the same time, the Yale/Australia model stood out in its explicit
preference for small internal teams outsourcing most investment activity to external managers,
whereas the Norway and Canada models clearly opted for the opposite approach, in‐sourcing as much
as possible. While these three models can serve as a useful analytical shorthand when reviewing and
assessing the practice of institutional fund management at different organisations, as any model they
are necessarily reductive, and should therefore be applied judiciously.
In this paper, we expand and build on that analysis, but we take the opposite approach: in an inductive
manner, we proceed from specific observations to general principles. Namely, we look at ten case
studies of individual funds from three regions – Northern Europe, Canada and Australasia – to
formulate some recommendations for those public pension and sovereign wealth funds which may be
looking for ways of closing the gap with the best in their industry. We look at three funds in Canada
and one each in Australia, the Netherlands, Denmark, Norway, New Zealand, Singapore, and Sweden.
But what dictates our choice of the ten funds, and why focus on the three geographical regions?
Part of the answer is simply that the three regions in question map neatly onto the three stylised
models of institutional fund management mentioned above. But the decision was also informed by
the author’s twenty years of experience working with global institutional investors. While one can
easily identify highly sophisticated, well governed and very capable public pension and sovereign
wealth funds in other parts of the world, somehow the three regions in question appear to have a
disproportionate share of cutting‐edge public sector investment organisations. This observation is
corroborated by other, more knowledgeable and experienced practitioners, such as Keith
Ambachtsheer, the renowned Canadian pension fund ‘guru’, who in his many books and articles
repeatedly invokes the cases of Australia, Canada, Denmark, the Netherlands and Sweden as being at
the forefront of an ongoing ‘pension revolution’.2
For the more analytically inclined readers, who prefer hard numbers and objective rankings to years
of subjective experience, one can point to the annual Melbourne Mercer Global Pension Index, which
has been published since 2009 through a collaboration between Mercer, a global leader in investment
consulting, and the Australian Centre for Financial Studies (ACFS), an independent not‐for‐profit

3
research centre, with funding provided by the Victorian Government. The index ranks and compares
retirement income systems in 25 countries, encompassing a diversity of pension policies and practices.
It benchmarks each country’s retirement system using more than 40 indicators and is comprised of
three sub‐indices, covering measures of pension adequacy, sustainability and integrity. Ever since
being included in the index in 2012, Denmark has consistently occupied the top spot, followed closely
by the Netherlands and Australia, who normally round up the top 3. Sweden has consistently ranked
in the top 5, with Canada coming in close behind every year.3
Clearly, there is something unique about the three regions in question, which results in the best‐
ranked retirement income systems and a concentration of best‐in‐class public sector investment
organisations. But what might be the secret formula behind this impressive accomplishment?
Exploring this question in detail is beyond the scope of this paper and deserves a dedicated research
project all on its own. However, there is one hypothesis which we would like to put forward as our
small contribution to this debate. Specifically, we believe there are three interconnected reasons. First,
all three regions have very strong legal, regulatory and institutional frameworks which act as critical
enablers for large public sector investors. There are many jurisdictions around the world which would
envy the rule of law and the highest levels of transparency, predictability and pragmatism that
characterise these three regions.
However, one might wonder as to why the United States and the United Kingdom, which have similarly
strong legal, regulatory and institutional enabling environments, are not on our list. This is where the
other two reasons come into play: a fundamental distrust of government and the overwhelming
attractiveness of New York and London as global financial centres. Whereas in the three regions in
question there appears to be a strong consensus and belief in the ability of governments (and the
public sector more broadly) to establish and operate non‐commercial entities in a highly effective and
efficient manner, in the United States, and still to some degree in the United Kingdom4, the prevailing
view seems to be that governments are simply too bureaucratic, inefficient and politically conflicted
to be trusted with managing money.
The best illustration of this attitude was provided at the turn of the millennium by Alan Greenspan,
Chairman of the Federal Reserve at the time, who famously spoke against the idea of entrusting the
US government with preserving and investing the accumulated fiscal surpluses, opting for tax cuts
instead. In his testimony to Congress on 2 March 2001, he opined: “A major accumulation of private
assets by the federal government…would make [it] a significant factor in our nation’s capital markets
and would risk significant distortion in the allocation of capital to its most productive uses… I doubt
that it is possible to secure and sustain institutional arrangements that would insulate federal
investment decisions from political pressures.”5
As for the attractiveness of New York and London, with their lucrative private sector career
opportunities and a genuinely global scope, it is difficult for public sector investors to attract and retain
top talent. In contrast, their peers in Canada, Northern Europe, Australia and New Zealand have an
advantage: while they also compete for talent and have to accept the reality of not always being able
to match the pay scales of local private sector firms, most career opportunities offered by the latter
tend to be domestic, or at most regional in scope. Therefore, talented individuals who prefer to stay
in their hometowns of Toronto, Montreal, Oslo, Gothenburg, Copenhagen, Melbourne or Auckland,

4
but who also want a rewarding career in financial markets with a truly global reach and scope, may
have better opportunities at local public pension and sovereign wealth funds.
Whether or not the above hypothesis is correct, the fact remains that the three regions in question
are generally considered to be at the forefront of public sector investment excellence, and so it would
be logical for us to focus on them in this paper. But what accounts for our choice of the ten individual
funds? After all, there are so many best‐in‐class public funds in these countries that we could have
easily chosen a completely different sample of ten or more organisations and still managed to convey
essentially the same message. Let us explain the logic behind our selection.
First, throughout the paper, we occasionally refer to the analytical shorthand discussed earlier – the
three stylised models of institutional fund management. Therefore, it would be logical to include the
individual funds behind these models, namely, the sovereign wealth funds of Norway and Australia.
As for the Canada model, which is based on the collective experience of the ten largest Canadian public
sector funds, we decided to include the three largest entities on that list, which collectively account
for more than half a trillion US dollars in assets. This should be sufficient to illustrate both the
similarities among them that allow one to talk about the Canada model, but also the diversity of
approaches within it.
Secondly, we wanted to have a reasonable representation of both public pension funds and sovereign
wealth funds within our sample. Therefore, in addition to the two sovereign wealth funds from
Norway and Australia, we included one entity from New Zealand and one from Singapore. The choice
of the remaining three public pension funds – from Denmark, the Netherlands and Sweden – provides
a reasonable geographical spread, while also maintaining a fair balance across the three areas.
However, in one sense, the choice of individual entities was entirely arbitrary, in that it was based on
the author’s knowledge of these funds and his close interactions with some of them, which brings us
to the third deciding factor.
The target audience for this paper is practitioners – public pension and sovereign wealth fund
managers, policymakers, and financial market experts who advise and work with these institutions. As
we proceed in an inductive manner, from specific case studies to general principles, we thought it
might be useful in the discussion of each individual fund to focus on one particular aspect of its
operations which, in our view, is unique to that fund and which might provide a helpful hint – or
possibly even a ready‐made template – for its less advanced peers as they strive to evolve and catch
up. For example, among the Danish, Dutch and Swedish pension funds, we chose to focus on ATP, APG
and AP2, respectively, for the simple reason that the author’s knowledge of, or experience of working
with, these funds is more extensive and, as a result, it is possible to identify at least one unique feature
at each of these entities to highlight in the respective case studies. This is essentially how we arrived
at our universe of ten best‐in‐breed funds.
Before proceeding to the case studies, let us briefly describe the template which we will use for each
individual fund. We start with a brief description of the fund and then review its liability profile,
covering the source of funding and the intended use for the assets. We then review the fund’s current
governance arrangements, with a particular emphasis on how these may have helped or hindered the
fund’s investment professionals in their activity. We then look at the evolution of the fund’s
investment strategy, focusing in particular on asset allocation, portfolio construction and portfolio‐
wide risk management. We conclude each case study by highlighting the aforementioned unique

5
feature of the fund in question, which we believe to be sufficiently attractive for other funds to study
and potentially emulate.
In the concluding part of the paper, we bring all of these separate strands together, with a view to
formulating some general observations about how the best‐in‐breed public pension and sovereign
wealth funds within our universe have evolved with respect to governance and investment strategy.
We use the analytical shorthand of the three stylised institutional models to determine whether the
ten funds in question have been converging onto one model, or whether their experiences suggest
increasing divergence. This section can effectively be viewed as a distillation of some preliminary
recommendations for the less advanced funds, based on what we believe to be an emerging
consensus around ‘best practice’ in public sector fund management.
Case Study #1: Norway’s Government Pension Fund – Global (GPF‐G)
In terms of assets under management (AUM), Norway’s fund is one of the largest – if not the largest
– sovereign wealth fund (SWF) in the world.6 It is certainly, and by far, the largest fund in our sample
of ten entities. At the end of June 2016, the market value of its assets was reported at 7,177 billion
Norwegian kroner, which was equivalent to US$ 854 billion. The enabling legislation for the fund was
passed by Norway’s parliament in 1990, but the first allocation was made only in 1996. However,
growth in the fund’s AUM since then has been nothing short of spectacular, so at the time of writing
in October 2016, the country has had 20 years of experience running a fast‐growing and increasingly
eye‐catching pool of public money.
The fund was originally set up for transparent and efficient management of Norway’s excess revenues
from oil exports, with a view to macroeconomic stabilisation and budget revenue smoothing. This was
reflected in the fund’s original name – Government Petroleum Fund – as well as the fact that its
management was delegated from the start by the Ministry of Finance to the central bank, which by
that time had accumulated relevant experience managing Norway’s foreign exchange reserves.
However, due credit must go to the local policymakers for having realised early on that with the
expected long‐run trajectory in the oil prices, the fund would likely grow at a very rapid pace, so in
addition to its original macroeconomic objectives, long‐term savings and inter‐generational wealth
transfer also became an explicit and important part of the fund’s mandate.
In fact, it is the increasing importance over time of this particular objective which, in our view, has
driven the evolution of Norway’s SWF with regard to investment and risk management over the
previous two decades. In contrast, its governance arrangements have not evolved at all during the
same period, and as we explain below, it is this tension that at least in part appears to be constraining
Norway’s ability to construct and manage its portfolio in a way that would be considered optimal for
a genuinely unconstrained, long‐term institutional investor.
Liability Profile
The source of funding for Norway’s SWF is clear: annual revenues accruing to the government from
hydrocarbon exports. From the outset, the philosophical foundation for the fund has also been clear:
this natural endowment belongs to all Norwegians, both current and future generations, and so it
must be managed prudently and equitably. But what did it mean in practice? First, given the volatility
of oil prices and the limited absorptive capacity of the local economy, the oil money should not be

6
allowed to overwhelm domestic spending, potentially leading to so‐called ‘Dutch disease’ and various
macroeconomic imbalances. Secondly, a mechanism had to be found whereby the current generation
could reliably and demonstrably benefit from oil revenues, but at the same time sufficient amounts
of oil wealth would be saved for future generations.
Norway’s answer was to design its SWF as a perpetual endowment fund, well integrated into the
broader fiscal framework via the so‐called ‘Fiscal Rule’. In the first instance, all government revenues
from oil exports pass through the budget, but go straight into the SWF account. Subsequently, an
annual transfer of a predetermined size goes from the SWF into the annual budget, covering what is
called the ‘non‐oil structural budget deficit’. This annual transfer is a function of the size of the fund
and the expected long‐term real return on its assets, which is currently set at 4%. Effectively, Norway
has been transforming its non‐renewable oil wealth into a growing portfolio of financial assets,
generating annual returns. In principle, as long as annual budget transfers, which benefit the current
generation of Norwegians, do not consistently exceed actual real returns on the fund, the inflation‐
protected principal remains intact to continue benefiting future generations.
So the liability profile of Norway’s SWF, in terms of both sources and uses of funds, is quite
straightforward: the inflows come from the government’s share of oil export revenues and,
increasingly, financial returns on the accumulated assets, while the outflows are based on the annual
budget transfer rule, corresponding to 4% of the AUM of the fund. But one question remains: why
was the fund renamed in 2006 from a ‘petroleum fund’ to a ‘pension fund’? After all, it is neither
sourced from pension contributions, nor is it managed to meet any particular future pension liability.
To understand the logic and motivation behind this name change, we now turn to the fund’s
governance arrangements.
Governance Arrangements
As discussed in Rozanov (2015), one peculiar feature of the Norway Model is the highly political nature
of its governance set‐up. Instead of opting for an arms‐length, independent board of trustees to
insulate the fund from short‐term political pressures, the Norwegians decided to put the fund front
and centre of the political process. The fund is managed by a dedicated investment arm of the central
bank, which acts as an agent for the government. The investment team reports to the Governor of the
central bank, who answers to the Minister of Finance, who in turn is a politician, accountable to the
Prime Minister and ultimately to Parliament. It cannot get more political than this!
This governance system has not materially changed over the last twenty years. In our view, its highly
political nature has had some unintended negative consequences. First, let us consider the episode
with the name change. As the fund was dramatically growing in size, there were increasing calls from
some segments of the Norwegian society to reconsider at least some aspects of the fund’s operations,
so as to allow more government spending. Had the fund been insulated from day‐to‐day politics in the
same way as its peers in Canada, Australia or New Zealand, this would not have presented an
immediate threat. But in Norway’s case, if these siren calls for a more generous spending policy had
gathered enough political backing in Parliament, the fund would have been potentially exposed.
The officials in charge of the fund went out of their way to persuade the electorate that increasing
spending out of the fund was the wrong policy choice. As part of these concerted efforts to sway public
opinion, the name of the fund was changed from ‘petroleum fund’ to ‘pension fund’, and the

7
explanation was disarmingly simple: psychologically, it would be much harder for the proponents of
increased public spending to argue their case if the underlying assets were broadly perceived as
‘pension money’ as opposed to ‘oil money’. In other words, the name change had nothing to do with
the fund’s actual liability profile or investment strategy – it was a diversionary tactic to win a political
argument over public spending policy.
It must be said that, in and of itself, there has been no discernible impact on the fund’s operations
from this name change, so we do not want to belabour the point. But it does seem quite ironic that
Norway’s politicians and policymakers, who take pride in their democratic credentials and who go to
great lengths to extol the virtues of direct accountability of the fund to Norwegian voters, had to revert
to a diversionary tactic rooted in nothing more than semantics and human psychology. Since then,
Norway’s SWF, which is effectively a perpetual endowment fund, happens to be masquerading as a
pension fund for reasons of political expediency. In our view, this is a direct result of Norway’s choice
of governance model. But it is the other unintended consequence of this choice which appears to have
a much more real – and increasingly material – negative impact on the fund. To explain what we mean,
we now look at the evolution of the fund’s investment strategy.
Investment Strategy
Norway’s fund is managed on the basis of an explicit set of six core investment beliefs, formulated by
the Ministry of Finance:
(1) markets are largely efficient and difficult to outperform on a consistent basis;
(2) risk premia and diversification are the main determinants of long‐term performance;
(3) economies of scale are critical to lowering costs and managing the fund efficiently;
(4) asset classes and strategies with limited capacity are impractical due to size limitations;
(5) principal‐agent problems necessitate proactive shareholder engagement;
(6) negative externalities (e.g. environmental impact) must be fully addressed.7
So what is the result of applying these investment beliefs to a very large, government‐owned fund
with an inter‐generational investment horizon, low short‐term liquidity needs and no clearly defined
liabilities? Some implications are fairly obvious and not particularly controversial. For example,
generating returns by exposing the fund to a diversified set of risk premia is the foundation of modern‐
day long‐term capital management. Also, a clear preference for internal versus external management
allows one to partake in economies of scale, lowers costs, and mitigates principal‐agent problems.8
Finally, a strong emphasis on corporate governance and active ownership as a way of improving long‐
term returns is also widely acknowledged and commonly practiced. As we shall see later, most of
Norway’s peers examined in this paper apply these principles and practices.
But there are two aspects of Norway’s approach to investment management which stand out in
comparison to all of its peers and which come across as highly unusual: a distinct preference for highly
liquid securities traded in public markets and the excruciatingly slow progress in making changes to
its asset allocation. The best way to illustrate these two points is to take a closer look at Norway’s
underlying benchmark and its evolution over time. By definition, a benchmark describes a fund’s long‐
term preferences with respect to sources of return and levels of risk, so by tracing its evolution over
time we can also see how such preferences changed throughout the years.

8
In 1998, after two years of investing the entire amount in a highly conservative fixed income portfolio,
the decision was made to adopt a strategic benchmark with a large allocation to equities. After a highly
competent and efficient programme to implement these changes, for the next 8 years the fund’s
underlying benchmark contained 60% fixed income and 40% equities, initially in developed markets,
but since 2000 with a meaningful and gradually expanding allocation to emerging markets as well. In
2002, corporate and securitised bonds were added to the fixed income benchmark, while in 2007
small‐cap companies and in 2008 all emerging markets were added to the equities benchmark.
[Insert Figure 1]
Also, in the midst of the financial crisis of 2007‐08, and after many years of deliberations and lobbying
by the investment management team, the Ministry of Finance finally approved an increase in the long‐
term risk profile of the fund to a new benchmark of 60% equities and 40% bonds.
[Insert Figure 2]
It also approved a 5% allocation to direct real estate investments, funded out of the fixed income
portfolio, which marked the first time ever the fund was allowed to expand its universe into illiquid
assets traded in private markets. However, the first real estate investment was executed in 2010, and
the overall progress has been excruciatingly slow: at the time of writing in October 2016, the 5%
allocation target has not yet been filled.9
[Insert Figure 3]After reviewing the evolution of Norway’s strategic benchmark during the last 20 years,
we have two major observations. On the positive side, once the explicit link was made early on
between the fund’s role as a long‐term savings vehicle and the need to make a meaningfully large
allocation to risk assets, the investment team in charge of the fund made rapid progress, as they
expanded – in a highly methodical and efficient way – from developed into emerging markets, from
government bonds to corporate and securitised debt, and from large‐cap to mid‐ and small‐cap
companies. They also realised early on the need to increase the long‐term level of risk, and to add
meaningful allocations to illiquid assets, lobbying hard and seeing some success with real estate in
2007‐08, as explained above.
But on the negative side, it is undeniable that, for all its competence and professionalism, the fund
has lagged behind most of its peers by completely missing out on any and all opportunities to earn the
illiquidity premium, despite being ideally positioned to do so. During 20 years since inception in 1996,
Norway’s fund has been invested either exclusively or, since 2010, overwhelmingly in the most liquid
end of the capital markets spectrum, thus effectively paying for liquidity it did not need. Or here is
another way of looking at it: while the fund invests in liquid claims on existing productive assets, it
effectively denies itself the opportunity to benefit from deploying at least part of its capital to create
new productive assets.
In a private conversation with a senior Norwegian official back in 2006, the author posed the following
question: “For a fund which prides itself on a uniquely long investment horizon and the ability to earn
various risk premia, why would it choose to pay for liquidity it does not need?” The answer was
illuminating, as the official explained that it all had to do with governance: unless and until the
Norwegian parliament and the general public can be convinced to allow the investment team to

9
expand into illiquid assets and private markets, nothing could be done. At the time of writing 10 years
later, approximately 97% of the fund’s AUM was still invested in liquid assets traded in public markets.
Unique Feature
After expressing some of our long‐held criticisms of the fund’s governance approach and how it may
be constraining Norway’s ability to manage assets more efficiently, the unique aspect of the fund we
chose to highlight here is perhaps the only feature of its governance model which, in our view, is
genuinely more efficient – and compares more favourably to many of its peers – in terms of enabling
better investment management. The Council on Ethics is an independent entity, operating under the
ethical guidelines provided by the Ministry of Finance, which makes recommendations to the central
bank on which companies should be put under observation or altogether divested from the portfolio.
This covers two types of exclusion criteria: product‐based (e.g. tobacco or nuclear weapons) and
conduct‐based (e.g. gross corruption or environmental damage).
While many of Norway’s peers, including those reviewed in this paper, fully engage in responsible
investment practices, there is always a risk of confusing the financial case and the ethical case for
doing so. The former argues for incorporating environmental, social and governance (ESG) factors into
the broader analytical tool‐kit of the investment team and focusing purely on long‐term risk and return
considerations. The latter argues that some investments simply should not have a place in a public
investor’s portfolio, irrespective of risk and return considerations. By having the Council on Ethics,
which is completely separate and independent from the investment team, analyse and argue the
ethical case for exclusion, Norway’s governance system achieves a much cleaner distinction and a
better delineation of responsibilities and accountability.
For example, if tobacco companies had been excluded on purely ethical rather than financial grounds,
but were shown to have subsequently outperformed the market on the relevant time horizon, then
the ownership of the original decision must clearly lie with the Council on Ethics rather than the
investment team. In this respect, Norway’s governance model is exemplary and could be used as a
template by other public pension and sovereign wealth funds.
Case Study #2: Sweden’s AP2 Fund
AP2 is one of the five so‐called ‘buffer funds’ which are the cornerstone of Sweden’s national pension
fund system. At just over 300 billion Swedish kronor (US$ 35.9 billion), it is the third largest of the five,
having grown from the initial capital allocation of 134 billion Swedish kronor (US$ 19.7 billion) in 2001.
The funds were created as part of a broader pension reform, legislated into law in 1998 and seeded
with an equal amount of assets in early 2001, initially comprising Swedish government bonds and
Swedish equities. The funds’ boards, appointed by the government, were tasked with independently
designing their respective long‐term investment strategies, based on their own interpretation of a few
basic principles enshrined in the new legislation.
Fundamentally, the roles and objectives of all AP funds are derived from the unique nature of
Sweden’s pension system, which is sometimes described as a notional defined contribution pay‐as‐
you‐go system. Each of the four largest AP funds receives a quarter of the total annual income‐based
pension contributions, and at the same time each finances a quarter of all income‐based pension
disbursements. If the former exceed the latter, the funds accumulate savings, but in the opposite

10
scenario, they cover the shortfall from their capital – hence the term ‘buffer funds’. However, there is
one additional feature unique to the Swedish pension system which the funds must take into account
when planning their long‐term investment strategies.
The totality of Sweden’s economic resources available to pay current and future pension benefits
broadly falls into two categories: so‐called ‘contribution assets’ and the financial assets managed by
the AP funds. The former reflect the value of all future pension contributions, which are determined
by broad economic and demographic forces. For example, shorter term macroeconomic cycles will
determine whether there are more or fewer gainfully employed Swedes making regular pension
contributions. Even more important are longer term demographic trends related to ageing, birth rates
and immigration, since they will determine the dynamics of the labour force, as are structural trends
like productivity growth, since in the long run it is the only sustainable source of increases in incomes
and, by extension, pension contributions. To put things in perspective, at the time of writing in October
2016, these ‘contribution assets’ constituted 86% of the total asset base, with the AP funds accounting
for the remaining 14%.
One of the key features of Sweden’s modern‐day pension system, which makes it sustainable and fair
across generations, is the so‐called ‘balancing rule’ and the ability to apply a ‘brake’ to pension
indexation. In principle, how much in pension benefits a Swedish citizen earns over the years is a
function of how much he or she contributes into the system, which in turn depends on length of
service and income levels. What this means for the pension system as a whole is that benefits are
effectively indexed to growth in the average income, unless there is a system‐wide problem which
makes such indexation no longer affordable. What might constitute such a problem? Total liabilities
exceeding total assets would be the clearest indication of an unsustainable situation. For such
eventualities, the ‘balancing rule’ kicks in, putting an automatic ‘brake’ on any indexation until the
asset‐liability shortfall has been resolved. Taking full account of this unique feature is critical for AP
funds in their long‐term planning.10
Liability Profile
At first glance, the source of funding for AP2 appears relatively straightforward: in 2001, together with
its peers, it received a portfolio of legacy assets comprising domestic government bonds and stocks,
which it has long since restructured and on which is has been generating solid annual returns. Another
seemingly obvious, and potentially even more important, source of funding for AP2 would be its equal
share of annual income‐based pension contributions. The intended use of funds also appears
straightforward: just like its peers, every year AP2 pays out its equal share of income‐based pension
benefits. However, the highly unusual nature of Sweden’s pension system design, which combines the
features of defined contribution and pay‐as‐you‐go systems, as well as its unique ‘balancing rule’ and
indexation ‘brake’, complicates the picture and makes estimation of liability profiles at the AP funds
non‐trivial. It is all the more so, given that each AP fund is allowed to make its own independent
interpretations of the rules in the pension legislation.
For AP2, the starting point is a proprietary asset‐liability model, which is used to forecast the likely
long‐term developments in the overall pension system and the broader economy. The assumptions
regarding demographic and general economic trends are critical, since they determine the expected
future trajectory of ‘contribution assets’ and pension liabilities. In the event of disbursements
exceeding contributions, AP funds will need to maintain sufficiently liquid payment reserves to cover

11
the outflows. Naturally, AP2 and its peers stand ready to fulfil their obligation as ‘buffer funds’ to
smooth out benefit payments in such an eventuality. However, once total assets drop below total
liabilities, the ‘balancing rule’ automatically kicks in and the indexation ‘brake’ is activated. While this
helps mitigate the pressure on AP funds and promotes inter‐generational equity, from the point of
view of Swedish pensioners, it is a direct risk to their well‐being and as such is best avoided altogether.
This interpretation of its liability profile has led AP2 to conclude that its long‐term investment focus
must be determined with a view to avoiding, as far as possible, activating the ‘brake’.
Governance Arrangements
The AP funds are more independent than most other Swedish government entities, since their
operations are regulated only by statute and not by government directive. Sweden’s national pension
legislation provides the AP funds with a governance model centred on arms‐length, independent
boards of directors, not that dissimilar to governance arrangements at public funds in Australia,
Canada and New Zealand. Just like at other AP funds, there are nine members of the board at AP2,
appointed by the Swedish government on the basis of their competence. Two directors are appointed
from nominees of employee organisations and two from nominees of employer organisations,
whereas the government appoints the Chairman and Deputy Chairman from its own nominees. The
government’s policy stipulates that no director may hold board membership for more than 8 years.
As already mentioned, boards of directors at AP funds are fully independent in how they choose to
interpret their mandates based on the legislation, how they determine their respective liability profiles,
and how they subsequently translate all this into actionable investment strategies. Boards are also
independent in the formulation and implementation of remuneration policies, which has helped funds
develop at least some awareness of how their pay scales stack up against what financial professionals
can earn in the private sector. If there is one potential criticism that one could level at the governance
setup at the AP funds, it is that there do not seem to be any constraints on the Swedish government
from dismissing any director from an AP fund’s board. However, so far this potential vulnerability has
not been tested yet.
In fact, the notion of board independence from government influence passed a critical test and was
reaffirmed in 2015, when the Chairmen and Chief Executive Officers of AP1, AP2, AP3 and AP4 – in a
rare show of solidarity – formulated a collective public response to attempts by the Ministry of Finance
to overhaul the pension system by shutting down two AP funds, thus reducing their number and
consolidating the remaining entities. The ministry had also planned to create a National Pension Fund
Board to coordinate the investment activities of the remaining AP funds. The boards and executive
teams at the AP funds argued that the proposed alternative governance structure was opaque and
bureaucratic, while the proposed two‐year transition process would risk distracting the investment
teams from single‐mindedly pursuing their long‐term investment objectives. More importantly, they
argued that the alternative structure would increase the risk of government meddling in the
investment process. In December 2015, the ministry was forced to withdraw the proposal, postponing
it ‘indefinitely’.11
Investment Strategy12
From the outset, the board and senior management of AP2 formulated a strong view that the fund’s
investment policy should have a return‐focused bias, even at the cost of higher risk and portfolio

12
volatility. This was the direct result of two major considerations. First, based on long‐term economic
and demographic trends and the output of the proprietary ALM model, the fund clearly had the
advantage of a very long investment horizon, thus having sufficient capacity to bear higher financial
risks.13 Secondly, AP funds were the only way for the public pension sector to gain direct exposure to
financial markets, but given that their collective weight was only 14% of the total pension ‘assets’, in
order to move the proverbial needle the funds would need to target materially higher long‐term
returns by taking on higher risk.14 So at inception, the decision was made to increase the allocation to
equities and to move away from the initial ‘home bias.’
Before we look at the evolution over the years of strategic asset allocation and the underlying portfolio
of AP2, it may be helpful to briefly review the fund’s fundamental investment beliefs and the set of
constraints within which it must operate by law. With respect to the former, the fund places enormous
emphasis on efficiently harvesting long‐term risk premia by constructing a well‐diversified portfolio:
it expects that some 90% of long‐term returns will be derived from the broad market exposures of its
strategic benchmark, with the remaining 10% coming from active management. AP2 also strongly
believes that its long‐term investment horizon allows it to take higher risks and to invest in a broader
range of asset classes, including illiquid assets. Another core belief focuses on the ability to add value
over the long term by practicing active governance.
As for constraints imposed by law, in addition to the usual and relatively uncontroversial caps on
holdings in individual issuers or groups of related issuers, there are five constraints which, in our view,
are potentially questionable and which therefore deserve to be mentioned separately. First, AP funds
must invest at least 30% of their assets in fixed income securities with low credit and liquidity risk. In
addition, the fund’s currency risk exposure may not exceed 40% of total assets. Also, at least 10% of
the fund’s assets must be managed by external managers. What is the rationale for imposing such
specific and explicit hard limits? Wouldn’t it be more in line with the spirit of the pension reform that
created AP funds in the first place to trust their respective boards and executive management to
independently determine such limits based on their interpretation of their mandates and the state of
the financial markets?
The other two constraints raise even more questions: by law the AP funds cannot invest in any
commodity‐related instruments and they cannot invest more than 5% in any unlisted securities.
Moreover, with respect to the latter, they are not allowed to invest directly, but only through third‐
party funds. However, somewhat arbitrarily, this rule does not apply to investments in real estate. It
is very difficult to see what benefits, if any, come from these restrictions, but it is perfectly clear that
they do have an impact on the fund’s ability to achieve better diversification and to lower costs. In
private conversations with the author, senior managers at some of these funds acknowledged the
limiting nature of these constraints and expressed cautious optimism that in time these regulations
might be reviewed and changed.
So how did the AP2 portfolio evolve over time? Tomas Franzén, the fund’s chief investment strategist,
referred to it as a two‐stage process: Diversification 1.0 between the fund’s inception in 2001 and the
Global Financial Crisis of 2007‐08, followed by Diversification 2.0 after that. At the outset, the initial
policy portfolio was heavily skewed towards developed markets and traditional asset classes.
[Insert Figure 4]

13
In 2003, the bond portfolio was further diversified to include developed market sovereign debt and
credit bonds. At the same time, within the equity portfolio, a small allocation to emerging markets
was implemented. And a process was put in place for a gradual build‐up of a private equity portfolio,
which deserves a separate mention. Early on in the fund’s history, its managers decided that
diversification within and across traditional listed assets traded in public markets was very different in
nature to diversification within and across less liquid alternative assets traded in private markets.
While the former allowed ‘top‐down’ allocations using broad asset class categories, the latter had to
be accessed through third‐party active managers, whose dispersion of returns tended to be so wide
as to render meaningless the notion of a broad, ‘top‐down’ allocation to, say, private equity as a
generic ‘asset class’. As a result, AP2 took a gradualist approach to investing in private equity and other
non‐listed assets, building up positions in a ‘bottom‐up’ way, as they identified desirable projects on
a case‐by‐case basis, thus continuously changing strategic allocation weights to reflect actual portfolio
size. It took AP2 a decade to fill the 5% limit on unlisted assets.
Amidst the Global Financial Crisis of 2007‐08, just like many of its peers, AP2 realised that in spite of
considerable diversification across different geographies, sectors and industries, their overall portfolio
was still too concentrated in developed market equity risk. In hindsight, the initial approach to
portfolio diversification proved insufficiently balanced, so AP2 initiated a second wave of
diversification. First, allocations to emerging markets were boosted considerably, both in equity and
bond portfolios. Secondly, in addition to private equity, AP2 started a gradual build‐up of a portfolio
of agricultural and forest properties, as well as traditional real estate outside Sweden. Thirdly, the
fund initiated a search process for the so‐called ‘alternative risk premia’ that were not represented in
the existing policy portfolio. Finally, a more dynamic approach to strategic asset allocation was
adopted, based on the fund’s view of the valuation levels in key asset classes. In short, AP2 embarked
on its self‐proclaimed Diversification 2.0 programme, hoping to come up with a new portfolio design
for better diversification, both for the long and the short term.
[Insert Figure 5]
Another major trend, which goes hand in hand with AP2’s more sophisticated approach to
diversification, has been the increased focus on in‐sourcing more assets and strategies for internal
management. In 2012, the fund’s management initiated a 3‐year ‘internalization process’, which was
successfully completed in 2015, resulting in 83% of all assets managed internally. This has helped not
only deepen and strengthen the in‐house investment management capability, but also materially
lower costs. In addition, having a broader, more globalised and more transaction‐intensive internal
portfolio management team makes it possible for AP2 to increase the level of collaboration with its
peers, both domestically and internationally.
[Insert Figure 6]
Unique feature
AP2’s focus on harvesting long‐term risk premia, combined with unrelenting efforts at improving
portfolio diversification and controlling costs, have resulted in the fund becoming one of the early
adopters of novel investment solutions at the cutting‐edge of innovation in two related areas. First, in
its equity portfolios, AP2 has embraced a whole range of alternative index weighting methodologies,
sometimes referred to in the industry as ‘smart beta’ or ‘alternative beta’. Specifically, in addition to
14
market capitalisation‐weighted indices, the fund allocates to equal‐weighted, risk‐weighted, value‐
weighted, GDP‐weighted, and low volatility portfolios, as well as portfolios with weights based on
fundamental corporate factors such as sales, dividends and profits.
The second area of innovation focuses on non‐equity alternative risk premia, which includes portfolios
linked to stock market volatility, reinsurance premia, premia associated with the market for corporate
acquisition and convertible bonds, as well as strategies focused on the foreign exchange market and
the market for future dividends on corporate profits. At the end of 2015, these non‐equity alternative
strategies collectively accounted for 3% of the fund, with yet another stand‐alone allocation to
alternative credit constituting an additional 2%. Together with the ‘alternative beta’ allocations within
the equity portfolio, these strategies are designed to contribute to increased diversification and to
generate higher risk‐adjusted returns while controlling costs as much as possible.
Case Study #3: Denmark’s ATP Fund
Established in 1964, ATP has grown into one of the largest pension providers in Europe, managing
assets of 800 billion Danish kroner (US$ 120 billion) as of October 2016. It is a statutory, defined
contribution pension plan, designed as a funded supplement to Denmark’s tax‐based old‐age pension
system. With 5 million members, it is the largest pension scheme in the country. Mandatory
contributions into the fund are paid by 92% of the Danish working population, with the fund providing
90% of the country’s old‐age pensioners with supplementary income. While pension benefits depend
on the total amount of contributions paid in by individuals throughout their working life, ATP does
offer minimum guaranteed benefits, which are based on a minimum guaranteed interest rate.
Operationally, the ATP Group is divided into two areas: the Pensions & Investments business, which
manages the underlying assets, and the Processing Business, which administers and pays out pension,
social security and other welfare benefits.
Generally speaking, the history of ATP can be divided into four main periods: (1) years of high inflation,
declining contributions, and poor investment returns before 1980; (2) a period of disinflation,
rebounding contributions, and high real returns throughout the 1980s; (3) a period of expanded
coverage and contributions, innovative investment policies, and high investment returns of the 1990s
and early 2000s; and (4) the period since 2006 to the present day, which saw a transformation of ATP
into one of the most advanced and sophisticated public sector institutional investors in the world.
ATP’s executive team is constantly innovating, with the most recent changes to its asset allocation
implemented in 2015 being a classic example. We highlight this innovation at the end of the section
as our choice of the fund’s unique feature worthy of emulation.
Liability Profile
As a public pension fund, ATP has a liability profile that is fairly straightforward: it receives regular
mandatory contributions from the vast majority of Denmark’s active workers and the unemployed
recipients of social benefits, and it pays out nominally guaranteed supplement pension benefits, which
are occasionally adjusted depending on longevity increases and financial returns. While historically,
and especially since the 1980s, annual pension contributions comfortably exceeded pay‐outs for many
years, ATP has gradually matured as a pension plan, with pay‐outs now consistently exceeding
contributions since mid‐2000s. On the current trend, this gap is expected to grow as the population
continues to age.

15
In light of the nominal guarantees extended to current and future pensioners, it is critical for ATP to
maintain a sufficiently large and liquid reserve portfolio, and to protect it against adverse moves in
the markets. At the same time, it is equally important to maximise returns to grow the fund, so that
future pensions can be inflation‐proofed and augmented to cover unexpected increases in longevity.
ATP’s answer to this challenge has been to split total assets into two separate portfolios: a hedging
portfolio to underwrite the guaranteed nominal pension pay‐outs, and an investment portfolio to
achieve long‐term capital growth. But before we turn to ATP’s unique investment strategy, let us first
consider the fund’s governance setup.
Governance Arrangements
ATP’s governance structure effectively puts the fund at an arm’s length from the government and
allows a degree of operational independence. However, critics also point out that it looks somewhat
archaic, cumbersome, and unnecessarily bureaucratic, possibly reflecting the legacy of the Danish
labour market, such as high union membership, important role of collective labour agreements, and
significant influence of ‘social partners’. Among other things, it appears to emphasise representation
over financial expertise, and it may expose the fund to the risk of being slow in making certain
fundamental decisions – for example, raising the level of contributions – due to vested interests and
political constraints.
Starting from the bottom, the organisation is run on a day‐to‐day basis by an Executive Board
consisting of the Chief Executive Officer; the Chief Investment Officer; the Chief Risk Officer; the Chief
Financial Officer, who is also the Chief Operating Officer of the pensions and investments unit; and
the Chief Operating Officer of the processing business and human resources. This five‐person team is
effectively in charge of an organisation of 2,600 people, of which a lean and efficient team of just 50
professionals runs 85% of the fund’s investment activities. Between them, the Executive Board and
the investment team are largely responsible for all the cutting‐edge innovations which made ATP
famous in the institutional investment world.
The Executive Board reports into ATP’s Supervisory Board, which is comprised of an independent
chairman and 12 other board members, who equally represent the ‘social partners’ – six directors
from the Confederation of Danish Employers and the other six from the Danish Confederation of Trade
Unions. Board directors are subject to a ‘fit and proper’ test and are required to have adequate
experience. However, the relevant legal act does not specify what constitutes adequate experience.
The board is responsible for hiring the CEO and other senior executives, setting investment and
operational guidelines, preparing and approving written procedures for all significant areas of activity,
and establishing full internal control systems.
The peculiar nature of ATP’s governance is that on top of the Supervisory Board there is yet another
layer, which is called the Board of Representatives. It consists of 31 members: an independent
chairman and 15 representatives each from the same employer and employee associations. The
board’s main function is to review and approve the annual report of ATP and to deal with any matter
referred to it by the Supervisory Board, playing a consultative role. Importantly, it also has the right to
set contribution amounts, which requires a simple majority of each group of representatives. While
this extra layer of decision‐making does come across as somewhat redundant and bureaucratic, the
good news is that it does not appear to have hindered the executive team in their continuous efforts
to implement cutting‐edge innovations in how the ATP fund is managed.

16
Investment Strategy15
Before 1990, the portfolio was invested conservatively in domestic securities, dominated by Danish
government and mortgage bonds. However, throughout the next decade, a major diversification drive
saw ATP increase the weight of its equity allocation from 22% to 43%, with a significant boost to
foreign equities in particular. The fund also added inflation‐linked and foreign bonds, as well as real
estate assets, which accounted for just over 3% by the end of the millennium. Then, in 1999, ATP
embarked on yet another major review of strategic asset allocation, increasing equities still further,
and diversifying even more into international stocks and bonds. Target allocation to real estate was
also raised to 5%. As the size of the fund was getting larger, it made sense to expand investments
beyond the limited opportunities in the domestic market, while the introduction of the euro and
Denmark’s policy of pegging the krona opened up the opportunity of investing in longer dated
European government bonds to better match ATP’s long‐dated liabilities.
[Insert Figure 7]
In 2001, several new trends converged, triggering a major change of philosophy at ATP. In the wake
of the technology bubble collapse, equities and interest rates declined sharply, hitting funds like ATP
on both sides of their balance sheet. At the same time, the Danish regulators introduced new
accounting rules that required market valuation of assets and liabilities. Combined with the growing
longevity of the Danish population, ATP was forced to rethink its approach to asset allocation: the
fund introduced an active liability hedging programme, designed to protect pension liabilities from
changes in interest rates. By 2006, having achieved 100% after‐tax hedging of liabilities, ATP
established a dedicated department specialising in this activity. Effectively, ATP’s assets were now split
into a hedging and an investment portfolio, which was also reflected in how member contributions
were now split, such that 80% automatically went into the former and 20% into the latter.
[Insert Figure 8]
With respect to the hedging portfolio, its assets are invested in a liability‐mimicking strategy made up
of interest‐rate‐sensitive instruments – such as Danish and German long‐duration government bonds
and long‐dated euro and Danish kroner interest rate swaps – whose value changes in tandem with the
benefits ATP has nominally guaranteed to its members. Until 2015, these benefits came in the form
of lifelong pensions, and ATP’s liabilities were valued (and hedged) using a market‐based yield curve
between years zero and forty. For maturities beyond 40 years, a fixed 3% discount rate was used,
which was covered out of long‐term returns from ATP’s investment portfolio. From January 2015, ATP
has changed its pension product, such that all future contributions will be covered by rolling 15‐year
rather than lifelong guarantees, which means that over time all of ATP’s pension liabilities will
eventually become rolling guarantees of no more than 15 years. At the time of writing, all of ATP’s
liabilities were fully hedged, with a funded status of approximately 114%.
With respect to the investment portfolio, also known as ‘free reserves’ and ‘bonus potential’16, from
2006 until 2015 ATP used to sub‐divide it into two components: the Beta portfolio, focusing on
harvesting various long‐term risk premia, and the Alpha portfolio, dedicated to generating excess
returns from active management. In addition, ATP established separate companies for investing in
illiquid assets like real estate and private equity. Finally, in a major departure from the traditional
approach to asset allocation, ATP introduced a novel risk allocation methodology.

17
Recognising that effective diversification was the first line of defence against investment risks, ATP
shifted from capital‐based allocation, which tends to have a strong equity bias, to risk‐based allocation,
which offers a much better balance of risk exposures. In addition, ATP augmented its risk management
in two important ways: first, it engaged in selective tail risk hedging, and second, it started dynamically
managing its risk exposures based on the size of ‘free reserves’. Back in 2006, this combination was a
revolutionary development among large public sector asset owners – not just in Denmark, but globally.
In line with ATP’s shift in 2006 to a new system of risk‐based allocations, the Supervisory Board had
set a long‐term reference target for allocating risks across five different ‘risk classes’: Equities (35%)17,
Rates (20%)18, Credit (10%)19, Inflation (25%)20, and Commodities (10%)21. It is important to reiterate
that the above target weights do not represent amounts of capital allocated to each type of risk, but
rather the amount of risk that is budgeted to each underlying driver of long‐term returns. One could
view this as a variation on the so‐called ‘risk parity’ methodology and approach to asset management.
[Insert Figure 9]
Another important point to stress in this context is that the long‐term reference targets above were
not designed to structurally encourage ATP’s investment team to match them in the actual investment
portfolio. Instead, the Supervisory Board sets an annual absolute return target, which the investment
team is mandated to beat by deviating from the long‐term risk allocation profile as much as they deem
necessary.22 The degree of operational freedom and flexibility enjoyed by ATP’s portfolio managers
can be seen in the degree of deviation from targets in their actual risk allocations in the first half of
2015: Equities at 56% vs. 35%, Rates at 3% versus 20%, Credit at 8% versus 10%, Inflation at 27% versus
25%, and Commodities at 6% versus 10%.
Unique Feature
In spite of the fund’s robust performance during the past decade, ATP’s board and management
decided to yet again review and overhaul their asset allocation and portfolio construction framework.
The new approach will still focus on risk allocation, but it will change the way risk is measured. Also,
instead of allocating each investment into one of five risk classes, ATP will now decompose each
investment into four risk factors. ATP’s management believes that these changes will make risk
measurement and management much more precise, and that this will also help analyse and compare
different investment opportunities across asset classes in a much more consistent way. The language
used to describe the new approach and the terminology invoked by the management sound very
familiar, but they belie the revolutionary nature of the changes taking place at the fund, which in fact
are quite radical and which represent yet another qualitative step‐change and a case of cutting‐edge
innovation in institutional fund management.
There are two major sources of innovation in ATP’s new approach. First, it is a total departure from
the notion of asset classes in favour of risk exposures. In its previous incarnation, ATP’s risk allocation
focused on the underlying risk driver in each asset class, using it as the basis for portfolio construction.
For example, a corporate bond would typically be assigned to the ‘credit’ bucket, while a real estate
investment would be placed in the ‘inflation’ bucket. But in the new approach, these two potential
investment would be de‐composed in terms of their various risk factor exposures. As a result, a
corporate bond would contain some ‘equity risk’ and some ‘rates risk’, while a real estate investment
18
would be exposed to all four of the newly established risk categories – equity risk, rates risk, inflation
risk, and ‘other’ risk, which covers illiquidity.
In the 2015 annual report, ATP’s management explicitly invoked Andrew Ang’s famous comparison of
asset classes and risk factors contained within them with everyday foods and the basic nutrients
contained therein. The Supervisory Board has adopted a new set of four risk factor weightings, which
represent a long‐term anchor: Equity (35%), Rates (35%), Inflation (15%), and ‘Other’ (15%). However,
as before, the investment team is encouraged to materially deviate from these long‐term risk
allocation targets in order to beat the annual absolute return target mandated by the board. It should
be noted that, of the four risk factors, the newly created ‘other’ risk bucket is not just a residual catch‐
all category. Broadly speaking, it includes a combination of two types of risk factors that are distinct
from the other three: namely, liquid alternative risk premia strategies and illiquid alternative
investments.
[Insert Figure 10]
This is where the second source of innovation comes in: after ten years of successfully implementing
alternative risk premia strategies through its dedicated alpha and hedge fund unit, ATP decided to
shut it down and to integrate it into the main investment portfolio, thus merging the once‐separate
alpha and beta investment functions, and putting all investments on one common platform. There is
no longer a separation between alpha and beta, and no asset class or geographical ‘silos’ – the whole
investment team and the entire investment process are now built organically around risk factors.
Case Study #4: The Netherlands’ APG / ABP Fund
APG is the largest pension fund manager in the Netherlands, operating in its current form since 2008,
when it was spun off from Stichting Pensioenfonds ABP, the Dutch pension fund for government and
education‐sector employees. Carving out ABP’s in‐house team into a specialist investment
management firm was a direct result of the regulations introduced in 2007, which required pension
funds to delegate their asset management functions to independent entities. At the time of writing in
October 2016, APG managed pension assets of approximately € 400 billion (c. US$ 455 billion) on
behalf of 4.5 million citizens in the Netherlands, or roughly one in five Dutch families. While ABP is still
its main client with about € 351 billion (c. US$ 400 billion) under management, APG also provides
services for a number of other Dutch pension schemes. At the time of writing, APG employed 650
professionals across four global offices, who managed approximately 80% of its assets internally,
investing across 15 asset classes and covering the full range of public and private markets around the
world.
APG is at the core of the Dutch pension system, which stands out globally for its breadth of coverage
and for the quality of its institutions and regulations. In the Melbourne Mercer Global Pension Index,
the country consistently comes at the top of the rankings, second only to Denmark. Approximately
90% of the labour force is enrolled in a pension plan, with benefits aiming to cover around 70% of
average lifetime earnings. The Dutch save about 16% of their disposable income, which is second only
to Germany among the eurozone countries. The Dutch regulatory system is exemplary in the clarity of
its rules and its emphasis on achieving equitable outcomes across different stakeholders. For example,
Dutch pension funds are required to maintain a minimum asset‐to‐liability funding ratio of 105%, with
liabilities discounted at market rates tracking the interbank swap curve.23

19
But what happens if the funding ratio declines, as occurred in the wake of the global financial crisis,
due to a simultaneous drop in risk assets and interest rates? Unless funds fully separate their asset
portfolios into hedging and investment tranches along the lines of Denmark’s ATP, there are only two
steps to address the situation over time: increase contributions and lower benefits. At the same time,
pension funds often find themselves under enormous political pressure to effectively de‐risk and
simplify their investment portfolios.24 But there is a potential problem here: while the first two steps
are perfectly natural for achieving an equitable solution without affecting the underlying long‐term
investment strategy, de‐risking and simplifying the portfolio in these circumstances could be
dangerously myopic and pro‐cyclical for a long‐term investor like APG. When prices of risk assets
collapse, it should be taking on more risk, not less. Similarly, when liquidity and complexity premia
expand, the fund should be taking advantage of these opportunities by deploying more money into
the respective asset classes and strategies.
Liability Profile
Since APG manages assets on behalf of multiple domestic pension fund clients, the specifics of the
liability profiles which APG’s investment team must take into account necessarily vary. However, as
Dutch pension funds, APG’s clients are all subject to the same strict regulatory regime mentioned
above, not least the minimum asset‐to‐liability funding rule. Given that ABP is APG’s largest client, we
briefly describe the state of its liabilities at the time of writing in October 2016, based on the fund’s
2015 Annual Report and the latest updates on its website.
While financial returns on the portfolio were positive in 2014 (+14.5%) and 2015 (+2.7%), ABP’s
coverage ratio deteriorated, finishing 2015 at 97.2% as a result of lower interest rates and increases
in longevity. At the time of writing in October 2016, ABP’s coverage ratio dropped even lower,
standing at 92.8%, which is dangerously close to the critical coverage ratio of 90%. So far, pensioners
had to forego annual indexation, and even if things turn around, on current estimates they cannot
expect indexation for at least five more years. However, if the funding ratio drops below 90%,
pensioners will need to endure actual benefit cuts. At the same time, to maintain a fair and equitable
distribution of pain across different stakeholders, active members must endure temporary premium
surcharges to their normal pension contributions in order to speed up the recovery.
Given the challenges surrounding the coverage ratio rules and the Dutch pension funds’ liability
profiles more broadly, there is an ongoing debate in the Netherlands about the need for a major
pension reform, in which ABP is actively participating. ABP views the main problem with the current
system to be the unconditional pension promise with tremendous interest rate sensitivity, which
necessitates extremely high buffers. A better system would introduce more flexibility, conditionality
and personalisation, while still maintaining compulsory pension accruals and collective risk sharing,
especially with respect to inter‐generational investment and longevity risk.
Governance Arrangements25
By virtue of splitting what used to be one entity into two – ABP as the underlying pension fund and
APG as the asset management and pension administration specialist – the reforms of 2007 have
effectively introduced an extra layer into the governance set‐up of the fund. While both boards are
independent in the sense that they operate at arm’s length from day‐to‐day politics, just like with
Scandinavian funds there is a very strong emphasis on representation and social partnership. At the

20
same time, there are sensible mechanisms built into the governance arrangements to ensure
sufficient levels of domain‐specific expertise, not least an active involvement by the Dutch central
bank in vetting and approving board nominees with respect to the necessary ‘fit and proper’ criteria.
But if there is one potential criticism to be levelled at the overall governance set‐up at APG/ABP, it is
the sheer level of complexity: there are so many moving parts, it is a miracle that the whole operation
does not get bogged down in bureaucracy.
At the ABP level, there is the Board of Trustees, which consists of 13 members: one independent non‐
voting chairperson, five members nominated by employers with one vote each, and seven members
nominated by employees with 5/7 of one vote each, thus resulting in a 50/50 representation between
social partners. Underneath the Board of Trustees, there are eight sub‐committees, and an Executive
Office which helps the board interact on a day‐to‐day basis with APG on various strategy and
implementation issues. In addition, there are two more entities: an internal Supervisory Board and an
Accountability Council. The former consists of five members and is responsible, among other things,
for general supervision as well as board member nominations, selections and resignations. The latter
consists of 48 members, nominated by employers (16), active plan members (19) and pensioners (13).
This entity advises the Board of Trustees on important policy measures affecting their respective social
groups, and it is also involved in nominations to ABP’s Board and Supervisory Board.
At the APG level, there is a Supervisory Board as well, which consists of six independent directors, and
an Executive Board, which consists of four senior executives – Chief Executive Officer (CEO), Chief
Finance & Risk Officer (CFRO), Chief Operations Officer (COO) and Chief Investment Officer (CIO). The
Supervisory Board, charged with overseeing the Executive Board and its performance, is responsible
for all appointments and dismissals of directors. While it supports the Executive Board with advice on
all strategic matters, the latter has the duty of managing APG on a day‐to‐day basis, realising the
organisation’s objectives and implementing its strategy, and is responsible for compliance with all
relevant legislation and regulations, managing risks, and the company’s financing.
Investment Strategy26
Historically, ABP used to be a stodgy institution with a conservative investment strategy, placing most
of its money in Dutch bonds and domestic real estate. However, since the mid‐1990s, when the
government liberalised pension regulations, the fund expanded into a wider range of assets, starting
with international stocks and bonds, then proceeding into alternative asset classes like private equity
and hedge funds. Two individuals in particular, Jean Frijns and Roderick Munsters, who served as
consecutive CIOs from 1996 to 2009, left their mark by transforming ABP into a cutting‐edge
institutional investor with a track record of innovation.
Presciently, as they were embarking on their diversification drive in 1996, Frijns and his team decided
to manage as much of the portfolio as possible internally, primarily on cost‐saving grounds. To this
day, this in‐sourcing ethos is strong, with 80% of assets still managed in‐house. Also, their approach
to building up ABP’s exposure to hedge funds and private equity was quite unique. After launching the
initial fund of hedge funds portfolio out of Amsterdam, the team quickly realised that it would be more
efficient to base the entire operation in New York. After hiring two senior private sector professionals
in the US to build out the team and to run the portfolio, in 2006 they gave them full autonomy,
restructuring the whole operation as a stand‐alone company called New Holland Capital.

21
With respect to private equity, in 1999 ABP entered into a strategic alliance with PGGM, the second‐
largest pension fund in the Netherlands, to establish a jointly owned independent private equity
operation, which eventually came to be known as AlpInvest, and which became one of the largest
allocators to private equity globally. In 2011, in a management buy‐out, the company was sold to
Carlyle Group, with ABP and PGGM committing to increase their private equity allocations as core
clients. Throughout its existence, AlpInvest allowed ABP and PGGM to enjoy cost savings due to
economies of scale, while also benefiting from the dedicated client service and a focus on their specific
needs and requirements.
[Insert Figure 11]
In 2005, with the arrival of Munsters, who during the previous seven years had served as CIO at PGGM,
the drive for even more innovation, new sources of return, and broader diversification intensified
further. ABP expanded into more complex strategies and esoteric investments, while also adding an
important multi‐asset‐class dimension with the introduction of a successful but highly complicated set
of global tactical asset allocation (GTAA) strategies. A dedicated allocation, called the ‘opportunity’ or
‘innovation’ fund, was also made for orthogonal investment strategies which were difficult to place in
traditional asset class categories, such as insurance‐linked securities and intellectual property rights.
By 2008, after more than a decade of innovation, ABP’s portfolio had acquired the look and feel of an
advanced multi‐asset class portfolio constructed by a highly sophisticated long‐term institutional
investor. While it maintained a 40% allocation to bonds (10% governments, 7% inflation‐linked, and
23% corporates), the remaining 60% allocation was broadly diversified across 9 different risk asset
categories: developed market equities (27%), emerging market equities (5%), convertible bonds (2%),
private equity (5%), hedge funds (5%), commodities (3%), real estate (9%), infrastructure (2%), and
innovation (2%).
[Insert Figure 12]
Interestingly, even after the drastic changes to simplify the portfolio after the crisis, the overall asset
allocation and the risk posture of the fund have not changed dramatically. According to ABP’s 2015
annual report, the fund still maintained strategic allocation at approximately 40% bonds (16%
governments, 14% corporates, 9% inflation‐linked, and 2% emerging market bonds) and 60% equity
and other risk assets, which included developed market equities (25%), emerging market equities (8%),
private equity (5%), hedge funds (5%), commodities (4%), real estate (9%), and infrastructure (3%).27
[Insert Figure 13]
Unique Feature
One of the most visible and unique features of ABP (and subsequently APG) has been its capacity to
innovate. While many of their advanced institutional peers have always been well attuned to the latest
developments in financial practice and academia, very few were able to push the proverbial envelope
and create something entirely new and unprecedented. In this section, we chose to highlight two such
innovations which deserve to be studied and potentially emulated by other sophisticated, long‐term
investors. The first has to do with the so‐called ‘opportunity’ or ‘innovation’ portfolio mentioned
earlier, which was set up specifically to house completely new and innovative strategies. Alongside
22
catastrophe bonds and renewable energy, this portfolio includes direct investment in intellectual
property (IP), such as copyright to music, films and TV shows.28
Just before the global financial crisis, when APG was looking for new alternative investments and
better ways to achieve portfolio diversification, Ronald Wuijster, director of strategy and research at
the time, came up with the idea, convincing the Innovation Committee and taking charge of the
strategy. After considering IP in films, art, literature and software, he determined that music rights
presented the most compelling opportunity at the time, as Universal were putting on the market a
large portion of their pop music portfolio. Subsequently, he diversified his music exposure by acquiring
portfolios of classical music and theatrical musicals, eventually making APG the largest independent
owner of music rights in the world, covering more than 250,000 songs. Now every time one of these
pieces of music are used in any context anywhere in the world, APG gets a small royalty payment. The
annualised target return was set at 10%, and the portfolio is reported to have performed in line with
it over the years.
The second case of cutting‐edge innovation has to do with APG’s long history of pushing the
boundaries of environmental, social and governance (ESG) investing. Like many of its peers, over the
years, it has re‐engineered its governance and investment processes to incorporate ESG factors into
the analyses of more traditional asset classes, such as public and private equity and fixed income. But
one of the bigger challenges was making real estate investing ESG‐compliant in a consistent and
systematic way. APG’s unique solution was to team up with Maastricht University and its peers PGGM
and USS – pension funds in the Netherlands and the UK, respectively – to create an ESG‐focused and
standardised approach to benchmarking real estate investments. In 2009, they co‐developed the so‐
called Global Real Estate Sustainability Benchmark (GRESB), establishing an organisation of the same
name to maintain and manage the benchmark. The process is based on annual surveys of data
collected from property companies and real estate funds, at the time of writing covering 61,000
buildings with an aggregate value in excess of US$ 2.3 trillion. As of July 2015, about two‐thirds of
APG’s property portfolio was reporting against the GRESB survey, with all new investments required
to take part in it.29
Case Study #5: Canada’s CPPIB30
The Canada Pension Plan Investment Board (CPPIB) is the country’s largest pension fund manager,
established in 1997 and currently managing C$ 300 billion (US$ 223.3 billion) in assets on behalf of 19
million Canadians. The Canada Pension Plan (CPP) is a compulsory, earnings‐based pension
programme operating across Canada, with the exception of Quebec, where pensions are provided by
the Quebec Pension Plan. CPP was first established in 1966, with a fairly low level of contributions. By
the mid‐1990s, despite several increases in contribution levels, serious concerns arose about long‐
term sustainability of the pension plan. In 1997, the federal and provincial governments embarked on
a reform programme to put CPP on a more sustainable footing. First, annual compulsory contributions
were set at a higher and more stable level, which currently constitutes 9.9% of earnings, an amount
shared equally by employers and employees. Secondly, restrictions were lifted which previously
forced the fund to invest only in non‐marketable Canadian federal, provincial and territorial bonds.
But the most significant outcome of these reforms was the creation of CPPIB as an independent and
professional manager of CPP funds operating at an arm’s length from the government.
23
The legislative act which created CPPIB contains no specific investment requirements and no
geographic, economic, development or social conditions and limitations. While the federal and
provincial finance ministers are the stewards of the CPP Fund, they do not have the right to direct
CPPIB’s investment activity. CPPIB’s professional board has full operational independence to pursue
the sole objective of maximising long‐term returns at an appropriate level of risk. Such a high level of
autonomy cannot be easily reversed: amendments to the governing legislation require agreement by
the federal government plus two‐thirds of the provinces representing two‐thirds of the population.
This is a higher requirement than for changes to the Canadian Constitution.
At the same time, in order to maintain the public’s trust, CPPIB operates in the most transparent and
accountable way: it publishes all the relevant information about what they do and how they invest,
including the release of quarterly investment results and an extensive annual report, which is tabled
in Parliament by the federal finance minister every year. In addition to annual audits and tri‐annual
reviews by the federal and provincial finance ministers, the Chief Actuary of Canada conducts a
financial review of CPP every three years. CPPIB is also subject to a statutory external Special
Examination of their records, systems and practices, which is conducted every six years. Finally, CPPIB
has taken on the commitment to hold bi‐annual public meetings in each participating province, during
which stakeholders can ask questions directly of the Chairperson and the Chief Executive Officer.
Liability Profile
The money needed to pay pension benefits out of the CPP Fund comes from two sources: (1)
contributions from active plan members and their employers and (2) investment returns earned on
the financial portfolio. The CPP Fund is still in accumulation phase, and will continue to receive more
in contributions than it pays out in benefits until 2023, channelling the excess cash to be managed by
CPPIB. Every three years, the Chief Actuary of Canada reviews the contribution rate required to sustain
the CPP over the next 75 years, taking into account several different demographic and economic
factors (e.g. population ageing, increases in longevity, growth in contribution base and employment
earnings, etc.) The most recent actuarial review was conducted in December 2012, reaffirming that
the mandatory 9.9% annual contribution rate is adequate for long‐term sustainability. One key
assumption in the review was that, over the long term, CPPIB would be able to earn an annualised
compound rate of return of 4% above Canadian inflation. At the time of writing, CPPIB’s annual real
rate of the return between 2006 and 2016 was comfortably above that, registering 5.1%.
One important point to note is that, according to the Chief Actuary, CPPIB’s portfolio will cover only
20‐25% of pension benefits over the very long horizon, with regular pension contributions continuing
to cover the bulk of the cost. This is very different from most other funded defined benefit plans,
where financial portfolios are expected to shoulder a much larger share of pay‐outs. The CPP’s partially
funded status, combined with a legally determined high and stable earnings‐based contribution rates
stretching out into the future, mean that investment returns will have an important but secondary
impact on the long‐term sustainability of CPP, compared with the collective effect of real wage growth
and demographic developments. With net inflows expected until 2023, and with the fund in a position
to comfortably cover the deficits out of investment income for many decades to come, CPPIB’s board
and management can take advantage of a highly stable and predictable capital base when planning
and making their investments.

24
Governance Arrangements
Establishing and maintaining high‐quality governance arrangements for public sector investors
operating in private financial markets means carefully balancing independence, professionalism and
experience against transparency, accountability and representation. This has been one of the
hallmarks of the so‐called Canada Model of institutional fund management, and CPPIB can serve as an
excellent case study. The Board of Directors, which is the ultimate governing body of CPPIB, consists
of 12 independent members. They are appointed by the federal finance minister, in consultation with
the participating provinces and with the assistance of an external nominating committee with private
sector involvement. The nomination process is designed to ensure that only those with expertise in
investment, business and finance are appointed to the Board. The Chair of the nominating committee
is federally appointed, with each participating provincial government appointing one representative.
Each director of the Board is appointed for a three‐year term, with the possibility of re‐appointment.
To ensure continuity, the terms are staggered, so that no more than half of the terms expire in any
given year. The principal duty of the Board is to oversee the strategy and the management of business
affairs of CPPIB, which among other things includes establishing investment policies, standards and
procedures; appointing an independent auditor; hiring the President and the Chief Executive Officer;
monitoring management; setting compensation policies and approving financial statements. The
Board has four committees: Audit, Human Resources & Compensation, Investment, and Governance.
The first two consist of five members each, while the Investment Committee, which is chaired by the
Chief Investment Strategist, includes all members of the full Board. It reviews, approves and
recommends to the Board the fund’s long‐term investment strategy, risk tolerances, engagement of
external investment managers, and large investment transactions.
The six‐member Governance Committee ensures that CPPIB follows appropriate governance best
practices: it makes recommendations to improve the Board’s effectiveness, oversees succession
planning, reviews criteria and qualifications for new directors, recommends director compensation,
and is involved in performance evaluation of the Board and each of its individual members. As part of
its work to regularly review and update both desirable and actual competencies of the Board, the
Governance Committee retains external executive search firms to source qualified candidates for
consideration. In addition to narrowing down the search based on required competencies, the
Committee also pays close attention to the overall diversity of the Board, not least considerations of
gender balance. Once the list has been finalised, it is forwarded on to the external nominating
committee, which considers the candidates and submits its recommendations to the federal finance
minister.
Investment Strategy31
In very broad terms, the evolution of the CPP Fund’s investment strategy can be viewed as a three‐
stage process. Prior to the establishment of CPPIB in 1997, the accumulating pension assets in their
entirety were invested in non‐marketable debt issued by federal, provincial and territorial
governments across Canada. This was a highly sub‐optimal strategy, which was finally abandoned in
1997. The second stage in the evolution covers the decade between 1997 and 2006, when CPPIB was
established as an independent manager and various restrictions were gradually lifted throughout the
period. In 1999, the fund invested for the first time in listed Canadian and foreign equities,
implementing the allocations passively through broad stock market indices.

25
[Insert Figure 14]
In 2001, the fund invested in private equity and real estate through external funds. In 2003, CPPIB’s
in‐house team took on the management of index equity portfolios, while in the following year they
started active equity investment and made their first allocations to infrastructure assets. In 2005, as
the government removed all limits on foreign investments, CPPIB started aggressively diversifying into
both developed and emerging markets. As a result, the underlying fund was completely restructured,
starting to resemble a typical multi‐asset class portfolio of a modern day long‐term institutional
investor.
[Insert Figure 15]
In 2006, CPPIB’s board and management embarked on a major overhaul of their approach to investing,
making a strategic choice to move away from passive investments and to introduce a much higher
degree of active management across all asset classes, which marked the beginning of the third stage
in the evolution of the fund. This was based on the realisation that the fund had three unique
endowments which allowed it to invest differently: (1) large asset size, which offered tremendous
economies of scale; (2) a favourable liability profile, which guaranteed stability of assets; and (3) a
very long investment horizon, which provided a larger risk‐taking capacity to obtain higher returns
over multiple decades. In order to take full advantage of these endowments, CPPIB set itself on course
to build a well‐rounded internal team to manage as much of the multi‐asset‐class portfolio as
possible.32 This meant hiring more specialists in active investing and alternative assets, who tend to
be more expensive. However, once appropriate adjustments are made for the cost savings that come
from foregoing external management and incentive fees, the case for internal management becomes
very compelling.33
[Insert Figure 16]
The transformation of both the underlying investment portfolio and the organisation managing it
which occurred during the last two decades has been nothing short of spectacular. In March 2000, in
the early days of CPPIB, the fund’s C$ 45 billion consisted of only 5% equities and 95% fixed income,
with 82% invested in Canada and only 18% internationally. By March 2016, the fund’s C$ 279 billion
was invested 52% in equities, 27% in fixed income, and 21% in real assets, while geographically CPPIB
completely reversed its home bias, with only 19% invested in Canada and the remaining 81% allocated
globally.
Even compared with the state of affairs ten years ago, the transformation of CPPIB looks stunning. In
2006, before the strategic decision to move away from passive investing, total assets under
management were C$ 98 billion, of which only 36% were invested outside Canada, run by a team of
164 people out of a single location in Toronto, implementing only 6 investment programmes. In
contrast, by March 2016, assets under management were C$ 279 billion, of which 81% were invested
outside Canada, run by a team of more than 1,200 staff out of seven locations around the world,
implementing 25 investment programmes. Another striking indicator is the evolution in the share of
the fund allocated to less liquid investments in private markets: it more than quintupled from 4.3% in
2005 to 23.6% in 2010, and then more than doubled to 47.6% by March 2016.

26
Given that CPPIB manages the underlying fund with a multi‐decade investment horizon, it would be
more appropriate to judge its results on at least a 20‐30 year interval, but it is already possible to make
some preliminary conclusions. Since CPPIB was established in 1997, it has generated C$ 161 billion in
investment income, which in March 2016 constituted almost 58% of the total fund. The majority of
this income (C$ 126 billion) was generated in the previous ten years, of which just over C$ 17 billion
is directly attributable to active management. This translates into an impressive outperformance of
80 basis points per year in excess returns over the reference portfolio comprising public market indices.
In addition to this added value, the underlying portfolio is now much more broadly and effectively
diversified, making it more resilient and capable to better withstand market shocks.
Unique Feature
In 2006, as CPPIB shifted away from passive strategies to a more active and hands‐on approach to
investment management, it introduced a new feature in asset allocation and portfolio construction
which has since revolutionised the industry. At CPPIB, it is called ‘Total Portfolio Management’ (TPM),
although elsewhere it has also been referred to as the ‘Opportunity Cost Model’ (OCM). At the heart
of this methodology lies the notion of a ‘Reference Portfolio’ (RP), which consists of some combination
of cheap and investable broad market indices that serve as a performance benchmark and a
description of the fund’s long‐term risk and return preferences. For funds that invest only or
predominantly in liquid assets traded in public markets, the difference with the more traditional multi‐
asset, fixed‐weight benchmarks may appear trivial. But for funds engaged in a wide variety of active
strategies in less liquid assets and private markets, the difference is material.
There are several problems with the traditional approach. First, benchmarks are not readily available
for certain types of alternative asset classes, and for those that do have them, such benchmarks are
not always fully investable or easily replicable. Secondly, even if there is a readily available and fully
investable benchmark, it may not necessarily represent a sufficiently compelling and efficient
exposure to the broad asset class.34 Thirdly, fund managers may be forced to make an allocation to an
asset class just because there is a target weight affixed to it in the benchmark, even though they may
be loath to do so on risk/return grounds. Finally, managing a portfolio against a multi‐asset, fixed‐
weight benchmark often results in a culture of geographical and asset class ‘silos’ within the
organisation. Adopting TPM / RP helps a fund resolve or get around these problems.
Applying the TPM framework allows all potential investments across different geographies, asset
classes and strategy types to be evaluated consistently on the basis of their exposures to the common
risk factors contained in the RP: whether one looks at a private equity transaction, a real estate deal,
or an infrastructure project, all three will contain exposures to equity, term, inflation and other risk
premia. In this context, RP also introduces the discipline of comparing expected returns on a
prospective investment to the opportunity cost of re‐allocating money from the asset classes
contained within the RP. There are no benchmark‐related constraints or limitations, and no pressure
to invest or divest for any reason other than normal risk/return considerations. And the TPM/RP
framework also encourages different investment teams to search for the best possible investment
opportunities across and irrespective of ‘silos’.
At CPPIB, the notion of RP is just a starting point. The next stage within the TPM framework is
developing and agreeing on a Strategic Portfolio, which consists of six asset classes and four
geographical areas.35 This ‘ideal’ portfolio composition is what the team will strive to maintain on a

27
horizon of 5 years and beyond, making sure that its risk profile broadly corresponds to that of the RP,
while trying to maximise expected returns considerably in excess of the RP. Finally, taking into account
various implementation constraints and inevitable time lags, the team at CPPIB will develop, as the
third stage within the TPM framework, so‐called ‘target portfolio ranges’, which correspond to a
shorter term roadmap on the way to constructing the Strategic Portfolio. This overall framework has
proven such a success at CPPIB, and its logic is so compelling, that in recent years some of CPPIB’s
global peers have also adopted it for their funds.36
Case Study #6: Canada’s CDPQ37
La Caisse de Dépôt et Placement du Québec (CDPQ) is an institutional investor managing funds
primarily for public and quasi‐public pension funds, insurance plans and various government‐linked
schemes in the province of Québec in Canada. It was established in 1965 by an Act of the Québec
National Assembly, and was initially mandated with investing and managing money on behalf of the
Québec Pension Plan, which made its first deposit with CDPQ in February 1966. Over the years, CDPQ
has been entrusted with assets of multiple other public sector institutions, often referred to as
‘depositors’. As of July 2016, CDPQ had 34 depositors, 8 of which accounted for more than 97% of net
assets under management38, which at C$ 255 billion (US$ 192 billion) made CDPQ the second largest
public pension fund manager in the country after CPPIB. Some 2 million Quebecers receive pension or
insurance benefits from CDPQ’s depositors, so naturally, its mission is to achieve optimal long‐term
risk‐adjusted returns on the funds under management. However, there is another, equally important
component to CDPQ’s mission, which is to contribute to Québec’s economic development.
It is unusual to find amongst top‐notch public pension funds successful investors with so‐called ‘double
bottom lines’, which describes entities seeking to perform not only in terms of financial results, but
also in terms of social or economic impact. But CDPQ is indeed such an organisation, having not only
delivered impressive long‐term risk‐adjusted returns39, but also meaningfully contributed to economic
development of its home region. The secret of CDPQ’s success appears to be a well‐structured and
highly focused approach to its mission: all of its activities in Québec are based around four pillars –
supporting growth of local businesses; backing innovative companies and funds; investing in real
estate and infrastructure projects with local impact; and nurturing local entrepreneurs. Between 2009
and 2015, CDPQ made C$ 16 billion of new investments in Quebec. It is currently partnering with 550
small and medium‐sized enterprises in the region, while owning or financing 330 local buildings. With
two electric public transit systems being studied for Montréal and three major downtown real estate
projects underway, CDPQ continues to plan and execute investments for maximum local impact.
Liability Profile
CDPQ’s liability profile is a function of all the liability profiles of its 34 depositors. CDPQ’s relationship
with each client is clearly defined in the respective service agreement, which sets out the
responsibilities of each party. Depositors are responsible for managing relations with their individual
participants, collecting contributions and paying out pension annuities and benefits. With respect to
entrusting funds to CDPQ, each depositor establishes its own investment policy, specifying its return
objectives, cash flow requirements, risk tolerance, investment horizon and constraints, as well as the
types of targeted investments which make up the benchmark portfolio. In turn, CDPQ then manages
the funds in line with each depositor’s investment policy, seeking out attractive investment
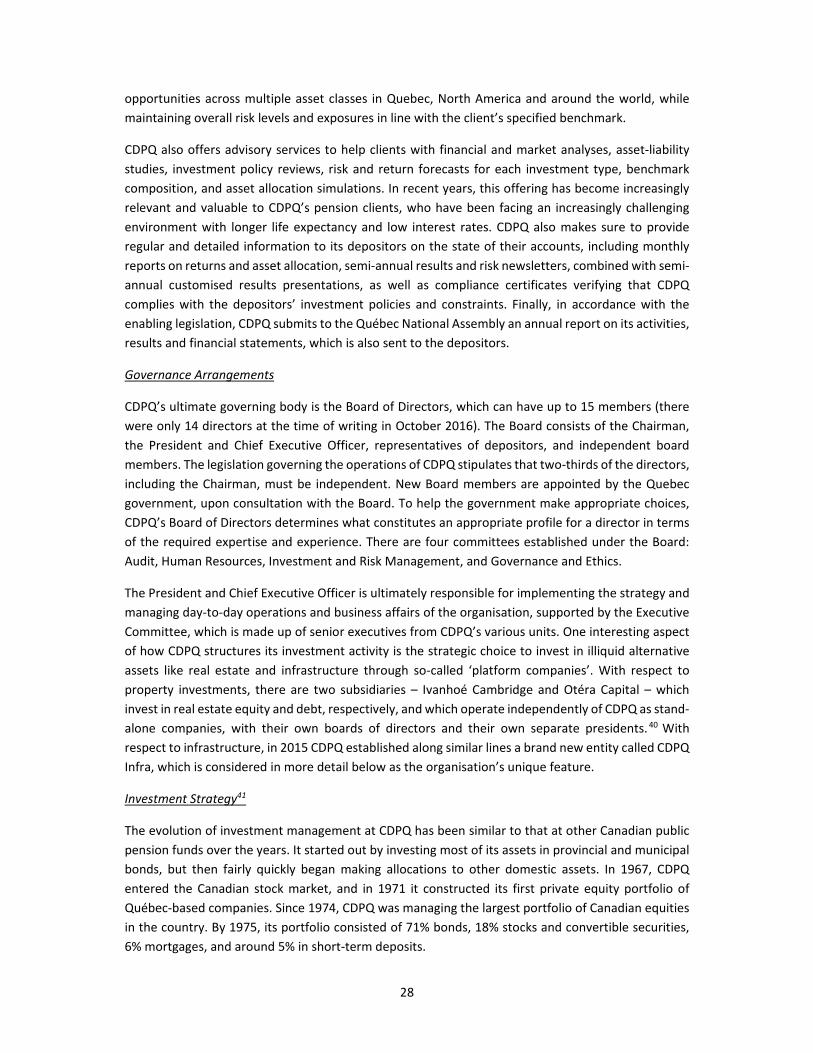
28
opportunities across multiple asset classes in Quebec, North America and around the world, while
maintaining overall risk levels and exposures in line with the client’s specified benchmark.
CDPQ also offers advisory services to help clients with financial and market analyses, asset‐liability
studies, investment policy reviews, risk and return forecasts for each investment type, benchmark
composition, and asset allocation simulations. In recent years, this offering has become increasingly
relevant and valuable to CDPQ’s pension clients, who have been facing an increasingly challenging
environment with longer life expectancy and low interest rates. CDPQ also makes sure to provide
regular and detailed information to its depositors on the state of their accounts, including monthly
reports on returns and asset allocation, semi‐annual results and risk newsletters, combined with semi‐
annual customised results presentations, as well as compliance certificates verifying that CDPQ
complies with the depositors’ investment policies and constraints. Finally, in accordance with the
enabling legislation, CDPQ submits to the Québec National Assembly an annual report on its activities,
results and financial statements, which is also sent to the depositors.
Governance Arrangements
CDPQ’s ultimate governing body is the Board of Directors, which can have up to 15 members (there
were only 14 directors at the time of writing in October 2016). The Board consists of the Chairman,
the President and Chief Executive Officer, representatives of depositors, and independent board
members. The legislation governing the operations of CDPQ stipulates that two‐thirds of the directors,
including the Chairman, must be independent. New Board members are appointed by the Quebec
government, upon consultation with the Board. To help the government make appropriate choices,
CDPQ’s Board of Directors determines what constitutes an appropriate profile for a director in terms
of the required expertise and experience. There are four committees established under the Board:
Audit, Human Resources, Investment and Risk Management, and Governance and Ethics.
The President and Chief Executive Officer is ultimately responsible for implementing the strategy and
managing day‐to‐day operations and business affairs of the organisation, supported by the Executive
Committee, which is made up of senior executives from CDPQ’s various units. One interesting aspect
of how CDPQ structures its investment activity is the strategic choice to invest in illiquid alternative
assets like real estate and infrastructure through so‐called ‘platform companies’. With respect to
property investments, there are two subsidiaries – Ivanhoé Cambridge and Otéra Capital – which
invest in real estate equity and debt, respectively, and which operate independently of CDPQ as stand‐
alone companies, with their own boards of directors and their own separate presidents.40 With
respect to infrastructure, in 2015 CDPQ established along similar lines a brand new entity called CDPQ
Infra, which is considered in more detail below as the organisation’s unique feature.
Investment Strategy41
The evolution of investment management at CDPQ has been similar to that at other Canadian public
pension funds over the years. It started out by investing most of its assets in provincial and municipal
bonds, but then fairly quickly began making allocations to other domestic assets. In 1967, CDPQ
entered the Canadian stock market, and in 1971 it constructed its first private equity portfolio of
Québec‐based companies. Since 1974, CDPQ was managing the largest portfolio of Canadian equities
in the country. By 1975, its portfolio consisted of 71% bonds, 18% stocks and convertible securities,
6% mortgages, and around 5% in short‐term deposits.

29
[Insert Figure 17]
During the next ten years, CDPQ adopted new investment guidelines, expanding its allocation to
equities and real estate. It acquired its first office building in 1980 and bought its first shares listed on
global stock markets in 1983. In 1984, it made its first foray into international private equity, and in
1989 it ventured into foreign real estate. By December 1991, CDPQ invested 48% in bonds, 38% in
equity and convertibles, 5% in mortgages, and 4.5% each in real estate and short‐term deposits.
[Insert Figure 18]
By 1996, CDPQ managed the largest real estate portfolio in Québec and the second largest in Canada.
The following year, an important change in legislation increased the previous 40% cap on equity
allocations to 70%, allowing CDPQ to invest even more in shares. In 2005 and 2006, CDPQ made its
first major infrastructure acquisitions by investing in airports internationally. To facilitate investments
in real estate and infrastructure (and to better manage liquidity), CDPQ has the ability to issue debt,
for which in 2003 it obtained the highest short‐ and long‐term credit ratings from the major credit
rating agencies. As a result of its diversification efforts, by 2007 CDPQ’s portfolio had acquired the
look and feel of a highly sophisticated, multi‐asset class, long‐term institutional portfolio: fixed income
and currency allocation at 30%, equity market allocation at 36%, and alternatives allocation at 34%,
with the latter comprising real estate (11%), private equity (7%), real estate debt (7%), infrastructure
(4%), hedge funds (3%), and commodities (2%).
[Insert Figure 19]
Then, as a result of the global financial crisis, CDPQ lost almost C$ 39 billion or 25% of its assets by the
end of 2008, having markedly underperformed both its portfolio benchmark and the median return
of Canadian pension plans. As with many funds around the world, this led to a period of introspection,
which resulted in substantial changes to the organisation and the investment process. The man who
spearheaded the transformation was Michael Sabia, who joined as President and CEO in 2009 and
who was still at the helm at the time of writing in October 2016. Having previously spent most of his
working life in the real economy, the new head of CDPQ anchored the new investment strategy in
what he called “a business‐owner mind‐set.”42 What this meant in practice was that, to be a successful
investor, one needed to understand more than just balance sheets and profit‐and‐loss statements –
one also needed to have an in‐depth understanding of each company’s operations.
Re‐orienting CDPQ’s investment philosophy in that way led to three profound changes in the
organisation and the investment strategy. First, in addition to market and financial engineering
professionals, CDPQ started actively hiring specialists with strong operational backgrounds from
various sectors – geologists, mining engineers, people with experience in consumer products and IT
companies, in other words, people with a deep understanding of how value is created in each of these
industries.43 Secondly, the new approach meant that CDPQ now had a particularly strong preference
for investing in assets that that were rooted in the real economy – buildings, ports, IT services,
consumer products, etc. – which favoured even more illiquid investments and strategies in private
equity, real estate and infrastructure. Thirdly, CDPQ started a major shift away from benchmark‐
oriented investment towards what they refer to as ‘benchmark‐agnostic’ strategies.

30
To be clear, CDPQ’s investment process is still structured around the individual benchmarks discussed
and agreed with their respective depositors. But these benchmarks no longer serve as the starting
point for the investment process, as was the case in the past. For example, rather than automatically
invest in a top‐down fashion in thousands of securities that constitute the benchmark while
overweighting stocks CDPQ’s team likes and underweighting those they don’t like, the process now
works from the bottom up, with CDPQ’s team expending much more time and effort on researching
a smaller basket of securities with the intention of owning a more concentrated portfolio without
reference to benchmark weights.44 At the same time, portfolios are still constructed and risk‐managed
in such a way that the overall risk for the client will not deviate too far from their specified long‐term
benchmark. This new approach to investing is being introduced gradually, starting with the so‐called
Global Quality Equities portfolio, which was launched in January 2013 and has since grown to C$ 34
billion. Subsequently, CDPQ also applied the same methodology to its C$ 22 billion Canadian equity
portfolio. CDPQ plans to have up to 80% of the total portfolio managed in this way within a few years.45
The resulting shape of the overall portfolio and the nature of the organisation coming out of this
transformation makes CDPQ a uniquely Canadian institution, fitting the main parameters that
characterise the so‐called Canada Model. The internal team, responsible for 90% of total assets,
focuses on hands‐on active management, liberated from the tyranny of benchmarks and allocating a
large chunk of the portfolio to illiquid assets traded in private markets. There is also an increasing
preference for forming long‐term partnerships, not just with private sector providers, but with public
sector peers investing with similar objectives and a long‐term horizon. As of December 2015, CDPQ’s
overall portfolio was invested as follows: 35% in fixed income, including a 5% allocation to real estate
debt; 17% in inflations‐sensitive instruments, including 11% in real estate and 5% in infrastructure;
and 48% in equities, including an 11% allocation to private equity. There were also minor allocations
to active overlay and asset allocation strategies.
[Insert Figure 20]
Unique Feature46
In June 2015, the Québec National Assembly passed a law allowing CDPQ to establish CDPQ Infra, a
wholly owned subsidiary focusing on infrastructure investment and management. This vehicle is
unique, because it offers a brand new operating model and a completely different framework for
catalysing public and private investment in infrastructure, based on long‐term commercial logic. It will
pursue a fully vertically integrated model of selecting, investing in, and operating greenfield
infrastructure projects. The process begins with the Quebec government identifying infrastructure
needs. CDPQ Infra will then evaluate the short‐listed projects for feasibility and commercial viability.
If a project meets the necessary criteria, CDPQ Infra will submit its proposal to the government, and if
the latter decides to proceed, CDPQ Infra will assume full responsibility for all aspects and stages of
the project, including planning, financing, execution and operations. CDPQ Infra will oversee and
coordinate the project, but it will also bring in external partners, whom it will choose through
international public tenders.
There are at least two major advantages for the government in this business model: participation by
CDPQ Infra throughout the whole deal flow and the value‐adding chain of activities introduces

31
commercial rigour and financial discipline, while at the same time taking the project completely off
the government’s balance sheet. For CDPQ, this model provides access to a deal pipeline in the earliest
possible stages, thus opening up new opportunities. Also, CDPQ gets an opportunity to screen and
shape potential greenfield investments from the very start, making sure it takes on deals that make
good commercial and financial sense. For CDPQ, it made perfect sense to expand its tried‐and‐tested
real estate investment business model to infrastructure, where it already had plenty of experience
investing in various domestic and international deals. Also, CDPQ Infra’s business model and holistic
approach to investment fits perfectly CDPQ’s philosophy of operational excellence and investing like
a long‐term ‘business owner’.
Case Study #7: Canada’s OTPP47
Ontario Teachers’ Pension Plan (OTPP) is Canada’s largest single‐profession pension fund, and the
third largest pension plan in the country. In December 2015, it had C$ 171.4 billion (US$ 130 billion)
in net assets under management. OTPP was established in 1990 as an independent organisation by its
two sponsors – the Ontario Teachers’ Federation (OTF), representing union members, and the Ontario
Ministry of Finance and Ministry of Education, jointly representing the provincial government. Today
the sponsors continue to play an important role, in that they are responsible for appointing
independent board members, setting pension contribution and benefit rates, and deciding how to
allocate any surpluses or deficits arising as a result of the fund’s performance. But OTPP’s Board is
totally independent, operating at an arm’s length from both sponsors. The organisation works solely
in the interests of 183,000 school teachers, who are currently active members, and 133,000 former
teachers, who are currently in retirement, receiving pension and survivor benefits.
Unlike CPPIB or CDPQ, which operate only as fund managers, OTPP has two distinct but equally
important functions – asset management and pension administration. Therefore, OTPP measures and
reports performance not only in terms of risk‐adjusted returns, but also member satisfaction with the
quality of administration services. For example, based on an independent annual survey of plan
members, in 2015 OTPP scored 9.1 out of 10.0 on the Quality Service Index. Over the years, the
organisation has grown, at the time of writing consisting of 1,100 professionals in three locations –
Toronto, London and Hong Kong. In addition, there are 1,400 people working for the Cadillac Fairview
Corporation, OTPP’s real estate subsidiary. Generally speaking, OTPP can be described as a jointly‐
sponsored defined benefit pension plan, focusing on delivering lifelong pension and survivor benefits
to the school teachers in the province of Ontario. But its role and impact on the Canadian pension
industry is much bigger than that: OTPP is generally acknowledged to have pioneered in 1990 a new
business model, which later came to be known as the Canada Model of institutional fund management.
Liability Profile
It terms of its liability profile, OTPP is a mature pension fund. When it was established in 1990, the
ratio of active members to pensioners was a comfortable four‐to‐one, but at the time of writing in
2016, it had declined to 1.4‐to‐1.0, and will only get more challenging as more baby boomers retire
and life expectancy increases. OTPP and its sponsors put a strong emphasis on intergenerational
equity and risk‐sharing, so contribution and benefit levels are adjusted depending on the plan’s

32
funding status. A funding valuation, which is an assessment of the financial health of the pension plan
showing its assets and liabilities, must be filed with pension regulatory authorities at least every three
years, with valuation dates and the timing of each filing determined by OTF and the Ontario
government. These filings, which look ahead more than 70 years and which are prepared by an
independent actuary, must show that the plan has sufficient assets to pay all future benefits to current
plan members.
The valuation uses a number of assumptions, including future inflation, salary increases, retirement
ages, life expectancy, and – crucially – the discount rate. In OTPP’s case, the latter is derived from the
expected rate of return on investments, adjusted for the costs of running the plan and the risk of
occasional high‐impact adverse events, such as the 2008 financial crisis. The assumption‐setting
process is very robust and includes an in‐depth analysis of the plan’s actual experience: in case of
material deviations, assumptions are reviewed and revised accordingly. The independent actuary,
who works closely with the Board, must verify that the assumptions are appropriate, both individually
and in aggregate. OTPP has identified four main funding risks, which it monitors closely – longevity,
interest rates, inflation and asset volatility. In the event of significant investment losses or a funding
shortfall, there are two primary funding levers that the sponsors can use to bring the plan back into
balance: increase contribution rates and/or reduce conditional inflation protection (CIP). However,
with the decrease in the active member to pensioner ratio, there is a limit to how far contribution rate
hikes can address potential shortfalls. Therefore, there is an increasing focus on CIP adjustments.
In 2016, for the third consecutive year, OTPP had a preliminary surplus, assuming that the current
levels of contributions and benefits continue unchanged into the future. Estimated at C$ 13.2 billion,
it translated into a funding ratio of 107%. CIP was set at 70% of Consumer Price Index (CPI) increases
for pension credit earned after 2009. In 2015, OTPP had a preliminary surplus of C$ 6.8 billion, which
the sponsors allocated equitably: while post‐2009 pension credit CIP level was raised from 60% to 70%,
a substantial amount was reserved to help facilitate stability in contribution and benefit levels in case
of future funding shortfalls. Any future changes in CIP levels will be subject to OTPP’s funding status
on respective valuation dates, which in turn will depend on various economic and demographic factors,
contribution rates and, crucially, long‐term investment returns on OTPP’s portfolio. According to
OTPP’s 2015 annual report, since inception in 1990, only 21% of the fund was accounted for by
contributions, with the remaining 79% coming from investment returns (41% from benchmark
exposure and 38% from active management).
Governance Arrangements
Through a six‐member Partners’ Committee, OTPP’s two joint sponsors appoint experienced,
professional experts to the pension plan’s board, which operates as an independent governing body
responsible for investment management and plan administration. 48 Until 2015, it consisted of 9
members, but due to the organisation’s substantial growth in size and complexity in recent years, it
was expanded to 11 members, with the two sponsors each appointing five members, and then jointly
selecting the chair. Each board member is appointed for a two‐year term, and can serve for up to four
consecutive terms. Board members are required to act independently from both the plan sponsors
and management, making decisions in the best interest of all beneficiaries of the pension plan. Neither
members of the Partners’ Committee nor any representatives of OTPP’s management can sit on the
board, thus reinforcing its independence.

33
The board operates through six committees – Investment, Audit and Actuarial, Human Resources and
Compensation, Governance, Benefits Adjudication, and Operational Risk – as it goes about its business
of approving strategic plans, budgets, investment policies, risk appetite and asset mix, benchmarks,
performance, compensation and succession planning. The board also monitors enterprise risks,
reviews and approves large transactions above pre‐set limits, as well as audited consolidated financial
statements. The board and management share the responsibility for investment management, which
is reinforced by the fact that all board members are also members of the Investment Committee.
However, the sponsors are not involved in such decisions. The board also works with an independent
actuary in conducting regular funding valuations to assess the pension plan’s long‐term financial
health and to advise the two joint sponsors accordingly. The day‐to‐day investment management, plan
administration and normal business affairs of the organisation are delegated by the board to the
President and CEO and his staff.
Investment Strategy
OTPP’s predecessor was a stodgy government‐sponsored public pension plan established in 1917,
which by 1990 had accumulated C$ 18.5 billion of assets invested exclusively in non‐marketable
provincial debentures. 49 With the establishment of OTPP and the strategic decision to run it
independently as a business, major changes started happening as the fund began to transform itself
into a modern‐day long‐term institutional investor. From its very first steps, OTPP engaged in cutting‐
edge innovation, which was evident in how it chose to implement its first foray into equities – using
total return equity swaps.50 By the end of 1993, OTPP increased its equity exposure to 47%. Two other
equally impressive innovations by OTPP during the 1990s were its moves into private equity, both
directly and through external funds, and into real estate by purchasing a specialist property
investment and development platform company. By December 2000, OTPP’s asset mix policy was 57%
equities, which included shares in public and private companies as well as equity derivative contracts;
25% inflation‐sensitive assets such as real estate, inflation‐linked bonds and commodities; and 18%
fixed income securities, primarily federal and provincial government bonds.
[Insert Figure 21]
Throughout the first decade of the new millennium, OTPP’s asset allocation evolved, driven by two
major influences: the impact of the dot‐com crash, which prompted re‐evaluation of the appropriate
level of long‐term equity risk exposure, and the increasing maturity of OTPP’s membership, which
required a more balanced portfolio with respect to stable income and inflation protection. By early
2008, the fund’s asset mix policy was 45% equities, 33% inflation‐sensitive investments, and 22% fixed
income. By that time, OTPP had also expanded its investment universe to include such new alternative
asset classes as infrastructure, timberland, as well as hedge funds and absolute return strategies. Then,
as with many of its peers, OTPP was forced to revisit its approach to investment and risk management
due to the global financial crisis of 2008, during which the fund lost 18%, underperforming its
benchmark by more than 8%.51 In early 2009, after reviewing the portfolio, the asset mix was changed
to 45% inflation‐sensitive investments, 40% equities, and 15% fixed income, with the bulk of the
decrease in the latter due to a cut in credit allocation.52 In the following year, the portfolio grew by
13%, outperforming the benchmark, which – together with capping inflation protection on all post‐
2009 pension credit – put OTPP on a sustainable path to recovery.
[Insert Figure 22]

34
In 2010, OTPP’s approach to target asset mix policy was further reviewed and clarified, by reclassifying
some of the underlying asset classes and strategies and by adjusting certain target allocations. For
instance, absolute return strategies and money market securities, which used to be reported as part
of the fixed income asset class, were now carved out and reported separately. Absolute return
strategies included both internally run programmes as well as external hedge funds, focusing on
generating positive returns uncorrelated to the rest of the portfolio. As for money market instruments,
this allocation was reported as a negative number, reflecting OTPP’s funding operations implemented
by the internal treasury department, acting in a similar capacity to a corporate treasury at a private
firm. Derivative contracts and bond repurchase agreements had played an important role in OTPP’s
portfolio management since the early 1990s, so now the money market allocation gave a better
representation of its crucial part on the funding side of OTPP’s balance sheet. At the end of 2010,
OTPP’s actual asset mix was reported as follows: 45% equities, 44% fixed income, 5% commodities,
25% real assets, 11% absolute return strategies, and a negative ‐30% money markets.
During the next five years, OTPP consistently delivered impressive annual returns between 11% and
13%, comfortably outperforming the benchmark by 1.5‐3.0% every year. By the end of 2015, its asset
allocation had not changed materially, standing at 46% equities, 41% fixed income, 6% natural
resources53, 24% real assets, 11% absolute return strategies, and a negative ‐28% money markets.
[Insert Figure 23]
In line with the Canada Model, approximately 80% of the investment portfolio was managed internally.
OTPP’s model has proven very successful over the long term, having delivered a total annualised
return of 10.3% since inception in 1990 to December 2015, and beating its benchmark by 2.2% per
annum. However, the organisation is certainly not resting on its laurels: at the time of writing, OTPP
was embarking on yet another new chapter in its development, having just hired as the new Executive
Vice‐President and Chief Investment Officer Bjarne Graven Larsen, who had held a similar position at
the Danish pension fund ATP. He has been mandated with implementing a new investment strategy,
and has already started by reorganising OTPP’s investment division.54 It would not be unreasonable to
expect him to bring OTPP closer to the risk factor based approach to asset allocation pioneered at ATP.
Unique Feature55
From the very beginning, OTPP has been at the forefront of innovation in institutional fund
management: from pioneering the Canada Model to accessing equity markets through swaps, from
early direct investments in private equity, infrastructure and timberland to being the first Canadian
pension fund to manage a long/short portfolio and to buy a real estate company – OTPP’s brand has
been synonymous with innovation. But even against this background, there is one particular
transaction which stands out as unique: OTPP’s purchase in 1994 of a local sports team called Toronto
Maple Leafs, which it later developed into a major sports and entertainment conglomerate. The initial
investment of C$ 44 million was subsequently followed up with a total of C$ 229 million, as OTPP’s
private equity arm – Teachers’ Private Capital – professionalised the company, executed on its vision
of building a multi‐faceted and integrated sports and entertainment company, and invested in
broadcasting rights. In 2012, OTPP exited the investment by selling its entire stake for C$ 1.32 billion.
Over the life of its investment that spanned 18 years, OTPP realised C$ 1.21 billion in total proceeds,
generating C$ 977 million of profits and an internal rate of return (IRR) of 16%, representing 5.3 times
total invested capital.

35
There are three reasons why this deal represents a particularly unique case study. First, it is the highly
unusual nature of the investment target: buying and managing a sports team, while building a larger
integrated brand around it and monetising it successfully, is a very rare type of investment for a public
pension fund, not just in Canada but globally. Secondly, it is the timing and format of OTPP’s
investment: not many of its global peers back in 1994 would have gone for a direct private equity
investment along similar lines, even in their home market. Thirdly, it is the length of the investment
horizon. Typically, private equity funds run by external managers have a 5‐ to 7‐year horizon. In
contrast, with its investment in Toronto Maple Leafs, OTPP demonstrated that for a genuinely patient,
long‐term institutional investor it is possible to source and structure deals with much longer horizons,
which is especially beneficial for investors with inter‐generational liabilities. In short, this transaction
illustrated some of the key benefits of the Canada Model: finding new and unusual sources of return,
executing efficiently by investing directly and having control, and matching longer dated liabilities with
much longer investment horizons.
Case Study #8: Australia Future Fund56
The Future Fund is Australia’s sovereign wealth fund (SWF), established in 2006 and managed by the
Board of Guardians, an independent entity operating at an arm’s length from the government and
supported by the Future Fund Management Agency. As of June 2016, its total assets were A$ 123
billion (US$ 92 billion). In addition to the Future Fund, the Board and the Agency are also responsible
for managing four other special purpose public asset funds: the Medical Research Future Fund (A$ 3.2
or US$ 2.4 billion), the Disability Care Australia Fund (A$ 6.1 or US$ 4.6 billion), the Building Australia
Fund (A$ 3.7 or US$ 2.8 billion), and the Education Investment Fund (A$ 3.7 or US$ 2.8 billion)57,
resulting in a grand total of almost A$ 140 billion (US$ 105 billion) under management. Each fund has
a distinct investment mandate determined by the Australian government under legislation: the first
two funds are managed with high risk tolerance and a genuinely long‐term investment horizon,
whereas the last three funds are run much more conservatively, with strong loss aversion and liquidity
preference, resulting in ultra‐short investment horizons of 12 months. Given that the Medical
Research Future Fund was just launched in 2015 and still constitutes a relatively small amount, for our
purposes we shall focus exclusively on the Future Fund.
The Future Fund was established to make provision for the unfunded superannuation liabilities of the
government that will become payable at a time when an ageing population will likely place significant
pressure on public finances. Therefore, its mandate from the outset was framed by a commitment to
sound fiscal management and intergenerational equity. However, while its purpose is to help pre‐fund
a specific government pension liability in the future, the Future Fund is not a traditional pension fund.
Instead, it can be viewed as a particular type of SWF, sometimes referred to as a national pension
reserve fund. There are two reasons to make such a distinction. First, the source of funds here is not
pension contributions, but general budget surpluses and privatisation proceeds. 58 Secondly, the
ultimate ownership of these funds rests with the taxpayers rather than current and future pensioners.
In other words, the money belongs to the sovereign, who just happened to choose – from many
different possible ways of using it – to accumulate and save it to cover a particular pension‐related
future liability.

36
Liability Profile
The fund’s objective is to help Australia’s federal government meet its unfunded defined‐benefit
pension liabilities in the future. Currently, these liabilities are being paid out of consolidated revenue.
However, the enabling legislation set 2020 and 2040 as two specific reference points on the Future
Fund’s timeline for realising its goals and objectives. The former date was identified as the likely year
when the balance of income and benefit payments will switch from net inflows to net outflows: in
principle, the government will be able to make the first withdrawals from the fund starting in July
2020. The latter date is the year when the payment of superannuation benefits is likely to conclude:
since the plan has been closed to new members, it is possible to make such an estimate with a
considerable degree of certainty. Therefore, at inception in 2006, such a liability profile effectively
endowed the Future Fund with a long‐term investment horizon and a reasonably stable capital base.
It is important to point out that, even though the fund’s liability profile was clearly defined and the
relevant timeline explicitly specified, there was by design no asset‐liability management (ALM)
framework put in place. In other words, how the Future Fund’s assets are invested and managed is
not supposed to be directly influenced by any year‐to‐year changes in the government’s pension
liabilities due to, for example, increases in longevity or moves in interest rates. The focus is solely on
managing the asset portfolio based on the investment mandate and directives established by the
government, which provide guidance with respect to the objective, risk tolerance, constraints,
investable universe and benchmark. However, the fact that the government will have the right to
make withdrawals from 2020 onwards does have potential investment implications: namely, the level
of illiquidity that the fund will be able to take on, and the level of future returns that can be realistically
expected from a progressively smaller and more liquid portfolio. The Board of Guardians is currently
engaging with the government to develop a clear and shared understanding on these issues.
Governance Arrangements59
The Future Fund’s enabling legislation clearly sets out the roles and responsibilities of the government,
the Board, and the Agency. The federal government, through the responsible ministers, has oversight
of the fund. It retains beneficial ownership of the assets, appoints Board members, and establishes
the investment mandate for the fund. The Board is responsible for investing and managing the assets,
based on its interpretation of the guidance contained in the investment mandate. To assist it in this
role, the Board receives advice and recommendations from the Agency, which is also responsible for
implementing the Board’s investment decisions. The Board’s independence is sacrosanct, secured in
three critical ways: (1) the expenses of the Fund are met from the underlying assets rather than from
appropriations through Parliament; (2) while the government defines overall risk and return
requirements, legislation imposes very few limitations on the Board with respect to asset allocation,
selection of markets and portfolio design; and (3) Board members must be drawn from outside
government and have substantial expertise and professional credibility in finance and governance.
Naturally, with such strong independence comes the requirement for full transparency and
accountability. Every year the Board tables in Parliament its annual report and audited financial
statements, while also publishing quarterly updates on investment activity and portfolio performance.
The responsible ministers are kept informed of the fund’s operations on a regular basis, while Board
members also routinely appear in Senate committee hearings.

37
While this governance model looks very similar to those at other public sector funds that have
independent boards operating at arm’s length from governments, there are three subtle but
important features of the Australian approach which make it potentially even more robust and
efficient. First, the legal responsibility and accountability of Board members goes beyond conventional
expectations derived from trust law and traditional pension fund governance: by referring to them as
‘guardians’, the legislation accords them higher status and significance than would be normal for
‘trustees’. This underscores the fact that they represent a claim by future generations on current
public policy and today’s taxpayers. Secondly, the size and composition of the board makes it
particularly well suited for efficient governance. Whereas in other countries attempts to balance
representation and expertise often lead to large and unwieldy boards of fifteen or even more
members, the Board of Guardians is comprised of only seven members, including the chair, who must
all have, first and foremost, relevant experience and expertise. Thirdly, unlike other funds, where
board members are often appointed for renewable terms of two or three years, the normal term for
a guardian on the board of the Future Fund, which is also renewable, extends to five years, which
makes the tenure of the average board member meaningfully longer than the typical political cycle.
Investment Strategy
The investment mandate presented by the government to the Board at inception in May 2006 has
remained practically unchanged throughout the 10 years of the Future Fund’s operations: deliver an
annualised rate of return of 4.5% to 5.5% above Australian Consumer Price Index (CPI) over the long
term, while taking acceptable but not excessive risk, subject to three conditions –
Being consistent with international best practice for institutional investment;
Minimising the impact on domestic financial markets;
Avoiding anything that could damage the Australian government’s reputation.
In addition, the enabling legislation explicitly stipulated that management of the fund’s assets must
be delegated to external managers. After considerable deliberation, the Board and the Agency chose
to interpret the mandate such that achieving the required long‐term returns would mean beating the
CPI benchmark on a rolling 10‐year period, whereas acceptable but not excessive risk was determined
as a particular expected maximum‐loss threshold, determined over two horizons – rolling 3‐year and
10‐year periods. In order to reconcile these two (sometimes conflicting) objectives, the Board and the
Agency have designed a very distinct investment management framework, which we will now review
in the context of its evolution over the years.
The Future Fund’s 10‐year history can be logically divided into four sub‐periods. The first one, between
2006 and 2009, was spent building up the investment team, putting in place the necessary
infrastructure, restructuring the original portfolio of cash and in‐kind contributions received from the
government, gradually ramping up risk and diversifying into various asset classes and strategies. This
meant that the fund had to maintain lower‐than‐optimal levels of risk exposure, which proved
fortuitous, given that it lost less during the global financial crisis than it would have otherwise.60 By
the end of this period, the fundamental principles of the fund’s approach to investment and risk
management had been established. First, instead of looking at the investment universe through the
prism of traditional, fairly granular asset classes, the team decided to use six broad investment
categories. Secondly, a framework called Long‐Term Strategic Asset Allocation (LTSAA) was adopted,

38
describing the team’s view of a notional portfolio which represented the level of exposure to each
broad category that might be, on average, held over time. Thirdly, on a 3‐year horizon, the team also
devised so‐called Target Asset Allocation (TAA), which represented their best judgement about the
current investment opportunities.
[Insert Figure 24]
The second sub‐period, from 2009 to 2012, was marked by a noticeable increase in the risk level taken
on by the fund, which was reflected in its LTSAA portfolio: 32.5% public equity, 7.5% private equity,
15% debt, 25% tangible assets, 15% alternative assets, and 5% cash. 61 Three noteworthy
developments occurred throughout this period with respect to portfolio management: (1) the concept
of LTSAA was eventually dropped, leaving only the TAA framework, resulting in an even more dynamic
and flexible approach to asset allocation; (2) the legacy holding in previously locked up Telstra shares
had been fully rebalanced; and (3) the actual level of cash fell to 10.6%, with a TAA target of 7.5%. The
third sub‐period started in 2012 with a further ramp‐up in risk, following Mario Draghi’s ‘whatever it
takes’ comment and the massive uplift in risk assets that it unleashed. As the team maintained a still
higher risk posture, the levels of cash bottomed around 5.8% in June 2013.
[Insert Figure 25]
However, as bond yields reached historical lows and valuations of equities and other risk assets were
beginning to look increasingly stretched, the Future Fund initiated a gradual process of de‐risking the
portfolio, marking the start of the fourth sub‐period around 2014. As a result, by June 2016, the
corollary of the fund’s reduced exposure to both risk and debt assets was a massive 22% allocation to
cash. At the time of writing in October 2016, the asset allocation was as follows: 29% listed equities
(15% developed markets, 7% emerging markets, 6% Australian shares); 10% private equity; 12% debt
securities; 14% tangible assets (7% property, 7% infrastructure & timberland); 14% alternative assets;
and 22% cash.
[Insert Figure 26]
The performance generated by the Board and the Agency during the first decade of managing the
Future Fund is impressive. On the combined base of cash and in‐kind contributions valued at A$ 60.5
billion, by 2016 the fund produced cumulative investment returns of A$ 62.3 billion, thus more than
doubling the investment that had originated it. This represented an annualised return of 7.7%, which
was above the realised baseline target return of 6.9%.62 In the meantime, the internal team had grown
from 6 permanent staff in 2006 to 129 professionals in 2016, which still makes it one of the smallest
teams amongst their institutional peers. Even as the Future Fund continues to focus on generating
absolute returns above its CPI‐plus benchmarks on a rolling 10‐year basis, it still requires a sensible
way of measuring and evaluating staff performance on a still meaningful but shorter horizon. The
preferred solution is to look at the returns generated by the management team in excess of the policy
portfolio implied by the TAA over rolling 3‐year periods.63 On this measure, the results have also been
encouraging: for the 3 years to June 2016, the actual portfolio outperformed the policy portfolio by
70 basis points per annum.

39
Unique Feature64
The most unique feature of Australia’s Future Fund, in our view, is that the combination of its core
characteristics discussed above makes it the closest equivalent in the public pension and SWF industry
of the celebrated Yale University Endowment Model. For those who closely followed the Board and
the Agency in their early formative years this should not come as a surprise: it is a matter of record
that David Neal, the fund’s Chief Investment Officer at the time who has since become the Chief
Executive Officer, looked for inspiration not so much to his peers in pension organisations or SWFs,
but rather to university endowments, charitable foundations and even multi‐strategy hedge funds.
Yale’s investment office was one of the confirmed early role models, while Charles Ellis, who used to
chair Yale’s investment committee, was also retained as a consultant to Australia’s nascent SWF.
Consider the following five core characteristics of the Yale Model and how neatly they map onto the
Future Fund model:
1. The governing body of Yale’s Endowment Fund is an independent, relatively small, and highly
professional board called the Yale Corporation Investment Committee, consisting of 10
members selected for their senior‐level investment experience and expertise.
2. A small internal management team called the Investment Office, consisting of 31 professionals
and overseen by the board‐like Investment Committee.
3. Almost exclusive reliance on external fund managers and service providers in implementing
Yale’s investment programme and selecting individual investments.
4. Focus on absolute returns unconstrained by a traditional benchmark; preference for dynamic
allocation of risk using a periodically reviewed and updated ‘target asset allocation’.
5. Heavily equity risk‐centric portfolio, with a strong preference for alternative asset classes,
especially less liquid investments traded in private markets.
There are only two potential downsides that are sometimes discussed in the context of applying the
Yale Endowment Model to large‐scale institutional portfolios. First, this model appears to work only if
one can consistently access high‐quality external managers, who do not have limitless capacity in their
funds, so there is a question of realistic limits on allocation size. Secondly, these managers tend to be
very expensive in terms of management and incentive fees. However, so far, Australia’s Future Fund
seems to have defied the critics, having delivered a strong performance even as its assets reached
A$ 123 billion.
Case Study #9: New Zealand Superannuation Fund65
New Zealand Superannuation Fund (NZSF) is a sovereign wealth fund (SWF), established in 2001 and
managed by a Crown entity called the Guardians, an organisation which is part of the broader New
Zealand government, but which operates autonomously. As of October 2016, its total assets were
NZ$ 32 billion (US$ 22 billion). The purpose of NZSF is to pre‐fund future government pension liabilities,
thus alleviating the burden on future taxpayers. All citizens and permanent residents of New Zealand
aged 65 and over are eligible for universal superannuation benefit payments from the government,
which are currently funded by taxpayers. As the population ages and the ratio of pensioners to
workers increases, the fund will help spread the funding burden across generations more equitably.
The fund is a pool of assets on the government’s balance sheet, but it is not a separate legal entity in
its own right. However, the Guardians of New Zealand Superannuation were established as an

40
independent legal entity to manage the assets on a prudent and commercial basis, subject to three
conditions: (1) maximising returns without undue risk to the fund as a whole; (2) applying international
best practices in investment management; and (3) avoiding prejudice to New Zealand’s reputation as
a responsible member of the world community.
It is clear that the general concept and overall framework developed by the New Zealand government
around NZSF later served as a model for the Australian government when it was setting up the Future
Fund. New Zealand established its fund five years prior to Australia, offering a helpful template and a
series of useful lessons.66 There are indeed a number of very close parallels between the two entities:
SWF structure to help pre‐fund a specific future pension liability of the government;
Independent legal entity operating at an arm’s length from the government;
Small, professional board of ‘guardians’ vs. large, representative board of ‘trustees’;
High level of operational autonomy and flexibility, with full transparency and accountability;
Very similar objectives and constraints, subject to interpretation by the board;
Strong preference for dynamic and flexible asset and risk allocation;
Relatively small internal teams, relying heavily on external managers.
However, in spite of all these similarities, after the global financial crisis the two funds started to
diverge, in increasingly material ways, in how they approached investment and risk management. In
our estimate, slowly but surely, NZSF started to evolve towards a variation of the Canada Model, with
the introduction in 2009 of a reference portfolio and an increased emphasis on in‐sourcing and
developing internal capabilities, especially in various illiquid asset classes traded in private markets.
That being said, even as NZSF moves closer to the Canada Model, it still retains at least one distinctive
feature from each of the other two models. While it does not rely exclusively on external managers
like Australia’s fund, and even as it continues to take on more investment mandates in‐house, NZSF
still maintains a relatively small team of 115 staff, managing less than half of its assets internally.67 As
for the similarity with Norway, NZSF manages the bulk of its assets passively, even as it varies the
amount it allocates to and from the reference portfolio depending on perceived opportunities for
active management.68
Liability Profile
The fund’s objective is to help New Zealand’s future governments meet their universal pension
liabilities while lowering the burden on future generations of taxpayers. Currently, these liabilities are
being paid out of consolidated revenue. However, it was already clear at the start of this millennium
that due to population ageing and longer life expectancy, the increase in pensioners to workers ratio
would render this pay‐as‐you‐go system unsustainable: NZSF’s 2003 inaugural annual report
contained estimates that, without pre‐funding, the annual cost of providing superannuation payments
would more than double from 3.6% to 8.0% of GDP by 2050. To prepare for this, the government
committed to allocate an average of just over 1% of annual GDP to the fund over the course of 20
years. It was estimated that, as a result, by 2023 the fund would grow to NZ$ 100 billion. By law, no
withdrawals are allowed before 2020. But even as the government inevitably starts drawing money
from NZSF at some point in the future, the fund is expected to continue growing due to compounding
investment returns.

41
From 2003 to 2009, everything proceeded according to plan: the government made annual
contributions to NZSF, which by the end of the period reached a cumulative amount of NZ$ 14.9 billion.
However, with the government budget going deeply into deficit due to the impact of the global
financial crisis, the decision was made to temporarily suspend annual contributions until the fiscal
situation improved and the Crown operating balance returned to surplus. At the time of writing in
2016, the expectation was that once the core net debt of the government declined to 20% of GDP, it
would resume contributions, most likely around 2021. First withdrawals to support the pension
system are expected around 2032, although the fund will continue to grow and is expected to peak
around 2070. In the meantime, in the absence of government contributions, growth in NZSF assets
has come entirely from investment returns: by 2016, the investment team has more than doubled the
amount of the original government contributions, with assets under management exceeding NZ$ 30
billion.69
Governance Arrangements
The Guardians of New Zealand Superannuation are an autonomous Crown entity, legally separate
from the government and operating at what is referred to as ‘double arm’s length’, meaning that there
are effectively two layers of decision‐making which secure NZSF’s independence from the government.
The first step in finding the right candidates to serve on the Board of Guardians is for the government
to appoint members to an independent nominating committee. The latter then reviews and short‐lists
appropriate candidates who fit the required criteria with respect to skills, knowledge, expertise and
experience in relevant areas. This is the first layer of independence, in the sense that the government
has no say in creating the short‐list. Once the candidates have been identified, the nominating
committee presents the list to the Minister of Finance. Upon consultations with other political parties,
the minister then recommends a particular candidate to the Governor‐General70, who then officially
appoints the person in question. Once the new member of the Board joins the rest of the Guardians,
the government once again finds itself in a position where it does not have a say in how the fund’s
assets are invested and managed. This constitutes the second layer of independence.
The Board must comprise at least five, but not more than seven members. Each Board member is
appointed for up to five years and is eligible to be reappointed. The responsibilities of the Guardians
primarily focus on establishing the objectives, corporate strategy, investment policy framework, and
the level of risk appropriate for the fund; overseeing and supervising the management team; and
ensuring that decision‐making authorities are clearly defined and that both the organisation and the
fund are managed well and in compliance with all the relevant laws and regulations. There are two
standing committees, Audit and Employee Policy & Remuneration, but the Board can also set up
temporary sub‐committees for particular issues. Performance of the Board, committees and individual
members is evaluated at least bi‐annually. The Guardians maintain the highest levels of transparency
and accountability, providing regular and full updates with various frequencies: tri‐annual updates of
the five‐year plan; annual statements of performance expectations at the start of the year, followed
by annual reports at the end of the year; annual reviews in Parliament with participation from the
Office of the Auditor General; as well as quarterly and monthly updates on fund performance, strategy
and various organisational matters.

42
Investment Strategy
While the legislation establishing NZSF was passed in October 2001, the fund made its first investment
in September 2003, having spent the preceding two years appointing the Guardians, hiring the CEO
and the management team, putting in place the necessary infrastructure, and formulating an
appropriate investment strategy. With respect to the latter, NZSF considered expert advice from one
of the largest global investment consulting firms, subsequently retaining one of its major competitors
to provide a peer review. Based on this analysis, and given the long‐term horizon and the stability of
expected contributions, two fundamental conclusions were drawn by the Guardians: international
best practice meant wide diversification across different asset classes and geographies, and the best
way to maximise long‐term returns was to invest a large portion of the fund in growth assets such as
equity and property. The resulting inaugural asset allocation was 80% ‘growth’ assets and 20%
‘defensive’ assets, with the former comprising 67% listed equities, 6% property, and 7% private equity,
infrastructure and commodities, while the latter was split into 10% international and 10% domestic
bonds. The fund’s long‐term absolute performance target was set to exceed, before New Zealand
taxes, the risk‐free rate of return by an average of 2.5% per annum over rolling 20‐year periods.71
[Insert Figure 27]
During the first few years, in line with their commitment to aggressively diversify the portfolio, the
Guardians awarded multiple mandates covering various segments of listed equity markets: large‐cap
and small‐cap companies in developed and emerging economies, as well as in New Zealand. In 2005,
NZSF made its first allocations to global listed property, global infrastructure, domestic private equity
and unlisted property, US and New Zealand timber, and commodity futures. Subsequently, the fund
also made allocations to global private equity, multi‐strategy and long/short hedge funds. While there
were a few investments in domestic real assets that were made directly and managed internally, the
vast majority of NZSF’s allocations were made to external managers. However, from 2009 this
gradually began to change, driven by two developments. First, with the arrival of the new CEO in 2007,
a stronger emphasis was placed on developing internal capabilities and expanding the team. Secondly,
the global financial crisis of 2008‐09, during which the fund suffered a peak‐to‐trough unrealised loss
of almost 31%, reinforced the potential benefits of getting more control over some of the key portfolio
and risk management functions. This has resulted in two important changes to the investment process
and a further expansion of the fund’s investable universe.
First, the Guardians switched from traditional strategic asset allocation with a multi‐asset fixed‐weight
benchmark to using a reference portfolio consisting of a few simple, low‐cost, liquid and investable
market indices. This represented a much more clear‐cut and flexible framework for dynamic allocation
of risk across various investment opportunities, irrespective of asset class, geography or strategy type.
However, fundamentally, the fund’s ethos remained the same, as broad exposures to core risk factors
remained unchanged: 80% ‘growth’ assets (70% global equities, 5% domestic equities and 5% global
listed property) and 20% fixed income.
[Insert Figure 28]
Secondly, NZSF introduced two macro strategies run by the internal team – Strategic Tilting and
Portfolio Completion, which were later complemented by Collateral Management and Direct
Arbitrage strategies. Eventually, internal capabilities were extended to include both international and

43
domestic direct investments, as well as domestic active equities. With the deepening and broadening
of the Guardians’ expertise, the team felt comfortable to expand the investment universe, albeit via
external managers, into more esoteric alternatives such as natural catastrophe reinsurance and life
settlement contracts.In 2015, as part of a five‐yearly review process, the Guardians made some minor
revisions to the reference portfolio. While they maintained their signature 80/20 split, ‘growth’ assets
now contain 65% developed markets equity, 10% emerging markets equity, and 5% domestic equity.
[Insert Figure 29]
Based on this long‐term risk‐return profile, the board sets a specific active risk budget, which is then
allocated by the internal team to the most promising, high‐conviction investment opportunities. To
facilitate this process, all investment opportunities are grouped into five broad risk baskets:
Asset selection skills (e.g. internal / external active equity mandates, opportunistic buyouts)
Market pricing/Arbitrage, Credit & Funding (e.g. internal Active Collateral, Direct Arbitrage)
Market pricing/Broad Markets (e.g. internal Strategic Tilting, external global macro)
Market pricing/Real Assets (e.g. internal / external real estate, infrastructure, energy assets)
Structural risk (e.g. timber, life settlements, catastrophe bonds, etc.)
Whenever the team is able to find multiple interesting and compelling opportunities, the actual
portfolio tends to deviate considerably from the reference portfolio. At other times, it is managed
much more closely to it.72 Since July 2015, the long‐term performance objective of the Guardians has
been reaffirmed, albeit with a slight modification: (1) outperform the rate on 90‐day Treasury bills by
2.7% per annum73 and (2) outperform the reference portfolio by 1% per annum, both over rolling 20‐
year periods. So far, throughout the life of the fund, the results have been encouraging: since inception,
NZSF has generated annualised returns of 9.44%, which translated into a cumulative net investment
gain of NZ$ 4.3 billion. This represented annual outperformance of 1.24% over the reference
portfolio74 and 5.03% over 90‐day Treasury bills.
Unique Feature
Strategic Tilting is an active investment programme, introduced in April 2009 and run by the internal
team to generate returns in excess of the reference portfolio. It is anchored in an explicit investment
belief that markets are not entirely efficient, in that prices often deviate materially from fundamental
values in the short term, but tend to revert to the mean over the longer term. For investors like NZSF,
with a long investment horizon and patient capital, this represents an opportunity. Based on the
team’s evaluation of the price/value gaps across a wide range of markets and currencies75, and
operating within the allocated risk budget, the programme takes overweight and underweight
positions in proportion to the degree of perceived under‐ and over‐valuation of the respective assets.
The intention is to hold these positions over extended periods of time, measured in months and years.
The attractiveness of these positions is continuously evaluated as prices evolve through time and the
tilting positions are adjusted accordingly. It is important to stress that by design this is a contrarian
programme driven exclusively by long‐term fair value; it does not in any way incorporate market
timing or momentum.
The reason this programme is unique is that it incorporates and adapts global macro methodologies,
analytics and tools, which historically tend to be deployed by short‐term, leveraged and liquidity‐

44
constrained hedge funds, in the context of a long‐term, unleveraged and relatively unconstrained
sovereign institutional investor. Hedge funds typically translate their macro views into relatively short‐
term trading positions, with most of their returns generated over time from momentum‐based or
trend‐following strategies. In contrast, as illustrated by the Strategic Tilting programme, investors like
NZSF translate their macro views into relatively long‐term investment positions, generating returns
from contrarian, value‐driven, mean‐reverting strategies. Not many institutional investors currently
do this on a sufficiently large scale, so unlike the case of macro hedge funds, this space is still relatively
uncrowded. However, we expect more institutions to follow the pioneering trail blazed in global macro
by the Guardians of New Zealand Superannuation.
Case Study #10: Singapore GIC76
GIC Private Limited, formerly known as the Government of Singapore Investment Corporation, is the
sovereign wealth fund of Singapore entrusted with managing the bulk of the city‐state’s foreign
reserves. Established in 1981, GIC has grown to manage assets of approximately US$ 350 billion.77 GIC
does not own these assets: its sole purpose is to act as an agent on behalf of the government.78 Just
like Norway’s fund, GIC was created due to a pressing macroeconomic policy imperative. Unlike
Norway, however, the source of funding was different, as was the nature of the macroeconomic
challenge the Singaporean authorities were trying to address. After gaining independence in 1965 and
throughout the 1970s, Singapore had accumulated vast foreign exchange reserves, which was the
inevitable result of running sustained balance of payments surpluses in a country with a pegged
exchange rate. Subsequently, the government ran a prudent fiscal policy, generating persistent budget
surpluses, together with a mandatory pension saving system called the Central Provident Fund (CPF),
which was yet another source of money accumulating in the government’s accounts. By 1981, the
authorities made the strategic decision to set up a dedicated government‐owned investment vehicle
to manage Singapore’s burgeoning ‘excess’ reserves and national savings more efficiently, with the
aim of improving long‐term risk‐adjusted returns.79
Throughout GIC’s history, the authorities maintained a very high level of confidentiality around
anything to do with foreign reserves: there was no public disclosure of the fund’s asset size,
composition or returns; no information on its investment strategy; no substantive discussion of the
organisation, its structure and management. The watershed moment came in September 2008, when
GIC published its first annual report, opening up in a meaningful way and subsequently providing
useful updates about various aspects of its operations. However, it still does not disclose the exact
amount of assets under management nor annual returns. Instead, it chooses to constantly refer to the
underlying portfolio as being “well over US$ 100 billion” and to report its performance in terms of
annualised rates of return over 20‐year rolling periods.80 The reason for this is the government’s firmly
held view that full disclosure would not be in Singapore’s national interest, given the city‐state’s
potential vulnerabilities to external macroeconomic dislocations, speculative currency attacks and
occasional geopolitical shocks. With no natural resources to keep the country going in times of crisis,
these reserves represent an insurance policy against unforeseen circumstances and a shock absorber
for Singapore’s small and open economy. Revealing the full extent of the available war‐chest is
deemed unwise and imprudent.

45
Liability Profile
With respect to the sources of funds, the bulk of GIC’s capital at inception appears to have originated
from ‘excess’ foreign exchange reserves. However, most of the later funding came from other sources:
budget surpluses, proceeds from the government’s land sales, and proceeds from the issuance of
Singapore government securities that were placed with the CPF in order to guarantee the rate of
return in local currency promised to its beneficiaries.81 In the latter case, the government effectively
incurred (and continues to incur) multiple mismatch risks. However, as far as GIC is concerned, neither
the original source of funds nor the apparent asset‐liability mismatch are relevant: the government
does not specify to GIC either the proportion of assets from each source or their cost of funding.
Instead, the Ministry of Finance (MOF) takes full ownership of these risks, balancing them against the
entire asset side of the national balance sheet, which includes foreign and domestic assets managed
by MAS, GIC and Temasek. Based on the MOF’s asset‐liability modelling and estimates of risk, it
mandates GIC to manage all assets entrusted to it as a single pool, on an unencumbered basis and
without regard to their source, with the aim of achieving good long‐term returns, subject to pre‐
specified risk tolerance and time horizon.
As for the use of funds, under the Amendment to the Constitution passed in 2008, every year the
government is allowed to spend up to 50% of the long‐term expected real return on the net assets
managed by GIC and MAS, which is equivalent to approximately 2% of Singapore’s gross domestic
product (GDP).82 The government’s reserves thus provide a stream of returns that benefits the current
generation of Singaporeans. At the same time, by focusing on real returns and capping annual
expenditures at 50%, the principal is both inflation‐protected and enhanced, thus contributing to the
welfare of the future generations of Singaporeans. The fund managed by GIC thus effectively
represents a national endowment portfolio, with a clearly defined annual spending rule, but no
explicitly defined future liabilities. However, it also has a role as an insurance policy and a shock
absorber in times of crisis. Therefore, in addition to its annual endowment‐type payments into the
budget, the fund has contingent liabilities and may be called upon in extraordinary times. For such
eventualities, there is a special provision in the Constitution, which was adopted in 1991: it established
the post of a directly elected President who, among other duties, is entrusted with safeguarding the
accumulated reserves. We review this arrangement in more detail below as Singapore’s unique
feature.
Governance Arrangements83
GIC was incorporated in 1981 under the Singapore Companies Act, borrowing the template for its
structure and governance directly from the corporate world. As such, GIC has many of the best
features of Western publicly listed companies, such as having a board of directors composed of both
executive and non‐executive members, with the latter including government officials and
independent directors. The GIC Board is supported by five committees, the functions of Chair and CEO
are separate, while knowledgeable and experienced external advisers are routinely brought in to sit
on various boards and committees throughout the broader organisation. The mission is clear, the
delineation of responsibilities is well defined, and accountability is maintained through several
different channels for regular reporting and disclosure to the relevant parts of the government,
including the directly elected and politically independent President of Singapore. Importantly, this
whole construct and the relevant governance protocols are based upon, and operate within, the city‐

46
state’s highly efficient and corruption‐free civil service. After 35 years since the inception of GIC, all
the best practices and principles of governance have been fully and deeply embedded into the fabric
of the organisation and its relations with its stakeholders.
The MOF, representing the government as the beneficial owner of assets, has the responsibility to
ensure that a competent board of directors is in place. Once this has been achieved, the MOF then
specifies GIC’s mandate, which sets out the terms of appointment, investment objectives, investment
horizon, risk parameters and investment guidelines for managing the reserves. Operationally, the
most important directive focuses on the amount of total risk which GIC can incur in pursuit of good
long‐term returns. Then the MOF takes a step back: while it holds the GIC Board accountable for the
overall portfolio performance, it does not direct or influence GIC’s operational and investment
decisions. The corollary to this operational autonomy is the system of regular reports and disclosures
which has been put in place to ensure accountability: GIC provides monthly and quarterly reports to
the government through the Accountant‐General of Singapore; GIC holds annual portfolio review
meetings with the MOF; the GIC portfolio and the main companies in the GIC group are annually
audited by the Auditor‐General, who is appointed by the President of Singapore and who submits
annual audit reports to the President and Parliament.
The 15‐member GIC Board is responsible for determining long‐term asset allocation and for
overseeing the overall management of the portfolio. It is supported by five committees: Investment
Strategies, Investment Board, Risk, Audit, and Human Resources & Organisation. There is also a 7‐
member International Advisory Board, chaired by a Deputy Prime Minister and consisting of six highly
knowledgeable and experienced financial experts from overseas. Once the long‐term asset allocation
strategy has been decided by the Board, the management then seeks to add value through active,
skill‐based strategies within the risk parameters set by the Board. In managing the portfolio, GIC
implements investment strategies through three separate and distinct entities: GIC Asset
Management, which focuses on public markets; GIC Real Estate, which focuses on property; and GIC
Special Investments, which focuses on private equity and infrastructure. Each entity has its own board
and management. To facilitate effective workflow and coordination throughout the whole of GIC, top‐
level management is organised around four committees: Group Executive Committee, Investment
Management Committee, Direct Investment Steering Committee and Group Risk Committee. While
at first glance it may come across as a large and unwieldy structure, it appears to have performed well
over the years, considering the size of assets and the scope of the organisation.84
Investment Strategy
When GIC was established in 1981, it inherited a legacy portfolio from MAS which consisted of
Treasury bills, short‐term bonds and gold. Having retained Rothschild as an adviser, it embarked on
the path of diversifying the portfolio into riskier assets with higher expected long‐term returns. It
started by mandating external managers to invest on its behalf in US and Japanese equities,
subsequently following up with mandates for European and other Asian equities. It also established
new internal units for private equity and real estate: GIC was one of the earliest institutional investors
in these asset classes, although the allocation amounts at that time were fairly small. Initially, US and
UK markets accounted for 60‐70% of the portfolio, but with the end of the Cold War, GIC started to
expand into emerging markets, especially South‐East Asia and China.85 During the first two decades of

47
operations, GIC ran a very conservative long‐term asset allocation strategy: 30% equities, 40% bonds,
and 30% cash.
[Insert Figure 30]
While this may have been appropriate in the early growth stages in the 1980s, when GIC was viewed
largely as a contingency fund, towards the end of the millennium, as it increasingly transformed into
a national endowment fund, GIC started to come across as overly conservative and lagging its more
advanced institutional peers.In the early 2000s, the MOF and GIC embarked on a major review of the
fund’s investment objectives and asset allocation policy. By 2003, it was decided that the government
could accept higher risk and illiquidity in the portfolio, resulting in higher target allocations to equities,
especially in emerging markets, and to new alternative investments, such as commodities, inflation‐
linked bonds, infrastructure and absolute return strategies. Reflecting GIC’s increased risk tolerance,
allocations to bonds and cash were reduced steadily from more than two‐thirds to less than one‐third
of the portfolio. Over the decade, the GIC policy portfolio grew to include 13 distinct asset classes.
Although GIC openly referred to the US university endowment model as the template they had in mind
when they made the changes, throughout the period, GIC’s allocations to equities and alternative
assets remained smaller than those of the major endowment funds in the US. During this period, GIC
showed remarkable ability to adapt to unexpected market developments: from 2007 to early 2009, it
deliberately and proactively reduced its public equity allocation by more than 10%, mitigating the
impact of the global financial crisis. Once the recovery started, GIC swiftly reversed course and caught
most of the uplift in public equity. By March 2011, the policy portfolio had 49% allocation to public
equity (34% developed and 15% emerging), 22% allocation to fixed income (20% nominal and 2%
inflation‐linked bonds), 26% allocation to alternatives (10% each in real estate and private
equity/infrastructure, with 3% each in absolute return and natural resources), and 3% in cash.
[Insert Figure 31]
However, in the wake of the crisis, two major conclusions were drawn: structural exposure to
emerging markets had to be increased and a more flexible medium‐term asset allocation framework
had to be devised. In 2012, the MOF and GIC embarked on their second major review of the
investment process, resulting in a new investment framework adopted from 2013. They introduced
the concept of a Reference Portfolio, approved by the MOF to define the government’s long‐term risk
preference. In GIC’s case, the allocation was set at 65% global equity and 35% global bonds.
[Insert Figure 32]
Then, at the next level, the GIC Board decides on a Policy Portfolio, which consists of 6 major asset
classes: as of March 2016, the allocations were 26% developed market equities, 19% emerging market
equities, 34% nominal bonds and cash, 5% inflation‐linked bonds, 9% private equity and 7% real estate.
This portfolio remains the central component of the investment framework and represents GIC’s
exposures to key systematic or market risks.
[Insert Figure 33]
Finally, on the third level, GIC’s management team constructs and manages an Active Portfolio, which
is an overlay of active, skill‐based strategies aiming to add value to the Policy Portfolio within the

48
board‐approved active risk budget.86 This new investment framework not only improves flexibility of
decision‐making, it also reaffirms who is responsible for what: the MOF owns the Reference Portfolio
decision, the Board is responsible for the Policy Portfolio, while GIC’s management and investment
team are held accountable for the Active Portfolio.
Unique Feature87
In managing its reserves, Singapore has developed a unique rules‐based system of checks and balances,
which helps maintain inter‐generational equity and keeps populist spending pressures at bay. With
respect to annual payments into the budget, we already mentioned the spending rule introduced in
2008, which capped them at 50% of long‐term expected real return on net assets.88 But what about
withdrawals from accumulated reserves for contingency purposes? In normal circumstances,
Singapore’s constitution allows the government of the day to draw down only on those reserves which
it has accumulated during its term of office. For past reserves to be unlocked and used for current
spending, there is a specifically defined protocol based on the so‐called ‘two‐key system’. The
government and the President of Singapore each holds a virtual key that must be turned
simultaneously to unlock the reserves, which means that both must agree that the current conditions
warrant such a decision and that the spending programmes in question meet the necessary
specifications. This safeguard relies on the political independence of the president from the
government, which is assured through a number of legally specified provisions.
The president, who is elected directly by Singaporeans every six years, is forbidden from being a
politician or member of a political party, and cannot hold any government jobs at the time of his
election or during his tenure as president. The president receives regular and detailed accounts from
all entities managing the country’s reserves, including GIC. The GIC’s annual budgets require the
approval of the president, and nobody can be appointed to or removed from the GIC Board without
his concurrence. The Auditor‐General, who carries out independent audits of GIC and its portfolio, is
appointed by and reports to the president. The president may withhold his assent to any budget of
any statutory board or government company, including GIC, which, in his opinion, is likely to draw on
past reserves. In those cases when the government explicitly proposes to unlock past reserves, the
president must evaluate the merits of the government’s case and, if he agrees, he must publish his
justification for this in a government bulletin. The constitution further reinforces the separation of
powers by enabling the government – but not the president – to propose unlocking past reserves.89
Bringing It All Together
With only ten funds highlighted in the paper, our sample is extremely limited. That being said, it does
cover a very diverse set of entities, located in eight countries across three distinct regions and ranging
in asset size from US$ 22 billion to US$ 854 billion and in staff from just over 60 to 2,600 employees.
There are four sovereign wealth funds: two of the endowment variety, with annual spending rules and
contingent liabilities, and two established to pre‐fund specific future pension liabilities of their
respective governments. The other six funds are classic public pension plans, but they also happen to
be very different in terms of liability profiles and institutional types: there are defined contribution
(DC) and defined benefit (DB) type funds; there are buffer funds for smoothing out and only partially
covering future benefit payments and pension funds designed to fully cover targeted benefits; there
are those who have only one client and those who service multiple clients; there are organisations

49
which focus exclusively on managing assets, and then there are entities that also provide pension
administration and benefit payment services. Finally, there are funds in our sample that manage asset
portfolios without direct and constant reference to liabilities, and funds who apply a full‐fledged asset‐
liability management (ALM) framework, including ongoing partial or full hedging of liabilities.
[INSERT TABLE 1]
And yet, in spite of all these differences, when it comes to governance and investment management,
there seems to be a remarkable convergence towards a set of core principles and best practices which
characterise genuinely best‐in‐breed public sector investment institutions. First, with the exception of
Norway, all the funds in our sample have independent, professional boards operating at arm’s length
from governments.90 While these boards may vary in size and in the emphasis they place on expertise
versus representation, by and large, they appear to have succeeded in securing meaningful autonomy
for their investment teams to pursue sophisticated asset allocation strategies and to deploy cutting‐
edge portfolio construction and risk management techniques.
[INSERT TABLE 2]
Secondly, all the funds in our sample have a very high allocation to risk assets, typically exceeding 60%
and in some cases reaching levels of 80% and higher. These allocations comprise public equities in
developed and emerging markets, as well as the full range of alternative asset classes. In fact,
alternatives – and especially the less liquid assets traded in private markets – have a prominent place
in all of these portfolios except Norway’s: other Northern European funds have a 20‐25% allocation,
Canadians have anywhere between 20 to 40% (although the latter figure is boosted by leverage), while
Australia’s SWF has a 38% allocation. Somewhat surprisingly, GIC and NZSF had allocations of less than
one‐fifth, but still meaningful at 16% and 17%, respectively. Norway stood out with only a 5% target
allocation to real estate, which at the time of writing in October 2016 was still unfilled.
Thirdly, all the funds in our sample, with the glaring exception of Australia, had a very strong
preference for internal management: eight funds had more than three‐quarters of their portfolios
managed in‐house. Only NZSF had less than half of the fund managed by its internal team, but as
discussed in the respective case study, the Guardians have been consistent in their efforts to build and
expand internal portfolio management capabilities, so we fully expect this fund to decrease its reliance
on external managers in the future. In this context, Australia’s Future Fund clearly stands out: as long
as it is legally compelled to outsource all of its asset management to external providers, it will remain
something of an outlier. However, the Board of Guardians and the Management Agency must be fully
aware of the general trend amongst their peers for more in‐sourcing, as well as the various arguments
in support of it. It would be interesting to see if and how any changes to Australia’s legislation might
be initiated in the future to allow the Future Fund to join this trend.
The fourth area of increasing convergence is the shift from static asset allocations, using multi‐asset
class benchmarks with fixed weights and ranges, towards much more flexible and dynamic approaches
to risk allocation. While four funds in our sample still use some variation of the more traditional
Strategic Asset Allocation approach, three funds – CPPIB, GIC and NZSF – have switched to using
Reference Portfolios, while the remaining three funds – ATP, CDPQ and the Australia Future Fund –
use their own idiosyncratic methodologies to achieve essentially the same objective. CDPQ practices
what it calls a ‘benchmark agnostic’ approach, opting for more concentrated portfolios built from the

50
bottom up. ATP has completely abandoned the notion of asset classes, choosing to construct and
manage its portfolio on the basis of target allocations to risk factors. Meanwhile, Australia’s SWF
discarded the whole notion of long‐term strategic asset allocation, leaving only the concept of a highly
flexible, medium‐term target allocation portfolio, designed to accommodate and support its long‐run
objective of hitting a particular CPI‐plus absolute return target.
In Table 2, just for reference purposes, we have included annualised nominal rates of return generated
by the ten funds in our sample over meaningfully long periods of time. However, the returns of each
fund should be viewed in isolation: the differences in underlying time periods, currencies and levels
of exposure to various risk factors preclude meaningful comparisons. That being said, we believe these
numbers do offer a general sense of what level of absolute returns was available to a genuinely long‐
term, relatively unconstrained institutional investor during the last 20‐25 years. While past returns are
no guarantee of future returns, they do offer a potentially useful frame of reference and a starting
point to consider optimal approaches to governance and investment management going forward.
Based on these numbers, it would not be unreasonable to set expectations of long‐term nominal
returns in the range of 5‐10% per annum.
Finally, with respect to the three models of institutional fund management, it appears to us that for
the five funds in our sample which did not have an obvious prior connection to either Norway,
Australia or Canada, all five – AP2, ATP, APG, NZSF and GIC – are gradually converging, albeit at a
different pace, on some variation of the Canada model. Naturally, there are meaningful differences
and specific features that make each of these funds unique. For example, ATP’s separation of the
overall fund into a liability‐hedging and an investment portfolio, combined with its risk factor‐based
asset allocation, makes for a very unique model without precedent. However, if one looks at the
combination of features that make the Canada model different from the other two – independent
board, flexible and dynamic risk allocation, preference for alternative investments and illiquid assets,
emphasis on internal management, cutting‐edge innovation – then ATP and the other four funds
appear to be much closer to their peers in Canada than those in either Norway or Australia.

51
1 See Rozanov (2015), which described and analysed international best practice with respect to governance and investment management of public sector funds, concluding with a set of recommendations for policymakers in Japan trying to reform the Government Pension Investment Fund (GPIF), the largest pension fund in the world. 2 For example, see Ambachtsheer (2007), Ambachtsheer (2013) and Ambachtsheer (2016). One of the key messages in all of his works throughout the years has been the call to arms for a ‘pension revolution’ – a call for public sector pension officials, policymakers and regulators around the world to overhaul their respective national and sub‐national pension systems, moving away from the traditional defined‐benefit and defined‐contribution type systems towards more of a hybrid pension system, while also making it genuinely independent, professional, fair across different stakeholders, more affordable, and thus more sustainable. As examples of countries ahead of everyone else in this effort, Ambachtsheer time and again mentions Australia, Canada, the Netherlands, and the Scandinavian nations. 3 For more detailed information on the background, history, composition and calculation methodology of the index, see the Melbourne Mercer Global Pension Index website (http://www.globalpensionindex.com/). 4 In the United Kingdom, the sentiment of deep distrust of the government, and the public sector more broadly, in economic and financial affairs was particularly prevalent under the Conservatives in the 1980s and early 1990s. However, under the New Labour governments of Tony Blair and Gordon Brown, the proverbial pendulum had swung at least partly in the other direction. Specifically, with respect to the pension system, the so‐called Pension Commission, chaired by Adair Turner, and its three consecutive reports between 2004 and 2006 laid the groundwork for establishing the National Employment Savings Trust (NEST) in 2011. This major reform has set the UK pension system on a long‐term path similar to those in Canada and Northern Europe, although it was still in an early phase at the time of writing in 2016. For a more substantive discussion, see Ambachtsheer (2016). 5 See Greenspan (2001) for the full exposition of his views on this matter. 6 Some sources refer to the Abu Dhabi Investment Authority (ADIA) as the largest SWF in the world, but such claims are typically based on estimates that are highly uncertain and for the most part unscientific. ADIA does not publish information on its AUM. It may well be the case that if one were to combine all of Abu Dhabi’s sovereign investment vehicles, collectively they could be larger than Norway’s fund. But on a fund‐by‐fund comparison basis, we take the view that Norway’s SWF is the largest in the world. 7 See Norwegian Ministry of Finance (2015). 8 At the time of writing in October 2016, 96% of the fund’s total assets were managed internally. 9 Also at the time of writing in October 2016, a government‐appointed committee put forward an official recommendation to increase the allocation to equities from 60% to 70% at the expense of bonds, which would result in a 70/25/5 strategic benchmark. Norway’s centre‐right government will evaluate this recommendation before setting out its own position in the spring of 2017. 10 For more details, see Settergren (2011) and Franzén (2011b). 11 For more details, see Newlands (2015) and Newlands (2016). 12 Based on Franzén (2011a), Franzén (2011b), AP2 (2015) and Moreolo (2016). 13 In practical terms, AP2 has adopted and operates on a 30‐year investment horizon. This is in line with the in‐house ALM model, which assumes an analytical horizon of 30‐35 years. 14 Another way of looking at this would be to equate the ‘contribution assets’, which constitute 86% of total assets, with inflation‐linked bonds: to achieve the best possible diversification and maximise long‐term returns for the overall pension system, the remaining 14% should be invested in high‐risk / high‐return assets in the financial markets. 15 Based on Vittas (2008), ATP (2015) and World Economic Forum (2016). 16 According to current rules, if the value of ‘reserves’ exceeds 10% of the value of guaranteed benefits, the Supervisory Board can decide to increase pension pay‐outs for pensioners. For example, in 2014 the ‘reserves’ were almost 18% of guaranteed benefits, so the board increased the pay‐outs for all current pensioners by 1.5%. 17 This category includes publicly traded and private equity. 18 This category primarily includes government bonds and mortgage debt. 19 This category typically includes loans to credit institutions, investment‐grade bonds and high‐yield bonds. 20 This category comprises infrastructure assets, inflation‐linked bonds and inflation derivatives. 21 This category is primarily about the price of oil, including oil‐indexed bonds and oil‐related derivatives. 22 For fiscal 2015, the absolute return target for the investment portfolio was set at 9% before taxes and expenses (7% after taxes and expenses). According to ATP’s 2015 annual report, the fund achieved 17.2% return on the investment portfolio. As a result, for the third consecutive year, the Supervisory Board decided to increase the ATP pension pay‐out by 1.5%. 23 General description of APG and ABP is based on ABP (2015), APG (2015) and World Economic Forum (2016).

52
24 For example, from November 2009, the newly appointed Chief Investment Officer (CIO) Angelien Kemna initiated a major overhaul of APG’s approach to investment management, openly admitting to it being a “drastic” and “harsh” shift of policy. This came in the wake of two major developments – ABP losing €44 billion (or more than 20%) in the crisis and the regulators introducing a new liability measurement approach – both resulting in a dramatic drop in ABP’s coverage ratio from 140% to less than 90%. In response to public uproar and calls for scaling back risk, Kemna shut down a whole range of complex portfolio management strategies in a self‐proclaimed drive for “controlled simplicity.” To be fair, the new CIO did maintain the broad universe of investable asset classes and kept the overall risk profile of the fund at broadly similar levels. However, in the words of one of her senior colleagues at APG: “Since [the changes] we’re less into innovation and more into making it as simple as possible.” For a more detailed discussion, see Denmark (2012). 25 Based on ABP (2015), APG (2015) and Duijsens (2015). 26 Based on Top1000funds.com (2008), Denmark (2012), ABP (2015), APG (2015), Preesman (2015) and Preesman (2016). 27 The actual weights were slightly different, which reflected tactical views across different asset classes, but also allowed for a 1% allocation to the ‘opportunity’ fund, which was not included in long‐term strategic allocation. Also, beyond the standard government bond allocation, there was a separate dedicated 3% allocation to long‐dated government debt, which was used for liability hedging purposes. Historically, managers of ABP’s fund used derivatives to partially hedge its liabilities, but in the drive for ‘simplification’, using long‐dated Dutch and German government bonds appears to have been considered a better option. 28 Based on Haddon (2010). 29 Based on World Economic Forum (2016). 30 General discussion of the fund, as well as its liability profile and governance, is based on CPPIB (2016). 31 Based on CPPIB (2016), as well as past CPPIB annual reports. 32 CPPIB still works closely with multiple external managers across different asset classes, with all the relationships managed out of a dedicated department called Investment Partnerships. As of March 2016, this group maintained over 150 relationships across both public and private funds, overseeing externally managed net assets of C$ 66.6 billion, or 23.9% of the total fund. 33 For example, in its 2015 annual report, CPPIB provides the following illustrative calculation: “Infrastructure investing is a case in point. We estimate that the total costs for an externally managed $15 billion of committed capital on average would range from $600 million to $700 million per year. By contrast, our fully costed internal management of our $21 billion infrastructure portfolio amounted to approximately $65 million.” 34 For example, it is well documented that to achieve attractive long‐term returns when investing in external private equity or hedge funds, it is critical to access managers in the top quartile. However, many of these funds may be closed to new investments, while investable benchmarks may track lesser funds in the second or third quartile. Such benchmarks would be neither representative of the ‘asset class’ nor attractive to investors. 35 In CPPIB’s case, the six asset classes are public equity, private equity, high‐quality government bonds, credit, real assets, and cash/absolute return strategies. The four geographical areas are developed markets in Americas, Europe and Asia Pacific, plus the catch‐all category of Emerging Markets. 36 Two of the most notable cases are GIC of Singapore and New Zealand Superannuation Fund, both of which are profiled later in this paper. Norway’s GPF‐G is also reported to be looking into it. 37 General discussion of the fund is based on CDPQ (2015). 38 To facilitate investments and to better manage liquidity, CDPQ borrows in the market by issuing short‐ and long‐dated bonds, which are rated by two global and one Canadian credit rating agencies. Therefore, total assets under management include those procured using debt, while net assets are total assets minus CDPQ borrowing. 39 During 50 years of operations, between 1965 and 2015, CDPQ has produced an 8.6% annualised return. 40 Interestingly, while at the time of writing, there were 851 staff working at CDPQ’s offices around the world, the two real estate companies had between them staff of 1,600 people. 41 Discussion of the evolution of CDPQ’s investment strategy prior to 2009 is based on CDPQ (2015) and past CDPQ annual reports; discussion of the transformation of CDPQ post‐2009 is based on Bisson and Tétrault (2015) and CFA Institute (2016). 42 Michael Sabia came to CDPQ from Bell Canada Enterprises, a Montréal‐based telecommunications and media company, where he was President and CEO from 2002 to 2008. Prior to that, he worked for six years at Canadian National Railway, where he worked in various roles, including chief financial officer. 43 In an interview with McKinsey consultants, Michael Sabia drew an interesting analogy: if balance sheets and income statements offer a ‘snapshot’ of a company like a two‐dimensional photograph, CDPQ’s new approach added a third dimension – deep grounding in operations – which made it more like 3D magnetic resonance imaging or MRI.

53
44 In the same McKinsey interview, Michael Sabia suggested that instead of ‘due diligence’, CDPQ’s team was now engaging in ‘deep diligence’. 45 Investments in illiquid assets like private equity, real estate and infrastructure are already viewed by CDPQ as inherently benchmark‐agnostic. 46 Based on World Economic Forum (2016). 47 Background and history of OTPP is based on OTPP (2015) and previous annual reports, as well as Segal (2012a), Segal (2012b) and CFA Institute (2016). 48 Prospective candidates for the Board are drawn from the fields of business management, finance, investment management, banking, actuarial science, economics, education and accounting. 49 Even after the change in regulations, OTPP had to continue holding this debt on their books until August 2012, when the last non‐marketable debenture expired. 50 At a time when very few institutional investors anywhere in the world engaged in derivatives trading, this was a very revolutionary move. Not only did it offer OTPP a highly efficient way of obtaining instant equity market exposure while maintaining their legacy non‐marketable debt in the portfolio, it was also a smart way of legally getting around Canada’s stifling regulations which at the time limited foreign asset exposure. 51 This was only the third annual loss in OTPP’s history, and by far the largest. 52 The actual portfolio had a much higher allocation to inflation‐sensitive assets and correspondingly lower allocation to fixed income. 53 A slight reclassification has occurred in this category, which now includes investments in oil and gas assets, commodity indices, and physical assets such as timberland and agriculture. This category also includes mining sector acquisitions. 54 The new investment groups are Capital Markets (focusing on treasury capabilities, passive investments and liquid trading strategies); Infrastructure & Natural Resources; Private Capital; Public Equities; and Real Estate. These groups will be supported by Portfolio Construction and Strategy & Risk groups, which will control portfolio‐wide risk and facilitate a collaborative investment process. 55 Based on the materials on OTPP’s website: https://www.otpp.com/news/article/‐/article/21045 56 Based on Australia Future Fund (2016) and previous annual reports, as well as Adamson (2013). 57 The latter two funds are also sometimes referred to as Australia’s two ‘nation‐building funds’. 58 Due to the combination of Australia’s booming trade with China, burgeoning global commodity prices and the government running a sound fiscal policy, sizable budget surpluses allowed large cash transfers to capitalise the Future Fund: between May 2006 and June 2007 there were cash transfers of A$ 40.4 billion, followed by additional transfers of A$ 10.9 billion by June 2008. Also, the government transferred to the Future Fund its shareholding in the privatised telecommunications company Telstra, which was valued approximately A$ 9.21 billion at the time. However, all Telstra shares had a lock‐up restriction period until November 2008. Thus, the total cash and in‐kind share contribution which seeded the Future Fund amounted to A$ 60.5 billion. No more contributions were made since 2008. 59 This section draws on Clark, Dixon and Monk (2013). 60 In June 2008, the portfolio (excluding Telstra stock) still contained 62% cash. By June 2009, the cash position was reduced to a still sizable 41%, while by June 2010 it was reduced further still to 13%. 61 Subsequently, a seventh broad category called ‘portfolio overlays’ was formally introduced, which covers currency and interest rate hedging and portfolio protection strategies. 62 Based on the realised cumulative growth in the Australian CPI+4.5% during 2006‐2015. 63 A series of benchmarks which approximate the characteristics of each category within the TAA are maintained and provide an opportunity to assess performance against the policy portfolio. 64 This section draws on Adamson (2013) and Yale (2015). 65 This case is based on NZSF (2016) and previous NZSF annual reports. 66 This was reinforced by the fact that the Board of Guardians in Australia hired their compatriot Paul Costello as the inaugural General Manager of the Future Fund Management Agency, after he had served as the inaugural CEO of NZSF from 2003 to 2007. 67 In June 2016, NZSF had more than 58% of assets outsourced to external managers, of which 35% and 11% were invested in passive equity and passive fixed income mandates, respectively. 68 According to NZSF annual reports, from 2014 to 2016 the share of the underlying portfolio managed passively increased from two‐thirds to three‐quarters, implemented both internally and externally. 69 In its 2016 annual report, NZSF estimated that, had the government continued with its annual contributions as originally planned, the fund would have grown to NZ$ 50 billion.

54
70 The Governor‐General is the representative of the monarch, currently Queen Elizabeth II, appointed by the Queen on the advice of the Prime Minister of New Zealand, to carry out most of constitutional and ceremonial duties in the country. 71 The risk‐free rate was defined as the rate on 90‐day government Treasury bills, representing the opportunity cost for the government of investing in NZSF versus retiring debt. 72 This makes for an interesting contrast to the Australian Future Fund model: whereas NZSF will react to the dearth of compelling investment opportunities by moving towards the 80/20 long‐term risk‐return profile embedded in the reference portfolio, the Australian fund will have a tendency to build up its cash position. 73 The slightly higher hurdle rate partly reflects the increased allocation to emerging market equity in the reference portfolio. 74 For the period between 2003 and 2010, outperformance is calculated over the strategic asset allocation benchmark used at the time. 75 The team uses a set of proprietary discounted cash‐flow models to arrive at long‐term fair value for each asset class, market and currency. Over time, these models have been applied to an ever wider and more granular opportunity set. 76 Based on GIC (2016) and previous GIC annual reports. 77 Based on published estimates from the Sovereign Wealth Center (www.sovereignwealthcenter.com), the SWF Institute (www.swfinstitute.org), and the author’s calculations. 78 This is in contrast to Temasek, Singapore’s other manager of long‐term sovereign assets, which operates as a holding company and owns all assets in its name. The government exercises control by acting as Temasek’s only shareholder. 79 GIC is widely acknowledged to be the brainchild of the late Dr. Goh Keng Swee, who was at the time Deputy Prime Minister and immediate past Chairman of the Monetary Authority of Singapore (MAS). In the words of the late Lee Kuan Yew, the founding father of modern Singapore, Dr. Goh’s vision was to “manage long‐term reserves more rationally, strategically and professionally.” 80 From 2011, GIC also started publishing average US dollar‐denominated nominal rates of return over rolling 5‐year and 10‐year periods to provide a sense of the ongoing medium‐term investment performance. 81 Obviously, another source of funds for GIC, which is increasing in importance, is financial returns from the underlying portfolio. While up to half of these returns can be used for annual budget spending, the other half is reinvested in the portfolio. 82 With the recently passed new amendment, from FY 2016 this will also include the long‐term expected real return on the net assets owned by Temasek, which will increase such annual budgetary contributions from the current 2% to 3% of GDP. 83 In addition to GIC annual reports, this section draws on Clark, Dixon and Monk (2013). 84 Not only is GIC one of the largest SWFs in the world by asset size, in 2016 it also had more than 1,300 staff working in 10 locations on four continents. 85 Given that capital markets there were underdeveloped, GIC often ended up investing in privately‐held companies and property, thus further reinforcing its earlier moves into illiquid alternatives. 86 While GIC continues to engage a wide range of external managers, its reliance on them has decreased over the years: as recently as 2008, management of approximately one‐third of GIC’s assets was outsourced, but in recent years, external managers typically account for up to 20% of the portfolio. 87 This section draws on Clark, Dixon and Monk (2013). 88 To be more precise, the constitutional amendment in 2008 modified the previous spending rule, which had been in place for many years and which capped annual withdrawals at 50% of ‘net investment income’ (i.e. bond coupons, stock dividends and bank deposit interest). This had some drawbacks. First, by focusing on income and not total return, it was misaligned with GIC’s total return portfolio management philosophy. Second, by allowing spending out of nominal rather than real returns, it compromised the principle of inflation‐proofing the portfolio. Third, year‐to‐year withdrawals tended to be volatile, due to nominal fluctuations of actual dividend and coupon income. 89 At the time of writing in 2016, there has been only one episode when the ‘two‐key’ system was activated: amidst the global financial crisis of 2008‐09, Singapore – for the first time in history – used some of its past reserves to support the domestic economy. 90 One could legitimately question whether Singapore’s GIC has a genuinely independent board, given that it is chaired by the Prime Minister and includes two Deputy Prime Ministers, as well as the ministers of finance and trade and industry. However, as explained in our case study, GIC has built up a 35‐year track record of operating autonomously, with the government neither directing nor influencing its investment decisions. There is also the unique rule‐based system of checks and balances enshrined in Singapore’s constitution which prevents any

55
misuse of accumulated reserves and protects them from populist spending pressures. Therefore, it appears logical to us to suggest that Singapore’s GIC is closer, both in letter and spirit, to the model of governance that is characterised by independent, professional boards operating at arm’s length from governments.

Table 1
Country / Fund
Asset Size (US$ bn)
Fund Type
Liability Profile Number ofClients
Number of Functions
Asset‐Only or ALM
Number of Employees
GlobalLocations
Norway GPF‐G
854 SWF Endowment fund with contingent liability
Single Asset management
Asset‐only 500+ 7
Sweden AP2
36 Public pension
Defined contribution buffer fund
Single Asset management Benefit payments
Asset‐only 60+ 1
Denmark ATP
120 Public pension
Defined contribution supplement fund
Single Asset management Benefit payments
ALM 2,600 1
Netherlands APG / ABP
455 / 400 Public pension
Defined benefit fund
Multiple Asset management
ALM 650 4
Canada CPPIB
223 Public pension
Defined benefit buffer fund
Single Asset management
Asset‐only 1,266 7
Canada CDPQ
192 Public pension, insurance, etc.
Various client‐specific liability profiles
Multiple Asset management
Asset‐only 850+ 10
Canada OTPP
130 Public pension
Defined benefit fund
Single Asset management Benefit payments
ALM 1,100 (plus 1,400 in property subsidiary)
3
Australia Future Fund
92 SWF National pension reserve fund
Single Asset management
Asset‐only 129 1
New Zealand Superannuation Fund
22 SWF National pension reserve fund
Single Asset management
Asset‐only 115 1
Singapore GIC
350 (est.) SWF Endowment fund with contingent liability
Single Asset management
Asset‐only 1,300 10

Table 2
Country / Fund
Governance arrangements
Allocation to risk assets
Allocation to alternatives
% managed internally
Approach to benchmarking
Long‐term returns
Institutional model
Norway GPF‐G
Direct political accountability
65% 5% 96% Traditional Strategic Asset Allocation (SAA)
5.6% p.a.(since 1998)
Norway Model
Sweden AP2
Independent board: 9 membersi
66% 20% 83% Traditional SAA, with alternative indices
5.6% p.a.(since 2001)
Closer to Canada Model
Denmark ATP (investment portfolio only)
Independent board: 13 membersii
>50% risk allocation
High, but unspecified
85% Long‐term risk factor allocation
12.3% p.a.(since 2009)
Closer to Canada Model
Netherlands APG
Independent board: 6 membersiii
73% 26% 80% Traditional SAA 5.8% p.a.(since 2000)
Closer toCanada Model
Canada CPPIB
Independent board: 12 membersiv
73% 21% 76% Reference portfolio (with Strategic portfolio)
6.8% p.a. (since 2006)
Canada Model
Canada CDPQ
Independent board: up to 15 membersv
68% 31% 90% Benchmark‐agnostic
8.6% p.a.(since 1965)
Canada Model
Canada OTPP
Independent board: 11 membersvi
87% (with leverage)
41%(with leverage)
80% SAA with leverage 10.3% p.a.(since 1990)
Canada Model
Australia Future Fund
Independent board: 7 membersvii
67% 38% 0% Dynamic, medium‐term Target Asset Allocation
7.7% p.a. (since 2006)
Yale Model
New Zealand Superannuation Fund
Independent board: 7 membersviii
80% 17%(in FY 2016)
42% Reference portfolio
9.4% p.a.(since 2004)
Closer to Canada Model
Singapore GIC
Autonomous board: 15 membersix
61% 16% 80%+ Reference portfolio (with Policy portfolio)
5.7% p.a.(since 1996)
Closer to Canada Model

i All 9 members appointed by the government, but 2 must be nominees of employee organisations and 2 must be nominees of employer organisations. ii ATP Supervisory Board consists of an independent chairman, and 6 representatives each from employers and trade unions. On top of it, there is another Board, which consists of 31 members: an independent chairman, and 15 representatives each from employers and trade unions. The former Board puts equal emphasis on representation and expertise (‘fit and proper test’), while the latter Board emphasises broad representation. iii ABP, the main pension fund client of APG, has a much more complicated structure. Its Board of Trustees has 13 members: one non‐voting chairman, 5 employer representatives (with one vote each), and 7 employee representatives (with 5/7th of one vote each). There is also a Supervisory Board and an Accountability Council. iv There is a separate 12‐member nominating committee, which shortlists and proposes candidates for the Board. The chairperson of the nominating committee is federally appointed, while the other members each represent their respective participating regional government. v At the time of writing in 2016, there were only 14 members. The Board consists of executive directors, representatives of CDPQ’s clients, and independent directors. By law, two‐thirds of directors, including the Chairman, must be independent. vi Until 2015, the Board consisted of 9 members. OTPP’s two sponsors – Ontario’s provincial government and the Ontario Teachers Federation – appoint five members each, while jointly selecting the chairperson. vii Appointed exclusively on the basis of reputation, experience and expertise and not on the basis of representation. viii The law stipulates a minimum of 5 and a maximum of 7 members; all are appointed exclusively on the basis of reputation, experience and expertise and not on the basis of representation. ix Includes 2 executive directors (GIC President and Deputy President); 5 top government officials serving as non‐executive directors (Prime Minister, two Deputy Prime Ministers, Minister of Finance and Minister of Trade); and 8 senior ‘captains of industry’ from various sectors of the Singaporean economy serving as independent directors.

Norway's GPF‐G
1998
Global stocks 40%
Global bonds 60%
2007
Global stocks 60%
Global bonds 40%
2010
Global stocks 60%
Global bonds 35%
Global Real Estate 5%
Note: strategic asset allocation
Source: NBIM annual reports
40%
60%
Figure 1: GPF‐G during 1998 ‐ 2006
Global stocks Global bonds
60%
40%
Figure 2: GPF‐G during 2007 ‐ 2010
Global stocks Global bonds

60%
35%
5%
Figure 3: GPF‐G from 2010 to 2016
Global stocks Global bonds Global Real Estate

Sweden's AP2
2001
Swedish equities 20%
Swedish bonds 40%
Foreign equities ‐ developed 40%
2011
Swedish equities 14%
Swedish bonds 19%
Foreign equities ‐ developed 29%
Foreign equities ‐ emerging 9%
Foreign bonds ‐ developed 14%
Foreign bonds ‐ emerging 4%
Alternative ‐ real estate 5%
Alternative ‐ private equity 3%
Alternative ‐ convertibles 3%
2015
Swedish equities 10%
Swedish bonds 16%
Foreign equities ‐ developed 24%
Foreign equities ‐ emerging 11%
Foreign bonds ‐ developed 12%
Foreign bonds ‐ emerging 6%
Alternative ‐ real estate 10%
Alternative ‐ private equity 5%
Alternative ‐ risk premia 3%
Alternative ‐ credit 2%
Chinese series A equities 1%
Note: strategic asset allocation
Source: AP2 annual reports
20%
40%
40%
Figure 4: AP2 in 2001
Swedish equities Swedish bonds Foreign equities ‐ developed
14%
19%
29%
9%
14%
4%
5%3% 3%
Figure 5: AP2 in 2011
Swedish equities Swedish bonds Foreign equities ‐ developed
Foreign equities ‐ emerging Foreign bonds ‐ developed Foreign bonds ‐ emerging
Alternative ‐ real estate Alternative ‐ private equity Alternative ‐ convertibles
10%
16%
24%
11%
12%
6%
10%
5%
3% 2% 1%
Figure 6: AP2 in 2015
Swedish equities Swedish bonds Foreign equities ‐ developed
Foreign equities ‐ emerging Foreign bonds ‐ developed Foreign bonds ‐ emerging
Alternative ‐ real estate Alternative ‐ private equity Alternative ‐ risk premia
Alternative ‐ credit Chinese series A equities

Denmark's ATP
Actual Asset Allocation of the Total Portfolio
(in 2006, includes Hedging and Investment portfolios)
2001
Danish equities 17%
Foreign equities 31%
Danish bonds 31%
Foreign bonds 17%
Real estate 4%
Private equity 1%
2006
Danish equities 12%
Foreign equities 13%
Danish bonds 17%
Foreign bonds 50%
Real estate 4%
Private equity 3%
Other 1%
Strategic Risk Allocation of the Investment Portfolio
2006
Equities 35%
Rates 20%
Credit 10%
Inflation 25%
Commodities 10%
17%
31%
31%
17%
4%
1%
Figure 7: ATP's Asset Allocation for Total Portfolio (2001)
Danish equities Foreign equities Danish bonds Foreign bonds Real estate Private equity
12%
13%
17%50%
4%3% 1%
Figure 8: ATP's Asset Allocation for Total Portfolio (2006)
Danish equities Foreign equities Danish bonds Foreign bonds
Real estate Private equity Other

2016
Equity 35%
Rates 35%
Inflation 15%
Other 15%
Note 1: actual portfolio allocations for 2001 and 2006
Note 2: strategic risk allocations for investment portfolio
only in 2006 and 2016
Source: ATP annual reports
35%
20%10%
25%
10%
Figure 9: ATP's Strategic Risk Allocation for Investment Portfolio Only (2006)
Equities Rates Credit Inflation Commodities
35%
35%
15%
15%
Figure 10: ATP's Strategic Risk Allocation for Investment Portfolio Only (2016)
Equity Rates Inflation Other

Netherlands' APG / ABP
2001
Global equities 48%
Global bonds 40%
Alternative ‐ real estate 8%
Alternative ‐ private equity 4%
2008
Equities ‐ developed 27%
Equities ‐ emerging 5%
Government bonds 17%
Corporate bonds 23%
Alternative ‐ real estate 9%
Alternative ‐ private equity 5%
Alternative ‐ hedge funds 5%
Alternative ‐ commodities 3%
Alternative ‐ infrastructure 2%
Alternative ‐ convertibles 2%
Alternative ‐ innovation 2%
2015
Equities ‐ developed 25%
Equities ‐ emerging 8%
Government bonds 16%
Corporate bonds 14%
Inflation‐linked bonds 9%
Emerging market bonds 2%
Alternative ‐ real estate 9%
Alternative ‐ private equity 5%
Alternative ‐ hedge funds 5%
Alternative ‐ commodities 4%
Alternative ‐ infrastructure 3%
Note: strategic asset allocation
Source: ABP annual reports
48%
40%
8%4%
Figure 11: ABP in 2001
Global equities Global bonds Alternative ‐ real estate Alternative ‐ private equity
27%
5%
17%23%
9%
5%
5%
3%2% 2% 2%
Figure 12: ABP in 2008
Equities ‐ developed Equities ‐ emerging Government bonds
Corporate bonds Alternative ‐ real estate Alternative ‐ private equity
Alternative ‐ hedge funds Alternative ‐ commodities Alternative ‐ infrastructure
Alternative ‐ convertibles Alternative ‐ innovation

25%
8%
16%14%
9%
2%
9%
5%5%
4% 3%
Figure 13: ABP in 2015
Equities ‐ developed Equities ‐ emerging Government bonds
Corporate bonds Inflation‐linked bonds Emerging market bonds
Alternative ‐ real estate Alternative ‐ private equity Alternative ‐ hedge funds
Alternative ‐ commodities Alternative ‐ infrastructure

Canada's CPPIB
2000
Equities 5%
Fixed Income 95%
2006
Public equities 58.5%
Bonds 27.7%
Inflation-linked bonds 4.0%
Alternative - private equity 4.5%
Alternative - real estate 4.3%
Alternative - infrastructure 0.4%
Cash 0.6%
2016
Foreign equities - developed 41%
Foreign equities - emerging 6%
Canadian equities 5%
Bonds and money markets 19%
Other debt 8%
Alternative - real estate 13%
Alternative - infrastructure 8%
Note: actual portfolio allocations
Source: CPPIB annual reports
5%
95%
Figure 14: CPPIB in 2000
Equities Fixed Income
58.5%27.7%
4.0%
4.5%4.3% 0.4% 0.6%
Figure 15: CPPIB in 2006
Public equities Bonds Inflation-linked bonds
Alternative - private equity Alternative - real estate Alternative - infrastructure
Cash
Figure 16: CPPIB in 2016

41%
6%5%
19%
8%
13%
8%
Figure 16: CPPIB in 2016
Foreign equities - developed Foreign equities - emerging Canadian equities
Bonds and money markets Other debt Alternative - real estate
Alternative - infrastructure

Canada's CDPQ
1975
Fixed Income 71%
Equities and convertibles 18%
Mortgages 6%
Cash 5%
1991
Fixed income 48%
Equities and convertibles 38%
Mortgages 5%
Real estate 5%
Cash 5%
2007
Fixed income 30%
Real estate debt 7%
Public equities 36%
Alternative - real estate 11%
Alternative - private equity 7%
Alternative - infrastructure 4%
Alternative - hedge funds 3%
Alternative - commodities 2%
2015
Fixed income 30%
Real estate debt 5%
Inflation-linked debt 1%
Public equities 37%
Alternative - private equity 11%
Alternative - real estate 11%
Alternative - infrastructure 5%
71%
18%
6%5%
Figure 17: CDPQ in 1975
Fixed Income Equities and convertibles Mortgages Cash
48%
38%
5%
5%5%
Figure 18: CDPQ in 1991
Fixed income Equities and convertibles Mortgages Real estate Cash

Note: actual portfolio allocations
Source: CDPQ's annual reports
30%
7%
36%
11%
7%
4%3%
2%
Figure 19: CDPQ in 2007
Fixed income Real estate debt Public equities
Alternative - real estate Alternative - private equity Alternative - infrastructure
Alternative - hedge funds Alternative - commodities
30%
5%
1%37%
11%
11%
5%
Figure 20: CDPQ in 2015
Fixed income Real estate debt Inflation-linked debt
Public equities Alternative - private equity Alternative - real estate
Alternative - infrastructure

Canada's OTPP
2000
Equities 57%
Fixed Income and cash 18%
Inflation-linked bonds 13%
Alternative - real estate 9%
Alternative - commodities 3%
2009
Equities 44%
Fixed income and cash 7%
Inflation-linked bonds 20%
Alternative - real estate 18%
Alternative - infra & timber 9%
Alternative - commodities 2%
2015
Equities 46%
Fixed income 41%
Natural resources 6%
Real assets 24%
Absolute return strategies 11%
Money market -28%
Note: actual portfolio allocations
Source: OTPP annual reports
57%
18%
13%
9%3%
Figure 21: OTPP in 2000
Equities Fixed Income and cash Inflation-linked bonds
Alternative - real estate Alternative - commodities
44%
7%
20%
18%
9%
2%
Figure 22: OTPP in 2009
Equities Fixed income and cash Inflation-linked bonds
Alternative - real estate Alternative - infra & timber Alternative - commodities

-30%
-20%
-10%
0%
10%
20%
30%
40%
50%
Equities Fixed income Naturalresources
Real assets Absolutereturn
strategies
Moneymarket
46%
41%
6%
24%
11%
-28%
Figure 23: OTPP in 2015

Australia Future Fund
2010
Listed equity 37%
Debt 22%
Alternative - private equity 3%
Alternative - property 5%
Alternative - infra & timber 5%
Alternative - hedge funds 16%
Cash 13%
2013
Listed equity 41%
Debt 16%
Alternative - private equity 7%
Alternative - property 6%
Alternative - infra & timber 8%
Alternative - hedge funds 17%
Cash 6%
2016
Listed equity 29%
Debt 12%
Alternative - private equity 10%
Alternative - property 7%
Alternative - infra & timber 7%
Alternative - hedge funds 14%
Cash 22%
Note: actual portfolio allocations
Source: Australia Future Fund annual reports
37%
22%3%
5%
5%
16%
13%
Figure 24: Australia Future Fund in 2010
Listed equity Debt Alternative - private equity
Alternative - property Alternative - infra & timber Alternative - hedge funds
Cash
41%
16%
7%
6%
8%
17%
6%
Figure 25: Australia Future Fund in 2013
Listed equity Debt Alternative - private equity
Alternative - property Alternative - infra & timber Alternative - hedge funds
Cash

29%
12%
10%7%
7%
14%
22%
Figure 26: Australia Future Fund in 2016
Listed equity Debt Alternative - private equity
Alternative - property Alternative - infra & timber Alternative - hedge funds
Cash

New Zealand Superannuation Fund
2003
Listed equity 67%
Fixed income - domestic 10%
Fixed income - international 10%
Alt - PE, commod, infra, etc. 7%
Alt - property 6%
2010
Global equities 70%
Domestic equities 5%
Global listed property 5%
Global fixed income 20%
2015
Global equities - developed 65%
Global equities - emerging 10%
Domestic equities 5%
Global fixed income 20%
Note: strategic asset allocation for 2003; reference portfolios for 2010 and 2015
Source: New Zealand Superannuation Fund annual reports
67%
10%
10%
7%
6%
Figure 27: NZSF Strategic Asset Allocation in 2003
Listed equity Fixed income - domestic Fixed income - international
Alt - PE, commod, infra, etc. Alt - property
70%
5%
5%
20%
Figure 28: NZSF Reference Portfolio in 2010
Global equities Domestic equities Global listed property Global fixed income

65%
10%
5%
20%
Figure 29: NZSF Reference Portfolio in 2015
Global equities - developed Global equities - emerging Domestic equities Global fixed income

Singapore's GIC
1981 - 2001
Global equities 30%
Global bonds 40%
Cash 30%
2011
Global equities - developed 34%
Global equities - emerging 15%
Global bonds - nominal 20%
Global bonds - inflation-linked 2%
Alternative - real estate 10%
Alternative - PE & infrastructure 10%
Alternative - absolute return 3%
Alternative - natural resources 3%
Cash 3%
2016 - Reference Portfolio
Global equities 65%
Global bonds 35%
2016 - Policy Portfolio
Global equities - developed 26%
Global equities - emerging 19%
Nominal bonds and cash 34%
Inflation-linked bonds 5%
Alternative - real estate 7%
Alternative - private equity 9%
Note 1: strategic asset allocations for 1981-2001 and 2011
Note 2: for 2016, Reference Portfolio and Policy Portfolio
Source: GIC annual reports
30%
40%
30%
Figure 30: GIC Strategic Asset Allocation (1981 - 2001)
Global equities Global bonds Cash
34%
15%20%
2%
10%
10%
3%3%
3%
Figure 31: GIC Strategic Asset Allocation in 2011
Global equities - developed Global equities - emerging Global bonds - nominal
Global bonds - inflation-linked Alternative - real estate Alternative - PE & infrastructure
Alternative - absolute return Alternative - natural resources Cash

65%
35%
Figure 32: GIC Reference Portfolio in 2016
Global equities Global bonds
26%
19%34%
5%
7%
9%
Figure 33: GIC Policy Portfolio in 2016
Global equities - developed Global equities - emerging Nominal bonds and cash
Inflation-linked bonds Alternative - real estate Alternative - private equity
References
Adamson, L. (2013). ‘Australia’s Future Fund Investment Wizardry’, Institutional Investor, May 15.
Available from URL: http://www.institutionalinvestor.com/article/3205504/investors‐sovereign‐
wealth‐funds/australias‐future‐fund‐investment‐wizardry.html#/.WJDcp2ymk2x
Ambachtsheer, K. (2007). Pension Revolution: A Solution to the Pensions Crisis. Hoboken, NJ: John
Wiley & Sons.
Ambachtsheer, K. (2013). ‘Fixing the “Loser’s Game”: What It Will Take’. Guest Editorial, Financial
Analysts Journal, May/June, pp. 6‐12.
Ambachtsheer, K. (2016). The Future of Pension Management: Integrating Design, Governance, and
Investing. Hoboken, NJ: John Wiley & Sons.
AP2 (2015). Second Swedish National Pension Fund 2015 Annual Report. Available from URL:
http://www.ap2.se/en/news‐reports/reports/annual‐reports/
ABP (2015). ABP 2015 Annual Report. Available from URL: https://www.abp.nl/english/financial‐
situation/annual‐report.aspx
APG (2015). APG Groep NV 2015 Annual Report. Available from URL:
https://www.apg.nl/en/publication/annual‐report‐apg‐group‐
2015/1958?type=706&apg_nocsrf_token=undefined
ATP (2015). The ATP Group 2015 Annual Report. Available from URL: https://www.atp.dk/en/results‐
and‐reports/annual‐and‐interim‐reports/atp‐group
Australia Future Fund (2016). The Australia Future Fund 2015/2016 Annual Report. Available from
URL: http://www.futurefund.gov.au/about‐us/annual‐reports
Bisson, P. and Tétrault, J. (2015). ‘A Conversation with CDPQ’s Michael Sabia’. McKinsey on Investing,
No. 2, July. Available from URL: http://www.mckinsey.com/industries/financial‐services/our‐
insights/a‐conversation‐with‐cdpqs‐michael‐sabia
CDPQ (2015). La Caisse de Dépôt et Placement du Québec 2015 Annual Report. Available from URL:
http://www.cdpq.com/en/results/annual‐reports
CFA Institute (2016). ‘Best Practices in Fund Management: Lessons from the Canadian Public Pension
Model’, Panel Discussion, 2016 CFA Institute Annual Conference, 9 May. Available from URL:
https://blogs.cfainstitute.org/investor/2016/05/17/lessons‐from‐the‐canadian‐public‐pension‐fund‐
model/
Clark, G., Dixon, A. and Monk, A. (2013). Sovereign Wealth Funds: Legitimacy, Governance, and
Global Power. Princeton, NJ: Princeton University Press.
CPPIB (2016). The Canada Pension Plan Investment Board 2016 Annual Report. Available from URL:
http://www.cppib.com/content/dam/cppib/Our%20Performance/Financial%20results/CPPIB%20F2
016%20Annual%20Report%20‐%20ENGLISH%20(May%2019,%202016).pdf
Denmark, F. (2012). ‘Back to Basics at Dutch Pension Giant APG’, Institutional Investor, June 11.
Available from URL: http://www.institutionalinvestor.com/Article/3042000/Back‐to‐Basics‐at‐Dutch‐
Pension‐Giant‐APG.html?ArticleId=3042000&single=true#/.WJCh6Wymk2x

Duijsens, P. (2015). ‘Governance Practice in the Netherlands’. Presentation to Pensions Europe
Conference 2015. Available from URL:
www.pensionseurope.eu/system/files/Plenary%206%20‐%20Presentations.pdf
Franzén, T. (2011a). ‘A Tail of a Tale’, in Franzén, T. (ed.) (2011), A Decade of Challenges: A Collection
of Essays on Pensions and Investments, Second Swedish National Pension Fund/AP2, pp. 6‐13.
Franzén, T. (2011b). ‘AP2’s Role in the Reformed Pension System’, in Franzén, T. (ed.) (2011), A
Decade of Challenges: A Collection of Essays on Pensions and Investments, Second Swedish National
Pension Fund/AP2, pp. 46‐55.
GIC (2016). GIC 2015/2016 Annual Report. Available from URL:
http://www.gic.com.sg/report/report‐2015‐2016/overview.html
Greenspan, A. (2001). Testimony before the Committee on the Budget, US House of
Representatives, March 2. Available from URL:
https://www.federalreserve.gov/BoardDocs/testimony/2001/20010302/default.htm
Haddon, P. (2010). ‘The Pensions King of Pop’, Citywire Global Magazine, September. Available from
URL: http://www1.citywire.co.uk/wealth‐manager/news/the‐pensions‐king‐of‐
pop/a430385?section=global
Melbourne Mercer Global Pension Index (2016). Country data and rankings available from URL:
http://www.globalpensionindex.com/
Moreolo, C. S. (2016). ‘How We Run Our Money: AP2’. Investment & Pensions Europe, July/August.
Available from URL: https://www.ipe.com/pensions/investors/how‐we‐run‐our‐money/how‐we‐run‐
our‐money‐ap2/10014051.fullarticle
Newlands, C. (2015). ‘Swedish Pension Chief Executives Condemn Reforms’. Financial Times, October
25. Available from URL: https://www.ft.com/content/341b7ea4‐798c‐11e5‐933d‐
efcdc3c11c89#axzz43cwls9g6
Newlands, C. (2016). ‘Per Bolund: Sweden’s Great Green Pensions Hope’. FTfm, Financial Times,
January 3. Available from URL: https://www.ft.com/content/93a39da4‐aeff‐11e5‐993b‐
c425a3d2b65a#axzz43cwls9g6
Norges Bank (1998). The Norwegian Government Petroleum Fund Annual Report. Available from
URL: https://www.nbim.no/globalassets/reports/2000_1999_‐1998/1998‐en.pdf
Norges Bank Investment Management (2001). ‘Management Strategy of Large Foreign Funds’.
Available from URL: https://www.nbim.no/.../2001‐management‐strategy‐of‐large‐foreign‐funds.pdf
Norges Bank Investment Management (2015). Government Pension Fund Global Annual Report.
Available from URL: https://www.nbim.no/en/transparency/reports/2015/annual‐report‐2015/
Norwegian Ministry of Finance (2015). The Management of the Government Pension Fund in 2015.
Report to the Storting. White Paper. Available from URL: https://www.regjeringen.no/en/topics/the‐
economy/the‐government‐pension‐fund/arlig‐melding‐til‐stortinget/id2357436/
NZSF (2016). New Zealand Superannuation Fund 2016 Annual Report. Available from URL:
https://www.nzsuperfund.co.nz/publications/annual‐reports
OTPP (2015). The Ontario Teachers’ Pension Plan 2015 Annual Report. Available from URL:
https://www.otpp.com/corporate/annual‐reporting
Preesman, L. (2015). ‘Asset Allocation: The Dutch Top Five’, Investment & Pensions Europe,
September. Available from URL: https://www.ipe.com/pensions/pensions‐in/netherlands/asset‐
allocation‐the‐dutch‐top‐five/10009578.fullarticle
Preesman, L. (2016). ‘ABP to Stick with Strategic Asset Allocation for Next Three Years’, Investment &
Pensions Europe, 13 May. Available from URL: https://www.ipe.com/countries/netherlands/abp‐to‐
stick‐with‐strategic‐asset‐allocation‐for‐next‐three‐years/10013311.fullarticle
Rozanov, A. (2015). ‘Public Pension Fund Management: Best Practice and International Experience’.
Asian Economic Policy Review, vol. 10, issue 2, July, pp. 275‐295.
Segal, J. (2012a). ‘The Oracle of Ontario’, Institutional Investor, September 20. Available from URL:
http://www.institutionalinvestor.com/Article/3088138/The‐Oracle‐of‐
Ontario.html?ArticleId=3088138&p=1#/.WJDNL2ymk2x
Segal, J. (2012b). ‘From Debentures to Derivatives: A Brief History of Ontario Teachers’, Institutional
Investor, September 21. Available from URL:
http://www.institutionalinvestor.com/Article/3092743/From‐Debentures‐to‐Derivatives‐Et‐
Al.html#/.WJDNNGymk2x
Settergren, O. (2011). ‘The Swedish Pension Reform: Ambitions and Techniques Used’, in Franzén, T.
(ed.) (2011), A Decade of Challenges: A Collection of Essays on Pensions and Investments, Second
Swedish National Pension Fund/AP2, pp. 32‐45.
Top1000funds.com (2008). ‘ABP Sticks to Plan and Active Management’, Top1000funds.com
website, September 26. Available from URL:
http://www.top1000funds.com/profile/2008/09/26/abp‐sticks‐to‐plan‐and‐active‐management/
Vittas, D. (2008). ‘A Short Note on the ATP Fund of Denmark’, Policy Research Working Paper 4505,
Financial Systems Department, The World Bank, February. Available at URL:
http://elibrary.worldbank.org/doi/pdf/10.1596/1813‐9450‐4505
World Economic Forum (2016). ‘Innovations in Long‐Term Capital Management: The Practitioner’s
Perspective’. White Paper, April. Available at URL:
www3.weforum.org/docs/WEF_GAC_Future_of_Investing_Case_Studies.pdf
Yale (2015). The Yale Endowment 2015 Annual Report. Available from URL:
http://investments.yale.edu/endowment‐update/