Embed Size (px)
Citation preview

The Condition of Education 2019 | 1
Chapter: 1/Preprimary, Elementary, and Secondary Education Section: Finances
Public School Revenue Sources
From school year 2014–15 to 2015–16, total revenues for public elementary and secondary schools increased by $27 billion in constant 2017–18 dollars (4 percent). During this period, state revenues increased by 5 percent, local revenues increased by 4 percent, and federal revenues increased by 1 percent.
In school year 2015–16, elementary and secondary public school revenues totaled $706 billion in constant 2017–18 dollars.1 Of this total, 8 percent, or $58 billion, were from federal sources; 47 percent, or $332 billion, were from state sources; and 45 percent, or $316 billion, were from local sources.2 In 2015–16, the percentages from each source differed across the states and the District of Columbia. For example, the percentages of total revenues coming from federal, state, and local sources in Illinois were 8 percent, 24 percent, and 67 percent, respectively, while the corresponding percentages in Vermont were 7 percent, 89 percent, and 4 percent.
Total public school revenues were 24 percent higher in school year 2015–16 than in 2000–01 ($706 billion vs. $569 billion, in constant 2017–18 dollars). During this time, total revenues rose from $569 billion in 2000–01 to $685 billion in 2007–08, decreased to $648 billion in 2012–13, and then increased to $706 billion in 2015–16. These changes were accompanied by a 7 percent increase in total elementary and secondary public school enrollment, from 47 million students in 2000–01 to 50 million students in 2015–16 (see indicator Public School Enrollment).
Figure 1. Revenues for public elementary and secondary schools, by revenue source: School years 2000–01 through 2015–16
2000–01 2005–06 2010–11 2015–16
0
200
400
600
$800
Total
State
Local
Federal
School year
Revenues (in billions) [In constant 2017–18 dollars]
NOTE: Revenues are in constant 2017–18 dollars, adjusted using the Consumer Price Index (CPI). See Digest of Education Statistics 2018, table 106.70. SOURCE: U.S. Department of Education, National Center for Education Statistics, Common Core of Data (CCD), “National Public Education Financial Survey,” 2000–01 through 2015–16. See Digest of Education Statistics 2018, table 235.10.

The Condition of Education 2019 | 2
Chapter: 1/Preprimary, Elementary, and Secondary Education Section: Finances
Public School Revenue Sources
Federal revenues for public schools were 111 percent higher in school year 2009–10, the year after the passage of the American Recovery and Reinvestment Act of 2009, than in 2000–01 ($87 billion vs. $41 billion, in constant 2017–18 dollars). Federal revenues then decreased each year from 2009–10 through 2013–14. Federal revenues were $58 billion dollars in 2015–16, which was 1 percent higher than in 2013–14. Local revenues increased by 29 percent, from $245 billion to $316 billion, from 2000–01 through 2015–16. State revenues increased 17 percent from 2000–01 to 2007–08 ($283 billion vs. $331 billion), decreased 12 percent from 2007–08 to 2012–13 ($293 billion), and then increased 13 percent from 2012–13 to 2015–16 ($332 billion). During the period from 2000–01 through 2015–16, federal revenues peaked in 2009–10 at $87 billion, while both state and local revenues were highest in 2015–16 ($332 billion and $316 billon, respectively).
Between school years 2000–01 and 2015–16, the percentage of total revenues for public schools coming from federal sources fluctuated between 7 and 13 percent, accounting for 7 percent of total revenues in 2000–01, 13 percent in 2009–10 and 2010–11, and 8 percent in 2015–16. Local sources accounted for 45 percent of total revenues from 2011–12 through 2015–16, which was higher than the percentages between 2000–01 and 2010–11.
The percentage of total revenues coming from state sources decreased 3 percentage points between 2000–01 and 2015–16 (50 vs. 47 percent). Within the 2000–01 to 2015–16 period, the percentage of revenues coming from state sources was highest in 2000–01 (50 percent) and lowest in 2009–10 (43 percent).
More recently, from school year 2014–15 to school year 2015–16, total revenues for public schools increased by $27 billion (4 percent), from $679 billion to $706 billion in constant 2017–18 dollars. Federal revenues increased by $0.6 billion (1 percent) from 2014–15 to 2015–16. State revenues increased by $16 billion (5 percent) from 2014–15 to 2015–16. Local revenues increased by $11 billion (4 percent), reflecting a $9.9 billion (4 percent) increase in revenues from local property taxes, a $1 billion (2 percent) increase in other local public revenues, and a $0.2 billion (1 percent) increase in private revenues.3
In school year 2015–16, there were substantial variations across the states in the percentages of public school revenues coming from state, local, and federal sources. In 23 states, at least half of all revenues came from state governments, while in 15 states and the District of Columbia, at least half of all revenue came from local governments. In the remaining 12 states, no single revenue source made up more than half of all revenues.
The Condition of Education 2019 | 3
Chapter: 1/Preprimary, Elementary, and Secondary Education Section: Finances
Public School Revenue Sources
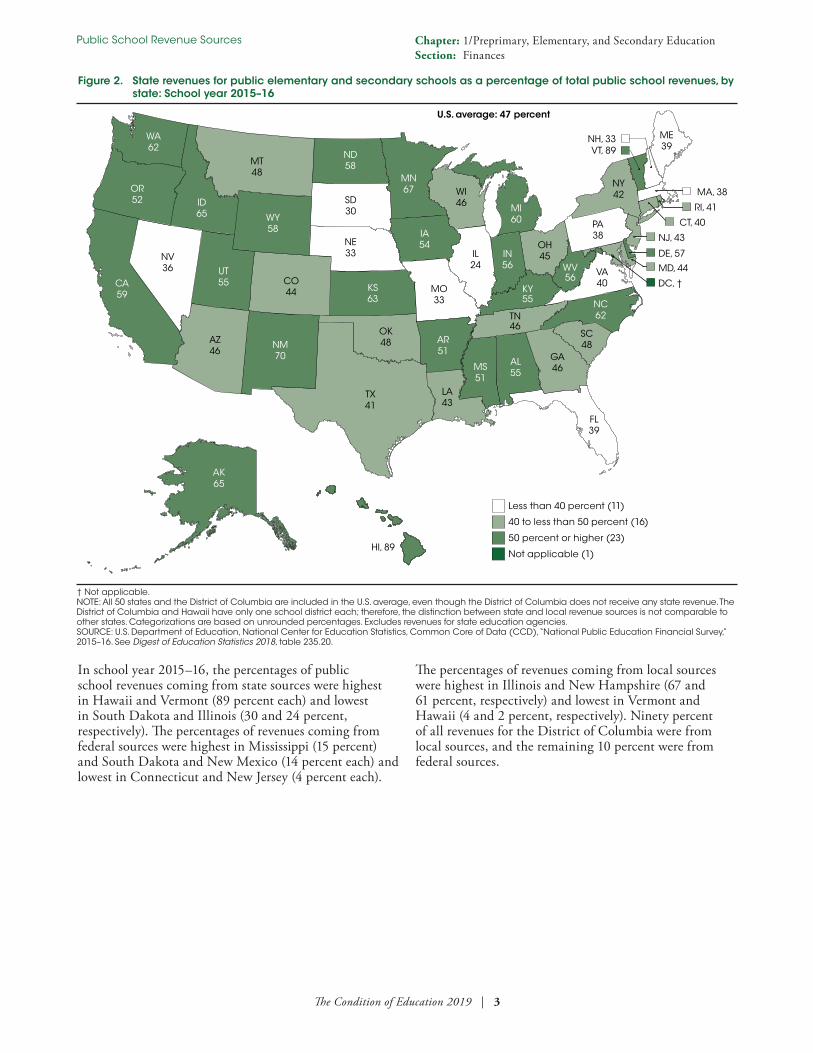
Figure 2. State revenues for public elementary and secondary schools as a percentage of total public school revenues, by state: School year 2015–16
HI, 82
AK65
AZ46
UT55
NV36
CA59
CO44
WY58
ID65
OR52
WA62
MT48
ND58
SD30
TX41
OK48
HI, 89
AR51
LA43
MS51
AL55
TN46
IL24
MI60
IN56
OH45
KY55
VA40
WV56
PA38
NY42
MO33
KS63
NE33
IA54
MN67 WI
46
GA46
SC48
NC62
FL39
ME39
NM70
DC, †
NJ, 43
VT, 89
MA, 38
CT, 40
RI, 41
NH, 33
DE, 57
MD, 44
U.S. average: 47 percent
40 to less than 50 percent (16)
Less than 40 percent (11)
50 percent or higher (23)
Not applicable (1)
† Not applicable. NOTE: All 50 states and the District of Columbia are included in the U.S. average, even though the District of Columbia does not receive any state revenue. The District of Columbia and Hawaii have only one school district each; therefore, the distinction between state and local revenue sources is not comparable to other states. Categorizations are based on unrounded percentages. Excludes revenues for state education agencies. SOURCE: U.S. Department of Education, National Center for Education Statistics, Common Core of Data (CCD), “National Public Education Financial Survey,” 2015–16. See Digest of Education Statistics 2018, table 235.20.
In school year 2015–16, the percentages of public school revenues coming from state sources were highest in Hawaii and Vermont (89 percent each) and lowest in South Dakota and Illinois (30 and 24 percent, respectively). The percentages of revenues coming from federal sources were highest in Mississippi (15 percent) and South Dakota and New Mexico (14 percent each) and lowest in Connecticut and New Jersey (4 percent each).
The percentages of revenues coming from local sources were highest in Illinois and New Hampshire (67 and 61 percent, respectively) and lowest in Vermont and Hawaii (4 and 2 percent, respectively). Ninety percent of all revenues for the District of Columbia were from local sources, and the remaining 10 percent were from federal sources.

The Condition of Education 2019 | 4
Chapter: 1/Preprimary, Elementary, and Secondary Education Section: Finances
Public School Revenue Sources
Figure 3. Property tax revenues for public elementary and secondary schools as a percentage of total public school revenues, by state: School year 2015–16
AK13
AZ30
UT29
NV25
CA26
CO40
WY26
ID20
OR33
WA26
MT26
ND23
SD48
TX44
OK30
HI, 0
AR32
LA19
MS29
AL16
TN20
IL60
MI27
IN24
OH39
KY25
VA33
WV31
PA44
NY49
MO46
KS17
NE52
IA32
MN18 WI
43
GA30
SC32
NC22
FL41
ME51
NM13
DC, 30
NJ, 50
VT, #
MA, 53
CT, 54
RI, 49
NH, 59
DE, 21
MD, 24
U.S. average: 36 percent
25 to less than 50 percent (27)
Less than 25 percent (17)
50 percent or higher (7)
# Rounds to zero. NOTE: All 50 states and the District of Columbia are included in the U.S. average. The District of Columbia and Hawaii have only one school district each; therefore, the distinction between state and local revenue sources is not comparable to other states. Categorizations are based on unrounded percentages. SOURCE: U.S. Department of Education, National Center for Education Statistics, Common Core of Data (CCD), “National Public Education Financial Survey,” 2015–16. See Digest of Education Statistics 2018, table 235.20.
On a national basis in 2015–16, some $257 billion,4 or 81 percent, of local revenues for public school districts were derived from local property taxes. Connecticut and Rhode Island had the highest percentages of local revenues from property taxes (98 and 97 percent, respectively). The percentages of total revenues from local
property taxes differed by state. In 2015–16, Illinois and New Hampshire had the highest percentages of revenues from property taxes (60 and 59 percent, respectively). In Vermont, the percentage of revenues from local property taxes rounded to zero. Hawaii has only one school district, which received no funding from property taxes.
Endnotes:1 Revenues in this indicator are adjusted for inflation using the Consumer Price Index, or CPI. For this indicator, the CPI is adjusted to a school-year basis. The CPI is prepared by the Bureau of Labor Statistics, U.S. Department of Labor.2 Local revenues include revenues from such sources as local property and nonproperty taxes, investments, and student activities such as textbook sales, transportation and tuition
fees, and food service revenues. Local revenues also include revenues from intermediate sources (education agencies with fundraising capabilities that operate between the state and local government levels).3 Private revenues consist of tuition and fees from patrons and revenues from gifts.4 In constant 2017–18 dollars.
Reference tables: Digest of Education Statistics 2017, table 105.30; Digest of Education Statistics 2018, tables 235.10 and 235.20Related indicators and resources: Public School Expenditures
Glossary: Constant dollars; Consumer Price Index (CPI); Elementary school; Property tax; Public school or institution; Revenue; School district; Secondary school