Embed Size (px)
Citation preview

by Keith Reynolds 2018
Public-Private Partnerships in British Columbia
UPDATE 2018

Suite 510 – 1155 Robson Street, Vancouver, BC V6E 1B5
t: 604.408.2500 / e: [email protected]
columbiainstitute.ca
PUBLIC-PRIVATE PARTNERSHIPS IN BRITISH COLUMBIA: UPDATE 2018
By Keith Reynolds
June 2018
This document was reviewed by five individuals with extensive knowledge in the area of public-private partnerships. Their contributions have made for a significantly stronger document. Any errors that remain are the responsibility of the author.
We wish to express our appreciation to the Hospital Employees’ Union for its financial support of this project.
Graphic design: Nadene Rehnby, Hands on Publications
ISBN: 978-0-9781918-8-7
Cover photos: Province of BC and Partnerships BC
For almost two decades, many of British Columbia’s major public infrastructure
projects have been built through public-private partnerships (P3s) in which private
corporations fully or partially finance the projects and operate or maintain them
through multi-decade contracts.
For most of this time, the real cost of these projects was withheld from the public.
Persistent freedom of information requests about P3s between 2003 and 2016
has led to the release of financial information for 17 public-private partnership
projects, revealing that British Columbians are not only paying a high price for P3s
today, but will continue to do so for decades.

CONTENTSOKANAGAN CORRECTIONAL CENTRE CONSTRUCTION 2016, PHOTO PROVINCE OF BC/FLICKR
PART 1 Introduction .....................................................4
PART 2 What is a public-private partnership? ........ 7
CASE STUDY: Abbotsford Hospital .............. 8
PART 3 Comparable cost of P3s and public service delivery .......................... 10
PART 4 Direct risk adjustments ..................................12
CASE STUDY: Canada Line .............................16
PART 5 Adding more risk transfer with the discount rate ....................................18
CASE STUDY: Fort St. John Hospital ..........24
PART 6 Impact of risk ...................................................26
PART 7 Some conclusions ...........................................28
PART 8 Recommendations .........................................30
PART 9 Methodology ...................................................32
Selected references ........................................................34
APPENDICES
Appendix A: Undiscounted costs of public sector comparator and public-private partnership .......36
Appendix B: Risk adjustment calculated and added to the public sector comparator cost ......38
Appendix C: Simple example comparison of undiscounted project with upfront public spending versus 8% discounted project ..............39
Appendix D: Effect of discounting (government borrowing rate) and risk adjustment on public-private partnerships ....... 40
Appendix E: Effect of discounting (Partnerships BC discount rate) and risk adjustment on public-private partnerships .........41
Appendix F: History of public-private partnerships in British Columbia ............................42

PUBLIC-PRIVATE PARTNERSHIPS IN BRITISH COLUMBIA UPDATE 20184
PA R T 1
Introduction
INFORMATION RELEASED from persistent freedom of information requests shows
that the province of British Columbia will pay an additional $3.7 billion1 as a result of
contracts signed between 2003 and 2016 to deliver 17 infrastructure projects through
public-private partnerships (P3s) rather than traditional procurement.
With an $18.2 billion price tag, these 17 projects all involved multi-decade contracts
in which private companies managed a combination of the design, building, financing,
operation, and maintenance of the public infrastructure. Of the 17 projects, 10 were
in health care and three were for roads. The others were for the environment, transit,
education, and corrections. If the 17 projects were procured through the public
delivery of projects rather than public-private partnerships, they would have cost
$3.7 billion less through the decades of the contracts.
While $3.7 billion may seem like an enormous amount of money — approximately
$1,800 for every BC household — the number underestimates the additional cost BC
will pay as a result of the P3 projects currently on the books.
Information provided on these 17 projects represents only half of the 33 P3 projects
undertaken by Partnerships BC, the province’s P3 agency, for multi-year contracts that
involve operating, maintaining, and/or building facilities.2 In public-private partnership
terms these would be DBFO (design/build/finance/operate) or DBFM (design/build/
finance/maintain) contracts. Information has not been yet been released for an
additional 16 P3 projects.
1 To establish whether a P3 should be used, Partnerships BC calculates the actual annual dollar cost over the life of the project of using a P3 versus traditional procurement. This is the information released under FOI. The $3.7 billion figure is found by adding the total annual costs of the 17 projects for both P3s and traditional procurement and then subtracting the long-term cost of traditional procurement from the multi-decade cost of the P3s. While this is subsequently “discounted” in a way that shows an advantage for P3s, $3.7 billion is the actual saving in dollars Partnerships BC FOI responses find. The discounting issue is discussed later in the report.
2 Partnerships British Columbia, Projects Page, partnershipsbc.ca/projects/, (accessed 29 January 2018).
If the 17 projects were
procured through
the public delivery
of projects rather
than public-private
partnerships, they
would have cost
$3.7 billion less
through the decades
of the contracts.
PHOTO MICHAEL TAM/WIKIMEDIA COMMONS

COLUMBIA INSTITUTE 5
To put this in context, Partnerships BC estimates the capital cost for the Royal
Inland Hospital at $79.8 million. The Surrey Memorial Hospital redevelopment
project had an estimated capital cost of $512 million. The Emily Carr University
project had an estimated capital cost of $134 million.3 Savings from public delivery
of these projects could have built more hospitals and schools in British Columbia.
Historically, Partnerships BC has favoured public-private partnerships based
on the assumption that the private sector partner carries the dollar value of risk
for a P3 project. PBC assumes this risk cannot be reduced in a publicly delivered
project, an opinion rejected by auditors general in Saskatchewan, Ontario, and
Quebec.
Partnerships BC is a private company owned by the government. It makes
its money by advising the government on the use of P3s and then delivering
projects, a potential conflict of interest. In that context, it’s not surprising that
Partnerships BC’s methodology has tended to favour P3s. In 2014, a Ministry of
Finance review of the agency found that PBC frequently compares the cost of P3s
with the most expensive possible form of public delivery, rather than the most
likely form.4
Many other jurisdictions have raised serious questions about the use of public-
private partnerships. In the United Kingdom, some projects have been returned to
the public sector5 while others have had their profits clawed back.6
3 Ibid.4 BC Ministry of Finance Internal Audit and Advisory Services, Review of Partnerships BC, Date
of Fieldwork Completion, July 2014, https://www2.gov.bc.ca/assets/gov/british-columbians-our-governments/services-policies-for-government/internal-corporate-services/internal-audits/partnerships-bc-review.pdf.
5 Martin Beckford, “Hospital saves £14m by getting out of PFI deal,” The Telegraph, 2 February 2011, telegraph.co.uk/news/health/news/8296685/Hospital-saves-14m-by-getting-out-of-PFI-deal.html.
6 Local Partnerships LLP, “Report and Financial Statements for the year ended 31 March 2014,” 2, http://localpartnerships.org.uk/images/files/LP_signed_accounts_2013.14.pdf.
BC’s auditor general
has yet to examine
BC-based projects
and the methodology
behind them in the same
rigorous fashion. The
release of information
on 17 public-private
partnerships reveals
that the real risk is
that generations of
British Columbians will
continue to pay the
inflated price of these
30-year P3 contracts for
many years to come.
BC LEGISLATURE, PHOTO MICHELLE LEE/FLICKR CREATIVE COMMONS

PUBLIC-PRIVATE PARTNERSHIPS IN BRITISH COLUMBIA UPDATE 20186
BC’s auditor general has yet to examine BC-based projects and the methodology
behind them in the same rigorous fashion. The release of information on 17 public-private
partnerships reveals that the real risk is that generations of British Columbians will
continue to pay the inflated price of these 30-year P3 contracts for many years to come.
Early in the century, the BC provincial government compelled health boards and the
Greater Vancouver Transit Authority to deliver projects by offering a choice of using P3s
or losing provincial funding (see case study on page 16). The BC government originally
said that any project worth more than $20 million that had provincial funding was a
potential public-private partnership.
Today, for the most part, the threshold for P3s has been raised to $100 million;
Partnerships BC can only be involved with lower levels of government at their invitation.
Despite the threshold, and particularly with the public-private partnership agenda of
the federal government’s infrastructure bank, new P3s remain a possibility in BC. And, of
course, current projects will continue for decades.
Early in the century,
the BC provincial
government
compelled health
boards and the
Greater Vancouver
Transit Authority to
deliver projects by
offering a choice of
using P3s or losing
provincial funding.
ABBOTSFORD HOSPITAL, PHOTO PARTNERSHIPS BC

COLUMBIA INSTITUTE 7
PA R T 2
What is a public-private partnership?
THE CANADIAN COUNCIL FOR PUBLIC-PRIVATE PARTNERSHIPS (CCPPP),
Canada’s leading lobbyist for the use of P3s, defines P3s as:
partnerships between governments and the private sector to build public infrastructure like roads, hospitals or schools, or to deliver services. Unlike traditional procurement, the public sector integrates all parts of a P3 project into one contract. Depending on the preferred P3 model, this approach requires the architect, the builder, the lender and the maintenance and/or operations provider to form a team.7
CCPPP lists a number of models for public-private partnerships including
what would normally be considered contracting out work. For the most
part, however, CCPPP’s focus is on longer term arrangements involving
both private financing and operation or maintenance. It specifically rejects
design/bid/build projects with no long-term financing or operation in its
definition of a P3.
In essence, public-private partnerships are not really partnerships — they
are contracts.
For the purpose of this report, a public-private partnership is defined as
a public sector infrastructure project that is fully or partially financed by the
private sector on a long-term basis and in which the private sector takes a
long-term operation and/or maintenance role.
7 Canadian Council for Public-Private Partnerships, “What are Public-Private Partnerships (P3s)?,” pppcouncil.ca/web/Knowledge_Centre/What_are_P3s_/web/P3_Knowledge_Centre/What_are_P3s.aspx?hkey=2c6597c6-53bf-4a9d-adf0-86e108d003bb (accessed 29 January 2018).
For the purpose of this
report, a public-private
partnership is defined
as a public sector
infrastructure project
that is fully or partially
financed by the private
sector on a long-term
basis and in which the
private sector takes a
long-term operation and/
or maintenance role.

PUBLIC-PRIVATE PARTNERSHIPS IN BRITISH COLUMBIA UPDATE 20188
C A S E S T U DY
Abbotsford Hospital
A YEAR AFTER THE LIBERAL GOVERNMENT WAS ELECTED IN 2001, a hospital needed to be replaced in Abbotsford. The Liberals were determined to try out their new model of public-private partnerships, which was announced with the creation of Partnerships BC in 2002.
But the government had two problems. First, their own report on the project anticipated a savings of less than 1 per cent by using a P3 — and there was a strong possibility even this was optimistic.8
Second, the government received push back from the Fraser Health Authority. Professor Daniel Cohn conducted an intensive review of the process and reported on his findings in 2008.9 Cohn discovered that some FHA board members with substantial private sector and real estate experience found problems with the
proposed P3. One interviewee said the board had preferred more traditional procurement and was concerned that savings through competition would not materialize. Cohn wrote, “the provincial government ordered the board to accept the project as a DBFO P3 or face removal. Either way, the province had lost confidence in the ability of the FHA board
to lead the project and transferred some FHA staff members and responsibility for executing the project to Partnerships BC.”10
In a 2002 interview with the Journal of Commerce, Finance Minister Gary Collins said P3s were the wave of the future and that “part of the appeal of beginning the province’s P3 learning curve with this project is that there’s little
8 Vaughn Palmer, “Liberals’ pet ‘P3s’ a long way from reality,” Vancouver Sun, 10 May 2002, A14.
9 Daniel Cohn, “British Columbia’s capital asset management framework: moving from transactional to transformative leadership on public-private partnerships, or a ‘railroad job’?,” Canadian Public Administration, 51 (1), March 2008, 71–97.
10 Ibid., 77.
The Liberals were
determined to try
out their new model
of public-private
partnerships, which
was announced
with the creation of
Partnerships BC in
2002. But their own
report on the project
anticipated a savings
of less than 1 per cent
by using a P3 — and
there was a strong
possibility even this
was optimistic.
“...Even if the project doesn’t
work well, it’s unlikely that
Fraser Valley farmers will
elect an NDP government
next time around.” — Then
Finance Minister Gary Collins
PUBLIC-PRIVATE PARTNERSHIPS IN BRITISH COLUMBIA UPDATE 20188
COLUMBIA INSTITUTE 9
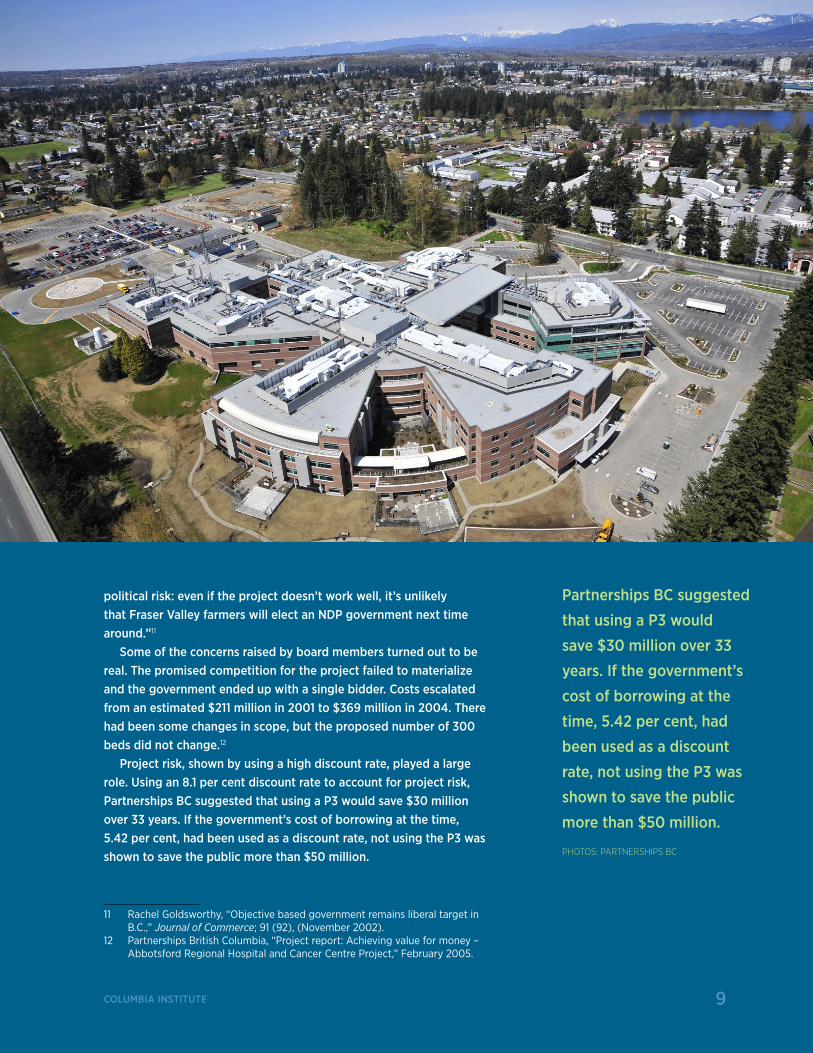
political risk: even if the project doesn’t work well, it’s unlikely that Fraser Valley farmers will elect an NDP government next time around.”11
Some of the concerns raised by board members turned out to be real. The promised competition for the project failed to materialize and the government ended up with a single bidder. Costs escalated from an estimated $211 million in 2001 to $369 million in 2004. There had been some changes in scope, but the proposed number of 300 beds did not change.12
Project risk, shown by using a high discount rate, played a large role. Using an 8.1 per cent discount rate to account for project risk, Partnerships BC suggested that using a P3 would save $30 million over 33 years. If the government’s cost of borrowing at the time, 5.42 per cent, had been used as a discount rate, not using the P3 was shown to save the public more than $50 million.
11 Rachel Goldsworthy, “Objective based government remains liberal target in B.C.,” Journal of Commerce; 91 (92), (November 2002).
12 Partnerships British Columbia, “Project report: Achieving value for money – Abbotsford Regional Hospital and Cancer Centre Project,” February 2005.
Partnerships BC suggested
that using a P3 would
save $30 million over 33
years. If the government’s
cost of borrowing at the
time, 5.42 per cent, had
been used as a discount
rate, not using the P3 was
shown to save the public
more than $50 million.
PHOTOS: PARTNERSHIPS BC
COLUMBIA INSTITUTE 9

PUBLIC-PRIVATE PARTNERSHIPS IN BRITISH COLUMBIA UPDATE 201810
PA R T 3
Comparable cost of P3s and public service delivery
SINCE 2002, WHEN DECIDING whether a new public infrastructure project will be at least
partially financed with private sector capital and operated or maintained by the private
sector, the government has gone through an evaluation process.
This process is based on two assumptions. Both involve risk and make finding value
in public projects as opposed to P3s almost impossible.
The first assumption is that publicly-delivered projects pay for construction costs up
front without borrowing. The second assumption is the use of a high discount rate (a
rate used to discount or weight future expenditures in order to calculate their equivalent
present value). Because it is assumed that public projects pay for construction up front
without borrowing, there is little discounting of this money. Yet, it is assumed that a
private partner borrows the money and pays it back over the long term, meaning that
over 30 years the value of their costs are discounted deeply.
In 2009, when data was less available than now, two prominent British Columbia
forensic accountants reviewed four BC public-private partnerships and reached some
notable conclusions. They observed that the difference in cost (in undiscounted dollars)
between a publicly-delivered project and a P3 could be substantial. They found that
the elevated discount rates used by Partnerships BC were not appropriate. And, that
the methodology used by Partnerships BC was biased in favour of public-private
partnerships.13
In 2018, with more available data, these conclusions still stand. Using appropriate
discount rates and less biased assumptions, few P3s show value for money.
While discount rates are critical to rationalizing P3 projects, it is also important to
consider the actual number of dollars spent over the life of these projects. Looking at
17 projects, roughly half of Partnerships BC’s DBFO (design/build/finance/operate) or
DBFM (design/build/finance/maintain) developments, P3s cost $18.3 billion. If those 17
13 Ronald H. Parks and Rosanne E. Terhart, “Evaluation of Public Private Partnerships: Costing and Evaluation Methodology: Blair Mackay Mynett Valuations,” 5 January 2009, http://d3n8a8pro7vhmx.cloudfront.net/cupebcvotes2014/legacy_url/1044/bw-final-report_0.pdf?1460990529.
In 2018, with more
available data,
these conclusions
still stand. Using
appropriate discount
rates and less biased
assumptions, few
P3s show value
for money.

COLUMBIA INSTITUTE 11
projects were procured through traditional means with public financing, those projects
would have cost $3.7 billion less, a saving of roughly 20 per cent. It is important to note
that this 20 per cent saving was arrived at despite large values of risk that were already
loaded onto the assumed cost of publicly-delivered projects.
It was only after loading even more risk onto the cost of public projects (project risk)
through an elevated discount rate that Partnerships BC was able to find value for the
P3s.
These findings are supported by a 2014 BC Ministry of Finance evaluation of
Partnerships BC. The report found that in comparing costs, Partnerships BC frequently
used the most expensive possible form of public procurement to compare with a P3
rather than the most likely one.
The report raised the possibility of bias in Partnerships BC’s work.
PBC is mandated to be both an advisor and service provider to government, and to
also be a self-sustaining organization. These multiple roles have created the perception
that PBC’s advice to government could be biased towards solutions that create
opportunities for PBC to earn revenue.14
Two other observations raised questions about the wisdom of using a P3 for some
of the projects. A supplementary report from the Partnerships BC evaluation steering
committee said, “Given the significant resources required by both the public sector
and private sector to participate in a P3 procurement process, it is recommended that
the preliminary threshold identified in the capital asset management framework for P3
screening be increased from the current $50 million to $100 million.”15
Using the Partnerships BC discount rates, the Britannia Mine Water Treatment Plant,
the Diamond Health Centre, and the Cancer Centre for the North would have failed to
meet the $100 million threshold. The same is true for one of the earliest P3s, the Sierra
Desan Road.
The 2014 BC Ministry of Finance study says, “Given the inherent uncertainty of the
assumptions made in the value for money calculations, at least one jurisdiction in
Canada has set a minimum value for money threshold (5 per cent) that is required to
go forward as a P3, and the government could consider doing the same.”16
Even when using the Partnerships BC methodology, several projects came close
to the 5 per cent advantage threshold, including the South Fraser Perimeter Road (5
per cent), the Kelowna and Vernon Hospitals Project (5.7 per cent), the Prince George
Cancer Centre (6.3 per cent), and the Royal Jubilee Hospital (6.1 per cent). The Golden
Ears Bridge was simply reported as “very close.” A small reduction in risk assumptions
would have put these projects below the 5 per cent threshold.
14 BC Ministry of Finance, “Internal Audit and Advisory Services, Review of Partnerships BC, Date of Fieldwork Completion,” July 2014, 13, https://www2.gov.bc.ca/assets/gov/british-columbians-our-governments/services-policies-for-government/internal-corporate-services/internal-audits/partnerships-bc-review.pdf.
15 Peter Milburn, Chair Executive Steering Committee, Ministry of Finance Review of Partnerships BC, Correspondence to Michael de Jong of the BC Ministry of Finance, 23 October 2014. Document no longer available on the Internet.
16 Ibid., 24.
Partnerships BC
is mandated to be
both an advisor and
service provider to
government, and to
also be a self-sustaining
organization. These
multiple roles have
created the perception
that PBC’s advice to
government could
be biased towards
solutions that create
opportunities for PBC
to earn revenue.

PUBLIC-PRIVATE PARTNERSHIPS IN BRITISH COLUMBIA UPDATE 201812
PA R T 4
Direct risk adjustments
PART OF THE JUSTIFICATION for the use of public-private partnerships is that risk, which
would be carried by the public in traditional project delivery, is transferred to the private
sector. The risk involved — both in terms of construction and operation — is given a value.
Because it is assumed the public would carry the risk in traditional project delivery, it is
then added to the assumed cost of delivering the project publicly rather than through a P3.
In reality, regardless of P3 contracts, the public carries the final risk. The public will
have to pick up the pieces if the private partner fails. To the degree that risk can be
transferred, such as penalties for late delivery, auditors general in other jurisdictions have
found it can be done in a publicly-delivered project.
In short, PBC methodology overstates the risk carried by the public sector project
because it fails to consider how risk could be shed under traditional procurement. And it
understates the risk associated with the P3 because it fails to address contract failure. The
value of that assumed risk can be very high.
SOUTH FRASER PERIMETER ROAD AT PORT MANN BRIDGE, PHOTO ALEXANDER POPE/FLICKR CREATIVE COMMONS
In reality, regardless
of P3 contracts, the
public carries the
final risk. The public
will have to pick
up the pieces if the
private partner fails.

COLUMBIA INSTITUTE 13
Table 1 illustrates the assumed comparable cost of delivering a project publicly (public
sector comparator) with the cost of using a P3 (final concession agreement).
In this case, the assumed value of risk of $102 million has been added to the assumed
cost of delivering the project publicly. That $102 million comes to 16 per cent of the total
cost of delivering the project publicly. This is more
than three times the assumed 5 per cent saving
involved in using a P3.
As with many other aspects of public-private
partnerships, the details of how to achieve these risk
assumptions are often kept secret. Ontario’s auditor
general, who has access to many of these details,
found, “there is no empirical data supporting the key
assumptions used by Infrastructure Ontario to assign
costs to specific risks.” The auditor general also found
that in some cases risk assumed to be transferred
was not actually transferred. Finally, some of the risks
assumed to be transferred were not appropriate.17
This “risk adjustment” can be smaller in other
projects. In the Kelowna and Vernon Hospitals
Project, the net risk adjustment came to roughly
seven percent of the value of the public sector
comparator. Even this, however, was more than the
5.7 per cent advantage found for using a P3.
17 Auditor General of Ontario, “Chapter 3: Infrastructure Ontario — Alternative Financing and Procurement,” 2014 Annual Report, auditor.on.ca/en/content/annualreports/arreports/en14/305en14.pdf.
17
SOUTH FRASER PERIMETER ROAD
Overview of the allocation of key risks in the Concession Agreement:
DESCRIPTION OF RISK CONCESSIONAIRE PUBLIC SECTOR
Design 4
Construction 4
Functionality of Design 4
Ground Conditions 4
Traffic Management 4
Operations & Maintenance 4
Rehabilitation 4
Financing 4
Force Majeure/Relief Events 4 4
Change in Law 4 4
Property Acquisition within the Identified Right of Way 4
Property Acquisition outside the Identified Right of Way 4
Scope Changes initiated by Public Sector 4
Quantitative Benefits of the Concession AgreementFinancial value for money is the difference between the net present cost of the payments over the life of the Concession Agreement and the expected net present cost of the public sector comparator (PSC).
The expected net present cost (NPC) of the Project delivered using traditional procurement, the PSC, is an estimated $637 million (NPC). The partnership model including the final Concession Agreement with FTG has a NPC of $603 million. A high-level comparison of these numbers is provided below. In financial terms, the final Concession Agreement is estimated to achieve value for money for taxpayers’ dollars of $34 million (NPC), when compared to the PSC. All numbers are in millions of dollars as of January 1, 2009, as per the RFP.
ESTIMATED PUBLIC SECTOR COMPARATOR
$Millions (Net Present Cost)
Phase 2 Capital Costs $ 412
Life Cycle and Operating Costs $ 66
Risk Adjustment $ 102
Competitive Neutrality Adjustment $ 18
Province’s Phase 2 Project Management Costs $ 39
Total Phase 2 Public Sector Comparator $ 637
FINAL CONCESSION AGREEMENT
$Millions (Net Present Cost)
Availability Payments $ 233
Provincial Milestone Payments $ 174
Federal Milestone Payments $ 183
Province’s Phase 2 Project Management Costs $ 13
Total Phase 2 under Final Concession Agreement $ 603
Value for Money (Millions Net Present Cost)3 $34
Percentage Savings from PSC 5%
3The discount rate used for the calculation of value for money is 7.41 per cent. Sensitivity analysis of the discount rate showed that the VFM would have been approximately $14 million (NPC) less if the discount rate was 50 basis points lower and about $19 million (NPC) more if the discount rate was 50 basis points higher.
TABLE 1: COMPARABLE COSTS FOR A P3 AND TRADITIONAL DELIVERY
SOUTH FRASER PERIMETER ROAD
Source: Project Report, South Fraser Perimeter Road, June 2011
TABLE 2: COMPARABLE COSTS FOR A P3 AND TRADITIONAL DELIVERY
KELOWNA AND VERNON HOSPITALS PROJECT
18
7. Achieving Value for Money
Value for money is a broad term that captures bothquantitative factors, such as costs, and qualitativefactors, such as service quality. Partnerships BClooks at a broad range of factors in determiningwhether a project offers value for money totaxpayers, including comparison of the finalagreement to other benchmarks – in this case, theexpected results of a hypothetical traditional deliverymodel, and the expected results of a hypotheticalpartnership delivery model.
Financial value for money is the difference betweenthe net present cost of the annual service paymentsthat will be paid to Infusion Health over the life of theProject Agreement and the expected net presentcost of the capital cost, facility management andoperating costs, lifecycle maintenance costs andtransferable risk costs included in the referenceproject.
Based on the above, it was determined that the netpresent cost of the KVH project delivered traditionallyis an estimated $468.1 million. The final ProjectAgreement with the private partner, Infusion Health,has a net present cost of $442.7 million. Thus, usingconservative assumptions, in financial terms, thefinal Project Agreement is expected to achievevalue for taxpayers’ dollars of $25.4 million.
The significant factors in creating this value formoney include joint procurement; efficiencies fromintegrating the design, build and finance teams; andefficient transfer of risk.
Net present cost figures above were developedusing a discount rate, which represent the cost ofcapital over time taking into account factors such asinflation and interest rates. The discount rate usedfor the calculation of value for money is 7.8 per cent.Sensitivity analysis of the discount rate showed thatthe net present cost of the Project Agreement wouldhave been approximately $21 million less than that ofthe public sector comparator if the discount rate was50 basis points lower, and about $29.3 million less ifthe discount rate was 50 basis points higher.
FinalAgreement PSC
Capital Costs (includes RHD and IH) $256.9M
RHD and IHA Contribution toCapital Cost $178.6M
Lifecycle Costs $44.8M
Facility Maintenance Costs $113.8M
Risk Adjustment $1.2M $33.5M
Competitive Neutrality $9.3M $19.1MAdjustment (includes GST, insurance and public sector procurement costs)
ASP Payment to Infusion $253.6M
Total $442.7M $468.1M
Cost Differential $25.4M
Percentage saving from PSC 5.7%
NOTE: all numbers are NPC discounted at 7.8%
Source: Project Report, Kelowna and Vernon Hospitals Project

PUBLIC-PRIVATE PARTNERSHIPS IN BRITISH COLUMBIA UPDATE 201814
The information on this “risk adjustment” is not available for all the Partnerships BC
projects. In Appendix B, however, the information is listed for 17 of the projects. The value
of this risk identified and transferred to the estimated cost of public procurement varies
from a low of 6.9 per cent of the cost of public procurement to a high of 16.2 per cent.
Curiously, projects in the same sector do not carry the same amount or even similar
amount of risk. Both the lowest risk adjustment (Kelowna and Vernon Hospitals
Project — 6.9 per cent) and the highest (Interior Heart and Surgical Centre — 16.2 per cent)
are among the nine hospital projects carried out by Partnerships BC.
The importance of risk adjustment in justifying the use of P3s is particularly apparent
in transit, road, and bridge projects. The Golden Ears Bridge anticipated savings of
$6.3 million by using a P3. It anticipated a risk transfer of $170.6 million from risk
adjustment — nearly 3,000 per cent of the amount of money claimed to be saved with a
P3. The South Fraser Perimeter Road project assumed risk transfer was 300 per cent of
anticipated savings. With the Canada Line it was 253 per cent more.
Each of these projects lists the anticipated saving from using a P3 as opposed to public
procurement. These range from an anticipated savings of 5 per cent for the South Fraser
Perimeter Road Project to 19.1 per cent for the Interior Heart and Surgical Centre Project
with an average claimed savings of 7.4 per cent. The comparative cost of a P3 vs. public
procurement for the Golden Ears Bridge was described in its value for money report as
“very close.”18
In eight of the 15 projects, the amount of the risk adjustment is higher than the claimed
savings from using a public-private partnership. This, however, is only one element of risk
used by Partnerships BC. The other element is addressed in the next section.
This use of a direct risk adjustment is used in jurisdictions with public-private
partnerships. However, in other jurisdictions, government auditors have examined the
value of risk assumed to be transferred and found it to be inflated.
In the United Kingdom’s National Audit Office, a study found that adjustments to value
for money reports, such as “risk transfer,” “were not evidenced and increased the relative
cost of the public sector comparator more than the private finance option. An important
part of these adjustments relates to the benefits of transferring construction risk but there
is little evidence that overall construction cost is lower under PFI.”19 PFI, or private finance
initiative, is the term used for public-private partnerships in the UK.
Ontario’s auditor general has questioned the amount of risk transfer being loaded onto
public sector comparators. The 2010 Ontario auditor general looked at the procurement of
the Brampton Hospital and questioned the potential 13 per cent in savings that had been
achieved by transferring risk to the private sector.
The report said, “We questioned the inclusion of such a large amount because
a properly structured contract and sound project management under a traditional
18 Fred Cummings, “Golden Ears Bridge Project, Golden Ears Bridge: Value for Money Report,” Memo to the GVTA Board of Directors, 16 June 2006.
19 National Audit Office, “Report by the Comptroller and Auditor General, PFI and PF2,” 18 January 2018, 20, https://www.nao.org.uk/wp-content/uploads/2018/01/PFI-and-PF2.pdf (accessed 2 February 2018).

COLUMBIA INSTITUTE 15
procurement agreement could have mitigated many of the risks of cost
overruns.”20 In her 2014 report, Ontario’s auditor general also included
serious concerns about the amount of risk that was assumed to be
transferred with projects.21
In 2015, Saskatchewan’s auditor general found the assumed cost of risk
transfer was high. The auditor general said, “SaskBuilds valued the cost
savings from using a P3 approach, as compared to using the PSC, from just
under 10 per cent to over 30 per cent of the cost of each project. For all four
projects combined, SaskBuilds estimated the cost of the risks that the public
sector would retain, if it used conventional approaches, to be six times
higher than if it used P3s.” The auditor general continued that any benefits
obtained from public-private partnerships, “could be used in conventional
procurement processes (e.g., more efficient building designs, facilities
maintained at required levels).”22
SaskBuilds was a client of Partnerships BC in developing its approach to
the use of public-private partnerships.
20 Auditor General of Ontario, “Chapter 4: Brampton Civic Hospital Public-Private Partnership Project,” 2010 Annual Report, 307.
21 Auditor General of Ontario, “Chapter 3: Infrastructure Ontario—Alternative Financing and Procurement,” 2014 Annual Report, auditor.on.ca/en/content/annualreports/arreports/en14/305en14.pdf.
22 Auditor General of Saskatchewan, “Chapter 16, SaskBuilds—Evaluating Potential use of P3s,” 2015 Annual Report, https://auditor.sk.ca/pub/publications/public_reports/2015/Volume_1/16_SaskBuilds-Evaluating%20P3s.pdf.
The comparative cost of a
P3 vs. public procurement
for the Golden Ears Bridge
was simply described
in its value for money
report as “very close.”
GOLDEN EARS BRIDGE, PHOTO MARCIN CHADY/ FLICKR CREATIVE COMMONS

PUBLIC-PRIVATE PARTNERSHIPS IN BRITISH COLUMBIA UPDATE 201816
The province added
more pressure and,
in June, the project
failed again in a tie
vote. The Canadian
Union of Public
Employees (CUPE)
was offered a right
of first refusal for
union members, who
would work on the
line if they would
end their opposition.
They refused. Finally,
in July, two directors
switched their votes
to ‘yes’ and the
project was passed.
Costs for the project escalated
from $1.5 billion in 2004
to a final cost of more than
$2 billion, despite a surprise,
controversial decision to use a
trench for construction rather
than tunneling, cuts in the
number of stations, and shifting
costs to other agencies.
PUBLIC-PRIVATE PARTNERSHIPS IN BRITISH COLUMBIA UPDATE 201816
C A S E S T U DY
Canada Line
IN 2000, British Columbia and local government jurisdictions began discussing the possibility of building a rapid transit line along the Richmond-airport-Vancouver corridor. Once again, the province was determined from the outset that it would be a public-private partnership — regardless of what anyone else wanted.
In June 2002, BC’s deputy transportation minister wrote to Metro Vancouver’s transportation agency, TransLlink, saying “Any project constructed using provincial funding will be a public-private partnership.23 Two years later, the deputy minister to the premier wrote one more time to TransLink and once again linked the P3 to any provincial funding. He said, “the Province’s funding commitment to the project does assume and is conditional on a public-private partnership.”24
The board of directors was resistant. In May 2004, the Greater Vancouver Regional District voted the project down, citing concerns about cost, the
choice of system, and the use of a P3. The province added more pressure and, in June, the project failed again in a tie vote. The Canadian Union of Public Employees (CUPE) was offered a right of first refusal for union members, who would work on the line if they would end their opposition. They refused.25 Finally, in July, two directors switched their votes to ‘yes’ and the project was passed. The province’s distrust of the transportation authority finally played out in 2007 when the
23 Dan Doyle, BC Deputy Minister of Transportation, Correspondence to Pat Jacobsen, President and CEO TransLink, 19 June 2002.
24 Ken Dobell, BC Deputy Minister to the Premier and Cabinet Secretary, Correspondence to Pat Jacobsen, CEO of the Greater Vancouver Transportation Authority, 8 March 2004.
25 Jeff Lee, “Union reps turn down RAV jobs,” Vancouver Sun, 25 June 2004.

COLUMBIA INSTITUTE 17
In the end, the value for money report found a limited advantage for the public-private partnership over a public sector comparator only because it assumed there would be $148 million (net present value) greater ridership revenue on a P3. One reason offered was that the P3 idea of running more trains at midday and eliminating stations was considered to be too innovative for a publicly-delivered project.
TOP PHOTO: DENNIS TSANG/FLICKR CREATIVE COMMONS
BACKGROUND PHOTO: TED MCGRATH/FLICKR CREATIVE COMMONS
COLUMBIA INSTITUTE 17
transportation minister announced legislation that would strip elected directors of their authority in favour of an appointed board.26
Meanwhile, costs for the project escalated from $1.5 billion in 2004 to a final cost of more than $2 billion, despite a surprise, controversial decision to use a trench for construction rather than tunneling, cuts in the number of stations, and shifting costs to other agencies.
In the end, the value for money report found a limited advantage for the public-private partnership over a public sector comparator only because it assumed there would be $148 million (net present value) greater ridership revenue on a P3. One reason offered was that the P3 idea of running more trains at midday and eliminating stations was considered to be too innovative for a publicly-delivered project.27 This was despite the fact that the VFM report acknowledged, “it is possible that the PSC ridership could be increased by increasing midday train frequencies…”28
26 Miro Cernetig and William Boei, “Province unveils TransLink redesign: new council of mayors will oversee transit across Lower Mainland and beyond,” Vancouver Sun, 8 March 2007.
27 Canada Line Rapid Transit Inc., “Final project report: competitive selection phase,” April 2006, 17, 20.
28 Ibid., 18.

PUBLIC-PRIVATE PARTNERSHIPS IN BRITISH COLUMBIA UPDATE 201818
PA R T 5
Adding more risk transfer with the discount rate
ANOTHER ELEMENT OF RISK used by Partnerships BC lies in its assumptions related to
government borrowing and use of the discount rate.
The first issue is the assumption about borrowing. When Partnerships BC compares
the cost of using a public-private partnership with traditional project delivery, it assumes
the government does not borrow money to finance construction of traditionally delivered
projects. In contrast, it assumes with a P3, the private partner borrows the money and
pays the money back over the life of the project. These inconsistent assumptions favour
public-private partnerships.
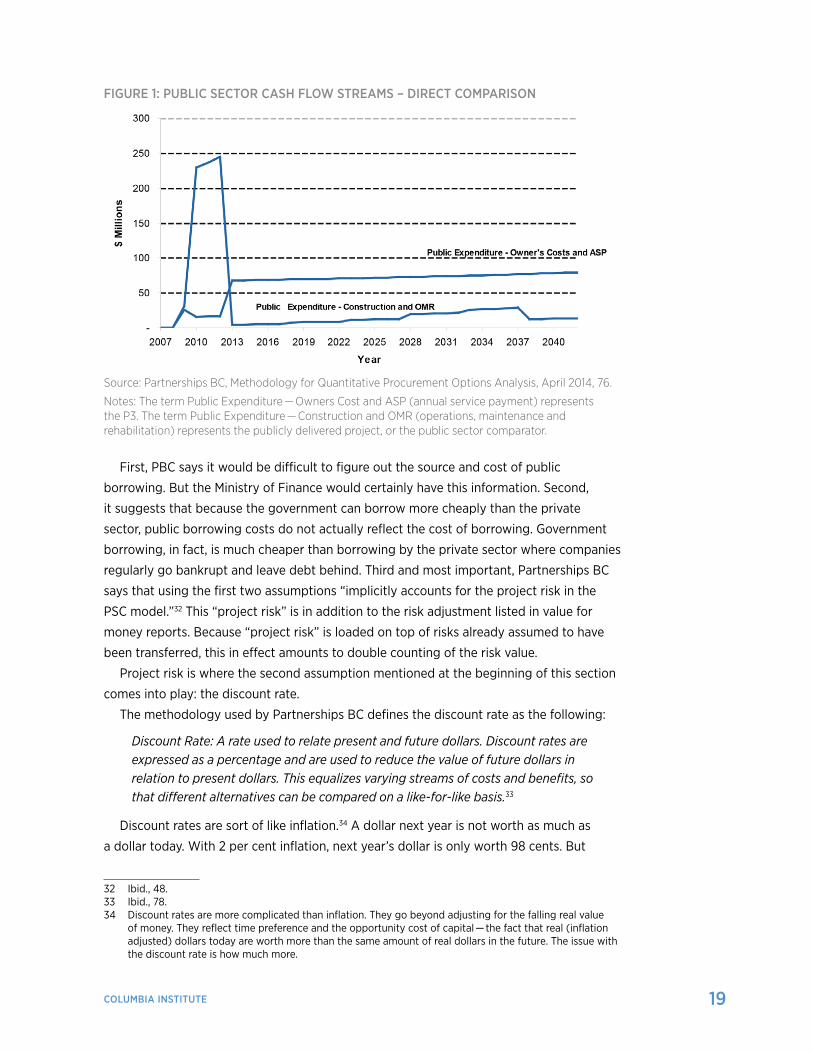
In its published methodology, Partnerships BC includes a chart that demonstrates the
effect on cash flows from this assumption.29 In this chart, the “Construction and OMR”
(operating, maintenance, and rehabilitation)” line represents the public sector comparator.
The “Owner’s Costs and ASP” (annual service payment) line represents the public-private
partnership.
As the chart shows, with traditional public delivery, it is assumed that construction
costs are paid upfront and not borrowed.
This has not been the case. Governments do not have a mountain of cash they can
dip into when they want to build something. In fact, the BC government has published
a spreadsheet of its borrowing showing the amount borrowed, the cost of borrowing,
and when the borrowing comes due. Millions of dollars are borrowed annually for capital
projects.30
Partnerships BC offers three reasons to explain why it used an “unfinanced” public
sector comparator when the government does not borrow to build the project.31
29 Partnerships BC, “Methodology for quantitative procurement options analysis: discussion paper,” Updated, April 2014, 76
30 Previously found at: fin.gov.bc.ca/PT/dmb/capmarkets.htm. The author has a copy of the information, but at the time of writing, was waiting for a response to a request about the new location of the information.
31 Partnerships BC, “Methodology for Quantitative Procurement Options Analysis,” April 2014, 48.
COLUMBIA INSTITUTE 19
First, PBC says it would be difficult to figure out the source and cost of public
borrowing. But the Ministry of Finance would certainly have this information. Second,
it suggests that because the government can borrow more cheaply than the private
sector, public borrowing costs do not actually reflect the cost of borrowing. Government
borrowing, in fact, is much cheaper than borrowing by the private sector where companies
regularly go bankrupt and leave debt behind. Third and most important, Partnerships BC
says that using the first two assumptions “implicitly accounts for the project risk in the
PSC model.”32 This “project risk” is in addition to the risk adjustment listed in value for
money reports. Because “project risk” is loaded on top of risks already assumed to have
been transferred, this in effect amounts to double counting of the risk value.
Project risk is where the second assumption mentioned at the beginning of this section
comes into play: the discount rate.
The methodology used by Partnerships BC defines the discount rate as the following:
Discount Rate: A rate used to relate present and future dollars. Discount rates are expressed as a percentage and are used to reduce the value of future dollars in relation to present dollars. This equalizes varying streams of costs and benefits, so that different alternatives can be compared on a like-for-like basis.33
Discount rates are sort of like inflation.34 A dollar next year is not worth as much as
a dollar today. With 2 per cent inflation, next year’s dollar is only worth 98 cents. But
32 Ibid., 48.33 Ibid., 78.34 Discount rates are more complicated than inflation. They go beyond adjusting for the falling real value
of money. They reflect time preference and the opportunity cost of capital — the fact that real (inflation adjusted) dollars today are worth more than the same amount of real dollars in the future. The issue with the discount rate is how much more.
Source: Partnerships BC, Methodology for Quantitative Procurement Options Analysis, April 2014, 76.
Notes: The term Public Expenditure — Owners Cost and ASP (annual service payment) represents the P3. The term Public Expenditure — Construction and OMR (operations, maintenance and rehabilitation) represents the publicly delivered project, or the public sector comparator.
FIGURE 1: PUBLIC SECTOR CASH FLOW STREAMS – DIRECT COMPARISON

PUBLIC-PRIVATE PARTNERSHIPS IN BRITISH COLUMBIA UPDATE 201820
governments do not use inflation when they are figuring out the cost of a project
over its lifetime.
Overwhelmingly, governments use their own cost of borrowing as a discount
rate when they are looking at P3 projects. Alberta, Saskatchewan, Ontario, and the
federal government all use their own cost of borrowing as their discount rate. Even
in the United Kingdom, which is the model for Partnerships BC and which used to
use a 6 per cent discount rate, has reduced its own discount rate to 3.5 per cent.35
From the beginning British Columbia has used a discount rate much higher than
the government’s cost of borrowing. Partnerships BC, however, uses a discount
rate equal to the private partner’s weighted average cost of capital (WAGG).
The private partner’s cost of capital is higher than the government borrowing
rate for two reasons. First, government can borrow more cheaply than the private
sector because governments have less risk of going out of business. Second,
usually 10 per cent of the money coming from the private partner is equity and
returns on equity are expected to be 15 per cent or higher.36
A simplified example of the impact of the combined assumptions of the
government not borrowing money for a project and a high discount rate can be
found in Appendix C. In this example, using BC assumptions in the first column,
a traditionally-delivered project spends $25 million over 12 years to build and
operate a project. The P3 spends $30 million. Forgetting about inflation for a
moment, the public sector comparator has an advantage of $5 million.
But in the second column, using an 8 per cent discount rate, which Partnerships
BC has used (e.g., Britannia Mine project and Abbotsford Hospital), the public-
private partnership has a $2.3 million advantage. By using Partnerships BC’s two
assumptions, we get a $7.3 million turn around that justifies the P3.
While Appendix C is a simplified example, getting the actual numbers for British
Columbia’s public-private partnerships was a challenge. For more than a decade,
the province and the agencies it worked with refused to release this information,
claiming it was a cabinet secret. BC’s information commissioner agreed with the
province’s arguments and declined to order the release of the information.37
Despite this, the province published this information in its value for money
report on the Sea-to-Sky Highway.38 FOI requests were successful with the Canada
Line project and the Diamond Health Centre. In 2017, the Ministry of Finance
produced the figures for several reports, bringing the total to 17.39 While provincial
35 Byers, S., ‘‘Full-text of Stephen Byers’ speech: the former transport and local government secretary’s speech to the Social Market Foundation in London today,’’ Guardian Unlimited, 3 June 2003, https://www.theguardian.com/society/2003/may/28/publicservices.politics1
36 Partnerships BC, “Methodology for Quantitative Procurement Options Analysis,” April 2014, 72. Major P3 actor John Laing Infrastructure makes the same point here: cityam.com/feeds/tags/john-laing-infrastructure-fund-ltd.xml.
37 Correspondence from Northern Health 27 February 2008, Interior Health 26 May 2008 and Office of the Information and Privacy Commissioner Order Number F09-26, 25 November 2009.
38 Partnerships BC, “Project Report: Achieving Value for Money Sea-to-Sky Highway Improvement Project,” December 2005, partnershipsbc.ca/pdf/SeatoSkyFinal.pdf.
39 BC Ministry of Citizen Services, Correspondence with the author, 7 November 2017, Partnerships BC, Correspondence with the author, 20 July 2017.
These 17 projects
represented roughly
half of the DBFO or
maintain public-private
partnerships that have
involved Partnerships
BC. It is unclear why
the information was
not available for the
remaining projects.
SEA-TO-SKY HIGHWAY PHOTO PROVINCE OF BC

COLUMBIA INSTITUTE 21
government agencies often make FOI files
public at the time of release, they chose not
to do so in these cases.
These 17 projects represented roughly
half of the DBFO or maintain public-private
partnerships that have involved Partnerships
BC. It is unclear why the information was
not available for the remaining projects,
however, there are some indications. In at
least some cases, the government claimed it
simply did not have the information, raising
serious questions about the level of scrutiny
that went into deciding whether a project
would proceed as a P3.40
Appendix A shows information for
the 17 projects with available data before
discounting. Only two of these projects (the
Britannia Mine Water Treatment Plant and
the Emily Carr University campus) showed
that the P3 had an advantage in nominal
spending terms, before discounting, over
public delivery. In the Emily Carr case,
the saving was only 2.5 per cent. In seven
cases, public delivery showed an advantage
of more than 25 per cent. In the case
of the Diamond Health Centre, a public
project showed an advantage of 55 per cent. On average, the public projects showed an
advantage over the P3 by nearly 20 per cent.
Appendix A also shows the impact of what happens when the value of these cash flows
is discounted.
When the Partnerships BC discount rate is applied, all the public-private partnerships
show an advantage over the public sector comparator. The average advantage for the
P3, with discounting, is 10.99 per cent. The discounting brings a 31 per cent turnaround
in favour of the public-private partnership. The Diamond Centre shows a 75 per cent
turnaround. Ten of the projects show a turnaround of 25 per cent or greater.
As noted at the beginning of this section, two practices make finding value in public
projects, as opposed to P3s, almost impossible.
First, for traditional public sector procurement, it is assumed that construction costs are
not financed over the long term, but paid out immediately. Second, using a high discount
40 BC Ministry of Economic Development, Correspondence with the author regarding the Sierra Yoyo Resource Road project, 7 June 2007, BC Ministry of Transportation Correspondence with the author regarding the Bennett Bridge project, 19 June 2008.
In seven cases, public delivery showed an advantage
of more than 25 per cent. In the case of the Diamond
Health Centre, a public project showed an advantage
of 55 per cent. On average, the public projects showed
an advantage over the P3 of nearly 20 per cent.
GORDON AND LESLIE DIAMOND HEALTH CARE CENTRE AT VGH, PHOTO PARTNERSHIPS BC
PUBLIC-PRIVATE PARTNERSHIPS IN BRITISH COLUMBIA UPDATE 201822
rate means that the early spending by the public sector, which is assumed not to be
borrowed, receives very little discounting.
In contrast, financing by the private partner, assumed to be borrowed and paid back
over the life of the project, is discounted heavily after the first few years. Interestingly,
Alberta, which uses public-private partnerships, specifically rejects the idea of using an
inflated discount rate to account for “project risk.” Doing this, according to Partnerships
BC, accounts for the risk of the project. But, as the Alberta Treasury Board points out:
[I]ncreasing the discount rate by adding a risk premium would lead to illogical results when evaluating project costs as a riskier project (with a higher discount rate) would have a lower net present value cost than a less risky project (with a lower discount rate).41
In other words, the riskier the project, using the Partnerships BC methodology, the
cheaper it looks.
However, all governments do use a discount rate when assessing the value of possible
projects. In most cases, governments use their own cost of borrowing as the discount rate.
Partnerships BC uses a higher discount rate to account for “project risk.” Appendix A also
shows the actual discount rate and the government cost of borrowing at the time for the
projects. The average cost of government borrowing for these projects was 4.4 per cent.
The average discount rate used was 6.71 per cent, more than 50 per cent higher than the
cost of government borrowing.
In five cases, the discount rate was more than 3 per cent higher than the government
cost of borrowing. With a $50 million loan, a 3 per cent increase in the cost of borrowing
would boost annual payments by more than a million dollars annually. In the case of
the North Island Hospitals Project, the discount rate was almost double the cost of
government borrowing.
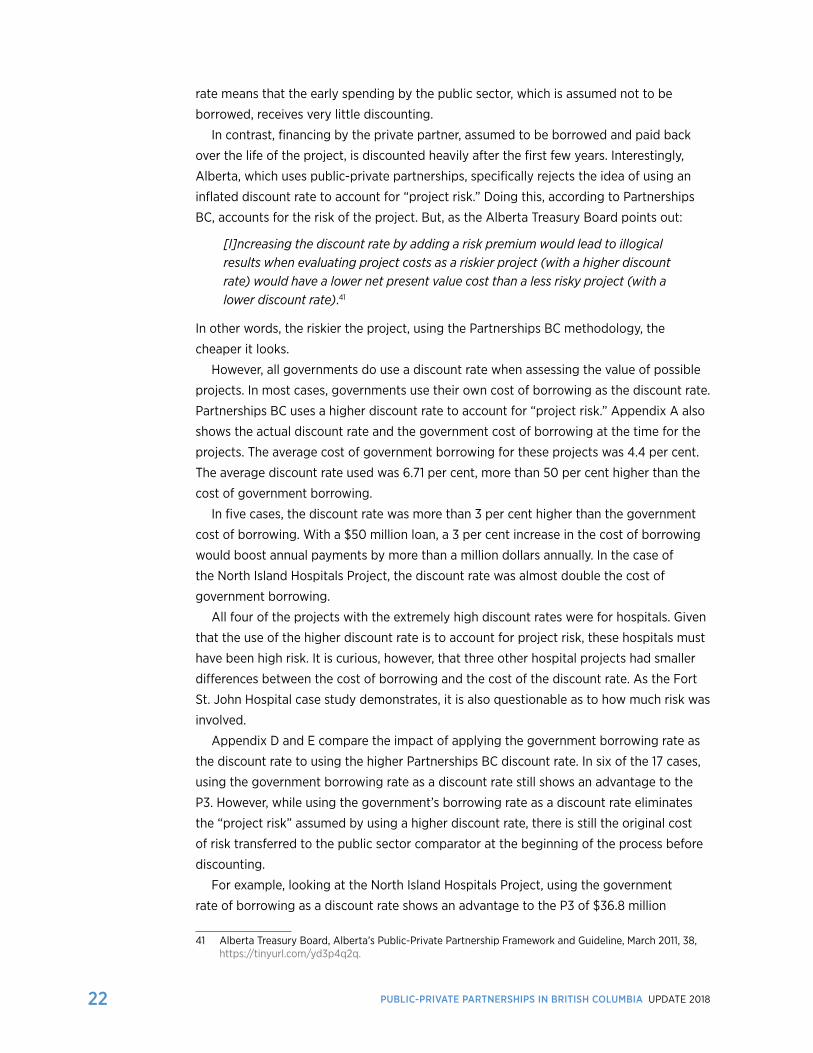
All four of the projects with the extremely high discount rates were for hospitals. Given
that the use of the higher discount rate is to account for project risk, these hospitals must
have been high risk. It is curious, however, that three other hospital projects had smaller
differences between the cost of borrowing and the cost of the discount rate. As the Fort
St. John Hospital case study demonstrates, it is also questionable as to how much risk was
involved.
Appendix D and E compare the impact of applying the government borrowing rate as
the discount rate to using the higher Partnerships BC discount rate. In six of the 17 cases,
using the government borrowing rate as a discount rate still shows an advantage to the
P3. However, while using the government’s borrowing rate as a discount rate eliminates
the “project risk” assumed by using a higher discount rate, there is still the original cost
of risk transferred to the public sector comparator at the beginning of the process before
discounting.
For example, looking at the North Island Hospitals Project, using the government
rate of borrowing as a discount rate shows an advantage to the P3 of $36.8 million
41 Alberta Treasury Board, Alberta’s Public-Private Partnership Framework and Guideline, March 2011, 38, https://tinyurl.com/yd3p4q2q.

COLUMBIA INSTITUTE 23
(Appendix D). However, risk valued at $95.2 million had already been added to the public
sector comparator before discounting.
Unfortunately, the amount of that original risk transfer is still not public for five of the
projects: the Abbotsford Hospital, the Britannia Mine Water Treatment Plant, the Sea-to-
Sky Highway, the Surrey Outpatient Project, and the Diamond Health Centre. In the case
of the Surrey Outpatient Hospital, development period costs were lumped together with
“retained risks” in the value for money report.42
Where the information is available on the risk adjustment before discounting, after
adjusting for the original “retained risk,” only the Emily Carr Campus continues to show
value for the public-private partnership.
A final example of the impact of discounting is worth noting. The value for money
report on the South Fraser Perimeter Road states that the capital cost of the project
was $666 million. However, the same report shows the total discounted project cost as
$603 million. In other words, this discounting makes the cost of the whole project, which
can run for more than 30 years, appear to cost less than the cost of constructing the
facility.43
42 Partnerships BC, “Project Report: Achieving Value for Money — Surrey Outpatient Hospital,” June 2009, 16.43 Partnerships BC, “Project Report — South Fraser Perimeter Road,” June 2011, 2, 17.
All four of the projects with the extremely high discount rates were for hospitals. Given that the use
of the higher discount rate is to account for project risk, these hospitals must have been high risk.
NORTH ISLAND HOSPITALS PROJECT, ARCHITECTURAL RENDERING PARTNERSHIPS BC

PUBLIC-PRIVATE PARTNERSHIPS IN BRITISH COLUMBIA UPDATE 201824
The 2008 financial
crisis saw the
cost of borrowing
by corporations
jump dramatically.
Suddenly, public
borrowing became
even more affordable
compared to P3s.
Still, the provincial
government wanted
public-private
partnerships and
it found a way to
make them happen.
A memo obtained under
freedom of information
suggested that the private
partner was only putting
in about 14 per cent of
construction costs.
PUBLIC-PRIVATE PARTNERSHIPS IN BRITISH COLUMBIA UPDATE 201824
C A S E S T U DY
Fort St. John Hospital Project
AFTER THE ABBOTSFORD HOSPITAL, the province received little push back from health board members, although in 2007, Capital Regional District politicians complained that decisions about the Royal Jubilee Hospital were being made in secret.44
The next stumbling block, however, was the 2008 financial crisis, which saw the cost of borrowing by corporations jump dramatically. Suddenly, public borrowing became even more affordable compared to P3s. Still, the provincial government wanted public-private partnerships and it found a way to make them happen.
In 2008, there was an agreement to deliver a new 55-bed acute-care hospital and a 123-bed residential care facility for seniors in Fort St. John.
Normally, financing from public-private partnerships comes in a mix of roughly 10 per cent equity investment and 90 per cent borrowing by the private partner. The new higher borrowing costs, however, would have made the project exceed the province’s affordability limits. In response the province moved to a “wide equity” model in which, theoretically, the private partner would put up 20 per cent in equity while
the province would do the necessary borrowing.However, a memo obtained under freedom of information suggested that the
private partner was only putting in about 14 per cent of construction costs.45 Another memo received under FOI questioned the amount of money the private partner expected to get for taking on risk: “There is no revenue risk in a hospital project; counter-party risk is the province; so as long as the proponent manages
44 Cindy E. Harnett, “VIHA unveils hospital tower plans, location; Proposals for public-private funding and building site made in secret, regional politicians complain,” Times Colonist, 12 April 2007.
45 Fort St. John — Technical Notes on Financial Structures, undated. Obtained under Freedom of Information.

COLUMBIA INSTITUTE 25
Fort St. John got a hospital,
the private partner got a
30-year contract with a
minimal contribution, and
BC taxpayers got the bill.
PHOTOS: PARTNERSHIPS BC
COLUMBIA INSTITUTE 25
the projects minimal equity risk; and only political risk, which is relatively low.”46
Remember, the province and the health authority were now putting in a lot of money — into a public project nonetheless. As this was government spending, presumably construction spending should show up as spending in the first few years and receive little discounting. So, the government then structured its spending as a “synthetic loan” to the private partner. The memo obtained under FOI explained, “The Affordability Model is necessary to demonstrate to Treasury Board that the Affordability Ceiling has been met, however, it does not reflect the deal structure that will be in the Project Agreement.”47
When looking at public projects Partnerships BC accounts for public borrowing in a way that makes it look expensive. But with this project they accounted for the government’s borrowing to make it look cheap and to make sure the P3 went through.
Fort St. John got a hospital, the private partner got a 30-year contract with a minimal contribution, and BC taxpayers got the bill. The wide equity model was also used for the BC Cancer Agency’s Centre for the North Project.
46 Felix Amerasinghe, “Options for Fort St. John, Corporate and Project Finance,” undated. Obtained under Freedom of Information (confidential draft).
47 Fort St. John, Ibid.

PUBLIC-PRIVATE PARTNERSHIPS IN BRITISH COLUMBIA UPDATE 201826
PA R T 6
Impact of risk
CLEARLY, RISK PLAYS AN ENORMOUS ROLE in justifying the use of public-private
partnerships. Again, turning to the Okanagan Correctional Centre as an example, using
the government borrowing rate as a discount rate shows an advantage to the P3 of
$14.4 million. Using the Partnerships BC elevated discount rate, it jumps to an advantage
of $46.6 million, a $32.2 million or 222 per cent increase for “project risk.”
The original, undiscounted $26.6 million “risk adjustment” for a total risk value of
$58.8 million must be added to the $32.2 million. This comes to nearly a quarter of the
total value of the discounted public sector comparator.
Is there really that much risk involved in these projects? Many people don’t think so.
In 2008, Ontario’s auditor general criticized the provincial government’s decision
to assume “an estimated $67 million in risks transferred to the private sector. This is
equivalent to expecting a 13 per cent cost overrun if the traditional construction method
was used.”48
This is a much lower level of risk than those estimated in Partnerships BC projects. The
Ontario auditor general said, “In comparison, actual cost overruns (a major component
of risk transfer) in the design and construction of the Peterborough Regional Health
Centre — a hospital built under the traditional procurement approach during the same
period — were about 5 per cent of the total contract value.”49
In 2009, Quebec’s auditor general raised similar concerns and found assumptions
about risk in P3 projects, “vary greatly and from decisions based on studies carried out
in other administrations without checking their applicability to Québec’s context.”50 The
Quebec auditor general also criticized the use of an elevated discount rate saying:
48 Auditor General of Ontario, “Chapter 3: Brampton Civic Hospital Public-private Partnership Project,” 2008 Annual Report, auditor.on.ca/en/content/annualreports/arreports/en08/303en08.pdf.
49 Ibid., 112.50 Auditor General of Quebec, “The Auditor General of Québec presents the conclusions of his watch
over the projects to modernize Montréal’s University Health Centres — Public-private partnerships (PPP)” — Press release no. 5, 18 November 2009, vgq.gouv.qc.ca/en/en_salle-de-presse/en_Communiques/en_index.aspx?Annee=2009.
Is there really that
much risk involved
in these projects?
Many people
don’t think so.

COLUMBIA INSTITUTE 27
It is recognized that the higher the discount rate used to convert to today’s dollars the cash flows associated with the two options, the more the PPP will appear preferable over a conventional public sector method, and conversely, because the PPP method permits the spreading out of expenses over a longer period than does the conventional method.
For the CHUM and MUHC [two hospital projects] business cases, PPP Québec chose a higher discount rate (8 percent) than the one it adopted for other PPP projects (6.5 percent) during a similar period, without justification.”51
In January 2018, Britain’s auditor general published a detailed examination of
public-private partnerships, or private finance initiatives as they are called in the
United Kingdom.
We have criticized the use of adjustments in the VFM assessment model, such as “optimism bias” and “risk transfer”, that were not evidenced and increased the relative cost of the public sector comparator more than the private finance option. An important part of these adjustments relates to the benefits of transferring construction risk but there is little evidence that overall construction cost is lower under PFI…52
Finally, an undated memo from the BC Ministry of Finance has also questioned inflated
assumptions about risk transfer. Looking at the Fort. St. John Hospital project the memo
suggested that the bidder should reduce their expected returns because:
• There is no revenue risk in a hospital project;
• Counter-party risk is the province, so as long as the proponent
manages the projects minimal equity risk; and
• Only political risk, which is relatively low.53
51 Ibid.52 National Audit Office, “Report by the Comptroller and Auditor General, PFI and PF2,” 18 January 2018, 20, nao.org.uk/wp-content/
uploads/2018/01/PFI-and-PF2.pdf (accessed 2 February 2018). 53 Felix Amerasinghe, “Corporate and Project Finance, Options for Fort St. John” (undated, obtained under Freedom of Information).
Turning to the Okanagan
Correctional Centre as
an example, using the
government borrowing
rate as a discount rate
shows an advantage to
the P3 of $14.4 million.
OKANAGAN CORRECTIONAL CENTRE, ARCHITECTURAL RENDERING PROVINCE OF BC/FLICKR

PUBLIC-PRIVATE PARTNERSHIPS IN BRITISH COLUMBIA UPDATE 201828
PA R T 7
Some conclusions
THIS REPORT SET OUT TO EXAMINE how the Partnerships BC public-private partnership
methodology shows bias in the way it compares costs of P3s versus publicly-delivered
projects. By investigating a range of examples, it found that when using appropriate
discount rates and less biased assumptions, almost no P3s show value for money. It was
only after loading even more risk onto the cost of public projects (project risk) through an
elevated discount rate that Partnerships BC was able to find value for the P3s.
Other issues still need to be explored. For instance, in many cases, public-private
partnerships have been sold to new owners, often for a substantial profit. The impact of
these ownership changes has not been examined, even in cases where the new owner is
in a tax haven, thus reducing the claimed benefits of taxation to the government.54
Studies in other jurisdictions have found major problems and costs in managing the
relationship between the partners in a P3. This has not yet been examined in British
Columbia.
More analysis needs to be done on the claim that public-private partnerships deliver
projects “on time and on budget.” In BC, costs have tended to escalate dramatically in
the negotiation process. The Canada Line, for example, estimated at an initial cost of
$1.5 billion, came in at a cost of $2 billion. That figure was achieved after reducing the
number of stations and transferring other costs to TransLink.55
As for on time, the Evergreen Line project was delivered late, but despite this, the
province agreed to waive the penalties that might have been imposed.56
Finally, Partnerships BC has said, “There has been an evolution towards greater
transparency in the way the components comprising the value for money calculation
are disclosed… In more recent projects, such as the Emily Carr University of Art + Design
54 Keith Reynolds, “Are tax havens robbing the government of revenue from P3s? Nobody seems to care,” BC CCPA Policy Note, 2 January 2013.
55 Vaughn Palmer, “Canada Line ‘on budget.’ How DO they do it?” Vancouver Sun, 20 April 2009.56 Jennifer Saltman, “Evergreen Line late but under budget, says province,” Vancouver Sun, 29 November
2016.

COLUMBIA INSTITUTE 29
Redevelopment Project, the information is provided in significant detail and is consistent
from project to project.”57
This move toward greater transparency is welcome and overdue. It is also inadequate.
Much of the process, particularly the risk calculations that add to the assumed cost of
public delivery of projects, remains hidden from public view. Had Partnerships BC’s new
transparency been present in 2002 it is unlikely than many of these P3 projects would
have gone forward.
More remains to be done. Further transparency would be evident if information were
disclosed proactively and not bundled in such a way as to prevent identification of
important figures such as initial risk adjustment.
57 Partnerships BC, Correspondence with the author, 5 March 2018.
By investigating a range of examples, this report found that when
using appropriate discount rates and less biased assumptions, almost
no P3s show value for money. It was only after loading even more risk
onto the cost of public projects (project risk) through an elevated
discount rate that Partnerships BC was able to find value for the P3s.
Had Partnerships BC’s
new transparency
been present in
2002 it is unlikely
than many of these
P3 projects would
have gone forward.
EMILY CARR UNIVERSITY ARCHITECTURAL RENDERING PROVINCE OF BC/FLICKR

PUBLIC-PRIVATE PARTNERSHIPS IN BRITISH COLUMBIA UPDATE 201830
PA R T 8
Recommendations
1. Dissolve Partnerships BC, move its function to a ministry, and improve the
capacity of ministries delivering infrastructure to evaluate and deliver projects.
As the 2014 Ministry of Finance review of Partnerships BC noted, creating
Partnerships BC as a private company owned by the Ministry of Finance and
dependent on earned revenue created the risk of bias within the organization
toward forms of project delivery that could deliver revenues to the agency.
Partnerships BC also promotes the development of P3s, provides
recommendations to government on infrastructure procurement, conducts
procurement options analysis, and develops value for money reports on projects.
A report published by the World Bank suggests,
Risks of a conflict of interest arise with cross-sectoral PPP units that both provide input into the approval process for PPPs and play a role in identifying and preparing projects. Conflicts also can arise if a PPP unit promotes or assists in developing projects and then is asked to carry out ex post evaluations. The best solution may be to split the functions.58
The government could fund an agency delivering infrastructure advice and
services under a ministry in order to eliminate any possible conflict of interest
generated by the need to earn revenue for the agency. Such an agency would
have a role in supporting and achieving infrastructure efficiency, but it should
also focus on other factors that bring value to the project, such as sustainable
development, apprenticeships, and job provisions for women and indigenous
workers.
58 Mark Dulz, Clive Harris, Inderbir Dhingra and Chris Shugart, Public-private partnership units: what they are what they do?, Public Policy for the Private Sector,” Note 311, World Bank, Washington, DC, September 2006, 3, http://web.worldbank.org/archive/website01021/WEB/IMAGES/311DUTZ_.PDF.
“Risks of a conflict
of interest arise with
cross-sectoral PPP
units that both provide
input into the approval
process for PPPs and
play a role in identifying
and preparing projects.”
— World Bank report

COLUMBIA INSTITUTE 31
2. Consider ending the use of long-term public-private partnerships in which the private
partner fully or partially finances the project and is responsible for management,
operations or rehabilitation. At a minimum, there should be a moratorium on such
projects, until the process has been fully reviewed by the auditor general. The review
findings could be shared with the public.
3. Similar to other provinces, ask British Columbia’s auditor general to review the
impact of Partnerships BC’s methodology for determining the use of public-
private partnerships rather than simply examining individual projects. Such a
study would include an examination of the relationship between public bodies
and private partners, including the movement of personnel between government
and corporations involved in P3s, and disputes with private sector companies over
interpretations of the operation and maintenance portion of their agreements.
4. Follow the lead of other jurisdictions and end the practice of using a discount rate
higher than the province’s borrowing rate when addressing value for money issues.
5. Adopt a policy of prompt and full proactive disclosure of all procurement records,
including preliminary analyses, business case documents, successful and unsuccessful
bids, evaluations of bids, and contracts.
6. Move to a discretionary standard for the release of information that has gone before
cabinet or cabinet committees. Give information commissioners access to these
documents and the ability to rule on whether such documents should be released.
7. Examine the costs and benefits of buying back existing public-private partnerships
including the possibility of purchasing such contracts if the private partner fails and
of more rigorously policing performance guarantees.
At a minimum, there should be a moratorium on such projects,
until the process has been fully reviewed by the auditor general.

PUBLIC-PRIVATE PARTNERSHIPS IN BRITISH COLUMBIA UPDATE 201832
PA R T 9
Methodology
PURSUING A LONG-TERM ANALYSIS of public-private partnerships in British Columbia is
challenging. Over time, the type and quality of information reported on these projects has
changed, making comparisons difficult. For more than a decade critical information was
withheld as cabinet secrets under S.12 of the BC Freedom of Information and Protections
of Privacy Act. In a number of earlier projects, some important information was not
created or subsequently lost.
In the case of the Abbotsford Hospital, Partnerships BC was unable to provide
information on the value of initial risk adjustment and other issues, saying that despite
extensive reviews it could not provide the information. In the case of the William R.
Bennet Bridge, the Britannia Mine Water Treatment Plant, and the Diamond Health Centre,
Partnerships BC said it did not have source files that would have allowed it to create
tables of information that were made available in later documents.59
Even in the case of some later files, it was not possible to obtain information on the
value of the initial risk adjustment. In the Surrey Outpatient facility case, for example,
risk adjustment values were rolled into development and operating period costs and not
reported separately.60 For this reason, the following appendices do not report on the
impact of initial risk adjustment for the cases cited.
Additionally, the reported net present value for money figures in Partnerships BC
reports do not match the net present value for money figures calculated using the actual
cash flow data retrieved under freedom of information requests and figures reported
in the most recent value for money reports. In a 2013 memo, the President and CEO of
Partnerships BC explains the differences:
It is important to note that the cash flows used to derive the net present cost numbers for the PSC and PPP delivery models in the Project Reports are based on a combination of monthly, quarterly and semi-annual cash flows. The cash
59 Partnerships BC, Correspondence with the author, 5 March 2018.60 Ibid.

COLUMBIA INSTITUTE 33
flows in the attached tables have been annualized. Discounting the annual cash flows will produce net present cost number similar, but not exactly the same as in the as in the Project Report. The calculation of net present cost numbers is dependent on the timing of cash flows, so a difference in the net present cost numbers is to be expected.61
Tables A and B show the discounted net present cost figures from the value for
money reports. However, Tables D and E are based on discounting both the actual
reported flows of money of the public sector comparator and the public-private
partnership to permit the use of comparable numbers. This discounting was done
using the net present value formula in Excel. As Partnerships BC suggests, the
resulting numbers are not the same, but the relative impact of the results is similar to
the Partnerships BC project reports.
61 Sarah Clark, President and CEO, Partnerships BC, Memo to the Minister of Finance, 21 August 2013.

PUBLIC-PRIVATE PARTNERSHIPS IN BRITISH COLUMBIA UPDATE 201834
Selected references
Alberta Treasury Board, Alberta’s Public-Private Partnership Framework and Guideline, March 2011, https://open.alberta.ca/publications/5418269
Auditor General of Ontario, “Chapter 3: Brampton Civic Hospital Public-private Partnership Project,” 2008 Annual Report, auditor.on.ca/en/content/annualreports/arreports/en08/303en08.pdf
Auditor General of Ontario, “Chapter 4: Brampton Civic Hospital Public-Private Partnership Project,” 2010 Annual Report, 307.
Auditor General of Ontario, “Chapter 3: Infrastructure Ontario—Alternative Financing and Procurement,” 2014 Annual Report, auditor.on.ca/en/content/annualreports/arreports/en14/305en14.pdf
Auditor General of Saskatchewan, “Chapter 16, SaskBuilds—Evaluating Potential Use of P3s,” 2015 Annual Report, https://auditor.sk.ca/pub/publications/public_reports/2015/Volume_1/16_SaskBuilds-Evaluatingper cent20P3s.pdf
Auditor General of Quebec, “The Auditor General of Québec presents the conclusions of his watch over the projects to modernize Montréal’s University Health Centres – Public-private partnerships (PPP)” – Press release no. 5, 18 November 2009, vgq.gouv.qc.ca/en/en_salle-de-presse/en_Communiques/en_index.aspx?Annee=2009
BC Ministry of Finance Internal Audit and Advisory Services, Review of Partnerships BC, Date of Fieldwork Completion, July 2014, https://www2.gov.bc.ca/assets/gov/british-columbians-our-governments/services-policies-for-government/internal-corporate-services/internal-audits/partnerships-bc-review.pdf
Canadian Council for Public Private Partnerships, “What are Public-Private Partnerships (P3s)?” pppcouncil.ca/web/Knowledge_Centre/What_are_P3s_/web/P3_Knowledge_Centre/What_are_P3s.aspx?hkey=2c6597c6-53bf-4a9d-adf0-86e108d003bb, accessed 29 January 2018.
Cohn, Daniel, “British Columbia’s capital asset management framework: moving from transactional to transformative leadership on public-private partnerships, or a ‘railroad job’?,” Canadian Public Administration, 51 (1), March 2008, 71–97.
Cummings, Fred, Golden Ears Bridge Project, Golden Ears Bridge: Value for Money Report,” Memo to the GVTA Board of Directors, 16 June 2006.
Dulz, Mark, Clive Harris, Inderbir Dhingra and Chris Shugart, “Public-Private Partnership Units: What they are what they do,” Public Policy for the Private Sector, September 2006. http://web.worldbank.org/archive/website01021/WEB/IMAGES/311DUTZ_.PDF
Goldsworthy, Rachel, “Objective based government remains liberal target in B.C.,” Journal of Commerce; Vancouver Vol. 91, Iss. 92, (Nov 20, 2002).

COLUMBIA INSTITUTE 35
Loxley, John, “Asking the right questions: A guide for municipalities considering P3s, Canadian Union of Public Employees,” Ottawa. http://cupe.ca/municipalities/questions-guide-municipal-officials, 10 September 2012.
Loxley, John and Salim Loxley, Public Service, Private Profits: The Political Economy of Public-Private Partnerships in Canada, Fernwood Publishing, 2010.
Milburn, Peter, Chair Executive Steering Committee, Ministry of Finance Review of Partnerships BC, Correspondence to Hon. Michael de Jong, BC Ministry of Finance, 23 October 2014. (No longer available online.)
National Audit Office, “Report by the Comptroller and Auditor General, PFI and PF2,” 18 January 2018, 20, nao.org.uk/wp-content/uploads/2018/01/PFI-and-PF2.pdf (accessed 2 February 2018).
Parks, Ronald H. and Rosanne E. Terhart, Evaluation of Public Private Partnerships: Costing and Evaluation Methodology, Blair Mackay Mynett Valuations, 5 January 2009, http://d3n8a8pro7vhmx.cloudfront.net/cupebcvotes2014/legacy_url/1044/bw-final-report_0.pdf?1460990529
Partnerships BC, “Methodology for Quantitative Procurement Options Analysis: Discussion Paper,” Updated, April 2014, partnershipsbc.ca/files-4/documents/Methodologyper cent20forper cent20Quantitativeper cent20Procurementper cent20Optionsper cent20Analysisper cent20(2014per cent20update).pdf
Partnerships British Columbia, Projects Page, partnershipsbc.ca/projects/, accessed 29 January 2018. This page leads to links for PBC Value for Money reports.
Seymour, Richard, “A short history of privatization in the UK: 1979-2012,” The Guardian, 29 March 2012, theguardian.com/commentisfree/2012/mar/29/short-history-of-privatisation
Shaffer, Marvin, “The Real Cost of the Sea-to-Sky P3: Critical Review of Partnerships BC’s Value for Money Assessment,” Canadian Centre for Policy Alternatives-BC Office, September 2006.
Shaffer, Marvin, “Review of Partnerships BC’s Methodology for Quantitative Procurement Options,” Discussion Draft, August 2009, prepared for the Canadian Union of Public Employees.
Steffenhagen, Janet, “Seeking Help with Auguston traditional school,” Vancouver Sun, 11 November 2008.
Whiteside, Heather, Purchase for Profit: Public-Private Partnerships and Canada’s Public Health care system, University of Toronto Press, 2015.
Whitfield, Dexter, Global Auction of Public Assets: Public sector alternatives to the infrastructure market & public private partnerships, Spokesman Books, 2010. Whitfield has also written many other important books and articles in this area, which can be found here: european-services-strategy.org.uk/publications/books-and-articles-by-dexter-whitfield

PUBLIC-PRIVATE PARTNERSHIPS IN BRITISH COLUMBIA UPDATE 201836
A P P E N D I X A
Undiscounted costs of public sector comparator and public-private partnership based on cash flows, comparison of government borrowing cost and Partnerships BC discount rate
Project
Undiscounted costsDiscount rate vs. government
borrowing costs
PSC total PPP totalDifference PSC – PPP
Saving of PSC
over PPPDiscount
rate
Gov’t borrowing
rate
Discount minus
borrowing
Abbotsford Hospital 1,181,485,000 1,696,139,000 514,654,000 30.3% 8.12% 5.42% 2.70%
BC Cancer Agency’s Centre for the North 130,239,000 217,203,000 86,964,000 40.0% 7.43% 4.75% 2.68%
BC Children’s and BC Women’s Project 1,025,182,000 1,133,529,000 108,347,000 9.6% 6.87% 3.88% 2.99%
Britannia Mine 71,446,000 61,987,000 -9,459,000 -15.3% 8.12% 5.42% 2.70%
Canada Line 4,143,300,000 5,231,600,000 1,088,300,000 20.8% 6.00% 5.42% 0.58%
Diamond Centre 89,903,000 203,446,162 113,543,162 55.8% 7.12% 5.98% 1.14%
Emily Carr 271,612,000 264,982,000 -6,630,000 -2.5% 4.80% 3.18% 1.62%
Fort St. John Hospital 608,656,000 748,455,000 139,799,000 18.7% 7.32% 4.31% 3.01%
Kelowna and Vernon Hospitals Project 1,004,067,000 1,154,534,000 150,467,000 13.0% 7.80% 4.75% 3.05%
Kicking Horse Canyon 155,565,000 253,332,000 97,767,000 38.6% 6.95% 4.68% 2.27%
North Island Hospitals 1,242,903,000 1,394,251,000 151,348,000 10.9% 6.24% 3.18% 3.06%
Okanagan Correctional Centre 393,300,000 466,113,000 72,813,000 15.6% 5.92% 3.18% 2.74%
Penticton Hospital 580,751,000 583,187,000 2,436,000 0.4% 4.98% 2.46% 2.52%
Royal Jubilee Hospital 589,461,000 855,978,000 266,517,000 31.1% 6.87% 4.75% 2.12%
Sea-to-Sky Highway 1,670,700,000 1,982,900,000 312,200,000 15.7% 7.50% 4.68% 2.82%
South Fraser Perimeter Road 989,759,000 1,386,286,000 396,527,000 28.6% 7.41% 4.17% 3.24%
Surrey Outpatient 449,134,000 640,860,000 191,726,000 29.9% 7.50% 4.31% 3.19%
Totals Average Average
14,597,463,000 18,274,782,162 3,677,319,162 20.1% 2.50%
Sources: Responses to Freedom of Information requests to Partnerships BC, the BC Ministry of Finance, the Greater Vancouver Transportation Authority, and the Vancouver Coastal Health Authority. Information on the Sea-to-Sky Highway was published in Partnerships BC’s 2005 value for money report. After 2005, this information was withheld as being a cabinet secret.

COLUMBIA INSTITUTE 37
Project
Discounted costs PBC discount rate reported in VFM reports
Net present cost PSC
Net present cost P3
NPC P3 advantage
% advantage
Abbotsford Hospital 463,000,000 424,000,000 39,000,000 8.42%
BC Cancer Agency’s Centre for the North 83,600,000 78,700,000 4,900,000 6.30%
BC Children’s and BC Women’s Project 525,800,000 471,500,000 54,300,000 10.30%
Britannia Mine 39,700,000 27,200,000 12,500,000 31.49%
Canada Line 1,750,000,000 1,658,000,000 92,000,000 5.26%
Diamond Centre 81,000,000 64,000,000 17,000,000 20.99%
Emily Carr 189,250,000 151,118,000 38,132,000 20.10%
Fort St. John Hospital 327,100,000 306,400,000 20,700,000 6.30%
Kelowna and Vernon Hospitals Project 468,100,000 442,700,000 25,400,000 5.70%
Kicking Horse Canyon 184,400,000 166,300,000 18,100,000 10.00%
North Island Hospitals 767,300,000 635,800,000 131,500,000 17.13%
Okanagan Correctional Centre 280,900,000 241,600,000 39,300,000 14.00%
Penticton Hospital 379,000,000 315,100,000 64,500,000 17.00%
Royal Jubilee Hospital 363,000,000 340,800,000 22,200,000 6.10%
Sea-to-Sky Highway 744,000,000 789,000,000 -45,000,000 -6.05%
South Fraser Perimeter Road 637,000,000 603,000,000 34,000,000 5.00%
Surrey Outpatient 256,700,000 234,200,000 22,500,000 8.80%
Totals Average
7,539,850,000 6,949,418,000 591,032,000 10.99%
Appendix A table continued

PUBLIC-PRIVATE PARTNERSHIPS IN BRITISH COLUMBIA UPDATE 201838
A P P E N D I X B
Risk adjustment calculated and added to the public sector comparator cost ($millions)
ProjectNet risk
adjustment
Discounted public sector comparator
cost
Discounted P3 project
cost
Claimed savings of P3
Risk adjustment
as % of savings
Risk adjustment
as % of PSC cost
Claimed savings of PPP
BC Cancer Agency Centre for the North 78.7 83.6 78.7 4.9 159.2% 9.3% 6.3%
BC Children’s and BC Women’s Project 47.9 525.8 471.5 54.3 88.2% 9.1% 10.3%
Canada Line (Net of increased ridership) 233 1750 1658 92 253.3% 13.3% 5.3%
Emily Carr University 18.44 189.25 151.118 38.132 48.4% 9.7% 20.1%
Fort St. John Hospital 30.2 327.1 306.4 20.7 145.9% 9.2% 6.3%
Golden Ears Bridge 170.6 1132.9 1126.6 6.3 2707.9% 15.1% 0.6%
Interior Heart and Surgical Centre 28.1 173 140 33 85.2% 16.2% 19.1%
Kelowna and Vernon Hospitals Project 32.3 468.1 442.7 25.4 127.2% 6.9% 5.7%
North Island Hospitals 95.2 767.3 635.8 131.5 72.4% 12.4% 17.1%
Okanagan Correctional 26.5 280.9 241.6 39.3 67.4% 9.4% 14.0%
Penticton Regional Hospital Tower 37.7 379.6 315.1 64.5 58.4% 9.9% 17.0%
Royal Jubilee Hospital 30 363 340.8 22.2 135.1% 8.3% 6.1%
Sea-to-Sky Highway (1) 4 744 789 -45 0.5%
South Fraser Perimeter Road 102 637 603 34 300.0% 16.0% 5.0%
Surrey Memorial Hospital 29 417 386 31 93.5% 7.0% 7.4%
Surrey Pretrial 19 148 133 15 126.7% 12.8% 15.0%
Average 126.7% 9.6% 8.9%
Sources: Net risk adjustment from value for money (VFM) reports; discounted public sector comparator and project costs from published VFM reports.

COLUMBIA INSTITUTE 39
A P P E N D I X C
Simple example comparison of undiscounted project with upfront public spending versus 8% discounted project
Twelve year projectDiscounted at 8 per cent annually
Year
Discounted 8 per cent annually
– value of payment
Public sector
comparator
Public-private
partnership
1 0.920 6,900,000 2,300,000
2 0.846 6,348,000 2,116,000
3 0.779 920,000 1,946,720
4 0.716 716,393 1,790,982
5 0.659 920,000 1,647,704
6 0.606 606,355 1,515,888
7 0.558 920,000 1,394,617
8 0.513 513,219 1,283,047
9 0.472 920,000 1,180,403
10 0.434 434,388 1,085,971
11 0.400 920,000 999,093
12 0.368 367,666 919,166
Total 20,486,022 18,179,591
Twelve year projectNo discounting of annual spending
YearPublic sector comparator
Public-private partnership
1 7,500,000 2,500,000
2 7,500,000 2,500,000
3 1,000,000 2,500,000
4 1,000,000 2,500,000
5 1,000,000 2,500,000
6 1,000,000 2,500,000
7 1,000,000 2,500,000
8 1,000,000 2,500,000
9 1,000,000 2,500,000
10 1,000,000 2,500,000
11 1,000,000 2,500,000
12 1,000,000 2,500,000
Total 25,000,000 30,000,000

PUBLIC-PRIVATE PARTNERSHIPS IN BRITISH COLUMBIA UPDATE 201840
A P P E N D I X D
Effect of discounting (government borrowing rate) and risk adjustment on public-private partnerships
Project
Discount
rate
Gov’t
borrowing rate
Discount
minus borrowing
Net present cost (FOI provided cash flows) using gov’t borrowing
rate as discount ($thousands) Risk
adjustment before
discounting
Discounted P3
advantage minus
original risk adjustment
Public sector
comparator
Public-private
partnership
Advantage to P3 after discounting
Abbotsford Hospital 8.12% 5.42% 2.70% 574,390 626,643 -52,253
BC Children’s and BC Women’s Project 6.87% 3.88% 2.99% 581,007 574,843 6,164 47,900 -41,736
Britannia Mine 8.12% 5.42% 2.70% 46,755 34,739 12,015
Canada Line 6.00% 5.42% 0.58% 2,445,595 2,509,020 -63,425 233,000 -296,425
Diamond Centre 7.12% 5.98% 1.14% 84,053 86,265 -2,212
Emily Carr 4.80% 3.18% 1.62% 200,563 165,792 34,772 18,440 16,332
Ft. St. John Hospital 7.32% 4.31% 3.01% 375,509 414,510 -39,000 30,200 -69,200
Kelowna and Vernon Hospitals Project 7.80% 4.75% 3.05% 583,951 598,831 -14,881 32,300 -47,181
Kicking Horse Canyon 6.95% 4.68% 2.27% 195,106 192,300 2,806 17,200 -14,394
North Island Hospitals 6.24% 3.18% 3.06% 887,470 850,660 36,810 95,200 -58,390
Okanagan Correctional Centre 5.92% 3.18% 2.74% 305,475 305,792 -318 26,500 -26,818
Penticton Regional Hospital 4.98% 2.46% 2.52% 441,646 403,610 38,036 37,700 336
Prince George Cancer 7.43% 4.75% 2.68% 84,293 99314 -15,021 7,800 -22,821
Royal Jubilee Hospital 6.87% 4.75% 2.12% 400,894 429,385 -28,491 30,000 -58,491
Sea-to-Sky Highway 7.50% 4.68% 2.82% 400,894 429,385 -28,491
South Fraser Perimeter Road 7.41% 4.17% 3.24% 804,390 860,700 -56,310 102,000 -158,310
Surrey Outpatient 7.50% 4.31% 3.19% 315,068 349,720 -34,653
Totals 8,727,059 8,931,511 -204,452 -777,098

COLUMBIA INSTITUTE 41
A P P E N D I X E
Effect of discounting (Partnerships BC discount rate) and risk adjustment on public-private partnerships
Project
Net present cost (FOI provided cash flows) using PBC rate as discount ($thousands)
Shift to advantage of P3 of using higher PBC
discount rate over
government borrowing
rate
Total risk adjustment including
discounting and
adjustment before
discounting
Risk % of PSC with
adjustment and PBC discount
Public sector comparator
Public-private partnership
Advantage to P3
Abbotsford Hospital 449,978 419,148 30,829 83,083
BC Children’s and BC Women’s Project 419,782 379,977 39,806 33,642 81,542 19.4%
Britannia Mine 39,860 27,177 12,683 668
Canada Line 2,348,780 2,366,921 -18,141 45,284 278,284 11.8%
Diamond Centre 83,460 65,932 17,528 19,740
Emily Carr 178,257 136,178 42,079 7,307 25,747 14.4%
Ft. St. John Hospital 316,389 298,860 17,529 56,529 86,729 27.4%
Kelowna and Vernon Hospitals Project 452,857 432,187 20,670 35,550 67,850 15.0%
Kicking Horse Canyon 184,491 168,237 16,254 13,448 30,648 16.6%
North Island Hospitals 703,675 588,024 115,651 78,840 174,040 24.7%
Okanagan Correctional Centre 260,942 221,507 39,435 39,752 66,252 25.4%
Penticton Regional Hospital 356,802 296,399 60,404 22,368 60,068 16.8%
Prince George Cancer 70,084 67,732 2,351 17,373 25,173 35.9%
Royal Jubilee Hospital 355,927 338,112 17,815 46,306 76,306 21.4%
Sea-to-Sky Highway 750,000 848,000 -98,000 -69,509
South Fraser Perimeter Road 716,900 636,170 80,730 -137,040 239,040 33.3%
Surrey Outpatient 268,561 249,855 18,706 53,358
Totals 7,956,744 7,540,415 416,329 346,701

PUBLIC-PRIVATE PARTNERSHIPS IN BRITISH COLUMBIA UPDATE 201842
A P P E N D I X F
History of public-private partnerships in British Columbia
While many other countries have used public-private partnerships, British Columbia’s model for the
use of P3s was largely borrowed from the United Kingdom. In one of the earliest P3 value for money
reports for the Abbotsford Hospital, Partnerships BC acknowledged, “The U.K. model for partnership
delivery was adopted as a general baseline with adaptations for B.C. and Canadian circumstances.”62 In
early Partnerships BC annual reports, PBC also spoke of its “strategic links” to Partnerships UK and the
fact that staff had been recruited from the United Kingdom.63
The UK had a significant lead on BC and Canada when it came to P3s. The UK’s public-private
partnership initiative, called Private Finance Initiative (PFI), was announced in 1992 under the
Conservative government; however, it was enthusiastically taken up by the Labour government when
they came to power in 1997.64
For both political parties in the UK, one of the big advantages for P3s or PFI was that expenditures
on public-private partnership assets did not show up on the books as debt. For political parties under
pressure because of growing public debt, this was attractive. Even today, as the UK’s National Audit
Office said in a January 18, 2018 report, “most private finance debt is offbalance sheet for National
Accounts purposes. This results in short-term incentives for the government and public bodies to use
private finance procurement.”65
Like most provinces, British Columbia perceived the province as having debt issues and, in the late
1990s, it began to look seriously at public-private partnerships.
In 1997, Employment and Investment Minister Dan Miller announced the release of a task force
report examining the potential of P3s. Miller, the then newly appointed minister for P3s, said he would
implement many of the task force recommendations, including the government move to implement
P3s. Early targets were to include a school in Burnaby, the Vancouver Trade and Convention Centre,
and improvements to Lions Gate Bridge.66 None of these came to fruition.
One of the first targets for a P3 announced in 1999 was Auguston Public School in Abbotsford;
however, the government found the lease cost too expensive and paid to buy it back.67
The province’s rush to public-private partnerships did not begin until after the provincial election
in 2001. In May 2002, the government announced the creation of Partnerships BC, “a publicly owned
company that will bring together ministries, agencies and the private sector to do P3 projects.”68 P3
62 Partnerships British Columbia, “Project report: Achieving value for money- Abbotsford Regional Hospital and Cancer Centre Project,” February 2005, 19.
63 Partnerships BC, Annual reports, 2002/2003 and 2003/2004.64 Richard Seymour, “A short history of privatization in the UK: 1979-2012,” The Guardian, 29 March 2012, https://www.
theguardian.com/commentisfree/2012/mar/29/short-history-of-privatisation.65 Report by the Comptroller and Auditor General of the United Kingdom, PFI and PFI2, 18 January 2018, 11, https://www.
nao.org.uk/wp-content/uploads/2018/01/PFI-and-PF2.pdf (accessed 29 January 2018).66 Government of British Columbia, “Miller releases task force report on public -private partnerships,”31 January 1997,
https://archive.news.gov.bc.ca/releases/archive/pre2001/1997/nrs97/00897nr.asp. 67 Janet Steffenhagen, “Seeking help with Auguston traditional school,” Vancouver Sun, 11 November 2008, http://
vancouversun.com/news/staff-blogs/seeking-help-with-auguston-traditional-school 68 Government of British Columbia, “New framework, agency to provide public building,” 30 May 2002, https://archive.
news.gov.bc.ca/releases/archive/2001-2005/2002FIN0001-000023.htm.

COLUMBIA INSTITUTE 43
plans took an early hit in 2003 when plans for a 55-year partnership to run the Coquihalla Highway
were abandoned.69 Still, plans were quickly in place for projects such as the Abbotsford Hospital and
Britannia Mine Water Treatment Plant.
Public statements and reports also made it clear that the government hoped that borrowing for P3
projects could be kept “off book” as it was in the UK.
In his 2003 budget speech, finance minister Gary Collins told the legislature that his government
would invest $650 million in transportation projects and that, “we will make these investments
without increasing the overall public debt.”70
The 2004 budget and fiscal plan which accompanied that year’s budget pointed to P3s as a reason
taxpayer supported capital spending was declining, noting, “Although total expenditures will be
relatively unchanged, taxpayer-supported capital spending will decline from $1.9 billion in 2004/05
to $1.6 billion in 2006/07. The decrease reflects completed projects and the impact of P3s on capital
spending costs.”71
In a 2004 value for money report on the Sierra Yoyo Desan Resource Road Upgrade Project,
Partnerships BC expressed its hope that, “the property and improvements will be recorded as assets
on Ledcor’s financial statements and will not appear on the financial statements of the Province or
any of the road users,” despite the fact the road was owned by the government. 72
By 2005, however, it was becoming clear the government would not be able to use P3s to hide
provincial debt. Speaking in the legislature, transportation minister Kevin Falcon said:
how the accounting profession looks at P3s and how debt is treated has actually been evolving since 2003 when there was generally a widespread assumption that the debt would be treated off-book. Given the accounting rules at the time, that was very much the assumption that would have been in play within the industry. What we are seeing on the projects that we’ve done to date is that the capital costs of our P3 projects will be treated as assets and liabilities on the [government’s] books. But the issue to me as the Minister of Transportation and the issue to us as government is that P3s have never been about how debt is treated. P3s have been all about two other issues that are really critical: one is risk transfer, and the other is value for money.73
While the BC government relied increasingly on Partnerships BC and P3s, it also began to push
local governments and agencies to use public-private partnerships. According to one study, the
government was forced to order the board of the Fraser Health Authority to accept the use of a P3
for the Abbotsford Hospital or face removal.74
In 2002, BC’s deputy minister of transportation wrote to Metro Vancouver’s transportation agency
(Translink) saying the province would not contribute its promised $550 million for the Canada Line
69 John Greenwood, “B.C. stops highway’s private lease: other projects in doubt,” National Post, 24 July 2003, FP1. 70 Gary Collins, BC Minister of Finance, Budget Speech, 18 February 2003, bcbudget.gov.bc.ca/2003/speech/default.htm
(accessed 29 January 2018).71 BC Ministry of Finance, Budget and Fiscal Plan, 17 February 2004, 39.72 Partnerships BC, Project Report: Achieving Value for Money for the Sierra Yoyo Desan Resource Road Upgrade Project,
November 2004, 14.73 Legislative Assembly of British Columbia. Official Report of Debates of the Legislative Assembly (Hansard). 3 (5), 1169,
25 October 2005.74 Daniel Cohn, “British Columbia’s Capital Asset Management Framework: Moving from transactional to transformative
leadership on public-private partnerships, or a ‘‘railroad job’’?,” Canadian Public Administration, 51 (1), March 2008, 71–97.

PUBLIC-PRIVATE PARTNERSHIPS IN BRITISH COLUMBIA UPDATE 201844
unless the project was built as a P3.75 While there was initial resistance from the Translink board, faced
with the loss of provincial funding they eventually capitulated.
Four years later, in a speech to the Union of BC Municipalities, Premier Gordon Campbell told local
governments that any provincially funded projects with a value of over $20 million were required
“to be considered first by Partnerships BC to be built as public-private partnerships unless there is a
compelling reason to do otherwise.”76 These rules applied to local government projects with provincial
funding. In the same speech, he said the province’s one third funding for sewage treatment in Victoria
would also be subject to oversight by Partnerships BC.
In two years, however, BC’s public-private partnership program found itself facing the economic
headwinds of the 2008 global financial crisis. On 7 November that year, the government issued a
statement saying the threshold for provincial P3s was being raised from $20 million to $50 million. The
reason given was to accelerate capital infrastructure projects.77
The largest program in the pipeline was the Port Mann Bridge/Highway 1 Improvement Project that
had seen a request for qualifications issued in 2007. By February 2009, negotiations with a potential
builder had fallen apart with the government saying in its value for money report, “The inability of the
parties to reach an agreement reflected the challenging and unprecedented economic and financial
market environment at the time. Despite the significant commitments of debt and equity capital to the
Project, and the strength of the consortium partners, Partnerships BC ultimately recommended that the
Province not proceed.”78 The project proceeded with a short-term design/build model instead.
Despite the failure of the flagship Port Mann P3 project, the government was still determined to
proceed with the partnerships. Faced with the problem that economic conditions meant that the
government’s P3 model no longer made economic sense, the government changed the model. Using
a new “wide equity” model, the government proceeded with hospital P3s in northern and central BC.
The issues with this wide equity model are addressed in a separate note on the Fort St. John Hospital
project.
P3s in British Columbia were also beginning to draw criticism. While unions, academics and think
tanks were among the first to criticize the projects they also began to draw critical remarks from
business groups. In 2008, Phil Hochstein of BC’s Independent Contractors and Business Association
(ICBA) complained to a business group that P3s were so large that smaller companies were being cut
out of the process.79
Four years later, in 2012, Hochstein and the ICBA were still raising issues about Partnerships BC’s
objectivity and possible conflict of interest when it came to decide how projects would be built. He
accused PBC of “mandate creep” for taking on project management of design-build projects. Hochstein
75 Dan Doyle, BC Deputy Minister of Transportation, Letter to Pat Jacobsen, President and CEO of Translink, 19 June 2002.76 Government of British Columbia, “Highlights of Premier Gordon Campbell speech to the UBCM: Backgrounder,” 27
October 2006, https://archive.news.gov.bc.ca/releases/news_releases_2005-2009/2006otp0152-001301-attachment1.htm (accessed 31 January 2018).
77 Government of British Columbia, “Province raises capital standard threshold for PPPs,” 7 November 2008, https://archive.news.gov.bc.ca/releases/news_releases_2005-2009/2008FIN0019-001677.htm.
78 Partnerships BC, Project Report: Achieving Value for Money, Port Mann Bridge/Highway 1 Improvement Project, March 2011, 12.
79 “P3 projects draw concern from small contractors,” Business Edge News Magazine, 21 March 2008, businessedge.ca/archives/article.cfm/p3-projects-draw-concern-from-small-contractors-17460 (accessed 31 January 2018).

COLUMBIA INSTITUTE 45
said PBC’s practice of “bundling” smaller projects so they would be large enough to support a P3
was hurting both taxpayers and small builders.80
In 2012, the BC Construction Association also raised concerns about “a Partnerships BC bias
to P3 and design-bid procurement due to their reliance on P3 fees, and because government
agencies provide services in competition with the private sector.”81
By 2013, the BC government was listening. In January, the government announced the
creation of an infrastructure forum to “consult, discuss and share information and ideas related to
improving government’s infrastructure procurement practices and use of construction-industry
resources.”82 Both the ICBA and the Construction Association, along with Partnerships BC, were
represented at the forum.
The BC Ministry of Finance established a review of Partnerships BC and the Construction
Association and ICBA were represented on the review body.83 In June 2014, the report expressed
concern that PBC was potentially biased “towards certain procurement methodologies.” The
committee recommended removing some of PBC’s decision making powers. It called for an
increase in the P3 threshold to $100 million and for a reduction in the use of “bundling.”84 Virtually
all the construction industry’s concerns were addressed and, to a degree, Partnerships BC’s wings
were clipped. On December 16, the government issued a release saying it would carry out the
recommendations of the review committee.85
PUBLIC-PRIVATE PARTNERSHIPS were originally seen in BC as a mechanism to use private funding
for public projects in a way that would hide government debt. Unlike the situation in the United
Kingdom, however, Canada’s auditors insisted that money borrowed to pay for public projects,
whether or not it was done through private operators, was public debt. Despite this change in
accounting, BC continued to promote P3s with increasing pressure. The use of P3s was somewhat
interrupted by the global financial crisis of 2008 and by increasing opposition from the BC
construction industry.
Despite these setbacks, Partnerships BC has continued to promote the use of P3s, particularly
for larger projects. Pressure from the federal government to use public-private partnerships
through the Canada Infrastructure Bank may also play a role in the future.
It remains to be seen how a new government in British Columbia will proceed with the
management of its infrastructure.
80 Peter Caulfield, “Industry leaders looking for changes in government procurement,” Journal of Commerce, 17 September 2012, https://canada.constructconnect.com/joc/news/government/2012/09/industry-leaders-looking-for-changes-in-government-procurement-joc051852w.
81 BC Construction Association, “Fair and transparent: implementing the CAMF for construction procurement: A partnership approach to public sector procurement policy in British Columbia,” 30 November 2012, bccassn.com/media/bcca-report-fair-transparent-camf-public-sector-procurement-2012.pdf (accessed 31 January 2012).
82 Government of British Columbia, “Working together: BC & BCCA launch infrastructure forum,” 25 January 2013, https://news.gov.bc.ca/stories/working-together-bc-bcca-launch-infrastructure-forum (accessed 31 January 2018).
83 Government of British Columbia, Freedom of Information Request on the composition of stakeholders chosen for the review of Partnerships BC, http://docs.openinfo.gov.bc.ca/d7637215a_response_package_fin-2014-00310.pdf (accessed 31 January 2018).
84 BC Government, “Review of Partnerships BC, Ministry of Finance,” July 2014, https://www2.gov.bc.ca/assets/gov/british-columbians-our-governments/services-policies-for-government/internal-corporate-services/internal-audits/partnerships-bc-review.pdf (accessed 31 July 2018).
85 Government of British Columbia, “Crown review finds Partnerships BC fulfilling its mandate,” 16 December 2014, https://archive.news.gov.bc.ca/releases/news_releases_2013-2017/2014FIN0060-001901.htm.

Suite 510 – 1155 Robson Street, Vancouver, BC V6E 1B5
t: 604.408.2500 / e: [email protected]
columbiainstitute.ca
KICKING HORSE CANYON PROJECT, PHOTO PARTNERSHIPS BC


