Embed Size (px)
Citation preview

Public Perceptions of
Environmental Management
Results of a Wide-Ranging Public Questionnaire Series
Conducted by the Students of Environmental Management,
Murdoch University
Dr F. Murray, Dr C. D. Walker, and Mr P. Dingle
Environmental Science, Murdoch University Murdoch 6150
Environmental Science Report, No. 93/1 February 1993
u u B

Preface
Participating Students
Summary
1. Introduction
2. Methodology 2.1 Designing theQuestionnaires 2.2 Data Collection
3. Summary of Results - Main Sectiort 3.1 In order of priority, what are the three biggest issues facing Australia today? 3.2 In order of priority, what will be the three biggest issues facing Australia ten years from now ?
3.3 How does the present environment compare to the environment ten years ago? 3.4 What are the three most important environment issues facing Australia today? 3.5 In order from one to five, who do you think should be most responsible for management of the
environment in Australia? 3.6 Each of the following is a major environmental problem (agree/disagree)?
(Ten specific areas of concern- see 5.1-5.10 below)
4. Major Issues 4.1 Discussion of the Core Responses 4.2 The Service Gap
5. Specific Areas of Concern 5.1 Energy Issues 5.2 Water Resources 5.3 Urban Wastes & Recycling 5.4 Land Degradation 5.5 Air Pollution 5.6 Toxic Substances 5.7 Transport 5.8 Natural Resources 5.9 Urban Expansion 5.10 Economic Incentives
6. References
2
3
4
5
6
7
8
10
13
35

r
Participating Students
CARNOLD N J ARROWSMITH AM BLAGG B J BUNNY RP CLAUDIUS MCOOTE N A DARLINGTON S W DEARLE CDRAKE A R DUCKWORTH T EDWARDS LE BOVELL KMFOWLER SJGEORGE SJHACK S HARLEY B J HARTY L M KISSANE MA LAING PDMANTON
P A MAZZUCATO KMCDERMOTT S M MC LAUGHLIN JGMILNER APMURPHY N A MUSTAFA B DO' GRADY PC OLDEN CNPALEY PJPAPAS K SPARKER P M PARTINGTON D JPIANTHAM TJPILBEAM F R PONTIN T POYNTON EPRASODJO S J PURNELL E ROSENBERG MCROWE
4
CGRYAN R D SEGAL P SHELBOURNE S J SIMMONDS R A SMITH M P TAYLFORTH JKTHOMAS HSTHOMPSON AGTHOMSON N C THORNING HEUPSTON H F VON ALTENSTADT C J WALKER M B WESTERA J C WHITE JDWOODS S N YAPRIHA T A YOUNG IJYULL

r
Preface
One of the great issues of our time is how we protect our environment. One of the great challenges is to ensure a satisfactory level of public consultation in our actions to protect the environment. Many technically adequate environmental protection projects have been de-railed due to an inadequate consideration of the wishes of the community. In the area of environmental protection, relatively little has been done to pro-actively determine the wishes of the community Almost all community consultation on environmental subjects has been in response to specific projects or plans. Perhaps if more was known about what the public wants, a better level of environmental performance could be provided. Perhaps some of the expensive and time-wasting confrontation and frustration which develops when unpopular plans and projects are rejected by the public could have been avoided if there was an improved knowledge of public opinion. What are the priorities for environmental management of the public ?
To provide some preliminary information on this topic, and to provide a learning experience for students in a course I coordinate, Environmental Management students from Environmental Science at Murdoch University conducted a study of community attitudes of environmental management. The survey was conducted from September 28 to October 2, 1992 by 55 students working in ten groups, supervised by Colin Walker, Peter Dingle, Jon Rowdon and me. Each group wrote a report, and these reports were summarised by a small team of enthusiastic and talented students, Lillias Bovell, Kirsty McDermott, Anthony Murphy, Michael Rowe, Andrew Thomson and Justin Woods. The report was edited by Colin Walker who was also responsible for many of the statistical analyses.
The students interviewed and discussed the results of this survey with individuals from a wide range of government and non government organisations, who provided considerable assistance for which we are very grateful. We also wish to thank the more than 1300 members of the public who gave their time to answer questions and provide thoughtful responses.
Frank Murray Senior Lecturer Murdoch University
3
January 1993

Summary
A study attempted to gain insight into the attitudes, perceptions and values of Perth inhabitants directed toward the environment. This document attempts to summarise the major findings drawn out in a series of more detailed reports generated at the conclusion of an initial study. Over 1300 responses were obtained to core questions investigating the significance of environmental management to these Western Australians. Ten specific areas received the attention of a proportionately smaller number of the public, and the literature, activities and policies of the relevant authorities were critically reviewed. These areas were the natural environment, air pollution, land degradation, toxic waste, water, urban waste, transport, energy, urban expansion, and economic incentives for guiding industry.
The environment was perceived to be worsening in Perth, in Australia, and world-wide, and to exceed unemployment and economic issues as a problem in the near future. Land degradation is considered the most important environmental issue by Western Australians, although closely followed by pollution in an unspecified form while the more specific terms, air pollution and water pollution, are also considered important. Other environmental issues include our forests, ozone, urban waste, and the natural environment.
A service gap model is advanced as an appropriate conceptual structure to examine the stewardship role that the government and its authorities have with respect to various areas of the environment. Education and information issues appear to be the major limitations in closing the service gap. One clear exception to this is the political motivation of the proposed coal-fired base load power station where the public sentiment away from the coal option is well founded in public understanding of the issue and well known to the government. This study confirmed this sentiment.
The community acceptance of and involvement in major government programs associated with the issue of land degradation appears to be a case of effective focussing of community attention, with closure of a service gap. Although there is no clear understanding of more technical or 'invisible' concepts such as groundwater, there appears to be a strong intuitive feel for returning land to a forested state as a repairing process.
The community often has only limited understanding of environmental issues. As a result, close but distinct issues, for example air pollution and toxic waste, can map together in respondents perceptions. In this situation, the individual tends to respond with a common level of concern be it high or low on both.
5

1. Introduction Environmental management is defined by Conacher (1978) as those activities
which seek to attain desirable environmental system states in response to community perceptions and desires under prevailing socio-economic and technical conditions. According to Murray (1992), environmental management consists of managing human affairs so as to achieve an acceptable balance between the quality of the human environment and the quality of the natural environment. Both of these descriptions emphasise the importance of social factors in environmental management.
Sustainable environmental management is concerned with the management for the physical, chemical, and biological resources of the environment; in timeframes beyond those involved in politically- and economically-motivated plans. However, environmental management is inherently political, and entrusted to the public authorities regulated by the government for the large part. Therefore,the public debate of environmental issues is a key regulatory component qf environmental management. Figure 1 summarises the range of factors impacting on the management of the environment.
Fig. 1. Factors affecting the value attached to the environment and its management.
The management of the environment by public authorities is a service enterprise. The government and its authorities must, as with any other service, identify the needs of the public, and consider these in determining the nature and level of service. It is not always easy or possible to coordinate the provided service with the community needs or wants. In some cases, the greater good of the community or the environment may outweigh the desires of one particular community sector. It is then the role of government to consider factors and make trade-offs where necessary. However, this does not absolve government of the responsibility of ensuring consultation with the community and considering their views as a legitimate input into environmental management.
A recent study conducted in Western Australia found that the environment was what people liked most about their community- they cited reasons such as clear blue skies, fresh air, clean beaches and waterways, wide open spaces, and the
6

abundance of flora and fauna (Reid Commission, 1992). However, the perception that this environment was changing, together with the possibility of severe environmental damage, was of paramount concern to the respondents. People felt that specific areas such as recycling, water management, land care, and air pollution were presenting a real threat to their lifestyle, and to the quality of the lives of their families and community in general. These concerns were confirmed by the recent DASET (1992) survey, a nationwide community opinion poll, in which 49% of the 2700 respondents stated that the environment would be the most important issue facing Australia in ten years time.
This study attempts to gain insight into the Perth inhabitants' attitudes, perceptions and values directed toward the environment. The effectiveness of government policies and plans can be directly related to their relevance to the people involved, and the willingness of these people to accept them. By questioning the public on a general core set of issues, we can gain an overall picture -of how the public feels on the broad topic of the environment among other current affairs. Subsequently, more indepth questions on specific areas (the natural environment, air pollution, land degradation, toxic waste, water, urban waste, transport, energy, urban expansion, and economic incentives for guiding industry) show a more insightful look at the public's perceptions.
2. Methodology
2.1 Designing the Questionnaires The questionnaires were designed with two sections, the first dealing more
generally with issues in Australia and the second examining issues in a specific area of the environment. The first section of the questionnaires was developed from a survey recently published by A.N.O.P. Research Services Pty Ltd for the Department of Arts, Sport, the Environment and Territories (DASET, 1992). This section collected demographic information and ascertained people's attitudes towards issues affecting Australia generally and in relation to the environment. People's opinions of who should take responsibility for management were also obtained.
The second sections of the questionnaires was developed by groups of six environmental science students, and related specifically to environmental issues in the Perth community. The questions were written after determining the aims to be addressed in each survey area.
2.2 Data Collection The questionnaires were presented to people randomly selected in a number
of locations in the Perth metropolitan region, over the days of September 28 to October 2, 1992. The locations were chosen to adequately represent a wide crosssection of the community. Careful survey techniques were used to make the results consistent. These included not prompting answers, not reacting to responses and approaching people in such a way as to obtain honest and thoughtful answers.
7

3. Summary of Results - Main Section
The results of the first section, or core questions, are presented below in percentage from for the general population. The opinions of all 1321 respondents have been summarised in these tables, not recording low levels (up to 1%) of no response. A more detailed breakdown of these responses on demographic bases of age, gender, and socio-economic status has also been undertaken and summarised in the text. Note that issues scoring less than 5% have been omitted for brevity.
Table 3.1 (Qn. 2): In order of priority, what are the three biggest issues facing Australia today?
FIRST (%) SECOND (%) THIRD (%) Unemployment 44.4 Environment 25.6 Environment 22.3 :Economy 22.2 F.conom_y_ 24.0 Social Issues 15.8 Environment 17.0 Unemployment 15.3 F.conom_y_ 13.3 Politics 5.4 Social Issues 10.7 Politics 10.5 Social Issues 5.1 Politics 8.9 Unemployment 9.4
---
Over all three of these responses, both males and females felt unemployment was one of the biggest issues (40.0% & 42.0% respectively), followed by the environment (32.8 % & 36.7% ).
A high percentage of males gave the environment as the third most important (32.7%). Females responded with several issues as the third most important including politics, the economy;. and law and order.
By age-group, those from 11-50 years old felt unemployment was the biggest issue, whilst the 51-65 age group felt the economy was. The same two age groups considered the environment and the economy I social issues as the second most important respectively.
Table 3.2 (Qn. 3): In order of priority, what will be the three biggest issues facing Australia ten years
FIRST (%) SECOND (%) THIRD (%) Environment 33.9 Environment 27.1 Environment 20.4 Unemployment 23.5 :Economy 18.9 Economy 17.1 :Economy 15.4 Unemployment 13.9 Social Issues 14.8 Social Issues 7.4 Social Issues 12.0 Unemployment 12.9 Others <5 Law and Order 5.6 Politics 8.8
Assessing responses overall, both males and females listed the environment as most important, followed by the economy. Those from 11-50 years old ranked the environment first. Those from 51-65 year old ranked the environment and economy roughly equal first, and the over 65 year old respondents merely ranked the economy first. The same three groups ranked unemployment, law and order, and the environment as the next biggest issues respectively.
Table 3.3 (Qn. 4): How does the present environment compare to the environment ten years ago ? -
WORLDWIDE AUSTRALIA PERTH BETTER(%) 18.8 19.4 19.7 SAME(%) 9.7 16.8 21.2 WORSE(%) 71.3 63.6 58.9
--- ----------
Both males and females felt that the environment has become worse worldwide, Australia-wide, and in Perth, when compared to 1982. Respondents perceived
8

_....
that the Perth environment had fa1red a little better than elsewhere. All age groups felt the state of the envirorunent World- and Australia-wide had worsened, and the over 65 age group felt Perth's environment had improved whilst everyone else perceived it had also worsened.
Table 3.4 (Qn. 5): What are the three most important environment issues facing Australia today?
ISSUE 1 (%) ISSUE 2 (%) ISSUE 3 (%) Land Degradation 13.5 Land Degradation 12.1 Pollution 10.6 Pollution 13.5 Forests 11.8 Water Pollution 10.5 Forests 13.4 Water Pollution 9.8 Land Degradation 9.8 Ozone 12.0 Pollution 9.8 Natural Environment 9.3 Air Pollution 8.8 Air Pollution 8.7 Air Pollution 8.8 Urban Waste 5.6 Urban Waste 7.6 Urban Waste 8.2 Natural Environment 5.4 Greenhouse 6.8 Forests 8.0 Water Pollution 5.2 Natural Environment 6.1 Ozone 5.5
Males felt land degradation was the biggest issue (22.8%) whilst females felt that ozone was (24.2% ). Males also ranked air pollution as one of the biggest issues but a considerably smaller percentage of females did (17.5% of males to 4.6% females).
Table 3.5 (Qn. 6): In order from one to five, who do you think should be most responsible for management of the environment in Australia ?
Federal I State Government Government
!Mean Ranking* I 2.66 I 2.80 *Lower ranking= Higher responsibility.
Local Government
3.25
Industry & Commerce
3.07
Individuals
2.99
Overall, the Federal government was deemed the best agent in the community to be responsible for the environment, returning a mean rank of 2.66, followed by the state government and the individual. Both males and females considered the federal government should be most responsible for the environment in Australia.
Table 3.6 (Qn. 7): Each of the following is a major environmental problem (agree/disagree)? Average ranking*
Air Pollution I 4.4 Toxic Waste 4.4 Water 4.3 Land Degradation 4.3 Natural Environment 4.3 Extinction 4.3 Urban Waste 4.2 Transport I 4.1 Energy I 4.0 Urban Expansion I 3.8 * Higher ranking = More serious environmental problem, where strongly agree=5 and agree=4.
There was general agreement between males and females that every issue was a problem to some extent. This was also true among age groups, although 11-20 year olds and over 65 were mostly neutral concerning urban expansion. The over 65 were also neutral about urban waste and energy.
9

4. Major Issues
4.1 Discussion of the Core Responses
Australia is currently facing an economic slump and unemployment levels are high. Thus, the unemployment issue currently preoccupy the Perth community's concerns and overshadows the environmental issues, while the economy is also high (Table 3.1). Nevertheless, the environment emerges as the number one issue of the future (Table 3.2). Considering all three responses, about 80% of respondents perceive the environment as an important issue. Unemployment and economic issues remain as other important issues (Table 3.2). In addition, social issues takes a place of importance on the community's agenda, both currently and in the future.
When the respondents' overall outlook is compared between now and in 10 -years' time, a mild optimism of Perth people associated with unemployment and economy is confirmed. On the other hand, people are less optimistic about the environment, worldwide, in Australia, or in Perth (Table 3.3). The deterioration of the worldwide environment is perceived to be greater than that of the Australian and Perth environments.
When people were asked to nominate the three most important environmental issues facing Australia today, land degradation, pollution issues and forests were perceived as major national environmental problems by 13%, 12% and 12% of respondents respectively, followed by ozone layer depletion, air pollution and water pollution (Table 3.4). The community appeared less concerned with issues such as urban waste, natural environment and toxic waste.
People interviewed were asked to rank from 1 to 5 whom they thought should be most responsible for the management of the environment in Australia. The results, in terms of the mean value, illustrate that the federal government followed by state government were seen as the most effective bodies to take responsibility for environmental management in Australia. The responsibilities of individuals and industry & commerce were rated next, while local government was given relatively low importance in such a role (Table 3.5).
To ascertain what the community perceived to be the most important environmental problems, ten environmental issues were listed and ranked from strongly agree to strongly disagree. Surprisingly, air pollution (92.5%), toxic waste (88.5%) and land degradation (87.6%) were agreed upon as major environmental problems (based on the combined percentages of "strongly agree" anei "agree"), despite the result that air pollution and toxic waste scored relatively low in Qn. 5 (see Tables 3.4 and 3.6). This may reflect the entry of the less specific term "pollution" in the open-ended format of Qn. 5. Water pollution, natural environment and extinction were considered the next highest priority, while urban waste, urban expansion, transport and energy were of least concern (Table 3.6).
Further analysis gives evidence that in responses to Qn. 7 respondents tend to link their concern with one area with concern in similar areas. Thus concern about air pollution correlates with concern about toxic waste. Concerns about energy, water, and transport issues are also associated in respondents minds and tend to be reported in association. The full perceptual alliances of the ten segments of the environment examined in this question is presented in Fig. 2. The headings provide an attempt to characterise the bases of the concerns.
10

i "-------
Domestic Services
Energy Water Transport
~
~
The Natural World
Extinction
Growth of the Suburbs
Urban Expansion (Urban Waste)
Jl
The Environment
11.
Industrial Waste
Air Pollution Toxic Waste (Urban Waste)
,. Agriculture
Land Degradation
Natural Resources
Fig. 2. The perceptual organisation of environmental issues by questionnaire respondents. Many respondents appear to link concerns between particular areas through their overall concern for the economics of the household (Domestic Services), the quality of the city and neighbourhood (Growth of Suburbs), the impact of man's industries (Industrial Waste), the struggle to farm (Agriculture), and the decline of wild regions (The Natural World).
While allied concerns between the ten base areas result in their many associations, there appears to be relatively little association between the concerns of the five overall areas shown in Fig. 2. The only exception occurs in the distribution of Urban Waste between two areas, the 'Growth of the Suburbs' and the 'Refuse of Industry'. This may simply be a matter of nomenclature in the repeated occurrences of the words 'urban' and 'waste' in associated areas, however it may alternatively reflect a perceived distinction between household and industrial wastes.
It is interesting to note that Land Degradation is a distinct issue to the mind of the respondent. This appears to reflect public awareness and acceptance of government activity in land renovating programs and education programs orientating the community to issues of salinity and land management generally. Naturally enough, some uncertainty about land degradation remains within this group from an urban population. There may be many other issues that have not been sampled in this study lying within the agriculture-environment area, and which also would be linked with land degradation. These could include the issues of sustainable agricultural systems, the agricultural economy, and saline groundwater, among others. In most viewpoints, a semantic argument can
11

L
eventually develop at some level of resolution. What is interesting is the question of how to effectively present such topics to the public in a way that the public can understand, and make effective judgements on. It should be noted that this is an ideal level to which to raise public awareness of the area. A discrete perceptual identity allows a more readily accepted public program and better targeting of messages to the community, as awareness of an issue has risen to the level where many background details may be left out or are intuitively obvious to the receiver.
4.2 The Service Gap
To service the needs of customers is a corporate objective of most business and government organisations, and yet this is difficult to do. Business organisations including Government Trading Enterprises (GTEs) often use significant amount of their resources to:
• identify a customer's needs, and • design a product to match those needs.
Quality Management Systems are developed and generally incorporate a number of Standard Operating Procedures for various processes used by the organisation. Some of these processes address issues such as marketing of the product, public relations, quality assurance of the product, and customer satisfaction surveys. All of these are developed with the view of i~proving the quality of the product and the service to the customer.
The overall principle is one of minimising that gap or discrepancy between the customer needs and provided service. For GTEs, it might be regarded as an extension of the democratically-provided mandate given by the community to the government itself, based on past performance and demarcation of policy. Where management perceptions are that the community demand is for risky, irresponsible or unnecessary service activities, the most appropriate response is one of initiating public education and debate.
The discussion following will describe gaps in the delivery of services by GTEs operating in various areas of the environment. These gaps have been identified through specific questioning of respondents on the issues associated with the particular area. Commonly used principles are to obtain the respondent's assessment of how much should be paid to fix a problem, who is most responsible for the problem, and which options they would prefer in arriving at a solution for long-term problems. A secondary aim is to ascertain how well the respondents understand an issue, as an educated decision must, by definition, be made from an educated position, after all.
12
"----
5. Specific Areas of Concern- Topic Section
5.1 Energy Issues
The Questionnaire Although the sample size was not large (96 respondents), the results showed
a clear indication that the community has a strong preference for renewable energy sources.
Just under half (46%) agreed with the statement that "A new power station needs to be built", while 21% disagreed. The subsequent question asked "If WA builds another power station, what kind of energy should be used?", and
the following distribution of responses was obtained: Coal 7% Gas 31% Renewable Sources 58% Nuclear 4% Other 0%
Further questions showed that 85% of West Australians believed that they would take advantage of incentive schemes should SECW A offer to assist in the purchase of energy conserving devices such as solar hot water systems. The majority of respondents said that they undertake energy conservation measures in their homes and gave strong support for epergy efficiency, reducing air pollution from the production of energy, and for the continued spending on research into alternative energy sources. Respondents also indicated that 84% would be prepared to pay some money to reduce air pollution, with 62% being prepared to pay $2 or more per week.
Management Objectives A review of the questionnaire results, of opinions arising out of discussions
with energy industry contacts, of industry literature, and debate among project members led to the following set of management objectives which fairly represent the needs and attitudes of the community:
• To supply energy to the community safely and at an affordable and equitable cost,
• To minimise or reduce the impact of energy generation on the environment, and,
• To reduce energy consumption through energy efficiency.
The following strategies should be adopted by energy-supplying or regulating authorities:
• To establish and facilitate public participation in decision-making on energy policy, planning, and provision of services.
• To examine current levels of funding for renewable energy research and development, and increase this if necessary.
• To introduce schemes to encourage and publicise energy efficient practises. • To assess the role of energy efficient practises in deferring the need for another
power station. • If and when necessary, establish further generating capacity using fuel sources
which minimise environmental impacts and costs.
13

'----
This will ensure that the community has a role in determining, where necessary, the trade-offs between energy conserving measures, cost minimising measures, and impacts on the environment.
Global Issues Fossil fuels provide 75% of the world's energy supply. The use of fossil fuels
for energy production has led to pollution and health problems in both developed and developing countries. Flavin and Lenssen (1991) state "The capacity of the global biosphere to absorb the emissions of a fossil-fuel-based energy system may in the end prove even more constraining than the limits posed by oil."
West Australian Issues Renewable energy has been proven as a reliable and economic source in
remote communities (Harman et al., 1991), and yet SECWA has not exploited opportunities in this area to any significant extent. A higher level of funding for research and technology development would significantly enhance the potential for renewable resources to be used for larger scale generation capacity, feeding into major grids in the South West of the State. The community appears willing to finance this research on and the establishment of renewable supplies through a small levy on energy accounts (this survey).
The community is willing to pursue energy efficient practises and ~would embrace innovative ideas to assist them in financing energy efficient appliances such as hot water systems. While SECW A produces excellent energy conservation information, it is not widely promoted or distributed. Consumers must be aware of and request this information.
There is a service gap in that there is no indication that government has consulted and responded to the community in any meaningful way in the development of its energy policies, although some public discussion documents have been prepared and it has established committees of independent experts to provide advice. In November 1990, the Environment Protection Authority commented on energy issues for W A in its report and Recommendations on the proposed Collie Power Station (EPA, 1990). The EPA's general recommendation in this document was that "in making decisions about how to meet the State's demand for power the Government should give the greater weight to the options which are environment preferable. In declining order of environment preference the Authority ranks the major options as follows:
• conservation and efficiency improvements, • renewable energy sources such as wind and solar energy, • gas, including combined cycle turbines, • new technology coal plants, • old technology coal plants, and • petroleum fuel plants."
Despite the recommendations of the Harman committee, the EPA, and the Energy Policy Planning Bureau through the Energy Options Green Paper, the government through SECW A has pursued energy policy seemingly at odds with sound environmental management. This is most apparent in its pursuits of a coal-fired base load power station for W A.
14

'---
5.2 Water Resources
The Questionnaire Issues Within the area of water resources, it was considered that the consumer
awareness of the issues associated with the provision of water supplies and management of water bodies should be examined. Thus the general public was asked questions determining their attitudes and behaviour, and to obtain information on their understanding of environmental issues in relation to waters. Scheme water quality, water pollution, and water conservation were the areas addressed.
Responses - Domestic Water Supply Some 63% of respondents were satisfied with the quality of scheme water in
Perth, 17% indicated that they were sometimes satisfied, while 20% were dissatisfied with the quality of water. The main reason given for dissatisfaction was problems -of taste or odour, or a concern about chemicals in the water.
At the time of questioning, 45% of respondents thought that Perth had a long term water shortage problem, while 25% did not think this was the case, or were unsure (30%). Options for future water supply were considered. The Kimberley pipeline, darns in the SouthWest, and the desalination of seawater all had a high approval rating (45-50% either strongly agreed or agreed with each of these options). Groundwater use was next (38% approval), although many were probably unaware of the extent to which it is used already (around 40% of the existing scheme supply). ·
Perhaps viewing it as a more economical option, 89% of respondents strongly agreed or agreed that household water use should decline. Several conservation measures such as native gardens rather than lawn, not using a dishwasher, dual flush toilets, and watering the lawn twice a week were nominated as the best ways to economise water use. The last two of these were reported as the most common measures currently practised.
Responses - Water Bodies Approximately 70% of respondents believed that Perth's water bodies are
polluted to some degree. Drains for stormwater runoff were considered by 32% to be the most polluted water bodies, while streams and rivers (21 %) were considered to be the second most polluted. A relatively high'proportion (more than 20%) of people were uncertain about the state of groundwater, lakes and wetlands, and drains. Many people associated lack of clarity of the Swan to pollution and not siltation through erosion. Some clearly believe that discharge to storrnwater drainage systems are not monitored or subject to disposal criteria and could therefore contain pollutants.
Respondents clearly perceived that industry (89%) was the biggest water polluters, followed by the public (49% of the second response). This perception may have developed from past examples both directly visible and reported in the media (East Perth power station, and the Cockburn Sound-Kwinana region). The public perceptions tend to overlook non-point source pollution of water bodies from agricultural runoff, horticultural activities, and septic tank leachate.
Over 85% of the respondents thought that there should be stricter controls on water pollution. Decreasing water pollution requires funds and the respondents felt that industry and state government should contribute most, while fewer
15

'----
respondents considered that the public, the polluter, and local government should contribute. However, given a question linking the correction of the declining condition of lakes and wetlands to the supply of domestic scheme water, 85% of respondents acknowledged that the public should be prepared to pay more for water to fund corrective work on the lakes and wetlands; with a median increase of around 7% suggested.
Management Issues for Water Resources The Perth community has significant concerns about water management
issues. An overall objective of: "To improve the quality of Perth's water resources and encourage water
conservation practices" was considered to fairly represent the public opinion contacted by the study. In order to meet this, it was clear that there is a mandate to:
• improve the quality of scheme water for drinking purposes, • reduce pollution in water bodies such as oceans, streams, rivers, lakes, wetlands
and drains, • introduce stricter water pollution controls, particularly for industry, • develop water resource strategies for Perth's future water supply, • develop water conservation programs, • develop community awareness programs, • ensure community involvement in the development of environmental
management plans and strategies. ·
A service gap model of delivery to the public of appropriate resources from the environment has been discussed in earlier sections. It is clear that, in the area of water resources, a significant component of the perception gap lies between that level of treatment technology, and resource monitoring and utilisation currently provided by authorities, and that level of these activities of which the public is aware. The lack of public awareness can not be seen as healthy for either the community or the resources and their responsible authorities, in the long term. For example, the Swan still suffers some level of eutrophication, Perth's water resources are still being wasted, and groundwater in some areas is contaminated. Many of these problems are caused more by the community rather than industry.
It is clear that education and incentives are needed for the community to change behaviour in this area.
16

5.3 Urban Wastes & Recycling
The Current Situation In 1992 the WA Government produced the State Recycling Blueprint. The
aim of the SRB is to reduce by half the amount of waste going to landfill by the year 2000. This was in response to predictions that by 2007 Perth's current and easily accessible landfill sites (rubbish tips) will be full. After this time sites further afield will be required. The extra distance to transport the waste will increase landfill disposal costs from the present $14/tonne to $50-$60/tonne. Recycling is an activity that can increase the life of present landfill sites by diverting resources from the 'waste' stream to the "recycle" stream. At present only 9.4% (43 000 tonnes) of Perth's municipal waste is recycled out of a total of 1.44 million tonnes (Department of State Development 1992).
Public Opinion and Involvement To have a successful recycling program requires public involvement. Survey
results show that recycling meets with a fair degree of acceptance from the Perth public, with -112 of the respondents claiming to always recycle newspaper, glass and aluminium. The most common mode of recycling is council pick-up (-2/3 of respondents). The majority of people perceive recycling to involve some kind of effort, but not an excessive amount of effort.
The public when asked how recycling in Perth could be improved provided the following suggestions:
Better council service More bins
33% 27%
Education/ awareness 25% Incentives eg refunds 12% Less packaging 3%
From the results above one can see that the most frequently mentioned suggestions for improving recycling was a better council service. This suggestion took various forms. Some people were dissatisfied with the type of container being provided, others with the frequency of collections, others with the lack of information, while others had no recycling services provided by their council as yet.
When people were asked what they recycled at home, most people either recycled a material"always" or "never". Newspaper was the material most often "always" recycled by the public (53%). The material which was most often "never" recycled was plastic (38% ). Food waste and garden waste were also high on the list of materials that were "never" recycled (32% and 22% respectively). This points to a need for more effort to be put into the promotion of the recycling of plastic, food waste and garden waste.
From the results provided by the survey and by reference to successful recycling schemes overseas it is possible to propose strategies to improve recycling in Perth. These include:
Council services • Input from residents in the development of recycling services • Introduction or implementation of council recycling service • Use of acceptable container (eg Blue bins in Seattle USA)
17
r---
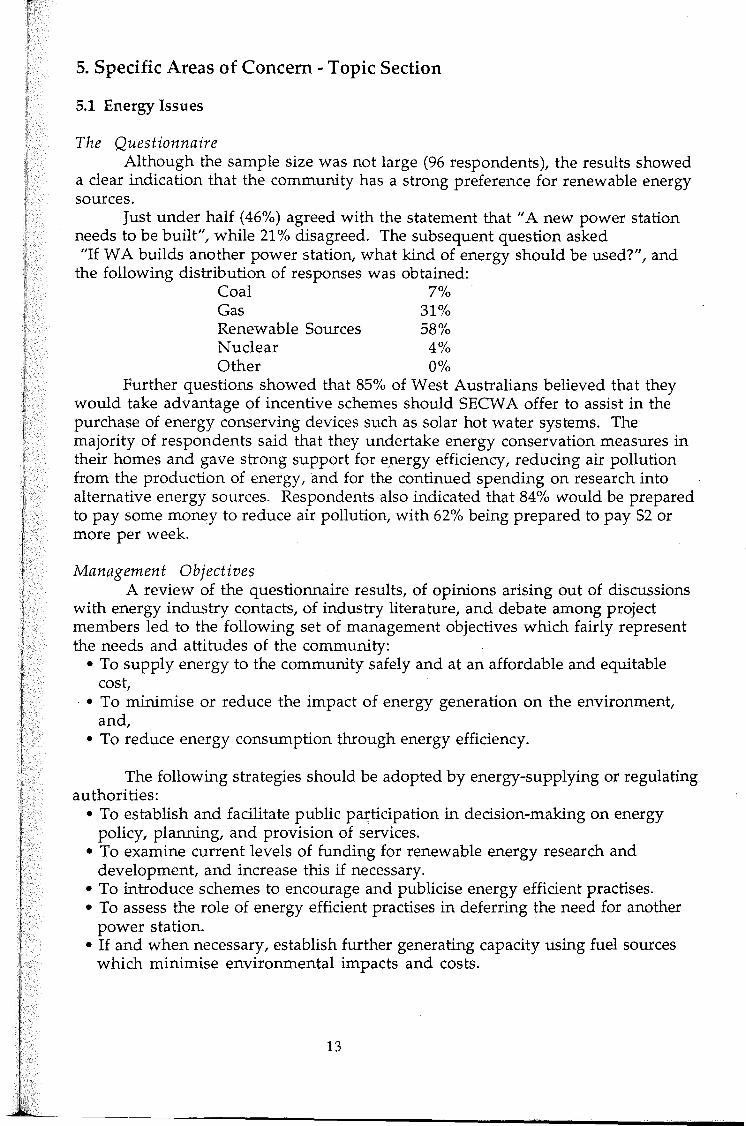
Recycling Bins • Provision of more bins in public places (eg central Perth) • Provision of more bins for different materials (eg glass, aluminium and
plastic) at the same location
Education and Public Awareness • Promotion of recycling through the School curriculum • Use local newspapers to provide feedback on the success of the recycling
program ( eg tonnes recycled, trees saved, jobs created etc) • Use of government campaigns to promote recycling (eg in a similar mode to
water conservation and anti-smoking ads)
Economic Incentives • State Government support of Councils in establishing a recycling system. • Incentive system for residents, ie charging for collection of non-recyclable waste
and collection of recyclable waste free of cost, or lotteries and cash prizes for recycling households.
Many of the points above are included in the State Recycling Blueprint. However by and large the policies are yet to be implemented.
18

5.4 Land Degradation
An Issue with Intuitive Awareness A topic survey on public attitudes and awareness was also conducted on land
degradation, with a sample size of 150 people. Over 90% of the population believed that human activities were damaging the land, with the most severe results of 'bad land use' being identified as chemical residues and land clearing. This question sought to examine public awareness of land degradation problems; the fact that people were unsure about other problems listed (salinisation, over grazing, alien plants) suggests that many were unaware of the actual situation.
The public suggested that industry and urban development were the greatest causes of land degradation, with mining and forestry also considered important contributors. A mixed response to farming and pastoral grazing as causes of degradation was recorded; while 50% agreed that they were important causes, equal numbers disagreed or were unsure. Some disparity between this response and an earlier one was identified, as farming is one of the main causes of salinisation (previously identified as resulting from bad land use) but it is not recognised as a significant causal agent in land degradation. This may indicate that Perth people lack an understanding of farming activities.
One of the most important pieces of information that this survey identified in relation to Government is that a significant portion of the public (67%) disagreed with a statement suggesting education and information about land degradation is sufficient. This response is the first of a number which highlight a lack of accessible · information and education relevant to these issues.
An investigation into public perception of the magnitude of the problem was expressed within a question querying the period of time it would take to solve land degradation problems. 94% said the problems would not be solved in 5 years, although the majority (78%) believing the problem would be solved within 20 years; 36% believed 10 years would be sufficient time to solve the problems. Obviously, the majority of the public can appreciate that appropriate management to ameliorate land degradation is likely to take some time, though they are optimistic that solutions can be found.
Several perceptions can be drawn from a response obtained regarding the effectiveness of government programs. The majority of respondents (54%) disagreed that government programs were providing solutions. Another significant response (26%) was that of people who were unsure as to whether programs were providing solutions. There is a perception that land renovation is a rather new, uncertain, and inexact science. There may also be an intuitive perception that European styles of broadacre agriculture will not be sustainable in the Australian environment. However, the uncertainty could indicate a general lack of knowledge within the public about the programs already in existence. The level of uncertain responses is about 10% greater than a similar question asked by Newman and Cameron (1982) suggesting a growing perception that Government programs are ineffective at solving environmental problems.
A question on personal behaviour related to actual involvement with fixing land degradation, indicates that most people are willing to contribute to solving land care problems, with the majority being willing to plant trees (91 %), control mining (84%), implement fines or taxing for those responsible (79%), and encourage change in farming activities (78% ).
The response to the last question is both significant and interesting; its subject -money. Generally the population indicated their personal willingness to pay directly for (ie, fund) the amelioration of land degradation (68%). In 1982, a similar
19

question provided a response of only 32% (Newman and Cameron, 1982). It would seem, even in difficult economic times, a significant change in attitude has occurred, with the majority of the (sample) population recognising that environmental repair is a societal and community responsibility.
Thus far we are aware of how people perceive degradation and its causes; we know that people are optimistic that the problems can be solved (but not immediately) but would like more information and education, they are generally unsure about Government programs in existence, and these programs effectiveness. Generally, the public would be prepared to contribute to solving the problems of land degradation by involvement in different activities and more directly by funding.
The Service Gap It appears that a service gap exists between the education and awareness
programs currently operating under various Government departments, and the effectiveness of these programs. Most people felt that accessible information about land degradation was lacking, and many seemed unsure about the existence of government programs to deal with the situation. As discussed earlier (Section 4.1), many respondents can conceptualise land degradation as a distinct environmental issue, and clearly agree with the need for renovating programs on an intuitive basis. Successful environmental management is partly dependant on public education and participation (and in the case of land degradation possibly the availability of public funding), so the ready availability of public education would still seem a priority issue.
The survey results suggest that people should have some control over· landuse, and the increased use of statutory powers under the Soil and Land Conservation Act (1945-1992), is presented as a possible option, by the authors, to close this apparent gap between Government policy and public expectation.
20

5.5 Air Pollution
Newly Emerging Issues The emerging issues in air quality facing the world today were seen by the
public to be pollution by industry, followed by ozone layer depletion, vehicle emissions, greenhouse effects and smog. Indoor air quality, acid rain and pesticides were also mentioned, but not deemed as important (see Table 5.5.1).
Table 5.5.1. Main Air Pollution Issues. Respondents were asked, in an open-ended question, to nominate important air quality issues facing the world now, Perth now, and in ten years time. Note that
dents mav have been uncertain as to sources of smoe:. ozone. & e:reenh ~_- -, --.....u.... ------ ----~-- --
Issues or Main Air Pollution Issues Sources
-World Today - Perth Today -In 2002
Industry 25 36 28 Ozone 23 0 7 Vehicles 21 43 58 Greenhouse gases 13 0 0 Smog 12 8 1 Power stations 0 6 0 Indoor air quality 2 1 5
A clear majority of respondents perceived vehicle emissions, pollution by industry and smog to be the main sources of air pollution problems in Perth, while ozone layer depletion and greenhouse effects were not seen to affect the Perth environment to such an extent.
When the community was asked about their concern for air quality in the next ten years, vehicle emissions emerged as the number one priority, ahead of industry and other global issues. Vehicle emissions and pollution by industry appear to be more of a concern to the community. In fact, both vehicles and industry emit substances that are related to ozone layer depletion and greenhouse effects. However, the concern about ozone layer depletion, greenhouse effects, acid rain and smog in ten years time is minimal.
The survey investigated the community's perception of the effects of air pollution on people's health in Perth. The respondents expressed concern; with 32% strongly agreeing, and 44% agreeing that air pollution has an adverse effect on health, while 16% gave the neutral response, only 8% disagreed, and 0% strongly disagreed.
The survey also explored the community's awareness on the perceived contribution of individuals by asking respondents to rate if "people can have a significant impact on the level of air pollution by reducing their vehicle usage". The majority supported this idea with 51% strongly agreeing , 45% agreeing, only 1% disagreed, and 3% had no opinion on the matter.
Respondents were asked to rate how often they chose to use public transport rather than their own vehicles. Although they believe that reducing the use of vehicles is an effective way to reduce the level of air pollution, 34% said that they sometimes use public transport, 20% and 11% stated that they rarely or never use public transport respectively. Others always (16%) or frequently (19%) used public transport.
21

The survey then asked respondents to identify whether outdoor or indoor air quality was of the most concern. The results showed that outdoor air pollution (68%) was of greater concern than indoor air quality (32%), a ratio of just over 2:1. Those who considered that outdoor air was of greater concern gave their reasons as that they spent more time outdoors (32%), there were more sources outdoors (30%), environmental effects (17%), industry (13%), or visibility (2%). Ventilation (37%), cigarettes (28%), confined areas (16%), air conditioning (14%), and spending more time indoors (5%) were reasons given for choosing indoor air pollution as of higher concern.
As with the core questions, the community was asked to prioritise (from 1 to 4) who should be most responsible for the control of air pollution, government, local council, industry or individuals. The results show a strong belief that government should be responsible, followed by industry, then local council. Individuals were thought to be the least responsible for the control of air pollution.
When asked if air pollution should be reduced, 60% of those interviewed strongly agreed, and 37% agreed that it should be reduced, 2% were neutral, a few disagreed (1%), and 0% strongly disagreed. The next question asked if people thought air pollution could be reduced. Some 41% strongly agreed, 55% agreed, 3% had no opinion, while 0% disagreed, and 1% strongly disagreed.
When asked if the public is willing to pay to ensure less air pollution; 10% strongly agreed, 38% agreed, 11% were neutral, 26% disagreed, and 15% strongly disagreed with the idea. Those who thought that people should pay more to ensure . less air pollution (the 48% of respondents in the first two groups above) were asked how much they would be prepared to pay each week. The majority of 74% indicated less than $5 per week. The remainder were divided between $5 per week (14%), $10 per week (7%) and more than $15 per week (5%).
The Service Gap Relative to industrial emissions, vehicle emissions in general are not
monitored to any great extent and yet the EPA has recognised that vehicles are expected to be the largest source of emissions by 1991 (EPA, 1991 ). Apart from WA Government strategy to redevelop the public transport opportunities in Perth, there appears to be little action to learn about or rectify the problems of vehicle emissions. Existing studies such as the Perth Air Shed Study and the network of monitoring stations around Perth may characterise the ambient concentrations of air pollution to some extent and public awareness of such studies is low.
Comments from respondents indicated that the mass media has the most significant impact on the opinions of the public about air quality. The EPA and various industries provide a small number of documents relating to both general and specific air quality issues, but accessibility is low and few people are aware of these publications. Many of these issues may be directly affecting the health and local environment of that individual.
In considering where the issues of air quality in Perth, the following points are considered a fair assessment of public concerns:
• the EPA's lack of a formal priority list which aims to address the most urgent air pollution and environmental issues first,
• the need for the enhancement of some current air pollution control programs, • the assessment and control of indoor air quality, and • the perceived need for tighter emission limits for industry, to at least WHO
levels.
22

5.6 Toxic Substances
The Current Situation Public sentiment towards the subject of management of toxic substances was
that credible consultation between public and government is needed rapidly to meet the needs of the people. Other reports, such as the Reid Commission report (1992), have reported similar attitudes. The issues explored in this topic questionnaire often align with issues of air pollution, and the public opinion has already been noted to collect these two facets of the environment (See section 4.1).
Responses The respondents were asked to rate the environmental impact of industrial,
domestic and agricultural wastes in order of priority (1 to 3). Industrial wastes wereplaced as the first priority by 72% of respondents. Domestic wastes were given the second priority by 50% of the respondents, and agricultural wastes were deemed the third priority by 57.7% of respondents.
The next question was designed to determine the public's opinion on the preferred method of waste disposal. The vast majority (56%) was in favour of the incineration of toxic wastes within Australia. The other methods of waste disposal were seen as much less acceptable to the public, with 14% of those surveyed having no opinion, other unspecified methods having 10% response, burial in Australia having 8%, exportation to developed countries having 8% and exportation to Third World countries having 2%. Ocean disposal was not considered by the public as an acceptable method of disposal, with no respondents choosing this method.
Respondents were asked to determine who was responsible, government, industry, or both, for a variety of subjects dealing with toxic substance management. These aspects included labelling, testing and development of alternatives to toxic substances, as well as research funding and public education. 38% of those surveyed felt that industry should be responsible for labelling toxic substances whereas 35% felt it should be a government task. Many of the respondents (46%) felt that the government should be responsible for the testing of toxic substances, while 28% said industry, and 26% said both. The development of alternatives showed no clear majority, with 36% saying both were responsible, while industry was 32%, and government 30%. 53% of the respondents felt that the government should be responsible for research funding, while 31% thought both industry and government were responsible. The respondents felt that industry was not solely responsible for the public's awareness of toxic substances, with only 9% saying industry is responsible, while 45% said that the government is responsible.
The perceived risk to the community's health was determined in the survey. Industrial emissions are seen to pose the greatest health risk, with 50% of the respondents indicating some risk (21%), or great risk (29%) to their health. Vehicle emissions were seen by 38% to be a health risk, as were pesticides (30% ), and household chemicals (24%). Other, unspecified sources were seen to pose little risk as only 4% indicated any as a health risk.
The respondents were then asked if the food they eat, air they breathe, and water they drink was perfectly safe. 7% of the respondents strongly agreed that the food they eat is perfectly safe, 33% agreed, 31% disagreed, and 4% strongly disagreed. 24% of the respondents were neutral on food safety.
The majority of the respondents (43%) disagreed that the air they breathe is perfectly safe, and 13% strongly disagreed. Completing this distribution: 5% strongly agreed that the air is perfectly safe and 21% agreed, while 17% were neutral.
23

Some 33% of those surveyed were neutral in their response to water being perfectly safe, while 7% strongly agreed, and 25% agreed. 29% of those surveyed disagreed that the water they drink is perfectly safe, and 5% strongly disagreed.
When asked how they felt education about toxic substances could be achieved, the respondents were asked to determine which of four different methods would be best to employ. 97% responded that mass media was acceptable in the education of the public, with 3% saying that mass media was not an acceptable method. 89% of the respondents agreed that secondary education is an acceptable method, while 73% of the respondents believed primary education to be acceptable. Only 23% of the respondents believed that information brochures provided acceptable education on toxic substances.
The Service Gap Ultimately, it is governments that make the final decisions in regard to
environmental management. Effective legislation can, in part, ensure that industry and commerce make their actions accountable in an environmental context. Public inputinto environmental matters is necessary and should have a greater impact on government decision making than it has currently. Community opinion needs to come from a more educated background, otherwise regulating authorities will continue to balance its decisions between the perceived wishes of a vocal and active minority and a great silent majority.
The following recommendations flowed from consideration of the assembled public opinion, industry consultation, and subsequent debate:
• Due to concern expressed by the public, both industry and government activity should be made more publicly accountable,
• State government should implement education initiatives targeted primarily at secondary students and households to inform the public of issues such as waste management and what the individual can do to reduce toxic waste,
• A joint industry-government program should develop alternatives to toxic substances and waste minimisation procedures,
• Economic incentives should be given to industries who conduct their own pollution monitoring and report on their observations, and
• Economic incentives should be given to industries who recycle or minimise toxic wastes.
The incentives must be appropriately performance-based, and public input on such incentives is seen as an area for future expansion and a vehicle for education. Expansion of the EPA reports in the newspaper may be an appropriate mass media channel to the community.
24

T 5.7 Transport
A Lifestyle Issue In Perth, a city with a large metropolitan area, a substantial suburban sector
as well as several regional areas, transportation is a major issue. In the Perth area, the usage of alternative transportation in the form of buses, trains, bicycles and carpools is overridden by a strong preference for private vehicles. The reliance on private vehicles is reinforced by the large areas of land allocated for roads and parking. The Transport Strategy Committee on Future Perth (1991) reported that the land in central Perth allocated for road reserves and parking is 24% and 8% respectively. This committee estimates the cost of construction for additional roads will be between $980 and $1100 million by the year 2020, in addition to the cost of planned road works over the next five years. In Australia, each private vehicle uses(on average) $1100 worth of fuel a year, and 24% of this is consumed in travelling to and from work (Dept Primary Industries, 1992).
The cost of this private vehicle dependence in Perth can be measured in more than purely economic terms, as there are also the environmental costs. Considering that the population of Perth is only around a million people, the city produces a lot of photochemical smog. Levels of pollutants such as oxides of nitrogen, carbon monoxide and hydrocarbons are often found to be present in very high concentrations, sometimes exceeding WA's health standards.
In the Transport Issues questionnaire, the aims were to assess public transport habits, the changes the public would like to see in Perth's transportation system, and which of these the public would patronise if implemented.
Results Table 5.7.1: H
Car Bus Train bicycle
ftend ALWAYS
58.9 3.2 8.7 3.2
he foll OFTEN
23.3 22.2 19.8 10.3
f f ? (U %) '-'- - - ---- r - -
SOMETIMES RARELY NEVER 12.4 3.9 1.6 22.2 30.2 22.2 28.6 42.9 0.0 23.8 18.2 44.4
As expected, the majority always use a car to travel (Table 5.7.1). The high percentages rarely using bus or train transport, and never using bus or bicycles, is of concern.
Table 5.7.2: Whv d . f, f tr, rt ther f, ? (list FIRST RESPONSE (%) SECOND RESPONSE (%)
Ease 30.7 20.0 No Choice 9.4 4.6 Speed I Comfort 4.7 15.4 Convenience 40.2 23.1 Cost 4.7 12.3 No Train I Bus 2.4 3.1 Frequency Services 2.4 6.2 Other 5.5 13.9
People usually chose their main form of transportation for its ease and convenience (Table 5.7.2). They usually had access to train or bus services. The 'other' reasons included fitness, environmental reasons, fun, habit, and access.
25

Table 5.7.3: List th bl 'th vubl' ? (
FIRST RESPONSE (%) SECOND RESPONSE (%) Too Slow 10.4 15.4 Access 13.2 20.0 Frequency 45.3 24.6 Reliability 4.7 6.2 Inconvenience 14.2 18.5 Crowded 7.6 4.6 Other 4.7 10.8
When asked to list the problems they associated with public transport, the most common response was that buses and other forms of public transport were not frequent enough (Table 5.7.3). Inconvenience, the second most common response, _ is perhaps tied to this, although distance from home to bus stop/train station may also be a factor.
Table 5.7.4: D 'th the foil ? (0/c
Strongly Agree Neutral Disagree Strongly agree Disagree
Closing more of the city centre to vehicles 15.5 42.6 18.6 19.4 3.9 Bikepark areas in city 18.6 57.4 19.4 3.1 1.6 Improved road conditions 22.5 43.4 21.7 10.8 1.6 Carpool incentives 24.0 53.6 17.8 3.9 0.8
. Tolls for vehicles entering city 4.6 17.0 24.8 30.2 23.3 Safety bike lanes 44.2 44.6 7.8 3.1 0.0 Improved bus service 37.2 45.7 13.2 3.9 0.0 More car parks in city 6.2 26.4 24.0 37.2 6.2 Expanded ferry service 10.8 34.1 47.3 7.0 0.8 Expanded train service 25.6 52.7 17.8 3.9 0.0
- ······--- - ·- ------------
When asked their opinion on various modifications to city transport, many respondents disagreed with tolls or more city car parks (Table 5.7.4), but agreed with bike lanes and parks, car pool incentives, train and bus services, and closing some city streets. The ferry appears to be an overlooked transport option to many.
Table 5.7.5: Which of the foll -- - CL ld k f? (%
ALWAYS OFTEN SOMETIMES RARELY NEVER Bike park 3.9 17.8 17.0 14.0 47.3 Carpools 3.9 24.0 29.5 22.5 20.2 Bike lanes 11.6 30.2 17.0 14.7 26.4 Buses 24.0 33.3 23.3 14.0 5.4 Carparks 3.1 21.9 29.7 28.9 16.4 Ferries 3.1 13.2 25.6 29.5 28.7 Trains 7.0 31.8 35.7 18.6 7.0 Taxis 7.8 14.8 21.1 32.8 23.4
·- - --------------~---- -------~------- -------------------- -· --····-------------~
Expansion of city bus services may be anticipated to have better usage than increased city car parks or bike parks (Table 5.7.5). Habitual usage of car pools, ferries, taxis needs significant incentives. In general, it can be seen that although Perth is reliant on cars, the public may respond to improvements in other forms of transport.
26

5.8 Urban Expansion
The Current Situation Urban expansion is a topical issue which has fuelled much debate within the
community in recent times. As an emotive issue, it is important that public perceptions and opinions are considered as part of the planning process, to provide a valuable insight into the relevant social, environmental and economic factors. To some, the term "urban expansion" brings visions of endless houses on the traditional quarter-acre block- without a parcel of undisturbed native bushland to be seen. To others it represents those extra consumers who will support business. In actuality, urban expansion is providing for the growth of the population through a diverse range of residential densities and flexible zoning to facilitate various lifestyles and employment opportunities.
Governments have often been advised by economists, environmental scientists and the like. Recently, planners have been conducting extensive studies to determine what the public prefer in a given planning situation. A problem which has been identified is that the public feel this attention is only a token concern- and is too little, too late. Members of the public who are concerned with a specific issue feel that voicing their concerns are to no avail, as their views carry no weight within the planning process. Others are resigned to the changes, and will passively await more information so that they can begin to adjust their lives accordingly. A service gap- when goverriment policy doesn't provide for the requirements of the public- has occurred in such a situation; and this study attempts to find a solution to any problems generated in this manner.
Thus, the urban expansion questionnaire was designed to determine: • the public's perception of Perth's population size, density and spread, • peoples' attitudes towards the main planning options for Perth's population
expansion, • whether- with appropriate incentives- city-dwellers could be prompted to
relocate to regional centres of the state, • the public's willingness to live in medium-density housing and obtain reasons
· for their choice, • if people are satisfied with the existing housing options and to ascertain what
options would be acceptable in the future, • factors that influence where people choose to live, and • problems the public associate with Perth's future growth and to assess how
knowledgeable people are in relation to this topic.
0 ----------- -r------ -- llected on Perth' I .. d - r- r -------- --- ------
Subject Just right(%) Too big/Much too big(%) Too small/ Much too small(%) Population size 54.6 23.5 22.0 Perth Area 44.4 38.0 17.6
When questioned about the population of Perth, the majority of people sampled felt that Perth's population was just right, with equal responding that Perth's population was too big/much too big and too small/much too small (Table 5.8.1). With the Dept. Planning & Urban Development's planning projections that Perth's population will double over the next twenty-five years, growth must be planned in a way that will be most compatible to the lifestyle desired by the population of Perth in the long-term.
The opinion expresses as to the size of Perth was supported by choice of the direction of growth for Perth. Only 21% of those surveyed chose the growth of
27 ;- 'j
7
'it
i 1. L ,,I;.
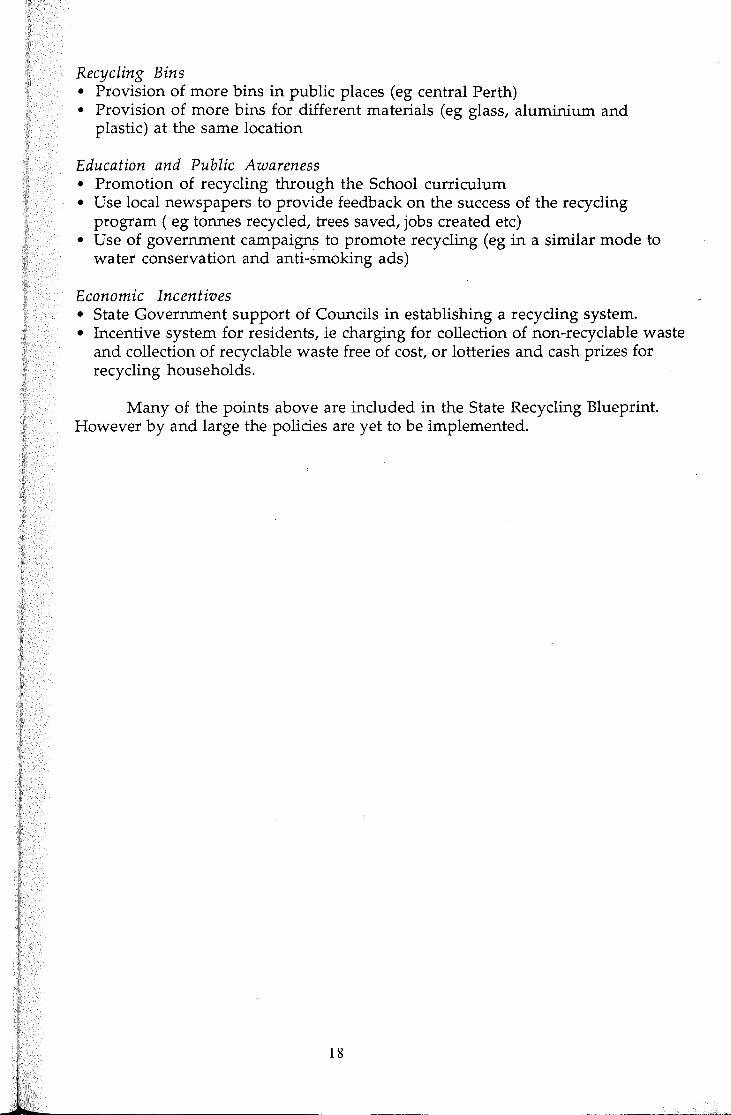
suburbs in outer areas, with the majority of respondents favouring more houses in existing suburbs and the development of regional towns (35.7% each). In total, 71% of those surveyed opted for methods likely to reduce urban sprawl.
The next questions sought to determine if people would be willing to change their lifestyles to meet the preferred pattern of growth and what would be influencing factors in their decisions. Of those surveyed, 76.1% replied that they would be willing to move out of the city, 86.4% of those surveyed indicated that employment and quality of life would play a part in their decision to move away from the city. Social and economic reasons were also cited.
To determine people's attitudes towards medium-density housing, interviewees were asked what they would miss most if they moved to a townhouse- defined as being a semi-detached house with it own small backyard (Table 5.8.2).
Table 5.8.2: Fact, · ed if rel h Factor Missed % Factor Missed, Contd. %
Backyard 41.8 Loss of services I facilities 3.0 Space 26.2 Undesirable social factors 2.2 Privacy 14.2 Loss of pets Nothing 11.2
Missing the backyard, space and privacy are closely related and can be treated as extensions of the same concern. As a group, these provided 82.1% of the reasons provided. As this is really a problem of perceptions (the highest density housing required by Perth's population would accept would be open enough to provide a small and private backyard), this provides a very good target on which a campaign to alter perceptions of medium-density housing could be focused.
Respondents were also asked the benefits of living in medium-density housing (Table 5.8.3). Lower maintenance and proximity to work and amenities clearly came to mind in the life-style envisaged.
Benefit Perceived % Benefit Perceived, Contd. % Reduced maintenance 32.2 Financial reasons 4.1 Proximity to work/ amenities 21.2 Better social interaction 4.1 Better space usage 7.3 Better security 3.2 Proximity to public transport 1.6 No benefit 24.4
The population of Perth sees the standard suburban block ("quarter acre" or 500-600m2 in the case of newer blocks) as the most appropriate style of housing for Perth (Table 5.8.4). Of almost equal preference was groups of houses with their own small outdoor area. Each of these styles of housing was favoured by over 70% of the people questioned. The next preference (groups of houses with a shared
Table 5.8.4: Preferred choice of h Housing type Agree(%) Neutral(%) Disagree(%) Single house on a standard suburban block 74.6 8.4 15.5 Group of houses with their own outdoor area 72.5 17.6 9.9 Group of houses with a shared outdoor area 55.6 14.8 29.7 Durlex housing 54.6 26.9 18.4 Blocks of flats 45.7 28.6 25.7 Single house on a block greater than an acre 19.0 13.4 67.6
--- ----
28

outdoor area) had only 55% approval. A possible reason for this is the desire to have one's own backyard. These were the only two options where the presence of a backyard was either directly stated or was obvious (ie. the standard block). Groups of houses with a shared outdoor area and duplexes rated almost equally while flats were considered appropriate by only 45.71% of those questioned. This raises the question of whether there is simply a perception problem (as may well be the case for duplex housing), or there are actually objections to those styles of housing. For example, if duplex houses are thought not to have their own backyard, this may explain why they rank closer to groups of houses with a shared backyard, rather than groups of houses, each with their own small backyard. The only type of housing that was definitely considered inappropriate for Perth was a house on a block greater than an acre, which would obviously lead to urban sprawl (19.0% approved compared to 67.6% disapproved).
Knowledge of the factors influencing where people choose to live is important as these needs should be accounted for in urban planning, and so that they may be used in strategies to direct the public's choice of housing. The most important factors identified were cost, privacy and having their own backyard
bl s d the£, that infl ----------- -------------- -··- ·- -------- ----------------- ·------ r--r-- ··---- ---~--- -- --· --
InfluencingFactor Agree(%) Neutral (%) Disagree (%) Cost 92.2 3.5 4.2 Privacy 88.0 9.9 2.1 Own backyard 81.0 14.1 4.9 Shops nearby 78.2 15.5 6.3 Distance to work 70.4 17.6 12.0 Social contact 67.6 23.9 8.4 Recreational facilities 64.8 26.1 9.4 Public open space 63.4 31.0 5.6 Health services 58.4 31.0 10.6 Public transport 50.7 35.9 13.4
(Table 5.8.5). Cost was clearly the most important, with 50°(o of people agreeing this was a very important factor and 42.2% agreeing that it was an important factor. All remaining factors listed rated above 50% of people agreeing they were an influencing factor, and thus must be considered as important aspects of overall choice. The results show that many factors are considered to be important, and thus strategies must involve several factors in order to be successful. Ultimately, the major consideration is price, so if other factors can be demonstrated to be adequate for public preference, a sufficient price incentive should enable planners to direct the public towards a particular mode of housing.
Problems resulting from "Perth growing larger" were perceived by 73.4% of those surveyed, while 20.3% did not see any problems (6.3% were unsure) (Table 5.8.6). The question was phrased in this way as to allow people to respond on the basis of either population and/ or area growth, according to their perceptions of the most serious problems. The most commonly perceived problems (environment, urban sprawl, transportation problems, lack of services and, to a slightly lesser degree, social factors) are all associated with the type of housing that may occur in the city. These results suggest that the population of Perth may be willing to change their style of housing in order to prevent these problems occurring. Several of the other concerns (pollution, lack of space and to a lesser extent the problems of
29

Table 5.8.6: Perceived orobl - r -- __ , d with Perth -- .. - ... -- __ groWing: larger.
Problem Percentage Environment 20.2 Sprawl 14.4 Transport 13.5 Social factors 12.5 Services 12.5 Population growth 10.6 Em_rloyment 5.8 Pollution 4.8 Lack of space 3.8 Law I crime problems 1.9
population size) could also be minimised through a change in housing style. The -remaining problems listed (unemployment, law I crime problems and some other social problems) are less able to be dealt with through urban planning (though good planning will help to minimise them). These are valid concerns and must be considered at some time, but are beyond the scope of this investigation concerning urban expansion.
This study indicated that Perth's people are satisfied with the present size and population of their city but can see problems with future growth. The public feels that medium density housing and decentralisation are suitable alternatives to reduce the urban sprawl of Perth. However, a change in the perception of medium density housing is needed in order for urban infilling - an integral part of Metroplan - to be acceptable. Decentralisation may be achieved by the provision of jobs in regional centres and by promoting the "quality of life" aspects of these areas.
Although there are opportunities for people to comment on State plans, many people are reluctant to participate, fearing their submissions will make no difference. State planners could help to alleviate this problem by providing local government with clear direction which co-ordinates with state plans and encourages people to have input at the local level.
30

5.9 Natural Resources
The Environment's Prospectus Western Australia is relatively rich in its abundance of natural resources.
However, increasing environmental concerns make the management of natural resources a significant issue in the 1990s and beyond. Effectively, increasing public awareness and concern has brought environmental management in this area into the political arena.
The increased involvement of the public in these matters and various social factors are very important to companies who utilise natural resources, because any adverse reaction to current issues could jeopardise further operations. Some companies are so aware of social issues that they go to the extent of including them within company policy (Alcoa is such a company).
It is in the area of natural resource management that the service gap is most apparent. As an illustrative example, the public viewed forestry as the worst managed resource in Western Australia, and felt that tourism and fisheries were the best. In actuality, the government authority responsible for fisheries management admitted problems of overfishing, in contrast to CALM who stressed that forestry is well managed. These discrepancies may be solely due to public perceptions, and indicated that more educational information is needed in these areas.
The Questionnaire The questions within the natural resources questionnaire were phrased to
determine social priorities within this area, and identify which areas were of particular concern. Once data such as these have been collected and analysed, it may be possible to alter public misconceptions and generally provide the public with the information and implement appropriate management changes.
Respondents were asked to indicate their support of the statement 'Western Australia has so many natural resources that it doesn't really matter how we use them". Some 90.3% answered that they strongly disagreed or disagreed with this statement, indicating how much environmental awareness has increased in recent times.
Using this same scaling system, respondents were asked to state how well they considered various aspects of Western Australia's natural resources were being managed (Table 5.9.1). Forestry management was viewed as being most badly managed, being criticised by 64% of those surveyed. Tourism was
Table 5.9.1: I think that WA' --- - - - -- --- - -- · the fall 11 d
INDUSTRY DISAGREEMENT(%) AGREEMENT(%)
Forestry 64 21 Energy Resources 55 24 Water 49 21 Mining 49 28 Agricultural Land 44 23 Fisheries 34 34 Tourism 34 42
--
31

considered to be the best managed industry. Many more people thought that agriculture, water, mining, energy, and forestry were not well managed than those who thought that management of these resources is good.
There were a substantial number of neutral responses, especially for the agricultural and fishing industries (Table 5.9.1). This could be due to people being non-committal in an area where they had little knowledge, perhaps indicating that a lack of information about these industries exists. In the above table "agreement" refers to strongly agree and agree responses, and "disagreement" refers to disagree and strongly disagree responses.
When asked to respond to the statement 'We should be doing much more to conserve our non-renewable resources for future generations" an almost overwhelming majority- 94%- at least agreed with the statement. Again, this shows how people consider that we have a finite amount of resources, and that we must act now to preserve them for the future.
Respondents were asked about the locations they would agree to resource development. In offshore areas, the majority of people agreed that development should be allowed on the proviso that adequate safeguards be implemented. Just over half would approve of development in areas of aboriginal significance, perhaps indicating a lack of understanding as to the importance that these areas have to the aboriginal community. By contrast, most people would not approve of resource development in national parks, with a similar response being given for development in World Heritage areas.
Again, using the five point scale (always, frequently, sometimes, rarely, and never) those surveyed were asked to state how often they considered sources of raw materials when buying goods. 35.1% said sometimes, 41.8% said always or frequently and 23.1% said rarely or never. When looked at in conjunction with the following question (do you agree that the information/education currently available to you about natural resources is adequate) to which 74% of those surveyed replied that such information was rarely adequate, it may be that this is the reason why so few people considered a product's origins. If steps were taken to correct this discrepancy, then perhaps more people would be more capable of choice when purchasing. ·
Respondents were asked to rank the statement "The information/ education currently available to you about natural resources is adequate" using the same five point system. Although related to the previous question, it refers to natural resources in general and not products specifically. The answers collected were fairly similar to question 6, except that people appear to agree that there is more adequate information available on natural resources than for individual products. Most people (61.9%) at least disagreed with the statement. Only 25.4% agreed with the statement (most not strongly), and 12.7% were neutral.
The Service Gap Overall, the general public was displeased with the current state of natural
and physical resource management provided by authorities in Western Australia. A greater amount of educational information is needed for the general public, and concerned community groups, if they are to be satisfied with the management of natural resources in Western Australia. Similar sentiments have been reported on other specific issues.
32
5.10 Economic Incentives
A subset of the topic questionnaires examined the policy development issue of economic incentives. Information from the questionnaire was used to gauge the public's view on the effectiveness of economic incentives in the achievement of desirable environmental management outcomes.
The Service Gap Throughout this document we have referred to a 'service gap' in the
formulation of policy and delivery of service matching that desired by the average member of the public. In the earlier specific area discussions (5.1-5.9), the perceptual gap concept has effectively been between services supplied and desired, however in the area of economic incentives, we move into issues of proactive policy. The public's perception of the role of governments in environmental management and that which is provided through economic incentives is still termed the service gap in this section, but the subtle difference should be borne in mind.
The survey indicates the public's strong belief that the responsibility for environmental management lies in the government's arena. In the hierarchy of responsibility it is interesting to note that people place the primary responsibility with the most distant sphere ie. Federal Government, secondly with State Government, followed by the Individual, Industry and Commerce, and the Local Authorities fifth (see Table 3.5).
When asked, in a subset of the questionaries, the community felt there is a greater need for economic incentives to assist in the role of better management. For example, placing a cost on a traditionally free service such as rubbish removal would motivate householders to recycle, compost and reduce their volume for disposal. With respect to water usage where a surcharge only applies to excess, those who do not use their "free" quota have little incentive to reduce use.
Such measures tackle the problem primarily at a domestic level. The real current perceptual service gap exists in the industrial pollution control area. Management strategies at present exist as regulations, penalties and monitoring which do not act as motivation to introduce the "cleanest" technology available.
Economic Incentives Almost three-quarters of the 150 people surveyed (73%) believed
Government schemes should be set up to raise the price of environmentally damaging products, while only 21% disagreed. The cost of products influences peoples attitudes to purchase. While 42% of people said that a higher price did not deter them from buying environmentally friendly products, 46% said that greater cost would be a deterrent. It is clear that almost half of the buyers could be influenced to buy environmentally friendly products if the cost is not too great.
With respect to a charge by weight system of household rubbish collection respondents overwhelmingly indicated that they would change their habits. More than 80% indicated that they would recycle, compost and buy products with less packaging if such a charging system was introduced.
This attitude is not reflected to the same extent where an excess based charge is employed as with water rates. 59% agreed that having to pay an excess charge meant they conserved water whereas 26% disagreed.
Around 80% of the public surveyed feel that government should provide aid to industries which use pollution control measures while only 15% feel that such economic assistance it is not a government responsibility.
33

There is also an overwhelming feeling that a charge should be made against industries which cause pollution. 93% of respondents support this idea.
52% of those surveyed felt that the consumer should be responsible for the cost of the clean up of pollution resulting from the manufacture of consumer goods though 40% disagreed.
It can be concluded from the responses to these questions that the public would support the introduction of economic incentive schemes.
The Existing Situation Discussion of the survey results, dialogue with personnel in government
departments, and examination of relevant literature led to the following assessment on how to close this 'service gap'. The current poor level of communication between the Federal and State Governments on environmental management is a major barrier to promoting both ecologically sustainable development and the introduction of economic incentives. The general public clearly expresses its belief that the primary role in environmental management is the responsibility of the Federal Government. This supports the present view of constitutional law commentators who believe that there are wide ranging appropriate constitutional powers allowing regulations, funding incentives and taxation incentives.
The current strategies place more emphasis on regulations with threatened penalties backed by parliamentary legislation. There has been limited success in promoting responsible environmental management as such measures are more often seen as disincentives. The positive aspect of economic incentives relies on encouraging behaviour by placing a value on a particular resource. Cases of such positive incentives include funding for land care projects, saline and catchment management projects, and remnant vegetation and coastal management. Also, the Department of State Development partly funds recycling initiatives. A number of cash incentives exist for collection of paper, glass and aluminium. Other State agencies contribute in the way of subsidies to reduce operational costs of the public transport system thereby reducing the ticket cost. Economic incentives flow through SECWA as cheaper electricity to industry for use in specific periods. Funds are also available for renewable energy research.
While no-one can deny that greater responsibility for protection of the environment rests with every individual the survey highlights the public's perception that primary responsibility lies with the Federal Government to establish effective economic incentive schemes which promote the individual's responsibility.
34

6. References
Conacher, A.J., 1978 Resources and environmental management: Some fundamental concepts and definitions. Search 9: 437-442
DASET, 1992 The Environment and the ESD Process -An Attitude Research Analysis. Office of the Minister for the Arts, Sport, the Environment and Territories. Australian Government Publishing Services, Canberra
Department of Primary Industries, 1992 1992-1993 Fuel Consumption Guide Australian Government Publishing Services, Canberra
Department of State Development and the West Australian Municipal Association, 1992. State Recycling Blueprint. Perth, WA.
EPA, 1990 Report and Recommendations of the Environmental Protection Authority - Proposed Collie Power Station. Bulletin 472, Perth W A
EPA, 1991 Annual Report EPA, Perth, W A., p. 68
Flavin, C., and Lenssen, N., 1991 Designing a sustainable energy system. In: State of Our World 1991, World Watch Inst., pp. 21-38
Harman, F., and others, 1991 Power Options for Western Australia. Report of the Review Committee on Power Options for Western Australia.
Murray, F., 1992. Pers. comm. Environmental Management Lecture.
Newman, P., and Cameron, I. 1982. Attitudes to Conservation and Environment in Western Australia. Environmental Science, Murdoch University, Murdoch.
Reid, R., 1992. Speaking Out. Taking Part: A report to the Government from the Community and Family Commission on behalf of the People of Western Australia. Community and Family Commission Office of the Family, Government of Western Australia.
Transport Strategies Committee on Future Perth (1991) Transporting Perth into the 21st Century: A Discussion Paper Dept. Transport, Perth
35
...,.