Embed Size (px)
Citation preview

1 1
W A K E C O U N T Y W A K E C O U N T Y W A K E C O U N T Y W A K E C O U N T Y
H U M A N S E R V I C E SH UM A N S E R V I C E SH UM A N S E R V I C E SH UM A N S E R V I C E S
P U B L I C H E A LT H P U B L I C H E A LT H P U B L I C H E A LT H P U B L I C H E A LT H
Q U A R T E R LY Q U A R T E R LY Q U A R T E R LY Q U A R T E R LY R E P O R T R E P O R T R E P O R T R E P O R T
J A N U A R YJ A N U A R YJ A N U A R YJ A N U A R Y ———— M A R C H 2 0 1 2M A R C H 2 0 1 2M A R C H 2 0 1 2M A R C H 2 0 1 2
Wake County Human Services Public Health Division 10 Sunnybrook Road P.O. Box 14049 Raleigh, NC 27620-4049 www.wakegov.com
MAY 18, 2012
P u b l i c H e a l t h Prevent · Promote · Protect
Ramon Rojano, Human Services Director Sue Lynn Ledford, Public Health Division Director
Editor-in chief: Edie Alfano–Sobsey, Public Health Epidemiologist
Editorial Staff: Roxanne Deter, Public Health Nurse and
Carla Piedrahita, Public Health Educator
Design and Layout: Michelle Ricci, Public Health Educator

2 2
Table of Contents
Topic Page
Introduction 3
County Health Rankings 4
Tobacco Use
Quitline Use 7
School Health
School Nurse to Student Ratio 8
School Staff Training 9
School Health Services 10
Outreach
National Association of Counties (NACo) Prescription Drug Discount Card
Program
11
Infectious Disease and Foodborne Illness
Reportable General Communicable Disease Investigations 12
Critical Violations at Wake County Restaurants/Food Stands 12 & 13
Emergency Preparedness
Strategic National Stockpile Plan 13
Sexually Transmitted Infections
Integrated Testing Services 14 & 15
Pregnancy Rates
Pregnancy Rates for 15-19 Year Olds in Wake County 16 & 17
Wake County Prenatal Clinic Clients 2009—2011 18
Healthy North Carolina 2020 Objectives 19 & 20
Acknowledgements 21

3 3
Introduction
Wake County Human Services (WCHS), an accredited health department, continues to strive to
perform the three core functions of assessment, policy development and assurance and the 10 public
health essential services (see Figure 1). This report helps fulfill public health essential services:
• Number 1: Monitor health status to identify community health problems and
• Number 3: Inform, educate, and empower people about health issues.
Figure 1
Information is provided on a quarterly basis about health and safety trends for Wake County residents,
providers, policy makers and community partners to better inform decision making. Strategies used
by WCHS Public Health programs and services to improve health outcomes are also featured in these
reports. For additional information, point of contact information is provided for each area.
This issue highlights the results of the national County Health Rankings. See inside how WCHS
ranked!

4 4
County Health Rankings
For the third year in a row, Wake County has been named “Healthiest County” in North Carolina,
according to a report released on April 3, 2012 by the University of Wisconsin Population Health
Institute and the Robert Wood Johnson Foundation (See Figure 2). Community members such as
businesses, government, faith-based organizations, health care, educational systems, and public health
work together with philanthropists and investors to achieve these outstanding results.
The report assesses the overall health of counties in all 50 states by using a standard formula to
measure how healthy people are and how long they live. Counties are ranked within each state. The
findings ranked Wake first in overall health outcomes and second for other health factors among all
100 North Carolina counties.
The four measures used to assess the level of overall health for North Carolina by County were:
• The rate of people dying before age 75
• The percent of people who report being in fair or poor health
• The number of days people report being in poor physical and poor mental health and
• The rate of low-birth-weight infants.
The report also looked at factors that affect people’s health within four categories:
• Health behavior
• Clinical care
• Social and economic factors
• Physical environment (see Table 1).
Data Source: County Health Rankings and Roadmaps www.countyhealthrankings.org
Figure 2
1

5 5
Wake County Health Outcomes and Health Factors
2012 Wake County Error Margin National Benchmark* North Carolina Rank ( of 100)
HEALTH OUTCOMES 1
Mortality 1
Premature Death 5,212 5, 042-5,382 5,466 7,961
Morbidity 1
Poor or fair health 12% 11-13% 10% 18%
Poor physical health days 2.6 2.4-2.9 2.6 3.6
Poor mental health days 2.5 2.3-2.7 2.3 3.4
Low birthweight 7.7% 7.6-7.9% 6.0% 9.1%
HEALTH FACTORS 2
Health Behaviors 2
Adult smoking 15% 14-17% 14% 22%
Adult obesity 26% 24-28% 25% 29%
Physical inactivity 18% 17-20% 21% 25%
Excessive drinking 15% 13-16% 8% 13%
Motor vehicle crash death rate 11 11-12 12 19
Sexually transmitted infections 394 84 445
Teen birth rate 30 29-30 22 50
Clinical Care 4
Uninsured 14% 13-15% 11% 18%
Primary care physicians 835:1 631:1 859:1
Preventable hospital stays 51 49-53 49 64
Diabetic screening 89% 86-91% 89% 87%
Mammography screening 73% 71-76% 74% 70%
Social and Economic Factors 3
High school graduation 84% 78%
Some college 77% 76-78% 68% 61%
Unemployment 8.4% 5.4% 10.6%
Children in poverty 15% 13-17% 13% 25%
Inadequate social support 18% 16-20% 14% 21%
Children in single parent households 26% 25-28% 20% 34%
Violent crime rate 333 73 448
93
Air pollution-particulate matter days 3 0 1
Air pollution-ozone days 7 0 6
Access to recreational facilities 15 16 11
Limited access to healthy foods 6% 0% 10%
Fast food restaurants 52% 25% 49%
Physical Environment
*90th percentile, i.e. only 10% are better. NOTE: Blank values reflect unreliable or missing data.
Data Source: County Health Rankings and Roadmaps www.countyhealthrankings.org
Table 1

6 6
County Health Rankings
Although Wake County achieved a high health ranking, several areas to explore for improvement
have been identified from this and other Wake County reports (such as the Wake County Community
Assessment, and State of the County Report) based on weight of health factor, trend, comparison to
NC state average or magnitude of difference from a national benchmark. These include:
• Children in poverty (Increased from 11% in 2008 to 15% in 2010.)
• Obesity (Since 2006, 25% or more of Wake county residents are obese.)
• Violent Crime (The violent crime rate was 333/100,000 population from 2007-2009 ;
almost 5 times higher than the national benchmark of 73/100,000 population.)
• Excessive Drinking ( Fifteen percent (15%) of Wake county adults participate in heavy or
binge drinking compared to 13% of adults in NC from 2004 - 2010. This is about twice as
high as the national benchmark.)
• Sexually Transmitted Infections (Increased from 365/100,000 population in 2008 to
394/100,000 population in 2009; almost 5 times higher than the national benchmark of
84/100,000 population.)
• Physical Environment (Wake County’s physical environment ranked 93rd out of 100
counties because of unhealthy environmental conditions based on air pollution, access to
recreational facilities, limited access to healthy foods and number of fast food restaurants.)
AREAS FOR IMPROVEMENT
Contact: Edie Alfano-Sobsey, Public Heath Division 919-212-9674 [email protected]
7 7
Tobacco Use
Data Source: NC Quitline Monthly Data Reports
The purpose of the Quitline is to provide NC citizens a FREE cessation resource to aid in quitting
tobacco use. The Quitline offers 24/7 counseling sessions either by phone and/or online. Quit coaches
call people who are referred to the Quitline by healthcare providers. While supplies last, callers who
enroll and qualify are offered FREE nicotine replacement therapy (NRT) medication in the form of
patches, gum or lozenges. The Quitline number is 1-800-784-8669 (1-800-QUITNOW).
During the first three months of 2012, enrollment in the Quitline increased compared to the same time
in 2011 and 2010 (see Figure 4). The Centers for Disease Control and Prevention (CDC) Office of
Smoking and Health, the NC Department of Health and Human Services (DHHS), and Wake County
Human Services Project ASSIST (American Stop Smoking Intervention Study) collectively provided
multiple media campaigns during the months of January-March. The media outlets used were radio,
television, web ads and local newspapers. The campaign began in January and DHHS and CDC ads
continue to air. Figure 3 is a reflection of the importance of social media in public health. Educating
the public on available resources like the Quitline is essential to getting people the support needed to
quit using tobacco.
5240
159
36
57
144
180
111
167
0
20
40
60
80
100
120
140
160
180
200
2010 2011 2012
Number of Wake County Residents Registered With Quitline
During January-March 2010-2012
Jan
Feb
March
Figure 3
Contact: Sonya Reid, Health Promotion Chronic Disease Prevention Section 919-250-4553 [email protected]
QUITLINE USE
8 8
School Health
Figure 4
STUDENT TO SCHOOL NURSE RATIO
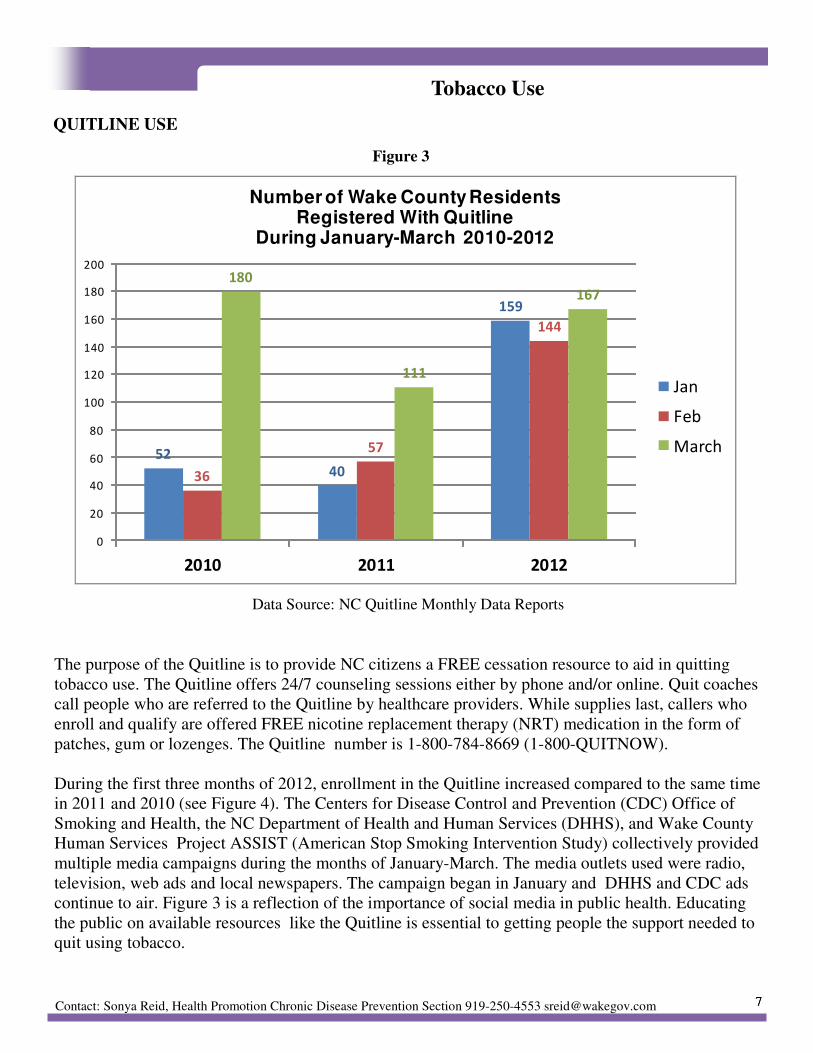
The Wake County Human Services School Health Program promotes the health, safety and
educational success of students in the Wake County Public School System (WCPSS). The WCHS
School Health Program does this by partnering with WCPSS, families, physicians, hospitals and
community agencies using evidence based practices and professional standards of care. This
partnership includes: training school staff with no medical background to perform medical procedures
and administer medications; responding to health concerns that interfere with academic success; and
assisting families in accessing needed resources. Additionally, the program promotes the public
health and safety of Wake County residents through emergency preparedness and the prevention,
investigation and control of communicable diseases in the school system.
The student to school nurse ratio is a measure used across the state of North Carolina and the United
States to assure students are healthy and able to participate in school. The student to school nurse
ratio is significantly higher in Wake County as compared to the recommended standard as well as to
other North Carolina counties (see Figure 4). In Wake County, the number of students per school
nurse is over twice the average of other North Carolina counties.
24052198
20471918 1897
1593 15711340 1340
1226 1175 1,201
19902172 2188 2239 2253 2298 2286
21632371
22672383 2,317
0
500
1000
1500
2000
2500
3000
Number of Student s
to One Nurse
Number of Public School Students Per School Nurse
Wake County and North Carolina
Trend from 1999-2000 to 2010-2011 School Years
North Carolina
Wake
Note: The standard student to school nurse ratio of 750 students to one school nurse nurse has been adopted by the North Carolina Public
Health Taskforce, the North Carolina Department of Public Instruction and teh NC Division of Public Health and is based on recommendations
made by the American Academy of Pediatrics, the Centers for Disease Contol and Prevention, and the National Association of School Nurses.
Source: NC Annual Survey of School Health Services, NC DHHS

9 9
School Health
Figure 5
SCHOOL STAFF TRAINING
12361542
18942111
2663
3180
35573881 3793
0
500
1000
1500
2000
2500
3000
3500
4000
4500
Number Of Procedures School Nurses
Trained WCPSS Non-Medical School Staff to Perform
2002-2003 through 2010-2011 School Year
Procedures
School Year
Data Source: Wake County Human Services School Based Public Health Nursing Program
Monthly Report
Use of epinephrine auto injectors
for severe allergy makes up 57%
of the medical procedures
performed in the schools (see
Figure 6); food allergies are the
most prevalent type of allergy.
Comprehensive preventive and
emergency care plans are
developed by the school nurse
and school staff is trained to give
medication through injections,
insulin pumps, rectal
suppositories and inhalers.
Data Source: Wake County Human Services School Based Public Health Nursing
Program Monthly Report
The number of procedures
school nurses train non-
medical staff to perform
increased 300% over a nine
year time span (see Figure
5).
Figure 6
Epinephrine
Auto Injector
57%
Diabetes
Re lated
Proc edure
27%
Diastat (Rectal
Valium)
7%
Nebulizer
Treatment
4%
Other
5%
Types of Procedures Wake County Public Schools

10 10
School Health
SCHOOL HEALTH SERVICES
The large number of assessments and counseling is attributed to assessment of each student referred to
the nurse with corresponding counseling when a health concern is identified. From October to
December, assessments increase significantly due to vision screening. As the year progresses, services
that take more time to complete such as case management, follow up of students referred for health
concerns and working with families to help their child access care increase (see Figure 7).
Figure 7
Contact: Roxanne Deter, Public Health Division 919-250-4637 [email protected]
9703
16511
13291
7725
8385
5958
5699
5317
3707
2072
1848
1457
0 2000 4000 6000 8000 10000 12000 14000 16000 18000
Jan-Mar 2012
Oct-Dec-2011
Jul-Sept 2011
Number of Services
Number of School Based Public Health Nurse and Dental Hygienist Services Including
Assessment, Counseling, Referral and Follow Up to Secure Care for Wake County
Public School Students
Quarterly Service Activity 2011-2012 School Year
Case Mananged
Services/Family
Intervetions/Home Visits
Follow up/Referral/Assurace
Student Secures Care
Health Counseling
Assessment of Health
Conditions
Source: Wake County Human Services School Based Monthly Reports

11 11
Outreach
The National Association of Counties (NACo) Prescription Drug Discount Card Program was initiated
in Wake County in September 2007. The card is ready for immediate use, with no form to fill out or
fee for enrollment, and provides a discount for prescription medications that are not already covered
by insurance or other prescription discount program. Cards can be obtained from card displays located
at Wake County government buildings with public access, including regional centers, public libraries,
town halls, and at retail pharmacies throughout Wake County. Table 2 shows card usage and price
savings in Wake County from 2008 –2011.
NATIONAL ASSOCIATION OF COUNTIES (NACo) PRESCRIPTION DRUG DISCOUNT
CARD PROGRAM
Calendar Year Total Utilizers Avg. Price Savings Percent of Price
Savings
2008 55,888 $13.83 25.44%
2009 52,836 $14.33 26.84%
2010 46,389 $14.77 27.74%
2011 38,163 $14.51 27.81%
Total 193,276 $14.36 26.95%
Total Utilizers – gives an indication of how many residents the program is helping
Average Price Savings – Average price savings per prescription
Percent of Price Savings – Percentage price savings per prescription
Data Source: National Association of Counties www.naco.org
Contact: JoAnn Douglas, Immunization Outreach 919-250-4518 [email protected]
Table 2

12 12
I n f e c t i o u s D i s e a s e s a n d F o o d b o r n e I l l n e s s
+Number reported by NC
Electronic Disease Surveillance
System (NCEDSS) on May 2,
2012.
*Foodborne Illness includes
campylobacter, E. coli shiga toxin
producing , hepatitis A, salmonella
and shigella.
**Tickborne Illness includes
Rocky Mountain spotted fever,
Lyme disease and ehrlichiosis.
***Hepatitis B includes new
infections, long term infections and
those acquired through pregnancy/
birth.
Figure 8
REPORTABLE COMMUNICABLE DISEASE INVESTIGATIONS
0
10
20
30
40
50
60
70
Foodborne
Illness*
Tickborne
Illness**
Hepatitis
B***
31 29
6867
16
47
Investigations
Reportable Communicable Disease Investigations+
January - March 2011 and 2012
Jan-Mar 2011
Jan-Mar 2012
Figure
9
CRITICAL VIOLATIONS AT WAKE COUNTY RESTAURANTS/FOOD STANDS
Data Source: Wake County Environmental Services
The average number of critical violations per inspection decreased during the last quarter
(January to March 2012) for the first time in several years (see Figure 9), possibly due to increased
outreach and educational activities by the Wake County Environmental Health and Safety Division
staff .
More foodborne illness and fewer tickborne illness and hepatitis B investigations were conducted in
the first quarter of 2012 compared to the first quarter of 2011 (see Figure 8).
0.0
0.5
1.0
1.5
2.0
2.5
Jan
-10
Fe
b-1
0
Ma
r-10
Ap
r-10
Ma
y-1
0
Jun
-10
Jul-1
0
Au
g-1
0
Se
p-1
0
Oct-1
0
No
v-1
0
De
c-10
Jan
-11
Fe
b-1
1
Ma
r-11
Ap
r-11
Ma
y-1
1
Jun
-11
Jul-1
1
Au
g-1
1
Se
p-1
1
Oct-1
1
No
v-1
1
De
c-11
Jan
-12
Fe
b-1
2
Ma
r-12
Average
Number
of
Critical
Violations
Average Number of Critical Violations per Inspection at Wake
County Restaurants from January 2010 to March 2012
Contact: Ruth Lassiter, Communicable Disease Surveillance Section, 919-212-7344 [email protected]

13 13
I n f e c t i o u s D i s e a s e s a n d F o o d b o r n e I l l n e s s
Figure 10
CRITICAL VIOLATIONS AT WAKE COUNTY RESTAURANTS/FOOD STANDS
Data Source: Wake County Environmental Services
Number of Cri=cal Viola=ons Associated with CDC Risk Factors*
at Wake County Restaurants/Food Stands January—March 2012
*CDC Risk Factors
Items 1-5: Poor Personal
Hygiene
Items 6-9: Food from
Unsafe Source
Items 10-12: Cross
Contamination/
Contaminated Equipment
Item 13: Final Cook
Time
Items 14-18: Holding/
Time-Temperature
Contact: Andre Pierce, Wake County Environmental Services 919-865-7440 [email protected]
E m e r g e n c y P r e p a r e d n e s s
During the first quarter of 2012, the Wake County Strategic National Stockpile (SNS) Plan was
completely re-written to comply with the CDC Technical Analysis Review (TAR) of such plans.
The SNS Plan provides information on how to request the CDC stockpile of medications and support
equipment during a biological incident, how the materials are to be received and how the materials
are to be distributed to the entire population of Wake County within a 48 hour “window”. The
previous Wake County SNS Plan was an “operational” plan which did not meet the requirements of
the current CDC TAR. The re-write provides extensive details about actions to be taken should the
SNS be required in Wake County and many details on possible scenarios for medication distribution
to the population of Wake County in the event a terrorist incident.
Contact: Brian McFeaters, Public Health Emergency Preparedness Section 919-212-9394 [email protected]
STRATEGIC NATIONAL STOCKPILE PLAN
"Critical Violation Risk Factors” are those that increase the chance of developing food-borne illness
and are categorized by CDC as poor personal hygiene (1-5), food from unsafe source (6-9), cross
contamination/contaminated equipment (10-12), inadequate final cook temperature (13), improper
holding/time-temperatures (14-18). Figure 10 shows that most of the critical violations involved
cross contamination of foods and contaminated equipment.

14 14
Sexually Transmitted Infections (STIs)
Table 3
The number of cases reported from Wake County to the NC Division of Public Health for calendar
year 2010 to 2011 decreased for syphilis (9.5%) and HIV/AIDS ( 12.6%) but increased for gonorrhea
(8.5%) and chlamydia (5%). New cases reported from January to March 2012 were syphilis (18),
HIV/AIDS (59), gonorrhea (326) and chlamydia (1062).
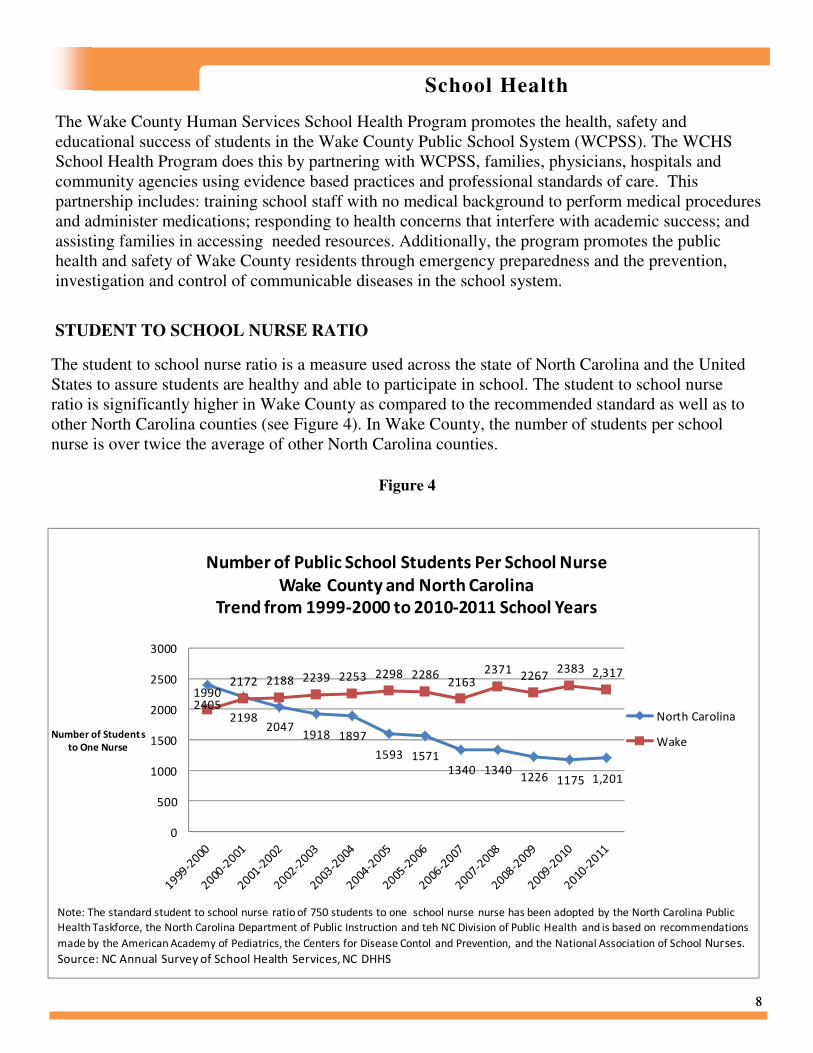
Testing services for HIV, syphilis, chlamydia, gonorrhea, and hepatitis C are integrated by offering
simultaneously to clients at community as well as clinical testing sites. Integrated testing increases
detection and treatment of all STIs in high risk populations. This enhanced testing is made possible
through the CDC Program Collaboration and Service Integration (PCSI) and other grant funding.
Tables 3, 4, and 5 show the number of tests performed at community sites and the positivity test rates
for HIV, syphilis, gonorrhea, chlamydia and hepatitis C comparing October thru December 2011 to
January thru March 2012.
Number of Tests and Test Posi=vity Rate (%) at Non-Tradi=onal Tes=ng Sites in Wake
October-December 2011 January- March 2012
Test Number Tested % Posi>ve Number Tested % Posi>ve
HIV 500 9.6 743 13.5
Syphilis 682 0.1 737 0
Gonorrhea 500 1.4 511 1.4
Chlamydia 680 0.4 511 9.2
Hepa>>s C 39 12.8 90 13.3
Data Source: Wake County Human Services HIV/STD Community Program
INTEGRATED TESTING SERVICES
Non-traditional testing sides are community locations where HIV/STD counseling and testing
services would not customarily be provided (churches, shelters, colleges, and universities).
15 15
Sexually Transmitted Infections (STIs)
Number of Tests and Test Posi=vity Rate (%) at Substance Abuse Centers in Wake County
October -December 2011 January -March 2012
Test Number Tested % Posi>ve Number Tested % posi>ve
HIV 90 0 86 0
Syphilis 91 0 86 0
Gonorrhea 61 0 63 0
Chlamydia 61 0 63 1.6
Hepa>>s C 76 15.8 48 21
Data Source: Wake County Human Services HIV/STD Community Program
Number of Tests and Test Posi=vity Rate (%) at Expanded Tes=ng Sites* in Wake County
October -December 2011 January -March 2012
Test Number Tested % Posi>ve Number Tested % Posi>ve
HIV 406 6.9 406 0.2
Syphilis 407 2 406 3.2
Gonorrhea 406 2.5 405 2.7
Chlamydia 406 6.9 405 7.9
Hepa>>s C* 0 0 0 0
Data Source: Wake County Human Services HIV/STD Community Program
Table 4
Table 5
* Jails, detention. Hepatitis C testing is not offered at Expanded Testing Sites.
Contact: Yvonne Torres, HIV/STD Community Section 919-250-4479 [email protected]

16 16
Pregnancy Rates
PREGNANCY RATE FOR 15-19 YEAR OLDS IN WAKE COUNTY AND NORTH
CAROLINA
Figure 12
Figure 11
From 2006 to 2010, both North Carolina and Wake County saw their pregnancy rates for ages 15-17
and ages 18-19 decline (see Figures 11 and 12) .
23.321.9 22.6
19.4
18.6
35.1 34.832.5
30.1
26.4
0
5
10
15
20
25
30
35
40
2006 2007 2008 2009 2010
Rat
e P
er
10
00
Pregnancy Rate per 1,000 Age 15-17
Wake County and North Carolina 2006-2010
Wake
North Carolina
Source: North Carolina State Center for Health Statistics
72.8 75.7
64.4 63.3 59.5
101.3 101.693.1
83 81.6
0
20
40
60
80
100
120
2006 2007 2008 2009 2010
Rat
e P
er
10
00
Pregnancy Rate per 1,000 Age 18-19
Wake County and North Carolina 2006-2010
Wake
North
Carolina
Source: North Carolina State Center for Health Statistics
17 17
Figure 13
Pregnancy Rates
PREGNANCY RATE FOR 15-19 YEAR OLDS IN WAKE COUNTY BY RACE AND
ETHNICITY
Figure 14
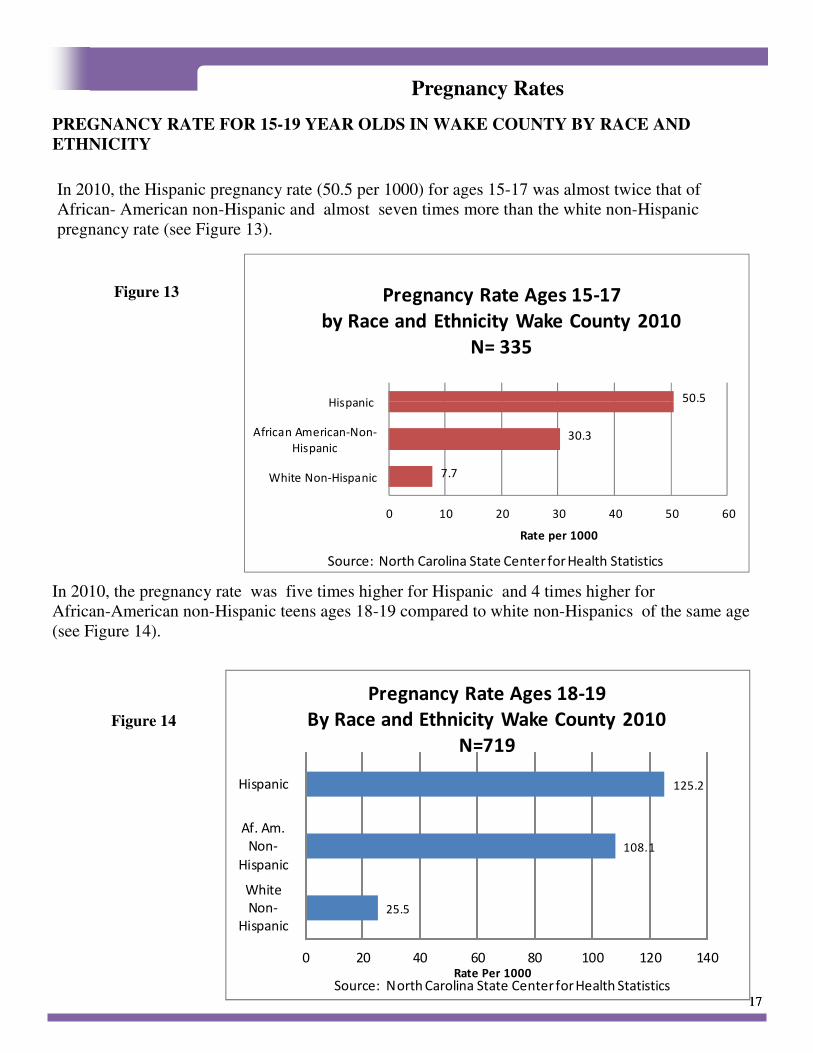
In 2010, the Hispanic pregnancy rate (50.5 per 1000) for ages 15-17 was almost twice that of
African- American non-Hispanic and almost seven times more than the white non-Hispanic
pregnancy rate (see Figure 13).
In 2010, the pregnancy rate was five times higher for Hispanic and 4 times higher for
African-American non-Hispanic teens ages 18-19 compared to white non-Hispanics of the same age
(see Figure 14).
25.5
108.1
125.2
0 20 40 60 80 100 120 140
White
Non-
Hispanic
Af. Am.
Non-
Hispanic
Hispanic
Rate Per 1000
Pregnancy Rate Ages 18-19
By Race and Ethnicity Wake County 2010
N=719
Source: North Carolina State Center for Health Statistics
7.7
30.3
50.5
0 10 20 30 40 50 60
White Non-Hispanic
African American-Non-
Hispanic
Hispanic
Rate per 1000
Pregnancy Rate Ages 15-17
by Race and Ethnicity Wake County 2010
N= 335
Source: North Carolina State Center for Health Statistics

18 18
Figure
Pregnancy Rates
WAKE COUNTY HUMAN SERVICES PRENATAL CLIENTS BY AGE 2009-2011
The Wake County Human Services Prenatal Clinic served more teens each year from 2009-2011 (see
Figure 15).
0
20
40
60
80
100
120
140
160
2009 2010 2011
0 08
26
188
17
51
25
53
80
57
98
157
Unduplicated Number
Calendar Year
Number Of Prenatal Clients Ages 15 - 19
Wake County Human Services 2009-2011
Age 15
Age 16
Age 17
Age 18
Age 19
Figure 15
Contact: Roxanne Deter, Public Health Division 919-250-4637 [email protected]
Source: Wake County Human Services Patient Care Management System.

19 19
Healthy North Carolina 2020 Objectives
Tobacco Use Current 2020 Target
1. Decrease the percentage of adults who are current smokers 20.3% (2009) 13.0%
2. Decrease the percentage of high school students reporting current use of any tobacco
product
25.8% (2009) 15.0%
3. Decrease the percentage of people exposed to secondhand smoke in the workplace in
the past seven days
14.6% (2008) 0%
Physical Activity and Nutrition Current 2020 Target
1. Increase the percentage of high school students who are neither overweight nor obese 72.0% (2009) 79.2%
2. Increase the percentage of adults getting the recommended amount of physical activity 46.4% (2009) 60.6%
3. Increase the percentage of adults who consume five or more servings of fruits and
vegetables per day
20.6% (2009) 29.3%
Injury and Violence Current 2020 Target
1. Reduce the unintentional poisoning mortality rate (per 100,000) population 11.0 (2008) 9.9
2. Reduce the unintentional falls mortality rate (per 100,000) population 8.1 (2008) 5.3
3. Reduce the homicide rate (per 100,00) population 7.5 (2008) 6.7
Maternal and Infant Health Current 2020 Target
1. Reduce the infant mortality racial disparity between whites and African Americans 2.45 (2008) 1.92
2. Reduce the infant mortality rate (per 1,000 live births) 8.2 (2008) 6.3
3. Reduce the percentage of women who smoke during pregnancy 10.4% (2008) 6.8%
Sexually Transmitted Diseases and Unintended Pregnancy Current 2020 Target
1. Decrease the percentage of pregnancies that are unintended 39.8% (2007) 30.9%
2. Reduce the percentage of positive results among individuals aged 15 to 24 tested for
chlamydia
9.7% (2009) 8.7%
3. Reduce the rate of new HIV infection diagnoses (per 100,000) population 24.7% (2008) 22.2
Substance Abuse Current 2020 Target
1. Reduce the percentage of high school students who had alcohol on one or more of the
past 30 days
35.0% (2009) 26.4%
2. Reduce the percentage of traffic crashes that are alcohol-related 5.7% (2008) 4.7%
3. Reduce the percentage of individuals aged 12 years and older reporting any illicit drug
use in the past 30 days.
7.8%
(2007-2008)
6.6%
Every ten years since 1990, the state of North Carolina sets objectives aimed at improving the health of North
Carolinians. Below are the objectives that are set for the year 2020 organized by focus area. The Wake
County Human Services Public Health Report is organized to align with selected Healthy North Carolina
2020 Focus Areas and Objectives For more information about North Carolina’s health objectives and how
they are decided, visit the North Carolina Division of Public Health web page at http://publichealth.nc.gov/
hnc2020/objectives.htm.

20 20
Mental Health Current 2020 Target
1. Reduce the suicide rate (per 100,000 population) 12.4 (2008) 8.3
2. Decrease the average number of poor mental health days among adults in the past 30
days
3.4 (2008) 2.8
3. Reduce the rate of mental health related visits to emergency departments (per 100,000)
population
92.0 (2008) 82.8
Oral Health Current 2020 Target
1. Increase the percentage of children aged 1-5 years enrolled in Medicaid who receive
any dental service during the previous 12 months
46.9% (2008) 56.4%
2. Decrease the average number of decayed, missing or filled teeth among kindergartners 1.5 (2008-09) 1.1
3. Decrease the percentage of adults who have had permanent teeth removed due to tooth
decay or gum disease
47.8% (2008) 38.4%
Environmental Health Current 2020 Target
1. Increase the percentage of air monitor sites meeting the current ozone standard of 0.075
ppm
62.5%
(2007-09)
100.0%
2. Increase the percentage of the population being served by community water systems
(CWS) with no maximum contaminant level violations (among persons on CWS)
92.2% (2009) 95.0%
3. Reduce the mortality rate from work-related injuries (per 100,000 equivalent full time
workers )
3.9 (2008) 3.5
Infectious Disease and Foodborne Illness Current 2020 Target
1. Increase the percentage of children aged 19-35 months who receive the recommended
vaccines.
77.3% (2007) 91.3%
2. Reduce the pneumonia and influenza mortality rate (per 100,000 population) 19.5% (2008) 13.5%
3. Decrease the average number of critical violations per restaurant/food stand 6.1 (2009) 5.5
Social Determinants of Health Current 2020 Target
1. Decrease the percentage of individuals living in poverty 16.9% (2009) 12.5%
2. Increase the four year high school graduation rate 71.8%
(2008-09)
94.6%
3. Decrease the percentage of people spending more than 30% of their income on rental
housing
41.8% (2008) 36.1%
Chronic Disease Current 2020 Target
1. Reduce the cardiovascular disease mortality rate (per 100,000 population) 256.6 (2008) 161.5
2. Decrease the percentage of adults with diabetes 9.6% (2009) 8.6%
3. Reduce the colorectal cancer mortality rate (per 100,000 population) 15.7 (2008) 10.1
Cross Cutting Current 2020 Target
1. Increase average life expectancy (years) 77.5 (2008) 79.5
2. Increase the percentage of adults reporting good, very good, or excellent health 81.9% (2009) 90.1%
3. Reduce the percentage of non-elderly uninsured individuals (aged less than 65 years) 20.4% (2009) 8.0%
4. Increase the percentage of adults who are neither overweight nor obese 34.6% (2009) 38.1%

21 21
We wish to thank all staff for their daily efforts toward improving the health and safety of the citizens
of Wake County.
Contributors to this Public Health Quarterly Report are:
Edie Alfano-Sobsey
Roxanne Deter
JoAnn Douglas
Brian McFeaters
Andre Pierce
Michelle Ricci
Ronda Sanders
Ramsay Hoke
Yvonne Torres
May 18, 2012
A c k n o w l e d g e m e n t s