Embed Size (px)
Citation preview

Public Health & Particulate MatterPublic Health & Particulate Matter
Columbus / Palomas Columbus / Palomas Air Quality StudyAir Quality Study
Thomas Ruiz, M.S.Thomas Ruiz, M.S.Border / Environmental Justice LiaisonBorder / Environmental Justice Liaison
New Mexico Environment Department– Office of the SecretaryNew Mexico Environment Department– Office of the Secretary

This PresentationThis Presentation
Public health and particulate matter (PM)Public health and particulate matter (PM)– Health effects from elevated PMHealth effects from elevated PM– Recent findingsRecent findings
Columbus / Palomas Air Monitoring StudyColumbus / Palomas Air Monitoring Study– Project reviewProject review– Presentation of data (1-year)Presentation of data (1-year)– Implications of this studyImplications of this study

Target Organ: LungsTarget Organ: Lungs
PM10 is among the PM10 is among the most harmful of all air most harmful of all air pollutants.pollutants.
When inhaled these When inhaled these particles evade the particles evade the respiratory system's respiratory system's natural defenses and natural defenses and lodge deep in the lungs.lodge deep in the lungs.

Serious Health Effects from PM10Serious Health Effects from PM10


Who is at risk in New Mexico?Who is at risk in New Mexico?
Mesilla Valley Inn

Pregnant Women & Particulate Matter Pregnant Women & Particulate Matter Latzin, et al University of Bern - 2008Latzin, et al University of Bern - 2008
Study and FindingsStudy and Findings– Focused on maternal exposure to PM10 and Focused on maternal exposure to PM10 and
distances from their residence to major roads distances from their residence to major roads during pregnancy.during pregnancy.
– Pregnant women exposed to high levels of Pregnant women exposed to high levels of PM10 have increased risk of giving birth to PM10 have increased risk of giving birth to infants with compromised respiratory status.infants with compromised respiratory status.
– Worse degree of respiratory illness in infants Worse degree of respiratory illness in infants whose mothers lived less than 150 meters whose mothers lived less than 150 meters from a major road and when mother was from a major road and when mother was exposed during third trimester exposed during third trimester
– (Reuters Health Information – November 2008)(Reuters Health Information – November 2008)

Air Quality Monitoring and School Absenteeism Air Quality Monitoring and School Absenteeism in the Columbus- Palomas, Mexico Regionin the Columbus- Palomas, Mexico Region
Larry Olsen, Dr.P.H., CHES, Larry Olsen, Dr.P.H., CHES, Principal InvestigatorPrincipal Investigator
Mohammed Y. Hussain, PhD, Mohammed Y. Hussain, PhD, Program ManagerProgram Manager
Thomas Ruiz, MS, Thomas Ruiz, MS, Co-Principal InvestigatorCo-Principal Investigator
Sonya Andron, MPH,Sonya Andron, MPH,Co-Principal InvestigatorCo-Principal Investigator
Daniel Galindo, MS,Daniel Galindo, MS,Field CoordinatorField Coordinator
Hugo Vilchis, MD, MPHHugo Vilchis, MD, MPH

ResearchResearch
Funded by the Southwest Consortium for Environmental Research Funded by the Southwest Consortium for Environmental Research Policy (SCERP)Policy (SCERP)– $58,000 grant awarded$58,000 grant awarded– Based on community EH prioritiesBased on community EH priorities
Binational studyBinational study
Record every 6 days for 12 monthsRecord every 6 days for 12 months
Air quality awareness and educationAir quality awareness and education
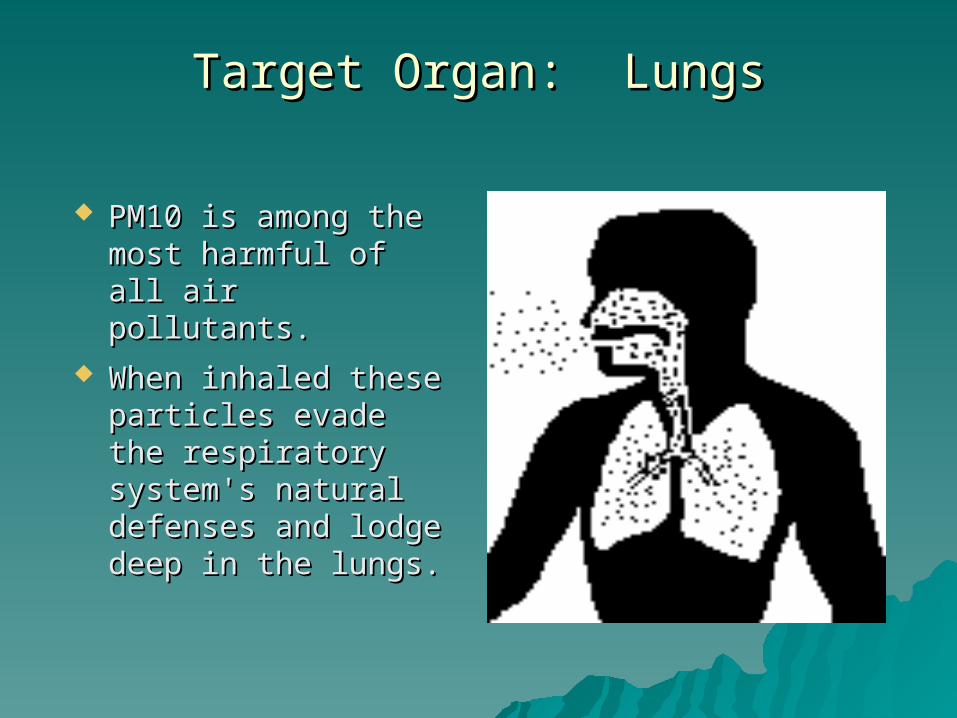
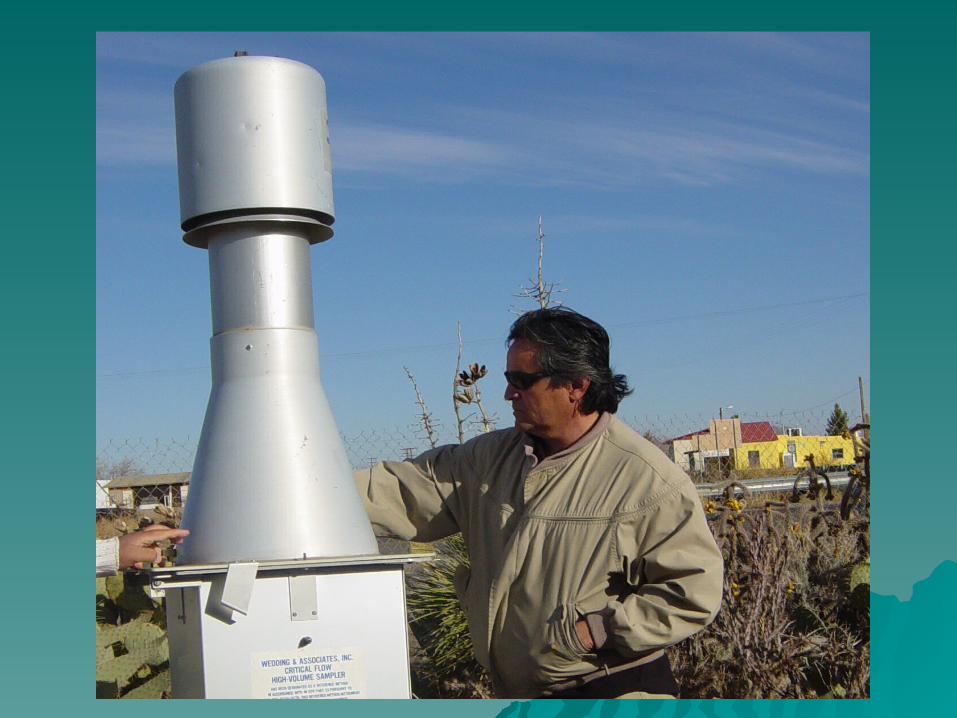
Two PM10 air monitors and one PM2.5 monitorTwo PM10 air monitors and one PM2.5 monitor


PM10 Concentration at Two SitesPM10 Concentration at Two Sites
0
200
400
600
800
1000
1200
8/27/2005
9/1/2005
9/7/2005
9/13/2005
9/19/2005
9/25/2005
10/1/2005
10/7/2005
10/13/2005
10/20/2005
10/26/2005
10/31/2005
11/6/2005
11/12/2005
11/24/2005
11/30/2005
12/6/2005
12/12/2005
12/18/2005
PM10 at Columbus(NM,USA), Palomos(Mexico) Vs. EPA-Standard: August-December 2005
Colpm10Palpm10
EPA_STD

PM10 Concentration at Two SitesPM10 Concentration at Two Sites
0
200
400
600
800
1000
1200
1400
1/1/2006
1/11/2006
1/17/2006
1/23/2006
1/29/2006
2/4/2006
2/10/2006
2/16/2006
2/22/2006
2/28/2006
3/6/2006
3/12/2006
3/18/2006
3/24/2006
3/31/2006
4/5/2006
PM10 at Columbus(NM,USA), Palomos(Mexico) Vs. EPA-Standard: January to March 2006
Colpm10Palpm10
EPA_STD

PM10 Concentration at Two SitesPM10 Concentration at Two Sites
0
200
400
600
800
1000
1200
1400
4/5/2006
4/12/2006
4/18/2006
4/23/2006
4/29/2006
5/6/2006
5/11/2006
5/17/2006
5/23/2006
5/28/2006
6/4/2006
6/13/2006
6/16/2006
6/27/2006
7/4/2006
7/11/2006
7/16/2006
7/22/2006
7/28/2006
8/4/2006
8/8/2006
5/11/2006
PM10 at Columbus(NM,USA), Palomos(Mexico) Vs. EPA-Standard: April to August 2006
Colpm10Palpm10
EPA_STD

PM10 Concentration at Two Sites – PM10 Concentration at Two Sites – One Year SummaryOne Year Summary
0
200
400
600
800
1000
1200
1400
09
-01
-05
09
-07
-05
09
-13
-05
09
-19
-05
09
-25
-05
10
-01
-05
10
-07
-05
10
-13
-05
10
-26
-05
10
-31
-05
11
-06
-05
11
-12
-05
11
-24
-05
11
-30
-05
12
-06
-05
12
-12
-05
12
-18
-05
01
-05
-06
1-1
1-0
60
1-1
7-0
60
1-2
3-0
60
1-2
9-0
60
2-0
4-0
60
2-1
0-0
60
2-1
6-0
60
2-2
2-0
60
2-2
8-0
63
- 6-0
60
3-1
2-0
60
3-1
8-0
60
3-2
4-0
60
3-3
1-0
60
4-0
5-0
60
4-1
2-0
60
4-1
8-0
60
4-2
3-0
60
5-0
6-0
60
4-2
9-0
60
5-1
1-0
60
5-1
7-0
60
5-2
3-0
60
5-2
8-0
60
6-0
4-0
60
6-1
3-0
60
6-1
6-0
60
6-2
7-0
60
7-0
4-0
60
7-1
1-0
60
7-1
6-0
60
7-2
2-0
60
7-2
8-0
60
8-0
4-0
60
8-0
8-0
60
8-1
5-0
60
8-2
1-0
6
Concentration of PM10 (ugm^3) at Palomas, Mexico-USA Mexican Border School over time
pm10_1pm10_2
epa

PM2.5 ConcentrationPM2.5 ConcentrationColumbus (INS Inspection Station), New Mexico
Columbus Inspection Station: PM 2.5 vs EPA Standard(65 ug/m^3)
0
20
40
60
80
100
120
140
11/2
3/20
0511
/24/
2005
11/2
5/20
0511
/26/
2005
11/2
7/20
0511
/28/
2005
11/2
9/20
0511
/30/
2005
12/1
/200
512
/2/2
005
12/3
/200
512
/4/2
005
12/5
/200
512
/6/2
005
12/7
/200
512
/8/2
005
12/9
/200
512
/10/
2005
12/1
1/20
0512
/12/
2005
12/1
3/20
0512
/14/
2005
12/1
5/20
0512
/16/
2005
12/1
7/20
0512
/18/
2005
12/1
9/20
0512
/20/
2005
12/2
1/20
0512
/22/
2005
12/2
3/20
0512
/24/
2005
12/2
5/20
0512
/26/
2005
12/2
7/20
0512
/28/
2005
12/2
9/20
0512
/30/
2005
12/3
1/20
05
November & December 2005
Conc
entra
tion
(ug/
m^3
)
Mass
EPA_STD

PM2.5 ConcentrationPM2.5 ConcentrationColumbus (INS Inspection Station), New Mexico
Columbus, NM (USA): PM 2.5 Mass vs. EPA Standard(65 ug/m^3)
0
20
40
60
80
100
120
January 2006
Con
cent
ratio
n (u
g/m
^3)
Mass
EPA_STD

Observations w/ Respect to WindObservations w/ Respect to Wind
Based on Santa Teresa wind data:Based on Santa Teresa wind data:– Most of the exceedances in Palomas Most of the exceedances in Palomas
were low wind events (<20 mph)were low wind events (<20 mph)High wind event is >18 m/s or 40 mphHigh wind event is >18 m/s or 40 mphAs reported to EPA under the NEAPAs reported to EPA under the NEAP
– Days with exceedances in Palomas had Days with exceedances in Palomas had gusts up to 20 mph.gusts up to 20 mph.
– PM2.5 exceedances at Port of Entry PM2.5 exceedances at Port of Entry could be linked to traffic flowcould be linked to traffic flow Increased around holidaysIncreased around holidays

Relevance of this WorkRelevance of this Work
Increase in monitoring to complete picture of the border Increase in monitoring to complete picture of the border areaarea
Modeling of weather related phenomenon such as high Modeling of weather related phenomenon such as high wind dayswind days
University researchUniversity research
Public informationPublic information
Health studiesHealth studies

Future WorkFuture Work
E-BAM study (possible)E-BAM study (possible)– Commenced in Sunland Park, Commenced in Sunland Park,
NM and Anapra, MX in NM and Anapra, MX in October ’08October ’08
– Continuous samplingContinuous sampling– Real-time accurate results Real-time accurate results
Tree plantingTree planting– Trees provided by NMEDTrees provided by NMED– Successful in Anapra (US and Successful in Anapra (US and
Mexico)Mexico)
Contact InformationContact Information
Thomas Ruiz, M.SThomas Ruiz, M.SBorder / Environmental Justice LiaisonBorder / Environmental Justice Liaison
New Mexico Environment DepartmentNew Mexico Environment Department
Office of the SecretaryOffice of the Secretary
(575) 528-6029(575) 528-6029
[email protected]@state.nm.us