Embed Size (px)
Citation preview

Public Health Insurance Expansions and Hospital Technology Adoption*
Seth Freedman
Indiana University Haizhen Lin
Indiana University
Kosali Simon
Indiana University and NBER
December 14, 2012
Abstract: This paper explores the effects of public health insurance expansions on hospitals’ decisions to
adopt medical technology. Specifically, we test whether the expansion of Medicaid eligibility for
pregnant women during the 1980s and 1990s affects hospitals’ decisions to adopt neonatal intensive care
units (NICUs). While the Medicaid expansion provided new insurance to a substantial number of
pregnant women, prior literature also finds that some newly insured women would otherwise have been
covered by more generously reimbursed private sources. This leads to a theoretically ambiguous net
effect of Medicaid expansion on a hospital’s incentive to invest in technology. Using American Hospital
Association data, we find that on average, Medicaid expansions have no statistically significant effects on
NICU adoption. However, we find that in geographic areas where more of the newly Medicaid-insured
may have come from the privately insured population, Medicaid expansion slows NICU adoption. This
holds true particularly when Medicaid payment rates are very low relative to private payment rates. This
finding is consistent with prior evidence on reduced NICU adoption from increased managed care
penetration. We conclude by providing suggestive evidence on the health impacts of this deceleration of
NICU diffusion, and by discussing the policy implications of our work for insurance expansions
associated with the Affordable Care Act.
* Acknowledgments: We are grateful to Jean Roth for assistance with the American Hospital Association data.
Freedman thanks the Robert Wood Johnson Foundation (RWJF) for funding support. We also thank Jill Horwitz,
Sam Kleiner, Tim Moore, Edward Norton, Jeff Prince, conference participants at the 2011 Association of Public
Policy Analysis and Management (APPAM), 2012 American Economic Association (AEA), 2012 American Society
of Health Economists (ASHEcon), and RWJ Scholars Program meetings, and seminar participants at George
Washington University and University of Chicago for helpful comments and suggestions.

2
1. Introduction
The development and diffusion of medical technology has been a primary driver of health care
cost growth during recent decades (Newhouse 1992; Fuchs 1996; Cutler 2005). Since the 1960s there
have also been dramatic changes in the U.S. health insurance landscape. Due in part to growth in private
insurance, the introduction of Medicare and Medicaid, and subsequent expansions of the Medicaid
program, 84 percent of Americans had health insurance in 2011(DeNavas-Walt et al. 2012). Weisbrod
(1991) argues that technology advancement and insurance expansion are intimately linked: the
availability of expensive, lifesaving technology increases consumer demand for health insurance, and the
ability of patients to pay for expensive medical care with insurance increases the incentives to produce
and adopt new medical technology. Given this theoretical endogeneity, empirically estimating the effect
of one on the other is difficult. Finkelstein (2007) finds convincing evidence that the introduction of
Medicare drastically increased hospital spending above and beyond what would be predicted using patient
demand elasticities implied by the RAND Health Insurance Experiment, suggesting additional supply-
side responses on the part of hospitals. She provides evidence that some of this additional supply side
response may be due to technology adoption by hospitals, but this finding is only suggestive as a result of
data limitations during the period she studies.2
In this paper we exploit exogenous changes in Medicaid eligibility to directly estimate the causal
effect of the availability of public health insurance on technology adoption by hospitals. In addition to
providing the first direct empirical evidence of hospital technology adoption reactions to health insurance
expansions in the U.S., studying supplier responses to Medicaid expansions fills an important gap in the
literature. First, Medicaid covered about 20 percent of all Americans in 2010 and accounted for about 15
percent of national health care spending (DeNavas-Walt et al. 2012; Kaiser 2012). For this reason it is
important to understand the ways in which hospitals respond to Medicaid expansions especially as these
hospital responses may be very different from their responses to Medicare. Medicaid pays providers much
2 Chou, Liu, and Hammitt (2004) find that the introduction of national health insurance in Taiwan also increased
hospitals’ adoption of medical technology.

3
less than Medicare (Norton and Zuckerman, 2000), thus possibly leading to different supply-side
reactions. Additionally, some new Medicaid enrollees might have otherwise held private coverage, and
therefore the Medicaid expansion may not unambiguously increase the financial incentives faced by
hospitals because Medicaid reimburses less generously than private insurance. The proliferation of
managed care, which also decreased hospitals’ financial incentives for investment in technology, has been
found to slow adoption (Baker 2001; Baker and Phibbs 2002). These previous findings are consistent with
Weisbrod’s (1991) hypothesis that the effect of insurance on technology adoption will depend on how
that insurer pays; while Medicare caused a large shift out in the demand curve for medical care, managed
care reduced patient and physician incentives for utilizing technology, and health care providers
responded by changing their technology adoption decisions. These findings are also consistent with
Chandra and Skinner’s (2011) model of productivity growth in health care, in which insurance impacts
the extent and type of technology diffusion through both patient and provider incentives. Theoretically,
the effects of Medicaid may fall somewhere in between those of Medicare and managed care.
Another reason for understanding the supply-side effects of past Medicaid expansions is the
scheduled expansion of the program under the Affordable Care Act. Starting in 2014 or earlier and at state
discretion, Medicaid programs will be open to all non-elderly adults in families with incomes less than
138 percent of the federal poverty level, which amounted to about $30,000 for a family of four in 2010.
This expansion is projected to insure a total of 17 million individuals (Congressional Budget Office
2011). As the existing literature on Medicare and managed care expansions may not be adequate for
understanding the possible technology adoption consequences of future Medicaid expansions, our
research addresses this need by examining the effects of past Medicaid expansions.
In this paper, we examine the supply-side reaction to public insurance expansion in terms of
hospital neonatal care intensive unit (NICU) adoption. We provide evidence from a period of substantial
Medicaid eligibility expansion among low-income pregnant women, examining hospitals’ decisions to
adopt a form of technology that appeals directly to patients undergoing childbirth. From 1985 to 1996,
Medicaid coverage of deliveries increased by 18 percent due to the expansion of Medicaid eligibility

4
alone (Dave et al. 2011). While Medicaid expansions insured a substantial number of otherwise-uninsured
pregnant women, some newly covered women came from the rolls of private sources that are more
generous in their reimbursements. Dave at al. (2011) and Dubay and Kenney (1997) both find private
insurance crowd-out estimates close to 50 percent for groups affected by Medicaid expansions. It is
important to note that while Medicaid imposes lower cost sharing for pregnant patients than private
insurance,3 from the provider perspective Medicaid is less generous than private insurers (Currie et al.
1995). As a result, the net effect of Medicaid expansion on hospitals’ incentives to invest in technology is
ambiguous, since Medicaid provides new insurance for some patients and a substitute for private
insurance for other patients.
The literature on the supply-side responses to public insurance expansions is relatively sparse
compared to the literature that estimates the demand-side responses to expansions. Except for
Finkelstein’s (2007) examination of hospital expenditures, the supply-side literature has focused on
innovation rather than provider-level decisions. Acemoglu et al. (2006) find that the introduction of
Medicare for non-prescription-drug health care in 1965 did not increase demand for new prescription
drugs enough to result in pharmaceutical innovation. However, according to Blume-Kohout and Sood
(2008), pharmaceutical research and development accelerated when Medicare began covering outpatient
prescription drugs through Part D. Finkelstein (2004) finds that public health initiatives, including
Medicare coverage of influenza vaccines, led to increased vaccine-related clinical trials. Clemens (2012)
finds increased medical equipment patenting in response to the introduction of Medicare and Medicaid.
While others have found that insurance expansions spur innovation overall, Hult and Philipson
(2012) point out that returns to innovation should be non-monotonic as public insurance eligibility
expands through the income distribution. On one hand, eligibility expansions increase demand for care,
and this effect is likely to be particularly strong at the low end of the income distribution. On the other
hand, eligibility expansions at higher levels of income are less likely to impact demand and likely to result
in lower payments rates to providers than previous sources of payment held by higher income individuals.
3 As Gruber (2008) puts it, Medicaid “provides the best insurance money can’t buy.”

5
While the Medicaid expansions we study still affect relatively low-income populations, if Medicaid
replaces higher-reimbursing private coverage for some individuals, the expansion may have a limited or
even negative net impact on hospitals incentives to invest in new technologies.
In terms of provider behavior, a set of papers have examined the impact of Medicaid fees on the
amount of time physicians spend with patients and the setting in which care occurs (Decker 2007, 2009),
but we are aware of only one paper that studies supply-side responses to eligibility expansions:
Garthwaite (2011) studies physicians’ labor-supply responses to Children’s Health Insurance Program
(CHIP) expansions. Research on other supply-side responses to Medicaid expansion such as investments
in new facilities or technology adoption is needed, since technology diffusion has been a major driver of
health care cost growth (Newhouse 1992; Fuchs 1996; Cutler 2005).
We proceed in this paper by first developing an analytical model to illustrate the ways in which
hospitals’ NICU adoption decisions might change following Medicaid eligibility expansions. We consider
both the insurance expansion effect and the Medicaid crowd-out effect and conclude that the impact of
Medicaid expansion on NICU adoption is ambiguous and depends on which of these two effects
dominates. We also draw guidance from this model to help us empirically distinguish between these two
effects based on how the eligibility expansion interacts with local market characteristics, such as the
community’s pre-expansion uninsurance rate and reimbursement ratios between private and Medicaid
patients.
In our empirical analysis we use data for 1985 to 1996 from the American Hospital Association
(AHA), covering virtually all hospitals in the U.S., and consider changes in Medicaid eligibility over time
and across states for pregnant women. We find that on average, state-level Medicaid expansions have no
effect on the likelihood that a hospital will offer a NICU. However, this effect varies greatly across
hospitals according to certain socioeconomic characteristics of their state and county which plausibly
proxy for variation in private insurance prevalence absent the Medicaid expansions. Our results indicate
that Medicaid expansion slows NICU diffusion in areas where we expect crowd-out to be strongest. We
find that this result of slower NICU diffusion is driven by states in which the Medicaid reimbursement

6
generosity is lowest. In these states, we expect the crowd-out of public coverage to have the largest
negative impact on incentives to profitably invest in technology designed to attract maternal deliveries.
Although it is reasonable to expect a positive effect on NICU adoption in areas where the
insurance expansion effect is likely to dominate the Medicaid crowd-out effect, we find little evidence of
acceleration. In areas where we expect relatively less crowd-out, we find no impact of eligibility changes
on NICU provision, except in areas with extremely high pre-expansion uninsurance rates. Even in states
with Medicaid payment rates closer to private levels and low expected crowd-out, we do not find
evidence of increased NICU adoption. We conclude our paper by providing suggestive evidence on the
health impact of the deceleration of NICU diffusion in certain regions and by discussing the policy
implications of our findings. Because scheduled upcoming Medicaid expansions are not identical in
nature to these past expansions, our findings also underline the need to continue studying the impact of
insurance expansions on technology adoption under the ACA.
2. Background
A. The Medicaid Expansions
When Medicaid commenced in 1965, coverage for pregnancy-related costs initially applied only
to single mothers receiving welfare benefits, but the program expanded rapidly over the 1980s and 1990s.
Eligibility for Medicaid was decoupled from welfare eligibility, and states were given the option to
provide Medicaid for pregnant women under 100 percent of the federal poverty line in 1987 and then up
to 185 percent of the federal poverty line in 1988, while still receiving federal matching funds. In 1990
the federal government mandated all states to provide Medicaid to pregnant women in families earning
less than 133 percent of the federal poverty line. The percentage of deliveries covered by Medicaid rose
from 19.5 percent in 1985 to 35.2 percent in 1996, while uninsured deliveries fell from 13.7 percent to 4.1
percent (Dave et al. 2011). The prevalence of Medicaid eligibility is roughly similar for mothers who are
more and less likely to need neonatal intensive care services for their infants. In 2001, 41.9 percent of
preterm and low-birth-weight infants were covered by Medicaid and 5.3 percent lacked insurance, while

7
the corresponding percentages for uncomplicated newborns were 37.5 percent and 5.4 percent (Russell et
al. 2007).
While these Medicaid expansions extended coverage to many previously uninsured individuals,
about a quarter to a half of the increased Medicaid coverage has been attributed to crowd-out, in which
individuals who would otherwise be privately insured take up public coverage (Cutler and Gruber 1996;
Congressional Budget Office 2007). Dave et al. (2011) focus specifically on pregnant women and find a
crowd-out rate of about 55 percent among those affected at the margin. Dubay and Kenney (1997) find a
crowd-out rate of 45 percent for the marginal pregnant women made eligible by the expansions. Because
many new Medicaid enrollees came from the privately insured population, it is also important to consider
relative reimbursement rates. Medicaid payment rates are generally less generous than private rates; thus
from the provider’s perspective the Medicaid expansions may be more similar to managed care
proliferation than to Medicare expansion in terms of the changing profitability of their patient pool.
B. Neonatal Intensive Care
Neonatal intensive care is an important policy context in which to examine technology adoption
during the 1980s and 1990s, and it provides an example of a technology that is particularly relevant to the
population newly covered by the Medicaid expansions studied in this paper. Like many medical
technologies, NICUs have significantly improved health outcomes on average (Cutler and Meara 2000);
however, it is unclear if the recent NICU diffusion has been optimal from a standpoint of maximizing
health benefits and minimizing costs. Early development of NICUs was concentrated in large, regional
and typically academic hospitals. In the 1980s and 1990s diffusion greatly accelerated; between 1980 and
1996, the number of NICUs almost tripled, with most of the new units located in smaller, community
hospitals (Baker and Phibbs 2002).4 There is evidence that this diffusion exceeded medical need (Howell
4 Acemoglu and Finkelstein (2008) provide evidence that Medicare incentives may have been one contributing
factor in this diffusion. When Medicare transitioned to the Prospective Payment System (PPS) in 1983, it continued
reimbursing hospitals for capital expenditures retrospectively at cost. Acemoglu and Finkelstein (2008) find that this
policy change increased hospitals capital expenses relative to other operating expenses and actually spurred the
adoption of a range of technologies, including NICUs. While NICUs are rarely used by patients covered by
Medicare, they note that this effect may represent a spillover of the policy or the fact that hospitals had wide leeway

8
et al. 2002), that it has not correlated with geographic variation in infant health (Goodman et al. 2001),
and that it may lead to excessive utilization (Freedman 2011a). Organizations such as the March of Dimes
and the American Academy of Pediatrics have repeatedly advocated for a system in which NICU
resources are concentrated in larger, regional centers (Committee on Perinatal Health 1976, 1993;
Committee on Fetus and Newborn 2004).
In order to understand the impact of insurance on providers’ NICU adoption decisions, we briefly
discuss the two main reasons why hospitals generally choose to open NICUs. First, for sick infants who
would have been born in a hospital regardless of whether the hospital offered a NICU, insurance allows
hospitals the opportunity to continue treating them instead of transferring them to a different hospital that
does have a NICU.5 The profitability of treating infants in a NICU may vary by insurer, but in general
NICU reimbursement rates are relatively high (Horwitz 2005; online appendix).
Second, if pregnant women are more likely to choose hospitals that offer a NICU, a hospital may
adopt this technology in order to increase its market share of deliveries overall. Hospitals are limited in
their ability to be selected by patients on the basis of price, and this is especially true in the market for
deliveries, in which almost all patients are insured. Therefore, hospitals are more likely to compete on
non-price factors such as signals of quality, amenities, and service offerings (leading sometimes to a
“medical arms race” (Gaynor 2006)). Furthermore, it is thought that mothers are likely to return to the
same hospital for subsequent care of themselves and their families if they have a positive birth experience
(Friedman et al. 2002). As a result, providing a NICU may also act as a loss leader and generate
downstream profits in the future. In any given year, only about 10 percent of babies receive NICU
regarding which costs they attributed to Medicare. Medicare-related incentives may have partially spurred NICU
diffusion during the first half of the period we study here, but unless Medicaid eligibility expansions are correlated
with the state level importance of Medicare payments, they are not likely to confound our results. 5 Dor and Farley (1996) find that hospitals provide higher marginal cost treatment to patients with more generous
payment sources, suggesting that hospitals respond to the prospect of higher reimbursement by providing more
intensive treatments.

9
services (Schwartz et al. 2000). However, because most preterm labor is spontaneous and unpredictable,6
the existence of a NICU is likely to affect patients’ choice of obstetricians with admitting privileges to
such hospitals.7 Phibbs et al. (1993) find that the presence of a NICU is an important determinant in
patients’ hospital choice.
3. A Simple Model of Insurance Expansion and NICU Adoption
We motivate our empirical analysis with a simple model regarding a Medicaid expansion and a
hospital’s NICU adoption from which we generate testable empirical predictions.8 We assume that the
number of deliveries a hospital performs of each insurance type is characterized by ( ,
), where
equals 0 before Medicaid eligibility expansion and 1 after expansion, and the subscripts denote private
(P), Medicaid (M), and uninsured (U) patients. Medicaid changes the overall market patient mix by
allowing the previously uninsured to gain access to Medicaid coverage (the coverage expansion effect)
and by the crowd-out effect whereby some newly eligible patients switch from private insurance to
Medicaid; we expect that
,
and
. We assume that privately insured patients are
the most profitable and uninsured patients are the least profitable, with Medicaid patients falling in
between, and depending on a state’s Medicaid reimbursement generosity, i.e where
denotes the profitability of treating that patient. We simplify our model by assuming that these
profitability levels are not altered by Medicaid expansion itself. Actual data on public-private
reimbursement differentials specifically for neonatal intensive care are not available to the best of our
6 There are a variety of documented correlates of preterm delivery such as tobacco use, nutrition, stress, and
demographics, but there is in fact little understanding of what conditions and events can be used to predict and
diagnose preterm labor before it occurs (Behrman and Butler 2007). 7 An alternative model of demand could center on physicians and would result in similar implications. If physicians
choose a hospital at which to seek admitting privileges to maximize their utility, they might care about facilities to
the extent that they can provide better care for their patients, minimize malpractice risk, and attract more patients
who consider the delivery hospital in their physician choice. Therefore, adopting a NICU can attract more
physicians and, in turn, more patients. 8 Although a similar model could be used to study the reversal of adoption decision, in practice almost no hospitals
have divested themselves of NICUs during our time period. Technology abandonment is a relatively new concept in
the literature and is growing in importance because of the need to understand whether comparative effectiveness
research will translate to the abandonment of technology that is found to be inferior (e.g. Howard and Shen (2011)).

10
knowledge; however, we assemble data on Medicaid reimbursement to OB/GYNs for routine deliveries
and the associated prenatal care and note that these were on average 45 percent of private fees at the
beginning of our sample in 1985.9
In each period, a hospital decides whether to adopt a NICU if it does not already operate one,
knowing that after adopting it would attract ) privately insured,
) Medicaid, and
) uninsured patients, where ispositive.
10 Based on evidence that the elasticity of hospital
demand with respect to NICU availability differs by payer (e.g., Phibbs et al. 1993), it is reasonable to
assume that . NICU adoption in period t occurs if the increase in profitability from
attracting more patients outweighs the cost of adoption, i.e.
( ) (
) (1)
We assume that hospitals are purely profit driven, but all model predictions hold if we instead assume an
alternative object function determined by a weighted summation of profits and patient welfare, such as the
number of patients a hospital treats (see Sloan 2000; Horwitz and Nichols 2007). We assume the total
number of patients giving birth at a particular hospital does not change after Medicaid expansion so the
increase in the number of new Medicaid patients is equal to the total change in the private patient
population and the uninsured patient population,
. To understand how
Medicaid eligibility expansions change hospital incentives, we compare the difference in the net gain
associated with NICU adoption before and after Medicaid expansion:
( ) (
) ( )
(2)
9 In a report commissioned by the Health Care Financing Administration (the predecessor to the Centers of Medicare
and Medicaid) in the years following the initial Medicaid expansions, Serrato et al. (1991) expressed concern that
access to neonatal intensive care for Medicaid-covered infants could be limited because of low reimbursement rates
and prospective payment systems that did not fully capture the appropriate variation in the cost of care across
diagnosis related groups. 10
One implicit assumption that we make here is that hospitals can adjust their nursery bed capacity to meet the
increasing demand of pregnant women. Moreover, our results also hold if we allow to be negative, allowing
hospitals to avoid uninsured patients and attract more profitable patients (privately insured and Medicaid) after
NICU adoption.

11
The first expression on the right-hand side measures the decrease in profitability after the
Medicaid expansion due to the crowd-out effect, and the second expression measures the increase in
profits through the coverage expansion effect. If there is some level of crowd-out, the sign of this
expression is ambiguous, suggesting that Medicaid expansion could either slow down or speed up NICU
adoption. Assuming for simplicity that the profitability of treating uninsured patients is zero, i.e. ,
the above expression is negative (and Medicaid is likely to decelerate NICU adoption) if the following
inequality holds:
(3)
This inequality (3) is more likely to hold under the following conditions:
a. The market initial uninsurance rate, , is relatively small.
b. The level of crowd-out, (
), is high relative to the full increase in Medicaid eligibility,
(
.
c. The profitability ratio of Medicaid to private patients,
, is relatively small.
As suggested by the model, Medicaid expansion is likely to decelerate NICU adoption when the
pre-expansion uninsurance rate is low. The baseline uninsurance rate could also proxy for the likely level
of overall crowd-out and be useful in incorporating the insight from condition (b). In particular, we
hypothesize that in areas with larger pre-expansion uninsurance rates, Medicaid expansion is likely to
lead to a greater increase in overall insurance coverage, whereas markets with lower uninsurance would
likely see relatively greater numbers of privately insured individuals shift toward Medicaid coverage. As
additional proxies, we also expect crowd-out to be more prevalent when either the county-level
unemployment rate or the fraction of the county population living below the poverty line is lower.11
The
model also predicts that the relative profitability of treating patients of each payer type will play an
11
Baughman (2007) finds that the effect of Medicaid and CHIP expansions on children’s health insurance coverage
differs by local labor market conditions; for example, there are larger increases in overall insurance rates in markets
with higher unemployment rates.

12
important role in determining hospital responses to Medicaid expansion, thus we also examine how the
impact of expansions and potential crowd-out differ by the relative Medicaid fee generosity for a given
state.
4. Data
A. Hospital Data
We test our hypotheses regarding technology adoption using hospital-level data from the
American Hospital Association (AHA) Annual Survey of Hospitals from 1985 through 1996. The AHA
surveys all hospitals in the U.S., collecting information on service provisions and location. Our sample
includes non-Federal, acute care and children’s hospitals. As in Baker and Phibbs (2002), we restrict our
sample to hospitals with an obstetrics unit and at least 50 births in the first year of the sample in order to
be considered candidates for adopting NICU. Our sample contains close to 4,000 hospitals a year.
Within the AHA data, we consider a hospital as having a NICU if it reports having beds in a
neonatal intermediate or neonatal intensive care unit. The AHA data are self-reported and therefore have
some missing values and inconsistencies from year to year. Specifically, about 6 percent of hospital-year
observations have missing values for the number of either neonatal intensive or neonatal intermediate care
beds. In the Appendix, we provide details on how we address this problem by imputing missing values
based on data from surrounding years.
Table 1 lists the number and fraction of hospitals with NICUs in our analysis sample. While the
total number of hospitals fell in this time period due to hospital closures and consolidation, the number of
hospitals with a NICU increased from 597 to 868 between 1985 and 1996. This number amounts to an
increase from 14.8 percent to 24.9 percent of sample hospitals.
B. Measuring Medicaid Eligibility
Our empirical approach exploits variation in Medicaid expansions across states and over time to
estimate its impact on the likelihood that a hospital adopts a NICU. We cannot use actual year-to-year

13
changes in a hospital’s Medicaid population to identify this effect because it is likely correlated with other
unmeasured local economic factors that affect NICU adoption directly. Areas with greater Medicaid take-
up may also have more need for healthcare. To overcome these endogeneity concerns, we follow past
literature on Medicaid expansions by using a measure of simulated Medicaid eligibility that only varies
within a state due to legislative changes and not demographic or health trends. This methodology follows
Currie and Gruber (1996), Cutler and Gruber (1996), and many subsequent studies of the impact of
Medicaid expansions.
To construct a simulated eligibility measure for pregnancy-based Medicaid at the state-by-year
level, we obtain a national sample of women between the ages of 18 and 39 from the 1985 through 1996
Current Population Surveys. We then calculate what fraction of this fixed sample would be eligible for
Medicaid if they were to become pregnant based on the eligibility rules for each state and year. Because
this simulated measure is calculated using the same sample of women for each state and year, variation is
only driven by eligibility rules and not demographic composition. One drawback of this method is that we
are only able to measure year-by-year Medicaid eligibility at the level at which the policy variation occurs
– the state. As discussed below, within states we attempt to capture heterogeneity across local markets in
the importance of these expansions by interacting the state-level eligibility measure with local-level
demographic characteristics. As seen in Table 1, the fraction of individuals eligible for Medicaid within a
state increased from 9.4 percent to 31.5 percent over our sample period, as states responded to Federal
regulations regarding Medicaid eligibility rules.
C. Local Market Level Controls
The empirical approach described below utilizes hospital fixed effects, and therefore controls for
fixed characteristics of a hospital and its local market. We also control for the time-varying characteristics
of a hospital’s market using data from the Health Resources and Services Administration’s Area Resource
File (ARF), which provides annual, county-level data on population characteristics and health care
resources from sources such as the U.S. Census Bureau and the National Center for Health Statistics. We

14
control for the number of births and low-weight births, the infant mortality rate, and the total population,
as well as the female population by age categories, per capita income and unemployment rate. We use
linear interpolation to fill in values when a measure is not reported for all years. The mean and standard
deviations of these variables are summarized in Table 2.
Our source for state-level uninsurance rates is the March Supplement of the Current Population
Survey (CPS). Ideally, we would measure uninsurance rates only among pregnant women; however, we
cannot reliably identify a sufficient sample of pregnant women in the March CPS. We therefore use the
overall rate of uninsurance among the population under 65 years of age.12
D. Medicaid and Private Fee Data
In addition to the potential patient pool’s insurance composition, our theoretical model implies
that reimbursement rates are also likely to be important determinants of hospital NICU adoption. Ideally,
we would incorporate both hospital and physician reimbursement levels by payer. Unfortunately,
comprehensive state-level data on Medicaid hospital reimbursements are not available for the time period
of our study.13
However, we have obtained data from Currie et al. (1995), who construct a state-level
measure of the ratio of Medicaid to private fees for total obstetric care of a vaginal birth, including both
prenatal care and delivery, over the period 1979-1992. We use these fees as a proxy for the relative
generosity of Medicaid versus private payers for childbirth-related services by state.
The numerator of the Currie et al. (1995) index captures state-level Medicaid fees paid to
OB/GYNs gathered from various sources. The denominator is based on state-level private fees for vaginal
deliveries in 1989 as collected by Schwartz et al. (1991). Currie et al. (1995) then use financial data from
the American Hospital Association to inflate and deflate this fee for previous and subsequent years based
12
In results available upon request, we find that our results are robust to using the uninsurance rate among the
population of women between the ages of 18 and 39 as an alternative. We prefer specifications using the full
population as this provides a more precise estimate of the state uninsurance rate. 13
While there is work documenting state-by-state trends in Medicaid physician reimbursements (see Norton and
Zuckerman 2000; Zuckerman et al. 2009) there are no such sources for hospital reimbursements (Personal
communication with Stephen Zuckerman, Urban Institute). Quinn (2008) documents Medicaid hospital payment
methods by state as of 2004, but does not provide any information on rates or trends over time.

15
on hospital cost growth. In most of our analysis below we utilize the 1985 fee ratio to stratify our sample
based on relative Medicaid-to-private reimbursement generosity at the baseline of our sample. In later
robustness tests, we also control for yearly fee data to ensure that our results are not biased by fee
changes. For this analysis, we extend the Currie et al. (1995) data through 1996 using Medicaid fees
collected from a survey of states conducted by Bradley Gray and Kosali Simon as the numerator and
inflating the denominator with data from the American Medical Association Socioeconomic Monitoring
System on physician office visit reimbursements. Further details are provided in the Appendix.
5. Empirical Framework
We operationalize our test of hospital incentives by estimating the following regression equation
for hospital h in county c of state s in year t, with standard errors clustered at the state level to account for
correlation in the error term over time and within states:
(4)
is an indicator variable that equals one if a hospital offers a NICU in a given year and
is the simulated Medicaid eligibility rate in the hospital’s state and year. and represent
year and hospital fixed effects to control for general adoption trends and fixed hospital specific
characteristics, respectively. controls for time-varying characteristics of a hospital’s county extracted
from the Area Resource File.14
The identifying assumption of this specification is that changes in
eligibility are not correlated with unobserved NICU adoption trends. Because we use simulated eligibility
to ensure that the fraction eligible is not driven by demographic changes, the key assumption is that the
timing of state-level legislative changes to Medicaid eligibility rules is uncorrelated with unobserved
determinants of NICU adoption. To account for the fact that there may be systematic differences in
adoption trends that are correlated with legislative choices, we also include state-specific linear time
trends, . These time trends have been found to be important in previous studies of Medicaid eligibility
14
We have also obtained data on the number of Obstetricians and Neonatologists by county in 1985, 1990, and 1995
from the American Medical Association Physician Masterfile. Using linear interpolation to fill in the missing years
and including these measures as controls does not substantively impact the results presented below.

16
and insurance choices (e.g.Shore-Sheppard 2008). We also conduct placebo tests providing suggestive
empirical evidence demonstrating that, conditional on these state-specific time trends, eligibility changes
are not correlated with unobserved determinants of NICU provision.
In addition to estimating the net effect of eligibility, we attempt to tease out the offsetting
financial incentives by estimating how the effect varies with the baseline local socioeconomic
characteristics that are likely to predict the extent to which new Medicaid coverage would be attributable
to crowd-out. We do so through the following regression:
(5)
Notation for Equation 5 is as above in Equation 4 except for the added interaction term between Medicaid
eligibility and , which measures the uninsurance rate in the hospital’s state at its baseline in
1985. We also include an interaction between baseline uninsurance and a linear time trend to account for
the fact that areas with higher uninsurance may have differential NICU adoption trends even in the
absence of changes to Medicaid. For ease of interpretation, we present results where the uninsurance rate
is standardized so that reflects changes in the eligibility gradient with a one standard deviation change
in the uninsurance rate from its sample mean. As seen in Table 2, the 1985 uninsurance rate has a mean of
17.56 percent and a standard deviation of 4.28 percent in our sample.
Ideally, we would also exploit variation in uninsurance rates across sub-state markets; however,
there is no available data that measure this socioeconomic variable in large enough samples below the
state level for this time period. We therefore also estimate interactions of Medicaid eligibility with
baseline 1985 county-level unemployment, an important socioeconomic determinant of insurance, and the
baseline 1985 county-level fraction of individuals below the federal poverty line.15
These variables have a
mean of 8.12 percent (standard deviation=3.45 percent) and 14.18 percent (standard deviation=6.28
percent), respectively.
15
The fraction of the population living below the federal poverty line is available in the ARF data from 1979 and
1989. We therefore use the counties’ average of these two values. Results not shown here are robust to using either
the 1979 value or the 1989 value.

17
Finally, the generosity of Medicaid reimbursement relative to private insurance payment rates is
likely to impact the desire of a hospital to attract newly covered Medicaid patients, and as discussed
above, this impact may differ in areas of low and high crowd-out. We therefore also estimate the above
specifications separately for the sample of states with the most generous and the least generous baseline
1985 Medicaid reimbursement rates relative to private rates. We split the 45 states for which we have fee-
ratio data into the 22 states with the lowest fee ratios (less than 0.41) and the 23 states with the highest
ratios (greater than 0.41).16
Table 3 provides summary statistics for the hospitals in these two fee ratio samples. On average the
low-ratio states have a Medicaid-to-private-fee ratio of 0.27, whereas high-Medicaid-generosity states
have a ratio of 0.63. Interestingly, hospitals in both high- and low-fee-ratio states face identical baseline
state uninsurance rates at 17 percent. Also, states that are more generous with reimbursement are not more
generous with Medicaid eligibility at the beginning of our sample. On average, simulated Medicaid
eligibility shares are 10.5 percent in low-paying states and 8.9 percent in high-paying states for 1985.
However, high-paying states do see much larger increases in eligibility over the time period (24.1
percentage points vs. 19.0 percentage points). This difference suggests that states with more generous
Medicaid preferences acted through payment policies before being able to act through the eligibility
policies enacted by the expansion. Hospitals in low-paying states are more likely to have NICUs (18.1
percent vs. 11.8 percent) at the outset and also to see greater diffusion of NICUs over time (an increase of
12.3 percentage points vs. 7.8 percentage points). These summary statistics suggest that states with high
and low Medicaid payment rates relative to private payment rates may have quite different NICU
provision environments; thus an approach that separates regressions by fee ratio sample will help us
understand the interaction between payments, crowd-out, and eligibility increases.
6. Results
A. Graphical Evidence
16
Fee data are unavailable for Alaska, Arizona, Kentucky, Rhode Island, Texas and Wyoming.

18
While NICU availability and Medicaid eligibility both trend upward during the study period,
Figure 1 provides evidence from the raw data that increases in NICU availability are actually
concentrated in states with smaller Medicaid expansions. This figure plots the change in the fraction of
hospitals with NICUs in each state against the change in the fraction of women from the fixed national
CPS sample that would be eligible for Medicaid under each state’s eligibility rules between 1985 and
1996, along with a regression line. This simple state-level comparison suggests that, like the spread of
HMOs, Medicaid expansions may have slowed the diffusion of NICUs, implying that an increase in
public insurance coverage decreases the profitability of providing intensive care.
Figure 2 shows the same scatter plot for four groups of states based on whether their 1985
baseline Medicaid-to-private-obstetric fee ratio and their 1985 baseline uninsurance rate are above or
below the median. This figure suggests that there is important heterogeneity in the relationship between
Medicaid eligibility and NICU provision by potential crowd-out and reimbursement levels. The raw data
shows a negative relationship between eligibility and NICU provision in states that are low in fee ratio
and in uninsurance rates, which is not surprising since these are likely to be the states in which crowd-out
would have the largest negative impact on the profitability of attracting births and operating NICUs.
When fee ratios are low but baseline uninsurance rates are higher and crowd-out is expected to be lower,
there is a slight positive relationship. However, when fee ratios are highest, there is a relatively flat
relationship regardless of uninsurance rates.
B. Regression Estimates
Table 4 presents estimation results at the hospital level from Equations 4 and 5 to better exploit
the timing of eligibility changes and control for fixed hospital characteristics and time-varying local
market characteristics. Panel A displays results for the full sample of hospitals. Column 1 reports the
coefficient estimate of the eligibility variable from Equation 4. Consistent with Figure 1, the point
estimate is negative, although small and not statistically significant.

19
While on net Medicaid eligibility does not appear to affect hospitals’ decisions to offer neonatal
intensive care, Figure 2 suggests there may be heterogeneity in this relationship. The remaining columns
of Table 4 present results of Equation 5 in which the effect of eligibility is allowed to vary by the baseline
state-level uninsurance rate, the county-level unemployment rate and the fraction of households living
below the federal poverty line in the county. Higher values of these measures are expected to be proxying
for lower levels of crowd-out. In Column 2, the eligibility main effect is not statistically significant, but
the interaction of eligibility with baseline uninsurance is positive (0.056, se=0.022) and statistically
significant at the 5-percent level. This estimate implies that at the mean level of state uninsurance,
eligibility does not affect NICU provision, but that this effect does vary with the state uninsurance rate.
To facilitate the interpretation of these estimates, Figure 3 plots the point estimates showing the
effect of eligibility on NICU provision as uninsurance varies, along with their 90 percent and 95 percent
confidence intervals. For most levels of uninsurance below the mean, eligibility has a negative effect that
is statistically significant at the 5 percent level on the likelihood that a hospital has a NICU. For example,
hospitals in counties with baseline uninsurance rates one standard deviation below the mean, amounting
to an uninsured population of about 3.2 percent, are less likely to offer a NICU by about 1.4 percentage
points in reaction to a 22 percentage point increase in Medicaid eligibility, which reflects the average
increase in eligibility over the sample period. This 1.4 percentage point change represents 9.5 percent of
baseline NICU availability in 1985. Above the mean, the effect is not statistically significant for much of
the uninsurance rate distribution, but it is statistically significant and positive at very high levels of
uninsurance.
To better exploit geographic variation in potential crowd-out within states, we also consider
Medicaid eligibility interacted with baseline measures of county unemployment rates as well as the
percentage of a county’s population that lives below the federal poverty line. These results are presented
in Columns 3 and 4 of Table 4. These specifications reveal a similar pattern. At mean levels of
unemployment and percent below poverty, Medicaid eligibility does not have a statistically significant

20
effect on NICU provision. While the interaction terms are not statistically significant, they are also
positive.
We also expect that hospital responses to the level of crowd-out may depend on the generosity of
Medicaid reimbursements relative to private reimbursements, and Figure 2 confirms this. Panels B and C
of Table 4 present the results of Equations 4 and 5 separately for states with low vs. high Medicaid to
private fee ratios. The first column shows that there is no overall effect of eligibility on NICU provision
in either sub-sample, as we saw earlier in the full sample in Panel A. However, when interactions between
eligibility and baseline proxies for expected crowd-out are introduced, we find that the main result in
Figure 3, which shows that eligibility effects differ by expected crowd-out is being driven by low fee-
ratio states. The interaction effects are large and statistically significant in low-fee states for all three
crowd-out proxies, but in higher reimbursing states the interaction effects are close to zero and not
statistically significant.
The results so far suggest that crowd-out is an important determinant in a hospital’s response to
eligibility expansion when the reimbursement gap between Medicaid and private payers is greater.
However, when the reimbursement gap is smaller, eligibility has no impact on NICU adoption decisions.
The interaction between eligibility and crowd-out, conditional on reimbursement rates, may be nonlinear.
For example, when reimbursement rates are low, we might expect that areas with low expected crowd-out
see no change in NICU provision incentives, whereas high crowd-out areas may see more than
proportional decreases in incentives to adopt NICUs. We consider this possibility by splitting states
further based on whether their baseline uninsurance rate is above or below the median (16.29 percent) and
estimating the following regression:
(6)

21
This regression estimates the impact of eligibility on NICU provision separately for four groups
of states: low-paying low-uninsurance states, low-paying high-uninsurance states, high-paying low-
uninsurance states, and high-paying high-uninsurance states. Coefficient estimates confirm the raw data
plotted in Figure 2 and are presented in Table 5. We find a large negative and statistically significant
effect of eligibility in states with both low Medicaid to private fee ratios and low baseline uninsurance
rates. For all three other groups we find no statistically significant impact.
These results from Equation 6 suggest that when Medicaid payment rates are low and crowd-out
is expected to be most prevalent, increased eligibility has substantial negative effects on NICU provision.
When Medicaid payment rates are low but crowd-out is less likely to be prevalent, the profitability of
attracting this group is not affected, despite patient shifts from no insurance to public coverage. In states
with higher Medicaid generosity relative to private insurers, eligibility has no effect on NICU provision,
regardless of the expected crowd-out. This suggests that even in states in which Medicaid reimbursements
are most generous and eligibility expansions are most likely to substantially increase the fraction of
pregnant women covered by insurance, Medicaid payments might still be too low for hospitals to
experience a change in their financial incentives for operating a NICU.
C. Placebo Tests
The identification strategy in this paper relies on state-level changes in Medicaid eligibility being
uncorrelated with other unobserved state level changes that might affect the likelihood of NICU adoption.
Previous studies have found instances of state-level factors that could lead different states to adopt new
technologies at different speeds. For example, Skinner and Staiger (2005) find persistent differences in
states’ likelihood to adopt technology, both medical and non-medical. If these differences are correlated
with Medicaid expansion decisions and not captured by our state-specific linear time trends, our estimates
would be biased. In addition to general tastes for technology, there may be additional policy changes that
affect technology adoption. For example, our model does not control for changes in state Certificate of

22
Need (CON) laws or Disproportionate Share Program (DSH) rules,17
and our results would be
confounded if such changes coincided with Medicaid eligibility policy.
To test our identification assumption, we conduct several placebo tests. First, in Table 6 we test
whether future Medicaid eligibility impacts current NICU adoption. If we were to find that future
Medicaid eligibility is correlated with current NICU provision, it would suggest that changes in NICU
provision occurred prior to the actual roll out of eligibility changes. This pattern would shed doubt on the
assumption that eligibility expansions are independent of pre-existing NICU adoption trends. In the full
sample and the low-fee ratio states we find no statistically significant effect of leads of Medicaid eligibly
and leads of the uninsurance rate interaction term on NICU provision. In the high-fee-ratio states we do
find a negative and statistically significant main effect of future Medicaid eligibility, suggesting that these
states may have seen slowing NICU adoption concurrent with the eligibility increases; overall, however,
this placebo test supports our identifying assumptions.
To further ensure that state tastes for technology and other concurrent technology related policies
do not confound our results, we present an additional placebo test by examining the impact of Medicaid
eligibility for pregnant women on hospitals’ adoption of two cardiac care related technologies,
catheterization labs and open-heart surgery. We choose these two technologies because they represent
important investment decisions for hospitals, and because the adoption of such technologies should not be
directly affected by Medicaid expansion for pregnant women. Therefore, unless Medicaid expansions are
correlated with other unobserved adoption determinants, we would not expect to see eligibility
significantly impact the adoption of cardiac care related technologies.18
Additionally, these two
technologies diffused rapidly during our study period with the percent of sample hospitals providing
17
The period that we study, particularly the early 1990s, also coincides with expansions of the DSH program, which
allowed states to receive matching federal funds in order to distribute additional payments to hospitals treating a
disproportionate number of indigent patients. 18
If hospitals face capital constraints and respond to Medicaid expansions for pregnant women by investing in
NICUs, they might delay their adoption of other technologies such as those related to cardiac care. Nevertheless,
even in such cases, we expect the impact on cardiac care to be opposite to that of NICUs and to be much less
pronounced.

23
catheterization labs increasing from 19.7 to 34.2 and the percent providing open heart surgery increasing
from 12.7 to 19.4.
Specifically, we conduct our second placebo test by running our main specifications in Equations
4 and 5 using dummy variables for the provision of catheterization labs and open heart surgery as the
dependent variables. The estimation results are reported in Table 7. For each type of technology, we
report the estimation results with and without controlling for differential effects by state-level uninsurance
rates. Overall, we consistently find no statistically significant impact of Medicaid eligibility on the
adoption of cardiac care related technologies and no interaction between eligibility and potential crowd-
out. Furthermore, the results are not statistically significant in either fee ratio sub-sample. Our
falsification test suggests that the main findings of this paper are not driven by unobserved heterogeneity
at the state-year level, which is common to the adoption of NICUs and cardiac care related treatments.
D. Additional Robustness Tests
Our estimates above do not explicitly account for the fact that relative reimbursement rates
change over time, and these changes could be correlated with eligibility changes. On one hand, states that
expand eligibility may also be more inclined to increase Medicaid payment rates. Alternatively, states
may choose between eligibility policies and payment policies as substitutes in their aim to improve their
program’s generosity. Overall, Appendix Figure 1 shows that in addition to increasing Medicaid
eligibility, Medicaid reimbursement rates and the ratio of Medicaid-to-private obstetric fees generally
increased over this time period. Additionally, states with higher baseline fee ratios had larger eligibility
increases. If state-level changes in fees are correlated with changes in eligibility, increased payment for
Medicaid patients may confound our results.
Table 8 presents results controlling for the ratio of Medicaid-to-private obstetric reimbursement
rates. Because fee data are unavailable for six states, Panel A replicates the main results for the sample of
states that have fee data. Compared to the main results in Table 4 the interaction effects are slightly
smaller and not statistically significant, although the pattern of point estimates is largely consistent with

24
the full sample. Panels B reports the results controlling for one version of the Medicaid to private fee
index. More details about the fee index data can be found in the Appendix. These results are almost
identical to the results in Panel A that do not control for these fee ratios. The fee ratio itself has a positive
but not statistically significant effect on NICU provision. Appendix Table 1 reports results for alternative
fee indices and again finds that these controls do not change the main parameter estimates. The fact that
the coefficient estimates of eligibility and the interaction terms are unchanged suggests that our estimates
do not appear to confound any changes to Medicaid payment rates with the changes in Medicaid
eligibility associated with the expansions.
Table 9 presents some additional robustness tests for the main results. In Column 1 we present
results of our main model weighted by the number of births delivered by each hospital in 1985. This
allows us to interpret the results as the effect of Medicaid eligibility on the fraction of infants born in
hospitals with NICUs rather than the effect for the average hospital. If anything, we find stronger results
when weighting by births and more evidence of positive effects when uninsurance is above the mean.19
In
Column 2 we exclude from the sample any hospital that closed during the sample period. If hospitals with
and without NICUs were differentially likely to close in states with larger Medicaid expansions, our
estimates could be biased, with the direction of bias depending on which type of hospital is more likely to
close. The results that do not include closed hospitals are similar to the baseline specification. Column 3
considers that anecdotally hospitals are not likely to close NICUs once they have been adopted, and
therefore that cases in the data in which hospitals reported having a NICU one year but not a following
year may be due to reporting errors. We therefore redefine our NICU indicator by assuming that once a
hospital offers a NICU it continues to do so in all subsequent years. Similarly in Column 4 we more
closely mimic the hazard model estimated by Baker and Phibbs (2002) in their examination of managed
care penetration and NICU adoption by excluding from our sample hospitals that already operated a
NICU in 1985, as well as observations on adopting hospitals in the years after adoption occurs. For both
19
As with the main estimation results, in results not shown, we find that these births-weighted results are driven
fully by low-fee-ratio states.

25
alternative samples we again find no statistically significant effect of eligibility on NICU provision at
mean uninsurance rates, but we do find statistically significant and negative interaction effects at the 10
percent level.
In Columns 5 through 7 we address the fact that local market competition could be an important
determinant of NICU adoption that could be spuriously correlated with Medicaid expansions. While we
control for fixed market characteristics through the hospital fixed effects, changes in local market
competition could bias our results if they happen coincidental with Medicaid expansions. We estimate
regressions controlling for three alternative time-varying measures of the local NICU market competition.
In Column 5 we control for the number of other hospitals in the county that offered a NICU in the
previous year, and in Column 6 we control for the fraction of other hospitals in the county that offered a
NICU in the previous year.20
The estimates suggest that the fraction of other hospitals with NICUs in the
previous year does have a significant effect on NICU provision, although the number of other hospitals
offering a NICU in the previous year does not. However, changes in the fraction (or number) of other
hospitals offering NICUs do not appear to be correlated with eligibility changes, as the estimated effects
of eligibility and eligibility interacted with baseline uninsurance are unchanged from the baseline
specification.
Finally, in Column 7 we consider the overall competitive atmosphere of the market for deliveries,
rather than the direct number or fraction of other hospitals offering NICUs. Here we use the number of
births reported by each hospital in each year from the AHA data to construct county-level market shares,
and then we use these market shares to construct a county-level Herfindahl-Hirschman index (HHI) in the
market for births. Because these market shares will be affected by a hospital’s decision to open a NICU in
a given year, and therefore will be potentially endogenous to eligibility changes, we use lagged instead of
contemporaneous HHI.21
Our main results are robust to including this measure and we do not find that
HHI itself impacts NICU adoption. Note this does not necessarily refute the argument that competition for
20
The fraction of other hospitals is only defined for hospitals with at least one other sample hospital in their county,
therefore this specification is restricted to hospitals with at least one competitor. 21
In unreported results we also construct a measure of HHI based on all hospital admissions and find similar results.

26
births is a motivating factor for providing a NICU, but it does suggest that NICU provision decisions do
not respond to year-to-year changes in market concentration.
7. Further Implications: NICU Adoption and Infant Health
To this point, our results suggest that Medicaid eligibility expansions decelerated NICU adoption
in regions with high expected levels of crowd-out and relatively less generous Medicaid payments. Here
we provide some suggestive tests of the ways in which this supply-side response to public health
insurance expansion may have impacted health outcomes. In prior research examining the causal impact
of insurance system changes on NICU adoption, Baker and Phibbs (2002) find that managed care
penetration slowed the adoption of mid-level NICUs from 1980 to 1996, a similar time period to that of
our analysis. They also find that high-risk infants born in hospitals with mid-level NICUs have higher
mortality rates than those born in higher-level facilities and provide suggestive evidence that managed
care penetration itself decreased infant mortality. Therefore, they conclude that managed care induced
deceleration in NICU diffusion is likely to be health improving. While Freedman (2011b) finds that level
of care at the delivery hospital does not impact mortality when accounting for unobserved sources of
hospital selection, on average it appears that decreasing the number of hospitals offering NICUs would
likely be cost saving and at least not be harmful to health.
Consistent with the fact that most of the variation in NICU provision during this time period was
among mid-level NICUs and with Baker and Phibbs’s (2002) finding that managed care penetration
slowed the adoption of mid-level NICUs, Table 10 shows that our results are also driven by mid-level
NICUs.22
For both types, the main effect of eligibility on NICU provision is small and not statistically
significant, but the interactions between crowd-out proxies and eligibility are much larger and mostly
only statistically significant for mid-level NICU provision. This suggests that Medicaid expansion did not
22
Following Baker and Phibbs (2002) we define high-level NICUs as those with a positive number of intensive care
beds and at least 15 combined intensive and intermediate care beds, and we define mid-level NICUs as those with a
positive number of intensive care beds and less than 15 combined intensive and intermediate care beds or those with
zero intensive care beds and a positive number of intermediate care beds.

27
impact access to the highest level of neonatal care. Given past concerns about excessive diffusion of mid-
level NICUs by organizations such as the American Academy of Pediatrics (Committee on Perinatal
Health 1993), the slowed diffusion of these mid-level units may not be expected to have negative impacts
on health.
However, average effects may mask important heterogeneity across demographic subgroups.
There may be some groups of the population without sufficient access to necessary care, and the effect of
Medicaid expansion on hospitals’ decisions to adopt NICUs may be particularly important for these
groups. For example, while Currie and Gruber (1997, 2001) find that Medicaid expansions have little
effect on the mortality rates of infants born to teen or high-school-dropout mothers, they do find
decreased infant mortality among those mothers whose nearest hospital operates a NICU. If Medicaid
expansion changes the prevalence of NICUs, it could have health implications for the infants born to
women who gain coverage from the expansion. Additionally, Aizer, Lleras-Muney, and Stabile (2005)
find that poorer women are more likely to give birth in lower-quality hospitals and that increases in the
generosity of their insurance lead to increased access to higher-quality hospitals.
If slowed diffusion in high crowd-out states decreases access to neonatal intensive care for these
groups of infants, there may be important health consequences. While poor, teen, and high-school-
dropout mothers are likely to be less prevalent in these high crowd-out areas as proxied by higher
socioeconomic status, access to neonatal intensive care may be particularly relevant for some groups of
women impacted by the expansion.
We provide some suggestive evidence on whether changes in NICU provision induced by
Medicaid expansion had any impact on infant mortality rates. For this analysis we utilize the NCHS’s
Vital Statistics Birth Cohort Linked Birth/Infant Death Data, which provides demographic and health
characteristics from all US birth certificates and links to infant death certificates for any deaths within a
year of the birth. These data are not available for 1992-1994, so for this analysis we use births occurring
during the periods 1985-1991 and 1995-1996. Because we are interested in the ways in which Medicaid
expansion affected mortality through neonatal intensive care, we restrict our sample to low birth weight

28
infants to consider infants most likely to need this type of care.23
To match the infant mortality rates with
the population controls and crowd-out proxies we utilize in our main analysis, we collapse vital statistics
data to the county-year level.24
Our analysis in Table 11 examines whether the Medicaid eligibility expansion had differential
impacts on low birth weight mortality rates in the areas where we find differential impacts on NICU
adoption. Our strategy is to regress county-level low birth weight mortality rates on our measures of
Medicaid eligibility and our interactions of eligibility and crowd-out proxies. As in our main analysis, we
also separate the sample by level of Medicaid-to-private fee ratio. In addition to the population controls
included in the NICU adoption models, we also include county-level averages of individual-level infant
characteristics including mother’s age, race, and education; sex of the infant; and multiple birth status.
These models also include county and year fixed effects along with state-specific linear time trends.
The results are reported in Table 11, and Column 1 of Panel A show that, consistent with Currie
and Gruber’s (1997, 2001) findings, Medicaid eligibility has a small, negative, but not statistically
significant impact on mortality overall. We also find no evidence that mortality effects vary with our
crowd-out proxies, either in low- or high-fee states.25
These results suggest that though Medicaid
expansions decreased NICU adoption in certain regions (those with high expected crowd-out and low fee
ratios), they did not detrimentally affect infant mortality trends. While Currie and Gruber (1997, 2001)
find that Medicaid expansions improved health outcomes among infants whose mothers lived near
NICUs, our results suggest that the marginal NICUs deterred by Medicaid expansion in certain low-
paying areas had no detectable impact on health.
8. Discussion and Policy Implications
23
While Currie and Gruber’s work shows decreasing mortality rates associated with Medicaid expansion, they also
find decreasing rates of low birth weight and increasing use of prenatal care procedures that are not likely to be
connected to NICU access. 24
Note that our sample is restricted to counties with population greater than 250,000 as the publicly available vital
statistics data only include county identifiers for these larger counties. 25
In estimates available upon request, we find similar results when restricting the sample to infants born to teenage
and high-school-dropout mothers.

29
Our understanding of the ways in which large-scale insurance expansion affects technology
adoption is informed mainly by empirical examples from Medicare and managed care. We contend that
Medicaid may have an impact that is theoretically different and may fall somewhere between these prior
two cases of Medicare and managed care. Medicaid is currently scheduled to expand substantially for
adults under the ACA, starting in 2014. Using the case of hospital NICU technology during the last period
of large Medicaid expansions involving an adult population (pregnancy-related eligibility during the
1980s and 1990s), we contribute to the literature by providing the first analysis of Medicaid expansions
and technology adoption. We draw our testable hypotheses from a conceptual model in which we discuss
the opposing incentives created for hospitals by Medicaid expansions, and pay close attention to how the
predicted behavioral responses rely on reimbursement levels and the degree of expected private insurance
crowd-out.
Despite the fact that NICU technology diffused rapidly during these Medicaid expansions, we
first show descriptively that states marked by the largest expansion saw the slowest growth in NICU
availability. On average we estimate that Medicaid expansion had a negative but not statistically
significant impact on hospitals’ decisions to adopt NICUs. To understand the extent to which crowd-out
plays a role in hospitals’ responses to the expansion, we examine heterogeneity by baseline uninsurance,
unemployment and poverty rates. In high socioeconomic status areas where more new Medicaid patients
are likely to have been privately insured at baseline, Medicaid eligibility expansion decreases the
likelihood that a hospital has a NICU. This finding is particularly notable in states where Medicaid
reimbursement rates are low relative to private rates. In low socioeconomic status areas where we might
expect Medicaid expansion to most significantly increase the level of insurance coverage, we do not find
large impacts on NICU provision. Even when Medicaid payment rates are relatively high, we do not find
evidence that hospitals pursued NICU adoption. Note that even in states with higher Medicaid payment
rates, Medicaid rates are still only 63 percent of private rates on average. Taken together, our results
portray the effect of Medicaid expansion as having slowed the adoption of technology, which contrasts
with the evidence on the Medicare program. One factor our results point to as possibly responsible for this

30
difference is that Medicaid payment rates are less generous than Medicare payments. Therefore hospital
responses to Medicaid expansion had more in common with responses to the roll-out of managed care
insurance than to previous large increases in the number of individuals covered by Medicare insurance. In
the context of neonatal intensive care, the fact that Medicaid expansions slowed diffusion in low
uninsurance areas may imply that these eligibility changes actually curtailed expensive investments that
are likely not to be health improving. On the other hand, in high uninsurance and low socioeconomic
status areas, where we might expect access to necessary care to be the most limited, we do not find that
providing additional public coverage to low-income pregnant women increased the availability of
neonatal intensive care. This may be the population for which additional care availability has the most
scope for improving health. Further exploring this heterogeneity is an important avenue for future
research.
The literature on technology adoption and health care costs recognizes the difficult tradeoff
between medical advances and health (e.g. Cutler 2005). In this context, there would be concern that
implications of Medicaid expansions for NICU technology might affect infant health through low birth
weight infant mortality rates. Using an identification strategy similar to the one we use for testing
technology adoption outcomes, we provide some suggestive evidence on health impacts by using data
from the linked infant mortality files for 1985-1996. We do not find any evidence of health impacts, even
in cases of states with low fees and high uninsurance where our main analysis indicated that NICU
adoption was slowed by Medicaid expansions. This finding is not surprising, as it is likely that although
NICU technology is undoubtedly lifesaving, the marginal NICU that was deterred from adoption is likely
not a large determinant of infant health given the dense availability of NICUs regionally during this time
period.
Our findings also have important implications for the upcoming insurance expansions expected
through the ACA. While it may be difficult to determine which well-defined technologies specifically
appeal to the newly insured populations, such as neonatal intensive care in the case of pregnant women,

31
our results are informative about potential heterogeneity of supply-side responses to different types of
insurance expansions.

32
References
Acemoglu, D., Cutler, D., Finkelstein, A., Linn, J., 2006. Did Medicare Induce Pharmaceutical
Innovation? The American Economic Review 96, 103–107.
Acemoglu, D., Finkelstein, A., 2008. Input and Technology Choices in Regulated Industries: Evidence
from the Health Care Sector. Journal of Political Economy 116, 837–880.
Aizer, A., Lleras-Muney, A., Stabile, M., 2005. Access to Care, Provider Choice, and the Infant Health
Gradient. The American Economic Review 95, 248–252.
Baker, L.C., 2001. Managed care and technology adoption in health care: evidence from magnetic
resonance imaging. Journal of Health Economics 20, 395–421.
Baker, L.C., Phibbs, C.S., 2002. Managed Care, Technology Adoption, and Health Care: The Adoption of
Neonatal Intensive Care. The RAND Journal of Economics 33, 524–548.
Baughman, R., 2007. Differential Impacts of Public Health Insurance Expansions at the Local Level.
International Journal of Health Care Finance and Economics 7, 1–22.
Blume-Kohout, M.E., Sood, N., 2008. The Impact of Medicare Part D on Pharmaceutical R&D. National
Bureau of Economic Research Working Paper Series No. 13857.
Chandra, A., Skinner, J.S., 2011. Technology Growth and Expenditure Growth in Health Care. National
Bureau of Economic Research Working Paper Series No. 16953.
Chou, S., Liu, J., Hammitt, J.K., 2004. National Health Insurance and Technology Adoption: Evidence
from Taiwan. Contemporary Economic Policy 22, 26–38.
Clemens, J.P., 2012. The Effect of U.S. Health Insurance Expansions on Medical Innovation. SSRN
eLibrary.
Committee on Fetus and Newborn, 2004. Levels of Neonatal Care. Pediatrics 114, 1341–1347.
Committee on Perinatal Health, 1976. Toward Improving the Outcome of Pregnancy: Recommendations
for the Regional Development of Maternal and Perinatal Health. March of Dimes, White Plains,
NY.
Committee on Perinatal Health, 1993. Toward improving the outcome of pregnancy: The 90s and beyond.
March of Dimes, White Plains, NY.
Congressional Budget Office, 2007. The State Children’s Health Insurance Program. Washington, D.C.
Congressional Budget Office, 2011. CBO’s Analysis of the Major Health Care Legislation Enacted in
March 2010. Washington, D.C.
Currie, J., Gruber, J., 1996. Health Insurance Eligibility, Utilization of Medical Care, and Child Health.
The Quarterly Journal of Economics 111, 431–466.
Currie, J., Gruber, J., 1997. The Technology of Birth: Health Insurance, Medical Interventions, and Infant
Health. National Bureau of Economic Research Working Paper Series No. 5985.
Currie, J., Gruber, J., 2001. Public health insurance and medical treatment: the equalizing impact of the
Medicaid expansions. Journal of Public Economics 82, 63–89.
Currie, J., Gruber, J., Fischer, M., 1995. Physician Payments and Infant Mortality: Evidence from
Medicaid Fee Policy. The American Economic Review 85, 106–111.
Cutler, D.M., 2005. Your Money or Your Life: Strong Medicine for America’s Health Care System, 1st
ed. Oxford University Press, New York.
Cutler, D.M., Gruber, J., 1996. Does Public Insurance Crowd Out Private Insurance. The Quarterly
Journal of Economics 111, 391–430.
Cutler, D.M., Meara, E., 2000. The Technology of Birth: Is It Worth It?, in: Frontiers in Health Policy
Research, Volume 3, NBER Chapters. National Bureau of Economic Research, Inc, pp. 33–68.
Dave, D.M., Decker, S.L., Kaestner, R., Simon, K.I., 2011. The Effect of Medicaid Expansions on the
Health Insurance Coverage of Pregnant Women: An Analysis Using Deliveries. Inquiry 47, 315–
330.
Decker, S.L., 2007. Medicaid physician fees and the quality of medical care of Medicaid patients in the
USA. Review of Economics of the Household 5, 95–112.

33
Decker, S.L., 2009. Changes in Medicaid physician fees and patterns of ambulatory care. Inquiry 46,
291–304.
DeNavas-Walt, C., Proctor, B.D., Smith, J.C., 2012. Income, Poverty, and Health Insurance Coverage in
the United States: 2011. U.S. Census Bureau.
Dor, A., Farley, D.E., 1996. Payment source and the cost of hospital care: Evidence from a multiproduct
cost function with multiple payers. Journal of Health Economics 15, 1–21.
Dubay, L., Kenney, G., 1997. Peer Review: Did Medicaid Expansions For Pregnant Women Crowd Out
Private Coverage? Health Aff 16, 185–193.
Finkelstein, A., 2004. Static and Dynamic Effects of Health Policy: Evidence from the Vaccine Industry.
The Quarterly Journal of Economics 119, 527–564.
Finkelstein, A., 2007. The Aggregate Effects of Health Insurance: Evidence from the Introduction of
Medicare. The Quarterly Journal of Economics 122, 1 –37.
Freedman, S., 2011a. Capacity and Utilization in Health Care: The Effect of Empty Beds on Neonatal
Intensive Care Admission.
Freedman, S., 2011b. The Effect of Deregionalization on Health Outcomes: Evidence from Neonatal
Intensive Care.
Friedman, B., Devers, K.J., Steiner, C.A., Fox, S. (Steven H.., 2002. The Use of Expensive Health
Technologies in the Era of Managed Care: The Remarkable Case of Neonatal Intensive Care.
Journal of Health Politics, Policy and Law 27, 441–464.
Fuchs, V.R., 1996. Economics, Values, and Health Care Reform. American Economic Review 86, 1–24.
Garthwaite, C.L., 2011. The Doctor Might See You Now: The Supply Side Effects of Public Health
Insurance Expansions. National Bureau of Economic Research Working Paper Series No. 17070.
Goodman, D.C., Fisher, E.S., Little, G.A., Stukel, T.A., Chang, C., 2001. Are Neonatal Intensive Care
Resources Located According to Need? Regional Variation in Neonatologists, Beds, and Low
Birth Weight Newborns. Pediatrics 108, 426–431.
Gruber, J., 2008. Covering the Uninsured in the United States. Journal of Economic Literature 46, 571–
606.
Horwitz, J.R., 2005. Making Profits And Providing Care: Comparing Nonprofit, For-Profit, And
Government Hospitals. Health Affairs 24, 790–801.
Horwitz, J.R., Nichols, A., 2007. What Do Nonprofits Maximize? Nonprofit Hospital Service Provision
and Market Ownership Mix. National Bureau of Economic Research Working Paper Series No.
13246.
Howard, D.H., Shen, Y.-C., 2011. Comparative Effectiveness Research, COURAGE, and Technological
Abandonment (Working Paper No. 17371). National Bureau of Economic Research.
Howell, E.M., Richardson, D., Ginsburg, P., Foot, B., 2002. Deregionalization of Neonatal Intensive Care
in Urban Areas. American Journal of Public Health 92, 119–124.
Hult, K.J., Philipson, T.J., 2012. Health Care Reforms and the Value of Future Public Liabilities
(Working Paper No. 18571). National Bureau of Economic Research.
Kaiser, 2012. Medicaid & CHIP [WWW Document]. statehealthfacts.org. URL
http://www.statehealthfacts.org/comparecat.jsp?cat=4&rgn=6&rgn=1
Newhouse, J.P., 1992. Medical Care Costs: How much welfare loss? Journal of Economic Perspectives 6,
3–21.
Norton, S., Zuckerman, S., 2000. Trends in Medicaid physician fees, 1993-1998. Health Aff 19, 222–232.
Phibbs, C.S., Mark, D.H., Luft, H.S., Peltzman-Rennie, D.J., Garnick, D.W., Lichtenberg, E., McPhee,
S.J., 1993. Choice of hospital for delivery: a comparison of high-risk and low-risk women. Health
Serv Res. 28, 201–222.
Quinn, K., 2008. New Directions In Medicaid Payment For Hospital Care. Health Aff 27, 269–280.
Russell, R.B., Green, N.S., Steiner, C.A., Meikle, S., Howse, J.L., Poschman, K., Dias, T., Potetz, L.,
Davidoff, M.J., Damus, K., Petrini, J.R., 2007. Cost of Hospitalization for Preterm and Low Birth
Weight Infants in the United States. Pediatrics 120, e1–9.

34
Schwartz, R.M., Kellogg, R., Muri, J.H., 2000. Specialty newborn care: trends and issues. J Perinatol 20,
520–529.
Skinner, J., Staiger, D., 2005. Technology Adoption From Hybrid Corn to Beta Blockers. National
Bureau of Economic Research Working Paper Series No. 11251.
Sloan, F.A., 2000. Not-for-profit ownership and hospital behavior, in: Handbook of Health Economics.
Elsevier, pp. 1141–1174.
Weisbrod, B.A., 1991. The Health Care Quadrilemma: An Essay on Technological Change, Insurance,
Quality of Care, and Cost Containment. Journal of Economic Literature 29, 523–552.
Zuckerman, S., Williams, A.F., Stockley, K.E., 2009. Trends In Medicaid Physician Fees, 2003–2008.
Health Aff 28, w510–w519.

35
Figure 1: State-Level Changes in NICU Provision by Medicaid Eligibility Changes, 1985 – 1996
Notes: This figure plots changes in the fraction of a state’s hospitals that offer NICUs against changes in the fraction
of women in a fixed national sample from the CPS that would be eligible for Medicaid conditional on pregnancy,
under that state’s eligibility rules. Changes are calculated between 1985 and 1996 for each state. The line represents
the best linear fit.

36
Figure 2: State-Level Changes in NICU Provision by Medicaid Eligibility Changes –
Groups of States Stratified by Fee Ratio and Uninsurance Rate
Notes: This figure plots changes in the fraction of a state’s hospitals that have NICUs against changes in the fraction
of women in a fixed national sample from the CPS that would be eligible for Medicaid conditional on pregnancy,
under that state’s eligibility rules. Changes are calculated between 1985 and 1996. The line represents the best linear
fit. States are divided based on whether their 1985 uninsurance rate and 1985 Medicaid-to-private-obstetric-fee ratio
are above or below the median.

37
Figure 3: Effects of State Medicaid Eligibility Level on Hospital NICU Provision by 1985 State
Uninsurance Rate
Notes: This figure plot the estimated effect of state Medicaid eligibility on the probability that a hospital offers a
NICU for different values of the baseline state-level uninsurance rate, along with 95 percent and 90 percent
confidence intervals. Baseline uninsurance is normalized to reflect the number of standard deviations from the
sample mean. Estimates are from regression reported in Column 2 of Table 4 and control for hospital fixed effects;
year dummies; state-specific time trends; county level controls for number of births, number of low birth weight
births, infant mortality rate, population, female population by age, per-capita income, and unemployment rate; and
an interaction between baseline unemployment rate and a linear year trend. Standard errors are clustered at the state
level.

38
Table 1: Summary Statistics by Year
Year
Number of
Hospitals
Number of
Hospitals
with a
NICU
Fraction of
Hospitals
with a NICU
Mean
State
Medicaid
Eligibility
1985 4,030 597 0.148 0.094
1986 3,994 635 0.159 0.095
1987 3,930 663 0.169 0.116
1988 3,866 714 0.185 0.185
1989 3,819 742 0.194 0.231
1990 3,762 750 0.199 0.249
1991 3,713 769 0.207 0.252
1992 3,669 786 0.214 0.263
1993 3,631 803 0.221 0.274
1994 3,590 857 0.239 0.276
1995 3,543 865 0.244 0.306
1996 3,483 868 0.249 0.315
Notes: Number and fraction of hospitals with a NICU are calculated from the AHA data. Sample includes hospitals
with an active obstetric unit at beginning of sample. Mean state Medicaid eligibility is the mean at the year level for
our hospital sample. Total sample size: 44,607 at hospital-year level.

39
Table 2: Summary Statistics of County-Level Characteristics
Mean
Standard
Deviation
County-Level Infant Health Controls
Number of Births 8,861 26,249
Number of Low Birth Weight Births 636 1,803
Infant Morality (per thousand births) 8.589 3.043
County-Level Population Controls
Population 247,572 981,453
Female Population by Age
15 to 19 17,495 46,967
20 to 24 20,414 56,750
25 to 29 22,772 63,301
30 to 34 22,225 60,657
35 to 44 37,664 100,048
45 to 54 26,775 70,163
55 to 59 11,283 28,918
60 to 64 10,824 27,327
65 to 74 18,517 45,864
Per Capita Income ($) 16,911 5,263
Unemployment Rate (%) 6.756 3.092
Baseline Socioeconomic Characteristics
State-Level Uninsurance (%) 17.455 4.284
County-Level Unemployment Rate (%) 8.120 3.446
County-Level Below Federal Poverty Line (%) 14.179 6.283
N 44,607 Notes: All variables are calculated from the Area Resource File, except State-Level Uninsurance, which is drawn
from the March Supplement of the Current Population Survey. Baseline characteristics reflect 1985 levels.

40
Table 3: Summary Statistics by 1985 Medicaid/Private Obstetric Fee Ratio
Low Medicaid/Private
Fee Ratio
High Medicaid/Private
Fee Ratio
Fee Ratio, 1985 0.272 0.631
Uninsurance, 1985 0.169 0.169
Average State Medicaid Eligibility, 1985 0.105 0.089
Change in State Medicaid Eligibility, 1985-1996 0.190 0.241
Fraction of hospitals with a NICU, 1985 0.181 0.118
Change in Fraction with a NICU, 1985-1996 0.123 0.078
N 1,776 1,813 Notes: Sample includes hospitals in the 45 states with available fee ratio data. Low fee ratio states refer to the 22
states with the lowest 1985 fee ratio (less than 0.41), and high fee ratio states refer to the 23 states with the highest
1985 fee ratios (greater than 0.41).
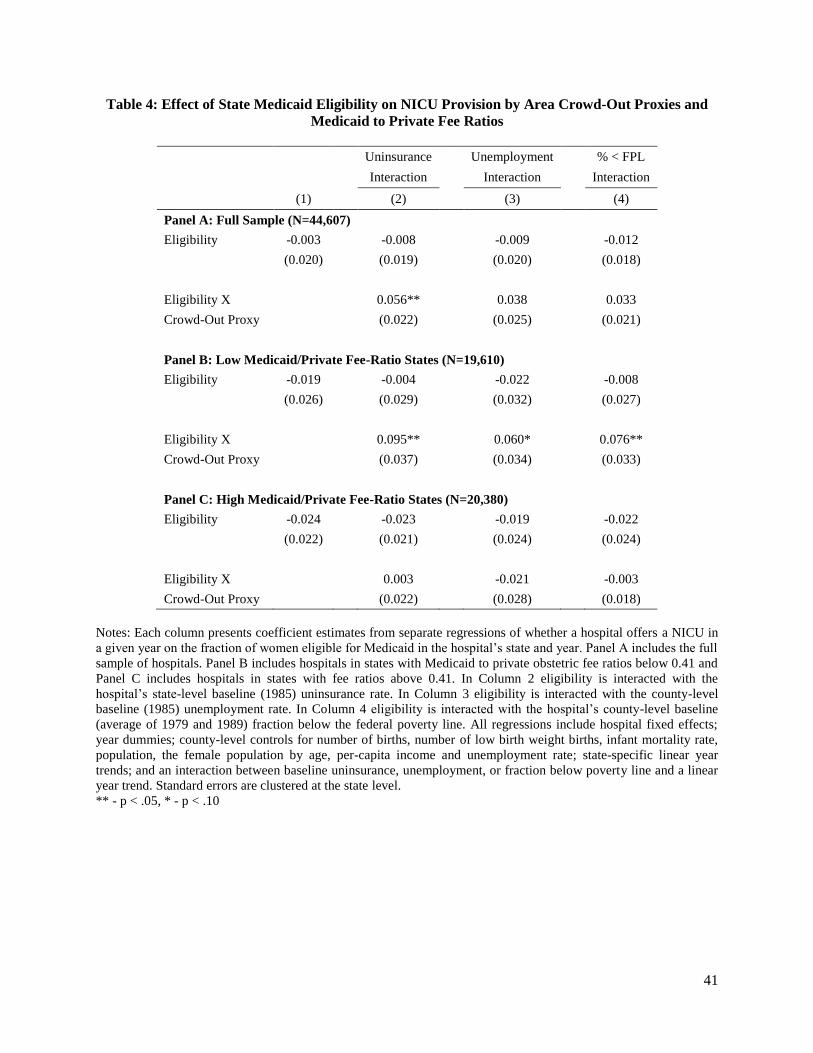
41
Table 4: Effect of State Medicaid Eligibility on NICU Provision by Area Crowd-Out Proxies and
Medicaid to Private Fee Ratios
Uninsurance
Unemployment
% < FPL
Interaction
Interaction
Interaction
(1)
(2)
(3)
(4)
Panel A: Full Sample (N=44,607)
Eligibility -0.003
-0.008
-0.009
-0.012
(0.020)
(0.019)
(0.020)
(0.018)
Eligibility X
0.056**
0.038
0.033
Crowd-Out Proxy
(0.022)
(0.025)
(0.021)
Panel B: Low Medicaid/Private Fee-Ratio States (N=19,610)
Eligibility -0.019
-0.004
-0.022
-0.008
(0.026)
(0.029)
(0.032)
(0.027)
Eligibility X
0.095**
0.060*
0.076**
Crowd-Out Proxy
(0.037)
(0.034)
(0.033)
Panel C: High Medicaid/Private Fee-Ratio States (N=20,380)
Eligibility -0.024
-0.023
-0.019
-0.022
(0.022)
(0.021)
(0.024)
(0.024)
Eligibility X
0.003
-0.021
-0.003
Crowd-Out Proxy
(0.022)
(0.028)
(0.018)
Notes: Each column presents coefficient estimates from separate regressions of whether a hospital offers a NICU in
a given year on the fraction of women eligible for Medicaid in the hospital’s state and year. Panel A includes the full
sample of hospitals. Panel B includes hospitals in states with Medicaid to private obstetric fee ratios below 0.41 and
Panel C includes hospitals in states with fee ratios above 0.41. In Column 2 eligibility is interacted with the
hospital’s state-level baseline (1985) uninsurance rate. In Column 3 eligibility is interacted with the county-level
baseline (1985) unemployment rate. In Column 4 eligibility is interacted with the hospital’s county-level baseline
(average of 1979 and 1989) fraction below the federal poverty line. All regressions include hospital fixed effects;
year dummies; county-level controls for number of births, number of low birth weight births, infant mortality rate,
population, the female population by age, per-capita income and unemployment rate; state-specific linear year
trends; and an interaction between baseline uninsurance, unemployment, or fraction below poverty line and a linear
year trend. Standard errors are clustered at the state level.
** - p < .05, * - p < .10

42
Table 5: Effects of State Medicaid Eligibility on NICU Provision by 1985 Medicaid/Private-Fee
Ratio Categories, and 1985 Uninsurance Rate Categories
(1)
Eligibility X Low Ratio X -0.120**
Low Uninsurance (0.045)
Eligibility X Low Ratio X 0.030
High Uninsurance (0.043)
Eligibility X High Ratio X -0.026
Low Uninsurance (0.023)
Eligibility X High Ratio X 0.002
High Uninsurance (0.032)
Notes: This table separates states into four groups based on whether their 1985 Medicaid to private obstetric fee
ratio is above or below the median and whether their 1985 uninsurance rate is above or below the median. Estimates
are from a regression of whether a hospital offers a NICU in a given year on the fraction of women eligible for
Medicaid in the hospitals state and year interacted with dummy variables for these four categories. Standard errors
are clustered at the state level.
** - p < .05, * - p < .10

43
Table 6: Contemporaneous and Lead Effects of Medicaid Eligibility on NICU Provision
Low Medicaid/Private High Medicaid/Private
All States Fee-Ratio States Fee-Ratio States
(1) (2) (3)
This Year:
Eligibility 0.018 0.054* -0.018
(0.019) (0.028) (0.018)
Eligibility X 0.070** 0.092** 0.024
1985 Uninsurance (0.019) (0.034) (0.019)
1 Year Later:
Eligibility -0.013 0.017 -0.040**
(0.015) (0.020) (0.017)
Eligibility X 0.017 0.026 0.025
1985 Uninsurance (0.012) (0.016) (0.017)
2 Years Later:
Eligibility -0.020 -0.023 -0.034*
(0.022) (0.028) (0.018)
Eligibility X 0.010 -0.023 0.003
1985 Uninsurance (0.022) (0.024) (0.019)
N 36,659 16,115 16,775
Notes: Each column presents coefficient estimates from separate regressions. All regressions include hospital fixed
effects; year dummies; county-level controls for number of births, number of low birth weight births, infant
mortality rate, population, female population by age, per-capita income and unemployment rate; state-specific time
trends; and an interaction between baseline uninsurance and a linear year trend. Standard errors are clustered at the
state level.
** - p < .05, * - p < .10
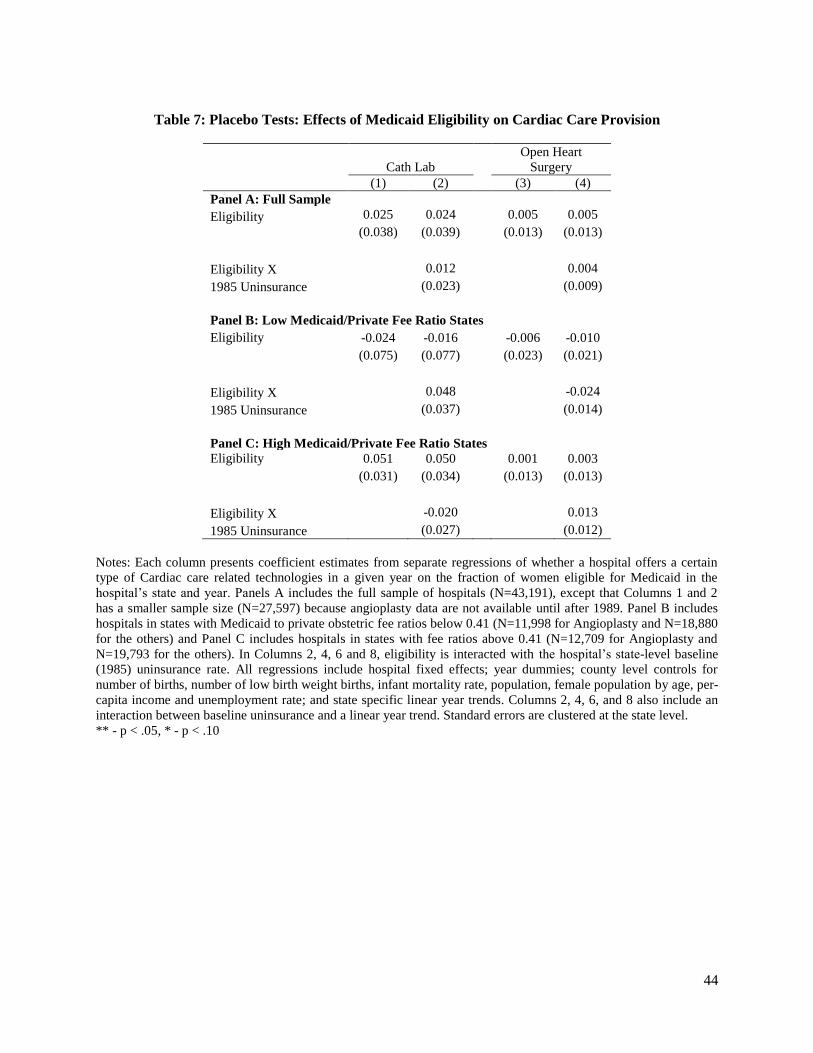
44
Table 7: Placebo Tests: Effects of Medicaid Eligibility on Cardiac Care Provision
Open Heart
Cath Lab Surgery
(1) (2) (3) (4)
Panel A: Full Sample
Eligibility 0.025 0.024 0.005 0.005
(0.038) (0.039) (0.013) (0.013)
Eligibility X 0.012 0.004
1985 Uninsurance (0.023) (0.009)
Panel B: Low Medicaid/Private Fee Ratio States
Eligibility -0.024 -0.016 -0.006 -0.010
(0.075) (0.077) (0.023) (0.021)
Eligibility X 0.048 -0.024
1985 Uninsurance (0.037) (0.014)
Panel C: High Medicaid/Private Fee Ratio States Eligibility 0.051 0.050 0.001 0.003
(0.031) (0.034) (0.013) (0.013)
Eligibility X -0.020 0.013
1985 Uninsurance (0.027) (0.012)
Notes: Each column presents coefficient estimates from separate regressions of whether a hospital offers a certain
type of Cardiac care related technologies in a given year on the fraction of women eligible for Medicaid in the
hospital’s state and year. Panels A includes the full sample of hospitals (N=43,191), except that Columns 1 and 2
has a smaller sample size (N=27,597) because angioplasty data are not available until after 1989. Panel B includes
hospitals in states with Medicaid to private obstetric fee ratios below 0.41 (N=11,998 for Angioplasty and N=18,880
for the others) and Panel C includes hospitals in states with fee ratios above 0.41 (N=12,709 for Angioplasty and
N=19,793 for the others). In Columns 2, 4, 6 and 8, eligibility is interacted with the hospital’s state-level baseline
(1985) uninsurance rate. All regressions include hospital fixed effects; year dummies; county level controls for
number of births, number of low birth weight births, infant mortality rate, population, female population by age, per-
capita income and unemployment rate; and state specific linear year trends. Columns 2, 4, 6, and 8 also include an
interaction between baseline uninsurance and a linear year trend. Standard errors are clustered at the state level.
** - p < .05, * - p < .10

45
Table 8: Impact of Controlling for Medicaid/Private Fee Ratios
Uninsurance Unemployment % < FPL
Interaction Interaction Interaction
(1) (2) (3) (4)
Panel A: Fee Data Sample, No Fee Ratio Control
Eligibility -0.019 -0.017 -0.024 -0.022
(0.017) (0.018) (0.017) (0.017)
Eligibility X 0.031* 0.017 0.012
Crowd-Out Proxy (0.019) (0.021) (0.015)
Panel B: Fee Data Sample, Including Medicaid/Private Fee- Ratio Control
Eligibility -0.022 -0.020 -0.027 -0.025
(0.017) (0.018) (0.017) (0.017)
Eligibility X 0.031* 0.016 0.011
Crowd-Out Proxy (0.019) (0.021) (0.015)
Fee Ratio 0.014 0.014 0.014 0.015
(0.015) (0.014) (0.015) (0.015)
Notes: Each column presents coefficient estimates from separate regressions of whether a hospital offers a NICU in
a given year on the fraction of women eligible for Medicaid in the hospital’s state and year. Panels A includes the
sample of hospitals from the 45 states with available fee data. Panel B includes the Medicaid to private obstetric fee
ratio as an additional control variable. This specification utilizes Fee Ratio 1 which inflates private fees using
census-division-level physician-office-visit fees. In Column 2 eligibility is interacted with the hospital’s state-level
baseline (1985) uninsurance rate. In Column 3 eligibility is interacted with the county-level baseline (1985)
unemployment rate. In Column 4 eligibility is interacted with the hospital’s county-level baseline (average of 1979
and 1989) fraction below the federal poverty line. All regressions include hospital fixed effects; year dummies;
county level controls for number of births, number of low birth weight births, infant mortality rate, population,
female population by age, per-capita income and unemployment rate; state-specific linear year trends; and an
interaction between baseline uninsurance, unemployment, or fraction below poverty line and a linear year trend.
Standard errors are clustered at the state level.
** - p < .05, * - p < .10

46
Table 9: Robustness Tests
Weighted
Results
Exclude
Closing
Hospitals
Assume
NICUs Do
Not Close
Hazard
Sample Controlling for Competition
(1) (2) (3) (4) (5) (6) (7)
Eligibility -0.013 -0.001 -0.043 0.007 -0.009 -0.004 -0.007
(0.038) (0.020) (0.026) (0.018) (0.018) (0.024) (0.018)
Eligibility X 0.137*** 0.065** 0.051* 0.029* 0.050** 0.057** 0.053**
1985 Uninsurance (0.030) (0.023) (0.031) (0.016) (0.022) (0.025) (0.023)
# of Other NICUs -0.003
In County (0.004)
Fraction of Other Hospitals 0.032*
In County With NICUs (0.018)
Birth HHI in County -0.005
(0.019)
N 44,607 42,054 44,607 35,765 40,614 24,284 38,605
Notes: Each column presents coefficient estimates from separate regressions of whether a hospital offers a NICU in
a given year on the fraction of women eligible for Medicaid in the hospital’s state and year. Column 1 runs a
weighted regression by the number of births delivered by each hospital in 1985; Column 2 excludes hospitals that
close at any time during the sample period; Column 3 constructs the dependent variable by assuming that NICUs do
not close; Column 4 adopts a hazard model sample by excluding hospitals that already operated a NICU in 1985 and
observations of hospitals after adoption occurs; Columns 5 through 7 include controls for county-level NICU
competition. All regressions include hospital fixed effects; year dummies; county-level controls for number of
births, number of low birth weight births, infant mortality rate, population, female population by age, per-capita
income and unemployment rate, state-specific time trends and an interaction between baseline uninsurance and a
linear year trend. Standard errors are clustered at the state level.
** - p < .05, * - p < .10

47
Table 10: Effects of Medicaid Eligibility on NICU Adoption by Level
Uninsurance
Unemployment
% < FPL
Interaction
Interaction
Interaction
(1)
(2)
(3)
(4)
Panel A: High-Level NICU Adoption
Eligibility 0.007
0.005
0.006
0.009
(0.010)
(0.009)
(0.010)
(0.011)
Eligibility X
0.018**
0.004
-0.007
Crowd-Out Proxy
(0.007)
(0.009)
(0.007)
Panel B: Mid-Level NICU Adoption
Eligibility -0.011
-0.013
-0.015
-0.021
(0.018)
(0.019)
(0.019)
(0.018)
Eligibility X
0.038*
0.034
0.040*
Crowd-Out Proxy
(0.020)
(0.023)
(0.022)
Notes: Each column presents coefficient estimates from separate regressions of whether a hospital offers high-level
or mid-level NICUs in a given year on the fraction of women eligible for Medicaid in the hospital’s state and year.
Panels A and B report results for high-level NICU and mid-level NICU, respectively. In Column 2 eligibility is
interacted with the hospital’s state-level baseline (1985) uninsurance rate. In Column 3 eligibility is interacted with
the county-level baseline (1985) unemployment rate. In Column 4 eligibility is interacted with the hospital’s county-
level baseline (average of 1979 and 1989) fraction below the federal poverty line. All regressions include hospital
fixed effects; year dummies; county-level controls for number of births, number of low birth weight births, infant
mortality rate, population, female population by age, per-capita income and unemployment rate; state specific linear
year trends; and an interaction between baseline uninsurance, unemployment, or fraction below poverty line and a
linear year trend. Standard errors are clustered at the state level.
** - p < .05, * - p < .10

48
Table 11: Effect of Medicaid Eligibility on County-Level Low-Birth-Weight Infant Mortality
Uninsurance Unemployment Percent < FPL
Interaction Interaction Interaction
(1) (2) (3) (4)
Panel A: Full Sample (N=1,593)
Eligibility -0.009 -0.009 -0.011 -0.007
(0.007) (0.007) (0.008) (0.007)
Eligibility X 0.0003 -0.007 0.006
Crowd-Out Proxy (0.005) (0.007) (0.005)
Panel B: Low Medicaid/Private Fee Ratio States (N=1,010)
Eligibility -0.013 -0.013 -0.017 -0.011
(0.009) (0.009) (0.011) (0.008)
Eligibility X -0.003 -0.011 0.003
Crowd-Out Proxy (0.006) (0.013) (0.008)
Panel C: High Medicaid/Private Fee Ratio States (N=462)
Eligibility 0.007 0.004 0.003 0.007
(0.010) (0.012) (0.014) (0.011)
Eligibility X 0.003 -0.006 0.005
Crowd-Out Proxy (0.010) (0.009) (0.011)
Notes: Each column presents coefficient estimates from separate regressions of county level infant mortality rates on
the fraction of women eligible for Medicaid in the state and year. Panel A includes the full sample of counties. Panel
B includes counties in states with Medicaid to private obstetric fee ratios below 0.41 and Panel C includes counties
in states with fee ratios above 0.41. In Columns 2 eligibility is interacted with the state-level baseline (1985)
uninsurance rate. In Columns 3 eligibility is interacted with the county level baseline (1985) unemployment rate. In
Columns 4 eligibility is interacted with the hospital’s county level baseline (average of 1979 and 1989) fraction
below the federal poverty line. All regressions include county fixed effects; year dummies; county level controls for
number of births, number of low birth weight births, population, female population by age, per-capita income and
unemployment rate. They also include county-level averages of individual-level infant characteristics including
mother’s age, race, and education; sex of the infant; and multiple birth status. All regressions include state-specific
linear year trends. Columns 2 through 4 include an interaction between baseline uninsurance, unemployment, or
fraction below poverty line and a linear year trend. Standard errors are clustered at the state level.
** - p < .05, * - p < .10

49
Appendix 1: AHA Data-Cleaning Steps
In our full sample of AHA data spanning 1980 to 2000, 6 percent of hospital-year observations
have missing values for the number of neonatal intensive or intermediate care beds. However, it is often
the case that the same hospital will have reported a value for the number of beds for the year before and
after the missing value. If a cell is missing intensive or intermediate care beds but the values for that
hospital in the year before and after are the same, we use that value to fill in the missing cell. This step
fills in about half of the missing values in those variables; only about 3 percent of hospital-year
observations are missing values for either of the two bed variables in our final data set, which spans 1985
to 1996.
Second, we define the NICU indicator variable as one if the number of total neonatal intermediate
and neonatal intensive care beds is greater than zero. The NICU indicator is thus initially missing for 3
percent of observations. However, since we only need to know whether the number of beds is positive for
this indicator, we can apply the “before and after” rule by looking at the number of beds variable here to
fill in additional missing values for this indicator variable; this step fills in about one third of the
remaining 3 percent of cells with missing values for NICU indicator. Third, we fill in any additional
missing values of the indicator variable if its previous two years have the same value. The above
procedures fill in most of the missing values in the data. There are about 100 to 150 observations (0.13
percent of the total observation) that remain missing after this step, and we fill in those remaining missing
values with the previous year’s value.
In addition to missing values, we also observe a small number of instances of inconsistent
reporting of whether or not a hospital has NICU beds from year to year. It is unlikely that a hospital will
intermittently have a NICU on a yearly basis, so we use two rules to address this inconsistency in
reporting in the created NICU dummy variable. Rule A is to convert zeros to ones if a hospital’s reported
beds indicate no NICU in three or fewer consecutive years but indicate a NICU in the year (s) right after
or before. We then similarly convert ones to zeros if a hospital indicates a NICU in three or fewer
consecutive years but no NICU in the surrounding years. Rule B creates an alternative series by reversing

50
these two steps, first converting intervals of ones to zeros and then intervals of zeros to ones. To decide
which rule is used for each hospital, we use the count of zeros and ones after we see the first transition
(either from one to zero or zero to one) in the raw data. If the number of ones is equal to or bigger than
the number of zeros, we apply rule A; otherwise rule B is applied.26
This correction for intermittent NICU
reporting changes less than 1 percent (892/78824) of observations in the data at the hospital-year level,
and about 12 percent (497/4125) of the hospitals are affected. Also note that we perform this data
cleaning on the full panel of data from 1980 to 2000 even though our analysis sample only includes 1985
through 1996. Therefore, even if a short interval of zeros or ones occurs at the beginning or end of our
analysis sample, we are able to use additional data from outside the analysis period to verify and correct
inconsistent reporting.
Appendix 2: Extending Medicaid to physician fee ratio series
In order to control for time-varying differences in fee ratios in our sample, we extend the data
initially collected for 1985-1993 to include 1994-1996. For 1993 through 1996, Medicaid fees are
collected from a survey of states conducted by Bradley Gray and Kosali Simon. The fee we use covers the
total OB/GYN reimbursement for a vaginal delivery. Unfortunately, the AHA financial data used to
adjust the private fees according to hospital cost growth are now restricted and not easily obtainable.
Instead, we obtain data from the American Medical Association Socioeconomic Monitoring System on
physician-office-visit reimbursements. These data report the mean physician-office-visit fee from private
payers annually by census division. They also report the annual nationwide average OB/GYN office visit
reimbursement. We therefore calculate multiple versions of the Medicaid to private fee ratio for 1993-
1996 using three different inflators to project the denominator of Currie et al. (1995)’s 1992 value
26
We use a simple example to illustrate how the data is corrected using the rules. For example, we observe in the
data that a hospital’s NICU indicator variable has values across time of 001000100. Applying Rule A leads to
001111100, and applying Rule B provides 000000000. In the example, the first transition happens at year 3; the
count of zeros after year 3 is 5; and the count of ones is 2. Since the hospital has more zeros than ones, Rule B will
be used to adjust the data.

51
forward. Fee Ratio 1 inflates the denominator utilizing the census-division-level growth rate of physician-
office-visit reimbursements. Fee Ratio 2 utilizes the nationwide growth rate of OB/GYN office visit fees.
Fee Ratio 3 calculates the average growth rate of the denominator by state from 1985-1992 from Currie et
al. (1995)’s data and applies this average growth rate to subsequent years by state. Fee data is missing for
Alaska, Arizona, Kentucky, Rhode Island, Texas and Wyoming, so these states are excluded from
analysis incorporating these fee indices.
Appendix Figure 1 shows mean Medicaid Obstetric Fees and the three Medicaid to private fee
ratios over time. Medicaid fees trend upward over the time period, and the ratio trends upward as well
until 1993 when it begins to fall, as Medicaid fees grow more slowly than private fees.

52
Appendix Figure 1: Medicaid Obstetric Fee and Medicaid to Private Fee Ratio, 1985-1996
Notes: Fee Ratio 1 inflates private fees after 1992 using census-division-level physician-office-visit fees. Fee Ratio
2 inflates private fees using nationwide obstetric-office-visit fees. Fee Ratio 3 inflates private fees using the average
growth rate of private fees prior to 1992.

53
Appendix Table 1: Controlling for Medicaid/Private Fee Ratios
Uninsurance Unemployment % < FPL
Interaction Interaction Interaction
(1) (2) (3) (4)
Panel A: Fee Data Sample, No Fee Ratio Control Eligibility -0.019 -0.017 -0.024 -0.022
(0.017) (0.018) (0.017) (0.017)
Eligibility X 0.031* 0.017 0.012
Crowd-Out Proxy (0.019) (0.021) (0.015)
Panel B: Fee Ratio 1, Extend Private Fees with Census-Division-Physician-Fee Growth Eligibility -0.022 -0.020 -0.027 -0.025
(0.017) (0.018) (0.017) (0.017)
Eligibility X 0.031* 0.016 0.011
Crowd-Out Proxy (0.019) (0.021) (0.015)
Fee Ratio 0.014 0.014 0.014 0.015
(0.015) (0.014) (0.015) (0.015)
Panel C: Fee Ratio 2, Extend Private Fees with National OB Fee Growth Eligibility -0.024 -0.022 -0.028 -0.027
(0.017) (0.018) (0.017) (0.017)
Eligibility X 0.030 0.016 0.010
Crowd-Out Proxy (0.018) (0.021) (0.015)
Fee Ratio 0.019 0.018 0.019 0.019
(0.015) (0.015) (0.015) (0.015)
Panel D: Fee Ratio 3, Extend Private Fees with Mean AHA Growth 1985-1992 Eligibility -0.024 -0.022 -0.028 -0.027
(0.017) (0.018) (0.017) (0.017)
Eligibility X 0.030 0.016 0.010
Crowd-Out Proxy (0.018) (0.021) (0.015)
Fee Ratio 0.018 0.017 0.018 0.019
(0.015) (0.014) (0.015) (0.015)
Notes: See notes to Table 8. This table includes specifications controlling for alternative versions of Medicaid to
private obstetric fees.


![NATIONAL HOSPITAL INSURANCE FUND ACT Hospital Insurance Fund Act.pdf · LAWS OF KENYA NATIONAL HOSPITAL INSURANCE FUND ACT CHAPTER 255 Revised Edition 2012 [1998] Published by the](https://img.dokumen.tips/doc/110x75/5e12f81a5e1d572ccb627d42/national-hospital-insurance-fund-act-hospital-insurance-fund-actpdf-laws-of-kenya.jpg)