Embed Size (px)
Citation preview
Public Health In
Arkansas 2009
Selected Health Statistics
& Health-Related Contacts
2
Prepared by: Martha M. Phillips, PhD, MPH, MBA Melanie Goodell, MPH and Other Faculty and Staff Fay W. Boozman College of Public Health Data and supplemental materials provided by: Arkansas Department of Health Arkansas Center for Health Improvement
Data included are the most recent available from cited sources.

3
Table of Contents Topic Page Directory of Public Health Contacts 6 Chapter 1: General Information: Essential Public Health Services 9 Public Health Challenges in the 21st Century 10 Core Competencies for Public Health Students 11 Diabetes Pathway 12 Heart Disease Pathway 13 Chapter 2: Disease Morbidity and Mortality Leading Causes of Death, 2005 15 3 Leading Causes of Death by Age Group 16 Leading Causes of Unintentional Injury 17 Motor Vehicle Fatalities by Restraint 19 Deaths due to Motor Vehicle Crashes 20 Infant Mortality 21 Contributors to Infant Health 22 Heart Disease Mortality Rates 23 Cancer Incidence Rates 24 Cancer Mortality Rates 25 Stroke Mortality Rates 26 Diabetes Prevalence 27 Oral Health (Ages 18-44) 28 Oral Health (Ages 45-64) 29 Oral Health (Ages 65+) 30 Chapter 3: Underlying Causes of Disease & Risk Factors Current Cigarette Smoking, Adults 32 Current Cigarette Smoking, Youth 33 Current Tobacco Use by Product, Youth 34 Women who Smoked During Pregnancy 35 Overweight & Obese, Adults 36 Overweight & Obese, Children, by Grade 37 Overweight & Obese, Children, By Gender and Ethnic Group 38 Overweight & Obese, Adults, 18-45 By Age Group 39 Overweight & Obese, Adults, 65+ 40

4
Topic Page Physically Inactive Adults, 18-44 yrs 41 Physically Inactive Adults, 45-64 yrs 42 Physically Inactive Adults, 65+ yrs 43 Chapter 4: Disease Prevention Opportunities to Improve Public Health 45 How About Your Constituents? 47 Preventive Vaccinations, Adults 65+ 48 Chapter 5: Access to Care Health Insurance Coverage, Adults, by Type 50 Physicians by County 51 Dentists by County 52 Chapter 6: Geographic Disparities Maps 54 Teen birth rate 55 Preterm births 56 Infant mortality 57 Early prenatal care 58 Low birth weight infants 59 Unintentional injury mortality rates 60 All-cause mortality rates 61 Cancer (all sites) mortality rates 62 Cardiovascular disease mortality rates 63 Diabetes mortality rates 64 Homicide rates 65 Influenza & Pneumonia mortality rates 66 Lung Cancer mortality rates 67 Nutritional deficiencies mortality rates 68 Prostate cancer mortality rates 69 Melanoma mortality rates 70 Suicide mortality rates 71 Binge drinking 72 No flu shot (adults 65+) 73 No HIV test 74 No health insurance (adults) 75 No mammogram 76 Physically Inactive (adults) 77 Obesity (adults) 78
5
Topic Page Maps, continued No Pap test 79 No pneumonia vaccination (adults 65+) 80 Tables (by county) The Social Environment 82 Access to Health Care and Risk Behaviors 84 Nutrition and Fitness 86 Preventive Care and Screenings 88 Health Outcomes and Mortality 92
6
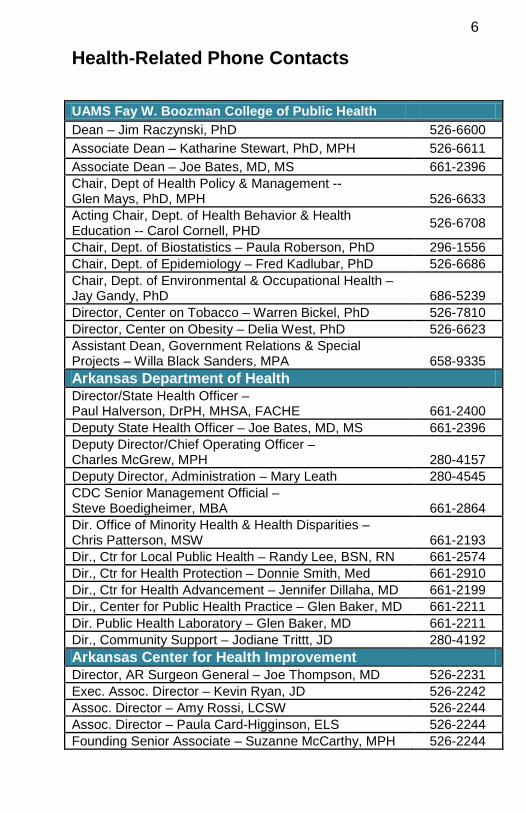
Health-Related Phone Contacts
UAMS Fay W. Boozman College of Public Health Dean – Jim Raczynski, PhD 526-6600 Associate Dean – Katharine Stewart, PhD, MPH 526-6611 Associate Dean – Joe Bates, MD, MS 661-2396 Chair, Dept of Health Policy & Management -- Glen Mays, PhD, MPH
526-6633
Acting Chair, Dept. of Health Behavior & Health Education -- Carol Cornell, PHD 526-6708
Chair, Dept. of Biostatistics – Paula Roberson, PhD 296-1556 Chair, Dept. of Epidemiology – Fred Kadlubar, PhD 526-6686 Chair, Dept. of Environmental & Occupational Health – Jay Gandy, PhD
686-5239
Director, Center on Tobacco – Warren Bickel, PhD 526-7810 Director, Center on Obesity – Delia West, PhD 526-6623 Assistant Dean, Government Relations & Special Projects – Willa Black Sanders, MPA
658-9335
Arkansas Department of Health Director/State Health Officer – Paul Halverson, DrPH, MHSA, FACHE
661-2400
Deputy State Health Officer – Joe Bates, MD, MS 661-2396 Deputy Director/Chief Operating Officer – Charles McGrew, MPH
280-4157
Deputy Director, Administration – Mary Leath 280-4545 CDC Senior Management Official – Steve Boedigheimer, MBA
661-2864
Dir. Office of Minority Health & Health Disparities – Chris Patterson, MSW
661-2193
Dir., Ctr for Local Public Health – Randy Lee, BSN, RN 661-2574 Dir., Ctr for Health Protection – Donnie Smith, Med 661-2910 Dir., Ctr for Health Advancement – Jennifer Dillaha, MD 661-2199 Dir., Center for Public Health Practice – Glen Baker, MD 661-2211 Dir. Public Health Laboratory – Glen Baker, MD 661-2211 Dir., Community Support – Jodiane Trittt, JD 280-4192 Arkansas Center for Health Improvement Director, AR Surgeon General – Joe Thompson, MD 526-2231 Exec. Assoc. Director – Kevin Ryan, JD 526-2242 Assoc. Director – Amy Rossi, LCSW 526-2244 Assoc. Director – Paula Card-Higginson, ELS 526-2244 Founding Senior Associate – Suzanne McCarthy, MPH 526-2244

7
UAMS – Area Health Education Centers (AHEC) Executive Director, AHEC Central Office – Mark B. Mengel, MD, MPH 501-686-5260
Dir., AHEC Northwest – Robert R. Gullett, Jr, MD 479-521-8269 Dir., AHEC Fort Smith – Don Heard, EdD 479-785-2431 Dir., AHEC Southwest – William McIntyre, PharmD 870-779-6000 Dir., AHEC North Central – Dennis Moore, PharmD 870-612-2147 Interim Dir., AHEC Northeast – Ron Cole, MBA 870-972-9603 Dir., AHEC Pine Bluff – Eddie Maples, RN, RRT 870-541-7611 Dir., Delta AHEC – Becky Hall, EdD 870-572-2727 Interim Dir., AHEC South AR – Michael Fitts, PsyD 870-862-2489 UAMS – Arkansas Aging Initiative Director – Claudia Beverly, PhD 686-5979 Minority Health Commission Director 686-2720 Medical Director – Creshelle Nash, MD, MPH 686-2748 Mental Health Council of Arkansas Exec. Vice President – Pam Christie 372-7062 Arkansas Tobacco Commission Exec. Director – Aaron Parish Black, JD, MPA 683-0074 Arkansas Foundation for Medical Care CEO – Nick Pasilidis, MD 375-5700
ext 861 Arkansas Health Care Association Exec. Director – Randy Wyatt 374-4422 Arkansas Prostate Cancer Foundation Director – Helen Baldwin 603-7433 American Cancer Society Dir, State Government Relations – Jason Brady 603-5212 Arkansas Hospital Association Exec. Vice President – Robert “Bo” Ryall 224-7878 Arkansas Heart Association Dir., AR State Advocacy – Barbara Kumpe 379-1182 Arkansas Medical Society Dir., Governmental Affairs – Scott Smith 224-8967 Arkansas Nurses Association President – Jean Zehler, MSE, RN-BC, NE-BC 244-2363 Community Health Centers of Arkansas, Inc. Executive Director – Sip Mouden 374-8225

8
CHAPTER 1
General Information

9
Essential Public Health Services 1. Monitor health status to identify and solve health problems. 2. Diagnose and investigate health problems and health hazards. 3. Inform, educate, and empower people about health issues. 4. Mobilize community partnerships and action to identify and solve health problems. 5. Develop policies and plans that support individual and community health efforts. 6. Enforce laws and regulations that protect health and ensure safety. 7. Link people to needed personal health services and assure the provision of health care when otherwise unavailable. 8. Assure competent public and personal health care workforce. 9. Evaluate effectiveness, accessibility, and quality of personal and population-based health services. 10. Research for new insights and innovative solutions to health problems.
Source: Public Health Functions Steering Committee (1994)

10
Public Health Challenges in the 21st Century 1. Chronic diseases • Lifestyle and other risks • Lifestyle change programs 2. Infectious diseases • Viral and bacterial • Safe food, water, limit sources of spread of infectious diseases 3. Other health risks – injury, drugs, etc. 4. Groups at high risk 5. Preparedness – Emerging threats • Diseases – e.g., AIDS, SARS, West Nile Virus, monkey pox • Terrorism/disasters – biological, chemical, nuclear, other • Natural disasters – hurricanes, earthquakes, tornados Source: UAMS, Fay W. Boozman College of Public Health

11
Core Competencies for Students Seeking Masters of Public Health
Degrees

12
Diabetes Pathway Obesity/Physical Activity
Glucose elevations
Insulin insufficiency
Metabolic abnormalities
Diabetes
Arteriolar damageRetinal diseaseAmputations
Renal dialysis Heart attack
Renal failure Cardiac death
Source: Arkansas Center for Health Improvement

13
Heart Disease Pathway
Tobacco / Obesity/Physical Activity
High cholesterol /Limited blood flow
Coronary arteryblockage
Heart attack
Cardiac disability
Cardiac death
Source: Arkansas Center for Health Improvement

14
CHAPTER 2
Disease Morbidity and Mortality
15
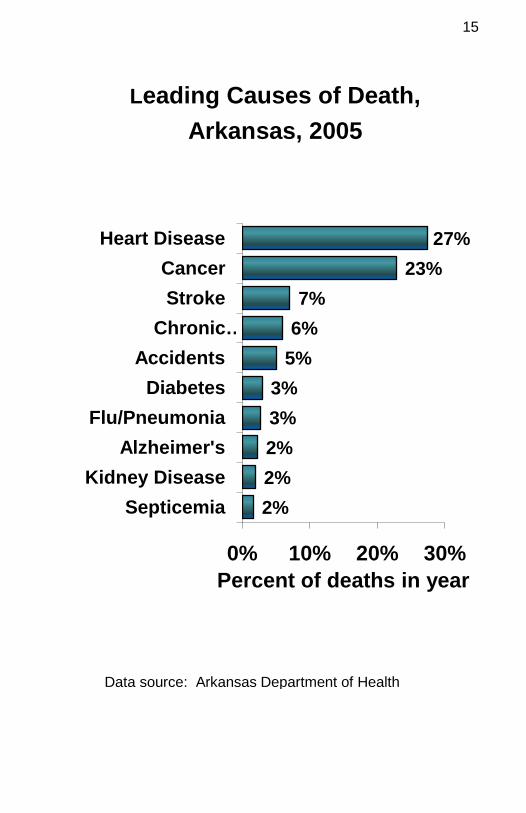
Leading Causes of Death, Arkansas, 2005
2%2%2%3%3%
5%6%7%
23%27%
0% 10% 20% 30%
SepticemiaKidney Disease
Alzheimer'sFlu/Pneumonia
DiabetesAccidents
Chronic …StrokeCancer
Heart Disease
Percent of deaths in year
Data source: Arkansas Department of Health

16
Leading Causes of Death By Age Group, Arkansas, 2005
Injury is the leading cause of death in every age group between 1 and 45 years.
Age Group
Rank
1 2 3
< 1 year Congenital anomalies
Sudden infant death Short gestation
1–4 years Injury Homicide 4 conditions tied for 3rd position
5–14 years Injury Cancer Homicide
15–19 years Injury Suicide Homicide
20-44 years Injury Heart disease Cancer
45-64 years Cancer Heart disease Injury
65+ years Heart disease Cancer Stroke
Data source: Arkansas Department of Health

17
Data source: Centers for Disease Control and Prevention

18
In 2006, just under 250,000 years of potential life were lost because of deaths among Arkansas citizens under the age of 75. – 13% lost because of injury deaths– 27% lost to cancer deaths– 28% lost of heart disease deaths
Many of those deaths were preventable.
19
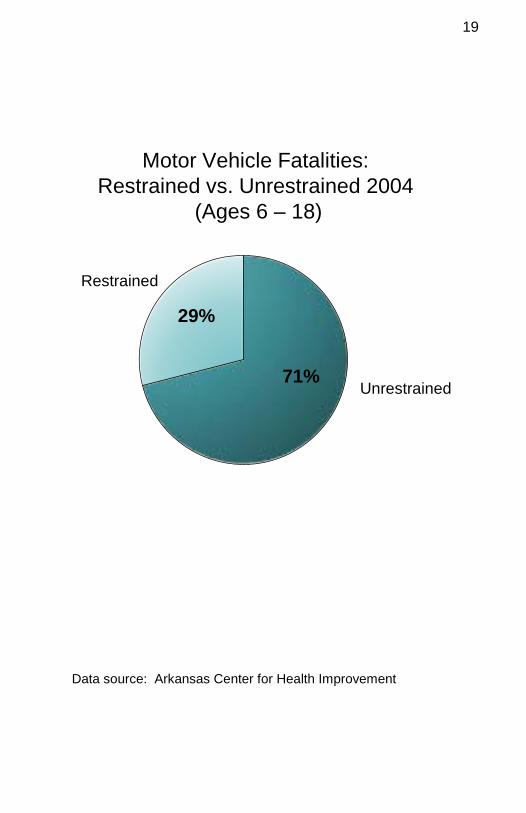
Data source: Arkansas Center for Health Improvement
Motor Vehicle Fatalities:Restrained vs. Unrestrained 2004
(Ages 6 – 18)
71%
29%
Restrained
Unrestrained

20
Data source: Arkansas Center for Health Improvement
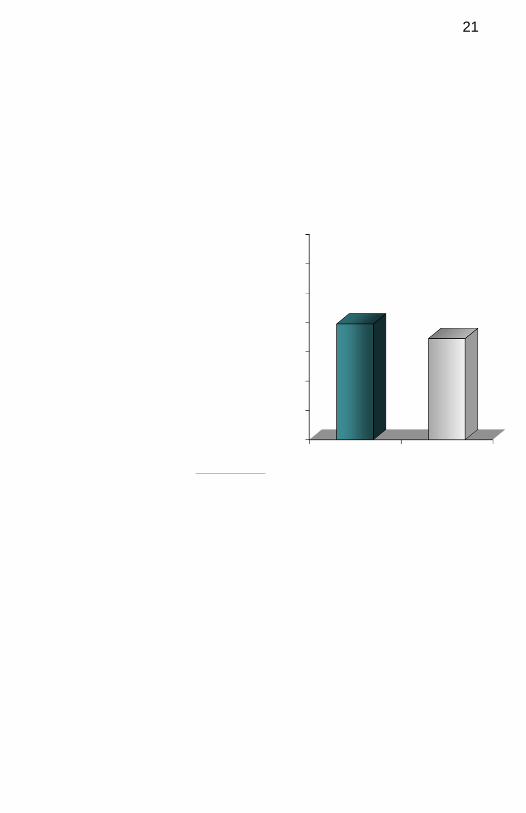
21

22
Contributors to Infant Health, 2005
AR US
Preterm births (% of all live births) 13.4 12.7
Low birth weight (% of all live births)8.9 8.2
Percentage of mothers beginning prenatal care in first trimester
80.6 83.9
Data source: National Vital Statistics Reports

23
Heart Disease Mortality Rates (Age-adjusted), Arkansas vs. US, 2005
0
50
100
150
200
250
300
AR US
228.4211.1
Dea
ths
per 1
00,0
00 p
opul
atio
n
Arkansas’ heart disease mortality rates are the eighth highest in the US.
Data source: Centers for Disease Control and Prevention

24
Data source: Centers for Disease Control and Prevention

25
Data source: Centers for Disease Control and Prevention

26
Stroke Mortality Rates (Age-adjusted), Arkansas vs. US, 2005
0
10
20
30
40
50
60
70
80
90
100
AR US
58.6
46.6
Dea
ths
per 1
00,0
00 p
opul
atio
n
Arkansas has the highest stroke mortality rates in the US.
Data source: Centers for Disease Control and Prevention
27
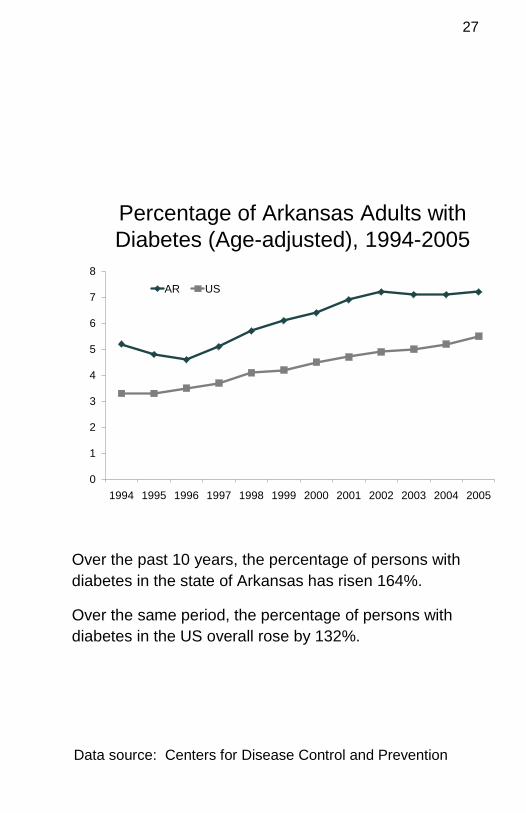
Percentage of Arkansas Adults with Diabetes (Age-adjusted), 1994-2005
0
1
2
3
4
5
6
7
8
1994 1995 1996 1997 1998 1999 2000 2001 2002 2003 2004 2005
AR US
Over the past 10 years, the percentage of persons with diabetes in the state of Arkansas has risen 164%.
Over the same period, the percentage of persons with diabetes in the US overall rose by 132%.
Data source: Centers for Disease Control and Prevention

28
Oral Health, Arkansas v. US Adults (18-45 years), 2006
0
10
20
30
40
50
60
70
80
90
58.7
82.9
69.1
85.9
58.1
71.165.9
75.6
62.8
53.2
72.565.1
Perc
enta
ge
AR US
18-24 18-2425-34 25-3435-44 35-44Visited dentist within past year
No permanentteeth extracted
62% of Arkansans are NOT covered by dental insurance.
Source: Arkansas Department of Health, Office of Oral Health
Data source: Centers for Disease Control and Prevention, Behavioral Risk Factor Surveillance Survey

29
Data source: Centers for Disease Control and Prevention, Behavioral Risk Factor Surveillance Survey

30
Data source: Centers for Disease Control and Prevention, Behavioral Risk Factor Surveillance Survey

31
CHAPTER 3
Underlying Causes of Disease & Risk Factors

32
Current Cigarette Smoking among Arkansas Adults, 1991-2007
Source: Centers for Disease Control and Prevention, Youth Risk Behavior Survey
0
5
10
15
20
25
30
35
Perc
enta
ge

33

34
Current Users of Tobacco by Product, Arkansas vs. US Teens,
2007
0
5
10
15
20
25
30
Cigarettes Smokeless Tobacco Cigars
20.7
11.2
17.420
7.9
7.0
Perc
enta
gee
AR US
Data source: Centers for Disease Control and Prevention, Youth Risk Behavior Survey
35
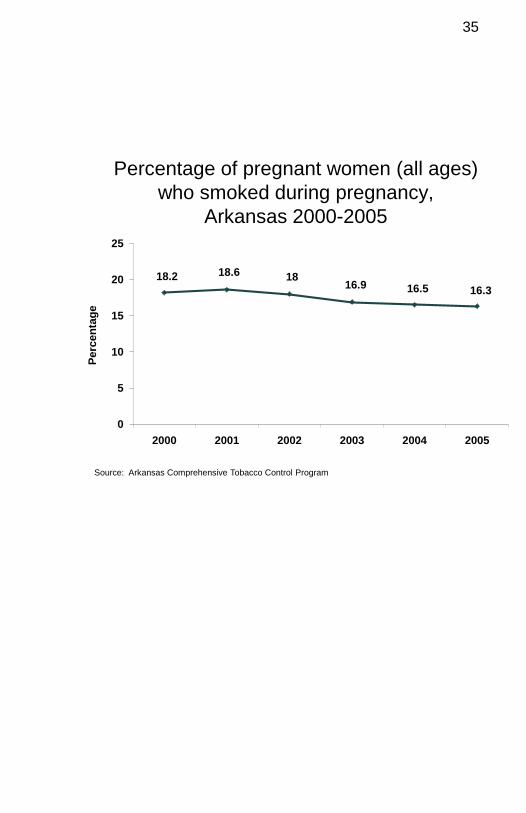
Percentage of pregnant women (all ages) who smoked during pregnancy,
Arkansas 2000-2005
18.2 18.6 1816.9 16.5 16.3
0
5
10
15
20
25
2000 2001 2002 2003 2004 2005
Perc
enta
ge
Source: Arkansas Comprehensive Tobacco Control Program

36
Percentage of Arkansas & US Adults Who Are Overweight or Obese (BMI ≥ 25),
1996-2006
0102030405060708090
100
1996 1998 2000 2002 2004 2006
55 5560 61 63 63
52 55 57 59 60 62
Perc
ent
AR US
Data source: Centers for Disease Control and Prevention, Behavioral Risk Factor Surveillance Survey

37
Percent of Students Classified as Overweight or Obese by Grade, 2007-08
15.819.3
22.8 23.8 21.7 20.4
17.315.9
17.7 18.118.1
17.2
0
5
10
15
20
25
30
35
40
45
K 2 4 6 8 10
Obese Overweight
Data source: Arkansas Center for Health Improvement
38
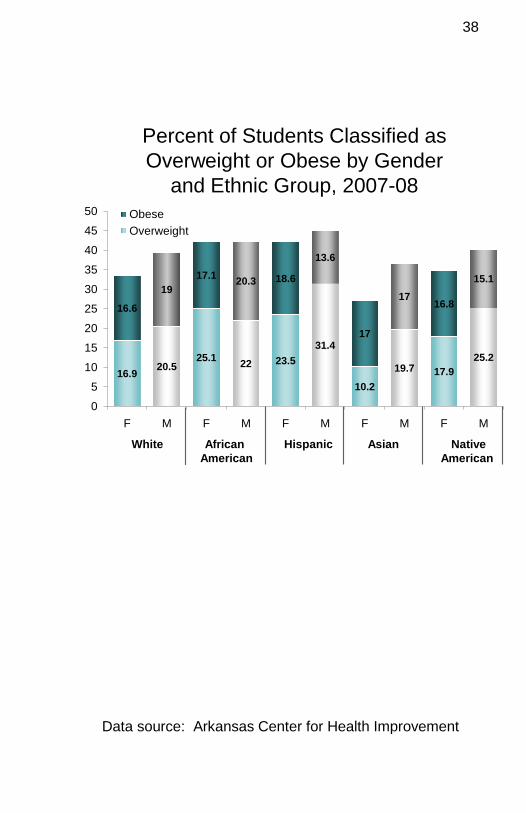
Percent of Students Classified as Overweight or Obese by Gender
and Ethnic Group, 2007-08
16.9 20.525.1 22 23.5
31.4
10.2
19.7 17.925.2
16.6
1917.1 20.3 18.6
13.6
17
1716.8
15.1
0
5
10
15
20
25
30
35
40
45
50
F M F M F M F M F M
ObeseOverweight
White African Hispanic Asian Native American American
Data source: Arkansas Center for Health Improvement

39
Overweight and Obese Adults, 18-44 years, Arkansas v. US, 2007
0
5
10
15
20
25
30
35
40
19.6
26.226.2
16.3
26
34.934.9
26
36.834.2
36.7
28.7
Perc
enta
ge
AR US
18-24 18-2425-34 25-3435-44 35-44
Overweight Obese
Data source: Centers for Disease Control and Prevention, Behavioral Risk Factor Surveillance Survey

40
Overweight and Obese Adults65+ years, Arkansas v. US, 2007
0
5
10
15
20
25
30
35
40
45 42.2 40.7
20.623.0
Perc
enta
ge
AR US
Overweight Obese
Data source: Centers for Disease Control and Prevention, Behavioral Risk Factor Surveillance Survey

41
Percentage of Adults (18-44 years) who are Physically Inactive, Arkansas v. US, 2007
0
5
10
15
20
25
30
20.617.1
18.9 18.6
27.3
19.3
Perc
enta
ge
AR US
18-24 25-34 35-44
Data source: Centers for Disease Control and Prevention, Behavioral Risk Factor Surveillance Survey

42
Data source: Centers for Disease Control and Prevention, Behavioral Risk Factor Surveillance Survey
Physically Inactive Adults (aged 45-64 years), Arkansas v. US, 2007
0
5
10
15
20
25
30
35 29.8
22.4
33.8
25.6
Perc
enta
ge
AR US
45-54 55-64
43
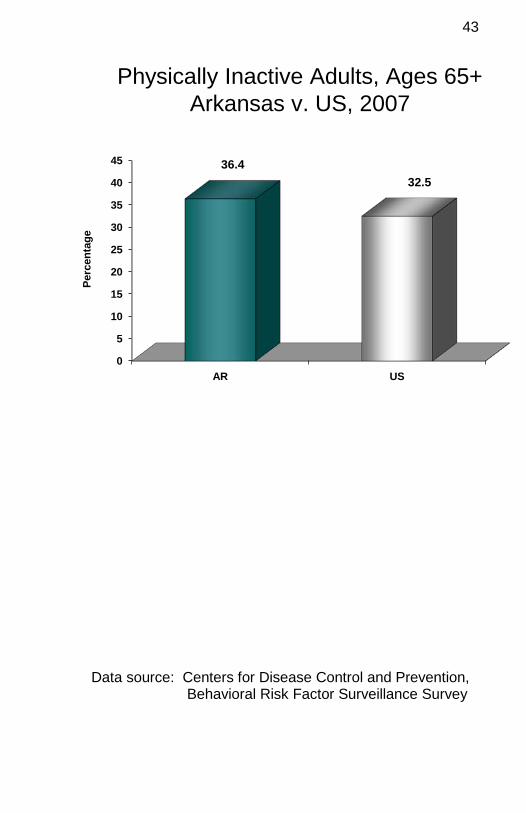
Physically Inactive Adults, Ages 65+ Arkansas v. US, 2007
0
5
10
15
20
25
30
35
40
45
AR US
36.432.5
Perc
enta
ge
Data source: Centers for Disease Control and Prevention, Behavioral Risk Factor Surveillance Survey
44
CHAPTER 4
Disease Prevention
45
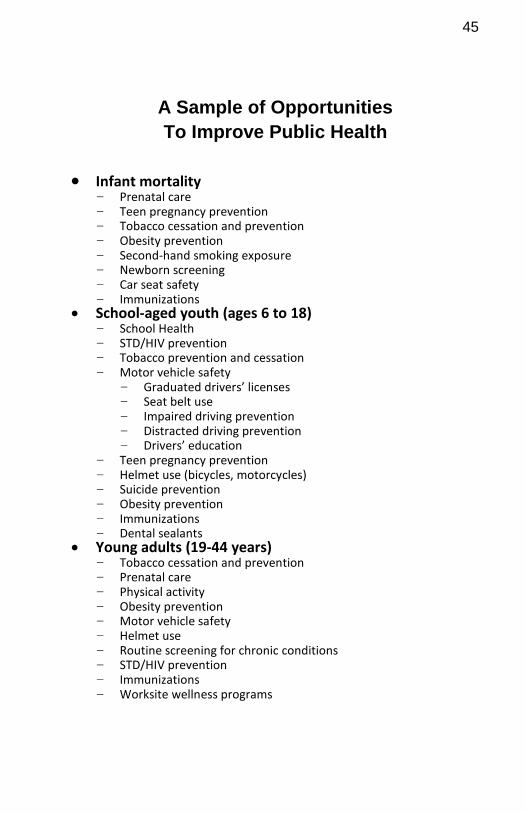
A Sample of Opportunities To Improve Public Health
• Infant mortality
- Prenatal care - Teen pregnancy prevention - Tobacco cessation and prevention - Obesity prevention - Second-hand smoking exposure - Newborn screening - Car seat safety - Immunizations
• School-aged youth (ages 6 to 18) - School Health - STD/HIV prevention - Tobacco prevention and cessation - Motor vehicle safety
- Graduated drivers’ licenses - Seat belt use - Impaired driving prevention - Distracted driving prevention - Drivers’ education
- Teen pregnancy prevention - Helmet use (bicycles, motorcycles) - Suicide prevention - Obesity prevention - Immunizations - Dental sealants
• Young adults (19-44 years) - Tobacco cessation and prevention - Prenatal care - Physical activity - Obesity prevention - Motor vehicle safety - Helmet use - Routine screening for chronic conditions - STD/HIV prevention - Immunizations - Worksite wellness programs

46
• Middle year adults (45-64 years) - Worksite wellness programs - Obesity prevention - Routine screening for chronic conditions - STD/HIV prevention - Immunizations
• Older adults (65+ years) - Adult nutrition - Physical activity - Chronic disease management - In-home services and hospice - Immunizations - Motor vehicle safety - Prevention of falls
• For all ages - Environmental health
- Drinking water safety - Food safety - Milk safety - Septic tank safety - Potential environmental hazards (landfills, gasoline storage,
chemical stockpiles, nuclear reactors, etc.) - Medical waste disposal
- Emergency preparedness - Pandemic flu - Bio-terroristic threats - Natural disasters (earthquakes, tornadoes, floods, hurricanes)
- Infectious disease prevention and control - Tuberculosis - Whooping cough (pertussis) - Measles - Chicken pox - Mumps - Meningitis - Others
- Violence prevention - Access to healthcare services
- Medical - Dental - Preventive - Health insurance - Provider availability
- Oral health - Water fluoridation
- Fire injury prevention - Smoke detectors - Sprinkler systems
47
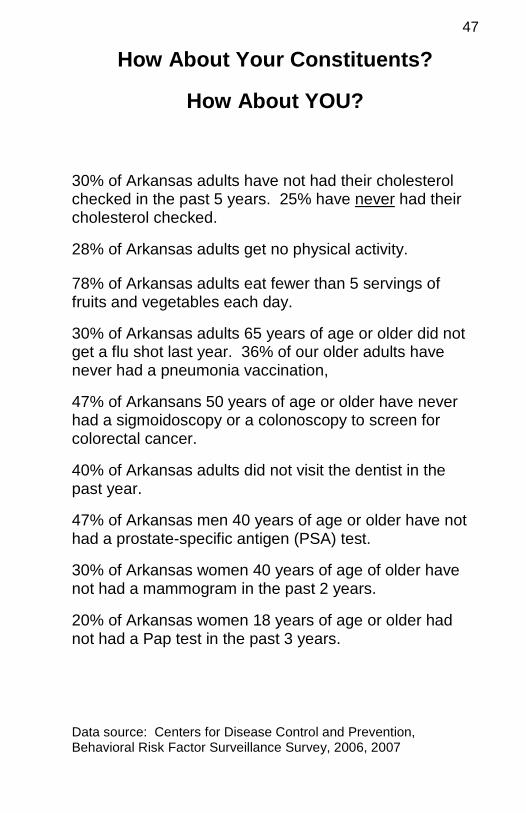
How About Your Constituents?
How About YOU?
30% of Arkansas adults have not had their cholesterol checked in the past 5 years. 25% have never had their cholesterol checked.
28% of Arkansas adults get no physical activity.
78% of Arkansas adults eat fewer than 5 servings of fruits and vegetables each day.
30% of Arkansas adults 65 years of age or older did not get a flu shot last year. 36% of our older adults have never had a pneumonia vaccination,
47% of Arkansans 50 years of age or older have never had a sigmoidoscopy or a colonoscopy to screen for colorectal cancer.
40% of Arkansas adults did not visit the dentist in the past year.
47% of Arkansas men 40 years of age or older have not had a prostate-specific antigen (PSA) test.
30% of Arkansas women 40 years of age of older have not had a mammogram in the past 2 years.
20% of Arkansas women 18 years of age or older had not had a Pap test in the past 3 years.
Data source: Centers for Disease Control and Prevention, Behavioral Risk Factor Surveillance Survey, 2006, 2007

48
Data source: Centers for Disease Control and Prevention, Behavioral Risk Factor Surveillance Survey

49
CHAPTER 5
Access to Care

50
Health Insurance Coverage for Arkansas v. US Adults, 19-64
(2005-2006)
AR # AR % US %
Employer 987,040 58 63
Individual 93,650 6 6
Medicaid 93,490 6 8
Other Public 97,860 6 3
Uninsured 420,810 25 20
Data source: Kaiser Foundation, statehealthfacts.org

51
Physicians per 10,000 population (Physicians recorded by county of residence, which may
not reflect county of practice)
Data source: Arkansas Center for Health Statistics

52
Dentists per 10,000 population (Physicians recorded by county of residence, which may
not reflect county of practice)
Data source: Arkansas Center for Health Statistics

53
CHAPTER 6
Geographic Disparities

54
Geographic Disparities
Maps
Maps included address: Infant mortality and low birthweight – purple Mortality – burgundy Risk factors and preventive care – green Lighter colors indicate areas with “better” values. Darker colors indicate areas with “worse” values.

55
Teen birth rate 2006
Data source: Arkansas Department of Health

56
Preterm births, 2002-2005
(as percentage of live births)
Data source: March of Dimes Peristats

57
Infant mortality, 2004
(deaths per 1000 live births)
Data source: National Center for Health Statistics

58
Percentage of mothers receiving
early (1st trimester) prenatal care (as percentage of all live births)
Data source: March of Dimes Peristats
59
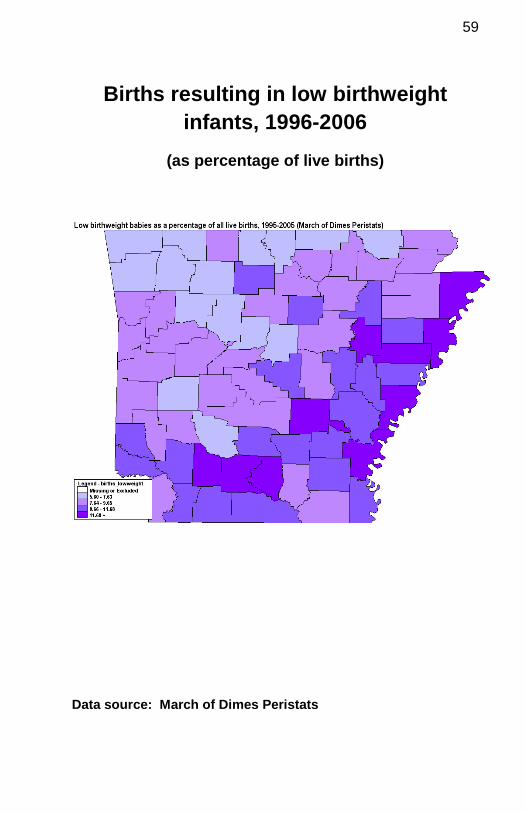
Births resulting in low birthweight infants, 1996-2006
(as percentage of live births)
Data source: March of Dimes Peristats
60
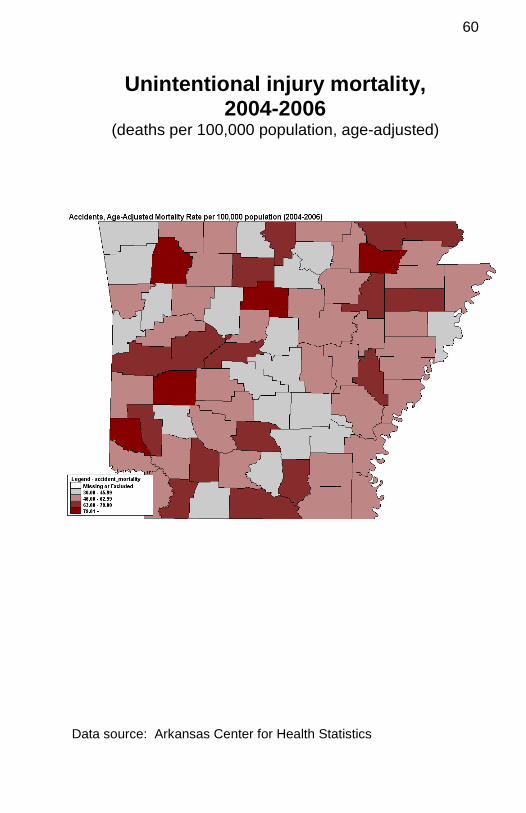
Unintentional injury mortality,
2004-2006 (deaths per 100,000 population, age-adjusted)
Data source: Arkansas Center for Health Statistics
61
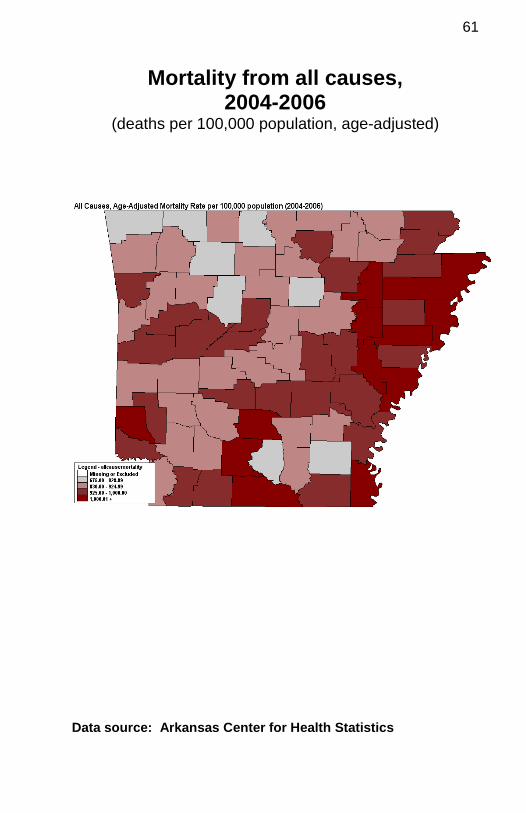
Mortality from all causes,
2004-2006 (deaths per 100,000 population, age-adjusted)
Data source: Arkansas Center for Health Statistics
62
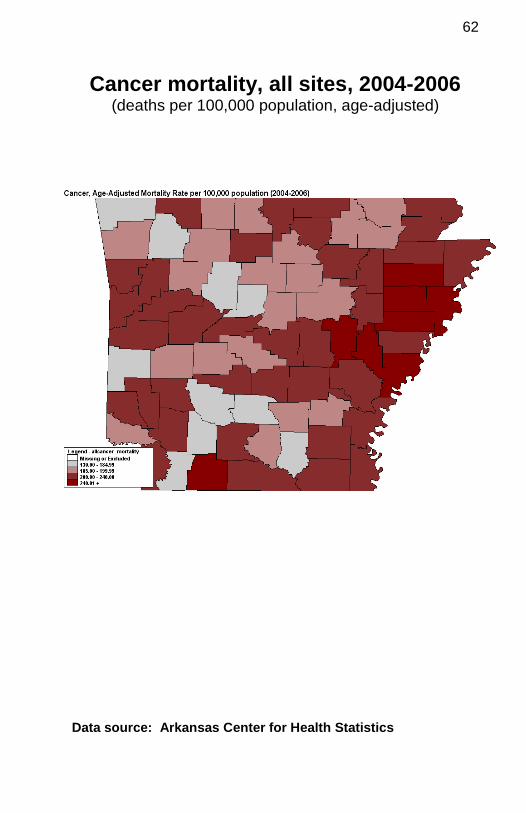
Cancer mortality, all sites, 2004-2006
(deaths per 100,000 population, age-adjusted)
Data source: Arkansas Center for Health Statistics

63
Cardiovascular disease mortality, 2004-
2006 (Deaths per 100,000 population, age-adjusted)
Data source: Arkansas Center for Health Statistics

64
Diabetes Mortality, 2004-2006 (deaths per 100,000 population, age-adjusted)
Data source: Arkansas Center for Health Statistics
65
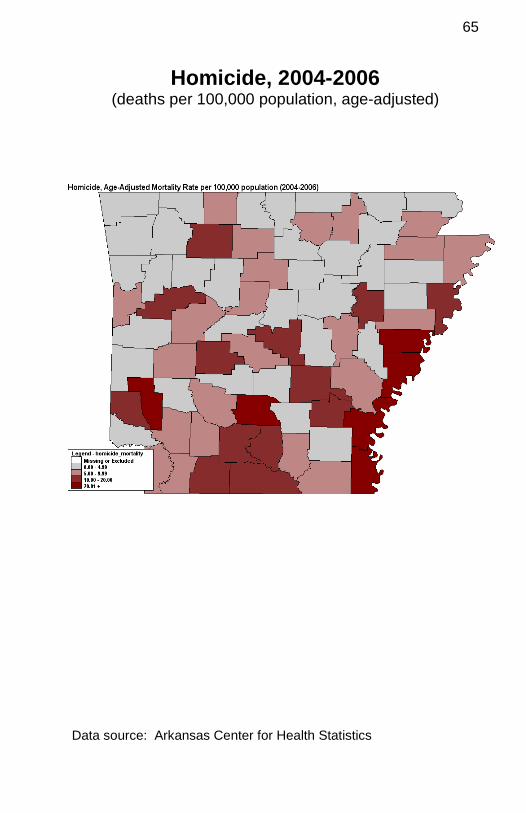
Homicide, 2004-2006
(deaths per 100,000 population, age-adjusted)
Data source: Arkansas Center for Health Statistics
66
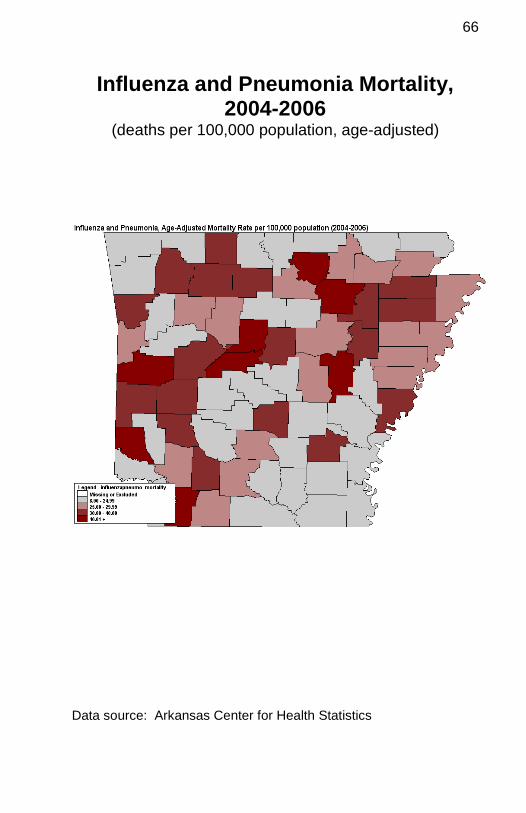
Influenza and Pneumonia Mortality,
2004-2006 (deaths per 100,000 population, age-adjusted)
Data source: Arkansas Center for Health Statistics

67
Lung Cancer Mortality, 2004-2006 (Deaths per 100,000 population, age-adjusted)
Data source: Arkansas Center for Health Statistics
68
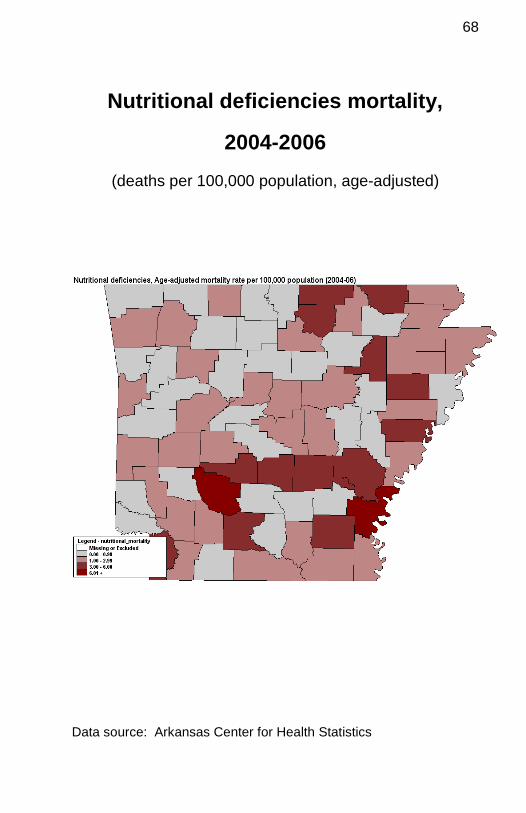
Nutritional deficiencies mortality,
2004-2006 (deaths per 100,000 population, age-adjusted)
Data source: Arkansas Center for Health Statistics
69
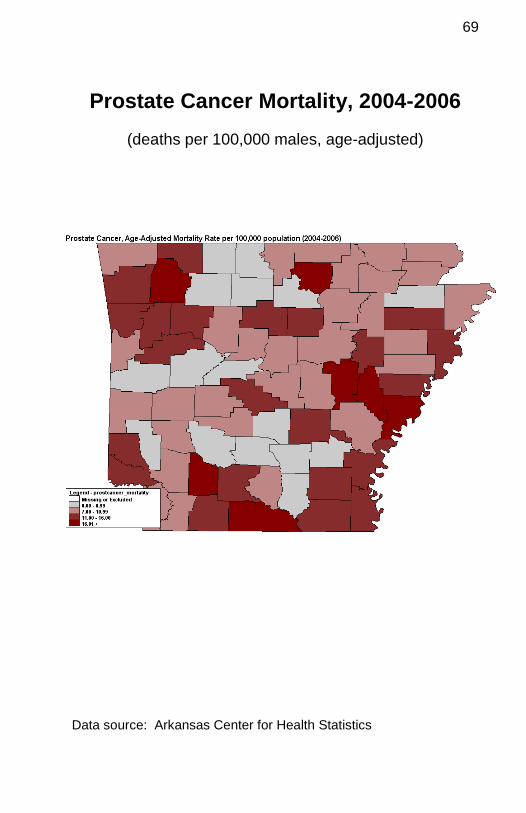
Prostate Cancer Mortality, 2004-2006 (deaths per 100,000 males, age-adjusted)
Data source: Arkansas Center for Health Statistics

70
Melanoma (skin cancer) mortality, 2004-2006
(deaths per 100,000 population, age-adjusted)
Data source: Arkansas Center for Health Statistics
71
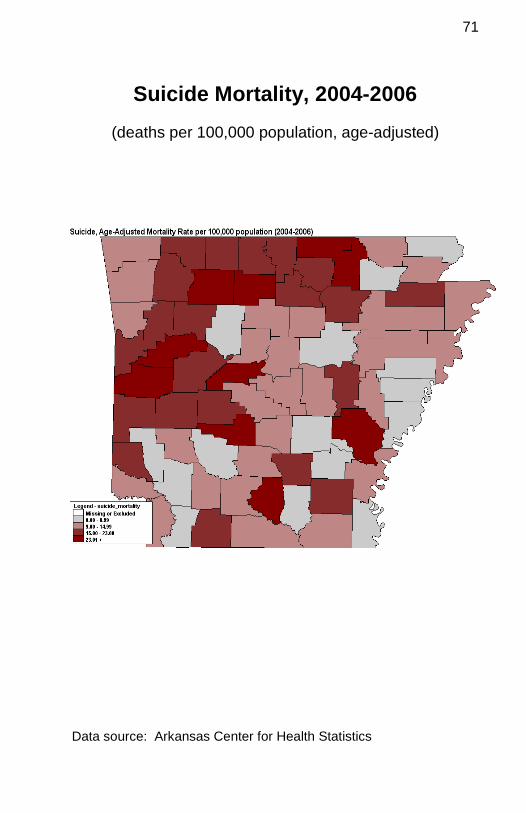
Suicide Mortality, 2004-2006 (deaths per 100,000 population, age-adjusted)
Data source: Arkansas Center for Health Statistics

72
Binge drinking, 2007 (percent of adults, 18+ years of age)
Data source: Arkansas Center for Health Statistics
73
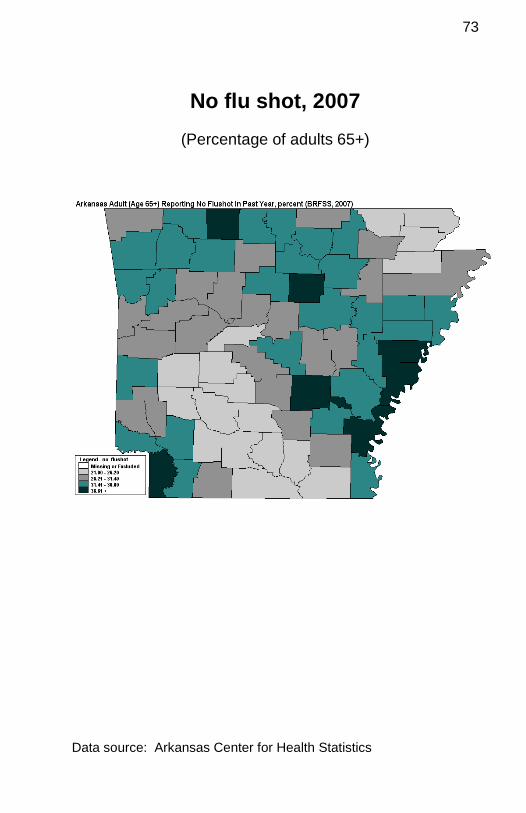
No flu shot, 2007 (Percentage of adults 65+)
Data source: Arkansas Center for Health Statistics
74
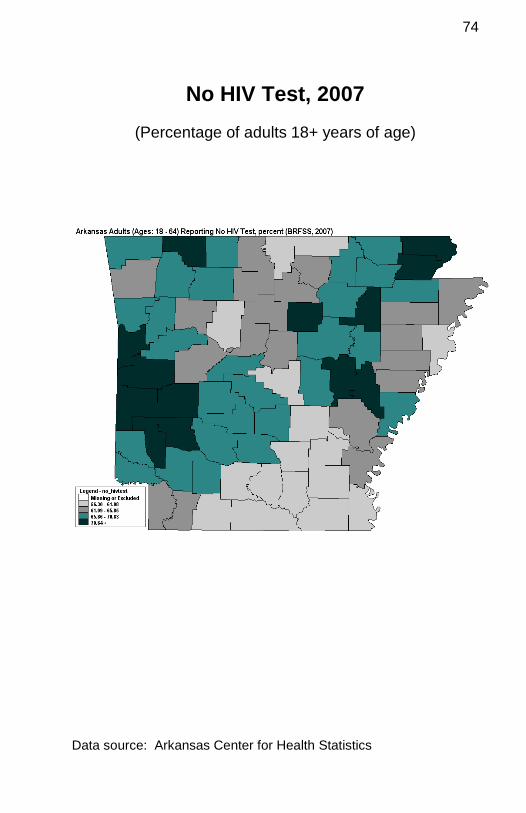
No HIV Test, 2007 (Percentage of adults 18+ years of age)
Data source: Arkansas Center for Health Statistics

75
No health insurance, adults, 2007 (percentage of adults, 18+ years of age)
Data source: Arkansas Center for Health Statistics
76
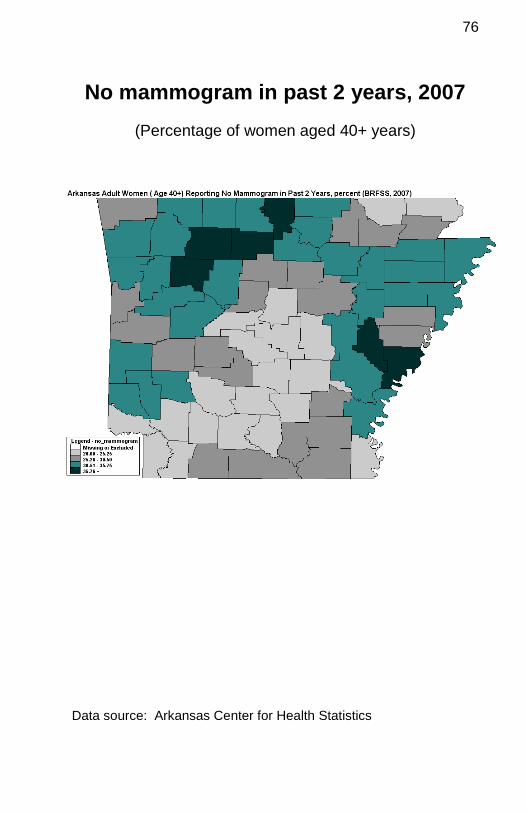
No mammogram in past 2 years, 2007 (Percentage of women aged 40+ years)
Data source: Arkansas Center for Health Statistics
77
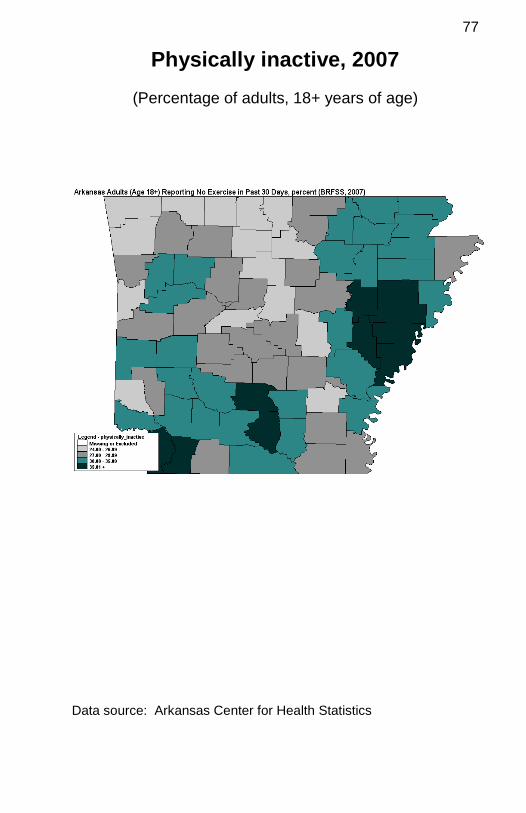
Physically inactive, 2007 (Percentage of adults, 18+ years of age)
Data source: Arkansas Center for Health Statistics

78
Obesity, 2007 (Percentage of adults, 18+ years of age, overweight or
obese (BMI ≥ 25)
Data source: Arkansas Center for Health Statistics

79
No Pap Test in Past 3 Years, 2007 (Percentage of women 18+ years of age)
Data source: Arkansas Center for Health Statistics

80
No Pneumonia Vaccination, 2007 (percentage of adults, 65+ years of age)
Data source: Arkansas Center for Health Statistics

81
Geographic Disparities
Tables
Tables present county-specific data for a variety of health indicators and associated variables. Colors indicate county’s relative standing to other counties in the state. Green – “best” 25% among Arkansas counties Yellow – middle 50% among Arkansas counties Red – lowest (“worst”) 25% among Arkansas counties
82
Best 25% of counties Middle 50% of counties Worst 25% of counties
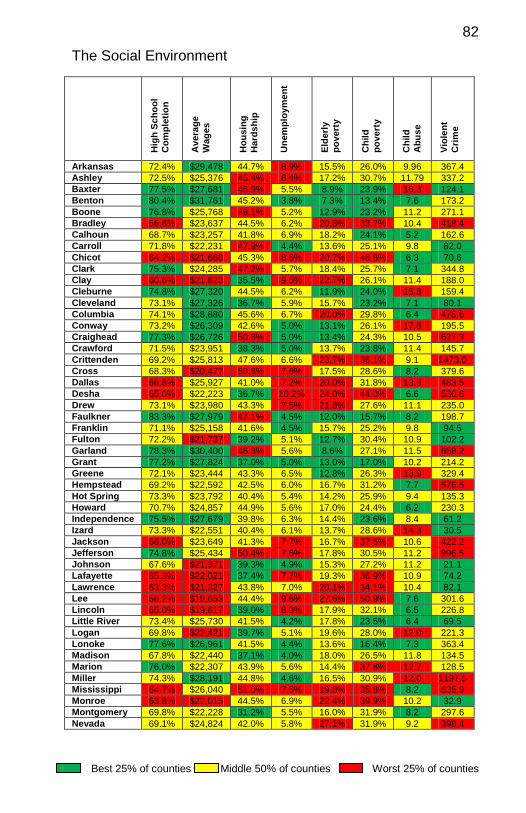
The Social Environment
H
igh
Scho
ol
Com
plet
ion
Ave
rage
W
ages
Hou
sing
H
ards
hip
Une
mpl
oym
ent
Elde
rly
pove
rty
Chi
ld
pove
rty
Chi
ld
Abu
se
Viol
ent
Crim
e
Arkansas 72.4% $29,478 44.7% 8.9% 15.5% 26.0% 9.96 367.4 Ashley 72.5% $25,376 46.4% 8.4% 17.2% 30.7% 11.79 337.2 Baxter 77.5% $27,681 45.9% 5.5% 8.9% 23.9% 16.3 124.1 Benton 80.4% $31,761 45.2% 3.8% 7.3% 13.4% 7.6 173.2 Boone 76.8% $25,768 49.1% 5.2% 12.9% 23.2% 11.2 271.1 Bradley 66.6% $23,637 44.5% 6.2% 20.8% 33.7% 10.4 418.4 Calhoun 68.7% $23,257 41.8% 6.9% 18.2% 24.1% 5.2 162.6 Carroll 71.8% $22,231 47.9% 4.4% 13.6% 25.1% 9.8 82.0 Chicot 64.2% $21,668 45.3% 8.6% 20.7% 46.8% 6.3 70.6 Clark 75.3% $24,285 47.2% 5.7% 18.4% 25.7% 7.1 344.8 Clay 60.6% $21,823 35.5% 9.5% 22.7% 26.1% 11.4 188.0 Cleburne 74.8% $27,320 44.5% 6.2% 11.9% 24.0% 15.8 159.4 Cleveland 73.1% $27,326 36.7% 5.9% 15.7% 23.2% 7.1 80.1 Columbia 74.1% $28,880 45.6% 6.7% 20.0% 29.8% 6.4 475.6 Conway 73.2% $26,309 42.6% 5.0% 13.1% 26.1% 17.8 195.5 Craighead 77.3% $26,726 50.8% 5.0% 13.4% 24.3% 10.5 627.3 Crawford 71.5% $23,951 38.3% 5.0% 13.7% 23.8% 11.4 145.7 Crittenden 69.2% $25,813 47.6% 6.6% 23.7% 36.1% 9.1 1473.0 Cross 68.3% $20,477 50.8% 7.6% 17.5% 28.6% 8.2 379.6 Dallas 66.8% $25,927 41.0% 7.2% 20.0% 31.8% 13.3 483.5 Desha 65.0% $22,223 36.7% 10.2% 24.0% 44.0% 6.6 530.6 Drew 73.1% $23,980 43.3% 7.5% 21.8% 27.6% 11.1 235.0 Faulkner 83.3% $27,979 47.1% 4.5% 12.0% 15.7% 8.2 198.7 Franklin 71.1% $25,158 41.6% 4.5% 15.7% 25.2% 9.8 94.5 Fulton 72.2% $21,737 39.2% 5.1% 12.7% 30.4% 10.9 102.2 Garland 78.3% $30,400 46.3% 5.6% 8.6% 27.1% 11.5 658.2 Grant 77.2% $27,824 37.0% 5.0% 13.0% 17.0% 10.2 214.2 Greene 72.1% $23,444 43.3% 6.5% 12.8% 26.3% 13.9 329.4 Hempstead 69.2% $22,592 42.5% 6.0% 16.7% 31.2% 7.7 576.5 Hot Spring 73.3% $23,792 40.4% 5.4% 14.2% 25.9% 9.4 135.3 Howard 70.7% $24,857 44.9% 5.6% 17.0% 24.4% 6.2 230.3 Independence 75.5% $27,679 39.8% 6.3% 14.4% 23.6% 8.4 61.2 Izard 73.3% $22,551 40.4% 6.1% 13.7% 28.6% 14.3 30.5 Jackson 66.0% $23,649 41.3% 7.7% 16.7% 37.5% 10.6 422.2 Jefferson 74.8% $25,434 50.4% 7.6% 17.8% 30.5% 11.2 996.5 Johnson 67.6% $21,371 39.3% 4.9% 15.3% 27.2% 11.2 21.1 Lafayette 65.3% $22,021 37.4% 7.7% 19.3% 36.9% 10.9 74.2 Lawrence 63.3% $21,327 43.8% 7.0% 20.1% 34.1% 10.4 82.1 Lee 56.2% $19,653 44.4% 9.6% 27.6% 50.9% 7.6 301.6 Lincoln 65.0% $19,817 39.0% 8.0% 17.9% 32.1% 6.5 226.8 Little River 73.4% $25,730 41.5% 4.2% 17.8% 23.5% 6.4 69.5 Logan 69.8% $22,421 39.7% 5.1% 19.6% 28.0% 12.0 221.3 Lonoke 77.6% $26,961 41.5% 4.4% 13.6% 16.4% 7.3 363.4 Madison 67.8% $22,440 37.1% 4.0% 18.0% 26.5% 11.8 134.5 Marion 76.0% $22,307 43.9% 5.6% 14.4% 37.8% 12.7 128.5 Miller 74.3% $28,191 44.8% 4.6% 16.5% 30.9% 12.0 1197.5 Mississippi 64.7% $26,040 51.0% 7.5% 19.8% 35.8% 8.2 635.9 Monroe 63.8% $22,015 44.5% 6.9% 22.4% 39.9% 10.2 32.9 Montgomery 69.8% $22,228 31.2% 5.5% 16.0% 31.9% 8.2 297.6 Nevada 69.1% $24,824 42.0% 5.8% 27.1% 31.9% 9.2 398.4

83
Best 25% of counties Middle 50% of counties Worst 25% of counties
H
igh
Scho
ol
Com
plet
ion
Ave
rage
W
ages
Hou
sing
H
ards
hip
Une
mpl
oym
ent
Elde
rly
pove
rty
Chi
ld
pove
rty
Chi
ld
Abu
se
Viol
ent
Crim
e
Ouachita 73.5% $25,390 44.0% 7.4% 18.6% 28.1% 14.1 375.2 Perry 73.8% $25,564 43.4% 4.9% 15.0% 23.5% 14.7 379.5 Phillips 62.2% $22,355 49.7% 7.6% 26.2% 47.7% 8.3 386.3 Pike 68.8% $25,551 37.0% 5.8% 20.2% 24.7% 9.0 257.9 Poinsett 62.0% $22,030 44.3% 7.1% 20.5% 34.8% 11.7 581.4 Polk 72.6% $21,932 41.2% 5.0% 16.2% 32.0% 14.3 35.0 Pope 77.4% $25,737 45.9% 4.8% 14.0% 23.0% 12.4 232.3 Prairie 68.2% $22,937 42.6% 5.9% 16.8% 27.0% 15.3 189.6 Pulaski 84.4% $39,905 49.4% 4.8% 9.8% 22.0% 8.3 1313.8 Randolph 69.2% $20,788 39.0% 9.5% 15.2% 27.9% 10.2 22.1 St. Francis 65.1% $21,499 54.9% 9.8% 23.1% 41.1% 10.4 666.0 Saline 82.3% $31,299 41.0% 4.2% 7.3% 14.0% 12.7 209.3 Scott 65.4% $21,925 33.2% 4.8% 14.1% 33.5% 10.1 465.1 Searcy 68.0% $19,597 36.0% 5.0% 26.6% 38.2% 7.3 197.2 Sebastian 76.6% $33,875 47.9% 5.3% 10.0% 24.0% 10.0 806.2 Sevier 64.6% $22,620 39.5% 4.2% 14.2% 29.1% 6.4 135.6 Sharp 72.9% $20,403 41.6% 6.8% 13.2% 34.2% 14.0 176.5 Stone 68.0% $22,312 34.5% 5.8% 12.1% 36.4% 16.4 25.7 Union 74.5% $35,339 48.6% 7.0% 14.3% 26.2% 9.5 471.9 Van Buren 71.6% $22,869 39.8% 6.1% 10.6% 32.4% 13.8 98.0 Washington 79.5% $29,249 48.9% 3.9% 10.2% 19.4% 10.6 384.0 White 72.9% $23,511 42.7% 6.6% 14.3% 22.3% 12.6 296.9 Woodruff 60.6% $20,360 41.3% 8.9% 27.0% 41.7% 16.1 249.7 Yell 64.1% $22,949 39.8% 4.3% 12.8% 25.3% 9.3 372.3

84
Best 25% of counties Middle 50% of counties Worst 25% of counties
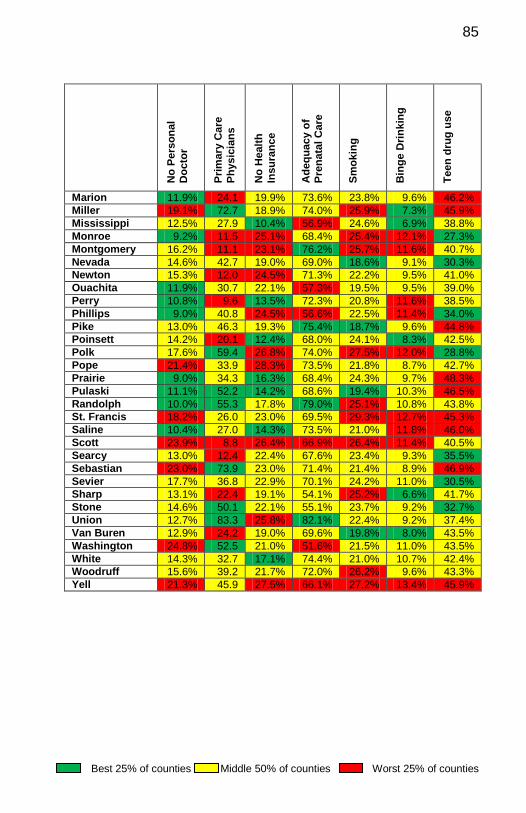
Access to Health Care and Risk Behaviors
No
Pers
onal
Doc
tor
Prim
ary
Car
e Ph
ysic
ians
No
Hea
lth
Insu
ranc
e
Ade
quac
y of
Pr
enat
al C
are
Smok
ing
Bin
ge D
rinki
ng
Teen
dru
g us
e
Arkansas 7.7% 67.0 18.2% 67.0% 25.0% 11.5% 44.3% Ashley 12.9% 44.8 23.4% 80.2% 24.8% 10.7% 39.2% Baxter 12.6% 42.9 20.1% 79.6% 23.7% 9.5% 42.7% Benton 19.6% 27.6 18.6% 64.7% 17.5% 9.6% 43.1% Boone 12.3% 54.5 26.0% 75.5% 25.7% 10.5% 42.1% Bradley 13.6% 91.8 27.2% 78.5% 24.7% 12.2% 44.6% Calhoun 9.2% 18.1 28.5% 71.7% 21.9% 8.9% 34.1% Carroll 15.2% 62.0 19.5% 67.6% 18.8% 8.9% 39.9% Chicot 13.7% 56.9 18.4% 76.1% 23.4% 7.6% 38.1% Clark 13.2% 29.7 23.0% 73.6% 16.6% 10.5% 34.5% Clay 10.4% 31.0 13.5% 78.0% 17.8% 9.9% 51.0% Cleburne 13.5% 51.2 16.6% 69.9% 19.4% 8.3% 45.4% Cleveland 11.8% 0.0 21.4% 74.8% 25.2% 11.7% 36.9% Columbia 16.4% 45.2 21.9% 68.2% 19.8% 7.9% 14.8% Conway 18.1% 48.2 21.6% 74.6% 23.0% 10.2% 47.3% Craighead 12.3% 67.7 11.4% 75.1% 21.5% 7.0% 42.8% Crawford 25.0% 30.5 21.5% 77.6% 23.4% 10.1% 43.2% Crittenden 18.3% 15.4 17.2% 65.2% 28.6% 12.1% 41.0% Cross 19.1% 37.5 20.7% 71.2% 28.4% 12.8% 44.9% Dallas 9.1% 36.4 19.8% 64.4% 16.9% 8.7% 38.7% Desha 13.3% 36.2 22.3% 66.9% 22.4% 9.1% 35.7% Drew 16.4% 26.7 23.3% 80.2% 28.1% 11.3% 32.3% Faulkner 10.1% 27.7 12.3% 75.0% 18.8% 10.3% 36.7% Franklin 22.3% 22.0 23.7% 72.3% 20.2% 6.7% 48.3% Fulton 13.7% 42.5 20.7% 70.1% 26.1% 7.5% 39.7% Garland 14.6% 34.2 20.8% 79.3% 26.1% 12.8% 49.4% Grant 9.1% 22.9 12.1% 77.0% 20.1% 11.3% 42.7% Greene 11.5% 44.6 12.4% 85.1% 21.3% 9.6% 38.0% Hempstead 14.8% 30.1 18.3% 62.7% 23.6% 9.4% 37.3% Hot Spring 14.3% 22.0 21.7% 76.4% 23.4% 12.5% 44.5% Howard 14.5% 42.9 26.5% 70.9% 25.0% 12.6% 39.7% Independence 17.9% 60.8 23.7% 52.9% 23.6% 7.2% 33.9% Izard 15.2% 38.5 21.2% 57.1% 23.2% 8.2% 35.5% Jackson 15.2% 34.8 16.4% 73.3% 23.2% 7.7% 35.5% Jefferson 10.5% 76.0 17.1% 62.2% 21.0% 9.5% 37.4% Johnson 20.0% 64.7 28.3% 69.1% 19.2% 7.0% 44.2% Lafayette 17.8% 38.7 18.1% 66.5% 20.7% 6.3% 43.2% Lawrence 14.9% 29.7 15.4% 76.5% 22.7% 7.9% 44.4% Lee 14.0% 36.8 19.7% 66.3% 25.7% 15.0% 20.8% Lincoln 15.2% 0.0 22.1% 66.3% 30.8% 12.4% 38.3% Little River 19.1% 39.0 16.6% 77.8% 22.3% 7.6% 29.9% Logan 21.5% 26.5 26.2% 71.9% 21.1% 8.1% 39.3% Lonoke 8.1% 22.0 10.5% 74.7% 19.6% 11.0% 46.2%
85
Best 25% of counties Middle 50% of counties Worst 25% of counties
No
Pers
onal
D
octo
r
Prim
ary
Car
e Ph
ysic
ians
No
Hea
lth
Insu
ranc
e
Ade
quac
y of
Pr
enat
al C
are
Smok
ing
Bin
ge D
rinki
ng
Teen
dru
g us
e
Marion 11.9% 24.1 19.9% 73.6% 23.8% 9.6% 46.2% Miller 19.1% 72.7 18.9% 74.0% 25.9% 7.3% 45.9% Mississippi 12.5% 27.9 10.4% 56.9% 24.6% 6.9% 38.8% Monroe 9.2% 11.5 25.1% 68.4% 25.4% 12.1% 27.3% Montgomery 16.2% 11.1 23.1% 76.2% 25.7% 11.6% 40.7% Nevada 14.6% 42.7 19.0% 69.0% 18.6% 9.1% 30.3% Newton 15.3% 12.0 24.5% 71.3% 22.2% 9.5% 41.0% Ouachita 11.9% 30.7 22.1% 57.3% 19.5% 9.5% 39.0% Perry 10.8% 9.6 13.5% 72.3% 20.8% 11.6% 38.5% Phillips 9.0% 40.8 24.5% 56.6% 22.5% 11.4% 34.0% Pike 13.0% 46.3 19.3% 75.4% 18.7% 9.6% 44.8% Poinsett 14.2% 20.1 12.4% 68.0% 24.1% 8.3% 42.5% Polk 17.6% 59.4 26.8% 74.0% 27.5% 12.0% 28.8% Pope 21.4% 33.9 28.3% 73.5% 21.8% 8.7% 42.7% Prairie 9.0% 34.3 16.3% 68.4% 24.3% 9.7% 48.3% Pulaski 11.1% 52.2 14.2% 68.6% 19.4% 10.3% 46.5% Randolph 10.0% 55.3 17.8% 79.0% 25.1% 10.8% 43.8% St. Francis 18.2% 26.0 23.0% 69.5% 29.3% 12.7% 45.3% Saline 10.4% 27.0 14.3% 73.5% 21.0% 11.8% 46.0% Scott 23.9% 8.8 26.4% 66.9% 26.4% 11.4% 40.5% Searcy 13.0% 12.4 22.4% 67.6% 23.4% 9.3% 35.5% Sebastian 23.0% 73.9 23.0% 71.4% 21.4% 8.9% 46.9% Sevier 17.7% 36.8 22.9% 70.1% 24.2% 11.0% 30.5% Sharp 13.1% 22.4 19.1% 54.1% 25.2% 6.6% 41.7% Stone 14.6% 50.1 22.1% 55.1% 23.7% 9.2% 32.7% Union 12.7% 83.3 25.8% 82.1% 22.4% 9.2% 37.4% Van Buren 12.9% 24.2 19.0% 69.6% 19.8% 8.0% 43.5% Washington 24.8% 52.5 21.0% 51.6% 21.5% 11.0% 43.5% White 14.3% 32.7 17.1% 74.4% 21.0% 10.7% 42.4% Woodruff 15.6% 39.2 21.7% 72.0% 26.2% 9.6% 43.3% Yell 21.3% 45.9 27.5% 66.1% 27.2% 13.4% 45.9%
86
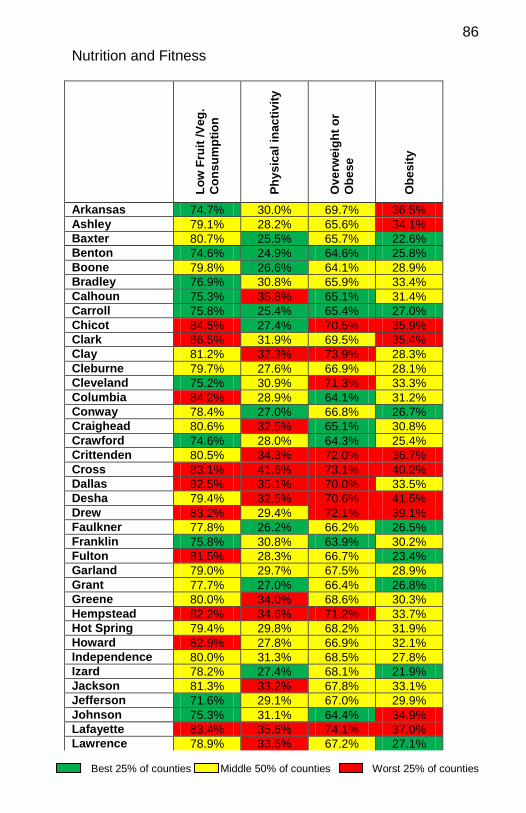
Best 25% of counties Middle 50% of counties Worst 25% of counties
Nutrition and Fitness
Low
Fru
it /V
eg.
Con
sum
ptio
n
Phys
ical
inac
tivity
Ove
rwei
ght o
r O
bese
Obe
sity
Arkansas 74.7% 30.0% 69.7% 36.5% Ashley 79.1% 28.2% 65.6% 34.1% Baxter 80.7% 25.5% 65.7% 22.6% Benton 74.6% 24.9% 64.6% 25.8% Boone 79.8% 26.6% 64.1% 28.9% Bradley 76.9% 30.8% 65.9% 33.4% Calhoun 75.3% 35.8% 65.1% 31.4% Carroll 75.8% 25.4% 65.4% 27.0% Chicot 84.5% 27.4% 70.5% 35.9% Clark 86.5% 31.9% 69.5% 35.4% Clay 81.2% 32.3% 73.9% 28.3% Cleburne 79.7% 27.6% 66.9% 28.1% Cleveland 75.2% 30.9% 71.3% 33.3% Columbia 84.2% 28.9% 64.1% 31.2% Conway 78.4% 27.0% 66.8% 26.7% Craighead 80.6% 32.5% 65.1% 30.8% Crawford 74.6% 28.0% 64.3% 25.4% Crittenden 80.5% 34.3% 72.0% 36.7% Cross 83.1% 41.6% 73.1% 40.2% Dallas 82.5% 35.1% 70.0% 33.5% Desha 79.4% 32.5% 70.6% 41.5% Drew 83.2% 29.4% 72.1% 39.1% Faulkner 77.8% 26.2% 66.2% 26.5% Franklin 75.8% 30.8% 63.9% 30.2% Fulton 81.5% 28.3% 66.7% 23.4% Garland 79.0% 29.7% 67.5% 28.9% Grant 77.7% 27.0% 66.4% 26.8% Greene 80.0% 34.0% 68.6% 30.3% Hempstead 82.2% 34.6% 71.2% 33.7% Hot Spring 79.4% 29.8% 68.2% 31.9% Howard 82.9% 27.8% 66.9% 32.1% Independence 80.0% 31.3% 68.5% 27.8% Izard 78.2% 27.4% 68.1% 21.9% Jackson 81.3% 33.2% 67.8% 33.1% Jefferson 71.6% 29.1% 67.0% 29.9% Johnson 75.3% 31.1% 64.4% 34.9% Lafayette 83.4% 35.6% 74.1% 37.0% Lawrence 78.9% 33.5% 67.2% 27.1%
87
Best 25% of counties Middle 50% of counties Worst 25% of counties
Low
Fru
it /V
eg.
Con
sum
ptio
n
Phys
ical
inac
tivity
Ove
rwei
ght o
r O
bese
Obe
sity
Lincoln 76.3% 26.8% 68.0% 31.9% Little River 81.9% 31.4% 77.3% 36.1% Logan 78.1% 30.4% 66.1% 32.5% Lonoke 77.4% 26.5% 66.8% 27.8% Madison 74.5% 27.9% 64.7% 26.9% Marion 81.5% 25.8% 65.8% 27.0% Miller 79.4% 36.7% 79.0% 38.0% Mississippi 78.8% 29.5% 67.9% 33.4% Monroe 72.6% 38.0% 73.4% 41.4% Montgomery 81.5% 30.3% 66.3% 29.5% Nevada 86.6% 31.3% 65.7% 31.4% Newton 76.2% 27.2% 65.6% 29.3% Ouachita 81.0% 31.7% 64.4% 30.1% Perry 77.7% 26.4% 66.8% 25.0% Phillips 76.0% 40.2% 72.2% 42.9% Pike 83.5% 31.8% 63.9% 30.5% Poinsett 80.6% 32.2% 68.8% 33.8% Polk 82.2% 31.0% 64.8% 28.6% Pope 76.9% 29.6% 65.2% 30.7% Prairie 79.7% 31.1% 70.2% 35.3% Pulaski 73.5% 27.6% 65.9% 27.6% Randolph 80.6% 32.5% 70.9% 26.9% St. Francis 81.0% 40.1% 72.6% 40.3% Saline 77.5% 27.4% 66.5% 26.3% Scott 80.1% 29.3% 62.8% 28.6% Searcy 79.3% 25.8% 67.2% 28.3% Sebastian 77.2% 26.7% 64.1% 28.5% Sevier 82.9% 25.2% 71.5% 33.5% Sharp 77.9% 31.2% 69.2% 23.8% Stone 77.8% 26.5% 67.2% 24.5% Union 77.8% 30.7% 61.8% 30.1% Van Buren 78.5% 26.6% 65.8% 27.0% Washington 73.5% 25.3% 63.1% 24.8% White 82.3% 28.0% 65.5% 30.4% Woodruff 83.1% 39.4% 70.0% 35.7% Yell 78.9% 29.6% 67.0% 30.5%

88
Best 25% of counties Middle 50% of counties Worst 25% of counties
Preventive Care and Screenings C
hild
hood
Im
mun
izat
ions
No
Flu
shot
No
Pneu
mo
shot
No
Bre
ast C
ance
r Sc
reen
No
Cer
vica
l C
ance
r Scr
een
Arkansas 72.2% 35.6% 53.3% 33.1% 23.6% Ashley 94.6% 22.7% 30.5% 28.1% 10.4% Baxter 76.6% 33.4% 39.4% 38.3% 27.6% Benton 74.0% 29.2% 30.4% 29.0% 19.1% Boone 82.2% 40.0% 34.8% 35.1% 29.6% Bradley 85.7% 21.0% 31.4% 29.0% 10.6% Calhoun 89.0% 23.1% 29.1% 20.0% 8.1% Carroll 75.3% 32.9% 32.3% 31.3% 28.3% Chicot 93.5% 31.6% 39.7% 23.8% 11.9% Clark 85.2% 24.9% 37.7% 24.1% 12.1% Clay 90.7% 22.2% 44.3% 24.7% 20.9% Cleburne 86.4% 37.0% 36.1% 28.8% 20.6% Cleveland 93.3% 29.3% 50.7% 23.1% 17.6% Columbia 81.7% 26.7% 41.8% 26.3% 16.0% Conway 76.4% 28.4% 38.1% 30.2% 19.5% Craighead 82.2% 22.8% 40.3% 32.7% 24.0% Crawford 74.8% 33.6% 32.8% 31.4% 18.0% Crittenden 64.0% 34.3% 50.5% 32.8% 15.7% Cross 87.8% 33.8% 47.6% 31.6% 17.0% Dallas 100.0% 26.0% 38.2% 20.5% 11.6% Desha 90.5% 40.7% 53.6% 31.7% 20.9% Drew 94.0% 26.8% 44.6% 26.0% 12.6% Faulkner 77.3% 31.0% 35.8% 23.6% 15.5% Franklin 93.6% 32.6% 35.3% 31.6% 23.4% Fulton 92.1% 30.1% 35.2% 32.4% 30.0% Garland 63.5% 23.0% 30.0% 27.1% 15.7% Grant 76.8% 28.4% 39.0% 23.8% 15.4% Greene 77.9% 22.2% 40.1% 26.4% 22.4% Hempstead 84.0% 31.9% 39.0% 23.9% 15.0% Hot Spring 62.3% 23.1% 31.5% 28.2% 14.9% Howard 93.0% 27.0% 37.1% 33.9% 19.4% Independence 90.7% 36.0% 36.1% 33.2% 25.7% Izard 94.6% 33.3% 34.5% 31.3% 25.1% Jackson 77.8% 29.2% 39.0% 34.1% 25.2% Jefferson 68.6% 36.7% 46.7% 24.2% 13.8% Johnson 83.1% 29.3% 41.1% 36.7% 22.8% Lafayette 91.1% 33.9% 50.3% 21.2% 19.2% Lawrence 90.0% 27.7% 37.0% 29.4% 25.3%
89
Best 25% of counties Middle 50% of counties Worst 25% of counties
Chi
ldho
od
Imm
uniz
atio
ns
No
Flu
shot
No
Pneu
mo
shot
No
Bre
ast C
ance
r Sc
reen
No
Cer
vica
l C
ance
r Scr
een
Lincoln 80.9% 34.3% 55.8% 29.9% 20.5% Little River 86.5% 32.4% 35.8% 24.7% 12.6% Logan 92.0% 26.8% 31.9% 32.2% 20.7% Lonoke 80.9% 29.1% 37.1% 24.2% 16.7% Madison 78.0% 31.8% 33.0% 31.2% 22.2% Marion 87.2% 34.4% 40.4% 34.1% 24.5% Miller 70.2% 41.8% 44.9% 20.3% 15.7% Mississippi 90.7% 26.7% 44.8% 34.8% 23.1% Monroe 75.5% 34.1% 51.1% 36.8% 23.9% Montgomery 87.5% 23.6% 31.0% 27.7% 15.5% Nevada 83.3% 23.7% 42.4% 22.6% 15.2% Newton 95.8% 32.7% 39.7% 37.7% 27.9% Ouachita 73.9% 24.4% 34.6% 20.8% 11.7% Perry 92.9% 25.4% 32.8% 23.1% 15.3% Phillips 85.7% 40.9% 56.1% 41.0% 27.6% Pike 90.7% 24.5% 45.6% 31.5% 20.6% Poinsett 81.7% 28.8% 45.7% 34.5% 22.2% Polk 85.7% 35.7% 36.7% 32.6% 23.1% Pope 57.6% 26.3% 37.8% 34.5% 19.2% Prairie 91.2% 31.0% 43.5% 32.1% 22.4% Pulaski 78.7% 33.2% 39.1% 24.1% 13.3% Randolph 97.4% 26.0% 41.5% 24.3% 22.0% St. Francis 68.1% 34.7% 48.2% 28.0% 14.2% Saline 85.7% 26.4% 35.3% 24.6% 15.2% Scott 74.4% 27.5% 27.7% 27.8% 18.2% Searcy 88.1% 30.4% 37.0% 36.3% 23.2% Sebastian 67.2% 26.7% 27.4% 28.2% 19.8% Sevier 82.6% 28.9% 28.9% 35.4% 17.3% Sharp 91.1% 33.0% 31.0% 26.4% 28.9% Stone 83.5% 35.6% 36.4% 32.3% 20.4% Union 84.1% 24.7% 31.4% 27.7% 12.0% Van Buren 81.4% 31.9% 36.3% 29.9% 20.5% Washington 53.3% 32.8% 29.3% 30.9% 17.1% White 82.2% 34.3% 35.8% 29.8% 19.4% Woodruff 90.9% 33.6% 40.6% 31.9% 19.2% Yell 78.7% 26.5% 31.5% 31.2% 17.3%
90
Best 25% of counties Middle 50% of counties Worst 25% of counties
Preventive Care and Screenings, continued N
o Pr
osta
te
Can
cer S
cree
n
No
Col
onos
copy
No
Feca
l Occ
ult
Blo
od T
est
No
HIV
Tes
t
Arkansas 50.0% 50.8% 82.0% 65.8% Ashley 47.5% 56.9% 76.4% 59.1% Baxter 45.8% 40.6% 80.9% 56.4% Benton 47.4% 45.2% 71.0% 68.2% Boone 51.0% 53.7% 79.4% 69.7% Bradley 54.6% 56.4% 79.7% 56.6% Calhoun 49.3% 56.3% 78.2% 57.0% Carroll 44.7% 45.2% 73.9% 71.5% Chicot 33.3% 46.5% 67.8% 59.2% Clark 35.0% 51.0% 68.8% 68.3% Clay 44.3% 47.5% 83.3% 74.0% Cleburne 51.7% 45.3% 78.1% 72.4% Cleveland 45.7% 51.1% 80.4% 60.1% Columbia 51.1% 58.7% 82.1% 59.3% Conway 52.1% 46.6% 78.8% 62.0% Craighead 50.5% 55.0% 82.5% 69.9% Crawford 48.9% 50.0% 73.0% 68.5% Crittenden 43.1% 59.1% 79.2% 57.1% Cross 51.4% 57.6% 84.6% 62.3% Dallas 38.8% 54.2% 72.8% 70.2% Desha 57.3% 53.0% 81.0% 61.2% Drew 47.8% 52.1% 77.5% 59.8% Faulkner 43.3% 38.1% 77.2% 65.4% Franklin 49.9% 49.9% 70.9% 69.4% Fulton 50.9% 40.7% 77.0% 58.0% Garland 42.3% 43.0% 76.1% 68.6% Grant 34.2% 37.4% 78.7% 68.5% Greene 50.7% 54.4% 82.7% 72.4% Hempstead 56.1% 53.8% 79.7% 66.7% Hot Spring 41.8% 44.8% 75.4% 70.1% Howard 66.0% 55.5% 80.6% 72.6% Independence 54.4% 50.1% 80.3% 69.8% Izard 52.1% 45.4% 82.4% 61.6% Jackson 49.0% 51.4% 81.6% 71.7% Jefferson 46.5% 42.6% 77.5% 56.3% Johnson 50.8% 57.3% 75.7% 63.0% Lafayette 48.7% 59.3% 84.0% 64.8% Lawrence 50.0% 50.0% 80.1% 69.9%
91
Best 25% of counties Middle 50% of counties Worst 25% of counties
No
Pros
tate
C
ance
r Scr
een
No
Col
onos
copy
No
Feca
l Occ
ult
Blo
od T
est
No
HIV
Tes
t
Lincoln 49.0% 53.9% 81.1% 57.4% Little River 49.0% 52.0% 80.6% 66.2% Logan 48.2% 50.8% 77.3% 70.0% Lonoke 39.5% 38.5% 77.4% 67.7% Madison 45.3% 48.1% 71.8% 69.3% Marion 42.7% 47.0% 79.3% 64.9% Miller 49.9% 55.8% 83.0% 64.7% Mississippi 42.8% 58.7% 79.1% 65.6% Monroe 53.8% 58.9% 85.8% 72.7% Montgomery 42.1% 48.0% 72.8% 74.9% Nevada 40.1% 52.3% 77.9% 66.9% Newton 45.2% 53.2% 78.5% 67.9% Ouachita 42.9% 55.9% 77.2% 60.9% Perry 35.6% 38.1% 77.7% 67.3% Phillips 63.5% 58.6% 88.5% 70.1% Pike 47.6% 48.5% 72.0% 75.4% Poinsett 44.8% 55.4% 82.3% 65.0% Polk 49.0% 52.4% 81.1% 75.2% Pope 50.6% 53.3% 79.5% 60.2% Prairie 49.8% 45.8% 76.7% 70.8% Pulaski 43.1% 36.1% 77.8% 61.0% Randolph 58.1% 51.2% 78.4% 69.8% St. Francis 45.6% 64.6% 83.8% 61.5% Saline 34.5% 36.8% 78.1% 68.1% Scott 44.7% 47.0% 75.9% 74.6% Searcy 43.1% 51.0% 81.4% 64.5% Sebastian 45.1% 47.0% 72.2% 72.9% Sevier 50.4% 55.6% 82.6% 70.0% Sharp 54.6% 45.5% 79.0% 67.9% Stone 51.3% 48.1% 82.5% 65.7% Union 52.3% 59.0% 79.2% 58.4% Van Buren 51.1% 45.3% 79.0% 65.7% Washington 51.5% 49.6% 72.9% 64.7% White 51.3% 44.3% 77.3% 70.0% Woodruff 55.3% 53.6% 80.1% 70.3% Yell 50.7% 51.0% 78.9% 64.7%

92
Best 25% of counties Middle 50% of counties Worst 25% of counties
Health Outcomes and Mortality Po
or M
enta
l H
ealth
Poor
Phy
sica
l H
ealth
Infe
ctio
us D
isea
se
Prev
enta
ble
hosp
italiz
atio
ns
Infa
nt m
orta
lity
Arkansas 9.3% 42.3% 15.4 86.7 6.7 Ashley 11.1% 46.5% 8.9 85.1 11.9 Baxter 14.1% 39.5% 3.6 92.2 8.7 Benton 8.2% 34.0% 11.8 81.4 7.2 Boone 12.9% 43.6% 2.7 176.3 6.5 Bradley 11.5% 45.1% 16.7 120.8 10.6 Calhoun 9.7% 43.7% 18.0 94.5 0 Carroll 9.0% 37.3% 21.9 125.1 8.1 Chicot 10.8% 45.0% 28.1 97.4 0 Clark 8.6% 37.0% 19.1 89.2 6.6 Clay 14.0% 47.5% 6.2 87.9 0 Cleburne 11.7% 40.4% 3.9 87.5 5.2 Cleveland 12.0% 39.2% 0.0 88.5 11.1 Columbia 10.9% 35.9% 30.7 104.6 10.8 Conway 9.3% 40.0% 2.4 94.4 7.1 Craighead 8.7% 34.3% 14.9 84.1 9.7 Crawford 6.5% 34.8% 23.1 99.1 8.9 Crittenden 17.8% 39.0% 31.7 80.8 13.6 Cross 17.5% 39.3% 15.9 142.8 14.7 Dallas 9.6% 42.6% 0.0 130.7 0 Desha 8.4% 48.2% 7.2 105.6 10.3 Drew 12.4% 44.2% 8.0 121.8 6.7 Faulkner 10.6% 39.8% 10.7 82.0 6.6 Franklin 7.1% 34.4% 19.3 100.0 7 Fulton 14.8% 44.3% 0.0 103.5 13.8 Garland 11.5% 39.6% 20.3 75.6 9.2 Grant 9.6% 39.4% 14.3 69.4 7.1 Greene 10.6% 41.4% 7.5 83.9 10.7 Hempstead 9.9% 38.9% 17.2 149.9 7.6 Hot Spring 12.8% 40.1% 23.6 94.6 5 Howard 10.0% 35.4% 17.8 145.2 0 Independence 15.7% 41.2% 18.8 85.5 6.6 Izard 14.7% 40.8% 3.9 102.9 9.2 Jackson 12.5% 37.0% 11.6 114.3 6.8 Jefferson 12.2% 39.8% 23.9 72.5 11.4 Johnson 8.1% 32.4% 10.3 104.6 6.4

93
Best 25% of counties Middle 50% of counties Worst 25% of counties
Poor
Men
tal
Hea
lth
Poor
Phy
sica
l H
ealth
Infe
ctio
us
Dis
ease
Prev
enta
ble
hosp
italiz
atio
ns
Infa
nt m
orta
lity
Lafayette 9.6% 40.6% 6.4 85.3 0 Lawrence 12.4% 41.7% 0.0 149.6 5.8 Logan 9.0% 34.8% 28.8 126.2 4.5 Lonoke 10.1% 38.8% 11.2 89.2 7.7 Madison 7.8% 35.5% 9.9 88.2 8.5 Marion 12.9% 40.5% 0.0 90.1 9.8 Miller 9.4% 48.7% 24.6 14.5 8.4 Mississippi 10.8% 35.5% 13.9 142.7 12 Monroe 11.1% 48.3% 56.4 72.1 0 Montgomery 11.3% 37.6% 0.0 66.8 0 Nevada 10.2% 33.7% 16.0 155.3 0 Newton 9.8% 37.9% 6.0 157.2 0 Ouachita 9.0% 41.0% 21.0 76.8 12.5 Perry 10.0% 39.3% 4.9 106.5 0 Phillips 8.3% 51.1% 26.7 155.2 11.2 Pike 9.9% 31.9% 18.5 107.5 16.8 Poinsett 12.2% 34.6% 12.0 96.4 13.8 Polk 11.9% 38.1% 4.9 99.6 10.4 Pope 9.0% 36.1% 8.5 104.3 5.5 Prairie 9.9% 36.3% 5.6 91.8 0 Pulaski 11.7% 40.4% 36.3 68.7 9.5 Randolph 15.9% 48.3% 2.7 105.2 7.1 St. Francis 16.8% 41.8% 22.1 110.1 11.3 Saline 10.1% 39.0% 6.9 84.2 7.7 Scott 10.8% 35.0% 4.5 114.9 0 Searcy 12.3% 38.3% 105.2 149.4 0 Sebastian 8.0% 33.9% 23.6 81.3 8.1 Sevier 10.7% 40.0% 6.1 224.2 6.3 Sharp 15.7% 45.5% 16.8 80.8 8.4 Stone 14.7% 40.0% 8.4 119.5 0 Union 10.5% 43.5% 30.0 81.8 4.3 Van Buren 9.7% 40.8% 3.0 118.7 6.9 Washington 7.6% 35.9% 31.0 81.2 0 White 11.6% 37.3% 11.7 111.9 6.8 Woodruff 12.7% 37.2% 6.5 115.8 6.9 Yell 10.8% 38.5% 16.1 115.4 15.1
94
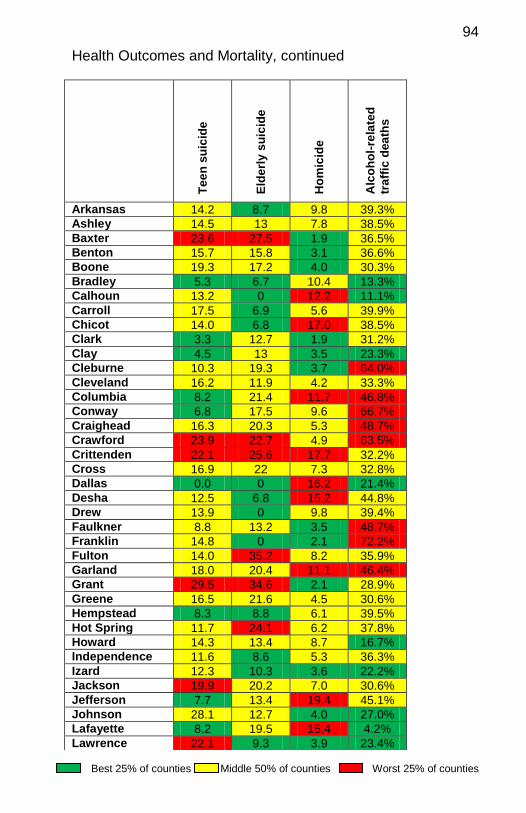
Best 25% of counties Middle 50% of counties Worst 25% of counties
Health Outcomes and Mortality, continued Te
en s
uici
de
Elde
rly s
uici
de
Hom
icid
e
Alc
ohol
-rel
ated
tr
affic
dea
ths
Arkansas 14.2 8.7 9.8 39.3% Ashley 14.5 13 7.8 38.5% Baxter 23.6 27.5 1.9 36.5% Benton 15.7 15.8 3.1 36.6% Boone 19.3 17.2 4.0 30.3% Bradley 5.3 6.7 10.4 13.3% Calhoun 13.2 0 12.2 11.1% Carroll 17.5 6.9 5.6 39.9% Chicot 14.0 6.8 17.0 38.5% Clark 3.3 12.7 1.9 31.2% Clay 4.5 13 3.5 23.3% Cleburne 10.3 19.3 3.7 64.0% Cleveland 16.2 11.9 4.2 33.3% Columbia 8.2 21.4 11.7 46.8% Conway 6.8 17.5 9.6 66.7% Craighead 16.3 20.3 5.3 48.7% Crawford 23.9 22.7 4.9 63.5% Crittenden 22.1 25.6 17.7 32.2% Cross 16.9 22 7.3 32.8% Dallas 0.0 0 16.2 21.4% Desha 12.5 6.8 15.2 44.8% Drew 13.9 0 9.8 39.4% Faulkner 8.8 13.2 3.5 48.7% Franklin 14.8 0 2.1 72.2% Fulton 14.0 35.2 8.2 35.9% Garland 18.0 20.4 11.1 46.4% Grant 29.5 34.6 2.1 28.9% Greene 16.5 21.6 4.5 30.6% Hempstead 8.3 8.8 6.1 39.5% Hot Spring 11.7 24.1 6.2 37.8% Howard 14.3 13.4 8.7 16.7% Independence 11.6 8.6 5.3 36.3% Izard 12.3 10.3 3.6 22.2% Jackson 19.9 20.2 7.0 30.6% Jefferson 7.7 13.4 19.4 45.1% Johnson 28.1 12.7 4.0 27.0% Lafayette 8.2 19.5 15.4 4.2% Lawrence 22.1 9.3 3.9 23.4%
95
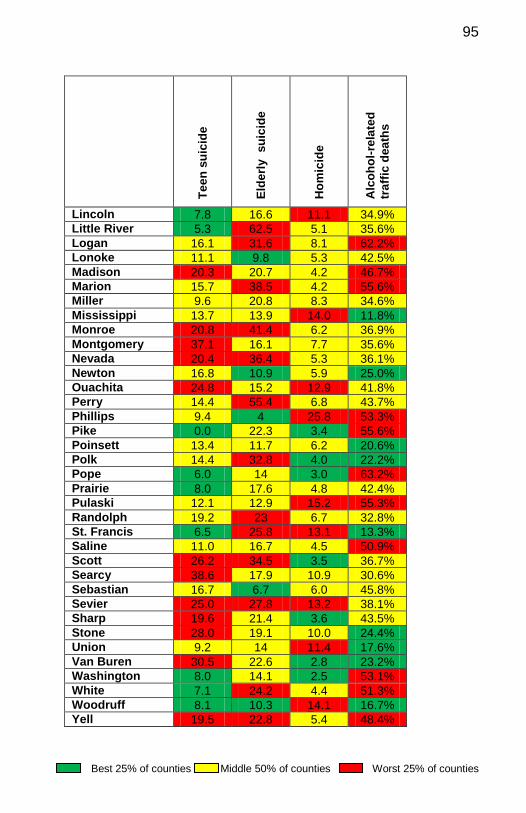
Best 25% of counties Middle 50% of counties Worst 25% of counties
Teen
sui
cide
Elde
rly s
uici
de
Hom
icid
e
Alc
ohol
-rel
ated
tr
affic
dea
ths
Lincoln 7.8 16.6 11.1 34.9% Little River 5.3 62.5 5.1 35.6% Logan 16.1 31.6 8.1 62.2% Lonoke 11.1 9.8 5.3 42.5% Madison 20.3 20.7 4.2 46.7% Marion 15.7 38.5 4.2 55.6% Miller 9.6 20.8 8.3 34.6% Mississippi 13.7 13.9 14.0 11.8% Monroe 20.8 41.4 6.2 36.9% Montgomery 37.1 16.1 7.7 35.6% Nevada 20.4 36.4 5.3 36.1% Newton 16.8 10.9 5.9 25.0% Ouachita 24.8 15.2 12.9 41.8% Perry 14.4 55.4 6.8 43.7% Phillips 9.4 4 25.8 53.3% Pike 0.0 22.3 3.4 55.6% Poinsett 13.4 11.7 6.2 20.6% Polk 14.4 32.8 4.0 22.2% Pope 6.0 14 3.0 63.2% Prairie 8.0 17.6 4.8 42.4% Pulaski 12.1 12.9 15.2 55.3% Randolph 19.2 23 6.7 32.8% St. Francis 6.5 25.8 13.1 13.3% Saline 11.0 16.7 4.5 50.9% Scott 26.2 34.5 3.5 36.7% Searcy 38.6 17.9 10.9 30.6% Sebastian 16.7 6.7 6.0 45.8% Sevier 25.0 27.8 13.2 38.1% Sharp 19.6 21.4 3.6 43.5% Stone 28.0 19.1 10.0 24.4% Union 9.2 14 11.4 17.6% Van Buren 30.5 22.6 2.8 23.2% Washington 8.0 14.1 2.5 53.1% White 7.1 24.2 4.4 51.3% Woodruff 8.1 10.3 14.1 16.7% Yell 19.5 22.8 5.4 48.4%
96
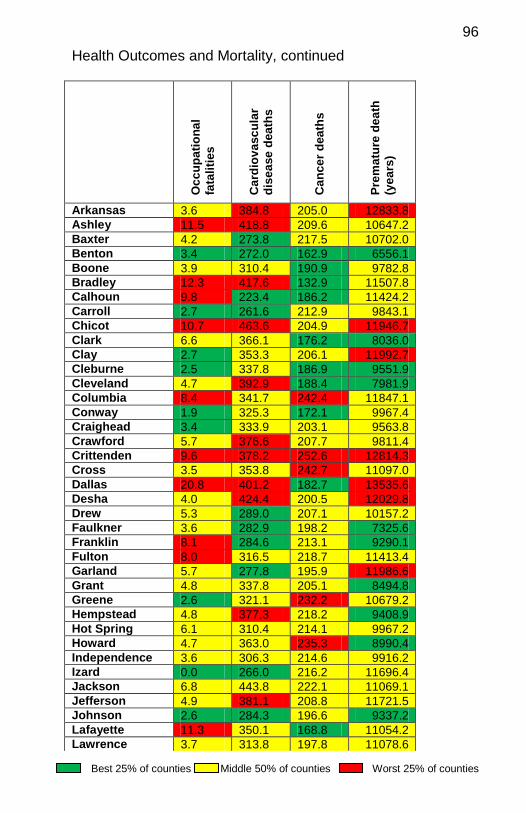
Best 25% of counties Middle 50% of counties Worst 25% of counties
Health Outcomes and Mortality, continued
Occ
upat
iona
l fa
talit
ies
Car
diov
ascu
lar
dise
ase
deat
hs
Can
cer d
eath
s
Prem
atur
e de
ath
(yea
rs)
Arkansas 3.6 384.8 205.0 12833.8 Ashley 11.5 418.8 209.6 10647.2 Baxter 4.2 273.8 217.5 10702.0 Benton 3.4 272.0 162.9 6556.1 Boone 3.9 310.4 190.9 9782.8 Bradley 12.3 417.6 132.9 11507.8 Calhoun 9.8 223.4 186.2 11424.2 Carroll 2.7 261.6 212.9 9843.1 Chicot 10.7 463.6 204.9 11946.7 Clark 6.6 366.1 176.2 8036.0 Clay 2.7 353.3 206.1 11992.7 Cleburne 2.5 337.8 186.9 9551.9 Cleveland 4.7 392.9 188.4 7981.9 Columbia 8.4 341.7 242.4 11847.1 Conway 1.9 325.3 172.1 9967.4 Craighead 3.4 333.9 203.1 9563.8 Crawford 5.7 376.6 207.7 9811.4 Crittenden 9.6 378.2 252.6 12814.3 Cross 3.5 353.8 242.7 11097.0 Dallas 20.8 401.2 182.7 13535.6 Desha 4.0 424.4 200.5 12029.8 Drew 5.3 289.0 207.1 10157.2 Faulkner 3.6 282.9 198.2 7325.6 Franklin 8.1 284.6 213.1 9290.1 Fulton 8.0 316.5 218.7 11413.4 Garland 5.7 277.8 195.9 11986.6 Grant 4.8 337.8 205.1 8494.8 Greene 2.6 321.1 232.2 10679.2 Hempstead 4.8 377.3 218.2 9408.9 Hot Spring 6.1 310.4 214.1 9967.2 Howard 4.7 363.0 235.3 8990.4 Independence 3.6 306.3 214.6 9916.2 Izard 0.0 266.0 216.2 11696.4 Jackson 6.8 443.8 222.1 11069.1 Jefferson 4.9 381.1 208.8 11721.5 Johnson 2.6 284.3 196.6 9337.2 Lafayette 11.3 350.1 168.8 11054.2 Lawrence 3.7 313.8 197.8 11078.6

97
Best 25% of counties Middle 50% of counties Worst 25% of counties
Occ
upat
iona
l fa
talit
ies
Car
diov
ascu
lar
dise
ase
deat
hs
Can
cer d
eath
s
Prem
atur
e de
ath
(yea
rs)
Lincoln 4.3 361.8 198.4 11152.6 Little River 15.4 345.5 200.0 10130.0 Logan 4.2 344.4 239.8 11394.5 Lonoke 5.0 311.8 206.4 9609.7 Madison 5.0 320.2 182.4 9701.1 Marion 0.0 207.1 191.5 9800.8 Miller 6.6 288.7 203.7 10356.7 Mississippi 6.2 478.0 213.7 12566.2 Monroe 11.3 396.0 253.9 14672.2 Montgomery 2.5 340.6 185.8 9969.7 Nevada 5.3 307.4 178.5 11602.5 Newton 10.3 239.1 197.9 9225.3 Ouachita 9.6 398.8 220.9 12593.1 Perry 0.0 317.4 228.5 10580.3 Phillips 10.9 457.2 278.4 15602.6 Pike 31.5 319.4 222.2 9789.5 Poinsett 4.1 448.6 251.6 14269.4 Polk 6.6 358.4 183.6 9144.0 Pope 4.2 272.7 174.3 7990.1 Prairie 2.9 287.4 261.9 12056.4 Pulaski 4.4 285.3 202.4 10501.3 Randolph 2.3 325.9 190.5 9223.1 St. Francis 6.6 449.3 271.0 12474.3 Saline 4.1 274.6 187.9 8593.7 Scott 3.7 375.0 216.3 9630.8 Searcy 2.7 261.1 230.2 12241.0 Sebastian 2.1 310.8 212.3 9326.0 Sevier 6.6 351.8 219.8 12865.5 Sharp 1.7 319.9 195.5 11341.3 Stone 14.7 299.4 187.3 9555.8 Union 6.3 317.3 236.1 12941.3 Van Buren 9.7 262.1 187.7 11709.7 Washington 3.2 290.3 188.6 7161.8 White 3.8 368.2 198.1 9011.8 Woodruff 10.2 452.0 233.6 16388.5 Yell 3.0 379.7 217.0 10767.4