Embed Size (px)
Citation preview
1
PUBLIC HEALTH UPDATE
Eric C. McDonald, MD, MPH, FACEP
Medical Director, Epidemiology and Immunizations
Services, Public Health Services
County of San Diego Health and Human Services Agency
Annual SoCal APIC Meeting
28 September 2018

DISCLOSURE STATEMENT
I have no relevant financial relationships with
any commercial supporters.
Unlabeled/Investigational products and/or
services will not be mentioned in this talk.
OBJECTIVE
To provide an overview of investigations by epidemiology staff and current status of infectious disease issues in San Diego County

TOPICS
Influenza
MERS-CoV
Aedes-borne Diseases
Hepatitis A
Ebola
Meningococcal Disease
Measles

Influenza
“Widespread”
“Worst season in years”
“Deadly”
“Severe SeaSon”
Flu Season in the Media
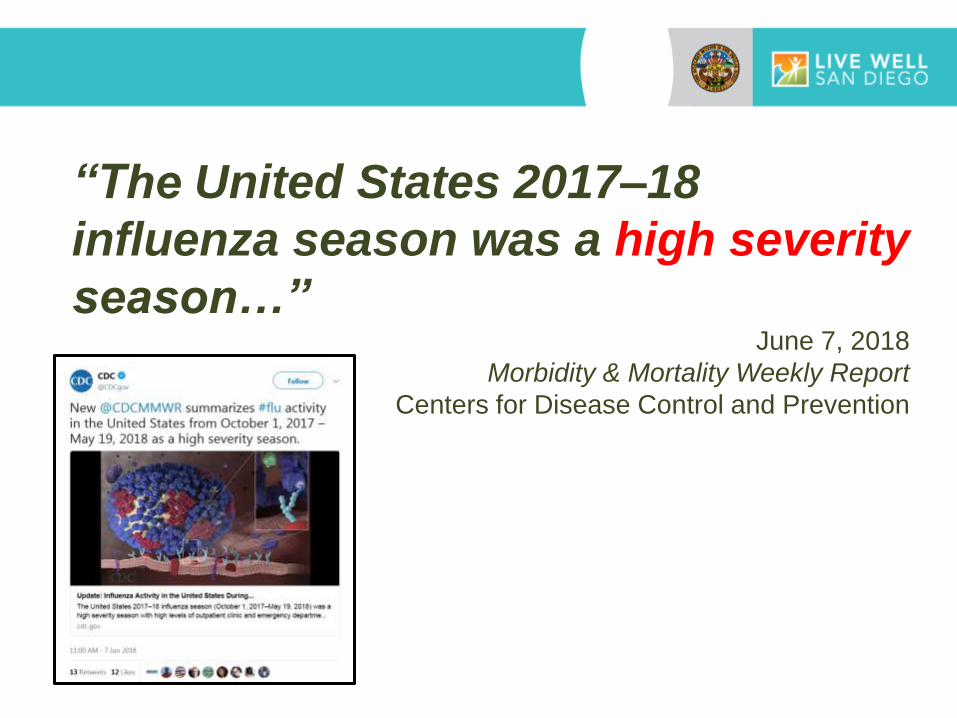
“The United States 2017–18
influenza season was a high severity
season…” June 7, 2018
Morbidity & Mortality Weekly Report
Centers for Disease Control and Prevention
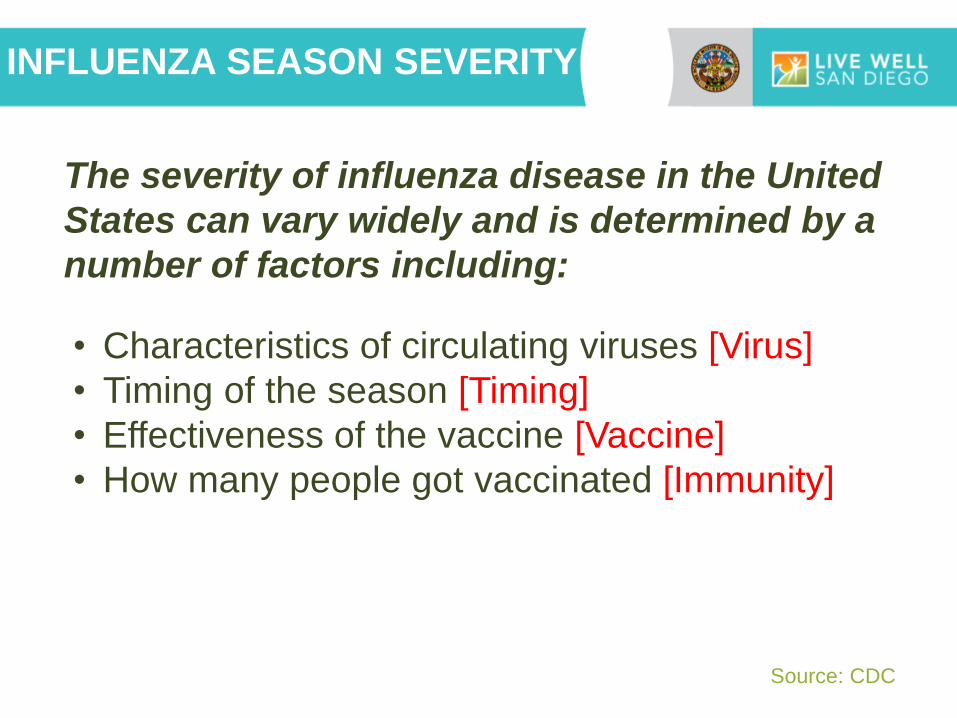
The severity of influenza disease in the United
States can vary widely and is determined by a
number of factors including:
Source: CDC
• Characteristics of circulating viruses [Virus]
• Timing of the season [Timing]
• Effectiveness of the vaccine [Vaccine]
• How many people got vaccinated [Immunity]
INFLUENZA SEASON SEVERITY

INFLUENZA SEASON 2017/18
20,833
320 342
Total Reported
influenza cases
DEATHS
ICU CASES
TOTAL REPORTED
INFLUENZA CASES
117 CONFIRMED
OUTBREAKS
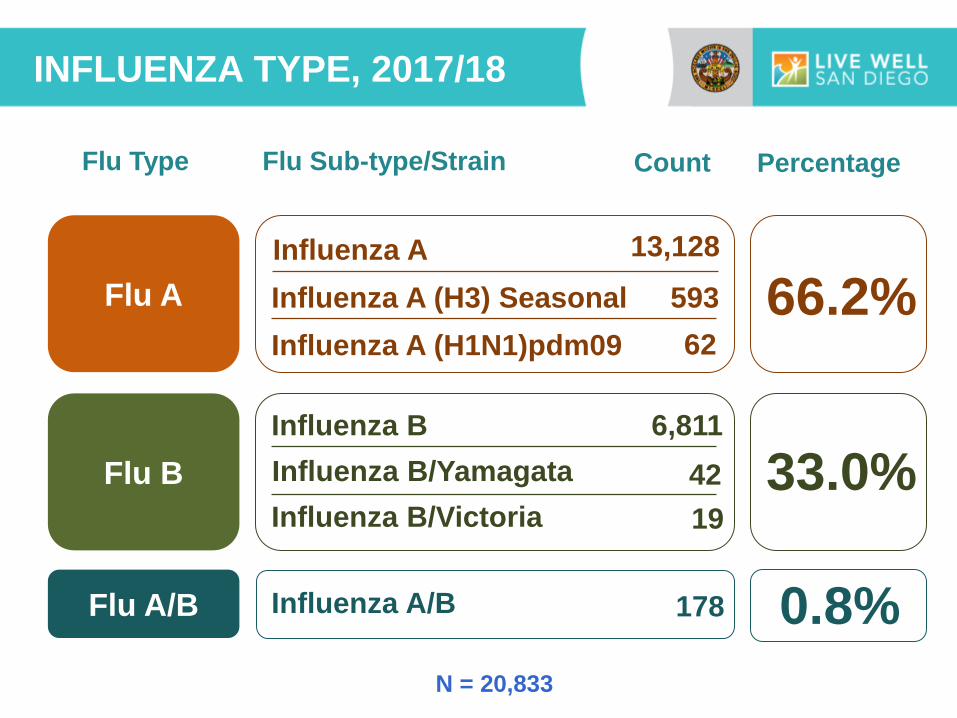
INFLUENZA TYPE, 2017/18
Flu A
Flu B
Flu A/B
Influenza A
Influenza B
Influenza A (H3) Seasonal
Influenza A (H1N1)pdm09
Influenza B/Yamagata
Influenza B/Victoria
Influenza A/B
13,128
593
62
66.2%
6,811
42
19
33.0%
178 0.8%
Flu Type Flu Sub-type/Strain Count Percentage
N = 20,833

WEEKLY CASES BY SEASON
0
500
1,000
1,500
2,000
2,500
3,000
3,500
4,000
Wk27
Wk29
Wk31
Wk33
Wk35
Wk37
Wk39
Wk41
Wk43
Wk45
Wk47
Wk49
Wk51
Wk1
Wk3
Wk5
Wk7
Wk9
Wk11
Wk13
Wk15
Wk17
Wk19
Wk21
Wk23
Wk25
2017-18 2016-17 2015-16 2014-15 Previous 5 Year Avg 2003-04
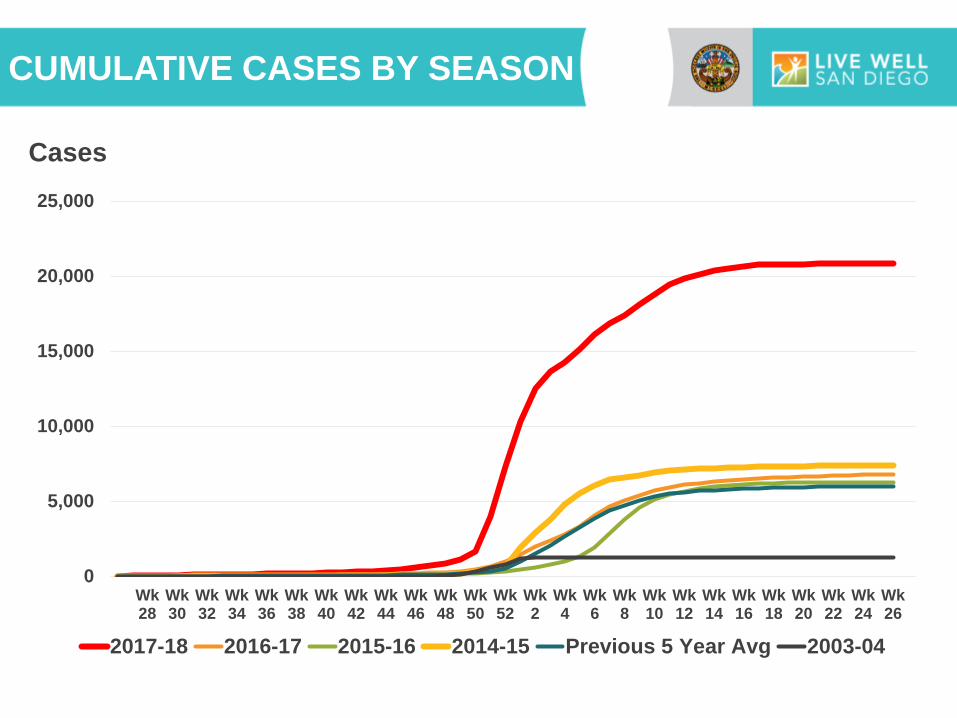
• Earlier season in 2017/18
• New historical weekly high
Cases
Cases
CUMULATIVE CASES BY SEASON
0
5,000
10,000
15,000
20,000
25,000
Wk28
Wk30
Wk32
Wk34
Wk36
Wk38
Wk40
Wk42
Wk44
Wk46
Wk48
Wk50
Wk52
Wk2
Wk4
Wk6
Wk8
Wk10
Wk12
Wk14
Wk16
Wk18
Wk20
Wk22
Wk24
Wk26
2017-18 2016-17 2015-16 2014-15 Previous 5 Year Avg 2003-04

1 22 5 14 4 9 8 58 25 13 65 70 97 71 87 342 0
50
100
150
200
250
300
350
FLU DEATHS BY SEASON
Deaths
Season

INFLUENZA DEATHS, 2017/2018
96% Had underlying health conditions
26% Residents of a skilled
nursing or long term
health facility
33% Known to
be
vaccinated
342 Deaths
Average days
between positive
influenza
lab result and death 11
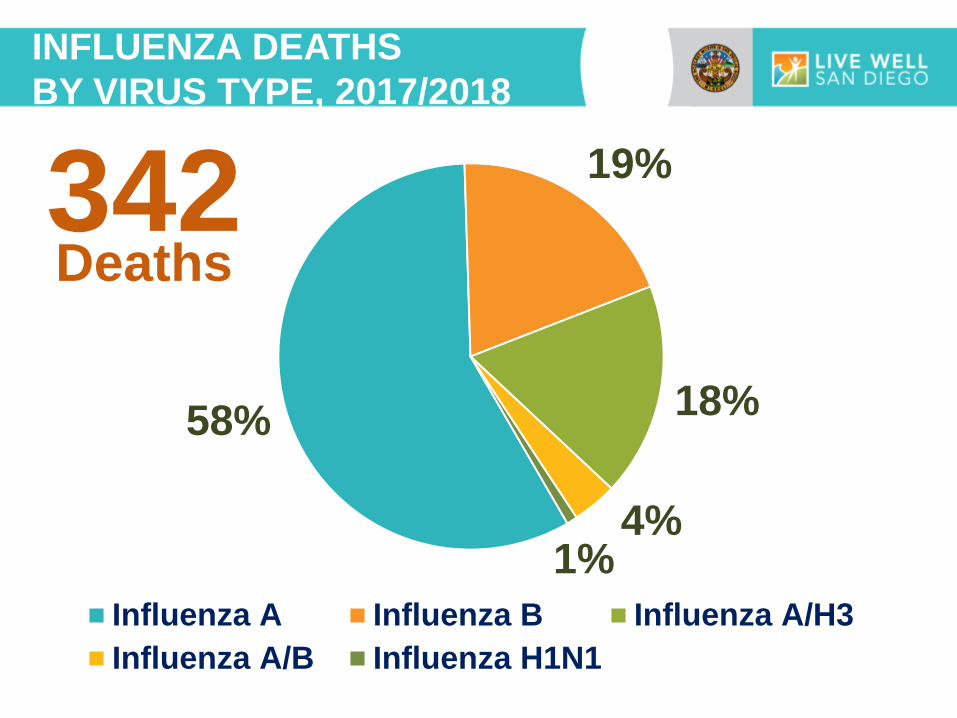
58%
19%
18%
4% 1%
Influenza A Influenza B Influenza A/H3
Influenza A/B Influenza H1N1
INFLUENZA DEATHS
BY VIRUS TYPE, 2017/2018
342 Deaths
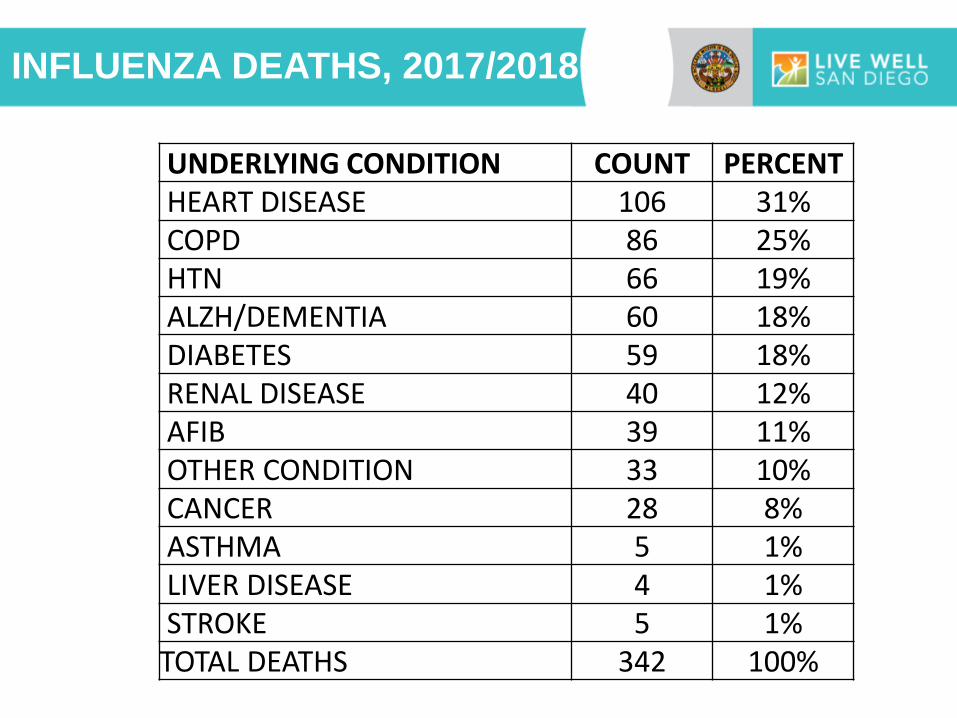
INFLUENZA DEATHS, 2017/2018
UNDERLYING CONDITION COUNT PERCENT HEART DISEASE 106 31% COPD 86 25% HTN 66 19% ALZH/DEMENTIA 60 18% DIABETES 59 18% RENAL DISEASE 40 12% AFIB 39 11% OTHER CONDITION 33 10% CANCER 28 8% ASTHMA 5 1% LIVER DISEASE 4 1% STROKE 5 1% TOTAL DEATHS 342 100%

FLU CASES BY AGE GROUP
2017/2018 Number & Age Specific Incident Rate
0.0
1,000.0
2,000.0
3,000.0
4,000.0
0
500
1000
1500
2000
2500
3000Count Rate per 100K
Co
un
t
Rate
per
100K

INFLUENZA OUTBREAKS
Confirmed
outbreaks 117
1 0 0 1 2
51 50
8 4
JUL AUG SEP OCT NOV DEC JAN FEB MAR
80% 7%
13%
Flu A Flu B Unknown Type
Total cases
1,655 Average cases
per outbreak
14.1
Influenza Type
Month Reported

52
37
56 60
47 49 51
19
48
39 40
0
10
20
30
40
50
60
70
80
Source: CDC
Influenza Season
ESTIMATED VACCINE
EFFECTIVENESS BY SEASON
Note: estimated effectiveness for preventing medically
attended, laboratory-confirmed influenza virus infection.
Percent 25% A(H3N2)
65% A(H1N1)
49% Flu B

Flu Forecast
?

48 0 DEATHS
TOTAL REPORTED
INFLUENZA CASES
CURRENT UPDATE Reported Cases Since July 1, 2018
Flu A 81%
Flu B 19%
0 OUTBREAKS
N=48
Cases by Flu Type
Preliminary Results
Data Source: Reported Influenza Case Reports
Prepared by County of San Diego, Health & Human Services Agency, Public Health Services, Epidemiology and Immunization Services Branch, 9/22/2018
0
10,000
20,000
30,000
40,000
50,000
60,000
70,000
80,000
26 28 30 32 34 36 38 40 42 44 46 48 50 52 2 4 6 8 10 12 14 16 18 20 22 24 26
Week Number 2016-2017 2017-2018 2018-2019
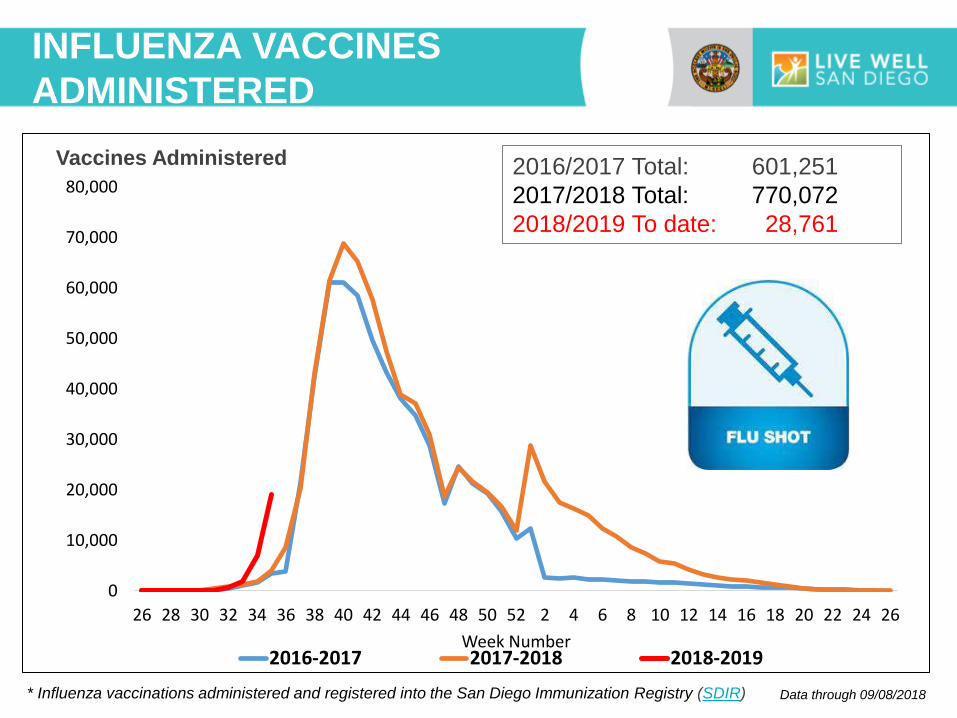
2016/2017 Total: 601,251
2017/2018 Total: 770,072
2018/2019 To date: 28,761
Data through 09/08/2018
Vaccines Administered
INFLUENZA VACCINES
ADMINISTERED
* Influenza vaccinations administered and registered into the San Diego Immunization Registry (SDIR)
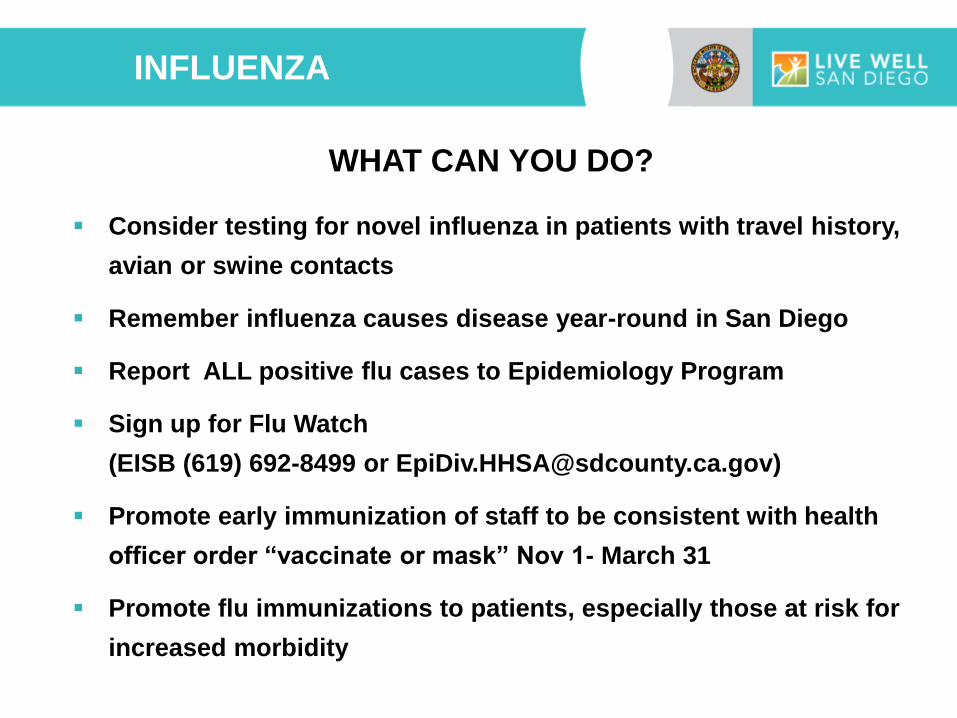
INFLUENZA
WHAT CAN YOU DO?
Consider testing for novel influenza in patients with travel history,
avian or swine contacts
Remember influenza causes disease year-round in San Diego
Report ALL positive flu cases to Epidemiology Program
Sign up for Flu Watch
(EISB (619) 692-8499 or [email protected])
Promote early immunization of staff to be consistent with health
officer order “vaccinate or mask” Nov 1- March 31
Promote flu immunizations to patients, especially those at risk for
increased morbidity
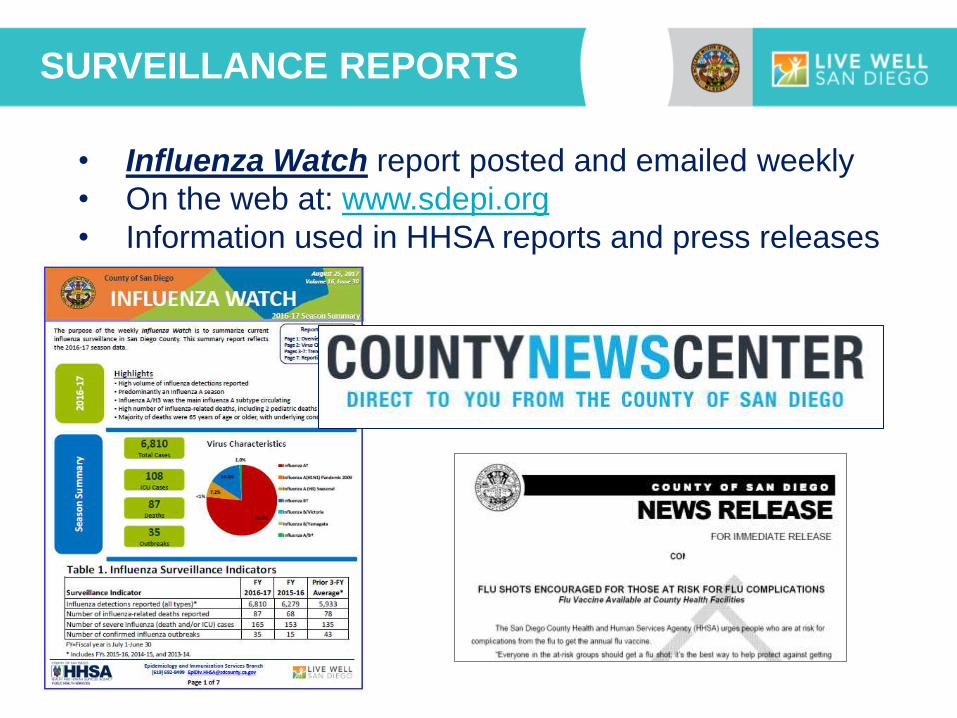
SURVEILLANCE REPORTS
• Influenza Watch report posted and emailed weekly
• On the web at: www.sdepi.org
• Information used in HHSA reports and press releases
MERS-COV

CURRENT STATUS
GLOBAL TOTAL
CONFIRMED
2,243 GLOBAL
DEATHS
795
CURRENT
CASES
KSA
9/24/18
Downloaded 9/27/18 from
https://www.moh.gov.sa/en/CCC/events/national/Documents/Epiwk36.pdf

Source: GHK CHP. Downloaded 9/20/17 from:
http://www.chp.gov.hk/files/pdf/distribution_of_mers_cases_en.pdf
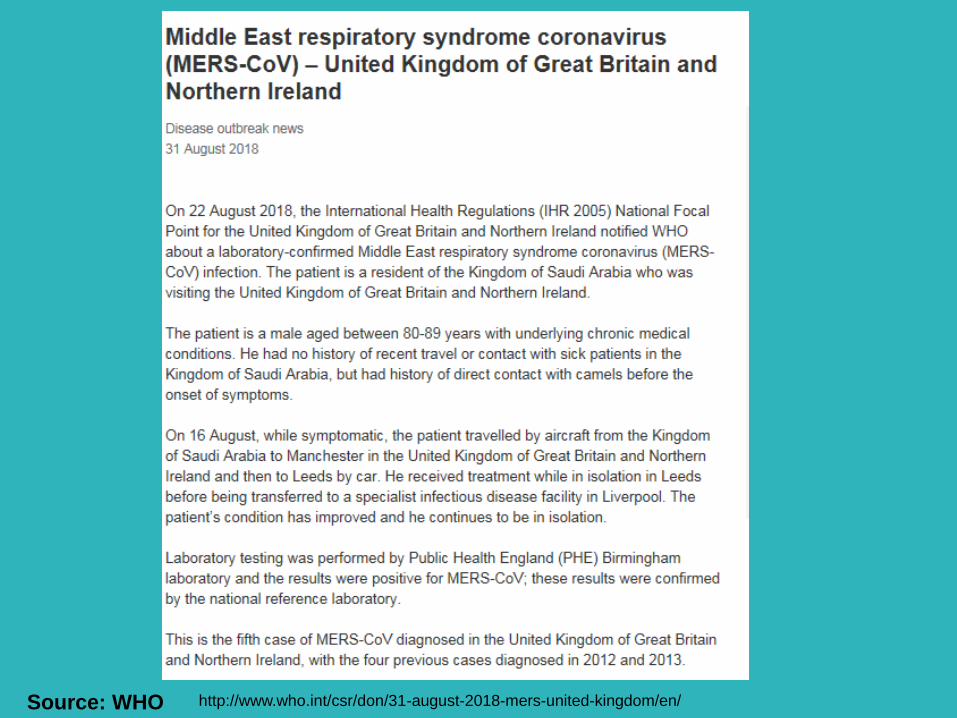
Source: WHO http://www.who.int/csr/don/31-august-2018-mers-united-kingdom/en/
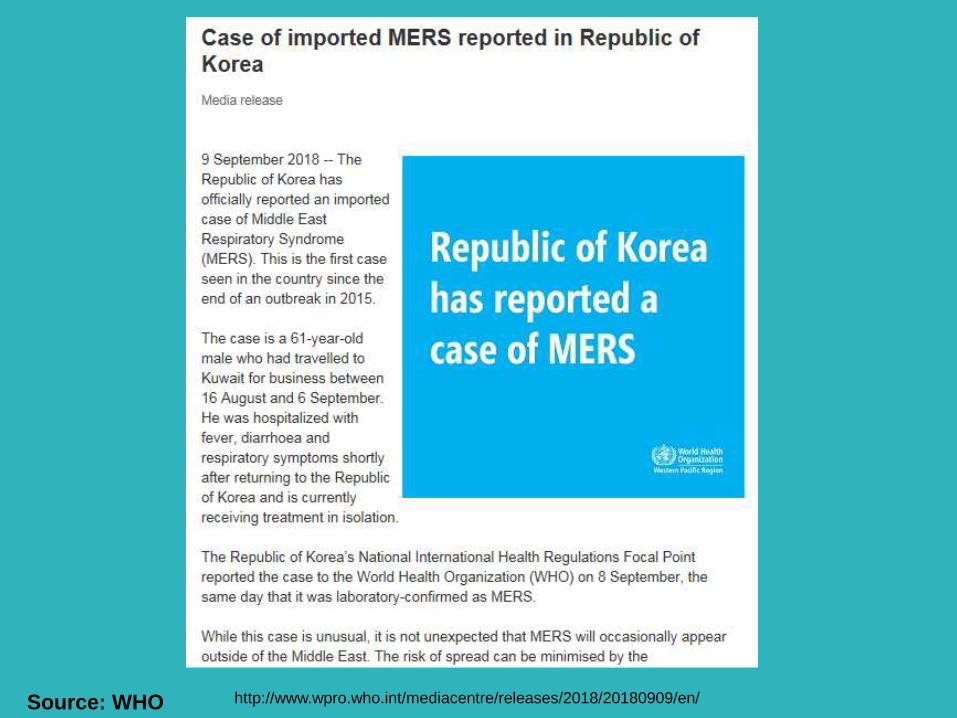
Source: WHO http://www.wpro.who.int/mediacentre/releases/2018/20180909/en/

MERS-COV
WHAT CAN YOU DO?
IDENTIFY ISOLATE INFORM
OBTAIN A TRAVEL HISTORY EARLY IN EVALUATION
Travel to affected area in last 2 weeks (HAJJ!)
Camel contact, healthcare contact
Be aware of the clinical spectrum of reported illness
Inform Epidemiology Program to facilitate testing
Three specimens needed (upper tract, lower tract, serum)
Specimens go to CDPH lab – 24 hour turn around
Counsel patients prior to travel to take precautions
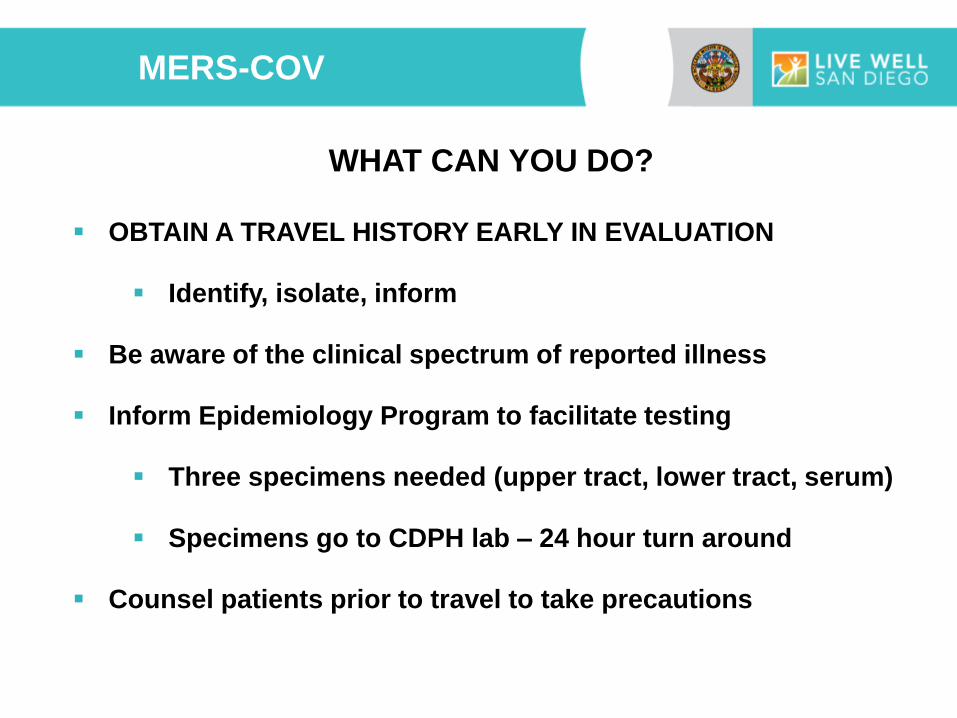
MERS-COV
WHAT CAN YOU DO?
OBTAIN A TRAVEL HISTORY EARLY IN EVALUATION
Identify, isolate, inform
Be aware of the clinical spectrum of reported illness
Inform Epidemiology Program to facilitate testing
Three specimens needed (upper tract, lower tract, serum)
Specimens go to CDPH lab – 24 hour turn around
Counsel patients prior to travel to take precautions

AEDES-BORNE DISEASES

ZIKA
Image Credit: Getty Images
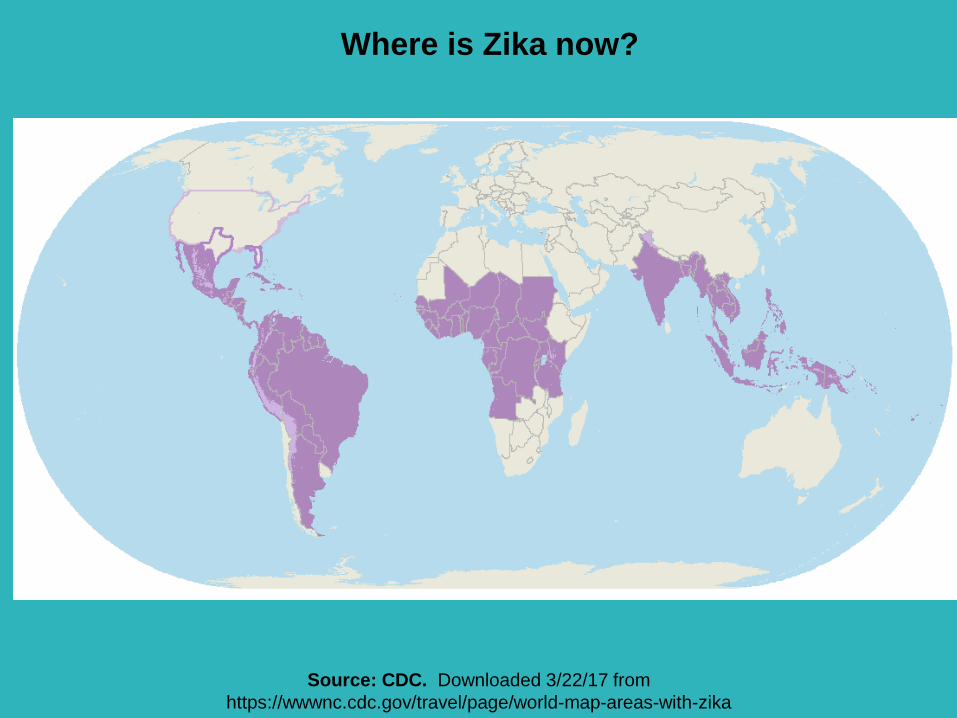
Source: CDC. Downloaded 3/22/17 from
https://wwwnc.cdc.gov/travel/page/world-map-areas-with-zika
Where is Zika now?

Africa: Angola, Benin, Burkina-Faso, Burundi,
Cameroon, Cape Verde, Central African Republic,
Chad, Congo Congo-Brazzaville), Côte d’Ivoire,
Democratic Republic of the Congo (Congo-Kinshasa),
Equatorial Guinea, Gabon, Gambia, Ghana, Guinea, Guinea-Bissau, Kenya,
Liberia, Mali, Niger, Nigeria, Rwanda, Senegal, Sierra Leone, South Sudan,
Sudan, Tanzania, Togo, Uganda
Asia: Bangladesh, Burma (Myanmar), Cambodia, India, Indonesia, Laos,
Malaysia, Maldives, Philippines, Singapore, Thailand, Vietnam
Caribbean: Anguilla, Antigua and Barbuda, Aruba, Barbados, Bonaire, British
Virgin Islands, Cuba, Curaçao, Dominica, Dominican Republic, Grenada, Haiti,
Jamaica, Martinique, Montserrat, Puerto Rico, Saba, Saint Kitts and Nevis, Saint
Lucia, Saint Martin, Saint Vincent and the Grenadines, Sint Eustatius, Sint
Maarten, Trinidad and Tobago, Turks and Caicos Islands, US Virgin Islands
North/Central/South America: Argentina, Belize, Bolivia, Brazil, Colombia,
Costa Rica, Ecuador, El Salvador, French Guiana, Guatemala, Guyana,
Honduras, Mexico, Nicaragua, Panama, Paraguay, Peru, Suriname, Venezuela
Pacific Islands: Fiji, Papua New Guinea, Samoa, Solomon Islands, Tonga
AREAS WITH
ZIKA RISK

American Samoa (4/17)
Bahamas (2/18)
Cayman Islands (7/17)
Cook Islands (3/17)
Guadeloupe (6/17)
French Polynesia (3/17)
Ilsa de Pascua, Chile (3/17)
AREAS WITH
INTERRUPTED
TRANSMISSION
Travelers’ Health
Marshall Islands (1/18)
Martinique (6/17)
Micronesia (11/17)
New Caledonia (3/17)
Palau (11/17)
Saint Barthelemy (5/17)
Vanuata (3/17)

Source: PAHO. Downloaded 9/27/18 from http://ais.paho.org/phip/viz/ed_zika_countrymap.asp
Local case count:
580,496 suspect
221,093 confirmed
Travel case count
6,162 travel
Total case count
807,751 as of 9/21/17 (!)
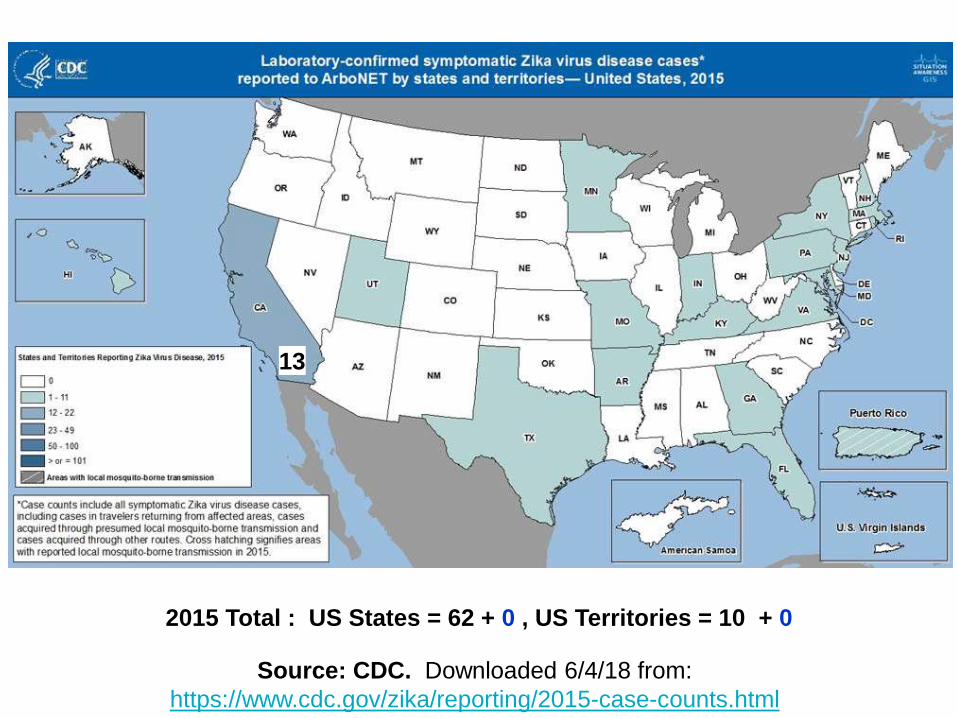
2015 Total : US States = 62 + 0 , US Territories = 10 + 0
Source: CDC. Downloaded 6/4/18 from:
https://www.cdc.gov/zika/reporting/2015-case-counts.html
13

2016 Total : US States = 5,168 + 38 , US Territories = 36,512 + 325
Source: CDC. Downloaded 6/4/18 from:
https://www.cdc.gov/zika/reporting/2016-case-counts.html
496

Source: CDC. Downloaded 7/30/18 from:
https://www.cdc.gov/zika/reporting/2017-case-counts.html
2017 Total as of 7/3/18: US States = 452 + 32 , US Territories = 666 + 6
126

Source: CDC. Downloaded 9/27/18 from:
https://www.cdc.gov/zika/reporting/2018-case-counts.html
2018 Total as of 9/5/18: US States = 41 + 6 , US Territories = 82 + 0
39
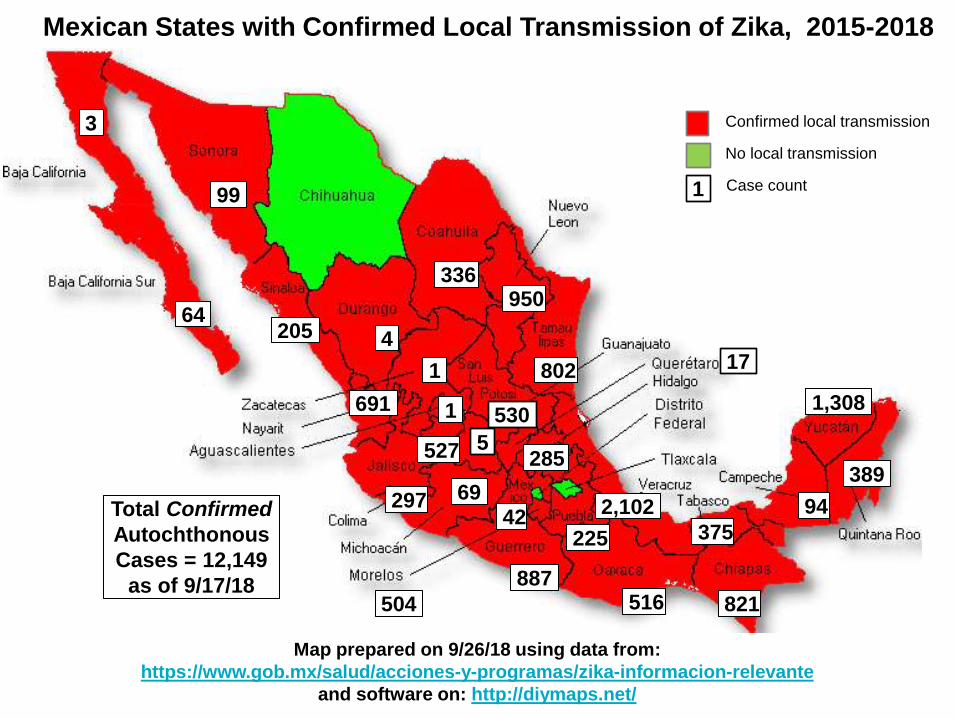
Map prepared on 9/26/18 using data from:
https://www.gob.mx/salud/acciones-y-programas/zika-informacion-relevante
and software on: http://diymaps.net/
Mexican States with Confirmed Local Transmission of Zika, 2015-2018
Total Confirmed
Autochthonous
Cases = 12,149
as of 9/17/18
1
Confirmed local transmission
No local transmission
Case count
3
64
99
205
336 950
4
691
1 802
1
527
297
504
42 69
530
285
225
2,102
516
375
821
94
389
1,308
887
5
17

Map prepared on 6/26/18 using data from:
https://www.gob.mx/salud/acciones-y-programas/zika-informacion-relevante
and software on: http://diymaps.net/
No local transmission
Case count
345
Mexican States with Confirmed Local Transmission of Zika, 2017
Case count 1
No local transmission
Confirmed local transmission
Total Confirmed
Autochthonous
Cases = 3,292
as of 6/18/18
3
60
22 107
274 108
2 1 653
493 614 15
8
2 15
4
134
6
106
78
17
27
22
5 3
196
415

Map prepared on 9/26/18 using data from:
https://www.gob.mx/salud/acciones-y-programas/zika-informacion-relevante
and software on: http://diymaps.net/
No local transmission
Case count
Mexican States with Confirmed Local Transmission of Zika, 2018
1
Total Confirmed
Autochthonous
Cases = 232
as of 9/17/18
11 28
13
95
6
8
2
5
2
2 8
Case count 1
No local transmission
Confirmed local transmission
5
1
2
9
15
2
15
1

Mexican States with Confirmed/Probable Cases of Dengue, 2016
Source: Secretaría de Salud. Map downloaded on 1/9/17:
http://www.epidemiologia.salud.gob.mx/informes/2016/dengue-semanas.html
Baja California
9 confirmed
242 probable
Total Cases
Confirmed= 17,795
Probable = 132,055
Total = 149,850
as of 1/30/17
Incidence per
100,000 of
confirmed cases

Mexican States with Confirmed/Probable Cases of Dengue, 2017
Source: Secretaría de Salud. Map downloaded on 1/29/18:
https://www.gob.mx/cms/uploads/attachment/file/285237/Pano_dengue_sem_52_2017.pdf
Total Cases with
symptom onset in 2017
Confirmed= 14,138
Probable = 89,893
Total = 104,031
as of 1/2/18
Incidence per 100,000
of confirmed cases
Baja California
11 confirmed
161 probable
Baja California Sur
30 confirmed
605 probable
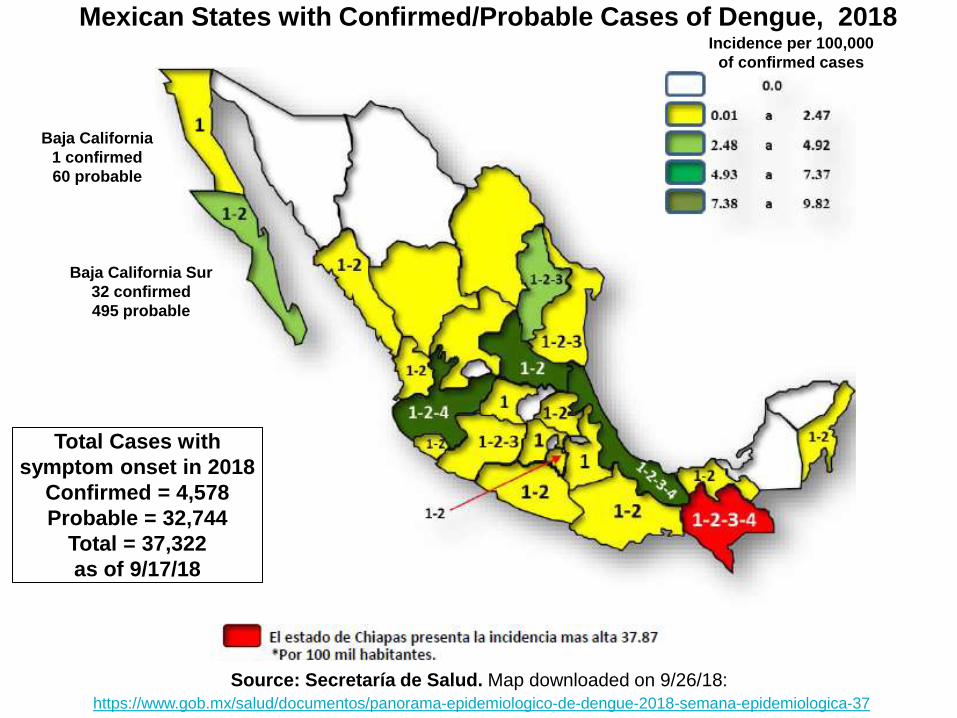
Mexican States with Confirmed/Probable Cases of Dengue, 2018
Source: Secretaría de Salud. Map downloaded on 9/26/18:
https://www.gob.mx/salud/documentos/panorama-epidemiologico-de-dengue-2018-semana-epidemiologica-37
Baja California
1 confirmed
60 probable
Baja California Sur
32 confirmed
495 probable
Total Cases with
symptom onset in 2018
Confirmed = 4,578
Probable = 32,744
Total = 37,322
as of 9/17/18
Incidence per 100,000
of confirmed cases
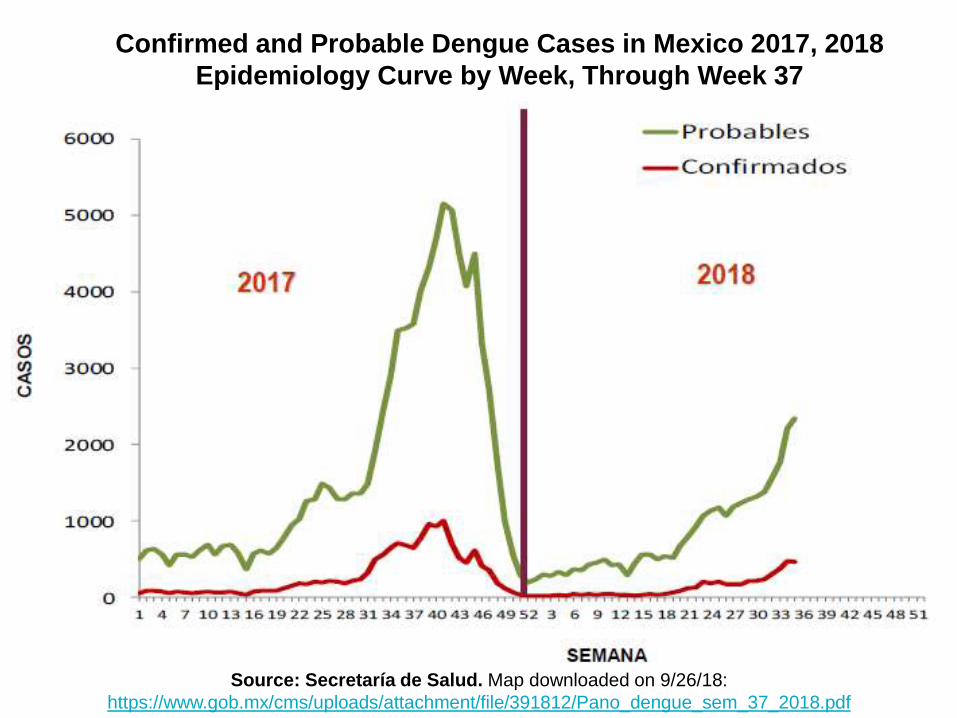
Source: Secretaría de Salud. Map downloaded on 9/26/18:
https://www.gob.mx/cms/uploads/attachment/file/391812/Pano_dengue_sem_37_2018.pdf
Confirmed and Probable Dengue Cases in Mexico 2017, 2018
Epidemiology Curve by Week, Through Week 37

Total Zika referrals: 4,519 (985 in 2018)
Confirmed/Probable Zika cases: 109 (4 in 2018)
Confirmed cases in pregnant women: 15
Cases ruled out for Zika: 4,351
Cases pending lab results or submission: 25
Cases pending lab results in pregnant women: 2
Cases referred to Vector Control: 455
Other diagnoses made:
Dengue 35 (4 in 2018)
Chikungunya 15 (4 in 2018)
ZIKA REFERRALS
IN SAN DIEGO 2015-18
For more information contact:
Eric C. McDonald, MD, MPH, FACEP Medical Director, Epidemiology and Immunizations Services
Public Health Services
County of San Diego Health and Human Services Agency
3851 Rosecrans Street (MS-P578)
San Diego, CA 92110
Phone: (619) 692-8436
Fax: (858) 715-6458
Email: [email protected]


![Nace Immunizations for Older Adults March PGS 2020 02 03[1] · 2020. 3. 2. · 2/24/20 1 Update on Immunizations for Older Adults 2019-2020 Season David A. Nace, MD, MPH, CMD Clinical](https://img.dokumen.tips/doc/110x75/601958434b889128e124ef9e/nace-immunizations-for-older-adults-march-pgs-2020-02-031-2020-3-2-22420.jpg)