Embed Size (px)
Citation preview
International Journal of Academic Research in Public Policy and Governance Januaruy 2014, Vol. 1, No. 1
15 www.hrmars.com
Public Distribution System in Tamil Nadu, India: Rice Supply Scheme of Prosperous, Problems and Policy
A Mahendran
TATA Institute of Social Sciences, Hyderabad, Andhra Pradesh, India
S Indrakant Council for Social Development, Hyderabad, Andhra Pradesh, India
*1Corresponding authors email: [email protected], 2* [email protected]
DOI: 10.6007/IJARPPG/v1-i1/635 URL: http://dx.doi.org/10.6007/IJARPPG/v1-i1/635
Abstract Public Distribution System (PDS) is a poverty alleviation programme and contributes towards the social welfare of the people. Essential commodities like rice, wheat, sugar, kerosene are supplied to the people under the PDS at reasonable prices. As per the announcement of Govt of Tamil Nadu, from 01st June 2011 onwards the rice is supplied at free of cost. Rice is important and stable food for poor people and PDS is a back bone to the below poverty line family. This study analysis the impact of free rice in coastal region population in the state. In this study multi- stage random sampling was used to select different coastal districts. The results showed that only17.4 percent of poor families are utilizing and others are buying in open market and black markets. The system facing many problems in inside and outside the state. Key Words: Free rice, PDS, Coastal region, Impact, Utilisation, Problems, Tamil Nadu. Introduction
A glance at statistics on Nutrition and Health status in India seriously disturbs the mind of socially concerned persons. The Statistics reveal that 20 per cent of the population in the country are undernourished, 40per cent of children below the age of 3 are under weight, 80 per cent of children in the age group of 6 to 35years are anemic and 33 percent of women in the age group of 15 to 49 have Body Mass Index (BMI) below the normal.
According to the latest report (WHO 2010) on the state of food insecurity in rural India, more than 1.5 million children are at risk of becoming malnourished because of rising global food prices. A well-functioning Universal PDS could be the means to ensure adequate physical access to food at the local and household levels before 1997 (Madhura S 1996) and that targeted programme often pushing the universal programme back. (MS Swaminathan 2010) suggested that food security is based on continuous reforms of PDS, effective storage of food grains and a sustained effort to increase agricultural productivity. (Jean Dreze 2012) suggests the introduction of a (quasi-universal system) based on specific

International Journal of Academic Research in Public Policy and Governance Januaruy 2014, Vol. 1, No. 1
16 www.hrmars.com
inclusion criteria, as well as a system of food coupons which possess a unique identification number and hologram, extensively used in Tamil Nadu is another method to track PDS grain to the household level. (Surojit 2009) integrating community involvement and decentralized procurement have also been suggested for reducing corruption. According to (Rajagopalan 2010), only 18 out of 31 states had been surveyed to identify below poverty line (BPL) families, In some states where surveys had been conducted, BPL families have been missed out, performance of Targeted PDS is considered to be poor in states with high number of BPL families, also lack of co-ordination between national and village level further impede its performance. Implementation of TPDS across states is also wrought with misappropriation. In the state of Tamil Nadu had issued BPL cards to the entire population by considering everyone to be below poverty line. The number of BPL cards issued in Andhra Pradesh exceeded the numbers registered below poverty in this state (Outlook Business 2009, Tritah 2003).There is an evidence of improvement in the Targeted PDS in most of other states (Jean D & Reetika K 2013). In the state of Karnataka populist scheme “Anna Bhagya” will be launched as on 10th July 2013. In 97lakh BPL family and AAY cardholders in the state would receive 30kg of rice at one rupee. It will get two square meals a day it will provide nourishment to the families (Government of Karnataka report). The state food subsidy is cost of the government Rs460crore a year. In Andhra Pradesh Government is launched an ambitious scheme under which the beneficiaries could buy rice at one rupee per kg from the state foundation day falls on 1st Novermber 2011(Government of AP report). The scheme would benefit about 7.50crore poor people in the state. There are as many as 2.01crore white card-holders under the PDS benefited. The state food subsidy Rs600crore would be necessary a year. In Odisha state 25 to 35kgs rice at price of one rupee as on February 2013distributed among the targeted groups under BPL, APL, AAY, KBK APL and SC/ST hostels has ensured a much improved PDS (Jean Dreze and Reetika 2012). To point out the Odisha, Karnataka and Andhra Pradesh are neighbouring states in Tamil Nadu, which has ensured a much improved Targeted Public Distribution System. But Tamil Nadu introduced a new scheme on free rice to poor people as well as Universal PDS System. But this study found that who are benefited by this system, whether poor or others? What are the complaints in PDS outlets? How the PDS rice smuggling to neighbouring states? Whether it is really effective in the state? Review of Literature Venugopal(1992) examined the impact of the welfare scheme on the reduction of hunger. Sastry et.al (1990) attempted to estimate leakages in the PDS. KrishnaRao(1993) made a critical evaluation of the scheme. The impact of alternative intervention policies has been the topic of analysis of Radhakrishna and Indrakant(1988) and Indrakant(1992). These study a cursory glance at the subsidised rice scheme of Andhra Pradesh and related to PDS distribution. Bhaskar Dutta, Barat Ramaswami(2001)This paper compares the public distribution of food in Andhra Pradesh and Maharashtra. Based on the 50th round of National Sample Survey (NSS) household consumption survey data, the authors examine differences in utilisation, extent of targeting, magnitude of income transfers and the cost-effectiveness of food subsidies. The findings suggest policy reforms in favour of self-targeting and greater operational efficiency.

International Journal of Academic Research in Public Policy and Governance Januaruy 2014, Vol. 1, No. 1
17 www.hrmars.com
B. Ramaswami and P. Balakrishnan (2002) as public intervention is a pervasive influence on food prices, this paper asks whether and how the inefficiency of state institutions matters to food prices. In the context of the wheat subsidy scheme in India, the paper models the implications of quality differences between public and private grain supply. As both are procured at similar prices, the lower quality of public grain marks the inefficiency of government operations. The paper proposes and empirically validates a method to test for demand switches that occur as a result of quality preference. As a result, a reduction in food subsidies increases food prices and hurts the poor even when they are not major recipients of the subsidy. This seeming paradox is contingent on the inefficiency of public interventions. Thus, the outcome will be different if the reduction in food subsidy were to be accompanied by reforms in the associated state agencies. Mihir Rakshit(2003) This paper suggests a simple analytical framework in terms of which answers to questions of an optimal food policy package can be fruitfully sought. This, we believe, is a worthwhile endeavour since not only can some crucial sources of policy failure over the last quinquennium be appreciated in terms of our model, but the absence of such a framework seems to have led the High Level Committee set up to formulate a long term grain policy astray on some important issues in its otherwise well documented and persuasive report. Ruthu Kattumuri(2011) performance of PDS not only varies across states but more so between rural and urban centres. Scaling up involvement of multiple stakeholders including teachers, parents, civil societies, private organisations and religious communities would enhance accountability and performance of PDS in India. Reetika Khera(2011) This paper estimates the proportion of grain diverted from the public distribution system to the open market in the past decade by matching official off take figures with household purchase reported by the National Sample Survey. At the all-India level, diversion of PDS grain remains a serious issue; however there are interesting contrasts at the state level. Based on trends in monthly per capita purchase of PDS grain and estimated diversion, states are categorised into three groups “functioning”, “reviving” and “languishing” states. The paper also discusses the possible reasons for the improvement in the PDS in the reviving states and questions the assessment of the PDS as uniformly and irreversibly dysfunctional. Jean Drèze, Reetika Khera(2013)This article presents estimates of the impact of the public distribution system on rural poverty, using National Sample Survey data for 2009-10 and official poverty lines. At the all-India level, the PDS is estimated to reduce the poverty-gap index of rural poverty by 18% to 22%. The corresponding figures are much larger for states with a well-functioning PDS, eg, 61% to 83% in Tamil Nadu and 39% to 57% in Chhattisgarh. Though number of studies has been conducted on PDS and food policy, but this paper find out impact of free rice distribution is measured quantitatively to suggest policy. Socio-Economic Profile of Tamil Nadu Tamil Nadu lies on the southern tip of the country and is located in the North Latitude between 8 5’ and 13. 35 and East Longitude between 76 5’ and 80 20’. The state is bounded by Kerala on the west, Andhra Pradesh and Karnataka on the North, Bay of Bengal on the east and Indian
International Journal of Academic Research in Public Policy and Governance Januaruy 2014, Vol. 1, No. 1
18 www.hrmars.com
Ocean in the south. For administrative convenience, the state is divided into 31districts, revenue division 76, revenue taluks 220, revenue firkas 1127 and revenue villages 16564. In the case of rural Tamil Nadu, though the shares of rural population have come down over the years from 65.84 percent in 1991 to 55.95percent in2001 and latest census 2011 is 51.55percent. As the spatial temporal distribution of rainfall was good during past several years the performance of agriculture was stable. Incidence of poverty in rural Tamil Nadu was at 29.16 per cent as per Union Planning Commission in 1999-2000. According to Government of India Planning Commission in 2011-2012 issued latest report on rural poverty as monthly per capita expenditure Rs.880 and urban is Rs.937. State estimates in Average Monthly Per Capita Expenditure as per Mixed Reference Period (MRP) rural is 1570.61 and urban is 2534.32.The decline in poverty flows from the increase in real per capita consumption in the state.
PDS in Tamil Nadu
Tamil Nadu has a universal PDS, where all households are entitled food from ration shop, including 20 kg of rice per month. In many other states, the Targeted PDS could be accessed only by Below Poverty Line (BPL) households. In those states, BPL lists are far from perfect, firstly they cover too few households, and secondly, they come with a lot of exclusion errors. As a result, the Targeted PDS does not ensure food security in early time. But now impact is particularly large in those states with a well-functioning PDS reinforcing recent evidence of the fact that PDS is now an important source of economic security for poor people in many states. But the Tamil Nadu state followed the old system of universal PDS 35 kg rice is distributed to AAY families and 20 kg rice is distributed to rest of the families which are supplied through Civil Supplies and Co-operative Societies.
Politics and PDS in Tamil Nadu In its election manifesto, the (AIADMK and DMK) promised free rice will be given to all people, and this was implemented soon after the elections. The PDS is a very good media to reach the people easily to the political parties in the state, and it often stands first in the list of schemes mean to lure or attract voters. As per government order follows the announcement of Chief Minister has made an electoral promise regarding the provision of free rice distributed as on 1st June 2011.Whichever government comes to power, they are ensuring proper working of the PDS. Coverage to the Card holders
This system covered 18.62lakh AAY beneficiaries and 1.83crore card holders are entitled to free rice and totally 32,535 ration shops across the state. Every month either raw or boiled the rice will be distributed to the card holders through the ration shops (fair price shops). The state government had been providing 3.82lakh tonnes of standardised rice. This rice was distributed to the family members nearly 12-20kgs proportionately but except in Nilgris district minimum of 16kgs and maximum 24kgs rice were distributed to per card holder. Family cards particular in rice cards 1, 67, 21,538, AAY 18, 62,615rice and full commodities. Sugar cards 10, 76, 552,

International Journal of Academic Research in Public Policy and Governance Januaruy 2014, Vol. 1, No. 1
19 www.hrmars.com
(except rice), police card 61,061(all commodities) and None-commodities cards 60,827 are circulated in Tamil Nadu. In the state fair price shops are covered in average population was 2217(table 01). In this study area higher population in Thiruvallur districts is covered less level fair price shops in average per FPSs 3748population. In the state covered per fair price shops are 585 ration cards as on 30.6.2013. The state food subsidy of free rice distribution was increased to the Govt nearly Rs.500 crore in a financial year. Transparency in PDS status via SMS In Tamil Nadu, the food department has put in place a system whereby any ration cardholder can send an SMS with the FPS number to receive instant information regarding the stock of each PDS commodity available in that outlet. This is an impressive arrangement, which illustrates the scope for effective IT-based transparency measures using straightforward technology.
Scope of this Study
In 26th, December 2004 tsunami significantly affected the coastal regions of southern peninsular India. Especially in Tamil Nadu, 13 coastal districts are completely damaged. The coastal population are affected with Social-Economic problems in those districts. The World Bank, GOI and other NGOs are helped those areas by reconstruction of houses, agricultural lands, fisheries infrastructure, animal husbandry, public infrastructure and created green shelter belts and undertake scientific studies in the affected coastal areas. After 7 years the state government distributed free rice to all regions but this study focused on affected tsunami coastal areas purposively because whether it is effective and utilize properly by the poor people and whether the rural poverty and hunger rates are reduced or increased in the selected study areas. Objectives of the Study To study find out the impact and utilisation of the free rice in coastal region To study find out the problems, corruption and complaints in coastal region To study suggest policy oriented ideas Methodology of the Study
For this study, data was collected from nearly 5200 households in 13 coastal districts by mean of a household questionnaire, on the background of household characteristics, individual opinion about PDS. This data were collected by group discussions and informal discussion with various coastal region people in the villages. In this study, multistage sampling technique was adapted like selection of districts, followed by selection of blocks, villages and finally of households. Two villages from each of 13 districts were chosen for the survey. The districts were selected through a purposive sample. Since the survey could not cover very large parts of the districts and whoever selected as a sample from all regions have got adequate representation and the survey was carried out in thirteen districts. The districts were Thiruvallur, Chennai, Kancheepuram, Villupuram, Cuddalore, Nagapattinam, Thiruvarur and
International Journal of Academic Research in Public Policy and Governance Januaruy 2014, Vol. 1, No. 1
20 www.hrmars.com
Thanjavur, Pudukkottai, Ramanathapuram, Thoothukkudi, Tirunelveli, and Kanniyakumari. These district only a fair geographic spread, but also high Marin fish production and differing levels of developments in South to North coastal regions in Tamil Nadu. This study find out only (pre-testing) frequency analysis related to problems, successful and policy of free rice distribution in PDS. Socio-Economic Characterise in Selected Study Areas The present study described the demographic variables such as covered in selected coastal region were male 13percent, female 86percent and the female are more respondents in this study because they are home makers. Secondly, educational qualification were 10th std as 71.6percent, HSc 28.3percent, and degree only 4.8percent covered, showed that literacy rate was low in rural coastal areas. In most of the respondents are highest in rural 79percent, urban based coastal 21 percent. In Coastal region, majority of religion as Christian 61.9 percent, secondly Hindu 29.3percent, Muslim is 8.6percent. In this study fisher men were Christian community and they are high percents. Head of the family’s occupation were agri-labour Nil and Fishing industrial labour 4.1percent, fisher man 84.5percent, fishing marketing labour 5.7percent, and others 5.5percent. This study mostly stated that fisher family were high. In rural family system, join system was 84percent, nuclear family were only 15.9percent. This study covered to average land owned as irrigated area 13.2percent and unirrigated area 5.9percent and there is no land owned 92.6percent. In number of live stock owned are cows and buffaloes 7.9percent, sheep and goats are 12percent and nothing else was 87.1percent. In rural mini transport vehicles are improved like bicycle 76percent and two wheelers 17.2percent and 4wheeler are 1percent, none of those was 5.6percent. To coastal life style, it improved because household assets like TV, Mixer, Grinder, Fan, Washing machines etc, are 100percent are available in rural areas. With regard to family children are below 14years are 56.8percent and above 14to20 years are 43.1percent and they are student of government schools. This study mainly covered membership in organisation was SHGs 50.2percent and NREGA are 45.8percent and no membership in any other group was only 3.4percent. It was this study suggested that rural empowerment also increased. In this study most of rural household have account holder in post office 24.2percent, bank account 75.7percent were covered. Impact of PDS in Selected Study Areas This research paper covered total number of ration cards were (with all commodity) 88.1percent, Sugar cards 11.8percent and No-commodity cards are not available. The main reason are genuine they don wont any products from PDS and basically this people are rich. Poor People buying capacity (last time or months) are 83.25percent full grains and 10.percent are half buying, 1/3grains are 6.75percent are covered. Most of poor people are satisfied to free rice was 89.9percent, not satisfied only 11percent. But main reasons are 81percent of food grain’s quality were good, poor quality was only 18.9percent stated. People agree that weights are accurate in ration shops was 76percent and disagree was 23.3percent, but still some problems are persist in measurements. This study suggests most of poor families are depended on PDS food grains were 94.25percent and not-depended only 5.75percent.

International Journal of Academic Research in Public Policy and Governance Januaruy 2014, Vol. 1, No. 1
21 www.hrmars.com
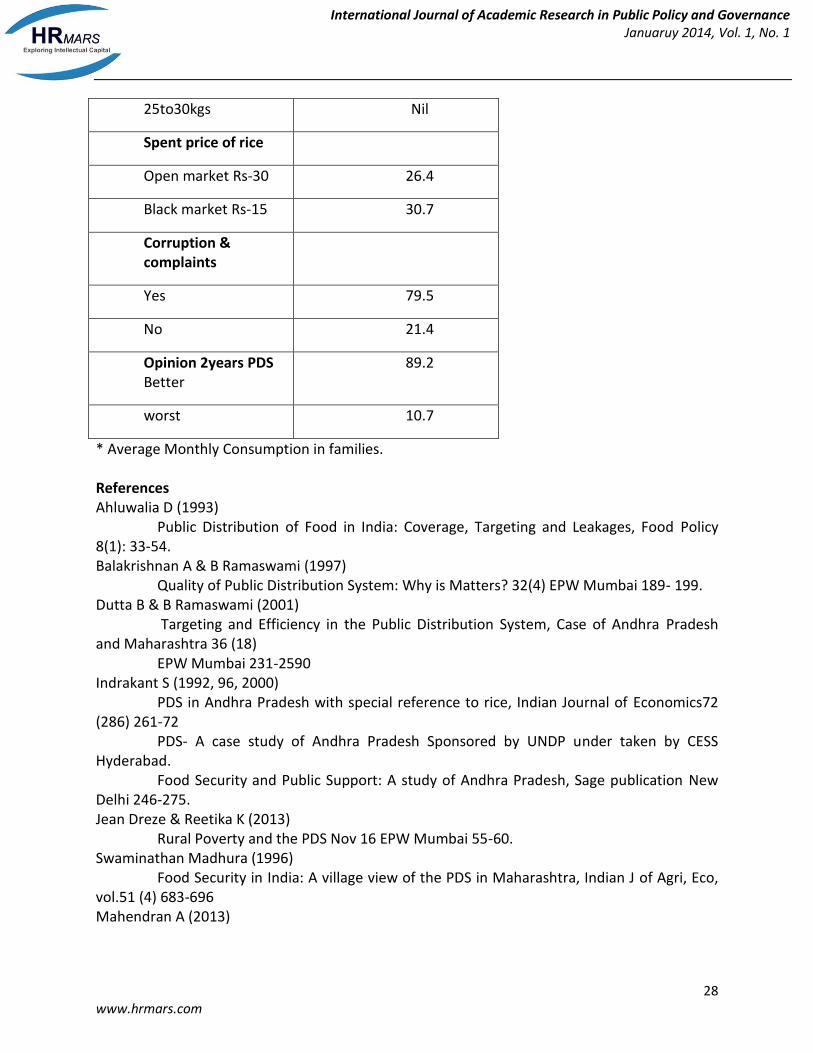
Utilisation of PDS in Selected Study Areas With regard to overall satisfaction on functioning of local PDS outlets was better 81.9percent and worst are 18.0percent. In free rice sufficient families are 35kg rice in AAY families 92.6 percent, only 8.3percent are not sufficient. But 20kg rice allotment families are sufficient only42.8percent but not sufficient are 57.1percent because these families are buying additional rice from open market and black markets. Poor families are buying open market is 21.6percent and 35.5 percent are buying in black markets. This study suggest poor families are buying capacity is high in block market. Average monthly consumption of rice in poor families is only 20kg are17.4percent, 20 to30 kg rice is 63.9 percent and 30 to 40 kg rice is 18.7percent, consumption status are increased in poor families. This study suggests only 17.4percent families are utilised government allotment of free rice system. The poor family need for additional food in rice, buying to black market 10 to 20kg is 27.6percent and 20 to 25kg rice is 7.8percent, 25 to 30kg rice is not buying. In open market, 10 to20kgs 20.6percent, 20 to 25kg 0.6percent and 25to30kg is not buying. In normally poor families are needed addition foods for rice is 10 to 15kgs are suggested in this paper. The poor people spent on price of open market are Rs 30 in rice (brand of IR-20) is 26.4percent and black market price is per kg Rs15 as buying 30.7percent (the black market rice as same in PDS rice). If compare to last 2years, transaction of free rice and other activities on PDS is better were 89.2percent and no change it is same like previous was only 10.7percent. But still now corruption and complaints were 79.5 percent. Major Problem in PDS How smuggling of free rice one state to other states? How black markets are developed in the context of free rice? This study (covered79percent complaints) discussed that coastal people are complaint about black market and it is unique. The reasons are some (APL) family cardholders are selling their ration cards for money with the rate of Rs.100 for one month. Each block marketer they have approximately 20 to 25 cards are available (particular in each street). Now small calculation exploring that 25 cards rate is Rs.2500 and person buying ration rice with free of cost as (25x20=500kgs). The next step is re polishing that rice and again resell to poor people per kg is Rs.15 (500x15= 7500). Black market expenses total card rate Rs.2500, re polishing charge is Rs 750(approximately) (2500+750=3250) and profit is Rs (7500-3250=4250) per month a single block marketer will get it. Profit of selling rice outside rates is huge. The main profit to the block marketers is through smuggling of the rice from one state to other states. Policy Suggestion in PDS This study suggested some new ideas in our point view only 17.4 percent families are utilised PDS allotments and remaining above 60percent of the families are buying from open market and black market. For example: each BPL family buying 20kg rice from PDS in addition they need 15kg, and they will buy from open-market with the price of Rs.30 per kg. The black market rate is Rs15. Each Family meets minimum requirements of 15kgs additional rice spends (15x30= Rs.450 in open market and block market 15x15= Rs.225). There is nothing wrong, the state government supplies to BPL family’s minimum requirements as35kgs at fixed with reasonable or strong stable prices. 92percent of AAY family card responded are sufficient 35kg of free rice

International Journal of Academic Research in Public Policy and Governance Januaruy 2014, Vol. 1, No. 1
22 www.hrmars.com
to this study suggested these cards only free rice distribution and finally fixed the price for APL family with high price for food grains. The black markets are alternatively reduced and needs of strong law and order developed, if they to sell any card even if the cards include no-commodity. If introduced this system, first find out who is BPL and APL family then give free rice. At present
Districts Area(sq.km)
Population* as 2011
Literates*
FPSs*
Per FPSs Population*
Thiruvallur 3550
3725697
281283
9
994
3748
Chennai 174 4681087
385047
2
1613
2902
Kancheepuram
4307
3990897
306579
9
1404
2843
Villupuram 7190
3463284
222360
5
1971
1757
Cuddalore 3706
2600880
184980
5
1361
1911
Nagapattinam
2417
1614069
122731
1
721
2237
Thanjavur 3476
2402781
180229
1
1143
2102
International Journal of Academic Research in Public Policy and Governance Januaruy 2014, Vol. 1, No. 1
23 www.hrmars.com
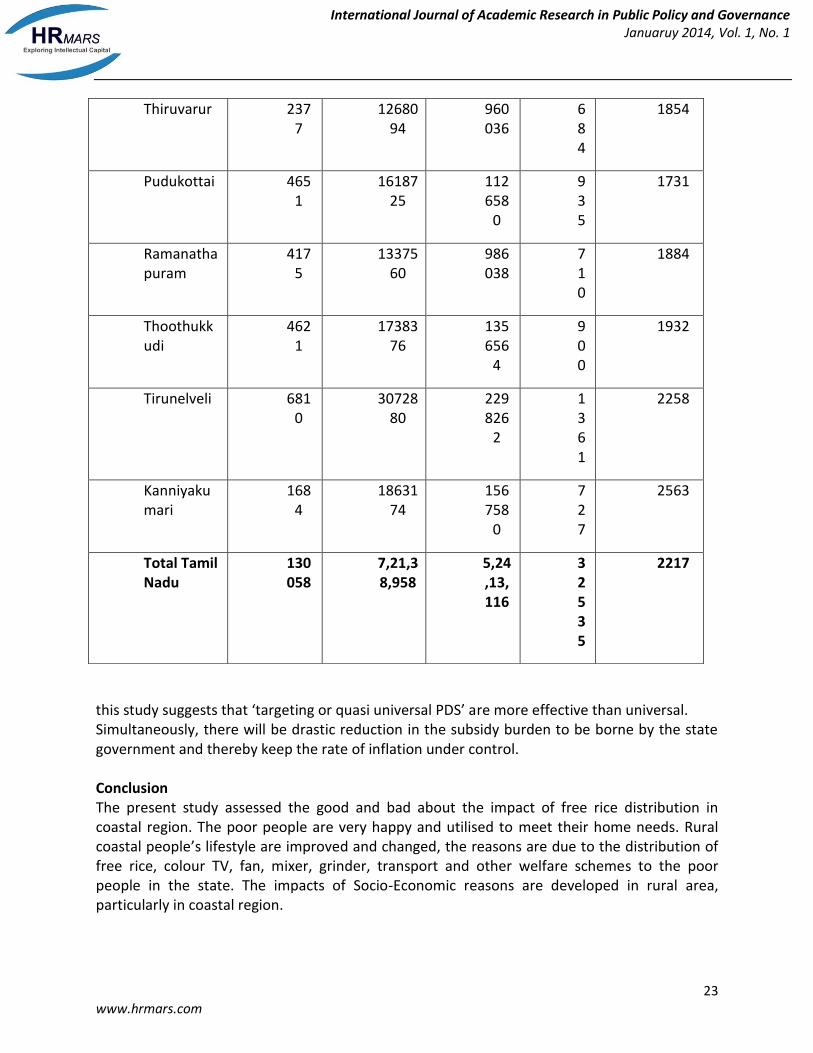
this study suggests that ‘targeting or quasi universal PDS’ are more effective than universal. Simultaneously, there will be drastic reduction in the subsidy burden to be borne by the state government and thereby keep the rate of inflation under control. Conclusion The present study assessed the good and bad about the impact of free rice distribution in coastal region. The poor people are very happy and utilised to meet their home needs. Rural coastal people’s lifestyle are improved and changed, the reasons are due to the distribution of free rice, colour TV, fan, mixer, grinder, transport and other welfare schemes to the poor people in the state. The impacts of Socio-Economic reasons are developed in rural area, particularly in coastal region.
Thiruvarur 2377
1268094
960036
684
1854
Pudukottai 4651
1618725
112658
0
935
1731
Ramanathapuram
4175
1337560
986038
710
1884
Thoothukkudi
4621
1738376
135656
4
900
1932
Tirunelveli 6810
3072880
229826
2
1361
2258
Kanniyakumari
1684
1863174
156758
0
727
2563
Total Tamil Nadu
130058
7,21,38,958
5,24,13,116
32535
2217

International Journal of Academic Research in Public Policy and Governance Januaruy 2014, Vol. 1, No. 1
24 www.hrmars.com
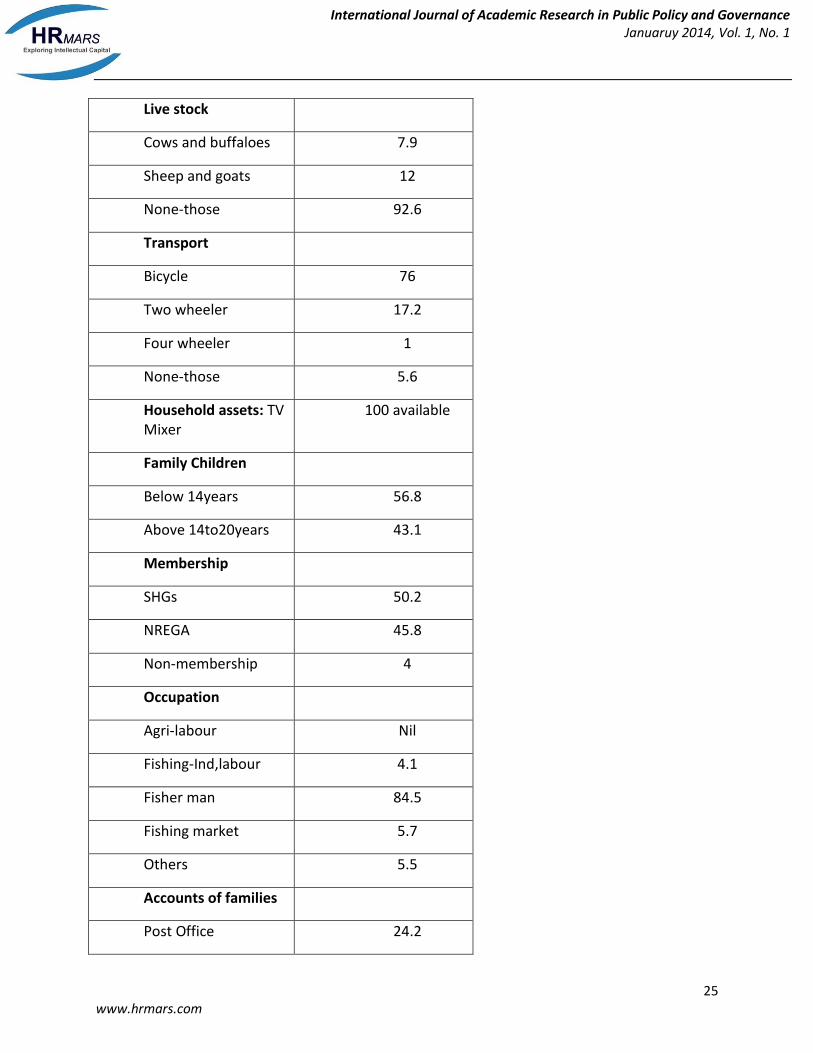
Table 01 Selected Study area, population, literate and fair price shops as on 31.03.2011 Sources: Statistical Hand Book of Tamil Nadu 2012 (* in Numbers). Table 02: Socio-Economic Characteristics of Sample Household in Coastal Region.
Gender Frequencies (pre-testing)
Male 13
Female 86
Education
10th Std 71.6
HSc 28.3
Degree 4.8
Area
Rural 79
Urban 21.6
Religion
Hindu 29.3
Muslim 8.6
Christian 61.9
Family
Joint family 84
Single family 15.9
Land owned
Irrigated area 13.2
Un-irrigated area 5.9
No-land 92.6
International Journal of Academic Research in Public Policy and Governance Januaruy 2014, Vol. 1, No. 1
25 www.hrmars.com
Live stock
Cows and buffaloes 7.9
Sheep and goats 12
None-those 92.6
Transport
Bicycle 76
Two wheeler 17.2
Four wheeler 1
None-those 5.6
Household assets: TV Mixer
100 available
Family Children
Below 14years 56.8
Above 14to20years 43.1
Membership
SHGs 50.2
NREGA 45.8
Non-membership 4
Occupation
Agri-labour Nil
Fishing-Ind,labour 4.1
Fisher man 84.5
Fishing market 5.7
Others 5.5
Accounts of families
Post Office 24.2

International Journal of Academic Research in Public Policy and Governance Januaruy 2014, Vol. 1, No. 1
26 www.hrmars.com
Bank 75.7
Table 03: Impact of PDS in Selected Study Areas
Coverage of Cardholders
Frequencies (pre-testing)
Rice cards 88.1
Sugar cards 11.8
AAY cards
Buying capacity
Full grains 83.25
Half grains 10
1/3grains 6.75
Satisfied free rice
Satisfied 89.9
Dis-satisfied 11
Main reasons
Good Q&Q* 81
Poor Q&Q* 18.9
Depended PDS grains
Depended 94.2
Not-Depended 5.7
Weights are Accurate
Agree 76
Dis-agree 23.5
* Quality & Quantity

International Journal of Academic Research in Public Policy and Governance Januaruy 2014, Vol. 1, No. 1
27 www.hrmars.com
Table 04: Utilisation of PDS Free Rice in coastal region
Overall Satisfaction Frequencies (pre-testing)
Better 81.9
Worst 18
Free rice is sufficient
AAY sufficient as 35kgs
92.6
Not- sufficient 8.3
20kg sufficient 42.8
Not-sufficient 57.1
A M Consumption*
20kg 17.4
20to30kg 63.9
30to40kgs 18.7
Additional rice buying
Open market 21.6
Black market 35.4
Buying rice - open market
10to20kg 20.9
20to25kg 0.6
25to30kgs Nil
Buying rice - black market
10to20kg 27.6
20to25kg 7.8
International Journal of Academic Research in Public Policy and Governance Januaruy 2014, Vol. 1, No. 1
28 www.hrmars.com
25to30kgs Nil
Spent price of rice
Open market Rs-30 26.4
Black market Rs-15 30.7
Corruption & complaints
Yes 79.5
No 21.4
Opinion 2years PDS Better
89.2
worst 10.7
* Average Monthly Consumption in families. References Ahluwalia D (1993) Public Distribution of Food in India: Coverage, Targeting and Leakages, Food Policy 8(1): 33-54. Balakrishnan A & B Ramaswami (1997) Quality of Public Distribution System: Why is Matters? 32(4) EPW Mumbai 189- 199. Dutta B & B Ramaswami (2001) Targeting and Efficiency in the Public Distribution System, Case of Andhra Pradesh and Maharashtra 36 (18) EPW Mumbai 231-2590 Indrakant S (1992, 96, 2000) PDS in Andhra Pradesh with special reference to rice, Indian Journal of Economics72 (286) 261-72 PDS- A case study of Andhra Pradesh Sponsored by UNDP under taken by CESS Hyderabad. Food Security and Public Support: A study of Andhra Pradesh, Sage publication New Delhi 246-275. Jean Dreze & Reetika K (2013) Rural Poverty and the PDS Nov 16 EPW Mumbai 55-60. Swaminathan Madhura (1996) Food Security in India: A village view of the PDS in Maharashtra, Indian J of Agri, Eco, vol.51 (4) 683-696 Mahendran A (2013)

International Journal of Academic Research in Public Policy and Governance Januaruy 2014, Vol. 1, No. 1
29 www.hrmars.com
A Study on customer satisfaction on food delivery mechanism of Universal PDS in Tamil Nadu (India) Int.J.Agri economics &extension, vol 1(8) 061-067. A Study on Impact of Universal PDS in Tamil Nadu, India. Int.J.Soc.Sci Manage. vol 1 (1) 41-50. Mihir Rakshit (2003) Some Analytics of medium and long term food policy, May 3 EPW Mumbai 174-189 Outlook Business (2009) More Holes that A Sieve: In its current form, the TPDS is a flawed system, http:// Business.outlookind.com/article.aspx?262373,31st Oct 2009. Rajagopalan S (2010) The Role of Targeted PDS and Food Stamps in promoting better access to food in Poor households M S Swaminathan Research Foundation Report, Chennai Radhakrishna R, Subba Rao K, Indrakant S and Ravi C (1997) The PDS be targeted to the very Poor- World bank Study, Washington DC Ruth Kattumuri (2011) Food Security and the Targeted PDS in India, ARC working Paper 38 LSE Surojit Deb (2009) PDS of Rice in Andhra Pradesh: Efficiency and Reform options. 44 ( 51) EPW Mumbai 70-77 Sen A (1981) ‘Poverty and Famines an Essay on Entitlements and deprivation’ Oxford University
Press, Oxford. Venugopal K R (1992) Deliverance form Hunger, the PDS in India Sage Publication New Delhi.