Embed Size (px)
Citation preview

PUBLIC DISCLOSURE
September 11, 2017
COMMUNITY REINVESTMENT ACT
PERFORMANCE EVALUATION
MountainOne Bank
Certificate Number: 90253
93 Main Street
North Adams, MA 01247
Division of Banks Federal Deposit Insurance Corporation
1000 Washington Street, 10th Floor 350 Fifth Avenue, Suite 1200
Boston, Massachusetts 02118 New York, New York 10118
This document is an evaluation of this institution’s record of meeting the credit needs of its entire
community, including low- and moderate-income neighborhoods, consistent with safe and sound
operation of the institution. This evaluation is not, nor should it be construed as, an assessment
of the financial condition of this institution. The rating assigned to this institution does not
represent an analysis, conclusion, or opinion of the Division of Banks or the Federal Deposit
Insurance Corporation concerning the safety and soundness of this financial institution.

TABLE OF CONTENTS
Institution
Institution Rating .................................................................................................................1
Scope of Evaluation .............................................................................................................2
Description of Institution .....................................................................................................4
Description of Assessment Area ..........................................................................................6
Conclusions on Performance Criteria ................................................................................10
Discriminatory or Other Illegal Credit Practices Review ..................................................21
Pittsfield, MA Metropolitan Statistical Area (full-scope review)
Description of Institution’s Operations ..............................................................................22
Conclusions on Performance Criteria ................................................................................23
Boston-Cambridge-Newton, MA-NH Metropolitan Statistical Area (full-scope review)
Description of Institution’s Operations ..............................................................................32
Conclusions on Performance Criteria ................................................................................35
Appendix
Fair Lending Policies and Procedures (Division of Banks) ...............................................49
Glossary .............................................................................................................................51

1
INSTITUTION RATING
INSTITUTION’S CRA RATING: This institution is rated Satisfactory. An institution in this
group has a satisfactory record of helping to meet the credit needs of its assessment area, including
low- and moderate-income neighborhoods, in a manner consistent with its resources and capabilities.
Examiners did not identify any evidence of discriminatory or other illegal credit practices. The
following points summarize the bank’s Lending Test and Community Development Test
performance.
The Lending Test is rated Satisfactory.
The average net loan-to-deposit (LTD) ratio is more than reasonable given the institution’s size,
financial condition, and assessment area credit needs.
The bank made a majority of home mortgage loans, small business loans and home equity lines
of credit in the assessment area.
The geographic distribution of loans reflects reasonable dispersion throughout the assessment
area, particularly to low- and moderate-income geographies.
The distribution of borrowers reflects, given the demographics of the assessment area, reasonable
penetration among individuals of different income levels (including low- and moderate-income)
and businesses of different sizes.
The institution did not receive any CRA-related complaints during the evaluation period;
therefore, this factor did not affect the rating.
The Community Development Test is rated Satisfactory.
The institution’s community development performance demonstrates reasonable responsiveness to
community development needs through community development loans, qualified investments, and
community development services. Examiners considered the institution’s capacity and the need and
availability of such opportunities throughout the assessment area.

2
SCOPE OF EVALUATION
General Information
This performance evaluation, conducted jointly by the Federal Deposit Insurance Corporation
(FDIC) and the Commonwealth of Massachusetts Division of Banks (Division), covers the
period from the prior evaluation, dated June 9, 2014, to the current evaluation dated September
11, 2017. Examiners used the Interagency Intermediate Small Institution (ISI) Examination
Procedures established by the Federal Financial Institution Examination Council (FFIEC). These
procedures include two tests: the Lending Test and the Community Development Test.
The Lending Test evaluates the bank’s performance based on the loan-to-deposit ratio,
assessment area concentration, geographic distribution, borrower profile, and response to CRA
complaints. The Community Development Test considers the number and dollar amount of
community development loans, qualified investments, and community development services, as
well as the bank’s responsiveness to the community development needs of the assessment areas.
Loan Products Reviewed
Examiners determined the bank’s major product lines are home mortgage and small business
loans. Home equity lines of credit (HELOC) were also analyzed, as the bank collects applicable
loan data and requested the review of HELOCs. Small farm loans, consumer, and other loan
types were not considered due to the low volume of originations and the small percentage of the
loan portfolio represented by these loan types.
Home mortgage lending performance received greater weight when determining the Lending
Test rating, as this product was the bank’s primary lending focus throughout the evaluation
period. Examiners emphasized performance by number over dollar volume because the number
of loans better indicates the number of individuals and businesses that the bank serves.
Examiners evaluated home mortgage lending data from January 1, 2015, through December 31,
2016, as reported on the bank’s Home Mortgage Disclosure Act (HMDA) Loan Application
Registers (LARs). The bank’s 2015 lending performance was compared with aggregate lending
data for all HMDA reporting lenders and assessment area demographics, as this is the most
current year for which aggregate data is available. The bank originated 667 home mortgage
loans totaling $208.2 million in 2015 and 663 loans totaling $211.5 million in 2016. HELOC
loans were reviewed for 2015 and 2016. The bank originated 132 HELOCs totaling $13.9
million in 2015 and 105 lines totaling $13.6 million in 2016.
Examiners also analyzed small business lending. The CRA defines small business loans as
commercial real estate loans and commercial and industrial loans with original balances of $1
million or less. The bank maintained accurate data on borrower revenues and location for small
business loans, so examiners analyzed all 2015 and 2016 small business loans for purposes of the
evaluation. The bank originated 96 small business loans totaling $28.3 million in 2015 and 79
loans totaling $25.0 million in 2016. Examiners compared the bank’s small business lending
data to 2015 and 2016 D&B demographic data.

3
The Community Development Test assessed community development loans, investments, and
services from June 9, 2014 through September 11, 2017 presented by bank management.
Assessment Areas Reviewed
In addition to assigning a rating for the bank’s overall performance in the combined assessment
areas, the CRA requires separate performance discussions for each Metropolitan Statistical Area
(MSA) where the bank maintains a deposit-taking facility. The bank maintains three branches in
the Pittsfield, MA MSA (Pittsfield MSA) and four branches in the Boston-Cambridge-Newton,
MA-NH MSA (Boston MSA). The evaluation includes separate performance discussions for
each MSA, but only assigns a rating for overall performance.
While MountainOne Bank operates in two MSAs, it has three distinct assessment areas: Western,
Eastern South Shore, and Eastern North Shore. The evaluation included a full-scope review of
each assessment area. Three branches in the Boston MSA are within the Boston, MA
Metropolitan Division (MD) and one is in the Cambridge-Newton-Framingham, MA MD.
Therefore, the bank delineated two non-contiguous assessment areas within the Boston MSA:
Eastern South Shore and Eastern North Shore. The review of both Boston MSA assessment
areas collectively contributed to performance conclusions within the Boston MSA.
Bank performance in the Pittsfield MSA and Boston MSA received similar weight when
assigning the overall rating. While the bank is headquartered and has a majority of its deposits in
the Pittsfield MSA, a slight majority of branches and loans are in the Boston MSA assessment
areas. The following table shows a breakdown of deposits, branches, and loans by assessment
area.
Assessment Area Breakdown of Deposits, Branches, and Loans
Assessment Area Deposits Branches HMDA Loans SB Loans HELOCs
$(000s) % # % # % # % # %
Western 391,630 60.7 3 42.9 276 38.9 46 40.4 98 53.8
Eastern South Shore 227,471 35.2 3 42.9 178 25.1 64 56.1 43 23.6
Eastern North Shore 26,612 4.1 1 14.2 255 36.0 4 3.5 41 22.5
Total 645,713 100.0 7 100.0 709 100.0 114 100.0 182 100.0
Source: FDIC Summary of Deposits (6/30/17); 2015 and 2016 HMDA LARs; 2016 and 2016 Bank Records.

4
DESCRIPTION OF INSTITUTION
Background
Founded in 1848, MountainOne Bank is a Massachusetts state-chartered mutual savings bank
and a wholly owned subsidiary of MountainOne Financial, Inc., which is a wholly owned
subsidiary of MountainOne Financial, MHC. MountainOne Capital Trust I and II are Delaware
statutory trusts administered by MountainOne Financial, MHC for the purpose of holding trust
preferred securities.
The bank has three subsidiaries:
NAHSB Security Corp. for investments purposes.
RSB Properties, LLC for the purpose of holding bank-owned real estate.
MountainOne Insurance, Inc. provides personal and business insurance, bonding services
and group benefits solutions.
The bank’s CRA performance was last evaluated by the Division and the FDIC on June 9, 2014,
and was rated Satisfactory.
Operations
The bank’s main office is located in a middle-income census tract at 93 Main Street in North
Adams. In addition to the main office, the bank operates six full-service branches located in
Danvers, Pittsfield, Quincy, Rockland, Scituate and Williamstown. The Danvers branch opened
in December 2014. None of the branches are located in low-income census tracts. The
Rockland branch is located in a moderate-income census tract, four branches are located in
middle-income census tracts, and two are located in upper-income census tracts.
The bank is a full-service financial institution that offers a wide variety of products and services.
The bank offers residential mortgage loans, including state and federal programs, first-time
homebuyer mortgages, home equity lines of credit, and home equity loans. MountainOne Bank
also offers secured and unsecured consumer loans. In addition, the bank offers commercial and
small business loans for asset purchase term financing, lines of credit, Small Business
Administration (SBA) loans, and letters of credit.
Deposit products and services include personal and business checking and savings accounts,
certificates of deposit, money market accounts, and IRAs. Other services include personal and
business online banking for account inquiries, bill pay, internal transfers, mobile banking, mobile
deposits and e-Statements. MountainOne Investments provides investment advisory services and
products to individuals and businesses.
Ability and Capacity
As of June 30, 2017, the bank had total assets of $873.9 million and total deposits of $645.7
million. Loans totaled $709.3 million and represented 81.2 percent of total assets.
The bank is primarily a residential lender with approximately half of the loan portfolio secured
by residential properties. As noted in the following table, 46.9 percent of loans are one-to-four
family properties followed by commercial real estate loans at 27.1 percent.

5
Loan Portfolio Distribution
Loan Category $(000s) %
Construction and Land Development 71,824 10.1
Secured by 1-4 Family Residential 332,615 46.9
Secured by Multi-family (5 or more) Residential 25,820 3.6
Secured by Nonfarm Nonresidential 192,460 27.1
Total Real Estate Loans 622,719 87.7
Commercial and Industrial 85,257 12.0
Consumer 1,103 0.2
Loans to Nondepository Financial Institutions 250 0.1
Total Loans 709,329 100.0
Source: Call report dated June 30, 2017
Examiners did not identify any financial, legal, or other impediments that affect the bank’s
ability to meet assessment area credit needs.

6
DESCRIPTION OF ASSESSMENT AREA
The CRA requires each financial institution to designate one or more assessment areas within which
it will focus its lending efforts and examiners will evaluate its CRA performance. MountainOne
Bank’s (MOB) combined assessment area comprises three individual assessment areas
encompassing five counties throughout Massachusetts and Vermont. Each assessment area
complies with CRA technical requirements and is described below:
Western – a contiguous area consisting of nine communities from Berkshire County,
Massachusetts and eight communities from Bennington County, Vermont. Although MOB
does not have a deposit-taking facility in Bennington County, this assessment area included
portions of Bennington County that do not extend substantially beyond the Pittsfield MSA.
The Western assessment area consists of many rural communities in the northwest corner of
Massachusetts and southeast corner of Vermont.
Eastern South Shore – a contiguous area consisting of 5 communities from Norfolk County
and 17 communities from Plymouth County Massachusetts, which are in the Boston MSA.
The Eastern South Shore assessment area contains Boston suburban communities.
Eastern North Shore – a contiguous area consisting of 18 communities from Essex County
Massachusetts, which is in the Boston MSA. The Eastern North Shore assessment area also
contains Boston suburban communities.
The assessment areas reflect expansions since the prior CRA evaluation. MOB opened a branch in
Danvers, Massachusetts in December 2014, which prompted the addition of the Eastern North Shore
assessment area. Additionally, the bank included the Town of Milton in its Eastern South Shore
assessment area in June 2016, adding five upper-income census tracts. Demographic information
below reflects the current combined assessment area, which includes the Town of Milton. No
significant changes to assessment area demographics occurred by adding Milton.
Demographic Data
Based on 2010 United States (U.S.) Census data, MOB’s combined assessment area consists of 193
census tracts with the following income designations: 5 low-income, 25 moderate-income, 114
middle-income, and 49 upper-income. None of the assessment areas has more than two low-income
tracts. The Eastern North assessment area contains over half of the combined area’s moderate-
income tracts. MSA-specific performance sections provide additional information on low- and
moderate income geographies, as performance context for these tracts varies in each assessment
area.
The following table presents demographic data for the combined assessment area.
7
Demographic Information of the Assessment Area
Demographic Characteristics # Low
% of #
Moderate
% of #
Middle
% of #
Upper
% of #
NA*
% of #
Geographies (Census Tracts) 193 2.6 13.0 59.1 25.4 0.0
Population by Geography 909,731 1.9 11.8 59.2 27.2 0.0
Housing Units by Geography 391,862 2.2 12.9 59.6 25.3 0.0
Owner-Occupied Units by
Geography
253,953 0.8 8.8 60.8 29.6 0.0
Occupied Rental Units by
Geography
104,125 5.5 22.9 56.4 15.3 0.0
Vacant Units by Geography 33,784 2.6 12.3 60.4 24.7 0.0
Businesses by Geography 66,679 2.8 11.7 55.9 29.6 0.0
Family Distribution by Income Level 231,137 18.4 17.1 22.3 42.3 0.0
Household Distribution by Income
Level
358,078 23.3 14.6 18.0 44.1 0.0
Median Family Income MSA –
14454 Boston, MA MD
$83,664 Median Housing Value $371,017
Median Family Income MSA - 15764
Cambridge-Newton-Framingham, MA MD
$90,625 Median Gross Rent $1,028
Median Family Income MSA -
38340 Pittsfield, MA MSA
$64,783 Families Below Poverty Level 5.1%
Median Family Income Non-MSA – VT $60,519
Source: 2010 U.S. Census; 2016 D&B Data (*) The NA category consists of geographies that have not been assigned an income classification.
There are 391,862 housing units. Of these, 64.8 percent are owner-occupied, 26.6 percent are
occupied rental units, and 8.6 percent are vacant. The geographic distribution criterion compares
home mortgage loans to the distribution of owner-occupied housing units. The percentage of
owner-occupied units in low- and moderate-income geographies is less than the percentage of
overall housing units in these tracts, which may reduce opportunities to make home mortgage
loans in these geographies.
According to 2016 D&B data, there were 66,679 businesses in the combined assessment area.
The analysis of small business loans under the borrower profile criterion compares the
distribution of businesses by gross annual revenue (GAR) level. GARs for these businesses are
as follows:
84.3 percent have $1 million or less,
6.3 percent have more than $1 million, and
9.5 percent have unknown revenues.
Service industries represent the largest portion of assessment area businesses at 47.8 percent;
followed by retail trade at 13.7 percent; construction at 9.6 percent; finance, insurance and real
estate at 8.5 percent; and non-classifiable establishments at 6.3 percent. Additionally, 72.6

8
percent of combined assessment area businesses have four or fewer employees, and 89.0 percent
operate from a single business location.
The FFIEC-updated median family income level is used to analyze home mortgage loans under
the borrower profile criterion. The following table defines low-, moderate-, middle- and upper-
income categories for each MSA, MD, or statewide nonmetropolitan area in the assessment area.
Median Family Income Ranges
Median Family Incomes Low
<50%
Moderate
50% to <80%
Middle
80% to <120%
Upper
≥120%
Boston, MA MD Median Family Income (14454)
2015 ($90,000) <$45,000 $45,000 to <$72,000 $72,000 to <$108,000 ≥$108,000
2016 ($90,800) <$45,400 $45,400 to <$72,640 $72,640 to <$108,960 ≥$108,960
Cambridge-Newton-Framingham, MA MD Median Family Income (15764)
2015 ($101,700) <$50,850 $50,850 to <$81,360 $81,360 to <$122,040 ≥$122,040
2016 ($98,600) <$49,300 $49,300 to <$78,880 $78,880 to <$118,320 ≥$118,320
Pittsfield, MA MSA Median Family Income (38340)
2015 ($67,700) <$33,850 $33,850 to <$54,160 $54,160 to <$81,240 ≥$81,240
2016 ($68,400) <$34,200 $34,200 to <$54,720 $54,720 to <$82,080 ≥$82,080
Vermont Nonmetropolitan Median Family Income (99999)
2015 ($64,700) <$32,350 $32,350 to <$51,760 $51,760 to <$77,640 ≥$77,640
2016 ($64,400) <$32,200 $32,200 to <$51,520 $51,520 to <$77,280 ≥$77,280
Source: FFIEC
Economic Data
In general, the Eastern South Shore and Eastern North Shore assessment areas have stronger
economic conditions than the Western assessment area. The eastern assessment areas benefit
from their proximity to Boston. Refer to comments in the individual assessment area sections of
this PE for economic data details.
Competition
MOB operates in a highly competitive market for financial services, particularly within the
Boston MSA. According to the June 30, 2016 Deposit Market Share Report, the bank’s
combined assessment area had 84 financial institutions that operated 718 full-service branches
within the combined assessment area. MOB ranked 20th with a 1.0 percent market share.
There is a high level of competition for home mortgage loans among banks, credit unions, and
non-depository mortgage lenders. In 2015, 535 lenders originated or purchased 46,849 HMDA-
reportable loans. MOB ranked 28th out of this group of lenders, with a market share of 1.0
percent. The three most prominent home mortgage lenders accounted for 14.5 percent of total
market share. Aggregate data for 2015 shows that 148 institutions reported 43,840 small
business loans in the combined assessment area; this indicates a high degree of competition for
this product. The three most prominent small business lenders accounted for 45.7 percent of the
total market share.

9
Community Contacts
As part of the evaluation process, examiners contact third parties active in the assessment area to
help assess credit and community development needs. The information obtained helps to
determine whether local financial institutions are responsive to these community needs and to
determine what credit and community development opportunities, if any, are available. Please
refer to sections discussing bank operations and performance in the Pittsfield MSA and Boston
MSA for a summary of community contacts.
Credit and Community Development Needs and Opportunities
Considering information from community contacts, bank management, and demographic and
economic data, examiners determined that the combined assessment area has similar credit needs
as most metropolitan areas. Small business loans, particularly those that do not include
traditional underwriting standards, are in high demand. Boston MSA assessment areas have high
home prices, reflecting the need for loans requiring low down payments in order to assist
potential low- and moderate-income homebuyers.
Opportunity exists to provide lending and financial education throughout the combined
assessment area. The significant percentage of businesses with GARs of $1 million or less and
the large number of businesses (74.4 percent) with four or fewer employees support this
conclusion. Furthermore, as indicated by demographic and economic data, the combined
assessment area has community development needs. Affordable housing represents the primary
need in the Boston MSA assessment areas, while economic development and community
services to low- and moderate-income borrowers represent primary needs in the Pittsfield MSA.

10
CONCLUSIONS ON PERFORMANCE CRITERIA
LENDING TEST
MountainOne Bank demonstrated reasonable performance under the Lending Test. Geographic
distribution and borrower profile performance primarily support this conclusion.
Loan-to-Deposit Ratio
The average net LTD ratio is more than reasonable given the bank’s size, financial condition,
and assessment area credit needs. The bank’s net LTD ratio, calculated from Call Report data,
averaged 108.7 over the past 13 calendar quarters from June 30, 2014, to June 30, 2017. The
ratio ranged from a low of 103.7 percent as of March 31, 2017, to a high of 113.9 percent as of
March 31, 2015. The ratio remained generally stable during the evaluation period. MOB
maintained a similar ratio to those of comparable institutions, as shown in the following table.
Examiners selected comparable institutions based on their asset size and lending focus.
Loan-to-Deposit Ratio Comparison
Institution Total Assets as of 6/30/2017
$ (000s)
Average Net LTD
Ratio (%)
MountainOne Bank 873,879 108.7
North Shore Bank 818,775 96.8
Newburyport Five Cents Savings Bank 778,150 115.9
Source: Reports of Income and Condition 6/30/2014 through 6/30/2017
Assessment Area Concentration
The bank made a majority of home mortgage loans, small business loans, and HELOCs by
number within its combined assessment area. Overall, the bank originated 57.7 percent of loans
by number and 47.7 percent by dollar volume in its combined assessment area.

11
Lending Inside and Outside of the Assessment Area
Number of Loans Dollar Amount of Loans $(000s)
Loan Category Inside Outside Total Inside Outside Total
# % # % # $ % $ % $(000s)
Home Mortgage
2015 330 49.5 337 50.5 667 84,892 40.8 123,338 59.2 208,230
2016 379 57.2 284 42.8 663 103,689 49.0 107,823 51.0 211,512
Subtotal 709 53.3 621 46.7 1,330 188,581 44.9 231,161 55.1 419,742
Small Business
2015 60 63.5 36 37.5 96 14,324 50.7 13,940 49.3 28,264
2016 54 68.4 25 31.6 79 15,103 60.3 9,942 39.7 25,045
Subtotal 114 65.1 61 34.9 175 29,427 55.2 23,882 44.8 53,309
HELOC
2015 98 74.2 34 25.8 132 10,044 72.2 3,864 27.8 13,908
2016 84 80.0 21 20.0 105 10,614 78.0 2,996 22.0 13,610
Subtotal 182 76.8 55 23.2 237 20,658 75.1 6,860 24.9 27,518
Total 1,005 57.7 737 42.3 1,742 238,666 47.7 261,903 52.3 500,569
Source: Evaluation Period: 1/1/2015 - 12/31/2016
Geographic Distribution
The geographic distribution of loans reflects reasonable dispersion throughout the combined
assessment area. Despite poor small business loan and HELOC dispersion, home mortgage lending
performance received the most weight in determining this conclusion. Examiners focused on the
percentage by number of loans in low- and moderate-income census tracts.
Home Mortgage Loans
The geographic distribution of loans reflects reasonable dispersion throughout the combined
assessment area. Examiners focused on comparisons to aggregate data for 2015 and the
percentage of owner-occupied housing units for 2015 and 2016. The bank’s 2015 performance
in low-income census tracts at 0.6 percent compares reasonably to the aggregate level at 0.9
percent. Its percentage increased slightly in 2016 and was slightly above the percentage of
owner-occupied housing units. These comparisons reflect reasonable performance.
The bank’s 2015 performance in moderate-income census tracts was slightly below the aggregate
level and owner-occupied housing units. In 2016, the bank’s loan percentage in moderate-
income tracts slightly exceeded the percentage of owner-occupied units. Again, these
comparisons reflect reasonable performance.
Market share data reflects the competitive environment in which the bank operates. Based on
MOB’s lending performance and competition, the bank’s performance is reasonable. The
following table shows bank lending by geography income level.

12
Geographic Distribution of Home Mortgage Loans
Assessment Area: Combined
Tract Income Level
% of Owner-
Occupied
Housing Units
Aggregate
Performance
% of #
# % $(000s) %
Low
2015 0.9 0.9 2 0.6 331 0.4
2016 0.8 -- 4 1.1 1,070 1.0
Moderate
2015 9.1 9.5 24 7.3 4,694 5.5
2016 8.8 -- 38 10.0 8,361 8.1
Middle
2015 62.7 60.4 169 51.2 38,810 45.7
2016 60.8 -- 195 51.5 49,538 47.8
Upper
2015 27.4 29.2 135 40.9 41,057 48.4
2016 29.6 -- 142 37.5 44,720 43.1
Totals
2015 100.0 100.0 330 100.0 84,892 100.0
2016 100.0 -- 379 100.0 103,689 100.0
Source: 2010 U.S. Census; 1/1/2015 - 12/31/2016 Bank Data, 2015 HMDA Aggregate Data, "--" data not available.
Small Business Loans
The geographic distribution of small business loans reflects poor dispersion. The bank’s 2015
and 2016 performance in low-income census tracts compares reasonably to the percentage of
businesses. In moderate-income tracts, however, the bank’s percentage of loans in 2015 was
below the percentage of businesses. The bank’s 2016 performance in moderate-income tracts
decreased to 1.8 percent, falling well below the percentage of businesses in these tracts. The
following table shows small business lending by tract income level.

13
Geographic Distribution of Small Business Loans
Assessment Area: Combined
Tract Income Level % of Businesses # % $(000s) %
Low
2015 2.8 1 1.7 212 1.5
2016 2.8 1 1.8 960 6.3
Moderate
2015 11.8 4 6.7 194 1.4
2016 11.7 1 1.8 760 5.0
Middle
2015 57.3 38 62.3 10,431 72.8
2016 55.9 36 65.5 8,887 58.3
Upper
2015 28.1 17 28.3 3,487 24.3
2016 29.6 17 30.9 4,646 30.5
Totals
2015 100.0 60 100.0 14,324 100.0
2016 100.0 54 100.0 15,253 100.0
Source: 2015 and 2016 D&B Data; 1/1/2015 - 12/31/2016 Bank Data;
Home Equity Loans
The geographic distribution of HELOCs reflects poor dispersion throughout the combined
assessment area. The bank’s 2015 performance in low-income census tracts at 2.0 percent
compares reasonably to the percentage of households at 2.2 percent. The bank did not originate any
HELOCs in low-income census tracts in 2016. The bank’s 2015 and 2016 performances in
moderate-income census tracts do not compare reasonably to the percentage of households. The
following table details HELOCs by geography income level.

14
Geographic Distribution of Home Equity Lines of Credit
Assessment Area: Combined
Tract Income Level % of
Households # % $(000s) %
Low
2015 2.2 2 2.0 35 0.3
2016 2.2 0 0.0 0 0.0
Moderate
2015 13.3 5 5.1 310 3.1
2016 12.9 4 4.8 188 1.8
Middle
2015 61.1 46 46.9 3,616 36.0
2016 59.5 44 52.4 4,563 43.0
Upper
2015 23.4 45 45.9 6,083 60.6
2016 25.4 36 42.9 5,863 55.2
Totals
2015 100.0 98 100.0 10,044 100.0
2016 100.0 84 100.0 10,614 100.0
Source: 2010 U.S. Census; 1/1/2015 - 12/31/2016 Bank Data.
Borrower Profile
The distribution of borrowers reflects reasonable penetration among individuals of different
income levels and businesses of different sizes. Examiners focused on the percentage by number
of home mortgage loans and HELOCs to low- and moderate-income borrowers and small
business loans to businesses with GARs of $1 million or less.
Home Mortgage Loans
The distribution of home mortgage loans to individuals of different income levels, including low-
and moderate-income, is reasonable. Examiners focused on the comparison to 2015 aggregate
data and the percentage of families. The bank’s 2015 performance for low-income borrowers
was similar to aggregate data, and its 2016 performance remained consistent.
The bank’s 2015 performance for moderate-income borrowers at 19.4 percent exceeds aggregate
data at 16.4 percent. The bank’s 2016 performance for moderate-income borrowers at 16.1
percent compares reasonably to the percentage of families at 17.1 percent. These comparisons
reflect reasonable performance. Market share data reflects the competitive environment in which
the bank operates. Based on MOB’s lending performance and competition, the bank’s
performance is reasonable. The following table shows home mortgage lending by borrower
income level.

15
Distribution of Home Mortgage Loans by Borrower Income Level
Assessment Area: Combined
Borrower Income Level % of Families
Aggregate
Performance
% of #
# % $(000s) %
Low
2015 18.6 4.4 17 5.2 1,692 2.0
2016 18.4 -- 23 6.1 2,263 2.2
Moderate
2015 17.3 16.4 64 19.4 11,916 14.0
2016 17.1 -- 61 16.1 11,885 11.5
Middle
2015 22.4 23.1 84 25.5 20,179 23.8
2016 22.3 -- 90 23.7 22,280 21.5
Upper
2015 41.7 37.1 153 46.4 46,931 55.3
2016 42.3 -- 187 49.3 58,038 56.0
Not Available
2015 0.0 19.0 12 3.6 4,174 4.9
2016 0.0 -- 18 4.7 9,223 8.9
Totals
2015 100.0 100.0 330 100.0 84,892 100.0
2016 100.0 -- 379 100.0 103,689 100.0
Source: 2010 U.S. Census; 1/1/2015 - 12/31/2016 Bank Data, 2015 HMDA Aggregate Data, "--" data not available.
Small Business Loans
The distribution of loans reflects reasonable penetration to businesses with GARs of $1 million
or less. In 2015, 48.3 percent of loans were originated to businesses with GARs of $1 million or
less. This number compares reasonably to aggregate lending data of 48.7 percent. The bank’s
performance in 2016 increased to 58.2, but remained below the percentage of businesses. D&B
data indicates small business credit opportunities; however, not all businesses are creditworthy or
have credit needs. Aggregate lending data, although not used as a benchmark for small bank
lending performance, indicates business credit demand, local competition, and lending
opportunities within the combined assessment area. The following table details lending by
revenue category.

16
Distribution of Small Business Loans by Gross Annual Revenue Category
Assessment Area: Combined
Gross Revenue Level % of Businesses # % $(000s) %
<=$1,000,000
2015 77.6 29 48.3 6,047 42.2
2016 84.3 32 58.2 9,477 62.1
>1,000,000
2015 5.5 31 51.7 8,277 57.8
2016 6.3 22 40.0 5,176 33.9
Revenue Not Available
2015 16.9 0 0.0 0 0.0
2016 9.5 1 1.8 600 3.9
Totals
2015 100.0 60 100.0 14,324 100.0
2016 100.0 54 100.0 15,253 100.0
Source: 2015 and 2016 D&B Data; 1/1/2015 - 12/31/2016 Bank Data; 2015 CRA Aggregate Data; "--" data not available.
Home Equity Loans
The distribution of HELOCs to individuals of different income levels, including low- and
moderate-income borrowers, is reasonable. The bank’s 2015 performance for low-income
borrowers was below the percentage of households, but the percentage of 2016 HELOCs to low-
income borrowers increased to 11.9 percent. The bank’s 2015 performance for moderate-income
borrowers compares reasonably to the percentage of households, and 2016 performance for
moderate-income borrowers increased to 15.5 percent. Refer to the following table for details.

17
Distribution of Home Equity Lines of Credit by Borrower Income Level
Assessment Area: Combined
Borrower Income Level % of
Households # % $(000s) %
Low
2015 23.5 8 8.2 611 6.1
2016 23.3 10 11.9 701 6.6
Moderate
2015 14.8 13 13.3 732 7.3
2016 14.6 13 15.5 1,092 10.3
Middle
2015 18.1 21 21.4 1,104 11.0
2016 18.0 16 19.0 1,934 18.2
Upper
2015 43.6 55 56.1 7,481 74.5
2016 44.1 44 52.4 6,837 64.4
Not Available
2015 0.0 1 1.0 116 1.2
2016 0.0 1 1.2 50 0.5
Totals
2015 100.0 98 100.0 10,044 100.0
2016 100.0 84 100.0 10,614 100.0
Source: 2010 U.S. Census; 1/1/2015 - 12/31/2016 Bank Data.
Response to Complaints
MOB has not received any CRA-related complaints since the previous CRA Evaluation;
therefore, this criterion did not affect the Lending Test rating.

18
COMMUNITY DEVELOPMENT TEST
MOB demonstrates reasonable responsiveness to the community development needs of its
assessment areas through community development loans, qualified investments, and community
development services. Examiners considered the institution’s capacity and the need and
availability of such opportunities.
Community Development Loans
The bank originated 16 community development loans totaling $21.5 million. This level of
activity represents 2.5 percent of total assets and 3.1 percent of net loans as of June 30, 2017.
The bank more than doubled the dollar volume of community development loans during the prior
evaluation period. The vast majority of loans by dollar amount supported revitalization and
stabilization in low- or moderate-income census tracts. The following table illustrates the bank’s
community development lending activity by year and purpose.
Community Development Loans – Combined Assessment Area
Activity Year
Affordable
Housing
Community
Services
Economic
Development
Revitalize or
Stabilize Totals
# $(000s) # $(000s) # $(000s) # $(000s) # $(000s)
*2014 0 0 0 0 7 1,411 0 0 7 1,411
2015 0 0 0 0 1 4 5 10,478 6 10,482
2016 1 300 0 0 0 0 2 9,300 3 9,600
**2017 0 0 0 0 0 0 0 0 0 0
Total 1 300 0 0 8 1,415 7 19,778 16 21,493
Source: Bank Records - *From June 9, 2014 through December 31, 2014. **January 1, 2017 through September 11, 2017.
Performance discussions for the Pittsfield MSA and Boston MSA indicate notable examples of
MOB’s community development loans. By number, the bank made a significant majority of
community development loans in the Pittsfield MSA; however, almost half of community
development loans by dollar amount benefitted the Boston MSA.
Qualified Investments
MountainOne Bank made 180 qualified investments totaling approximately $2.3 million. This
total includes three qualified equity investments of approximately $1.9 million and donations of
$413,799. The bank maintained two equity investments from the previous evaluation period
with a book value of $104,750. MOB also made one new investment totaling $1.7 million.
Qualified equity investments increased since the prior evaluation and represent 0.3 percent of
average total assets and 2.3 percent of securities.

19
Berkshire Fund, Inc. Good Samaritan Homeownership Program
The bank renewed the Mortgage and Collateral Trust Series E, No. E-3 Bonds in the amount of
$47,000 for the Good Samaritan Homeownership Program during the evaluation period. The
Good Samaritan Homeownership Program is a non-profit venture helping low- and moderate-
income families, who meet bank and program guidelines, purchase their first homes. Families
also receive financial education and counseling. The investment benefitted the Western
assessment area.
Berkshire Housing Development Corporation (BHDC)
The bank renewed Mortgage and Collateral Trust Series A and B Bonds for a total of $57,750.
The bonds support affordable housing development in the Western assessment area.
Federal National Mortgage Association (FNMA) Mortgage-Backed Securities
In 2016, the bank purchased a mortgage-backed security with a qualifying amount totaling $1.7
million. Underlying loans were made to low- and moderate-income borrowers in the Eastern
South Shore and Eastern North Shore assessment areas.
Qualified Donations
During the examination period, the bank donated $623,270 to charitable organizations, of which
177 contributions totaling $413,799, or 66.4 percent, were qualified CRA contributions. During
the last examination, the bank made 95 qualifying contributions totaling $250,118. These funds
primarily support organizations that provide affordable housing and community services to low-
and moderate-income individuals and families.
The table below details all qualified donations made by the bank by year and community
development category.
Qualified Grants and Donations Activity By Year – Combined Assessment Area
Activity Year
Qualifying Category
Totals Affordable
Housing
Community
Services
Economic
Development
Revitalizatio
n or
Stabilization
Neighborhood
Stabilization
Projects
# $ # $ # $ # $ # $ # $
Qualified
Investments 3 1,848,673 0 0 0 0 0 0 0 0 3 1,848,673
*2014 2 6,500 33 76,711 1 5,000 0 0 0 0 36 88,211
2015 8 11,750 35 73,921 1 1,000 0 0 0 0 44 86,671
2016 12 21,000 54 130,167 2 8,000 0 0 0 0 68 159,167
**2017 3 3,500 25 75,250 1 1,000 0 0 0 0 29 79,750
Total
Donations 25 42,750 147 356,049 5 15,000 0 0 0 0 177 413,799
Grand Total 28 1,891,423 147 356,049 5 15,000 0 0 0 0 180 2,262,472
Source: Bank Records - *From June 9, 2014 through December 31, 2014. **From January 1, 2017 through September 11, 2017.
Performance discussions for the Pittsfield MSA and Boston MSA provide examples of notable
donations supporting community development.

20
Community Development Services
MountainOne Bank provides community development services in the form of employee
involvement, educational seminars, and other services. During the evaluation period, 41 bank
employees provided 162 instances of financial expertise or technical assistance to 35 community
development organizations within the combined assessment area for the purpose of community
development. The following table illustrates the bank’s community development services by
year and purpose.
Community Development Services – Combined Assessment Area
Activity Year
Affordable
Housing
Community
Services
Economic
Development
Revitalize
or Stabilize
Neighborhood
Stabilization Totals
# # # # # #
*2014
5 35 3 0 0 43
2015 5 29 2 0 0 36
2016 9 29 6 0 0 44
**2017 5 31 3 0 0 39
Total 24 124 14 0 0 162
Source: Bank Records - *From June 9, 2014 through December 31, 2014. **From January 1, 2017 through September 11, 2017.
Performance discussions for the Pittsfield MSA and Boston MSA provide examples of notable
community development services.
Other Services
The bank is a member of the Federal Home Loan Bank and has been approved for the Equity
Builder Program (EBP). The EBP provides the bank with grants to assist borrowers earning no
more than 80 percent of the area median income with down payment, closing-cost, home-buyer
counseling, and rehabilitation assistance on units that borrowers will occupy as their primary
residence. To be eligible to receive assistance through the EBP, borrowers must complete a
homebuyer counseling program administered by an approved agency.
The bank participates in the Interest on Lawyers’ Trust Accounts (IOLTA). Lawyers place large
client deposits, such as escrow accounts, in interest bearing accounts, with the interest to be paid
to the client. Deposits that would individually be too small or to short-term to generate interest
are pooled into IOLTA accounts. Interest earned on the account is utilized to help fund
improvements in the administration of justice and delivery of legal services to low-income
clients.
The bank participates in the Massachusetts Community and Banking Council’s (MCBC) Basic
Banking in Massachusetts program. This statewide program is designed to offer low cost
checking and savings accounts to low- and moderate-income individuals.
The bank offers its branch locations to several CRA-qualified organizations for meetings, event
planning and drop off centers for food, clothing, and holiday gifts. Organizations include

21
Goodwill, Childcare of the Berkshires, Veterans Sock Drive, Viv’s Give, The Berkshire
Community Action Council and the Community Access to the Arts.
Bank branches are accessible to low- and moderate-income individuals, and the bank’s Rockland
branch is located in a moderate-income census tract. Branch hours are convenient and
comparable to other institutions, and bank services are more than sufficient to meet the needs of
the assessment area. All branches have drive-up teller services. The bank has two remote
ATMs: one at 1340 Curran Highway in North Adams, a deposit taking ATM located in a
moderate-income census tract; and the other ATM is located on campus at Williams College in
Williamstown, a cash dispensing ATM. Of the bank’s 14 ATMs, 11 are deposit taking.
DISCRIMINATORY OR OTHER ILLEGAL CREDIT PRACTICES REVIEW
Examiners did not identify any evidence of discriminatory or other illegal credit practices;
therefore, this consideration did not affect the institution’s overall CRA rating.

22
Pittsfield, MA MSA (Full-Scope Review)
DESCRIPTION OF BANK OPERATIONS IN Pittsfield, MA MSA
Examiners performed a full-scope review of the bank’s performance in the Pittsfield MSA,
which contains the Western assessment area. In addition to the main office located in a middle-
income census tract in North Adams, the bank operates two full-service branches in the Western
assessment area: Pittsfield (middle-income tract) and Williamstown (upper-income tract).
The Western assessment area includes 19 municipalities within Berkshire County and 8
municipalities in Bennington County, Vermont (a non-MSA area). Although the Western
assessment area contains just under half of MOB’s branches and an even smaller portion of the
combined assessment area’s census tracts, it holds 60.7 percent of bank deposits and a fair
portion of home mortgage and small business loans, and over half of MOB’s HELOCs. The
following sections discuss performance context for the Western assessment area.
Demographic Data
The Western assessment area includes 36 census tracts with the following income designations:
1 low-income, 6 moderate-income, 22 middle-income, and 7 upper-income. Pittsfield, MA
contains the low-income tract and two moderate-income tracts. Low- and moderate-income
census tracts account for 8.3 percent and 13.9 percent, respectively, of total census tracts in the
Western assessment area. The following table shows demographic information for this area.
Demographic Information of the Assessment Area
Assessment Area: Western
Demographic Characteristics # Low
% of #
Moderate
% of #
Middle
% of #
Upper
% of #
NA*
% of #
Geographies (Census Tracts) 36 8.3 13.9 58.3 19.4 0.0
Population by Geography 125,091 8.7 15.7 55.7 19.9 0.0
Housing Units by Geography 62,184 9.9 15.5 55.0 19.6 0.0
Owner-Occupied Units by Geography 35,715 3.3 13.3 62.0 21.5 0.0
Occupied Rental Units by Geography 17,591 23.6 22.8 42.1 11.4 0.0
Vacant Units by Geography 8,878 9.1 9.7 52.8 28.4 0.0
Businesses by Geography 8,400 9.2 17.3 50.9 22.7 0.0
Family Distribution by Income Level 31,902 23.9 17.9 20.9 37.2 0.0
Household Distribution by Income
Level
53,306 27.0 15.9 17.4 39.7 0.0
Median Family Income - Pittsfield MSA $66,604 Median Housing Value $193,649
Median Family Income - VT Non-MSA $64,849 Median Gross Rent $765
Families Below Poverty Level 11.1%
Source: 2015 ACS U.S. Census and 2016 D&B Data (*) The NA category consists of geographies that have not been assigned an income classification.

23
According to 2016 D&B data, 81.5 percent of area businesses had GARs of $1 million or less.
Economic Data
According to Moody’s Analytics, the Pittsfield MSA economy faces several challenges.
Unemployment has increased above the national average to 4.1 percent as of May 2017, partly
due to a rising labor force. In addition, home sales are flat, house prices are rising more slowly
than state and U.S. averages, and the population shows decreasing trends. The area relies on
summer tourism to offset weak demographics that limit gains in consumer industries and
housing. Furthermore, a large retiree population, high energy and labor costs, and difficulties
retaining skilled labor limit economic growth.
Nonetheless, the Pittsfield MSA has several economic strengths according to Moody’s. These
include below-average employment volatility, stability from an outsized healthcare industry, and
above-average housing affordability. The three largest employers are B. Mango and Bird
(consumer goods), Berkshire Healthcare Systems, and BMC Hillcrest Campus. The largest
employment sector is education and health services at 25.9 percent, followed by government at
13.7 percent, and retail trade and leisure and hospitality services at 13.6 percent.
Community Contact
Examiners contacted a representative of a non-profit organization that helps the low-income,
elderly, and working-poor of Berkshire County achieve sustainability and self-sufficiency. The
contact noted a steady migration out of the Berkshires in recent years due to a lack of
opportunity for skilled work and career growth. The immigrant population is rising due to
demand for unskilled laborers and hospitality workers.
The contact stated that financial institutions could assist low-income individuals with credit
counseling and independence from high-cost consumer credit. The contact suggested that banks
provide in-bank event space for free income tax preparation services. Institutions could use this
opportunity to provide financial education and discuss the importance of saving. One financial
institution partnered with the contact for their C.A.R.S program, which offers low interest rate
automobile loans to qualified low-income individuals needing suitable transportation.
CONCLUSIONS ON PERFORMANCE CRITERIA IN Pittsfield, MA MSA
LENDING TEST
The bank demonstrated reasonable Lending Test performance in the Western assessment area. The
following sections discuss the distribution of loans by geography and borrower income levels.
Geographic Distribution
The geographic distribution of loans reflects reasonable dispersion throughout the Western
assessment area. Despite poor performance for small business loans and HELOCs, the bank’s
reasonable home mortgage lending performance received the most weight in determining this
conclusion. Examiners focused on the percentage by number of loans in low- and moderate-
income census tracts.

24
Home Mortgage Loans
The geographic distribution of home mortgage loans reflects reasonable dispersion throughout
the Western assessment area. With less than one percent of aggregate lending and total owner-
occupied units in the low-income tract in Pittsfield, the conclusion was based on lending
performance in the area’s moderate-income tracts. The low-income tract had only 15 HMDA
loans from 12 lenders in 2015.
The bank’s 2015 performance in moderate-income census tracts at 8.5 percent compares
reasonably to the aggregate level at 10.4 percent. The percentage of loans in moderate-income
tracts increased in 2016 to 10.4 percent, just below the percentage of owner-occupied units. The
following table shows bank lending by geography income level.
Geographic Distribution of Home Mortgage Loans
Assessment Area: Western
Tract Income Level
% of Owner-
Occupied
Housing Units
Aggregate
Performance
% of #
# % $(000s) %
Low
2015 0.7 0.6 0 0.0 0 0.0
2016 0.7 -- 0 0.0 0 0.0
Moderate
2015 11.6 10.4 12 8.5 1,201 5.0
2016 11.6 -- 14 10.4 1,559 6.7
Middle
2015 64.7 63.2 63 44.7 8,548 35.5
2016 64.7 -- 66 48.9 9,683 41.9
Upper
2015 23.1 25.8 66 46.8 14,310 59.5
2016 23.1 -- 55 40.7 11,872 51.4
Totals
2015 100.0 100.0 141 100.0 24,059 100.0
2016 100.0 -- 135 100.0 23,114 100.0
Source: 2010 U.S. Census; 1/1/2015 - 12/31/2016 Bank Data, 2015 HMDA Aggregate Data, "--" data not available.
Small Business Loans
The geographic distribution of small business loans reflects poor dispersion in the Western
assessment area. The bank’s 2015 performance in low-income census tracts at 3.3 percent is
below D&B data at 8.8 percent. The bank did not originate any loans in low-income census
tracts in 2016. The bank’s 2015 performance in moderate-income census tracts was slightly
below the percentage of businesses. The bank did not originate any loans in moderate-income
census tracts in 2016. Refer to the following table for details.

25
Geographic Distribution of Small Business Loans
Assessment Area: Western
Tract Income Level % of Businesses # % $(000s) %
Low
2015 8.8 1 3.3 212 3.5
2016 9.2 0 0.0 0 0.0
Moderate
2015 16.9 4 13.3 194 3.2
2016 17.3 0 0.0 0 0.0
Middle
2015 51.5 16 53.3 4,058 67.9
2016 50.9 12 75.0 1,648 88.9
Upper
2015 22.8 9 30.0 1,510 25.3
2016 22.7 4 25.0 205 11.1
Totals
2015 100.0 30 100.0 5,974 100.0
2016 100.0 16 100.0 1,853 100.0
Source: 2015 & 2016 D&B Data; 1/1/2015 - 12/31/2016 Bank Data; 2015 CRA Aggregate Data, "--" data not available.
Home Equity Lines of Credit
The geographic distribution of HELOCs reflects poor dispersion. The bank did not originate any
loans in the low-income tract in 2015 or 2016, although only 4.0 percent of households are in the
low-income tract. Its percentage of HELOCs in 2015 and 2016 was below the percentage of
households. The following table details HELOCs by tract income level.

26
Geographic Distribution of Home Equity Lines of Credit
Assessment Area: Western
Tract Income Level % of
Households # % $(000s) %
Low
2015 4.0 0 0.0 0 0.0
2016 4.0 0 0.0 0 0.0
Moderate
2015 17.6 3 5.6 85 2.1
2016 17.6 2 4.5 108 2.2
Middle
2015 59.8 30 55.6 1,837 45.1
2016 59.8 23 52.3 1,925 38.5
Upper
2015 18.6 21 38.9 2,153 52.8
2016 18.6 19 43.2 2,972 59.4
Totals
2015 100.0 54 100.0 4,075 100.0
2016 100.0 44 100.0 5,005 100.0
Source: 2010 U.S. Census; 1/1/2015 - 12/31/2016 Bank Data.
Borrower Profile
The distribution of borrowers reflects reasonable penetration among individuals of different
income levels and businesses of different sizes in the Western assessment area. The bank’s
reasonable performance of home mortgage loans, small business loans, and HELOCs support
this conclusion.
Home Mortgage Loans
The distribution of home mortgage loans to individuals of different income levels, including low-
and moderate-income, is reasonable. The bank’s 2015 performance for low-income borrowers at
9.9 percent compares reasonably to the aggregate level. The percentage of loans increased in
2016 to 11.9 percent. The bank’s 2015 performance for moderate-income borrowers at 19.1
percent compares reasonably to aggregate data. The percentage of loans in 2016 remained
consistent. The following table details home mortgage loans by borrower income level.

27
Distribution of Home Mortgage Loans by Borrower Income Level
Assessment Area: Western
Borrower Income Level % of Families
Aggregate
Performance
% of #
# % $(000s) %
Low
2015 22.6 8.9 14 9.9 1,304 5.4
2016 22.6 -- 16 11.9 1,333 5.8
Moderate
2015 18.2 20.9 27 19.1 3,120 13.0
2016 18.2 -- 26 19.3 3,164 13.7
Middle
2015 23.1 20.6 30 21.3 4,245 17.6
2016 23.1 -- 24 17.8 2,991 12.9
Upper
2015 36.1 33.3 66 46.8 14,715 61.2
2016 36.1 -- 62 45.9 13,340 57.7
Not Available
2015 0.0 16.2 4 2.8 675 2.8
2016 0.0 -- 7 5.2 2,286 9.9
Totals
2015 100.0 100.0 141 100.0 24,059 100.0
2016 100.0 -- 135 100.0 23,114 100.0
Source: 2010 U.S. Census; 1/1/2015 - 12/31/2016 Bank Data, 2015 HMDA Aggregate Data, "--" data not available.
Small Business Loans
The distribution of small business loans reflects reasonable penetration to businesses with GARs
of $1 million or less. In 2015, 61.3 percent of small business loans were originated to businesses
with GARs of $1 million or less. This number exceeds aggregate lending data of 49.8 percent.
The bank’s performance in 2016 increased to 68.8 percent, but remained below the percentage of
businesses. D&B data indicates small business credit opportunities; however, not all businesses
are creditworthy or have credit needs. Aggregate lending data, although not used as a
benchmark for small bank lending performance, is indicative of business credit demand, local
competition, and lending opportunities within the Western assessment area. See the following
table for details on lending by business revenue category.

28
Distribution of Small Business Loans by Gross Annual Revenue Category
Assessment Area: Western
Gross Revenue Level % of Businesses # % $(000s) %
<=$1,000,000
2015 76.3 18 60.0 2,829 47.4
2016 81.5 11 68.8 1,496 80.7
>1,000,000
2015 5.7 12 40.0 3,145 52.6
2016 6.3 5 31.3 357 19.3
Revenue Not Available
2015 18.0 0 0.0 0 0.0
2016 12.2 0 0.0 0 0.0
Totals
2015 100.0 30 100.0 5,974 100.0
2016 100.0 16 100.0 1,853 100.0
Source: 2015 & 2016 D&B Data; 1/1/2015 - 12/31/2016 Bank Data; 2015 CRA Aggregate Data; "--" data not available.
Home Equity Lines of Credit
The distribution of HELOCs to individuals of different income levels, including low- and
moderate-income borrowers, is reasonable. The bank’s 2015 performance for low-income
borrowers at 7.4 percent falls below the percentage of households, but 2016 performance increased
to 13.6 percent. The bank’s 2015 performance for moderate-income borrowers at 18.5 percent
exceeds the percentage of households, and 2016 performance increased to 22.7 percent. See the
following table for the distribution of HELOCs by borrower income level.

29
Distribution of Home Equity Lines of Credit by Borrower Income Level
Assessment Area: Western
Borrower Income Level % of
Households # % $(000s) %
Low
2015 26.7 4 7.4 238 5.8
2016 26.7 6 13.6 296 5.9
Moderate
2015 15.9 10 18.5 536 13.2
2016 15.9 10 22.7 610 12.2
Middle
2015 17.5 11 20.4 618 15.2
2016 17.5 8 18.2 748 14.9
Upper
2015 39.9 29 53.7 2,683 65.8
2016 39.9 19 43.2 3,301 66.0
Not Available
2015 0.0 0 0.0 0 0.0
2016 0.0 1 2.3 50 1.0
Totals
2015 100.0 54 100.0 4,075 100.0
2016 100.0 44 100.0 5,005 100.0
Source: 2010 U.S. Census; 1/1/2015 - 12/31/2016 Bank Data.
COMMUNITY DEVELOPMENT TEST
The bank demonstrates reasonable responsiveness to community development needs in the
Western assessment area through community development loans, investments, and services.
Community Development Loans
During the evaluation period, the bank originated 13 community development loans totaling
$11.1 million in this area. The loans promoted economic development and revitalized low-
income geographies. The following describes notable examples of community development
loans in the Western assessment area.
In 2014, the bank originated an SBA 504 loan for $330,600 to a local small business
owner to erect three additional buildings for the expansion of his business located in a
moderate-income census tract. SBA 504 loans promote economic development.
In 2015, the bank originated four loans totaling $10.3 million to a developer to finance
the construction of a hotel located in a low-income census tract. The hotel will provide

30
permanent full-time employment for many local residents, primarily benefitting low- and
moderate-income individuals. These loans qualify because they revitalize a low-income
census tract.
In 2015, the bank originated a $140,000 loan for the purchase and renovation of a
property located on Tyler Street in Pittsfield. The Tyler Street District is part of the
Transformative Development Initiative (TDI), which is a three-year initiative providing
assistance in completing an actionable plan for revitalizing the neighborhood.
Qualified Investments
In addition to two qualified equity investments maintained from the prior evaluation period, the
bank made 111 qualifying donations totaling $268,749 in this area as noted in the table below.
Qualified Grants and Donations Activity By Year – Western Assessment Area
Activity
Year
Qualifying Category
Totals Affordable
Housing
Community
Services
Economic
Development
Revitalization
or
Stabilization
Neighborhood
Stabilization
Projects
# $ # $ # $ # $ # $ # $
*2014 0 0 21 48,661 1 5,000 0 0 0 0 22 53,661
2015 4 5,250 21 44,321 1 1,000 0 0 0 0 26 50,571
2016 5 6,500 39 94,267 2 8,000 0 0 0 0 46 108,767
**2017 2 2,500 14 52,250 1 1,000 0 0 0 0 17 55,750
Total 11 14,250 95 239,499 5 15,000 0 0 0 0 111 268,749
Source: Bank Records - *From June 9, 2014 through December 31, 2014. **From January 1, 2017 through September 11, 2017.
Examples of organizations receiving donations are noted below:
Higher Ground, Inc. – Higher Ground provides services and funds to meet needs of low-
income people affected by Tropical Storm Irene. The organization developed disaster
replacement housing for those who lost homes. The bank’s donation supported the Highland
Woods project, which created affordable housing for displaced low-income seniors.
The Brien Center – With more than 27 locations in Berkshire County, The Brien Center
partners with area hospitals, social service agencies, physicians, local and state agencies, law
enforcement, local schools and businesses, and donors to provide affordable accessible mental
health and addiction services for children, youth, adults and families suffering from serious
persistent behavioral disorders. The center primarily serves low- and moderate-income
individuals.
North Adams Farmers Market – The city of North Adams coordinates the SNAPx2 program
allowing low- and moderate-income individuals and families to purchase fresh produce and food
at the local farmers market.
31
Community Development Services
MountainOne Bank provides community development services in the form of employee
involvement, educational seminars, and other services. During the evaluation period, 29 bank
employees provided 142 instances of financial expertise or technical assistance to 25 community
development organizations within the assessment area. Most services supported community
services for low- and moderate-income people.
The following illustrates notable examples of the bank’s community development services:
Holiday Walk Soup-er Bowl - The Community Banking Officer developed this fundraising
program for two local food pantries. The food pantries serve the area’s low-income population.
Louison House, Inc. - Louison House, Inc. is a private, non-profit organization that was
established in 1990 by local agencies to address the issue of homelessness in Northern Berkshire
County. Over the past 20 years, Louison House has provided homelessness prevention and
housing services to over 3,500 individuals and families throughout Berkshire County. The
Assistant Vice President Marketing Manager is a member of the fundraising committee and
provides financial and marketing expertise to the Board.
Community Health Program (CHP) – CHP helps low- and moderate income individuals to
afford health insurance coverage. Counselors help individuals apply for government subsidized
health insurance and choose the right insurance plan to meet their family needs. The Executive
Vice President/Senior Risk Officer is the Vice President of the Board of Directors and a member
of the Finance Committee and the Performance Improvement Committee.
Berkshire Housing Development Corporation (BHDC) - The mission of BHDC is to improve
the quality of life for residents of Berkshire County by increasing affordable housing
opportunities, delivering community development programs and projects, and operating a
professional management company. The CFO is a member of the Board of Directors.
Educational Seminars
Listed below are examples of seminars and workshops provided by the bank.
Bank management and staff provided financial literacy training using the FDIC’s Money
Smart Program. The Money Smart Program is a comprehensive financial education
curriculum designed to help low- and moderate-income individuals enhance their financial
skills and create positive banking relationships. The program includes an introduction to
bank services and credit, how to choose and keep a checking account, how to keep track of
money, how credit history affects credit future, and how to make a credit card work for
you.
In 2014, the bank presented a two-day first-time homebuyer’s seminar to the Berkshire
Housing Authority. Topics included mortgage options, pre-application, applications,
closing costs, and fees.

32
Boston-Cambridge-Newton, MA-NH MSA (Full-Scope Review)
DESCRIPTION OF BANK OPERATIONS IN Boston, MA MSA
Examiners performed a full-scope evaluation of the bank’s performance in the Boston MSA,
which includes MOB’s Eastern South Shore and Eastern North Shore assessment areas. Three of
the bank’s full-service branches are located in the Eastern South Shore assessment area. The
Rockland branch is located in a moderate-income tract, the Quincy branch is located in a middle-
income tract, and the Scituate branch is located in an upper-income tract. In December 2014, the
bank opened a new branch in Danvers, located in a middle-income census tract. The Danvers
branch is MOB’s lone office in the Eastern North Shore assessment area.
Collectively, Boston MSA assessment areas contain just over half of MOB’s branches and a
significant majority of the combined assessment area’s census tracts. However, only 39.3
percent of bank deposits are in the Boston MSA. MOB made slightly more than half of its home
mortgage and small business loans in the Boston MSA assessment areas, while just under half of
its HELOCs were in these areas.
The following sections discuss performance context for Boston MSA assessment areas. In
general, the assessment areas have similar characteristics, including high home values and
relatively limited owner-occupied housing in low- and moderate-income geographies.
Demographic Data
Eastern South Shore Assessment Area
The Eastern South Shore assessment area consists of 98 census tracts with the following income
designations: 2 low-income, 5 moderate-income, 59 middle-income, and 32 upper-income.
Quincy contains both low-income tracts and three of the five moderate-income tracts. Low- and
moderate-income census tracts account for 2.0 percent and 5.1 percent, respectively, of total
census tracts in the Eastern South Shore assessment area. The following table shows
demographic information for this assessment area.

33
Demographic Information of the Assessment Area
Assessment Area: Eastern South Shore
Demographic Characteristics # Low
% of #
Moderate
% of #
Middle
% of #
Upper
% of #
NA*
% of #
Geographies (Census Tracts) 98 2.0 5.1 60.2 32.7 0.0
Population by Geography 498,415 1.5 5.1 60.1 33.3 0.0
Housing Units by Geography 208,188 1.6 5.8 61.1 31.5 0.0
Owner-Occupied Units by
Geography
141,264 0.7 3.7 59.7 35.9 0.0
Occupied Rental Units by
Geography
51,287 4.2 11.5 64.9 19.4 0.0
Vacant Units by Geography 15,637 1.7 5.3 62.9 30.1 0.0
Businesses by Geography 34,849 1.2 3.9 58.5 36.4 0.0
Family Distribution by Income Level 127,274 16.1 15.9 22.5 45.5 0.0
Household Distribution by Income
Level
192,551 20.4 13.9 18.0 47.7 0.0
Median Family Income MSA -
14454 Boston, MA MD
$83,664 Median Housing Value $417,477
Median Gross Rent $1,132
Families Below Poverty Level 4.3%
Source: 2010 U.S. Census and 2016 D&B Data
According to 2016 D&B data, 84.7 percent of businesses within this assessment area had GARs
of $1 million or less.
Eastern North Shore Assessment Area
The Eastern North Shore assessment area consists of 59 census tracts with the following income
designations: 2 low-income, 14 moderate-income, 33 middle-income, and 10 upper-income.
Salem and Gloucester each have one low-income tract and four moderate-income tracts.
Peabody and Beverly each have three moderate-income tracts. Low- and moderate income
census tracts account for 5.1 percent and 22.0 percent, respectively, of total census tracts in the
Eastern North Shore assessment area. The following table shows demographic information for
this assessment area.

34
Demographic Information of the Assessment Area
Assessment Area: Eastern North Shore
Demographic Characteristics # Low
% of #
Moderate
% of #
Middle
% of #
Upper
% of #
NA*
% of #
Geographies (Census Tracts) 59 3.4 23.7 55.9 17.0 0.0
Population by Geography 284,489 2.2 21.2 56.7 19.9 0.0
Housing Units by Geography 122,179 2.3 23.1 56.7 17.8 0.0
Owner-Occupied Units by
Geography
77,010 1.2 16.9 61.1 20.8 0.0
Occupied Rental Units by
Geography
35,373 4.7 36.1 47.2 12.0 0.0
Vacant Units by Geography 9,796 2.3 25.0 57.3 15.4 0.0
Businesses by Geography 23,430 2.8 21.4 54.0 21.8 0.0
Family Distribution by Income
Level
71,909 20.5 18.8 21.5 39.2 0.0
Household Distribution by Income
Level
112,383 26.7 15.3 18.1 40.0 0.0
Median Family Income MSA - 15764
Cambridge-Newton-Framingham, MA MD
$90,625 Median Housing Value $431,318
Median Gross Rent $1,042
Families Below Poverty Level 4.7%
Source: 2010 U.S. Census and 2016 D&B Data Due to rounding, totals may not equal 100.0
According to 2016 D&B data, 84.6 percent of businesses within this assessment area had GARs
of $1 million or less.
Economic Data
According to Moody’s Analytics, the Boston MSA has strong economic conditions. Job growth is
well ahead of the national average and twice the regional average, bolstered primarily by thriving
finance and education/healthcare industries. The Boston MSA has low unemployment rates
promoting wage increases, and limited real estate supply has contributed to high housing costs.
Boston has strong access to skilled labor and venture capital for emerging companies. Weaknesses
include high business and living costs.
The area’s largest employers are Partners HealthCare, University of Massachusetts, Harvard
University, and Massachusetts Institute of Technology. The largest employment sectors are
education and health services and professional and business services, followed by government. The
presence of some of the world’s most prestigious universities and hospitals has a significant impact
on the Boston MSA economy. As a result, many residents in the Eastern South and Eastern North
assessment areas commute to Boston and Cambridge and work in education, health services, or
biotechnology. While both assessment areas have relatively high family incomes, they also have
high living costs.

35
Community Contacts
Eastern South Shore Assessment Area
Examiners contacted a non-profit organization that develops and manages affordable housing,
educates and assists homeowners and homebuyers, and helps homeowners repair and maintain
their homes. The contact identified the lack of affordable housing as the biggest obstacle to
homeownership. Heavy competition for a limited supply of both rental and purchase units has
driven up market values. Considering these challenges, the contact praised local financial
institutions for their efforts to assist low- and moderate-income families that require flexible
financing for home purchases.
Eastern North Shore Assessment Area
Examiners contacted a non-profit housing organization that provides services to adolescents and
the homeless through group homes. The organization cited reduced manufacturing jobs as a
cause of homelessness. According to the contact, these jobs decreased from over 20,000 to
approximately 6,000 in the last decade. Without obtaining new skills, manufacturing workers
have not been able to obtain new jobs. The contact also noted affordable housing needs in the
area, but more specifically, quality jobs.
The organization had a positive perception of local financial institutions’ efforts to meet
community needs, particularly through grants and donations. However, the volatility of
donations makes it difficult for community development organizations to ensure sustainable
funding for projects.
CONCLUSIONS ON PERFORMANCE CRITERIA IN Boston, MA MSA
LENDING TEST
MOB demonstrated reasonable Lending Test performance in the Boston MSA. The following
sections describe the geographic distribution and borrower profile of MOB lending for each Boston
MSA assessment area.
Geographic Distribution
The distribution of loans reflects reasonable dispersion throughout the Boston MSA. Examiners
focused on the percentage by number of loans in low- and moderate-income census tracts.
Eastern South Shore Assessment Area
Home Mortgage Loans
The geographic distribution of home mortgage loans reflects reasonable dispersion throughout
the Eastern South Shore assessment area. Examiners compared bank performance to aggregate
data for 2015 and the percentage of owner-occupied housing units. The bank’s 2015 and 2016
performance in low-income census tracts at 2.8 percent exceeded aggregate lending data and the
percentage of owner-occupied housing units at 0.7 percent.

36
The bank’s 2015 performance in moderate-income census tracts at 4.2 percent exceeded the
aggregate level at 3.8 percent. The bank’s 2016 performance in moderate-income census tracts
increased to 5.7 percent, exceeding the percentage of owner-occupied housing units at 3.7
percent. These comparisons reflect reasonable performance. The following table details bank
lending by tract income level.
Geographic Distribution of Home Mortgage Loans
Assessment Area: Eastern South Shore
Tract Income Level
% of Owner-
Occupied
Housing Units
Aggregate
Performance
% of #
# % $(000s) %
Low
2015 0.7 0.7 2 2.8 331 1.4
2016 0.7 -- 3 2.8 844 2.3
Moderate
2015 3.9 3.8 3 4.2 854 3.5
2016 3.7 -- 6 5.7 1,307 3.6
Middle
2015 63.1 61.2 26 36.1 6,140 25.4
2016 59.7 -- 41 38.7 11,908 32.5
Upper
2015 32.3 34.3 41 56.9 16,843 69.7
2016 35.9 -- 56 52.8 22,540 61.6
Totals
2015 100.0 100.0 72 100.0 24,168 100.0
2016 100.0 -- 106 100.0 36,599 100.0
Source: 2010 U.S. Census; 1/1/2015 - 12/31/2016 Bank Data, 2015 HMDA Aggregate Data, "--" data not available.
Small Business Loans
The geographic distribution of small business loans reflects reasonable dispersion. The Eastern
South Shore assessment area contains a very low percentage of businesses in both low- and
moderate-income tracts. Although the bank did not originate any small business loans in low-
income tracts in 2015, its 2.9 percent of loans in these tracts in 2016 slightly exceeded the
percentage of businesses in low-income tracts. The bank did not originate any small business
loans in moderate-income tracts in 2015, and the one moderate-income tract loan in 2016
reflected a percentage slightly below the percentage of businesses in moderate-income tracts.
The following table shows bank lending by geography income level.

37
Geographic Distribution of Small Business Loans
Assessment Area: Eastern South Shore
Tract Income Level % of Businesses # % $(000s) %
Low
2015 1.2 0 0.0 0 0.0
2016 1.2 1 2.9 960 8.0
Moderate
2015 4.1 0 0.0 0 0.0
2016 3.9 1 2.9 760 6.3
Middle
2015 61.2 22 73.3 6,373 76.3
2016 58.5 20 58.8 5,989 49.9
Upper
2015 33.5 8 26.7 1,977 23.7
2016 36.4 12 35.3 4,291 35.8
Totals
2015 100.0 30 100.0 8,350 100.0
2016 100.0 34 100.0 12,000 100.0
Source: 2015 D&B Data; 1/1/2015 - 12/31/2016 Bank Data; 2015 CRA Aggregate Data, "--" data not available.
Home Equity Lines of Credit
The geographic distribution of HELOCs is reasonable. The bank’s 2015 performance in low-
income tracts at 4.3 percent exceeded the percentage of households, but MOB did not originate any
HELOCs in low-income census tracts in 2016. The bank did not originate any HELOCs in
moderate-income census tracts in 2015 or 2016. However, the bank could have had a lending
percentage comparable to the demographic comparator by making just one loan in a moderate-
income tract. The following table shows the distribution of HELOCs by tract income level.

38
Geographic Distribution of Home Equity Lines of Credit
Assessment Area: Eastern South Shore
Tract Income Level % of
Households # % $(000s) %
Low
2015 1.7 1 4.3 15 0.4
2016 1.6 0 0.0 0 0.0
Moderate
2015 6.1 0 0.0 0 0.0
2016 5.8 0 0.0 0 0.0
Middle
2015 64.2 6 26.1 987 24.3
2016 61.1 8 40.0 835 27.2
Upper
2015 28.1 16 69.6 3,055 75.3
2016 31.6 12 60.0 2,234 72.8
Totals
2015 100.0 23 100.0 4,057 100.0
2016 100.0 20 100.0 3,069 100.0
Source: 2010 U.S. Census; 1/1/2015 - 12/31/2016 Bank Data.
Eastern North Shore Assessment Area
Home Mortgage Loans
The geographic distribution of home mortgage loans reflects reasonable dispersion throughout
the Eastern North Shore assessment area. MOB made no loans in low-income tracts in 2015 and
one loan in low-income tracts in 2016. Aggregate data in 2015 and the percentage of owner-
occupied units reflect very low opportunities for home mortgage loans in low-income tracts.
The bank’s 2015 performance in moderate-income tracts at 7.7 percent fell below aggregate data
at 18.9 percent. The fact that the bank only has one branch in the assessment area that opened in
2014 mitigates the unfavorable 2015 aggregate comparison. However, MOB’s 2016 percentage
in moderate-income tracts increased to 13.0 percent, which is only slightly below the percentage
of owner-occupied housing units in these tracts.

39
Geographic Distribution of Home Mortgage Loans
Assessment Area: Eastern North Shore
Tract Income Level
% of Owner-
Occupied
Housing Units
Aggregate
Performance
% of #
# % $(000s) %
Low
2015 1.2 1.3 0 0.0 0 0.0
2016 1.2 -- 1 0.7 226 0.5
Moderate
2015 16.9 18.9 9 7.7 2,639 7.2
2016 16.9 -- 18 13.0 5,495 12.5
Middle
2015 61.1 58.5 80 68.4 24,122 65.8
2016 61.1 -- 88 63.8 27,947 63.6
Upper
2015 20.8 21.3 28 23.9 9,904 27.0
2016 20.8 -- 31 22.5 10,308 23.4
Totals
2015 100.0 100.0 117 100.0 36,665 100.0
2016 100.0 -- 138 100.0 43,976 100.0
Source: 2010 U.S. Census; 1/1/2015 - 12/31/2016 Bank Data, 2015 HMDA Aggregate Data, "--" data not available.
Small Business Loans
Examiners did not perform an analysis on geographic distribution of small business loans in the
Eastern North Shore assessment area due to the nominal volume of originated loans (four) during
the review period. Such limited loan activity did not provide enough data to come to a
meaningful conclusion.
Home Equity Lines of Credit
The geographic distribution of HELOCs reflects reasonable dispersion throughout the Eastern
North Shore assessment area. The following table shows that the bank’s 2015 performance in
low-income census tracts at 4.8 percent exceeds percent of households at 2.3 percent. The bank
did not originate any HELOCs in low-income census tracts in 2016.
The bank’s 2015 performance in moderate-income census tracts at 9.5 percent is well below
percent of households at 23.0 percent. The bank’s 2016 performance in moderate-income census
tracts at 10.0 percent is well below percent of households at 23.0 percent. However, the bank
only established a branch in this assessment area in 2014. MOB’s recent entry into this market
and the limited number of HELOCs originated supports reasonable performance. With just two
additional loans, the bank could have had a similar percentage as the demographic comparator.

40
Geographic Distribution of Home Equity Lines of Credit
Assessment Area: Eastern North Shore
Tract Income Level % of
Households # % $(000s) %
Low
2015 2.3 1 4.8 20 1.0
2016 2.3 0 0.0 0 0.0
Moderate
2015 23.0 2 9.5 225 11.8
2016 23.0 2 10.0 80 3.2
Middle
2015 56.7 10 47.6 792 41.4
2016 56.7 13 65.0 1,803 71.0
Upper
2015 18.1 8 38.1 875 45.8
2016 18.1 5 25.0 657 25.9
Totals
2015 100.0 21 100.0 1,912 100.0
2016 100.0 20 100.0 2,540 100.0
Source: 2010 U.S. Census; 1/1/2015 - 12/31/2016 Bank Data.
Borrower Profile
The distribution of borrowers reflects reasonable penetration among individuals of different
income levels and businesses of different sizes. The bank’s reasonable performance of home
mortgage loans, small business loans, and HELOCs support this conclusion. Examiners focused
on the percentage by number of small business loans to businesses with GARs of $1 million or
less. They also focused on the percentage by number of home mortgage loans to low- and
moderate-income borrowers.
Eastern South Shore Assessment Area
Home Mortgage Loans
The distribution of home mortgage loans to individuals of different income levels, including low-
and moderate-income borrowers, is reasonable. The bank’s 2015 performance for low-income
borrowers at 2.8 percent compares reasonably to the aggregate level of 3.6 percent. The bank’s
2016 performance for low-income borrowers at 3.8 percent was below the percentage of families
at 16.1 percent.
The bank’s 2015 performance for moderate-income borrowers at 18.1 percent exceeds aggregate
data at 14.7 percent. The bank’s 2016 performance for moderate-income borrowers at 11.3
percent was slightly below the percentage of families at 15.9 percent. These comparisons reflect
reasonable performance. Bank lending to low-income borrowers increased while lending to

41
moderate-income borrowers decreased in 2016. The following table shows bank lending by
borrower income level.
Distribution of Home Mortgage Loans by Borrower Income Level
Assessment Area: Eastern South Shore
Borrower Income Level % of Families
Aggregate
Performance
% of #
# % $(000s) %
Low
2015 16.4 3.6 2 2.8 203 0.8
2016 16.1 -- 4 3.8 335 0.9
Moderate
2015 16.2 14.7 13 18.1 2,818 11.7
2016 15.9 -- 12 11.3 2,612 7.1
Middle
2015 22.7 22.9 15 20.8 3,805 15.7
2016 22.5 -- 24 22.6 6,087 16.6
Upper
2015 44.7 39.9 34 47.2 13,843 57.3
2016 45.6 -- 55 51.9 20,628 56.4
Not Available
2015 0.0 19.0 8 11.1 3,499 14.5
2016 0.0 -- 11 10.4 6,937 19.0
Totals
2015 100.0 100.0 72 100.0 24,168 100.0
2016 100.0 -- 106 100.0 36,599 100.0
Source: 2010 U.S. Census; 1/1/2015 - 12/31/2016 Bank Data, 2015 HMDA Aggregate Data, "--" data not available.
Small Business Loans
The distribution of small business loans reflects reasonable penetration to businesses with GARs
of $1 million or less. The percentage of bank loans in 2015 was below the percentage of
businesses, but MOB’s percentage in 2016 increased to 55.9 percent. Although still below the
percentage of businesses in this revenue category, bank performance is reasonable. D&B data
provides an indicator of small business credit opportunities; however, not all businesses are
creditworthy or have credit needs. Aggregate lending data, although not used as a benchmark for
small bank lending performance, indicates fewer opportunities to make loans to businesses with
GARs or $1 million or less in the Eastern South Shore assessment area. See the following table.

42
Distribution of Small Business Loans by Gross Annual Revenue Category
Assessment Area: Eastern South Shore
Gross Revenue Level % of Businesses # % $(000s) %
<=$1,000,000
2015 77.9 11 36.7 3,218 38.5
2016 84.7 19 55.9 7,631 63.6
>1,000,000
2015 5.2 19 63.3 5,132 61.5
2016 5.9 14 41.2 3,769 31.4
Revenue Not Available
2015 16.9 0 0.0 0 0.0
2016 9.4 1 2.9 600 5.0
Totals
2015 100.0 30 100.0 8,350 100.0
2016 100.0 34 100.0 12,000 100.0
Source: 2015 D&B Data; 1/1/2015 - 12/31/2016 Bank Data; 2015 CRA Aggregate Data; "--" data not available.
Home Equity Lines of Credit
The distribution of HELOCs to individuals of different income levels, including low- and
moderate-income, is reasonable. The following table shows that the bank’s 2015 performance for
low-income borrowers was below the percentage of households. However, this percentage
increased in 2016 to 20.0 percent, which reasonably compares to the percentage of households.
Similarly, the bank’s percentage of HELOCs to moderate-income borrowers was below
demographics in 2015 but improved in 2016 to exceed demographics. See the following table.
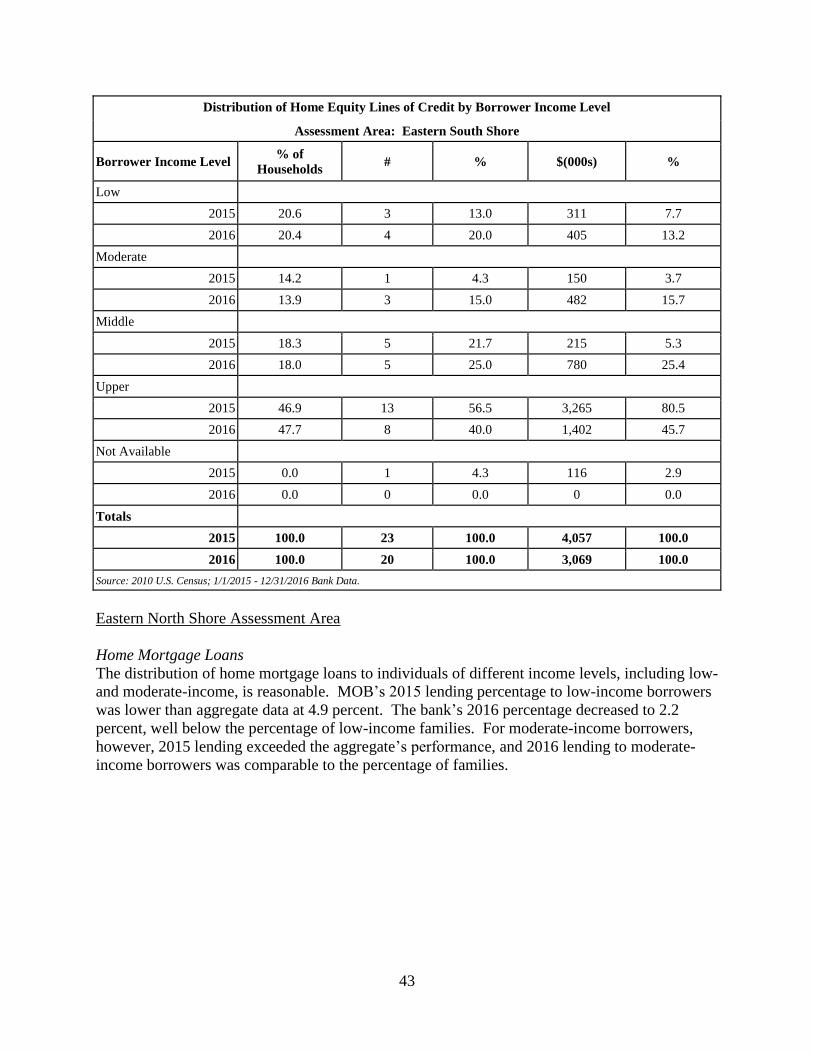
43
Distribution of Home Equity Lines of Credit by Borrower Income Level
Assessment Area: Eastern South Shore
Borrower Income Level % of
Households # % $(000s) %
Low
2015 20.6 3 13.0 311 7.7
2016 20.4 4 20.0 405 13.2
Moderate
2015 14.2 1 4.3 150 3.7
2016 13.9 3 15.0 482 15.7
Middle
2015 18.3 5 21.7 215 5.3
2016 18.0 5 25.0 780 25.4
Upper
2015 46.9 13 56.5 3,265 80.5
2016 47.7 8 40.0 1,402 45.7
Not Available
2015 0.0 1 4.3 116 2.9
2016 0.0 0 0.0 0 0.0
Totals
2015 100.0 23 100.0 4,057 100.0
2016 100.0 20 100.0 3,069 100.0
Source: 2010 U.S. Census; 1/1/2015 - 12/31/2016 Bank Data.
Eastern North Shore Assessment Area
Home Mortgage Loans
The distribution of home mortgage loans to individuals of different income levels, including low-
and moderate-income, is reasonable. MOB’s 2015 lending percentage to low-income borrowers
was lower than aggregate data at 4.9 percent. The bank’s 2016 percentage decreased to 2.2
percent, well below the percentage of low-income families. For moderate-income borrowers,
however, 2015 lending exceeded the aggregate’s performance, and 2016 lending to moderate-
income borrowers was comparable to the percentage of families.

44
Distribution of Home Mortgage Loans by Borrower Income Level
Assessment Area: Eastern North Shore
Borrower Income Level % of Families
Aggregate
Performance
% of #
# % $(000s) %
Low
2015 20.6 4.9 1 0.9 185 0.5
2016 20.6 -- 3 2.2 595 1.4
Moderate
2015 18.8 18.2 24 20.5 5,978 16.3
2016 18.8 -- 23 16.7 6,109 13.9
Middle
2015 21.5 24.0 39 33.3 12,129 33.1
2016 21.5 -- 42 30.4 13,202 30.0
Upper
2015 39.2 33.2 53 45.3 18,373 50.1
2016 39.2 -- 70 50.7 24,070 54.7
Not Available
2015 0.0 19.6 0 0.0 0 0.0
2016 0.0 -- 0 0.0 0 0.0
Totals
2015 100.0 100.0 117 100.0 36,665 100.0
2016 100.0 -- 138 100.0 43,976 100.0
Source: 2010 U.S. Census; 1/1/2015 - 12/31/2016 Bank Data, 2015 HMDA Aggregate Data, "--" data not available.
Small Business Loans
Examiners did not analyze the distribution of small business loans by GAR level in the Eastern
North Shore assessment area due to the nominal volume of originated loans (four) during the
review period. There was not enough lending activity to come to a meaningful conclusion.
Home Equity Lines of Credit
The distribution of HELOCs reflects poor penetration throughout the Eastern North Shore
assessment area. The bank made one HELOC to a low-income borrower and two to moderate-
income borrowers in 2015. MOB did not make any HELOCs to low- or moderate-income
borrowers in 2016. Although this performance is poor, several factors mitigate this performance on
overall conclusions. First, the bank only established a branch in this assessment area in 2014.
Second, HELOCs are not the bank’s primary product. Finally, the relatively small number of
HELOCs originated means that just one or two additional loans in an income category could have a
large impact on percentages. The following table shows bank HELOCs by borrower income level.

45
Distribution of Home Equity Lines of Credit by Borrower Income Level
Assessment Area: Eastern North Shore
Borrower Income Level % of
Households # % $(000s) %
Low
2015 26.7 1 4.8 62 3.2
2016 26.7 0 0.0 0 0.0
Moderate
2015 15.3 2 9.5 46 2.4
2016 15.3 0 0.0 0 0.0
Middle
2015 18.1 5 23.8 271 14.2
2016 18.1 3 15.0 406 16.0
Upper
2015 40.0 13 61.9 1,533 80.2
2016 40.0 17 85.0 2,134 84.0
Not Available
2015 0.0 0 0.0 0 0.0
2016 0.0 0 0.0 0 0.0
Totals
2015 100.0 21 100.0 1,912 100.0
2016 100.0 20 100.0 2,540 100.0
Source: 2010 U.S. Census; 1/1/2015 - 12/31/2016 Bank Data.
COMMUNITY DEVELOPMENT TEST
MOB demonstrates reasonable responsiveness to the Boston MSA’s community development
needs through community development loans, investments, and services.
Community Development Loans
Eastern South Shore Assessment Area
During the evaluation period, the bank originated one community development loan for $1.1
million to a local business owner for the construction of a new building under the SBA 504
program. The loan provided economic development and created and retained permanent jobs
within the assessment area.

46
Eastern North Shore Assessment Area
The bank originated two community development loans totaling $9.3 million in the Eastern
North Shore assessment area. In 2016, the bank originated a $1.8 million SBA 504 loan for the
development of a hotel located in a low-income census tract. MOB also originated a $7.5
million loan for the construction of a 24,000 square foot mixed-use building located in a
moderate-income census tract for the development of office and retail space that will replace a
rundown commercial block. Both loans revitalized low- or moderate-income geographies.
Qualified Investments
Eastern South Shore Assessment Area
The bank made 48 qualified CRA donations totaling $119,550 during the evaluation period to
the Eastern South Shore assessment area. Most qualified donations benefitted community
services to low- and moderate-income people. The following describes notable organizations
receiving bank donations.
Neighborworks Southern Mass (NWSOMA) – A non-profit charter member of the national
Neighborworks Network, NWSOMA operates three full-service centers that develop and manage
affordable housing, educate and assist homeowners and homebuyers with home purchase and
maintenance. The group has educated over 7,000 prospective homebuyers, assisted 3,000 buyers
purchase a first home, offered foreclosure prevention counseling to 2,200+ homeowners,
provided personal finance training to 1,000+ households, helped 1,000+ homeowners make
home repairs, and provided lead abatement loans to 250+ homes.
Friendship Home – Friendship Home provides respite care and support services for individuals
with developmental disabilities and their families primarily from southeastern Massachusetts but
include Boston and central Massachusetts. Programs teach new skills while family caregivers
tend to other priorities and nurture themselves. Eighty-five percent of the organization’s clients
served fall into the low- and moderate-income brackets.
Eastern North Shore Assessment Area
MOB made 18 donations totaling $25,500 in this assessment area. Most qualified donations
benefitted community services to low- and moderate-income people. The following describes
notable organizations receiving bank donations.
Citizens Inn –Citizen Inn’s mission is to help local families and individuals leave hunger and
homelessness behind by operating a food pantry, providing community meals, hunger prevention
and social transitional programs, addiction treatment, emergency housing shelter, case
management, and a portfolio of rental units.
North Shore Community Action Programs, Inc. (NSCAP) – A non-profit organization,
NSCAP provides social services that enable low-income families and individuals to obtain the
skills and knowledge needed to become economically self-sufficient, civically engaged, and to

47
rise out of poverty. They provide programs in education and training, economic stabilization,
housing and homelessness prevention, energy services, financial literacy classes, fuel assistance,
and temporary shelter.
Community Development Services
Eastern South Shore Assessment Area
Eight bank employees provided 16 instances of financial expertise or technical assistance to
eight community development organizations. Most services benefitted organizations that
provide community services to low- and moderate-income people. The following describes
notable community development services in the Eastern South Shore assessment area.
Viv’s Give - Viv's Give is a non-profit organization that provides diapers, formula and baby food
to families in need. The Assistant Vice President/Banking Officer is the founder and a member
of the Board of Directors of this organization. The Community Banking Officer is on the Board
of Directors and handles all banking and financial aspects of the organization.
Habitat for Humanity – Habitat for Humanity builds homes for families in need, using
volunteers to construct homes. They sell the homes with an affordable mortgage to hard working
local families so they can stay in their community. The Senior Vice President of Retail Lending
is a member of the Board of Directors and provides financial and management expertise to the
Board.
Catholic Charities – The mission of Catholic Charities is to provide services to people in need,
to advocate for justice in social structures, and work with individuals, families, parishes and
communities to help them meet their needs, identify their strengths, address oppression, and
overcome barriers to build a just and compassionate society. The Vice President of Commercial
Lending is a member of the Board of Directors.
Financial Literacy
In 2015, the bank presented a first time homebuyer’s workshop to the Quincy
Community Action Program (QCAP). QCAP is the leading private non-profit
organization in the Greater Quincy area dedicated to reducing poverty and helping low-
income people achieve self-sufficiency. Topics included: the home buying process and
terminology, how to locate a property in your price range, which mortgage program is
right for you, down payment, and closing cost assistance grants.
In 2017, the bank participated with NWSOMA to present a first time homebuyer seminar.
NWSOMA is a non-profit organization that creates housing opportunities by educating
and assisting first time homebuyers to purchase their homes, developing affordable
housing for those in need, and making home rehabilitation loans.

48
Eastern North Shore Assessment Area
MOB employees provided four instances of financial expertise or technical assistance to two
community development organizations within this assessment area. The following describes
notable community development services in the Eastern North Shore assessment area.
North Shore Community Development Coalition (CDC) – As the only regional community
development organization serving the North Shore, North Shore CDC is positioned to bring
neighborhood development model to communities throughout the region. Focusing on low-
income and distressed neighborhoods, they have committed to transformational, sustainable
revitalization in Salem, Peabody, and Beverly. A Community Banking Officer is a committee
member.
Financial Literacy
In 2015, the bank conducted a first time homebuyer’s seminar in the Danvers’ branch office.
All attendees were low- and moderate-income individuals. Topics focused on how to obtain
a mortgage, mortgage options available, application process, and closing costs and fees.
In 2016, in conjunction with MassHousing, the bank presented a homebuyer’s seminar to
the Gloucester Housing Authority. The seminar’s topics included: the home buying
process and terminology, how to locate a property in your price range, which mortgage
program is right for you and down payment and closing cost assistance grants.

49
APPENDIX A
Fair Lending Policies and Procedures – MA Division of Banks
The Division provides comments regarding the institution’s fair lending policies and procedures
pursuant to Regulatory Bulletin 1.3-106. A review of the bank’s public comment file indicated
the bank received no complaints pertaining to the institution’s CRA performance since the
previous examination. The fair lending review was conducted in accordance with the Federal
Financial Institutions Examination Council (FFIEC) Interagency Fair Lending Examination
Procedures. Based on these procedures, no evidence of disparate treatment was noted.
MINORITY APPLICATION FLOW
The bank’s HMDA LARs for 2015 and 2016 were reviewed to determine if the application flow
from the different racial groups within the bank’s assessment area was reflective of the
assessment area’s demographics.
According to the 2010 U.S. Census Data, the bank’s assessment area contained a total population
of 925,577 individuals of which 12.9 percent are minorities. The assessment area’s minority and
ethnic population is 2.6 percent Black/African American, 4.6 percent Asian, 0.1 percent
American Indian, 0.0 percent Hawaiian/Pacific Islander, 3.6 percent Hispanic or Latino and 2.0
percent other.
In 2015, the bank received 462 HMDA reportable loan applications from within its assessment
area. Of these applications, 32 or 6.9 percent were received from minority applicants, of which
22 or 68.8 percent resulted in originations. The aggregate received 46,849 HMDA reportable
loan applications of which 2,796 or 6.0 percent were received from minority applicants and
1,877 or 67.1 percent were originated. For the same time period, the bank also received 10 or
2.2 percent of applications from ethnic groups of Hispanic origin within its assessment area of
which 8 or 80.0 percent were originated versus the aggregate that received 982 applications or
2.1 percent of which 653 or 66.5 percent were originated.
For 2016, the bank received 504 HMDA reportable loan applications from within its assessment
area. Of these applications, 22 or 4.4 percent were received from minority applicants, of which
15 or 68.2 percent resulted in originations. For the same time period, the bank received 19 or 3.8
percent of applications from ethnic groups of Hispanic origin within its assessment area of which
11 or 57.9 percent were originated.
The bank’s level of lending was compared with that of the aggregate’s lending performance level
for the most recent year that data was available, the year 2015. The comparison of this data
assists in deriving good expectations for the rate of applications the bank received from minority
residential loan applicants. Refer to the table below for information on the bank’s minority
application flow as well as the aggregate lenders in the bank’s assessment area.

50
MINORITY APPLICATION FLOW
RACE
Bank 2015 2015
Aggregate
Data
Bank 2016
# % % # %
American Indian/ Alaska Native 2 0.4 0.2 1 0.2
Asian 13 2.8 3.5 8 1.6
Black/ African American 6 1.3 1.2 3 0.6
Hawaiian/Pacific Islander 0 0.0 0.1 0 0.0
2 or more Minority 0 0.0 0.0 0 0.0
Joint Race (White/Minority) 11 2.4 1.0 10 2.0
Total Minority 32 6.9 6.0 22 4.4
White 401 86.8 72.5 457 90.7
Race Not Available 29 6.3 21.5 25 5.0
Total 462 100.0 100.0 504 100.0
ETHNICITY
Hispanic or Latino 5 1.1 1.4 10 2.0
Not Hispanic or Latino 423 91.5 76.3 455 90.3
Joint (Hisp/Lat /Not Hisp/Lat) 5 1.1 0.7 9 1.8
Ethnicity Not Available 29 6.3 21.6 30 5.9
Total 462 100.0 100.0 100.0
Source: US Census 2010, HMDA Aggregate Data 2015, HMDA LAR Data 2015and 2016 *Due to rounding, totals may not equal 100.0 percent.
Considering the demographic composition of the assessment area and comparisons to aggregate
data in 2015, the bank’s minority application flow is good.

51
GLOSSARY
Aggregate Lending: The number of loans originated and purchased by all reporting lenders in
specified income categories as a percentage of the aggregate number of loans originated and
purchased by all reporting lenders in the metropolitan area/assessment area.
Area Median Income: The median family income for the MSA, if a person or geography is
located in an MSA; or the statewide non-metropolitan median family income, if a person or
geography is located outside an MSA.
Assessment Area: A geographic area delineated by the bank under the requirements of the
Community Reinvestment Act.
Census Tract: A small, relatively permanent statistical subdivision of a county. Census tract
boundaries normally follow visible features, but they may follow governmental unit boundaries
and other non-visible features in some instances. They always nest within counties. Census
tracts average about 4,000 persons, and their physical size varies widely depending upon
population density. Census tracts are designed to be homogenous for population characteristics,
economic status, and living conditions to allow for statistical comparisons.
Combined Statistical Area (CSA): A combination of several adjacent metropolitan statistical
areas or micropolitan statistical areas or a mix of the two, which are linked by economic ties.
Community Development: For loans, investments, and services to qualify as community
development activities, their primary purpose must:
(1) Support affordable housing for low- and moderate-income individuals;
(2) Target community services toward low- and moderate-income individuals;
(3) Promote economic development by financing small businesses or farms; or
(4) Provide activities that revitalize or stabilize low- and moderate-income geographies,
designated disaster areas, or distressed or underserved non-metropolitan middle-income
geographies; or
(5) Enable or facilitate projects or activities that address needs regarding foreclosed or
abandoned residential properties in designated target areas.
Community Development Corporation (CDC): A CDC allows banks and holding companies
to make equity type of investments in community development projects. Bank CDCs can
develop innovative debt instruments or provide near-equity investments tailored to the
development needs of the community. Bank CDCs are also tailored to their financial and
marketing needs. A CDC may purchase, own, rehabilitate, construct, manage, and sell real
property. Also, it may make equity or debt investments in development projects and in local
businesses. The CDC activities are expected to directly benefit low- and moderate-income
groups, and the investment dollars should not represent an undue risk on the banking
organization.

52
Community Development Financial Institutions (CDFIs): CDFIs are private intermediaries
(either for profit or nonprofit) with community development as their primary mission. A CDFI
facilitates the flow of lending and investment capital into distressed communities and to
individuals who have been unable to take advantage of the services offered by traditional
financial institutions. Some basic types of CDFIs include community development banks,
community development loan funds, community development credit unions, micro enterprise
funds, and community development venture capital funds.
A certified CDFI must meet eligibility requirements. These requirements include the following:
Having a primary mission of promoting community development;
Serving an investment area or target population;
Providing development services;
Maintaining accountability to residents of its investment area or targeted population
through representation on its governing board of directors, or by other means;
Not constituting an agency or instrumentality of the United States, of any state or
political subdivision of a state.
Community Development Loan: A loan that
(1) Has as its primary purpose community development; and
(2) Except in the case of a wholesale or limited purpose bank:
(i) Has not been reported or collected by the bank or an affiliate for consideration in the
bank’s assessment area as a home mortgage, small business, small farm, or consumer
loan, unless it is a multifamily dwelling loan (as described in Appendix A to Part 203 of
this title); and
(ii) Benefits the bank’s assessment area(s) or a broader statewide or regional area
including the bank’s assessment area(s).
Community Development Service: A service that
(1) Has as its primary purpose community development;
(2) Is related to the provision of financial services; and
(3) Has not been considered in the evaluation of the bank’s retail banking services under
§ 345.24(d).
Consumer Loan(s): A loan(s) to one or more individuals for household, family, or other
personal expenditures. A consumer loan does not include a home mortgage, small business, or
small farm loan. This definition includes the following categories: motor vehicle loans, credit
card loans, home equity loans, other secured consumer loans, and other unsecured consumer
loans.
Distressed Middle-Income Nonmetropolitan Geographies: A nonmetropolitan middle-
income geography will be designated as distressed if it is in a county that meets one or more of
the following triggers:
(1) an unemployment rate of at least 1.5 times the national average;
(2) a poverty rate of 20 percent or more; or,

53
(3) a population loss of 10 percent or more between the previous and most recent
decennial census or a net migration loss of 5 percent or more over the 5-year period
preceding the most recent census.
Family: Includes a householder and one or more other persons living in the same household
who are related to the householder by birth, marriage, or adoption. The number of family
households always equals the number of families; however, a family household may also include
non-relatives living with the family. Families are classified by type as either a married-couple
family or other family. Other family is further classified into “male householder” (a family with
a male householder and no wife present) or “female householder” (a family with a female
householder and no husband present).
Family Income: Includes the income of all members of a family that are age 15 and older.
FFIEC-Estimated Income Data: The Federal Financial Institutions Examination Council
(FFIEC) issues annual estimates which update median family income from the metropolitan and
non-metropolitan areas. The FFIEC uses American Community Survey data and factors in
information from other sources to arrive at an annual estimate that more closely reflects current
economic conditions.
Full-Scope Review: Performance under the applicable tests is analyzed considering
performance context, quantitative factors (geographic loan distribution, borrower profile loan
distribution, and total number and dollar amount of investments), and qualitative factors
(innovativeness, complexity, and responsiveness).
Geography: A census tract delineated by the United States Bureau of the Census in the most
recent decennial census.
Home Mortgage Disclosure Act (HMDA): The statute that requires certain mortgage lenders
that do business or have banking offices in a metropolitan statistical area to file annual summary
reports of their mortgage lending activity. The reports include such data as the race, gender, and
the income of applicants; the amount of loan requested; and the disposition of the application
(approved, denied, and withdrawn).
Home Mortgage Disclosure Loan Application Register (HMDA LAR): The HMDA LARs
record all applications received for residential purchase, refinance, home improvement, and
temporary-to-permanent construction loans.
Home Mortgage Loans: Includes home purchase and home improvement loans as defined in
the HMDA regulation. This definition also includes multi-family (five or more families)
dwelling loans, loans to purchase manufactured homes, and refinancings of home improvement
and home purchase loans.
Household: Includes all persons occupying a housing unit. Persons not living in households are
classified as living in group quarters. In 100 percent tabulations, the count of households always
equals the count of occupied housing units.

54
Household Income: Includes the income of the householder and all other persons that are age
15 and older in the household, whether related to the householder or not. Because many
households are only one person, median household income is usually less than median family
income.
Housing Unit: Includes a house, an apartment, a mobile home, a group of rooms, or a single
room that is occupied as separate living quarters.
Limited-Scope Review: Performance under the applicable tests is analyzed using only
quantitative factors (for example, geographic loan distribution, borrower profile loan
distribution, total number and dollar amount of investments, and branch distribution).
Low-Income: Individual income that is less than 50 percent of the area median income, or a
median family income that is less than 50 percent in the case of a geography.
Low Income Housing Tax Credit: The Low-Income Housing Tax Credit Program is a housing
program contained within the Internal Revenue Code of 1986, as amended. It is administered by
the U.S. Department of the Treasury and the Internal Revenue Service. The U.S. Treasury
Department distributes low-income housing tax credits to housing credit agencies through the
Internal Revenue Service. The housing agencies allocate tax credits on a competitive basis.
Developers who acquire, rehabilitate, or construct low-income rental housing may keep their tax
credits. Or, they may sell them to corporations or investor groups, who, as owners of these
properties, will be able to reduce their own federal tax payments. The credit can be claimed
annually for ten consecutive years. For a project to be eligible, the developer must set aside a
specific percentage of units for occupancy by low-income residents. The set-aside requirement
remains throughout the compliance period, usually 30 years.
Market Share: The number of loans originated and purchased by the institution as a percentage
of the aggregate number of loans originated and purchased by all reporting lenders in the
metropolitan area/assessment area.
Median Income: The median income divides the income distribution into two equal parts, one
having incomes above the median and other having incomes below the median.
Metropolitan Division (MD): A county or group of counties within a CBSA that contain(s) an
urbanized area with a population of at least 2.5 million. A MD is one or more main/secondary
counties representing an employment center or centers, plus adjacent counties associated with
the main/secondary county or counties through commuting ties.
Metropolitan Statistical Area (MSA): CBSA associated with at least one urbanized area
having a population of at least 50,000. The MSA comprises the central county or counties or
equivalent entities containing the core, plus adjacent outlying counties having a high degree of
social and economic integration with the central county or counties as measured through
commuting.

55
Micropolitan Statistical Area: CBSA associated with at least one urbanized area having a
population of at least 10,000, but less than 50,000.
Middle-Income: Individual income that is at least 80 percent and less than 120 percent of the
area median income, or a median family income that is at least 80 and less than 120 percent in
the case of a geography.
Moderate-Income: Individual income that is at least 50 percent and less than 80 percent of the
area median income, or a median family income that is at least 50 and less than 80 percent in the
case of a geography.
Multi-family: Refers to a residential structure that contains five or more units.
Non-metropolitan Area: All areas outside of metropolitan areas. The definition of non-
metropolitan area is not consistent with the definition of rural areas. Urban and rural
classifications cut across the other hierarchies. For example, there is generally urban and rural
territory within metropolitan and non-metropolitan areas.
Owner-Occupied Units: Includes units occupied by the owner or co-owner, even if the unit has
not been fully paid for or is mortgaged.
Qualified Investment: A lawful investment, deposit, membership share, or grant that has as its
primary purpose community development.
Rated area: A rated area is a state or multistate metropolitan area. For an institution with
domestic branches in only one state, the institution’s CRA rating would be the state rating. If an
institution maintains domestic branches in more than one state, the institution will receive a
rating for each state in which those branches are located. If an institution maintains domestic
branches in two or more states within a multistate metropolitan area, the institution will receive a
rating for the multistate metropolitan area.
Rural Area: Territories, populations, and housing units that are not classified as urban.
Small Business Investment Company (SBIC): SBICs are privately-owned investment
companies which are licensed and regulated by the Small Business Administration (SBA).
SBICs provide long-term loans and/or venture capital to small firms. Because money for venture
or risk investments is difficult for small firms to obtain, SBA provides assistance to SBICs to
stimulate and supplement the flow of private equity and long-term loan funds to small
companies. Venture capitalists participate in the SBIC program to supplement their own private
capital with funds borrowed at favorable rates through SBA’s guarantee of SBIC debentures.
These SBIC debentures are then sold to private investors. An SBIC’s success is linked to the
growth and profitability of the companies that it finances. Therefore, some SBICs primarily
assist businesses with significant growth potential, such as new firms in innovative industries.
SBICs finance small firms by providing straight loans and/or equity-type investments. This kind
of financing gives them partial ownership of those businesses and the possibility of sharing in the
companies’ profits as they grow and prosper.

56
Small Business Loan: A loan included in “loans to small businesses” as defined in the
Consolidated Report of Condition and Income (Call Report). These loans have original amounts
of $1 million or less and are either secured by nonfarm nonresidential properties or are classified
as commercial and industrial loans.
Small Farm Loan: A loan included in “loans to small farms” as defined in the instructions for
preparation of the Consolidated Report of Condition and Income (Call Report). These loans
have original amounts of $500,000 or less and are either secured by farmland, including farm
residential and other improvements, or are classified as loans to finance agricultural production
and other loans to farmers.
Underserved middle-income nonmetropolitan geographies: A nonmetropolitan middle-
income geography will be designated as underserved if it meets criteria for
Population size, density, and dispersion indicating the area’s population is sufficiently
small, thin, and
Distant from a population center that the tract is likely to have difficulty financing the
fixed costs of meeting essential community needs.
Upper-Income: Individual income that is more than 120 percent of the area median income, or
a median family income that is more than 120 percent in the case of a geography.
Urban Area: All territories, populations, and housing units in urbanized areas and in places of
2,500 or more persons outside urbanized areas. More specifically, “urban” consists of territory,
persons, and housing units in places of 2,500 or more persons incorporated as cities, villages,
boroughs (except in Alaska and New York), and towns (except in the New England states, New
York, and Wisconsin).
“Urban” excludes the rural portions of “extended cities”; census designated place of 2,500 or
more persons; and other territory, incorporated or unincorporated, including in urbanized areas.

57
PERFORMANCE EVALUATION DISCLOSURE GUIDE
Massachusetts General Laws Chapter 167, Section 14, as amended, and the Uniform
Interagency Community Reinvestment Act (CRA) Guidelines for Disclosure of Written
Evaluations, and Part 345 of the Federal Deposit Insurance Corporation’s Rules and
Regulations, require all financial institutions to take the following actions within 30 business
days of receipt of the CRA evaluation of their institution:
1) Make its most current CRA performance evaluation available to the public;
2) At a minimum, place the evaluation in the institution's CRA public file located at the
head office and at a designated office in each assessment area;
3) Add the following language to the institution's required CRA public notice that is
posted in each depository facility:
"You may obtain the public section of our most recent CRA Performance Evaluation,
which was prepared by the Federal Deposit Insurance Corporation and the
Massachusetts Division of Banks, at 490 Turnpike Street, Canton, MA 02021.
[Please Note: If the institution has more than one assessment area, each office (other
than off-premises electronic deposit facilities) in that community shall also include
the address of the designated office for that assessment area.]
4) Provide a copy of its current evaluation to the public, upon request. In connection
with this, the institution is authorized to charge a fee which does not exceed the cost
of reproduction and mailing (if applicable).
The format and content of the institution's evaluation, as prepared by its supervisory
agencies, may not be altered or abridged in any manner. The institution is encouraged to
include its response to the evaluation in its CRA public file.