Embed Size (px)
Citation preview
Report No. 47639-GH
GHANA 2009 External Review of Public Expenditures and Financial Management (In two Volumes) Volume I – Main Report May 2009
PREM 4 Africa Region
Document of the World Bank
Pub
lic D
iscl
osur
e A
utho
rized
Pub
lic D
iscl
osur
e A
utho
rized
Pub
lic D
iscl
osur
e A
utho
rized
Pub
lic D
iscl
osur
e A
utho
rized

ii
CURRENCY EQUIVALENTS (Exchange Rate Effective as of May 7, 2009)
Currency Unit = Ghana Cedis GH¢1 = US$0.70 US$1 = GH¢1.42
FISCAL YEAR January 1 to December 31
WEIGHTS AND MEASURES Metric System
ACRONYMS AND ABBREVIATIONS
AFTFM Africa Financial Management AFTP4 Africa Poverty Reduction and Economic Management 4 AFTPC Africa Procurement AFTPR Africa Public Sector Reform and Capacity ARIC Audit Reports and Implementation Committees BFP Budget Framework Paper BPEMS Budget and Public Expenditure Management System CAGD Controller and Accountant General Department CF Consolidated Fund DACF District Assemblies Common Fund DANIDA Danish International Development Agency DEO District Education Officer DFID UK Department for International Development DHIS District Health Insurance Schemes ECG Electricity Company of Ghana ERPEFM External Review of Public Expenditures and Financial Management ERPFM External Review of Public Financial Management FAA Financial Administration Act GAS Ghana Audit Service GCAA Ghana Civil Aviation Authority GDP Gross Domestic Product GES Ghana Education Services GETF Ghana Education Trust Fund GHAPOHA Ghana Ports and Harbors Authority GNPC Ghana National Petroleum Company GoG Government of Ghana GPRA Ghana Petroleum Regulatory Authority GPRS II Ghana Growth and Poverty Reduction Strategy for 2006-2009 GTZ Gesellshaft für Technische Zusammenarbeit HIPC Heavily Indebted Poor Country IAA Internal Audit Agency IFMIS Integrated Financial Management and Information System IGF Internally Generated Funds IMF International Monetary Fund

iii
IPPD-2 Integrated Personnel and Payroll Database IRS Internal Revenue Service KFW Kreditanstalt für Wiederaufbau LPG Liquefied Petroleum Gas MDAs Ministries, Departments and Agencies MDBS Multi-Donor Budgetary Support MDGs Millennium Development Goals MDRI Multilateral Debt Relief Initiative MMDAs Metropolitan, Municipal, and District Assemblies MoF Ministry of Finance MoFEP Ministry of Finance and Economic Planning MOH Minister of Health MTEF Medium-Term Expenditure Framework MUV Manufactors Unit Value NDPC National Development Planning Committee NEPAD New Partnership for Africa‟s Development NHIC National Health Insurance Council NHIF National Health Insurance Fund NHIL National Health Insurance Levy NPA National Petroleum Authority OECD-DAC Organization for Economic Co-operation and Development – Development Assistance
Committee OHCS Office of the Head of Civil Service PAC Public Accounts Committee PEFA Public Expenditure and Financial Accountability PETS Public Expenditure Tracking Surveys PFAU Project and Financial Analysis Unit PFM Public Financial Management PIF Permanent Insurance Fund PPA Public Procurement Authority PPME PPA‟s Public Procurement Model of Excellence tool PPPSAR Public Policy, Planning and Administration, and Related Services PREM Poverty Reduction & Economic Management RAGB Revenue Agencies Governing Board RCCS Regional Coordination Councils SOE State Owned Enterprise SSNIT Social Security and National Insurance Trust ST&MT AP Short and Medium-Term Action Plan for PFM UNCITRAL United Nations Committee on International Trade Law VALCO Volta Aluminum Company VAT Value-Added Tax VRA Volta River Authority
Vice President: Country Director:
Sector Director: Sector Manager:
Task Team Leaders:
Obiageli K. Ezekwesili (AFRVP) Ishac Diwan (AFCW1) Sudhir Shetty (AFTPM) Antonella Bassani (AFTP4) Daniel Boakye (AFTP4) Carlos Cavalcanti (AFTP4)

iv

v
Republic of Ghana: 2009 External Review of Public Expenditures and Financial Management
Table of Contents
1. CHAPTER I: MACROECONOMIC DEVELOPMENTS AND PROSPECTS .................................... 17
A. INTRODUCTION AND RECENT DEVELOPMENTS ................................................................................................ 17 B. WHAT HAPPENED TO GHANAIAN PUBLIC FINANCES IN 2008? ........................................................................ 19 C. THE CHALLENGES AHEAD ............................................................................................................................. 25
Managing volatility ....................................................................................................................................................... 26 D. CONCLUSIONS AND RECOMMENDATIONS ....................................................................................................... 30
2. CHAPTER II: EXPENDITURE PATTERNS .......................................................................................... 33
A. INTRODUCTION .............................................................................................................................................. 33 B. EXPENDITURE PATTERNS ............................................................................................................................... 34
Sectoral distribution of expenditures ............................................................................................................................ 34 The distribution of expenditure by economic categories ............................................................................................... 38
C. TRANSFERS TO SUBNATIONAL LEVELS OF GOVERNMENT ............................................................................... 50 D. CONCLUSIONS AND RECOMMENDATIONS ....................................................................................................... 55
Improving Public Expenditure Patterns ........................................................................................................................ 55 Ensuring that Subnational Transfers Achieve their Desired Objectives ....................................................................... 56
3. CHAPTER III: STRENGTHENING THE SYSTEMS FOR PUBLIC EXPENDITURES AND FINANCIAL MANAGEMENT ............................................................................................................................... 58
A. INTRODUCTION .............................................................................................................................................. 58 B. SHORT AND MEDIUM TERM ACTION PROGRAM (SMTAP) ............................................................................ 59 C. FINANCIAL REGULATORY AND MANAGEMENT FRAMEWORK ........................................................................ 60 D. BPEMS .......................................................................................................................................................... 61 D. IPPD-2 AND MANAGING THE WAGE BILL...................................................................................................... 63 E. INTERNAL AND EXTERNAL AUDIT .................................................................................................................. 64 F. PUBLIC PROCUREMENT .................................................................................................................................. 66 G. DEBT MANAGEMENT ..................................................................................................................................... 68 H. CONCLUSIONS AND RECOMMENDATIONS ....................................................................................................... 69
4. CHAPTER IV: STRENGTHENING THE STRATEGIC ROLE OF THE BUDGET ......................... 72
A. INTRODUCTION .............................................................................................................................................. 72 B. CURRENT BUDGET PREPARATION PROCESS ................................................................................................... 72 C. AN ASSESSMENT OF THE CURRENT BUDGET PREPARATION PRACTICES ........................................................ 75
Medium Term Perspective to Budgetary Planning ........................................................................................................ 75 Realistic and Credible Macro-fiscal Resource Framework .......................................................................................... 76 Linkage of Sectoral Allocations to Government Policies .............................................................................................. 77
D. MAKING THE MTEF MORE OPERATIONAL ...................................................................................................... 78 Increasing the Political Commitment to the MTEF/Budget Process ............................................................................. 79
E. CONCLUSIONS AND RECOMMENDATIONS ....................................................................................................... 82

vi
Tables: Table 1.1: Summary of Central Government Budget Operations, 2000-2008 ............................................ 17 Table 1.2: Central Government Budget Operations, 2007-2008 ................................................................ 22 Table 1.3: The Financing of Government Operations- 2007- 2008 ........................................................... 24 Table 1.4: Composition of Domestic Public Debt 2007-2008 .................................................................... 25 Table 1.5: Fiscal Adjustment Scenarios with Full and Partial Transmission of Revenues from Crude Oil Exploration, 2009-2015 .............................................................................................................................. 28 Table 2.1: Economic Classification of Central Government Expenditures: 2000-2008 ............................. 40 Table 2.3: Decomposition of the Increase in Payroll, Overall Public Sector and Selected Services, 2008 (%) .............................................................................................................................................................. 44 Table 2.4: Ghana recurrent fiscal balance, 2005-08 ................................................................................... 47 Table 2.5: Annual Real Earnings across Employment Status in Age group 25-64 .................................... 48 Table 2.6: Cross-Country Comparison of the Public Sector Wage Bill, 2008 (%) .................................... 52 Table 2.7: Relative Shares of Per Capita Transfers to the Regions by Source of Funding, 2006 (% share, unless otherwise noted) ............................................................................................................................... 52 Figures: Figure 1.1: Central Government Revenues, including Grants from Development Partners, Actual 2007 vs. Estimate 2008 ........................................................................................................................................ 19 Figure 1.2: Ratio of Import Tax Revenues-to- Merchandise Imports, 1993-2008 (%)............................... 20 Figure 1.3: Central Government Expenditures, 2007 Actual vs. 2008 Estimate ....................................... 20 Figure 1.4: Composition of Short Term Debt, 2007-2008 .......................................................................... 24 Figure 1.5: Growth in Short Term Public Debt and Inflation, March to September 2008 (%) ................... 29 Figure 1.6: Time Series for Manufactures Unit Value (MUV) and Crude Oil Price Indices, 1962-2005 . 28 Figure 2.1: 2008 Overall Budget Allocations and Expenditure Outcomes, including Statutory Funds, HIPC MDRI, IGFs and Donor Funds ......................................................................................................... 35 Figure 2.2: Budget execution rates for Overall Government of Ghana Expenditures and Key Expenditure Programs, 2008 (%)Figure 2.8: Source of Public Sector Financing, 2000 to 2008) Figure 2.3: 2007 Overall Budget Allocations and Expenditure Outcomes, including Statutory Funds, HIPC MDRI, IGFs and Donor Funds …………………………………………………………………….38 Figure 2.4: Economic Distribution of Government Expenditures between Statutory and Discretionary Payments, 2000-2008 .................................................................................................................................. 39 Figure 2.5: Domestically-financed capital expenditures, 2000-2008 ......................................................... 42 Figure 2.6: Public Sector Revenue Sources, 2000 to end-September 2008 ................................................ 43 Figure 2.7: Education Sector Wages, 2000-2008 (in US$ equivalent) ………………………………..….47 Figure 2.8: The ratios of Public Sector Wage Bill to Overall Expenditures, in Domestic Revenues and in Recurrent Expenditures, 2000 to 2008 ........................................................................................................ 46 Figure 2.9: Source of Public Sector Financing, 2000 to 2008……….. ...................................................... 47 Figure 2.10: Total transfers and population shares, 2006 ........................................................................... 51
Boxes: Box 1.1: Oil Funds ...................................................................................................................................... 29 Box 3.1: Progress in implementing the public financial management recommendations in last year‟s External Review .......................................................................................................................................... 71 Box 4.1: Budget Preparation Timetable ...................................................................................................... 75 Box A4.1: Progress in implementing the budgeting recommendations in last year‟s External Review ..... 85

vii
PREFACE The study is based on the research findings and interviews conducted by the ERPEFM team working on Ghana.1 The team wishes to thank the Government of Ghana for the excellent cooperation received from its senior government officials in the Ministry of Finance and Economic Planning. Daniel Boakye and Carlos Cavalcanti were the Task Team Leaders for this report, with contributions provide by Mmes. Mary Betley and Xiao Ye, and Messrs. Marcelo Andrade, Michael Stevens, Ross Worthington, Smile Kwawukume, and Winston Cole. The peer reviewers for this report were Bill Dorotinsky, Lead Public Sector Specialist (ECSPE) and David Nguyen-Thanh, Senior Economist (GTZ Ghana). Useful comments were provided by Sergiy Kulyk (AFCGH); Sebastien Dessus (AFTP4), Ruud-vander Helm, (Dutch Embassy in Accra); Paavo Eliste (AFTAR); and Caroline Ly (AFTH2). Glaucia Ferreira, Program Assistant, helped process this report. The report was prepared under the guidance of Sudhir Shetty, Sector Director, AFTPM, Antonella Bassani, Sector Manager, AFTP4, Ishac Diwan, Country Director, AFCW1, and Katherine Bain, Country Program Manager, AFCW1.
1 The ERPEFM team was led by the World Bank and included specialists supported by the Danish International Development Agency (DANIDA), by the UK Department for International Development (DfID) and by the German Kreditanstalt für Wiederaufbau (KFW).

viii
GHANA ERPFM 2009
Executive Summary
1. The 2009 External Review of Public Expenditures and Financial Management (ERPEFM) is the fifth in a series of annual assessments by some of the development agencies that contribute to the Multi-Donor Budgetary Support in Ghana. The review was prepared in close collaboration and after extensive discussions with senior government officials in the Government of Ghana, in particular with officials from the Ministry of Finance and Economic Planning. The main purpose of the review is to inform – based on research findings – the policy dialogue on public financial management that takes place in Ghana.
2. The implementation of the 2009 budget is happening against the backdrop of the Government’s stated objective of reducing the overall fiscal deficit to 9.4 percent of GDP, down from an estimated 14.5 percent in 2008. Achieving this objective will require the reprioritization of budgetary allocations, renewed efforts in public financial management reforms and the adoption of a strategic budgeting process based on a more effective Medium-Term Expenditure Framework. As the budget now stands, expenditure allocations are increasingly constrained, with obligations on wages and salaries accounting for well over 40 percent of domestic revenues. In the meantime, inflation expectations have become entrenched, with the consumer price index reaching 20.6 percent in April.
3. Under these circumstances, how the government achieves the planned fiscal adjustment is as important as the fiscal target to be achieved itself. There are three reasons why:
If the fiscal adjustment is reached by either raising tax collections or, more importantly, by reducing expenditures, the adjustment will not lead to a further acceleration in inflation. If however the fiscal adjustment is reached by allowing inflation to erode the value of expenditures, inflation expectations will become more entrenched, leading to further upward adjustments in public sector pay as well as to increases in public debt service, both of which will ultimately end up crowing out other expenditure priorities.
Because of the ongoing global financial crisis, Ghana will have to rely more heavily on domestic financing sources to close the expected fiscal gap. In an environment of increased uncertainty and rising inflation, there has been a shortening in the maturities of the domestic debt, exacerbating the quasi-money characteristics of these domestic debt instruments. Excessive reliance on the domestic debt market to finance the fiscal gap however will crowd out credit to the private sector and dampen the country‟s growth prospects.
The fiscal adjustment should avoid having a lasting negative effect on the country’s economic prospects over the medium term. For instance, if expenditure cuts fall disproportionally on the cost of running public services (other than wages and salaries) and on public investment, with a view to protect public sector wages and salaries, the price to be paid is likely to be slower progress in the achievement of the MDGs.

ix
4. The remainder of this executive summary outlines a policy agenda aimed at increasing control over government expenditures and at improving the efficiency of the budget process. The policy agenda for increasing control over government expenditures is centered on actions aimed at increasing control over public sector wages and salaries, although it also calls for enforcing fiscal discipline in the provision of energy sector subsidies, and for ensuring oversight in granting of tax exemptions. This policy agenda stems from the need to achieve a better balance between salary and non-salary expenditures, especially in the education and the health sectors. At present, recurrent expenditures in the education sector add to 5.5 percent of GDP, with wages and salaries absorbing almost the totality of these expenditures, leaving less than six percent of all budgeted expenditures for non-salary recurrent expenditures. This imbalance means that very few resources are available for expenditure such as textbooks and teaching materials. This problem is compounded by the unequal distribution of staff across regions. Since the ratio of teachers per pupil is lower in deprived regions, this means that deprived districts also receive limited resources for other needed expenditures. Similarly, 70 percent of all recurrent expenditures in the health sector go toward wages and salaries, leaving limited resources for needed expenditures on pharmaceutical drugs and the other running expenditures in hospital and clinics.
5. A policy agenda for greater control over expenditures needs to recognize that, while there is urgency in dealing with the fiscal deficit problem, particularly because of its inflationary consequences, there are no easy solutions. Addressing the deficit problem will require actions on several fronts. Critical actions include the following:
Getting a firmer grip on the wage bill. The trend in recent years of an ever rising wage bill needs to be contained because it is fiscally unsustainable. The solution lies with better government pay determination systems, and by relating MDA decisions on staffing to their cost through a more effective MTEF and annual budget process. Actions to be considered include: (i) ensuring a better balance between salary and non-salary expenditures, initially by placing a cap on public sector wages increases and then by strengthening the enforcement mechanism of expenditure limits; (ii) completing the public sector wage negotiations before the budget for the next fiscal year is finalized; (iii) strengthening oversight of records regarding the entrance, exit and the transfers of employees into the payroll system beyond what the legal requirements stipulate, since at present neither the records of employees who exit employment are promptly removed from the system, nor are records quickly updated to reflect transfers within the public sector; (iv) strengthening the payroll management and control system (IPPD-2) by upgrading the software, and then integrating it with BPEMS, completing its rollout to all MDAs, and setting up an information back-up system; and (v) establishing a payroll information database that provides comparability of staff strengths and pay across all sectors. These actions would help MoF regain control over pay determination, aid in annual public sector wage negotiations, and bring expenditures on personnel emoluments into a reformed MTEF, allowing annual budgeting to be subjected to realistic medium term ceilings.

x
Enforcing greater fiscal discipline is the provision of energy sector subsidies by implementing the automatic adjustment mechanism for utility tariffs, which would be triggered any time crude oil prices rise or fall by 5 percent, or there is an equivalent adjustment in the exchange rate.2 At present, energy sector subsidies aim at compensating the power generation company – the Volta River Authority – for below-cost recovery bulk supply tariffs by purchasing directly crude oil cargos to run the thermo-power generation plans. In 2008 these subsidies are estimated to have reached 3 percent of GDP. While there is expectation that the overall size of these subsidies will decline in line with lower crude oil prices, the exact cost of these subsidies in the future is uncertain. These subsidies remain open-ended since it is expected that the government will always cover the difference between the revenues from bulk supply tariffs and the actual costs of power generation by purchasing crude oil cargos directly. Because there was a steep decline in crude oil prices in the last quarter of 2008, this is the ideal time to re-introduce the automatic adjustment mechanism for utility tariffs, which would provide greater predictability to the budget by closing the open-endedness of the current utility subsidy scheme. More importantly, the automatic adjustment mechanism would help close the revenue gap at a time when the Government faces a tight budget constraint and can no longer afford to allow utility tariffs to fall below cost-recovery levels.
Ensuring greater oversight of tax exemptions. The cost of tax exemptions in 2008 is estimated to have added to 2.3 percent of GDP, or just under 9 percent of overall tax revenues. For efficiency and budgetary reasons, the authorities need to better enforce import tax obligations by allowing tax exemptions granted last year to expire, by improving import inspection and by closing remaining loopholes in the tax legislation that allow certain imports to enter the country duty free.
6. A policy agenda for improving the efficiency of budgetary operations needs to recognize that, while there is urgency in dealing with some of the problems, such as the public procurement practices and the Government’s Budget and Public Expenditure Management System (BPEMS), solutions will take time and require actions on several fronts. Some of these actions include the following:
Developing a reporting system that can trace the amounts transferred within and amongst the different levels of government, their quantities, and the dates and units of these resource flows (either financial or in-kind), with the objective of improving their accuracy and timing. In several instances, bottlenecks in the transfer of funds meant that these transfers arrived late and in insufficient amounts.
Preparing and making available on the Ministry of Finance and Economic Planning’s webpage timely budget execution reports to assist in monitoring overall budget implementation, as well as the implementation of individual expenditure programs. These actions should assist in ensuring that expenditure programs are neither crowded out by other programs, nor exceed originally budgeted amounts.
2 The latter is important because utility tariffs are set in Ghana cedis, while crude oil imports are paid in dollars, and crude oil is an essential input for thermal electricity production (electricity in turn accounts for around one-third of the cost of water production).

xi
Strengthening the Medium Term Expenditure Framework (MTEF), aiming at making the budgeting process more strategic. A revamped MTEF would facilitate in the short term management of the current fiscal adjustment and assist in the management of oil and gas revenues when they begin flowing in late 2010/early 2011. For this to happen, the MTEF needs to be placed at the center of policy making and the annual budgeting process by ensuring that it is comprehensive of all categories of spending, in particular personal emoluments. Also, early Cabinet endorsement of the aggregate fiscal strategy, and sector/MDA resource envelopes outlined in the budget guidelines, should be obtained through a Budget Framework Paper. This paper would be discussed at the start of the budget preparation cycle, allowing budget ceilings to be hardened, the scope for the fiscal adjustment to be minimized, the program formats simplified, and the budget performance information to be made more relevant.
Improving the screening of public investment proposals by requiring that investment project selection be guided by clearly defined priorities, and the preparation of pre-feasibility studies (including the calculation of net present social value using either cost-benefits or minimal costs analysis). These steps should allow funds to flow on the margin to projects with the highest rate of return or the lowest cost of delivery to beneficiaries.
7. In parallel, proposed actions for an across-the-board strengthening of public financial management systems include:
Ensuring that the provisions of the Public Procurement Act are applied. The information from the 2007 National Public Procurement Assessment that only about one-quarter of public procurement is subject to open, competitive bidding on a transactions basis indicates that additional efforts are needed to ensure that the provisions of the Public Procurement Act are applied, so that public resources are used efficiently. While this External Review endorses the systematic monitoring of entity performance regularly undertaken by the Public Procurement Authority (PPA), the performance monitoring reports need to be adjusted to measure open competitive procurement by value, not just by transaction, as done at present. Also, to certify that the provisions of the Act are applied, budget releases by the CAGD need to be made contingent on the submission by the MDAs of updated public procurement plans that are consistent with the Parliament-approved budget Appropriations Act.
Re-launching the government’s Budget and Expenditure Management System (BPEMS), using an updated and unmodified version of Oracle Financials, in combination with the Oracle Human Capital Management module to manage the payroll through an upgraded Integrated Payroll and Personnel Database (IPPD-2). A decision on the next steps for the implementation of BPEMS, and its alignment with IPPD-2, is urgently needed because the system is now in its tenth year of implementation, and, despite many efforts to roll it out, currently only a fraction of expenditures are processed through the system. The system continues to operate far below its potential, and, at the present roll-out rate, it will be obsolete by the time the roll-out is completed. Recommended next steps include the preparation of an implementation plan, the re-establishment of the BPEMS Project Steering Committee (PSC), the appointment of an

xii
overall BPEMS Project Manager with task team managers for the various modules, and the adoption of the Public Sector Budgeting (PSB) module in BPEMS for budget preparation.
Re-doubling the efforts to introduce modern internal and external audit functions. At present, the implementation of the 2003 Internal Audit Agency (IAA) Act is proceeding slowly, since there are difficulties in recruiting suitable professional staff for this function. The re-orientation of the internal audit function, as outlined in the Act is hampered also by the retention of traditional pre-audit functions in the BPEMS‟ business processes, as well as by the current budget incentives, which do little to build demand for modern control processes within government. Actions are needed on these two fronts, therefore, namely the creation of a special scheme of service for internal auditors to attract qualified professional staff for the function, the setting up and operationalization of the financial tribunal, and the re-orientation of the internal audit function from pre-payment audit towards the adoption of risk based audit, concentrating on systemic issues. Meanwhile, progress in strengthening the external audit functions has been positive but not without controversy. While the CAGD has submitted the public accounts report to the Auditor General within the legally established timeframe (end-March), and the backlog of delayed audits has been reduced, the subsequent step (the presentation of the Auditor General‟s report to Parliament) was not completed last year. The Speaker of Parliament did not recognize the mandate of the current Auditor General, arguing that his mandate had already expired. The issue has since been referred to the courts for a resolution. This disagreement between the Auditor General and Parliament should not be seen as an impediment for establishing greater synergy between the internal and external audit functions at the operational level, however. Furthermore, this External Review recommends that the external audit work performed by the Ghana Audit Service (GAS) rely on the work of the Internal Audit Agency (IAA) whenever the standards adopted by the latter are deemed to be sufficiently robust.
Continuing to improve Ghana’s debt management capacity. Although the Ghanaian debt management is regarded as one of the best in sub-Saharan Africa, with only moderate debt reporting problems, there is still room for improvements. Elements of debt management operations that are assessed as performing particularly well include: (i) coordination with fiscal policy; (ii) the analysis of the terms and conditions of potential external borrowing opportunities; and (iii) the recording and reporting of total public debt, all of which is underpinned by a sound legal framework. Identified areas for improvement include: (i) cash flow forecasting and cash management, and (ii) the publication and updating of a medium term debt management strategy.
8. Lastly, to strengthen the budget’s institutional framework for the time when oil and gas exploration revenues begin flowing, the Ghanaian authorities should proceed with:
Finalizing the drafting and submitting to Parliament the new Fiscal Responsibility Legislation (FRL). A FRL could make mandatory the publication of a rolling medium term fiscal strategy linked to a medium term debt management strategy.
Making statutory the arrangements for managing oil and gas revenues.

xiii
9. A draft Ghana Petroleum Regulatory Authority (GPRA) bill is currently being reviewed by the office of the Attorney General. The proposed bill aims at: (i) establishing the Ghana Petroleum Regulatory Authority (GPRA); (ii) defining the future role of the Ghana National Petroleum Company (GNPC) as a commercial entity; (iii) outlining the fiscal regime for petroleum and gas revenues; and (iv) determining the revenue information disclosure obligations of the GPRA and other government agencies. Since extensive comments on the proposed bill have been provided in the Bank in a separate letter to Government, this External Review focuses on the two issues in the draft bill related to the fiscal regime. First, the draft bill envisions a minimum 10 percent of gross petroleum production royalty rate, which is at variance with the advice provided by the Government team working separately on the petroleum fiscal regime, thus creating a certain degree of uncertainty. Second, many of the other elements of the fiscal regime are deferred to the forthcoming Internal Revenue Amendment bill and a Model Petroleum Agreement. It would be useful therefore to clarify these two points before proceeding with the submission of the bill.
10. There are two other issues that need to be considered before finalizing the draft Fiscal Responsibility Bill and the draft Ghana Petroleum Authority Regulatory Bill:
How to minimize the volatility inherent in oil price fluctuations? This External Review proposes a Permanent Income Fund to be established with the revenues from oil and gas exploration assigned to the State, whereby only the interest income on the accumulated assets of the Fund would be channeled into the budget.
How to ensure that the revenues from oil and gas are effectively used? First, efforts to improve PFM systems need to be accelerated to enhance the country‟s absorptive capacity for increased revenues. Second, the establishment of the Permanent Income Fund (PIF) would ensure regular reporting to Parliament as part of the annual account of the implementation of the budget. Third, the Permanent Income Fund (PIF) would need to be subject to regular audits by an independent external agency, with the evaluation of its investment strategy and the return on assets achieved. Lastly, the finalization and adoption of the draft Freedom of Information Bill, which would spell out the qualifications and conditions under which one could access official information held by government and government agencies, would provide the opportunity for civil society to seek the information needed to increase its oversight of the use of these revenues. The Cabinet is reviewing the draft Freedom of Information Bill and this Review recommends its rapid adoption. This legislation would complement Ghana‟s agenda under the Extractive Industries Transparency Initiative (EITI), which endeavors to ensure the efficient and sustainable use of revenues accruing to Government from mining activities.

xiv
11. Although this policy agenda is ambitious, and in some cases will take time to implement, the challenge for Ghanaian policymakers is to seize the opportunity created by the current fiscal crunch to implement it. While attention should focus initially on containing expenditures, if expenditure containment is not followed swiftly by actions aimed at ensuring better use of public resources, the delay will compromise the very goal that the new Government has been elected to achieve in the first place – better delivery of public services to the people.
Table A: ERPEFM 2008 - Proposed Key Measures and Sequencing
Challenges identified by the ERPEFM Recommendation Sequencing
Short term
Medium Term
Ensure that the fiscal policy supports macroeconomic stabilization
Enforce greater fiscal discipline in the provision of energy sector subsidies
Re-establish the utility tariff automatic adjustment mechanism. X
Strengthen budget formulation
Broaden the comprehensiveness of the MTEF
Ensure that the MTEF is as comprehensive as the macroeconomic framework used for the annual budget.
X
Ensure commitment to agreed budget ceilings early in the budget process
Introduce a Budget Framework Paper (BFP) early in the budget preparation cycle to encourage dialogue and consensus on budget priorities, and then obtain Cabinet endorsement of the BFP of MoF‟s medium term spending ceilings.
X
Improve public investment project selection
Screen public investment proposals by requiring that the project selection be guided by clearly defined priorities, and the preparation of pre-feasibility studies, including the calculation of net present social value using either cost-benefits or minimal cost analysis.
X
Strengthen budget execution
Ensure that public procurement rules are applied
Ensure that budget releases by CAGD are consistent with procurement plans that reflect the Parliament approved budget appropriations act.
X
Monitor the proportion of public procurement that is open and competitive by value, as well as by transaction.
X
Ensure that expenditure programs are neither crowded out by other programs, nor exceed originally budgeted amounts
Preparing and making available on the Ministry of Finance and Economic Planning‟s webpage timely budget execution reports to assist in monitoring overall budget implementation, as well as the implementation of individual expenditure programs.
X

xv
Challenges identified by the ERPEFM Recommendation Sequencing
Short term
Medium Term
Strengthen budget reporting
Re-launch the Government‟s Computerized Financial and Accounting Information Systems (BPEMS)
Use an updated and unmodified version of Oracle Financials, which would include a human resource module to manage the payroll. An upgrated BPEMS should provide budget reports, including regular in-year budget reports, and assist in enforcing budget execution.
X
Improve financial reporting of public expenditures at the subnational levels of government
Consolidate and simplify the financial reporting at the subnational levels of government, so as to ensure regular and timely information on public expenditures at these levels.
X
Strengthen internal auditing
Increase auditing of public accounts Shift the focus of internal auditiong from pre-payment auditing to risk-based auditing, concentrating on systemic issues. The objective should be to ensure: (i) conformity to the Government‟s strategy; (ii) effectiveness and efficiency of operations; (iii) reliability of financial reporting; and (iv) compliance with applicable laws and regulations.
X
Strengthen payroll management and control
Improve controls over payroll records Strengthen oversight of records regarding the entrance, exit and the transfers of employees in the payroll system.
X
Improve payroll planning
Complete annual public sector wage negotiations before the beginning of the financial year, incorporating the results of these negotitations in the annual budget.
X
Develop a payroll modeling software that can generate projections of annual and medium term payroll requirements.
X
Strengthen payroll management Complete the IPPD-2 roll out, strengthening the information back-up system, and integrate the HR and payroll system better within an upgraded BPEMS.
X
Reduce payroll overruns Establish a better link between staffing decisions and their costs in the annual budget and the MTEF processes.
X
Ensure that transfers to subnational levels of government achieve their desired objectives
Avoid delays in the delivery of transfers to subnational levels of governments
Develop a reporting system that can easily track transfers to subnational levels of government -- the amount, the quantities, the dates and the unit of resource flows (either financial or in-kind).
X

xvi
Improve monitoring, downward transparency and accountability in government transfers
Regularly disseminate and display in public domains critical information regarding intra-governmental transfers (e.g., Education Capitation Grants, DACF funds). Consolidate and simplify the financial reporting by subnational levels of government so as to ensure regular and timely reporting on expenditure undertaken at the regional and district levels of government; also, encourage development partners to institute a single, consolidated and simple financial report on aid-funded expenditures at subnational levels of government.
X
Enhance fiscal discipline and transparency
Enhance aggregate fiscal discipline and transparency
Submit to Parliament a Fiscal Responsibility Bill, using it to strengthen PFM transparency and accountability, including regular and timely publication of the budget execution reports and of the MTFF, linked to a medium-term debt strategy. Finalize and submit to Parliament the draft Freedom of Information Bill, which aims at spelling out the qualifications and conditions under which the public could access official information held by government and government agencies.
X
X
Ensure transparency in the management of oil and gas revenues
Finalize the drafting of the Ghana Petroleum Regulatory Authority Bill and submit it to Parliament.
X
Ensure accountability in the management of oil and gas revenues
Revenues from oil and gas should be audited by an independent external agency, with the evaluation of its investment strategy and the return on assets achieved.
X
Maintain the momentum of public financial management reforms
Establish new baseline to measure progress on PFM reforms
Conduct a new PEFA assessment to review PFM developments since 2006 and establish a new baseline to measure progress of PFM reforms in the coming years.
X
Issue the next (2010-13) Short and Medium Term Action Plan (SMTAP) for Public Financial Management (PFM)
The SMTAP should remain the guide of public sector efforts in the PFM area. While there might be shifts in emphasis in the next SMTAP, the key issues should not change, with the thrust of the reform agenda focused on strengthening public procurement practices, the implementation of an upgraded BPEMS and IPPD-2, integrating the MTEF into the IFMIS, and completing the Treasury realignment.
X
Note: Short term – implementation this fiscal year. Medium-Term – next fiscal year.

- 17 -
CHAPTER I: MACROECONOMIC DEVELOPMENTS AND PROSPECTS
A. INTRODUCTION AND RECENT DEVELOPMENTS
1.1 Ghana is implementing its 2009 budget against the backdrop of a macroeconomic situation that has changed considerably over the last 12 months. Estimates of the end-2008 fiscal deficit are in the 14.5 percent of GDP range, up from the already high deficit of 9.2 percent of GDP in 2007. Meanwhile, inflation reached 20.6 percent in April, up from 12.7 percent in December 2007 and, in response to rising inflation and shrinking available financing, interest rates on 91-day Treasury Bills have shot up to over 25 percent from around 10 percent at end-2007.
1.2 These developments reflect the large twin deficits (fiscal and balance of payments) that were allowed to build up in recent years. The rise in the fiscal deficit began already in 2006 as public expenditures increased faster than revenue collection, leading ultimately to a 12 percentage point widening of the fiscal deficit, as the deficit rose from 3.0 percent of GDP in 2005 to an estimated 14.5 in 2008. This widening of the fiscal deficit has been triggered by a large increase of the wage bill, as well as an expansion of public investments and, more recently, additional interest rate payments to match the recent debt build up. Public sector wage bill now accounts for 11.3 percent of GDP, up from under 7 percent at the beginning of this decade, notwithstanding the rapid real GDP growth rate during this period. Meanwhile, public investments rose to over 15 percent of GDP, and interest payments on domestic debt, which had began declining in the aftermath of two rounds of external debt relief (HIPC and MDRI), began rising again in 2008, reaching just under 4 percent of GDP in 2008, up by almost one-quarter over 2007 figures. These developments are important because, while this one-time increase in investment expenditures will not be repeated in 2009, recurrent expenditures, which increased by almost 12 percent in 2008, will be more difficult to contain in the future.
Table 1.1: Summary of Central Government Budget Operations, 2000-2008
(% of GDP, unless otherwise noted)
2000 2001 2002 2003 2004 2005 2006 2007 2008
Total revenues 19.8 25.0 22.3 24.9 28.7 27.1 27.3 28.8 27.4 Expenditures 29.5 34.0 29.1 29.3 32.3 30.1 34.8 37.2 40.9 of which:
Wages and salaries (W&S) 6.9 6.9 8.5 8.4 8.7 8.9 9.7 10.1 11.3 Goods and services (G&S) 2.6 2.6 3.0 3.1 3.0 2.7 3.7 4.0 3.7 Subsidies 0.0 0.0 1.0 0.6 2.8 0.8 2.6 1.6 3.0 Interest 7.5 7.8 6.1 6.2 4.3 3.6 3.4 3.1 3.8 Capital expenditures 9.3 13.5 6.1 7.9 10.0 10.8 10.0 14.3 15.6 Other 3.2 3.2 4.4 3.0 3.4 3.3 5.3 4.0 5.6 Overall balance -9.7 -9.0 -6.8 -4.4 -3.6 -3.0 -7.5 -9.2 -14.5 Memo:
G&S/W&S (%) 37.5 37.6 35.1 37.1 34.6 29.7 38.4 40.0 32.6 Source: Ghanaian authorities.
1.3 This expansionary fiscal policy contributed in turn to the widening of the balance of payments current account deficit, with this external deficit rising to an estimated 20 percent of GDP in 2008, up from around an already high 11 percent in 2007. The widening of the current account deficit was to a large extent the spillover effect of the increase in the

- 18 -
public sector deficit as the increase in domestic demand placed additional demands on foreign savings. Also, the combination of strong domestic activity and the crude oil and food prices shocks led to a surge in imports that contributed to weakening the country‟s external position. Meanwhile, the capital account shouldered most of the shock from the global financial crisis. Following the opening up of the market in late 2006, non-residents were bringing in more than 2 percent of GDP (buying the new 3-5 years government bonds) annually. By September 2008, however, inflows had collapsed and turned to outflows, as investors liquidated existing positions and repatriated their capital (leading to an estimated 2 percent of GDP shortfall with respect to expected inflows). As a result, foreign reserves are now estimated to have closed March 2009 at around 1.5 months of imports of goods and services (US$1.7 billion), down from 2.7 months (US$2.8 billion) at end-2007. The decline in reserves led in turn to the sharp depreciation of the cedis-dollar exchange rate, which lost over one-quarter of its value in 2008 alone. As a result, external financing is now more costly, in addition to being scarcer. Further currency depreciations will only increase the cost of servicing existing external debts, while the reliance on the domestic debt market will crowd out credit to the private sector.
1.4 Understanding these developments is important because they are set to drive the execution of the 2009 budget and beyond. The new administration has already signaled a reduction in the targeted overall fiscal deficit to 9.4 percent of GDP, as a first step in a multi-year fiscal adjustment program. Amongst the measures announced, there are (i) improvements in revenue collection; (ii) the positive impact of lower crude oil prices and good rains on the cost of electricity generation, leading to a reduction in implicit electricity subsidies; (iii) reductions in domestically-financed public investments;3 and (iv) the strengthening of public financial management systems, such as the introduction of a single treasury account. Reducing the remaining fiscal deficit will take time because of structural rigidities in recurrent expenditures that reflect the size of the Ghanaian public sector and the practice of earmarking expenditures. In this context, the proposed fiscal adjustment plan is important for three reasons. First, how the government achieves the fiscal adjustment is as important as the fiscal target to be achieved itself. In case the fiscal adjustment is reached by either raising tax collections or, more importantly, by reducing expenditures, the adjustment should not lead to a further acceleration in inflation. If however the fiscal adjustment is reached by allowing inflation to erode the value of expenditures, inflation expectations will become more entrenched, leading to further upward adjustments in public sector pay as well as to increases in public debt service, both of which will ultimately end up crowing out other expenditure priorities. Second, because of the ongoing global financial crisis, Ghana will have to rely more heavily on domestic financing sources to close the expected fiscal gap. In an environment of increased uncertainty and rising inflation, there has been a shortening in the maturities of the domestic debt, exacerbating the quasi-money characteristics of these domestic debt instruments. Third, the fiscal adjustment should avoid having a lasting negative effect on the country‟s economic prospects over the medium term. For instance, if expenditure cuts fall disproportionally on the cost of running public services (other than wages and salaries) and on public investment, with a view to protect public sector wages and salaries, the price to be paid is likely to be slower progress in the achievement of the MDGs.
3 On April 1, 2009, the ex-pump prices of petrol, LPG, Marine Gas Oil and diesel were revised upwards in line with increases in crude oil prices on the world market. Petrol prices were increased by 10 percent whilst Liquefied Petroleum Gas (LPG), diesel and Marine Gas Oil prices rose by 5.2 and 2 percent, respectively. There were no changes to the price of kerosene and premium fuel.

- 19 -
1.5 The remainder of this chapter is organized as follows. Section B recapitulates the change in Ghanaian public finances in 2008. Section C discusses the country‟s fiscal outlook and the policy challenges ahead. Section D closes the chapter with the main conclusions and recommendations.
B. WHAT HAPPENED TO GHANAIAN PUBLIC FINANCES IN 2008?
1.6 Estimates for the overall 2008 public sector deficit indicate a widening to 14.5 percent of GDP, up from the 9.2 percent of GDP at end-2007, and almost three times the 5.7 percent of GDP deficit target envisioned in the 2008 budget (Table 1.1). This widening of the fiscal deficit reflects three fundamental changes in the Ghanaian public finances: the large increase in import tax exemptions; the expansion of expenditures, especially spending on capital expenditures and on wages and salaries; and the shift in the public sector financing sources. When comparing 2008 and 2007 outturns, Government revenues and grants are estimated to have declined by around 5 percent, primarily on account of lower inflows of grants from foreign donors, which to a large extent reflected the decline in IMF grants associated to the MDRI debt relief that had already been anticipated at the time of the budget formulation.4 There were also lower revenue inflows from indirect taxes and trade taxes due to the sharp increase in exemptions following the Government‟s decision in mid-2008 to grant tax relief to consumers of food items (e.g., rice, wheat, yellow corn and vegetable oil), as well as to reduce the excise duties on gas oil, kerosene and LPG (and the removal altogether on marine gas oil). This increase in tax exemptions is not a one-time event, however. For several years, Government expenditures through the tax system (tax exemptions) have become an important source of forgone tax revenues, as reflected, for instance, in the sharp decline in the import tax revenue to import ratio depicted in Figure 1.2 below. Although the proceeds from direct taxes and non-taxes revenues rose in 2008, this increase did not entirely offset revenue losses from other sources.
Figure 1.1: Central Government Revenues, including Grants from Development Partners,
Actual 2007 vs. Estimate 2008 (% change)
Source: Ghanaian authorities.
4 The IMF‟s debt relief under the MDRI had been front-loaded in 2006 and 2007 and was already projected to decline in 2008 at the time of the budget formulation.

- 20 -
Figure 1.2: Ratio of Import Tax Revenues-to-Merchandise Imports, 1993-2008 (%)
4.0%
5.0%
6.0%
7.0%
8.0%
9.0%
10.0%
1993 1994 1995 1996 1997 1998 1999 2000 2001 2002 2003 2004 2005 2006 2007 2008f Source: Ghanaian authorities.
1.7 The most important changes in public finances were associated with the expansion of public spending. Overall expenditures increased well ahead of revenue collection, with particularly large expansions in subsidies, notably energy sector subsidies channeled through the reserve fund for crude oil purchases. The increase in spending also included increases in public sector wages and salaries, interest payments and capital expenditures (particularly domestically financed capital expenditures (Figure 1.3). It is important to note however that although the percentage increases spending on capital expenditures and public sector wages and salaries were lower than, for instance, on domestic interest payments, these increases were over a much larger base, as these expenditures together accounted for over three-quarters of the overall increase in expenditures. Higher interest payments (up around 20 percent) reflect, as discussed further below, increased borrowing and the shorter maturities of domestic debt instruments.
Figure 1.3: Central Government Expenditures,
2007 Actual vs. 2008 Estimate (% change)
Source: Ghanaian authorities.

- 21 -
Table 1.2: Central Government Budget Operations, 2007-2008
(% of GDP, unless otherwise indicated)
2007
2008
Budget 2008
Total revenue and grants 28.8 28.3 27.4
Revenue 22.7 23.4 22.8 Tax revenue 20.0 19.5 19.8
Direct taxes 6.7 6.4 7.1 Indirect taxes 9.3 8.8 8.7 Trade taxes 4.1 4.3 4.1
Nontax revenue 2.6 3.9 2.9 Grants 6.1 4.9 4.6
Total expenditure 37.2 33.1 40.9 Recurrent Non-interest expenditure 22.9 16.4 25.3
Wages and salaries 10.1 8.9 11.3 Goods and services 4.0 3.0 3.7 Energy, utility and related subsidies 1.6 1.5 3.0
Interest costs 3.1 2.9 3.8 Domestic 2.3 2.2 2.7 Foreign 0.8 0.7 1.1
Capital expenditure (total) 14.3 16.4 15.6 Domestic 9.2 8.9 10.4 Foreign 5.2 3.0 5.2
Arrears clearance and VAT refunds -0.7 -0.5 -1.0 Overall balance -9.2 -5.3 -14.5 Discrepancy -0.3 0.0 0.2 Total financing 8.9 5.3 14.7
Divestiture receipts (net) 0.8 1.6 4.0 Foreign (net) 6.1 2.7 1.0 Exceptional financing (debt relief) 0.7 0.4 0.4 Domestic (net) 1.3 0.5 9.3
Banking system -2.3 7.1 Non-bank 3.6 2.1
Memorandum items: Total poverty spending 9.4 9.6 9.2 HIPC and MDRI spending 2.7 1.5 1.6 Nominal GDP (GH¢ Billion) 14.1 16.3 17.7 Source: Ghanaian authorities.

- 22 -
1.8 There are two other important issues behind this expansion in expenditures that are worth highlighting: the open-endedness of energy sector subsidies and the erosion in the cost of running day-to-day government operations (items 2 and 3 -- goods and service -- in the budget). First, the open-endedness of energy subsidies implies that they increase without bounds during periods of escalating crude oil prices, since these subsidies aim, at present, at compensating the power generation company – the Volta River Authority – for below-cost recovery bulk supply tariffs. The subsidies translate operationally into the direct purchase by government of crude oil cargos to run VRA‟s thermo-electric power plans. In 2008 these subsidies are estimated to have reached around 3 percent of GDP. While there is expectation that the overall size of these subsidies will decline in line with lower crude oil prices, the exact cost of these subsidies in the future remains uncertain, since the subsidies are open-ended because it is expected that the government will always cover the difference between the revenues from bulk supply tariffs and the actual costs of power generation. Second, the increase spending in 2008 reported in the previous paragraphs was accompanied by the reduction in the ratio of government spending on goods and services-to-wages and salaries, with the ratio dropping from 0.4 in 2007 to 0.32 in 2008.5
1.9 The third significant change in Ghanaian public finances was in the sources of deficit financing (Table 1.2). Between end-2007 and end-2008 there has been a shift in the sources of financing of the public sector deficit toward the non-bank financial institutions, the Bank of Ghana, the use of the proceeds from the Eurobond (i.e., capital market financing), and, in the second half of 2008, divestiture receipts. This shift in financing reflected both the need to find additional financing sources for the public sector, as well as the reduction in financing available from domestic banks and from net sources of foreign financing. There were net repayments to deposit money banks and of foreign credits, as well as net withdrawals of non-resident investments in treasury bonds. Indeed, non-resident investments in the Treasury bond market shifted from being an important funding source for the public sector (with positive inflows of US$328 million) in the first half of 2007 to zero in 2008. This is an important development because since end-2006, when Ghana opened its domestic market to foreign investors, these investors had been representing important purchasers of new bond issues, accounting for around 10 percent of the overall domestic bond market at end-2007. Meanwhile, the Government used the proceeds of the Eurobond that had been kept deposited at the Bank of Ghana to fund its investment program, with funds from these deposits meeting around one-quarter of overall financing needs.
1.10 These shifts in the financing sources of the public sector deficit had important macroeconomic implications. The increases in domestic financing both directly through the Bank of Ghana and through the issuing of domestic debt instruments with shorter maturities helped fuel the acceleration in inflation, which ultimately led to the increase in domestic interest rates. Increased domestic financing also placed additional pressures on aggregate demand, which, added to rising crude oil and food prices, contributed to a surge in imports that weakened the country‟s external position. When the government was obliged to turn to the proceeds of the 2007 Eurobond issue to finance some of its expenditures, it contributed to the depletion of
5 As shown in Table 1.1, the ratio of expenditures on goods and services to wages and salaries was already declining in the first half of this decade, falling from 37.5% in 2000 to 29.7 in 2005, only to see a short lived recovery in 2006 and 2007 before this most recent decline.

- 23 -
foreign currency reserves kept at the Bank of Ghana. The result was a weakening in the cedis-dollar exchange rate, which lost over one-quarter of its value in 2008. These changes in interest and exchange rates had in turn a feedback effect on Government finances, with Government expenditures on interest payments, as noted above, rising by around one-fifth.
Table 1.3: The Financing of Government Operations- 2007- 2008 (GH¢ Million)
2007 Outurn
2008 Budget
2008 September
2008 Estimates
Overall Financing 662 989 890 1,977 Domestic Financing (net) 713 516 791 1,152 Banking 209 0 534 673 Bank of Ghana 364 0 570 572 Deposit Money Banks -154 0 -36 101 Non-Bank 504 0 258 245 o/w Non-Residents 328 0 0 0 Other Domestic Financing 0 516 0 234 Foreign Financing (net) -51 473 99 825 Loan disbursement (net) -219 -43 99 165 Exceptional Financing 0 0 0 78 Capital Market Financing 169 516 0 582
Source: Ghanaian authorities.
1.11 An important development on the financing side of the fiscal deficit was the shortening of the maturities of domestic public debt (Table 1.3). During this period of rising public sector debt, all of the increase was in short term public debt instruments, and even within these short term debt instruments there was an increase in the share of 91-days and 182-days treasury bills while the share of 1-year treasury notes declined in absolute terms (Figure 1.4). This increase in short term treasury instruments, and more importantly the increased share of shorter term instruments within the short term debt (i.e., the 91-day treasury bills), was (as expected) strongly correlated with inflation both because of the aggregate demand impact of larger deficit and the increased liquidity provided by these shorter term treasury instruments, since the increase in the share of shorter maturity instruments encouraged asset substitution and the further shrinking of money demand.
1.12 The Government’s other response to the rising fiscal financing needs was to draw down previously accumulated bank deposits. The government drew-down in 2008 around US$450 million from its foreign currency account at the Bank of Ghana, which contained some of the proceeds of the Eurobond issued in 2007, while several line ministries depleted their bank balances accumulated over the last few years in local commercial banks.6
6 As of January 2009, US$595 million from the proceeds of the 2007 Eurobond issue had been disbursed in support of public investments. The distribution of these investments were as follows: US$286 million for investments by the Volta River Authority (VRA); US$134 million for investments by the Electricity Company of Ghana (ECG); US$54 million for the investment in the Bui Dam; US$31million for the Government‟s equity investment in the West Africa Gas Pipeline (WAGP); and US$90 million for public investments in road infrastructure.

- 24 -
Table 1.4: Composition of Domestic Public Debt
2007-2008 (GH¢ Million)
2007 Dec. 2008 Jun. 2008 Sept. A. SHORT TERM 880 1,094 1,311 91-Day Treasury Bill 246 461 696 182-Day Treasury Bill 134 184 264 1-Year Treasury Note 501 449 351 B. MEDIUM-TERM 1,824 1,909 1,831 2-Year Treasury Note 0 0 0 2-Year Floating Treasury Note 41 40 7.3 2-Year Fixed Treasury Note 676 647 601 3-Year GOVT. GGILBS 0 0 0 3-Year Floating Treasury Note 2.1 0.1 0.1 3-Year Fixed Treasury Note 646 764 764 5-Year GOG Bond 269 269 269 GOG Petroleum Finance Bonds 80 80 80 TOR Bonds 110 110 110 C. LONG-TERM 1,004 1,003 1,003 Long Term Govt. Stocks 422 422 422
Telekom Malaysia Stocks 87 87 87 Revaluation Stock 493 493 493 Other Government Stocks 2.2 1.0 1.0 TOTAL PUBLIC Debt (A+B+C) 3,708 4,006 4,145 Source: Bank of Ghana
Figure 1.4: Composition of Short Term Debt, 2007-2008 (%)
Dec.07
Mar.08
Jun.08
Jul. 08 Aug.08
Sept.08
91-Day
1-Year 10.0%
20.0%
30.0%
40.0%
50.0%
60.0%
91-Day
182-Day
1-Year
Source: Bank of Ghana

- 25 -
C. THE CHALLENGES AHEAD
1.13 On Wednesday, March 18th, after two weeks of intense discussion, Parliament approved the new administration’s 2009 budget proposal. The 2009 budget aims at reducing the overall fiscal deficit to 9.4 percent of GDP by adjusting expenditures to the available financing. Under the new administration‟s fiscal adjustment proposal, the public sector‟s financing needs are projected to reach around US$1.5 billion, with the gap being closed with domestic financing, as well as planned official loans, and additional budget support from International Financial Institutions. Also, tax exemptions introduced in mid-2008 are expected to expire already this year, allowing the tax rate to rise without the need to introduce any new legislation,7 while expenditures on energy sector subsidies should decline in line with lower crude oil prices.
1.14 To achieve the 2009 deficit target, the administration is proposing the following actions: (i) increasing revenues, principally by improving VAT collection and raising airport taxes; (ii) compressing operational expenditure (goods and services)8 and delaying capital expenditures (with domestically financed capital expenditures down from 10.4 percent of GDP in 2008 to 6.0 percent in 2009); and (iii) establishing the single treasury account to improve cash management. Also, higher tariffs, low oil prices and the replenishment of water reserves in 2008 would contribute to reducing transfers needed to cover the financial losses of energy-related public agencies.9 Lastly, the Government also intends to reinforce hiring controls (through the re-centralization of hiring decisions), and to keep public wage rises at reasonable levels, as signaled by the outcome of minimum wage negotiations concluded in April 2009.10 The stabilization task will be made more difficult by the necessity to settle the stock of arrears that had accumulated in the past year.11 To keep the implementation of the budget on track with the proposed deficit target, the Government intends to conduct a mid-year budget review and implement the necessary contingency measures to reach the fiscal goals set in the budget law 2009.
1.15 Two challenges should be expected in implementing the administration’s fiscal plan. First, fitting overall expenditures to the available financing will require breaking the considerable degree of inertia that currently exists in Government spending, especially expenditures on public sector wages and salaries. Wages and salaries currently account for over 40 percent of domestic revenues, and under current policies this ratio could rise to 50 percent by end-year. Second, this will be the period for setting up the appropriate fiscal institutions to allocate the revenues from crude oil and gas explorations. Preliminary information available from offshore oil explorations
7 On the other hand, however, the tax base will decline due to lower prices for food items and crude oil. 8 Goods and services are budgeted to be cut from 3.7 to 1.8 percent of GDP, see table 2. However, this evolution conceals the reclassification of some allowances to public sector employees from goods and services to wages between 2008 and 2009. Without such a reclassification, goods and services would be reduced to 3.3 percent of GDP. 9 Volta River Authority (VRA), Electricity Company of Ghana (ECG), Tema Oil Refinery (TOR), and Bulk Oil Storage and Transport (BOST) Co Ltd. 10 The unions, the private sector and the Government, through tripartite wage negotiations, agreed on increasing the minimum wage by 18 percent from April 2009 onwards, with no retroactivity effect. The minimum wage increase is usually an upper limit to the general wage increase negotiated between partners. 11 The total stock of arrears in still unknown and unaudited, but will likely exceed 4 percent of GDP, while 2.7 percent were budgeted in the budget law 2009.

- 26 -
indicate that Ghana‟s oil reserves could reach about 500 million of barrels or more, which, when commercially exploited, would yield additional exports of around US$3.0 billion on average between 2011 and 2018 and generate additional fiscal revenues (including taxes, royalties, and direct participation in production) of as much as 4 percent of GDP.12 In comparison with these two figures, Ghana‟s total merchandise exports and the ratio of total revenues to GDP 2008 reached US$5.2 and 20 percent of GDP, respectively.
1.16 Since outlining the policy agenda that addresses the first of these two challenges is the focus of the next chapter, the rest of this section focuses on this second challenge, namely managing the revenue from forthcoming crude oil and gas exploration and their volatility. The focus on this second challenge is important because there will be considerable demands to postpone any harsh fiscal adjustment in view of these forthcoming fiscal revenues. The experience of the last few years demonstrates, however, how volatile crude oil price can be. For instance, in less than 12 months crude oil prices dropped from US$145 per barrel in June 2008 to around US$50 today, giving pause for thought on what could be plausible assumptions about future revenues from crude oil and gas explorations.
Managing oil and gas revenues and their volatility
1.17 The realization of these forthcoming revenues from crude oil and gas exploration and their inherent volatility raises two issues. First, it appears that oil and gas revenues alone will not suffice to stabilize Ghana‟s fiscal position and, therefore, should not be seen as a panacea.13 Second, there is some urgency in setting up the institutions to manage oil and gas revenues before they begin flowing in late 2010/early 2011.14 The review examines each of these issues below:
12 These projections assume an average price per barrel of crude oil of US$75, which is the current crude oil price projection by the Bank‟s Development Prospect Group. 13 The review elaborates on this point further below because forthcoming oil and gas revenues might urge policymakers to attempt to smooth expenditures, especially since a harsh fiscal adjustment might disrupt ongoing public expenditure programs. 14 At present, the office of the Attorney General is reviewing the draft Ghana Petroleum Regulatory Authority bill. The draft bill aims at: (i) establishing the Ghana Petroleum Regulatory Authority (GPRA); (ii) defining the future role of the Ghana National Petroleum Company (GNPC) as a commercial entity; (iii) outlining the fiscal regime for petroleum and gas revenue management; and (iv) determining the revenue information disclosure obligations of the GPRA and other government agencies. Since extensive comments on the proposed bill have been provided by the Bank elsewhere, this review focuses on two issues related to the proposed fiscal arrangements. First, the draft bill envisions a minimum 10 percent of gross petroleum production royalty rate, which is at variance with the advice provided by the Government team working separately on the petroleum fiscal regime, thus creating a certain degree of uncertainty. Second, many of the other elements of the fiscal regime are deferred to the forthcoming Internal Revenue Amendment bill and a Model Petroleum Agreement. It would be useful therefore to clarify these two points before proceeding with the submission of the bill.

- 27 -
The revenues from crude oil and gas exploration are no panacea. To place these future revenues from oil and gas exploration in perspective, consider the two scenarios for the period 2009 to 2015 outlined in Table 1.5. These two scenarios illustrate two different public deficits and public debt trajectories depending on how revenues from crude oil exploration are used. The first scenario foresees a limited fiscal adjustment in 2009 and 2010, and then full transmission of oil revenue from 2011 onwards to the budget. The result is a rising public debt to GDP ratio, which would choke private sector growth by requiring that most of the domestic savings go towards the funding of the public sector deficit. The second scenario foresees a fiscal adjustment in 2009 and 2010, and then a partial transmission of oil revenue to the budget from 2011 onwards, with the application of the Permanent Income Fund approach, whereby only real returns of 3 percent on the accumulated assets in an oil or heritage fund would be channeled to the budget. Prudence in the management of revenues from oil exploration is the counterpart to higher real GDP growth rates and lower public deficits and debt to GDP ratios.
Table 1.5: Fiscal Adjustment Scenarios with Full and Partial Transmission of Revenues
from Crude Oil Exploration, 2009-2015 (% of GDP, unless otherwise noted)
Scenario 1 2009 2010 2011 2012 2013 2014 2015 Fiscal balance -10.0 -12.5 -12.5 -12.9 -14.0 -8.7 -9.9 Public Debt 60.2 73.8 84.6 92.8 102.7 104.4 106.5 Real GDP growth (%) 3.8 3.9 5.5 6.1 6.1 6.1 6.6 Scenario 2 2009 2010 2011 2012 2013 2014 2015 Fiscal balance -9.0 -6.0 -3.0 -3.0 -3.0 -3.0 -3.0 Public Debt 59.2 66.1 67.9 65.9 65.3 63.0 61.0 Real GDP growth (%) 3.9 4.3 5.5 7.3 7.2 6.8 6.7
Source: World Bank staff calculations.
There will be considerable volatility associated with revenues from crude oil and gas exploration. One of the most remarkable features about crude oil prices is not their upward drift between 2006 and mid-2008, followed by the sharp drop afterward, but their perennial volatility. This fact is made clearer when one measures trend and volatility in a manner that the trend does not relate to volatility in a systematic way, minimizing possible measurement errors in the trend. To illustrate this point, Figure 1.5 compares the time series for the price indices of both real crude oil and the manufactured unit value (MUV).15 What is discernable from comparing the two time series is that the real price for crude oil has been more volatile than the real price for manufactured goods, with the
15 The manufacture unit price index is a weighted average of export prices of manufactured goods for the G-5 economies (the United States, Japan, Germany, France, and the United Kingdom), with local-currency based prices converted into current U.S. dollars using market exchange rates. Weights are the relative share in G-5 exports of manufactured goods to developing countries in a base year (currently 1995), with values: U.S. (32.2%), Japan (35.6%), Germany (17.4%), France (8.2) and United Kingdom (6.6%). The MUV tends to be dominated by movements in the cross exchange rates between the dollar-yen,-euro and – pound sterling. At a time of dollar depreciation, for example, the index will rise, suggesting higher-dollar-based prices from non-U.S. G-5 countries. In contrast, a rising dollar will tend to lower growth in the MUV, as diminishing values of local-currency prices in dollar terms dominate the movements of MUV. These movements in the cross exchange rates between the dollar-yen, the dollar-euro and the dollar-pound sterling dominate the volatility of the MUV index.

- 28 -
volatility of crude oil prices being particularly high between mid-1970 and mid-1980 – also a decade of world economic instability.
Figure 1.5: Time Series for Manufactures Unit Value (MUV) and Crude Oil Price Indices,
1962-2005 (first differences)
-100.00
-50.00
0.00
50.00
100.00
1962
'
1964
'
1966
'
1968
'
1970
'
1972
'
1974
'
1976
'
1978
'
1980
'
1982
'
1984
'
1986
'
1988
'
1990
'
1992
'
1994
'
1996
'
1998
'
2000
'
2002
'
2004
'
Manufacture Unit ValueCrude Oil
Source: World Bank staff.
1.18 Fiscal reforms that have been adopted by other countries to mitigate the consequences of the volatility in revenues from oil and gas exploration have focused on smoothing revenue flows by either setting revenue targets that account for the volatility in crude oil prices, or setting up an oil fund to stretch the income from oil revenues into the future. This External Review recommends as the best option for Ghana the establishment of a Permanent Income Fund (PIF), whereby only the interest rate revenue from accumulated assets is channeled into the budget. The Permanent Income Fund option would allow the country the needed time to undertake the public financial management reforms needed to ensure that these additional revenues are effectively converted into long term investments with high social returns while preserving the Ghanaian economy from the oil-induced volatility and the boom and bust cycles. World price and real interest rates assumptions would determine the income which can be spent every year, even after oil reserves have been exhausted.16 This proposal contrasts somewhat with the Stabilization Fund (SF) that was outlined by Ghana‟s previous administration, which would have failed to completely insulate the budget from the volatility in crude oil prices since it proposed to channeled two-third of oil revenues into the budget, and set aside the other third. By channeling a large share of the revenues from crude oil exploration to current expenditures, the previous proposal would allow a large share of the revenue volatility to trickle down to expenditures. This volatility would lead, in turn, to difficult and costly adjustments in expenditures.17
16 The permanent income is equal to the product of the interest rate and the net present value of future oil revenue. For the purpose of this exercise, we assume that the assets of the permanent income fund would yield a 3 percent real rate of return. 17 The previous administration‟s proposed oil revenue management was to be implemented in two-phases. The first phase would cover the period from 2010 to 2012, when accrued revenues would flow into this „Petroleum Custodian Fund‟ for two purposes: two-thirds for overall budget expenditures, one-third to help set up the Petroleum Regulatory Authority and the National Oil Company. The second phase would extend from 2013 onwards and be directed toward two purposes: financing overall budget expenditures (two-thirds of revenues) and setting up two national funds. From this remaining one-third of revenues, 60 percent would go toward a stabilization fund and 40 percent toward a heritage fund.

- 29 -
1.19 An important point to underscore is that a Permanent Income Fund is effective in protecting fiscal sustainability only when budget control systems for the general budget are also effective. These public financial management systems are discussed in greater detail in chapter 3 of this External Review. Other than that, the objectives of generating high rates of return under a Permanent Income Fund need to be complemented with strong political commitment to the rules that govern the fund, and buttressed with transparent investment guidelines for the accumulated assets and stringent mechanisms to ensure accountability and prevent misuse. Avoiding the misuse of the assets accumulated under a Permanent Income Fund includes forbidding borrowing by other agencies within the public sector against the Fund‟s surplus. Also, the good management of the Fund requires regular audits by an independent external agency, with the evaluation of its investment strategy and the return on assets achieved. Lastly, the Fund‟s activities would automatically be reported to Parliament, as part of the regular annual budget implementation reporting and the link between fiscal policy and asset accumulation would be made transparent. These steps are important because simply setting aside some of the revenues flowing into the Fund to build assets for future generations does not circumvent the problem identified above, namely that other agencies within government accumulate deficits offsetting the surplus being generated by the Permanent Income Fund. Only by integrating this Fund into the budget can the link between fiscal policy and asset accumulation be made transparent (Box 1.1).
Box 1.1: Oil Funds
Many countries have oil funds to channel revenues from oil exploration, so that revenues are shared transparently with current and future generations. Oil funds have multiple purposes, ranging from supporting current expenditures to helping stabilize revenue flows from oil production and allowing future generations to share in the national wealth. The two latter types of funds are usually termed oil stabilization and permanent income/heritage funds. Oil Stabilization Funds (SF) accumulate resources when either oil prices are high or when revenues from oil exports are higher than an agreed threshold. They make payments to the budget when oil prices and revenues from oil exports fall below the agreed threshold. These rules allow resource flows in and out of the budget to be smoothed over time, reducing the volatility usually associated with oil prices. Oil stabilization funds present some drawbacks, however. Fund rules may lead to an indefinite accumulation of revenues or a rapid exhaustion of funds depending on whether the reference price for crude oil not quickly adjusted to reflect changes in current crude oil prices. Also, relatively simple fund rules designed to save revenues during „good‟ times and spend them during „not-so-good times‟ do not deal with the overarching policy goal of stabilizing overall public finances, especially in countries, such as Ghana, where statutory funds operate side-by-side the national budget. Unless funds are set aside definitively during the „good‟ times (periods of positive inflows), the rest of government can „spend‟ the accumulated surplus by running a deficit. Permanent Income/Heritage Funds (PIF) aim at creating a store of wealth for future generations, where only the interest rate revenues from the accumulated assets are used for current budget expenditures. These objectives of a PIF can be achieved by defining transparent investment guidelines for the accumulated assets, with stringent mechanisms to ensure accountability and prevent misuse.18 In addition, the fund‟s activities should be audited by an independent external agency, and its investment performance periodically evaluated and published. Lastly, by integrating the Permanent Income Fund into the budget, its activities would automatically be reported to Parliament as part of the regular annual budget implementation reporting and the link between fiscal policy and asset accumulation would be made transparent.
Source: World Bank staff. 18 These rules include prohibiting borrowing against accumulated assets to finance deficits within the government.

- 30 -
1.20 The two other concerns that emerge as Ghana begins benefiting from revenues derived from oil exploration are the risk that the country might develop a Dutch disease-style resource pull, and the stress that this would entail to the institutions for public financial management. While a „Dutch disease-style resource pull‟ leads to a short term economic boom in non-tradable sectors, it is the forerunner to a loss of economic competitiveness that leads to economic stagnation. This concern is derived from past experience from oil exporting countries where spending out of oil wealth increased the demand for non-tradable, drawing productive resources into that sector.
1.21 The stress placed on the institutions for public financial management because of volatile oil revenues is particularly pronounced when expenditures are linked to current revenues. This link should be avoided, as it can lead to wasteful spending and low productivity of public investment projects. In the case of current expenditures, when oil revenues drop it is difficult and costly to adjust expenditure downwards, while in the case of investment projects the volatility of oil revenues can lead to difficulties in implementing these projects. When oil prices are high, the investment surge taxes the country‟s absorptive capacity, and when oil prices drop there are pressures to also drop these projects.
D. CONCLUSIONS AND RECOMMENDATIONS
1.22 This chapter reviewed the main developments in Ghanaian public finances in 2008, namely the four main factors behind the widening of the fiscal deficit: (i) the expenditures expansion, especially spending on wages and salaries, capital expenditures and on energy sector subsidies; (ii) the shift in the public sector financing sources; (iii) the large increase in import tax exemptions; and (iv) the gradual erosion in the operational expenditures of government (other than wages and salaries). While the most important changes in public finances were associated with the rapid increase in public spending – an issue that will be further developed in the next chapter, the development with the most lasting impact was the shift of public sector financing sources. The increases in domestic financing through the Bank of Ghana helped fuel the acceleration in inflation, which ultimately led to the increase in domestic interest rates. Increased domestic financing also increased aggregate demand pressures, which, once added to rising crude oil and food prices, led to a surge in imports that weakened the country‟s external position.
1.23 The two other important developments in public finances were the shortening of the maturities of domestic public debt and the gradual erosion in the funding of the everyday government operations (except for expenditures on wages and salaries). First, during this period of rising public sector debt all of the increase was in short term public debt instruments. This increase in short term treasury instruments, and more importantly the increased share of shorter term instruments within the short term debt (i.e., the 91-day treasury bills), is (as expected) strongly correlated with the acceleration in inflation both because of the aggregate demand impact of a larger fiscal deficit and the increased liquidity provided by these shorter term treasury instruments. Also, there has been gradual erosion in the funding of the day-to-day operations of government. Expenditures on goods and services declined by just under 9 percent in 2008, even as all other expenditure items were rising. Moreover, they are budgeted to decline by another 50 percent in 2009.

- 31 -
1.24 In reviewing the challenges for public financial management that lie ahead, two main messages emerge. First, forthcoming revenues from oil and gas exploration alone will not suffice to stabilize Ghana‟s fiscal position and, therefore, should not be seen as a panacea. Second, although there is some urgency in setting up the institutions to manage oil and gas revenues before they begin flowing in late 2010/early 2011, their efficacy is contingent on having in place effective budget control systems. The chapter outlines therefore a two-pronged policy agenda aimed at containing the drivers of expenditures in 2008 and at safeguarding forthcoming revenues from oil and gas exploration. These steps should assist the Ghanaian authorities in laying the ground work for the public financial management reforms proposed in the subsequent chapters of this report.
1.25 Short term recommendations
Ensure that the proposed fiscal adjustment is reached by a combination of raising tax collections and, more importantly, reducing expenditures. An adjustment that is achieved by allowing inflation to erode expenditures will only further entrench current inflationary expectations.
Ensure a better balance between salary and non-salary expenditures, initially by placing a cap on public sector wages and then by making these caps enforceable by strengthening the institutions that compel these limits.
Enforce greater fiscal discipline is the provision of energy sector subsidies. The option already being adopted by the Government of Ghana to limit the size of these energy sector subsidies, and increase their predictability, is the application of the automatic tariff adjustment mechanism. Under this mechanism energy tariffs are to be adjusted automatically any time that crude oil prices rise or fall by 5 percent, or there is an equivalent adjustment of the exchange rate.19 In many ways, this was the ideal timing for re-introducing the automatic adjustment mechanism for utility tariffs because of the steep decline in crude oil prices and the good rain patterns that has increased the share of hydroelectric generation in the power generation mix.
Ensure better oversight when granting tax exemptions. The cost of tax exemptions in 2008 is estimated to have added to 2.3 percent of GDP, or just under 9 percent of overall tax revenues. For efficiency and budgetary reasons, the authorities need to better enforce import tax obligations by allowing tax exemptions granted last year to expire, by improving import inspection and by closing remaining loopholes in the tax legislation that allow certain imports to enter duty free.
Medium term recommendations
Define fiscal arrangements needed to mitigate the consequences of the volatility in revenues from oil exploration by setting up an oil Permanent Income Fund that stretches the income from oil revenues into the future. Permanent Income Funds are
19 The latter is important because utility tariffs are set in Ghana cedis, while crude oil imports are paid in dollars. Crude oil is an essential input for thermal electricity production, and electricity production in turn accounts for around one-third of the cost of water production.

- 32 -
effective in establishing the link between the funds‟ earnings and expenditures, since funds that link current revenues to current expenditures fail to insulate the budget from the volatility in crude oil prices.
Ensure that revenues derived from the exploration of oil and gas deposits are
integrated into the budget. The reasons are three-fold. The integration of these revenues into the budget will add an additional level of Parliamentary oversight. Also, unless funds are set aside definitively during the „good‟ times (periods of positive inflows), integrating the oil and gas revenues into the budget will ensure that the link between fiscal policy and asset accumulation is made transparent. Otherwise, the rest of government can attempt to „spend‟ the accumulated surplus of the oil fund by running a deficit. Lastly, to complement the Parliamentary oversight through the budget, the activities of an oil fund should be audited by an independent external agency, and its investment performance periodically evaluated and published.
- 33 -
2. CHAPTER II: EXPENDITURE PATTERNS
A. INTRODUCTION
2.1 This chapter reviews the expenditure patterns in 2008, as well as in previous years, since improving aggregate fiscal discipline will depend on how well the budget is balanced. The analysis in this chapter aims at also laying the groundwork for the subsequent chapters: chapter 3 examines how to strengthen public financing management systems to handle these recent fiscal imbalances, and chapter 4 outlines steps to improve expenditure prioritization by making the Medium Term Expenditure Framework (MTEF) operational. There are three main messages that emerge from the analysis developed in this chapter:
Ghana’s national budget is increasingly constrained by expenditure obligations related to wages and salaries. At end-2008, wages and salaries accounted for well over 40 percent of domestic revenues20 – a ratio that is projected to rise further this year, even if the ratio of government domestic revenues to GDP remains unchanged – and around 41percent of overall revenues. Most of the increase in wages and salaries in 2008 was due to higher wages, accounting for around 60 percent of the increase, with the remainder increase due to changes in employment (around 25 percent) and to residual factors. The majority of the additional staff was recruited into the human development services sectors -- education services (up 60 percent) and health services (up 17 percent). This same distributional pattern is found in the breakdown of the wage bill increases by public services, with most of the increase (over three-quarters) taking place in the education and health services. The end result of the increasing share of public sector wages and salaries in overall expenditures is that the distribution of expenditures by sectors is dominated by those sectors with larger wage bills, primarily education and health, and, to a lesser extent, those falling under the administration and public safety functions.
While capital expenditures were the fastest growing expenditure item in 2008 (accounting for 40 percent of the overall increase in expenditures), their share in overall expenditures reached only about 35 percent – the same level as in 2005. Most of the recent increase in capital expenditures appears to have been possible thanks to one-time financing sources, such as the proceeds from the 2007 Eurobond and divesture receipts. The challenge in 2009 has been to scale back these expenditures without compromising either medium term growth prospects, or the delivery of public services.
While transfers to subnational levels of government and agencies are well matched to population shares, there is scope for improving the transparency of how these funds are transferred, as well as their timeliness. The analysis suggests that it is more important to ensure the timely delivery of these transfers, and to better balance recurrent expenditures between wages and other running costs of government, than to focus narrowly on changing the regional distribution of these funds.
2.2 The remainder of this chapter is organized as follows. Section B reviews broad expenditure allocations and outcomes by sectors in the 2008 budget, and then examines the distribution of expenditures according to their economic categories. In this context, it examines
20 Domestic revenues include total tax and non-tax revenues.

- 34 -
the breakdown between discretionary and statutory payments,21 exploring the shifts in the composition of expenditures and in their financing sources. Section C examines more closely the distribution of, and sources of funding for, transfers to subnational levels of government (regions and districts). This section also summarizes the findings of the 2007-08 Public Expenditure Survey (PETS), examining selected cases of how the allocated transfers reached their final destination. Section D closes the chapter with the concluding observations and some policy recommendations.
B. EXPENDITURE PATTERNS
Sectoral distribution of expenditures
2.3 The analysis of the sectoral/program breakdown of budgetary allocations and expenditure outturns highlights the budget fragmentation in Ghana, which makes this type of analysis more difficult. The difficulty derives from the fact that only about 50 percent of expenditures are channeled through the Government‟s budget (the so-called consolidated fund). The remainder of these expenditures is allocated and spent through statutory funds, HIPC and MDRI accounts, and donor-funded programs. As discussed in greater length in chapter 4 (paragraph 4.16), to ensure that the budget and the MTEF are proper planning instruments that can analyze trade-offs between sectoral expenditure programs, they need to be made comprehensive of all public resources to be allocated.
2.4 Figure 2.1 provides an overview of broad budget allocations by major programs and their expenditure outturns in 2008.22 Aggregate figures reported by sector/programs show that actual expenditures followed broadly the distribution envisioned under their initial allocations. However, their absolute overall amounts up to September were about 20 percent higher than original breakdown by sectors (or an additional 4.7 percent of GDP – around GH¢800 million). This suggests that some of the expenditures happened outside the normal budget process, probably because a supplementary budget was not tabled in time to allocate the revenues from the 2008 privatization receipts. As detailed in paragraph 2.10 and 2.11 below, most of the increase in expenditures was due to increases in so-called discretionary payments related to capital expenditures and public sector wages and salaries. This increase in the share of discretionary expenditure was juxtaposed by the decline in the share of expenditures channeled through statutory payments, such as transfers to households and transfers to the statutory funds (e.g., the Ghana Education Trust Fund, the Road Fund, the Petroleum Fund, the National Health Insurance Fund, and the District Assembly Common Fund).
2.5 Some important changes in the original spending plan at the level of individual sector/programs should be noted. Expenditure on economic programs fell behind the original plan, mostly on account of lower than anticipated capital expenditures. As a result, the share of expenditures of economic programs fell to about 20 percent of overall expenditures, down from about one-third in the original budget, with particularly pronounced declines in the energy sector 21 Discretionary expenditures are government payments made to cover expenditures such as public sector wages, administrative expenditures and domestic investments. These payments are made either from general domestic tax revenues or from specific external revenues, such the proceeds from debt relief initiatives. Statutory expenditures relate to payments made on external debt service, domestic interest payments, and transfers to funds that receive earmarked tax revenues, such as the District Assembly Common Fund (DACF) and the Ghana Education Trust Fund (GET Fund). 22 Note that expenditures either allocated or carried out under sector programs add to about 95 percent of all expenditures, with the difference assigned to multi-sector programs and expenditures under the contingency rubric.

- 35 -
and, to a lesser extent, transport sector programs. Meanwhile, social programs also saw their relative shares in overall spending decline, albeit by a smaller amount, dropping from 43 to 41 percent. Taken together, nevertheless, social programs still experienced a large absolute increase in expenditures (around GH¢200 million), accounting for about one-quarter of the overall increase in expenditures over the levels planned in the 2008 budget. Most of the relative decline in the shares of these social programs was due to lower spending on health programs, although this was partially offset by increased spending in employment programs managed by the Ministry of Manpower, Youth and Employment. The largest increase in expenditures, relative to the original spending plans, were in programs falling under the headings of public safety (primarily interior and defense) and, to a lesser extent, administration (ranging from expenditures managed by the President‟s office, and the ministries of Finance and Local Governments). Lastly, most of the expenditures outside sectoral programs (around 5 percent of overall expenditures), was allocated to several multi-sector programs but ended up spent under the contingency rubric. :
Figure 2.1: 2008 Overall Budget Allocations and Expenditure Outcomes, including
Statutory Funds, HIPC MDRI, IGFs and Donor Funds (%)
Source: Ghanaian authorities.

- 36 -
2.6 The gap that emerges in Figure 2.1 between expenditure allocations and outcomes is captured in part by examining the budget execution rates for overall expenditures and some of the main expenditure programs.23 Figure 2.2 presents the budget execution rate for overall Government of Ghana expenditures, as well as for key expenditure programs, in 2008. Budget execution rates were by in large very high, exceeding 100 percent in most cases, reflecting the fact that final expenditures were much higher than originally budgeted. Budget execution rates amongst different programs were nevertheless very uneven, with low rates for energy and, to a lesser extent, health sector programs. These disparities in budget execution rates, as well as the overall expansion of expenditures, would have been captured earlier if the reporting on budget execution was more frequent and made available more timely to the general public.
Figure 2.2: Budget execution rates for Overall Government of Ghana Expenditures and Key Expenditure Programs, 2008 (%)
Source: Ghanaian authorities.
2.7 The other observation that emerges from inspecting Figure 2.1 is that the distribution of expenditures by sector/program is dominated by those sectors with larger wage bills (primarily education and health, and, to a lesser extent, those falling under the administration and public safety functions). The weight of expenditures on wages and salaries in defining sectoral budget allocations comes, in many instances, at the expense of expenditures on goods and services and in sectors that are investment-intensive rather than staff-intensive. Examples of the latter include expenditures in agriculture and in natural resource management and the environment. In 2008, for instance, overall expenditure in the agricultural sector (including expenditures by the ministries of Food and Agriculture and Finance and Economic Planning, as well as the Cocoa Board) added to around 1.6 percent of GDP – a level that is well below the 10 percent of GDP commitment made under the NEPAD,24 and the bulk of the government‟s expenditure in the sector was allocated to recurrent activities, particularly wages 23 Budget execution rates are only available for expenditures of the consolidated fund. 24 The Africa Union‟s New Partnership for Africa‟s Development (NEPAD).

- 37 -
and salaries.25 A more serious concern emerges from the NREG review of budget allocations for the programs for natural resource management and environment. The review finds that the funding requirements necessary to perform the core functions for natural resource management and environment far exceed the funding available from revenue sources. A case in point was the lack of funding to carry out surveys of timber utilization areas, which would in turn determine the revenues to be derived from timber utilization fees. For these and other reasons, funding for these programs is estimated to have declined by 40 percent in nominal terms between 2004 and 2008, representing a decline in real terms of around 50 per annum during this period.26
2.8 Even if the review can only provide limited information on the adequacy of these broad budget allocations across sectors and their expenditure outturns, it is still possible to assess the distributional impact of expenditures in the two largest sectors (education and health). The incidence of allocations and expenditures on primary public education is definitely pro-poor, with around 45 percent of expenditure benefiting the two lowest income quintiles. This pro-poor orientation of expenditures on primary education is important because less than one-third of overall public education expenditures reach these two quintiles. Similarly, public health transfers, whose effectiveness are discussed further below (paragraph 2.15), are skewed toward higher income groups, with the two top quintiles capturing around 50 percent of the expenditures funded by these transfers. This uneven distribution of expenditures across income levels reflects in part the uneven distribution of expenditures across regions. And the distribution of expenditures across regions reflects, in turn, the uneven distribution of health care staff across regions as reflected in the lower doctor-to-patient ratio in deprived regions. This uneven distribution of health sector expenditures is corroborated by comparing the benefit-incidence across different types of facilities. The majority public hospitals and clinics still benefited disproportionately the better off patients. Community health centers and, to a lesser extent, mission facilities were more progressive, however. The latter is important because mission facilities, many of which receive public subsidies for salaries, have recently made an increasing contribution to health service delivery, and their primary mission has been to serve rural areas and the poor.
2.9 The distributional implications of public expenditures on education and health were reflected in the trends of poverty reducing expenditures.27 After rising to 10.4 percent of GDP in 2006, soon after the completion of the HIPC and MDRI debt relief initiatives, poverty-reducing expenditures edged slightly downwards, reaching 9.4 and 9.2 percent of GDP in 2007 and 2008, respectively. The trend in poverty-reducing expenditures reflected in part the 25 Reaching Middle-Income Status in Ghana by 2015 – Public Expenditures and Agricultural Growth, International Food Policy Research Institute, revised July 2008. 26 Natural Resources and Environmental Governance Program (NREG). Review of Budgets, Expenditures and Financial Management System of the Natural Resources and Environment Sector, June 2008. 27 Poverty related expenditures include the following expenditures from the Appropriation Act: (i) Education expenditures – non-formal education, pre-school, basic education, technical & vocational education, teacher training, and education management and supervision, and a fraction of the expenditures on special education (90%) and general administration (50%); (ii) Health expenditures – district health services, regional public health expenditures, oncology expenditures, funding for the international red cross, and health learning materials, plus a fraction of the expenditures on regional health support services (50%), psychiatric hospital (50%), regional clinical care (50%), health training institutions (70%), and institutional care (60%); (iii) Agriculture expenditures – crop services provided through the regional agriculture development units and projects funded by IDA; (iv) Works and Housing expenditure programs – the community water and sanitation program, and rural housing and rural hydrological drainage expenditures; (v) feeder roads and transport expenditures – expenditures on feeder roads and road safety; (vi) Energy expenditure programs – rural electrification programs; and (vii) Other expenditure programs – national vocational training, social welfare programs, etc.
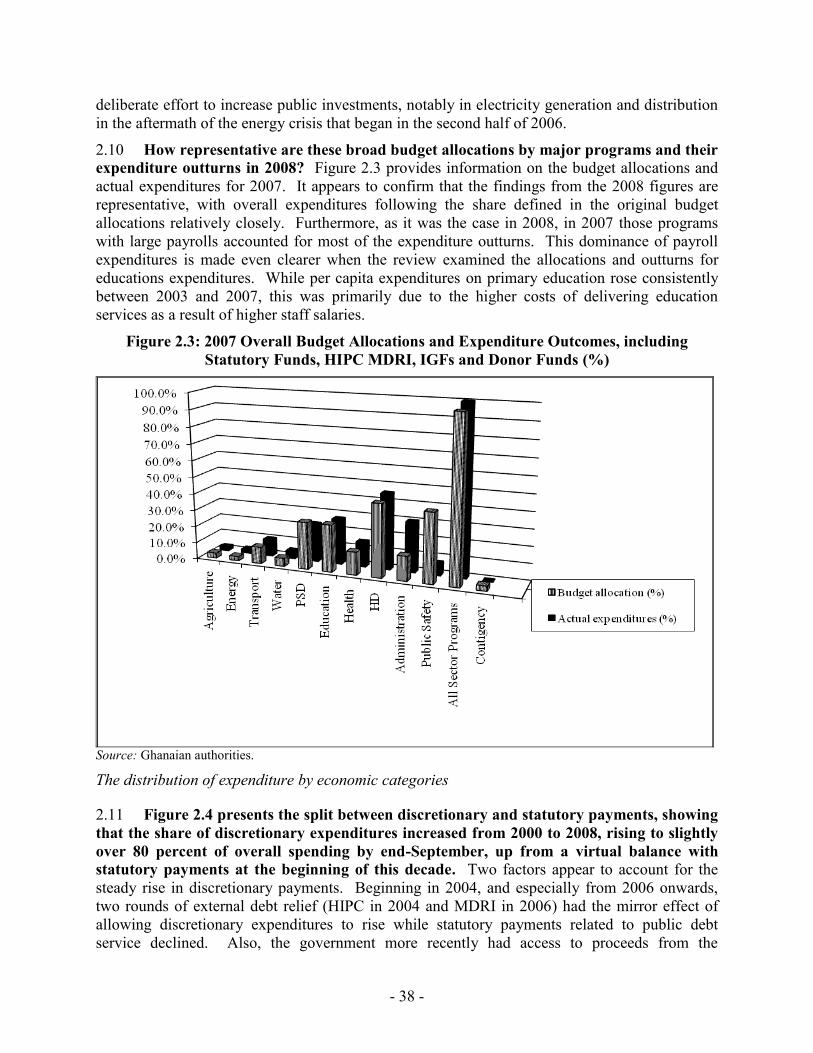
- 38 -
deliberate effort to increase public investments, notably in electricity generation and distribution in the aftermath of the energy crisis that began in the second half of 2006.
2.10 How representative are these broad budget allocations by major programs and their expenditure outturns in 2008? Figure 2.3 provides information on the budget allocations and actual expenditures for 2007. It appears to confirm that the findings from the 2008 figures are representative, with overall expenditures following the share defined in the original budget allocations relatively closely. Furthermore, as it was the case in 2008, in 2007 those programs with large payrolls accounted for most of the expenditure outturns. This dominance of payroll expenditures is made even clearer when the review examined the allocations and outturns for educations expenditures. While per capita expenditures on primary education rose consistently between 2003 and 2007, this was primarily due to the higher costs of delivering education services as a result of higher staff salaries.
Figure 2.3: 2007 Overall Budget Allocations and Expenditure Outcomes, including
Statutory Funds, HIPC MDRI, IGFs and Donor Funds (%)
Source: Ghanaian authorities.
The distribution of expenditure by economic categories
2.11 Figure 2.4 presents the split between discretionary and statutory payments, showing that the share of discretionary expenditures increased from 2000 to 2008, rising to slightly over 80 percent of overall spending by end-September, up from a virtual balance with statutory payments at the beginning of this decade. Two factors appear to account for the steady rise in discretionary payments. Beginning in 2004, and especially from 2006 onwards, two rounds of external debt relief (HIPC in 2004 and MDRI in 2006) had the mirror effect of allowing discretionary expenditures to rise while statutory payments related to public debt service declined. Also, the government more recently had access to proceeds from the

- 39 -
September 2007 Eurobond issue, as well as receipts from the 2008 divestiture of Ghana Telecommunications, which helped sustain this increase in discretionary expenditures at a time when some of the debt relief grants were beginning to decline.28
Figure 2.4: Economic Distribution of Government Expenditures between
Statutory and Discretionary Payments, 2000-2008 (%)
2000 2001 20022003 2004
20052006
20072008
Statutory Payments
Discretionary Payments
0.0%
10.0%
20.0%
30.0%
40.0%
50.0%
60.0%
70.0%
80.0%
90.0%
Statutory Payments
Discretionary Payments
Source: Ghanaian authorities
2.12 Tables 2.1 and 2.2 provide a breakdown of what is included under so-called discretionary expenditures. Expenditures on wages and salaries accounted for most of the absolute increase in expenditures, while capital expenditures and expenditures on subsidies accounted for most of relative increase in expenditure. While expenditures on wages and salaries increased by one third, rising to just over eleven percent of GDP, compared to slightly less than 7 percent of GDP at the beginning of the decade, the GDP share of expenditures on domestically-financed investments more than doubled during this period, rising from around 4.5 percent to just below 10.5 percent of GDP – a real increase of over three quarters since average real GDP growth was over 5 percent during this period. Meanwhile, the sharp increase in expenditures on transfers and subsidies in 2008 was associated with the massive tax exemptions extended to consumers of food products and petroleum derivatives in response to the steep rise in food and crude oil prices in international markets that occurred in the first six months of 2008.
28 In particular, the debt relief grants from the IMF, which had been front-loaded in 2006 and 2007. The result was that the sum of funds from debt relief and from overseas development assistance accounted for about 50 percent of the increase in externally financed discretionary expenditures during this period.

- 40 -
Table 2.1: Economic Classification of Central Government Expenditures: 2000-2008
(Million Ghana Cedis)
2000 2001 2002 2003 2004 2005 2006 2007 2008
Actual Actual Actual Actual Actual Actual Actual Actual Est.
RECURRENT EXPENDITURE 525 786 1,087 1,452 1,973 2,268 3,121 3,910 4,476
Non-interest expenditure 322 488 786 1,043 1,626 1,920 2,728 3,470 3,797
Wages & Salaries (Personal Emoluments) (Item 1) 187 263 414 557 699 868 1,137 1,419 1,988
Goods & Services (items 2&3) 70 99 145 206 242 258 428 565 648
Administration 30 43 63 111 151 161 302 416 n.a.
Services 40 56 82 95 90 97 126 149 n.a.
Transfers 43 49 69 97 128 293 298 580 629
Pensions 16 23 27 36 52 61 93 110 149
Gratuities 12 7 11 20 27 36 47 45 63
Social Security 16 19 30 41 50 62 98 133 160
National Health Fund (NHF) 0 0 0 0 0 134 61 292 257
Subsidies 0 0 48 43 222 76 304 32 329
Safety net for petroleum deregulation 0 0 0 0 0 25 37 27 10
Lifeline consumers of electricity 0 0 48 27 44 10 90 1 0
TOR for under-recovery 0 0 0 16 177 41 177 4 0
Other 0 0 0 0 1 0 0 0 319
Reserve Fund for oil purchases 0 0 0 0 0 0 0 192 324
Strategic Oil Stocks 0 0 0 0 0 15 0 0 0
Retention of IGF by MDAs 22 12 21 20 107 125 192 226 217
Interest Payments 203 298 300 409 347 347 393 440 679
Domestic 145 231 221 327 255 247 303 322 482
External (Due) 59 68 79 82 93 100 90 118 197
CAPITAL EXPENDITURE 253 513 299 523 797 1,052 1,145 2,017 2,751
Domestic-financed Capital 118 160 134 233 339 473 618 1,291 1,844
Development 113 134 134 229 321 464 617 903 1,432
(a) Indirecly through Transfers to Statutory Funds 48 92 99 187 228 321 323 392 595
of which: Education Trust Fund 3 14 34 71 82 118 106 143 175
Road Fund 25 30 33 52 64 88 109 103 100
Petroleum Related Fund 0 41 6 7 7 8 3 3 320
Dist. Ass. Common Fund 19 7 27 58 75 107 105 143 183
(b) Directly by Central Government 65 42 35 42 93 143 294 511 837
of which: Consolidated Fund 65 42 35 42 93 143 294 343 419
Capital Market Borrowing 0 0 0 0 0 0 0 169 418
Net lending 5 26 0 4 18 10 1 1 0
New loans 5 26 0 4 19 10 2 1 0
Loan recoveries 0 0 0 0 -1 0 -1 0 0
Foreign-financed Capital 135 353 165 290 458 579 528 726 907
DEBT RELIEF FINANCED EXPENDITURES 0 0 18 72 187 161 304 387 279
HIPC-financed 0 0 18 72 187 161 179 203 185
MDRI-financed 0 0 0 0 0 0 125 184 94 Source: Ghanaian authorities.

- 41 -
Table 2.2: Economic Classification of Central Government Expenditures: 2000-2008
(Percent of GDP)
2000 2001 2002 2003 2004 2005 2006 2007 2008
Actual Actual Actual Actual Actual Actual Actual Actual Est.
RECURRENT EXPENDITURE 19.3 20.7 22.2 21.9 24.7 23.4 27.2 28.0 25.3
Non-interest expenditure 11.9 12.8 16.1 15.8 20.4 19.8 23.7 24.8 21.5
Wages & Salaries (Personal Emoluments) (Item 1) 6.9 6.9 8.5 8.4 8.7 8.9 9.7 10.1 11.3
Goods & Services (items 2&3) 2.6 2.6 3.0 3.1 3.0 2.7 3.7 4.0 3.7
Administration 1.1 1.1 1.3 1.7 1.9 1.7 2.6 3.0 n.a.
Services 1.5 1.5 1.7 1.4 1.1 1.0 1.1 1.1 n.a.
Transfers 1.6 3.0 3.2 3.3 4.5 6.0 5.8 7.4 3.6
Pensions 0.6 0.6 0.6 0.5 0.6 0.6 0.8 0.8 0.8
Gratuities 0.4 0.2 0.2 0.3 0.3 0.4 0.4 0.3 0.4
Social Security 0.6 0.5 0.6 0.6 0.6 0.6 0.8 1.0 0.9
National Health Fund (NHF) 0.0 0.0 0.0 0.0 0.0 1.4 0.5 2.1 1.5
Subsidies 0.0 0.0 1.0 0.6 2.8 0.8 2.6 0.2 1.9
Safety net for petroleum deregulation 0.0 0.0 0.0 0.0 0.0 0.3 0.3 0.2 0.1
Lifeline consumers of electricity 0.0 0.0 1.0 0.4 0.5 0.1 0.8 0.0 0.0
TOR for under-recovery 0.0 0.0 0.0 0.2 2.2 0.4 1.5 0.0 0.0
Other 0.0 0.0 0.0 0.0 0.0 0.0 0.0 0.0 1.8
Reserve Fund for oil purchases 0.0 0.0 0.0 0.0 0.0 0.0 0.0 1.4 1.8
Strategic Oil Stocks 0.0 0.0 0.0 0.0 0.0 0.1 0.0 0.0 0.0
Retention of IGF by MDAs 0.8 0.3 0.4 0.3 1.3 1.3 1.7 1.6 1.2
Interest Payments 7.5 7.8 6.1 6.2 4.3 3.6 3.4 3.1 3.8
Domestic 5.3 6.1 4.5 4.9 3.2 2.5 2.6 2.3 2.7
External (Due) 2.2 1.8 1.6 1.2 1.2 1.0 0.8 0.8 1.1
CAPITAL EXPENDITURE 9.3 13.5 6.1 7.9 10.0 10.8 10.0 11.7 15.6
Domestic-financed 4.4 4.2 2.7 3.5 4.2 4.9 5.4 6.5 10.4
Development 4.2 3.5 2.7 3.5 4.0 4.8 5.4 6.5 8.1
(a) Indirecly through Transfers to Statutory Funds 1.8 2.4 2.0 2.8 2.9 3.3 2.8 2.8 3.4
of which: Education Trust Fund 0.1 0.4 0.7 1.1 1.0 1.2 0.9 1.0 1.0
Road Fund 0.9 0.8 0.7 0.8 0.8 0.9 0.9 0.7 0.6
Petroleum Related Fund 0.0 1.1 0.1 0.1 0.1 0.1 0.0 0.0 1.8
Dist. Ass. Common Fund 0.7 0.2 0.5 0.9 0.9 1.1 0.9 1.0 1.0
(b) Directly by Central Government 2.4 1.1 0.7 0.6 1.2 1.5 2.6 3.7 4.7
of which: Consolidated Fund 2.4 1.1 0.7 0.6 1.2 1.5 2.6 2.5 2.4
Capital Market Borrowing 0.0 0.0 0.0 0.0 0.0 0.0 0.0 1.2 2.4
Net lending 0.2 0.7 0.0 0.1 0.2 0.1 0.0 0.0 0.0
New loans 0.2 0.7 0.0 0.1 0.2 0.1 0.0 0.0 0.0
Loan recoveries 0.0 0.0 0.0 0.0 0.0 0.0 0.0 0.0 0.0
Foreign-financed 5.0 9.3 3.4 4.4 5.7 6.0 4.6 5.2 1.6
DEBT RELIEF FINANCED EXPENDITURES 0.0 0.0 0.4 1.1 2.3 1.7 2.6 2.8 1.6
HIPC-financed 0.0 0.0 0.4 1.1 2.3 1.7 1.6 1.5 1.0
MDRI-financed 0.0 0.0 0.0 0.0 0.0 0.0 1.1 1.3 0.5 Source: Ghanaian authorities.

- 42 -
2.13 Another observation that emerges from inspecting Tables 2.1 and 2.2 is that the increase in capital expenditures is due primarily to increases in domestically finance investments. While significant increases in spending on subsidies happened in 2006 and in 2008, the increase in capital expenditures dates from 2004 and more clearly from 2006 onwards. Figure 2.5 confirms this observation that the upward trend in investments is due primarily to increases in investments financed directly through the central government, as opposed to investments financed through statutory funds. Overall capital expenditures are depicted by the shaded area, while the lines provide the breakdown between capital expenditures financed through transfers to statutory funds and directly through the central government budget. The record for the first eight years of this decade is of rising domestically-financed capital expenditure from 2004 onwards, following a trough in the capital expenditures-to-GDP ratio in the early years of this decade. The increase in capital expenditures financed directly by the central government appears to be the main factor behind the investment build up, while capital expenditures financed through transfers to statutory funds remain relatively stable, averaging around 2.8 percent of GDP. Since statutory funds receive earmarked tax revenues to finance these investments, the increase in investment spending by the central government appears to be related to new sources of revenue, such as HIPC and MDRI debt relief, the proceeds from the 2007 Eurobond issue and divestiture receipts in 2008. While it is never possible to directly assign expenditures to specific sources of financing, since funding is fungible, what one infers from the data is that there is a correlation between the increase in investment expenditures and the additional sources of revenues that become available from 2004 onwards.
Figure 2.5: Domestically-financed capital expenditures, 2000-2008 (% of GDP)
0.00
1.00
2.00
3.00
4.00
5.00
6.00
7.00
8.00
9.00
10.00
2000 2001 2002 2003 2004 2005 2006 2007 2008
Domestic-financed capitalexpendituresDirectly by Central Government
Indirecly through Transfers toStatutory Funds
Source: Ghanaian authorities

- 43 -
2.14 The interpretation that additional financing was an important determinant of the recent increase in capital expenditures is also supported by information in Figure 2.6. Figure 2.6 depicts the breakdown of overall public sector resources, presenting the recent rise in the share of external sources of funding for the budget, which includes divestiture receipts, external concessional and nonconcessional loans, domestic borrowing, and proceeds from the 2007 Eurobond.
Figure 2.6: Public Sector Revenue Sources, 2000 to end-September 2008 (%)
0.0%
10.0%
20.0%
30.0%
40.0%
50.0%
60.0%
70.0%
80.0%
2000 2001 2002 2003 2004 2005 2006 2007 2008
Domestic revenues
Grants
Financing
Source: Ghanaian authorities
2.15 When assigning expenditure items to a source of funding, one needs to bear in mind that another expenditure item had to be forgone – in other words there was an opportunity cost associated with that expenditure choice. In the case of Ghana, it appears that the rise in expenditures on wages and salaries, investments and subsidies meant that spending on goods and services was being crowded out. Indeed, the rise in the share of wages and salaries in overall spending appears to have been partially offset by declines in the shares of spending on goods and services and on transfers, with the share of expenditures on goods and services and on transfers dropping to 12 percent each, down from 15 and 27 percent, respectively, in previous years. These shifts in expenditure shares are important in turn to understand trends in service delivery reported elsewhere,29 since they signal an imbalance between salary and non-salary expenditures, especially in sectors with a large number of staff (particularly education and health). Even though recurrent expenditures in education added to almost 5.5 percent of GDP in 2008, wages and salaries absorbed almost the totality of these expenditures, leaving less than six percent of all budgeted expenditures in this sector for non-salary recurrent expenditures. This imbalance meant that fewer resources were available, as a result, for textbooks and teaching materials. This
29 See, for instance, Ministry of Education and Sports, “Education Sector Performance Report in 2008,” July, and Ministry of Health, “The 2009 health sector Program of Work in Ghana,” December. The findings of this last report need to be placed in perspective, however, since preliminary results of the 2008 Ghana Demographic and Health Survey indicate significant improvements in several health outcome indicators, including a decline in infant mortality to 50 per 1,000 live births, down from 64 in the 2003 Survey, and a decline in child mortality from 111 to 80 per 1,000 live births.

- 44 -
problem was compounded by the unequal distribution of staff across regions. Since the ratio of teachers per pupil is lower in deprived regions, deprived districts received less funding for these other needed expenditures. Similarly, 70 percent of health sector recurrent expenditures go toward wages and salaries, leaving limited resources for needed pharmaceutical drugs and other non-salary recurrent expenditures.
2.16 What explains the increase in the overall public sector’s payroll?30 The decomposition of payroll increases between changes in wages and changes in employment indicates31 that overall changes in employment accounted for just over one-quarter of the increase in the payroll, while changes in average wages explain around 60 percent, with residual factors explaining the remaining 12 percent (Table 2.3). Note, however, that the size of the residual component varies depending on the public service in question. The residual is zero in the case of pensioners, confirming that all their wage gains were due exclusively to increases in pension benefits. Also, the residual component for the payroll of subvented agencies is smaller than average, with increases in employment accounting for three-quarters of changes in the wage bill. Lastly, the split between changes in employment and changes in wages in the decomposition of the payroll increase appears to be more evenly distributed amongst the Security services and employees in the „Police and Armed Forces‟ category.
Table 2.3: Decomposition of the Increase in Payroll, Overall Public Sector
and Selected Services, 2008 (%)
Public Service Category
Employment Wages Other Factors
Total 27.1% 60.8% 12.1% Civil Service 33.5% 53.2% 13.3% Health 33.2% 53.4% 13.4% Education 33.3% 53.4% 13.3% Pensioners 0.0% 100.0% 0.0% Security 41.1% 47.1% 11.8% Subvented Agencies 75.9% 15.5% 8.7% Police and Armed Forces
43.9%
44.9%
11.2%
Other 33.6% 53.2% 13.3% Source: Ghanaian authorities.
30 Public sector employees are presently classified according to the legal framework that defines their career services. The majority of these employees are classified as public servants, falling under the principles defined in the article 190 of the 1992 constitution. Table 2.3 presents some of the main employee categories that fall under this heading. Education non-tertiary employees account for the majority of article 190 public servants (59 percent), followed by public servants in public policy, planning and administration, and related services -- PPPSAR (11 percent), health (9 percent), security (9 percent), and tertiary educations (6 percent). The remaining are civil servants in legal and judicial services, local government services, regulatory agencies, revenue and accounting agencies, subvented agencies, and those included under section 214 and article 71 of the 1992 constitution, plus pensioners and employees of state owned enterprises. 31 This decomposition is based on the following accounting identity (2.1):
OFREP rrrr (2.1) where r represents, respectively, the rate of change of payroll (P), employment (E), remuneration (R), and other factors (OF), with OF being a catch all term designed to capture residual factors that cannot be explained by changes in either employment or wages.

- 45 -
2.17 What the decomposition of the wage bill does not capture is how these changes are reflected among the different services, since it only decomposes changes in the payroll within each service. The information available suggests however that over three quarters of the additional staff was recruited into education services (60 percent) and into health services (17 percent). The same distributional pattern appears to apply to wages, with most of the increase (over three-quarters) concentrated in education and health services.
2.18 Figure 2.7 provides information on trends in wages for a selected group of employees in the education sector during the period December 2000-March 2008. It shows the steady increase in wages (measured in dollar terms) for this selected group of employees during this period, with salaries increasing almost six-fold. It also depicts the slight compression in the distribution of wages across these categories (as measured by the ratio between the salaries of Assistant Directors and Certification A teachers) during the earlier part of the period, which is followed by a slight decompression of wages that begins after 2006 that not entirely reverse the compression that occurred during the between 2000 and 2001.
Figure 2.7: Education Sector Wages, 2000-2008 (in US$ equivalent)
Source: Ghanaian authorities.
2.19 To what extent do the recent increase in expenditures on public sector wages and salaries constrain other expenditures and, more broadly, the operations of the public sector? Expenditures on wages and salaries are estimated to have reached just above 11 percent of GDP at end-2008, up from around 10 percent in 2007, accounting therefore for about one-quarter of overall expenditures. As discussed above, the recent rise in overall expenditures is due primarily to increased financing available to the public sector, many of which were from one-time revenue sources, such as divestiture receipts and the proceeds from the 2007 Eurobond. There are three other measures of the constraints resulting from the recent increase in wages and salaries: the ratios of wages and salaries to domestic revenues and to overall recurrent expenditures, and the so-called recurrent balance. Figure 2.8 shows two of these measures (the

- 46 -
ratios of wages and salaries to domestic revenues and to overall recurrent expenditures) alongside ratio of wages and salaries in overall expenditures. While the share of public sector wages and salaries in overall expenditures has been relatively stable, at around one quarter, the share of wages in domestic revenues has been steadily rising since 2005, reaching well over 40 percent by end-2008. Similarly, the share of public sector wages and salaries in recurrent expenditures has been increasing, adding to 40 percent by the end of last year.
Figure 2.8: The ratios of Public Sector Wage Bill to Overall Expenditures, in Domestic
Revenues and in Recurrent Expenditures, 2000 to 2008 (%)
Share of wages and salaries in overall expenditures
Share of wages and salaries in domestic revenues
0.0%
20.0%
40.0%
60.0%
2000 2002 2004 2006 2007 2008
Share of wages and salaries in overall expenditures
Share of wages and salaries in recurrent expenditures
Share of wages and salaries in domestic revenues
Source: Ghanaian authorities. 2.20 There are two other measures of the effect of higher public sector wages and salaries on overall public sector operations: the trends in the so-called recurrent balance and the impact of higher wages on shifting public sector’s financing sources. The recurrent balance indicates the extent to which public investments can be covered by current revenues. What table 2.4 shows is that over the last four years Ghana‟s recurrent balance declined by over 6 percentage points of GDP (declining from 8.3 to 2.1 percent of GDP) primarily because of increase spending on public sector wages and energy sector subsidies. Two main concerns arise from these developments. First, any additional increase in recurrent expenditures, such as, for instance, rising interest payments, will crowd out investments. Second, even if the share of current expenditures in GDP remains unchanged, with the recurrent balance at 2 percent of GDP, new investments will need to rely primarily on borrowed funds. Since the availability of concessional funds for investments are projected to average around 3 percent of GDP during the 2009-11 period,32 in the absence of an increase in the recurrent balance, public investment financed from current and concessional funds will become the adjustment variable. The recurrent balance highlights therefore the degree to which the Ghanaian budget is increasingly constrained, with the wage bill and interest payments adding to almost two-thirds of overall revenues.
32 This estimate reflects the sum of project grants and HIPC and MDRI grants from multilateral organizations.

- 47 -
Table 2.4: Ghana recurrent fiscal balance, 2005-08 (% of GDP)
2005 2006 2007 2008 Total revenue 27.1 27.3 28.8 27.4 Recurrent expenditure 18.7 21.9 22.9 25.3 Wages 8.5 9.7 10.1 11.3 Good and services 3.2 3.7 4.0 3.7 Social transfers 2.7 2.5 4.1 3.5 Energy subsidies 0.8 2.6 1.6 3.1 Domestic interest payments 2.8 2.6 2.3 2.7 External interest payments 0.9 0.8 0.8 1.1 Recurrent balance 8.3 5.4 5.8 2.1
Source: Ghanaian authorities.
2.21 The changes in the public sector’s financing sources illustrate the options that needed to be sought to fund increasing expenditures and shifting financing sources (Figure 2.9). Two observations emerge from reviewing the sources of public sector financing in 2008, especially when compared to the previous years of this decade. First, while divestiture receipts met a large share of overall financing (almost 40 percent, compared to less than 10 percent in 2007), domestic financing was still the main financing source. Most of the domestic financing came from non-banking sources, such as the State pension system (SSNIT), however. Second, while recourse to the proceeds of the 2007 Eurobond issue deposited by the government in the Bank of Ghana helped cushion the decline in foreign currency reserves, this cushion was also needed to offset the negative net flows from foreign loans, as amortization amounting to 2.3 percent of GDP in 2008, greatly exceeded the inflows from new loans.
Figure 2.9: Source of Public Sector Financing, 2000 to 2008 (%)
2000 2001 2002 2003 2004 2005 2006 2007 2007 2007 2008
Divestiture Proceeds
Non-domestic financing-40%
-20%
0%
20%
40%
60%
80%
100%
120%
140%
Divestiture Proceeds
Domestic Financing
Non-domestic financing
Total Financing Requirements
Source: Ghanaian authorities.
2.22 While the analysis of the impact of the increase in public sector wages has up until now focused on its impact on increasing overall expenditures and on crowding out other expenditures, there is also an important labor market effect that results from this increase in public sector wages. To better understand the labor market effects of increases in public sector wages, this External Review turned to data from the Ghana Living Standards Survey,

- 48 -
which allows a comparison between public sector wages and wages earned in other sectors of the economy (Table 2.5). What the review observed was an increased duality in the labor market, with a persistent and widening gap between public sector wages and wages earned elsewhere. Public sector wages increased by just under 90 percent during the 1991-2005 period, while informal sector wages increased by slightly more than half of that amount during that same period. The only other worker category that experienced a percentage increase in wages of similar magnitude as public sector workers were self employed agricultural workers. These are primarily hired workers in cocoa production, however, so their increase is from a much lower base and concentrated (if not limited) to the recent period when the country saw a sustained increase in cocoa production and earnings.
Table 2.5: Annual Real Earnings across Employment Status in Age group 25-64
(in ‘000 cedis)
1991/92 1998/99 2005/06 Change Wage Public sector 7,470 8,992 14,120 89.0 Wage Private sector Formal 6,480 8,054 9,574 47.7 Wage Private sector Informal 4,205 3,915 6,025 43.3 Self-employed Agro 1,597 1,385 3,064 91.9 Self-employed Non Agro 3,455 3,733 5,180 49.9 All employees 1,442 1,293 2,551 76.9 Source: Based on Coulombe and Wodon (2007), using data from the GLSS surveys. Changes are expressed in percentage points. Note: Median annual earnings expressed in local currency in 1991 prices. Some divergences in trends observed with the 1998/99 data may be due to sampling issues and/or lower level of comparability.
2.23 What are the dynamic implications of the 25 percent average difference between public sector and private formal sector wages during the 1991-2005 period? Note that this difference reflects a 10 percent union premium and the remaining 15 percent “real” average public sector wage premium during this period.33 The first implication one would expect from this difference would be to place a barrier to the expansion of employment in the private formal sector, since higher public sector wages bid up private formal sector wages, which in turn squeeze profits, leading as a result to lower levels of investments. Lower investments imply lower increases in labor productivity and therefore lower job creation.34 The second, and related, implication one would expect would be that the slow growth of the private formal sector employment would consign most of employment to the informal sector.35 These expectations are confirmed by the data available from the Ghana Living Standards Survey. Between 1991 and 2005, employment increased by 45 percent, rising from 5.5 to 8 million people, while the labor force expanded by 55 percent, rising from 7.3 to 11.3 million people. Also, economic activity did indeed shift very slowly away from agriculture, with the agriculture sector still employing 54 percent of the labor force in 2005, down from 56 percent in 1991. Employment in services and 33 To calculate the “real” public sector wage premium one needs to first calculate the union wage premium, as measured by the percentage difference between wages in the private formal sector and wages in the private informal sector, and then subtract this union wage premium from the percentage difference between wages in the public sector and wages in the private formal sector. This remaining 15 percent is the “real” public sector wage premium during the period 1991-2005. 34 Other factors that are likely to account for the slow expansion of the private formal sector in Ghana and, therefore, its sluggish job creation include: real estate market rigidities and infrastructure bottlenecks (energy and water in particular). 35 The high prevalence of informality in Ghana remains an important obstacle to improvements in labor productivity. Some 87 percent of the Ghanaian workforce is employed informally as farmers (52 percent) or in self employment (35 percent). The informal sector is less able to invest in business, gain access to credit, establish standards or participate in industry bodies. These constraints are reflected in Ghana‟s ranking in the Doing Business survey for ease of starting a business (137th).
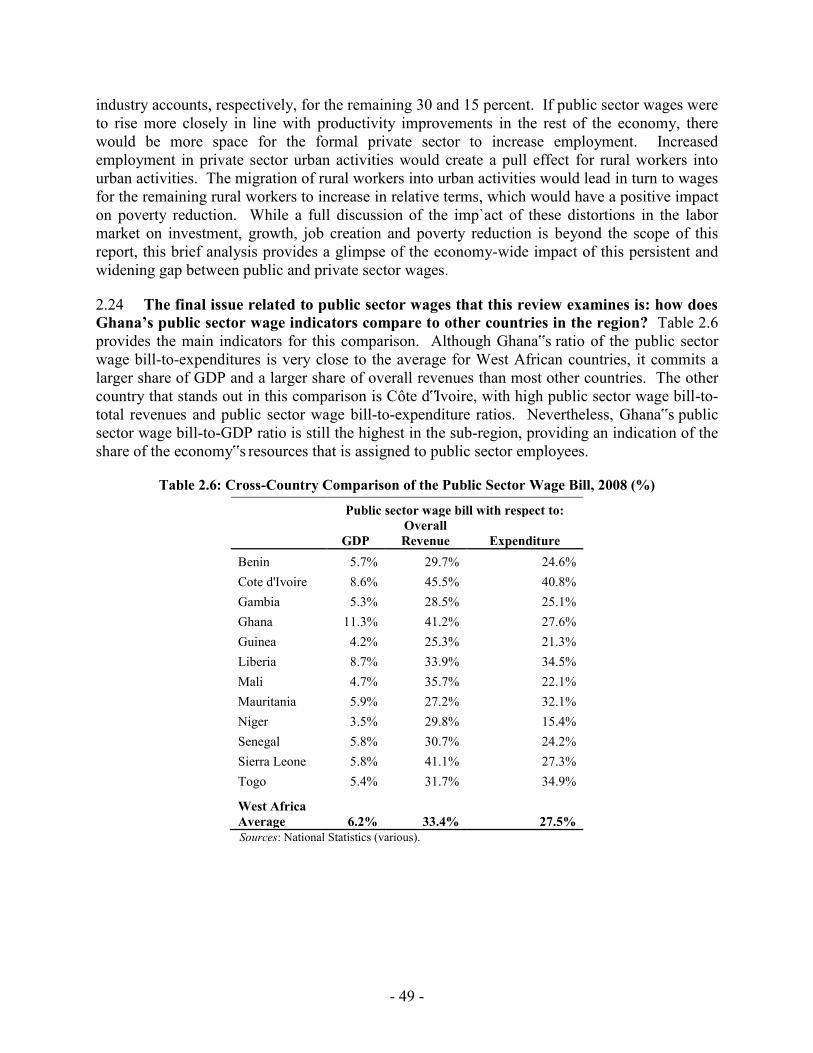
- 49 -
industry accounts, respectively, for the remaining 30 and 15 percent. If public sector wages were to rise more closely in line with productivity improvements in the rest of the economy, there would be more space for the formal private sector to increase employment. Increased employment in private sector urban activities would create a pull effect for rural workers into urban activities. The migration of rural workers into urban activities would lead in turn to wages for the remaining rural workers to increase in relative terms, which would have a positive impact on poverty reduction. While a full discussion of the imp`act of these distortions in the labor market on investment, growth, job creation and poverty reduction is beyond the scope of this report, this brief analysis provides a glimpse of the economy-wide impact of this persistent and widening gap between public and private sector wages.
2.24 The final issue related to public sector wages that this review examines is: how does Ghana’s public sector wage indicators compare to other countries in the region? Table 2.6 provides the main indicators for this comparison. Although Ghana‟s ratio of the public sector wage bill-to-expenditures is very close to the average for West African countries, it commits a larger share of GDP and a larger share of overall revenues than most other countries. The other country that stands out in this comparison is Côte d‟Ivoire, with high public sector wage bill-to-total revenues and public sector wage bill-to-expenditure ratios. Nevertheless, Ghana‟s public sector wage bill-to-GDP ratio is still the highest in the sub-region, providing an indication of the share of the economy‟s resources that is assigned to public sector employees.
Table 2.6: Cross-Country Comparison of the Public Sector Wage Bill, 2008 (%)
Public sector wage bill with respect to:
GDP Overall Revenue Expenditure
Benin 5.7% 29.7% 24.6% Cote d'Ivoire 8.6% 45.5% 40.8% Gambia 5.3% 28.5% 25.1% Ghana 11.3% 41.2% 27.6% Guinea 4.2% 25.3% 21.3% Liberia 8.7% 33.9% 34.5% Mali 4.7% 35.7% 22.1% Mauritania 5.9% 27.2% 32.1% Niger 3.5% 29.8% 15.4% Senegal 5.8% 30.7% 24.2% Sierra Leone 5.8% 41.1% 27.3% Togo 5.4% 31.7% 34.9%
West Africa Average 6.2% 33.4% 27.5%
Sources: National Statistics (various).

- 50 -
C. TRANSFERS TO SUBNATIONAL LEVELS OF GOVERNMENT36 2.25 A significant share of public services are delivered at the subnational level of government, and financed either by the MDAs through their district officers when allocating funds assigned by the Appropriation Act or through several transfers, ranging from central government grants to funds from development partners and payments made by statutory funds. This multiplicity of funds places a heavy reporting burden on the district assemblies and, as a result, some of the information on district level finances is not available. Indeed, because of this problem with the availability of data, the analysis in this External Review focuses on transfers to districts, excluding the budget allocations made by MDAs through their district officers.37 Specifically, the External Review analyzes the data available from the 2006 transfers to regions and districts and the results of the 2007-08 Public Expenditure Tracking Survey (PETS). The latter provides a snap shot of the extent to which the transfers to the districts are achieving their intended objectives. The 2006 data suggests that about two-thirds of these transfers follow broadly their regional population shares, while the results of the PETS indicate that there is scope for improving the efficiency with which these transfers are recorded and, in that way, generate savings without compromising service delivery – indeed, there is scope for actually improving the efficiency with which these transfers are performed.
2.26 What drives the transfers to regional and district levels of government? Figure 2.10 presents the share of transfers to each region alongside their population shares. The picture that emerges indicates that the share of transfers received by each region is well matched to their population shares, with a correlation of 0.8. Average figures conceal important differences across funding sources, however. For instance, internally Generated Funds (IGFs) are very unevenly distributed, with almost one-third of the transfer of IGFs allocated to the Upper East region. In principle, these transfers would be expected to go to regions with more schools, clinics and hospitals, as well as regions better endowed with natural resources (e.g., forests, mines), since the distribution of these transfers should be a function of the share of either the services provided or the resources extracted at the regional level.38 The distribution of IGFs does not conform to the distribution of services across the country, however. Meanwhile, the distribution of donor funds across regions appear to be relatively progressive (i.e., positively correlated with poverty rates), with almost 50 percent of these transfers going to the three 36 The original intent of this review was to analyze the extent to which budgetary allocations are aligned with broad strategic policy objectives at the national, sectoral and subnational levels. This information would advise the government on plans to implement its decentralization programs, including the shift of additional service delivery responsibility to sub-national levels of government. The review was to focus on efficiency issues and to examine the link between public spending, outputs and where possible outcomes, in two key sectors, namely education and health, which together account for more than 45 percent of the total discretionary spending. During the preparation of this review it became clear however that the data on sector budget allocations and expenditures at the regional and district level was not available, however. At the allocation stage centralized sector ministries have the discretion of reallocating funds assigned in the Appropriations Act, and at the expenditure stage the information is lacking because of problems with the financial reporting by the districts. The main problem faced by the districts is the multiplicity of funds on which they need to report on. In addition to the funding allocated from the central government budget to the districts through the district officer of the MDAs, the districts also receive grants from of the central government, as well as transfers from the HIPC and MDRI accounts, from the District Assembly Common Fund (DAFC), from the development partners, and transfers from Internally Generated Funds (IGFs). Going forward this review recommends the consolidation and simplification of the financial reporting at subnational levels of government, so as to ensure regular and timely reporting on expenditures undertaken at the regional and district levels of government. The review also encourages development partners to institute a single, consolidated and simple financial report on aid-funded expenditures at subnational levels of government. 37 2006 is the most recent date for which a complete data set on these transfers is available. 38 Internally Generated Funds are fees collected by government agencies in exchange either for services provided, primarily in education, health, or for the use of public natural resources, such as in forestry and mining.

- 51 -
northern regions (Northern, Upper East and Upper West), where poverty rates are significantly higher. Larger regions, such as Greater Accra and the Ashanti regions, received, almost 40 percent of these transfers and the other regions receiving the remaining 14 percent (Table 2.7).
2.27 The three other sources of transfers, out of the five sources being reviewed, the regional grants provided by the Government of Ghana, the transfers through the District Assembly Common Fund (DACF) and the distribution of HIPC funds, are the one’s driving the results linking overall transfers to population shares.39,40 Together these three sources of transfers account for over two-thirds of the overall transfers to the regions (or around three-quarters when donor transfers are excluded). The strong correlation between these transfers and population shares also means however that they are negatively correlated with poverty rates. Only the transfers through the District Assembly Common Fund (DACF) appear to be somewhat less regressive (with the lowest negative correlation with poverty rates amongst the three).41
Figure 2.10: Total transfers and population shares, 2006 (% of total)
North
ernUp
per E
ast
Grea
ter A
ccra
Easte
rnW
ester
nVo
ltaCe
ntral
Uppe
r Wes
tAs
hant
i
Bron
g Aha
fo
Share of transfers
0.0%
5.0%
10.0%
15.0%
20.0%
Share of transfersShare of population
Source: Ghanaian authorities.
39 The other two transfers include donor funds and internally generated funds. 40 The release of HIPC funds (as MDRI funds became available only at end-2006) by MoFEP was made according to priorities defined by Parliament. These provided that around 6.3 percent be used for retiring domestic debt, 44.3 percent be allocated to human development services projects (e.g., education, health and water and sanitation), 43.1 percent for private sector development (e.g., micro-credit, agriculture, rural electrification, non-traditional exports, feeder roads, employment, forest plantation, Volta lake transportation) projects, and 6.3 percent for governance-related programs (e.g., information, monitoring and evaluation, public security and public awareness). 41 The District Assemblies‟ Common Fund (DACF) was established under section 252 of the 1992 constitution of Ghana. Since 2008 it sets aside 7.5 percent (previously it was 5 percent) of the national revenue to be shared among all District Assemblies according to a formula approved by Parliament. For instance, the formula in 2007 envisioned that seventy-five of the year's allocation would be shared among District Assemblies according to service needs (primarily in education and health needs and population density) and the revenue effort, measured by the increase in revenue collection at the district level. Education sector needs were to be determined based on the number of facilities in the district, the teacher pupil ratio, the district‟s water coverage and the share of paved roads in the district. Health sector needs were based on the number of facilities in the district, the doctor-population ratio, and the nurse-population ratio. Of the remaining 25 percent, five percent would be shared among the 230 Members of Parliament for constituency projects, two and half percent would be assigned to the ten Regional Coordination Councils (RCCs) to be used for supervision in their respective regions, five percent would be assigned to the office of the DACF administrator, ten percent would be earmarked for the sanitation programs, and the remaining two and half percent would be reserved to meet contingency expenditures.

- 52 -
Table 2.7: Relative Shares of Per Capita Transfers to the Regions
by Source of Funding, 2006 (% share, unless otherwise noted)
GoG grants
DACF Donors HIPC IGF Total Pop. shares
Pov. Rates
Northern 6.8% 13.9% 26.0% 9.9% 1.6% 11.2% 9.6% 52% Upper East 3.9% 6.2% 7.3% 8.0% 29.1% 11.4% 4.9% 70% Upper West 1.8% 5.5% 13.8% 7.8% 1.1% 5.4% 3.0% 88% Greater Accra 26.2% 8.0% 8.6% 11.6% 29.1% 14.8% 15.4% 12% Eastern 12.0% 9.7% 3.9% 10.8% 6.4% 8.8% 11.1% 15% Ashanti 15.9% 17.5% 16.7% 15.3% 12.6% 15.9% 19.1% 20% Brong Ahafo 10.7% 11.9% 9.6% 8.6% 5.8% 9.7% 9.6% 30% Western 7.5% 10.6% 2.2% 9.2% 8.4% 8.8% 10.2% 18% Volta 7.0% 7.7% 6.9% 9.3% 2.8% 6.7% 8.6% 31% Central 8.3% 9.0% 5.1% 9.5% 3.1% 7.3% 8.4% 20% Share of overall total 9.1% 44.3% 10.1% 14.7% 21.8% Transferred amounts (GH¢ million) 183.7 893.4 203.4 296.7 440.6 2,017.8
Correlation with population shares
0.8
0.7
0.1
0.9
0.3
0.8
Correlation with poverty rates -0.7 -0.4 0.4 -0.6 -0.1 -0.4
Northern regions 12.5% 25.6% 47.1% 25.6% 31.8% 27.9% Larger regions 64.7% 47.2% 38.7% 46.3% 53.9% 49.2% Remaining regions 22.8% 27.3% 14.2% 28.0% 14.3% 22.8%
Source: Ghanaian authorities.
2.28 How effective are these transfers in reaching their intended objective? The results of the 2007-08 Public Expenditure Tracking Surveys (PETS)42 identifies three areas for improvement in managing these transfers: (i) the quality of record keeping, which is crucial to enforce the transparency of resource flows; (ii) the exchange of information between different levels of the public administration; and (ii) the timing of resource delivery. While its not possible to single out the causes behind the problems in record keeping, the lack of 42 The general methodology of a Public Expenditure Tracking Survey (PETS) is intuitively simple, consisting of charting budget flows and release mechanisms (funds and materials) from the center to service providers such as schools, clinics and hospitals. The in- and out-financial and material flows are compared (and ideally reconciled) at each stage of the observed spending channel, which corresponds to the specific resource distribution mechanisms. This is what is often referred to as vertical tracking. In practice, a PETS is inheritably complicated and cumbersome to implement due to the complexity of the financial management system, so it depends heavily on the quality and availability of data. When a vertical tracking is not possible due to lack of information, an alternative approach, relying less on detailed data, is simply to compare per capita resource flows at each administrative node, which is often referred to as horizontal tracking. The Ghana PETS uses both these tracking methods wherever applicable. Given that adequate information was available, the PETS was able to reveal discrepancies of resource flows between any two consecutive administrative stage. Also, following consultations with Ministry of Education, Ministry of Health, Ghana Education Service, Ghana Health Service and Development Partners (DFID, DANIDA , GTZ , Netherland Embassy, UNICEF), a few expenditures were selected, based on their financial and strategic importance in the sectors. In the education sector, selected expenditures are: capitation grants, textbooks, service activity expenditures (Item 3) and investment expenditures (item 4) in basic education. In the health sector, selected expenditures were: selected medications and medical supplies, Administrative Expenditures (Item 2), service activity expenditures (Item 3) and the National Health Insurance Scheme. The survey was designed to be national and regionally representative. After wide consultations with Ministry of Education, Ministry of Health, Ghana Education Service, Ghana Health Service and Development Partners (DFID, DANIDA , GTZ , Netherland Embassy, UNICEF), a few expenditures were selected, based on their financial and strategic importance in the sectors. In the education sector, selected expenditures are: capitation grants, textbooks, service activity expenditures (Item 3) and investment expenditures (item 4) in basic education. In the health sector, selected expenditures were: selected medications and medical supplies, Administrative Expenditures (Item 2), service activity expenditures (Item 3) and the National Health Insurance Scheme. The survey was designed to be national and regionally representative. See Ministry of Finance and Economic Planning (2008). Ghana Public Expenditure Tracking Survey.

- 53 -
communication between administrative units and the delays in transfers, these findings reveal the main value of the PETS exercise, namely identifying discrepancies in resource flows between any two consecutive administrative nodes.
2.29 The PETS exercise focused on tracking the transfers to and within the education and health sectors. In the case of the Education sector, these transfers included expenditures related to Education Capitation Grant (ECGs) and School Textbooks, as well as transfers from the District Education Officer (DEO) to fund expenditures on goods (item 3 of the budget) by the District Assemblies, and expenditures by the District Assemblies on primary school infrastructure projects funded by the District Assembly Common Fund (DACF).
2.30 The findings of the education component of the PETS included the following:
Timing of Education Capitation Grant (ECG) tranche release. The Ministry of Finance and Economic Planning (MOFEP) distributed the first and the second ECG tranches to the Ghana Education Service (GES) promptly in September 2006, and the third tranche was disbursed in May. The GES distributed in turn about 75 percent of ECG on time to DEOs, providing the funds needed for the first and second tranches. The third tranche did not take place, however, until June and July, constituting a delay of one to two months.
Information exchange between levels of the public administration regarding the ECG. Since the allocation of Education Capitation Grants is based on enrollment, the efficiency of ECG distribution is based on the accuracy of enrollment indicators. The PETS found that schools in the Central, Volta, and Upper East regions reported enrollment levels significantly lower than those reported by DEOs, while schools in the Northern region reported enrollment rates 10 percent higher than those reported by the DEOs. Schools with over-estimated enrollment by DEOs received higher than average amounts of ECGs per student, while the schools with under-estimated enrollment by DEOs received less than average amount of ECGs per student.
Timing of the distribution of textbooks. Delays in the distribution of textbooks were prevalent. For academic year 2005/06, most books were delivered to DEOs after November 2005 and some as late as January or February 2006.
Timing and record keeping of the transfers by DEOs for expenditures on goods (item 3 of the budget). Most of the DEOs received their transfers to cover expenditures on goods (items 3 of the budget) in November and March, when the academic year was already well into session. Based on expenditure return from Regional Education Officers (REOs), only one-third of designated funds transferred to them was accounted for with expenditure returns. Also, while the DEOs appear to have disbursed funds for the purchase of goods as soon as they received them, the funds disbursed added to only about 80 percent of funding received from the Ghana Education Service (GES).
Enforcement of DACF procedures. About 40 percent of the DACF funds transferred to the District Assemblies (DAs) were designed for primary school constructions. However, DAs reported that only 11 percent of the funding received was used for primary school infrastructure projects. This finding suggests that there is the need for

- 54 -
greater public scrutiny of financial transfers that are more fungible than in-kind transfers, such as textbooks, for instance.
Exchange of information on DACF transfers. While the records from the District Assembly Common Fund (DACF) were in a good form, they were grossly inconsistent with the records reported by the District Assemblies (DAs) themselves. DAs reported to have received much higher amounts than those claimed by the DACF. With this caveat made, the analysis of the DACF transfers focused on the use of the funding at district level, which is one of the aspects of the efficient use of public resources. Another important caveat is that, according to the DACF‟s own records, it retained 42 percent of DACF at the center. This retained share at the center appears large, given that the purpose of the DACF is to empower districts with more financial resources for local projects.
2.31 Health sector expenditures tracked by the PETS included transfers for service related expenditures on goods (item 3 of the budget), and transfers by the National Health Insurance Scheme (NHIS).43 The main concern related to the timing of these transfers. The findings of this component of the PETS were as follows:
Timing of item 3 expenditure transfers. There were significant delays in the transfer of funds for item 3 expenditures, which could have impacted service deliveries negatively during the first half of the year. MOH was in charge of transferring Item 3 to tertiary hospitals and to the Ghana Health Service (GHS), which were in turn responsible for transferring these resources to regional and district health offices (RHO and DHO). Although there was no leakage between MOH and tertiary hospitals on Item 3 transfers, serious delays occurred with all transfers taking place only during the fourth quarter of 2006. At first, MOH did not delay its Item 3 transfers to GHS, which received two tranches of Item 3 transfers, one in August and one in September 2006. The delay between MOH and GHS appeared to have happened with the GH¢19 billion tranche received by MOH in December, which was only transferred to GHS in January 2007.44
Timing in the transfers from the National Health Insurance Council (NHIC) to the
District Health Insurance Schemes. The NHIC receives funding from MOFEP and SSNIT to pay for medical claims through the District Health Insurance Schemes. In 2006, there were significant delays in the transfer of resource from the NHIC to these District Health Insurance Schemes (DHIS). The SSNIT released total GH¢213 billion to NHIC in May, August and December, while NHIC reported to have received only GH¢189 billion. Although it is possible that the December release did not register in the NHIC‟s account, this transfer should have been realized on the same day, as it was a bank transfer. Moreover, the majority (90 percent) of resource transfers only happened during the last three month of 2006, when MOFEP transferred GH¢188.8 billion to NHIC. It appears that the NHIC operated most of 2006, up to August 2006, out of funds from the previous year, and only then did MOFEP transfer a significant amount of resources to NHIC.
43 The PETS results for the health sector were designed to be representative at the national and regional level. 44 This delay between MOH and GHS appears in turn to be a ripple effect of delays in transfers between MOFEP and MOH.

- 55 -
D. CONCLUSIONS AND RECOMMENDATIONS
2.32 This chapter reviewed the factors relating to the allocation and outturn of expenditures and to the effectiveness of subnational transfers. The allocations and outturns of expenditures appear to be skewed to wages and salaries, accounting for an increasing share of domestic revenue collection. While in recent years there has been increased funding for discretionary expenditures, including capital expenditures and transfers, in many instance these have been funded by one-time revenue and financing sources, including the frontloading of part of the MDRI debt relief, proceeds from the 2007 Eurobond issue, and divestiture receipts. Meanwhile, discrepancies that have appeared in the transfers to subnational governments and agencies are due to: (i) the low quality of record keeping, which is crucial to enforce the transparency of resource flows; (ii) the shortcomings in the exchange of information between different levels of the public administration; and (ii) the inadequate timing of resource delivery. The ensuing paragraphs outline a policy agenda to improve public expenditure patterns and ensure that transfers to subnational levels of government reach their desired objectives.
Recommendations
Improving Public Expenditure Patterns
2.33 The reduction in the overall fiscal deficit should result from greater fiscal discipline at all levels of Government, as well as policy reforms aimed at ensuring fiscal discipline in key areas of public expenditure management.
Short term
Strengthen oversight of records regarding the entrance, exit and the transfers of employees in the payroll system, beyond what the legal requirements stipulate. The weaknesses in the overseeing employee records were compounded by software problems, as neither the records of employees who exited employment were promptly removed from the system, nor were records quickly updated to reflect transfers within the public sector. The responsibility for updating the payroll records is decentralized to the respective MDA, so at times it takes several months for records to be updated. Even though heads of departments sign the on the number of employees in their departments on a monthly basis, there is no structure within the MDA or from a central source (e.g. CAGD or OHCS) to routinely check whether staff on the payroll are indeed at post.
Prepare and make available to the general public through the webpage of the Ministry of Finance and Economic Planning timely budget execution reports. This would allow closer monitoring of the implementation of expenditure programs, ensuring the execution of these programs does not fall behind schedule either because these are being crowded out by other programs or because of other implementation problems.
Achieve a better balance between salary and non-salary expenditures, especially in the education and health sectors. In the immediate short run, this will likely entail no net staff increases by MDAs, even though MDAs might be allowed to trade staff positions during the budget formulation stage to improve the distribution of staff

- 56 -
resources within their units. This flexibility should not be allowed however during the budget execution stage.
Medium Term
Ensure greater transparency in the funding of non-salary and capital expenditures in the education and health sectors. In many instances, funding of capital expenditures in the education and health sectors are made through extra-budgetary funds that have close connections with operations. Failure to integrate wage and salary expenditures with non-salary and capital expenditures means delaying improvements in operational efficiency. Delays in improving operational efficiency leads, in turn, to stagnant productivity and to continuous pressure to accommodate demands for more staff since, otherwise, the delivery of services might suffer.
Screening public investment proposals, requiring that project selection is guided by clearly defined priorities, and the preparation of pre-feasibility studies, including the calculation of net present social value using either cost-benefits or minimal costs analysis. These steps should allow funds to flow on the margin to projects with the highest rate of return or the lowest cost of delivery to beneficiaries.
Ensuring that Subnational Transfers Achieve their Desired Objectives
Short term
Develop a simplified reporting system that can easily trace the amount, the quantity, the dates and the unit of resource flows, whether these are financial or in-kind transfers. These would be standard reports, with the same budget codes and following the same accounting procedures.
Identify the reasons behind the budget implementation bottlenecks at the ministerial
level and enforce on-schedule budget releases to line ministries by MOFEP. Discussions among stakeholders could also be beneficial in identifying measures that can strengthen budget implementation.
Identify the bottlenecks responsible for delays in transfers at the district level. For
example, why did suppliers not give sufficient lead time to DEOs when distributing books to schools? Were these delays in the budget processing or in procurement?
Have textbook procurement based on the previous budget rather than the current year
budget, since it appears that the bottleneck for the on-time delivering of textbooks was largely due to delays in release of the budget to GES for textbook procurement. By using the previous year budget release, the GES will have sufficient time to procure and distribute textbooks at the beginning of an academic year.

- 57 -
Medium term Evaluate the capacities of district offices against their mandates. Based on the findings,
it is recommended that the government systematically plan and implement district level capacity building strategies. In this regard, it might be necessary to develop enhanced capacity development strategies for poorer regions.
Review the resource distribution procedures and evaluate whether there are ways to
simplify procedures with a view to improve efficiency. Consolidate and simplify the financial reporting by subnational levels of government, so
as to ensure regular and timely reporting on expenditures undertaken at the regional and district levels of government. Also, encourage development partners to institute a single, consolidated and simple financial report on aid-funded expenditures at subnational levels of government.
Enforce resource flow transparency and downward accountability by regularly
disseminating and displaying critical information in public domains, notably at schools and health centers.

- 58 -
3. CHAPTER III: STRENGTHENING THE SYSTEMS FOR PUBLIC EXPENDITURES AND FINANCIAL MANAGEMENT
A. INTRODUCTION
3.1 The main message in this chapter is that strengthening public financial management systems is critically needed to achieve the new administration’s stated objective of reducing the overall fiscal deficit without compromising the quality of public service delivery and Ghana’s medium term growth prospects. This chapter echoes and elaborates therefore the findings of the two previous chapters. For the past decade and a half, the Ghanaian Government has invested a major effort in modernizing its PFM systems inherited from colonial days, and this has resulted in a new legal framework, new institutions, systems and processes. Each year has seen a building on past achievements. Nevertheless, additional efforts are still needed to have public financial management systems functioning well to support the government‟s goals of controlling public expenditures and increasing the efficiency with which they are used. This is particularly important now when the new administration grapples with large macroeconomic imbalances and the country is facing a particularly unfavorable global environment. Furthermore, by late 2010 or early 2011 Ghana will begin receiving additional fiscal revenues from oil and gas exploration. The ability to convert oil and gas proceeds into long term productive investments with high social returns, while preserving the economy from oil-induced volatility and boom and bust cycles, will require that efforts to improve the PFM framework be accelerated and the regulatory and fiscal framework for oil and gas revenue management with well-delineated, transparent rules and institutions be put in place prior to oil and gas extraction. This chapter endeavors to presents recommendations to address these challenges.
3.2 The chapter is organized as follows. Section B reviews progress on the government‟s Short and Medium Term Action Program (SMTAP) for public financial management. Section C examines the progress in the financial regulatory and management framework. Section D discusses the current status of Budget and Public Expenditure Management System (BPEMS) – the Government‟s Integrated Financial Management and Information System (IFMIS), and the options for strengthening it. Section E outlines steps to strengthen the payroll and management control system – the IPPD-2, Integrated Personnel and Payroll Database – and, in doing so, build robust links between payroll management and control and the budget. Section F reviews the transformation in the government‟s internal and external audit systems. Section G highlights the strengths and weakness in the current system of public procurement. Section H assesses progress in public external debt management. Section I closes the chapter with concluding observations and recommendations.

- 59 -
B. SHORT AND MEDIUM TERM ACTION PROGRAM (SMTAP)
3.3 The Government’s program of PFM reforms is encapsulated in the Short and Medium Term Action Program, now nearing the end of its four year implementation period (2006-2009). The SMTAP encompasses actions in nine areas:
1. Fiscal Policy management- Macroeconomic Stability
2. Budget Formulation/Preparation
3. Budget Implementation
4. Financial Regulatory and Management Framework
5. Integrated Payroll and Management System
6. Aid and Debt Management
7. Revenue Management
8. Financial Sector Program
9. Capacity Building.
3.4 With the SMTAP scheduled to end this year, a fresh program needs to be developed by the new administration. Up until now, the implementation of the STMTAP has benefited from the analysis and recommendations of earlier public expenditure reviews. The implementation of the recommendations from last year‟s External Review was however uneven, reflecting in part the electoral process in late 2008. In particular, recommendations remain to be addressed about the need to reduce in-year budget deviations, particularly those deviations related to weaknesses in payroll management and controls, as well as the need to improve the comprehensiveness, quality and timeliness of in-year budget implementation reports and to refine the assessment framework for public procurement (Appendix 4.1 provides a detailed description of the status of implementation of the recommendations of last year‟s External Review).
3.5 With fiscal policy, macroeconomic management and budget implementation having already been discussed in Chapters 1 and 2, this chapter covers the financial regulatory and management framework, including the IFMIS, payroll management, audit and procurement, and debt management. How to strengthen the MTEF is the subject of chapter 4 of this first volume of the ERPEFM, which reviews the workings of the present system, and suggests ways to make budgeting more strategic through an operational MTEF that is more closely tied to the annual budget process.45
45 Volume II of this ERPEFM provides a more detailed description of the budget process in Ghana and outlines recommendations for operationalizing the MTEF.

- 60 -
C. FINANCIAL REGULATORY AND MANAGEMENT FRAMEWORK
3.6 Ghana has been one of the countries in sub-Saharan Africa that has invested most effort to modernize its legal and regulatory framework for public financial management. Over the past decade and a half, Ghana has updated its finance law and issued new financial regulations, given greater autonomy to the external audit function, created an internal audit commission, and enacted a public procurement law based upon the UNCITRAL model law, and covering all public agencies. In recent years the challenge has been embedding the new institutional structures and processes and building capacity, a process that has continued in the past year. Current efforts to deepen this framework include the draft Ghana Petroleum Regulatory Authority (GPRA) and the fiscal responsibility legislation (FRL).
3.7 While the drafting of the fiscal responsibility legislation is yet to be completed, the Government has been consulting with the IMF on the shape that such a proposed legislation might take. Its coverage could include central and local governments, decentralized agencies and state owned enterprises. If other countries are a guide, it could provide for an annual fiscal report, regular in-year reporting requirements, a strengthening of enforcement mechanisms, and the possible creation of an independent fiscal council to oversee the implementation of this legislation. In this way, it would take to another level the transparency and accountability requirements of the Financial Administration Act. Rather than target a particular fiscal balance, the FRL might incorporate a reference level of debt for the central government, exceeding which would trigger an adjustment. Since this legislation is projected to be enacted on by 2011, the Ghanaian administration intends, in the short term, to lay out fiscal rules aimed at strengthening fiscal discipline and help ensure desired fiscal policy outcomes. The next step is to decide what components of these rules would go into the bill, not least because it would represent a significant further step in developing Ghana‟s legal and institutional framework for PFM.
3.8 A related issue is how arrangements for the management of oil and gas revenues should be reflected in this legislation. One possibility is to incorporate the key principles and mechanisms for managing revenues from oil and gas exploration in the FRL. Another is to include these issues under the Ghana Petroleum Regulatory Authority (GPRA) bill currently being reviewed by the office of the Attorney General. The proposed GPRA bill aims at: (i) establishing the Ghana Petroleum Regulatory Authority (GPRA); (ii) defining the future role of the Ghana National Petroleum Company (GNPC) as a commercial entity; (iii) outlining the fiscal regime for petroleum and gas revenue management; and (iv) determining the revenue information disclosure obligations of the GPRA and other government agencies. Since extensive comments on the proposed bill have been provided by the Bank in a separate letter to Government, this External Review focuses on the two issues related to the arrangements for the fiscal regime. First, the proposed bill envisions a minimum 10 percent of gross petroleum production royalty rate, which is at variance with the advice provided by the Government team working separately on the petroleum fiscal regime, thus creating a certain degree of uncertainty. Also, many of the other elements of the fiscal regime are deferred to the forthcoming Internal Revenue Amendment bill and a Model Petroleum Agreement. It would be useful therefore to clarify these two points, as well as the three points further below, before proceeding with the submission of the bill.

- 61 -
3.9 The proposed GRPA notwithstanding, two other issues need to be considered before finalizing the legislation covered under these two draft bills:
How to minimize the volatility inherent in oil price fluctuations? This External Review proposes a Permanent Income Fund to be established with the revenues from oil and gas exploration assigned to the State, whereby only the interest income on the accumulated assets of the Fund would be channeled into the budget (see paragraph 1.18).
How to ensure that the revenues from oil and gas explorations are effectively used? First, the efforts to improve PFM systems need to be accelerated to enhance the country‟s absorptive capacity for increased revenues. Second, the establishment of the Permanent Income Fund (PIF) would ensure regular reporting to Parliament as part of the annual account of the implementation of the budget. Third, the Permanent Income Fund (PIF) would need to be subject to regular audits by an independent external agency, with the investment performance of the fund periodically evaluated and published. Lastly, the finalization and adoption of the draft Freedom of Information Bill, which would spell out the qualifications and conditions under which one could access official information held by government and government agencies, would provide the opportunity for civil society to seek the information needed to increase its oversight of the use of these revenues. The Cabinet is reviewing the draft Freedom of Information Bill and this review recommends its rapid adoption. This legislation would complement Ghana‟s agenda under the Extractive Industries Transparency Initiative (EITI), which endeavors to ensure the efficient and sustainable use of revenues accruing to Government from mining activities.
3.10 The draft FRL underscores the importance of Ghana making its Medium Term Expenditure Framework more effective. The MTEF would be an essential part of the annual fiscal strategy report the FRL is likely to mandate. This annual fiscal strategy report would be a central instrument to address the incremental character of current budgeting, which, unchecked in an era of rising but volatile oil and gas revenues, risks a ratcheting upwards of spending, leading to growing imbalances in the economy.
D. BPEMS
3.11 BPEMS is the Government of Ghana’s Integrated Financial Management and Information System (IFMIS), and has been the subject of comment in all the previous External Reviews. Most recently, it was reviewed by the MDBS core PFM group, in a report which this ERPEFM draws upon.46 BPEMS was started in 1999, based on six Oracle Financials modules,47 and its development has been marked by rising costs as the Government sought to retrofit the system to the traditional PFM processes instead of modernizing the latter. There were also vendor disputes and growing frustration at the slow rate of implementation on the part of the external partners who earlier were funding BPEMS. BPEMS has now been introduced into 8 pilot MDAs, under the coordination of the BPEMS secretariat, which is part of the CAGD, though staffed primarily by local consultants. Oracle still supports the system, though BPEMS no longer reflects the most up-to-date software, and the costly customization that took place makes future upgrades difficult and expensive. 46 BPEMS Report, by five MDBS external partner PFM advisers, May 2008. 47 General ledger, Purchase order, Accounts payable, Cash management, Public sector budgeting, and Accounts receivable.

- 62 -
3.12 The MDBS PFM advisers, in their April 2008 study of BPEMS functionality, found that BPEMS, which was supposed to become the main computerized PFM system for the Government, had at best a symbolic presence in the agencies it was supposed to be rolled out to, and elsewhere had hardly any impact at all. Of the five MDAs visited by the group of PFM advisers, only three out of the 6 modules were being implemented. Across government, other systems operated in parallel with BPEMS. Paper systems remained predominant, cheques were printed manually, and there were long delays in the approval of invoices. While BPEMS Secretariat is in the process of developing reports specified by the users, the group of advisers estimated that overall no more than 6 percent of the value of Government spending through the budget was being processed through BPEMS.
3.13 At current roll out rate of Government’s IFMIS, BPEMS will be obsolete and not maintainable by the time it reaches full coverage. It is urgent therefore that an alternative path for ensuring an effective IFMIS in Ghana be defined. While part of the reason for the slow roll out of BPEMS is lack of clear leadership, as well as limited staff capacity and training, other factors include connectivity limitations and the lack of willingness on the part of senior government financial managers to commit to operating through BPEMS.
3.14 In the ERPEFM’s team view, the main option facing the Government is re-launching BPEMS using an updated version with standard functionalities (i.e., unmodified) of Oracle Financials, which would include a human resource module to manage the payroll. The current versions of both BPEMS and IPPD-2 are Oracle applications using the same version of the Oracle database (v.10). The accounting modules are used for BPEMS and components of the older Oracle HRMS suite are used for IPPD-2. The replacement of these systems with a newer, unmodified version of the Oracle database would allow BPEMS and IPPD-2 to essentially be a single software solution – Oracle Database with associated Oracle Financial Management and Human Capital Management applications. This solution is a recognition that regardless of BPEMS current performance to date, the time is drawing nigh for ensuring that BPEMS contributes positively to the overall PFM system, as this solution would allow the current legacy systems to be replaced in time with additional Oracle modules.48
3.15 As first steps, this External Review recommends the preparation of an implementation plan, the re-establishment of the BPEMS Project Steering Committee (PSC), the appointment of an overall BPEMS Project Manager with task team managers for the various modules, and the adoption of the Public Sector Budgeting (PSB) module in BPEMS for budget preparation.
48 The legacy systems still in used in Ghana include: (i) ACCPACC for general accounting, used at CAGD, drawing on a different chart of accounts than BPEMS, (ii) the Budget Management System (BMS) used by the CAGD to manage and release the budget for all MDAs through the Bank of Ghana, pending their transfer to BPEMS; (iii) the National Expenditure Tracking System (NETS) used for making budget releases for Item III (Service) and Item IV (Investment) of the budget by most (but not all) ministries; and (iv) ACTIVATE, a budget preparation system which is being used by MOFEP and some MDAs. ACTIVATE was developed about ten years ago by the MTEF Unit in the face of doubts about whether BPEMS would be ready in time to support budget reform.

- 63 -
D. IPPD-2 AND MANAGING THE WAGE BILL
3.16 The Government of Ghana’s wage bill, now 11.3 percent of GDP, up from about 10 percent in 2007, has also been a subject of comment in previous External Reviews because of the growing pressure it is placing on the fiscal balance. The wage bill has grown for several reasons, some of them structural, such as the public sector pay determination process which pits public sector unions and public service heads against the Ministry of Finance. It is also driven by the growth of employees, which is, to some extent, the consequence of policies to expand public services, and the result of the lack of incentives to redeploy workers from less to more productive activities. Lastly, the wage bill has grown because the underlying control systems are fragmented and insufficiently linked to the budget process. The ensuing paragraphs examine each one of these issues.
3.17 First, the pay determination in Ghana is decentralized, with the Government negotiating sequentially the new pay levels for the main services in which the Ghanaian public service is divided. The process is vulnerable to competitive leapfrogging and the emergence of pay anomalies between services. As a consequence, similar jobs attract significantly varied rates of pay in different parts of the Public Service. Ghana has come a long way in the past two decades from pay scales that were low and compressed, almost symbolic, to a situation where public sector wages are, in some cases, more rewarding than comparable jobs in the private sector. Most civil servants can afford to live on their official pay, even if this remains modest for many employees. This was far from the case in the past. At the same time however there are egregious anomalies both within the Public Service and between government pay for certain high demand skill categories and their private sector comparators.
3.18 One consideration to bring more order to the pay setting process is to introduce a single pay spine for all services into which jobs would be slotted, ensuring greater comparability of similar jobs across the Public Service.49 The implementation of the single pay spine should be gradual because of its across-the-board cost implications, and it would be the responsibility of the Fair Wages and Salaries Commission (FWSC) to ensure its maintenance and sustainability. The FWSC would also be responsible for future job analysis, evaluation and grading across the public sector. Although the Fair Wages and Salaries Commission is expected to lead the public sector pay negations this summer, hoping to benefit from information that allows greater comparability across public sector jobs, attention also needs to be given to the other dimensions of pay negotiations, such as quality of services, recruitment, retention and re-location of staff. Indeed, the government‟s intention to progressively move public sector employees into the “single pay spine” provides the opportunity for exploring ways to improve public sector productivity (notably capacity building and wage levels and structure for incentives and accountability), with a view for better service delivery at sustainable costs. It is important therefore that the stronger discipline entailed by the single pay spine be matched by information that provides policymakers with a perspective of how the public sector wage bill fits within the budget and, more broadly, in the Medium Term Expenditure Framework (MTEF).
49 The Single Spine Pay Structure would replace the existing Ghana Universal Salary Structure (GUSS), which was never embraced by all Ghanaian public sector employees, with one vertical structure. Under this new structure, wages increase in equal increments until the salaries of all public sector employees are included.

- 64 -
3.19 Regaining control over public sector hiring is also critical for short-term stabilization needs and longer-term civil service effectiveness. In the short term, this Review recommends that hiring controls be reinforced (through the recentralization of hiring decisions) and public wage increases be kept at fiscally sustainable levels. Over time, fitting the wage bill within an overall MTEF will be essential to ensure that new hirings are both supportive of the country‟s development objectives and fiscally sustainable. At present, the budget has had little disciplining effect on additional staff requests. Both processes are incremental and compartmentalized. Here, a better functioning MTEF is critical. Currently, personnel costs are excluded from the MTEF, and the latter has little or no traction on the annual budget process. Having annual budget ceilings derived from an MTEF that covers all resource flows, financial and human, is key to bringing staffing decisions into a broader and strategic resource allocation process. This issue is therefore elaborated further in Chapter 4 of this first volume of the report.
3.20 In parallel, it will be important to make further progress with the development of the Government’s integrated HR and payroll management system. The origins of the current system, IPPD-2, are in the early 1990s, when its predecessor was developed, its upgrading planned, and then set aside in favor of IPPD-2. The latter is an Oracle based combined HRMIS and payroll system, though not linked to the Government‟s IFMIS (BPEMS). Currently, IPPD-2 data are uploaded manually into the CAGD‟s accounting system, ACCPAC, to enable payrolls to be met. There is no consolidated establishment list for government, and many agencies use their own HR and payroll management systems. MDAs that are part of IPPD-2 enter their own data on staff they hire. However, the Government is continuing to roll out IPPD-2 to more ministries, departments and agencies. The goal, eventually, is to complete the IPPD-2 roll out, fully integrating it into an upgraded BPEMS as a sub-system, which should improve back-up capability, as well as the flow of information on resource use to managers.
E. INTERNAL AND EXTERNAL AUDIT
3.21 The Government of Ghana’s internal audit process was overhauled in 2003 with the passage of the Internal Audit Agency (IAA) Act. The new Act sought to raise the profile of internal audit by establishing an Internal Audit Agency (IAA) to perform a central policy formulation role, establishing standards and recruiting and deploying internal audit staff. In turn, each MDA/MMDA is required to set up an internal audit unit that reports directly to the IAA with copies to entity management. In addition, institutions, bodies or organizations audited by the Ghana Audit Service (GAS) are required by the Audit Service Act to establish Audit Report Implementation Committees (ARIC). These committees have the responsibility, amongst others, to pursue the implementation of matters in all audit reports, including the Auditor-General's reports endorsed by Parliament and the financial matters raised in the reports of internal monitoring units in the institution, body or organization. Where the Auditor General finds the quality of internal audit work to be adequate, reliance can be placed on the internal audit reports, reducing the amount of substantive tests.
3.22 The transformation of the internal audit function by the Internal Audit Agency is proceeding slowly, however. The Internal Audit units in the MDAs are still beginning to be set up with separate organizational codes within these entities, and budget allocations for staff and operational costs have not been sufficient. The IAA is unable therefore to attract enough

- 65 -
personnel with the required skills and competencies to perform specialized audits.50 The staff complains of low pay and poor conditions of service. Proposals have been made to the Head of the Civil Service and MoFEP for a special scheme of service for internal auditors to attract suitably qualified staff, just as is done for the accounting class in the CAGD and the Internal Revenue Service (IRS). This is important to ensure that the implementation of the auditing function proceed in a timely manner.
3.23 The other important transformation of the internal audit function is the shift from pre-payment auditing to adopting risk-based auditing, concentrating on systemic issues. The objectives in this case are to ensure: (i) conformity to the Government‟s strategy; (ii) effectiveness and efficiency of operations; (iii) reliability of financial reporting; and (iv) compliance with applicable laws and regulations. Internal audit should aim at playing an important monitoring role in evaluating the effectiveness of the control systems within the Government‟s operations in meeting its strategic objectives. In performing this role, internal audit should not be involved in maintaining the controls it is supposed to evaluate. This recommendation is important because at present the current business process for BPEMS requires that internal auditors approve transactions in the system before a payment is made. This procedure is however a continuation of their traditional function, which weakens their independence.
3.24 Completing this shift in the way the auditing function is carried out is important because at present most of the work performed by internal auditors is concentrated on financial audit. Also, while the annual audit work plan of internal audit units include audit of budget preparation, more training is needed for internal auditors to be able to properly audit and monitor the MTEF process. In addition, the MTEF process needs overhaul so that it impacts on the budget preparation process in a way that changes incentives, making it more likely that MDA senior managers will see the value of control systems that support their strategic objectives and greater efficiency and effectiveness, and not just compliance with applicable laws and regulations. Completing the way the IAA operates is a prerequisite for transforming the way the budget and the MTEF operates.
3.25 Action is also needed to ensure follow up of the findings and recommendations in all audit reports. To achieve this objective, the Financial Tribunal,51 whose orders are enforceable in the same manner as an order of the High Court, needs to be made functional, which they are at present not. The setting up and operationalizing the Financial Tribunal will contribute to consolidation of the initial successes registered by the Internal Audit Agency.
3.26 Meanwhile, external auditing will benefit from completing these actions to strengthen the internal audit function. The Ghana Audit Service (GAS) should be able to rely on the work of the internal audit agency, whenever the standards adopted by internal auditors are deemed sufficiently robust, avoiding unnecessary duplication, helping reduce further the backlog
50 While 11 qualified persons were recruited as directors of audit for the MDAs, only 3 assumed their posts. 51 The Tribunal should comprise of a Justice of the High Court, as Chairman, a Chartered Accountant and a Management Accountant, or professional appraiser, who would be nominated by the Chief Justice in consultation with the Judicial Council and appointed by the President.

- 66 -
of unaudited accounts and expediting the turn-around time for submission of General Auditor‟s report to Parliament.
F. PUBLIC PROCUREMENT
3.27 The main finding of the most recent (2007) National Procurement Assessment is that the proportion of public procurement subject to open, competitive bidding on a transaction basis declined to about one-quarter, down from around one-half in the 2006 report. This finding is important because in 2003, Parliament passed the Public Procurement Act, legislating principles of open, competitive procurement by all public bodies, and establishing the Public Procurement Authority (PPA) with powers to issue procurement regulations and oversee the procurement activities of all public entities. The years since then have seen the establishment of the PPA, the creation of a cadre of professional procurement staff, the modernization of procurement regulations, and the bringing of all public bodies under the Act. In the 2007 External Review public procurement was given special attention and performance was assessed using the OECD procurement assessment methodology. Ghana had participated in the development of this assessment methodology, and, on its side, the PPA created its own assessment tool – the Public Procurement Monitoring and Evaluation (PPME), to be applied annually to measure progress across the public sector implementing the new procurement framework. PPA issued its first National Procurement Assessment Report for 2006, followed by second report for 2007. The 2008 report is currently under preparation.52
3.28 These assessments are important because, although the legal and institutional foundations for sound public procurement are now in place in Ghana, there is the needed to continuously monitor how these arrangements are being applied, as well as to build capacity and institutionalize the processes now laid down in all the ministries, departments and agencies of the Government. The Government‟s 2007 National Procurement Assessment Report, issued by the PPA, covered 515 entities of central and sub-national government, state owned enterprises, teaching institutions and hospitals, the Bank of Ghana and financial institutions. By using the same methodology as 2006, although with a larger and more representative sample of entities, the PPA was able to benchmark some of the progress thus far. While the report showed progress in some areas, it also highlighted some weaknesses:
Entities show little interest in who carries out procurement in their organizations;
Most procurement departments, where they exist, are understaffed, and there is a general lack of procurement professionals;
Few entities had established complaints and appeals mechanisms; and
Invitations to bid and contract award remain weak areas, and contract management showed no improvement over 2006.
3.29 This ERPEFM underscores the conclusions of the 2007 National Procurement Assessment. It recognizes that it will take time to build the professional skills and experience, 52 Procurement is also one of the high level indicators of the PEFA process, and has been reported on in that context also. In this way, there has been close domestic and external monitoring of the implementation of the Act.

- 67 -
and familiarity with new processes. While part of the challenge is on the supply side – creating a cadre of experienced procurement professionals – the PPA assessments also point towards a demand side problem that should be addressed in a timely manner, namely the low status senior management assigns to the procurement function. Previous External Reviews have estimated that spending equivalent of between 15 to 17 percent of GDP passes through the public procurement systems of all levels of government, indicating the significance of the function for using public resources efficiently.53 Although entities are more aware that there is a well defined set of rules for public procurement, watched over by the PPA and statutorily enforced, many are still not giving the procurement function the importance it deserves. This in turn is part of a larger issue discussed at various points in this report – the priority given to all aspects of PFM, and the recognition that PFM is not just about rules compliance, but a vital underpinning of public entity performance. This will change only when budgeting ceases to be incremental and becomes more about achieving policy and program goals within finite entity resource envelopes. Once budgeting incentives change, the status of the procurement function in ministries, departments and agencies should improve.
3.30 The ERPEFM strongly supports the continued use of the PPA’s procurement assessment tool, the PPME. Of particular interest is the proportion of public procurement subject to open, competitive bidding on a transaction basis, which in the 2007 report declined to only about one-quarter, down from around one-half in the 2006 report.54 While these two estimates are not entirely comparable, the finding is still significant. The 2006 sample was skewed toward larger public sector entities, more likely to follow competitive processes, and the sample of entities reviewed in the 2007 assessment appears to be more representative, containing a large number of entities procuring smaller amounts and therefore relying disproportionally on price quotation as a procurement method.55 The information is therefore very important and will continue therefore to draw increasing attention. First, the share of procurement following competitive procedures is a critical measure of the effectiveness of the system as a whole. Second, given donor interest in the greater use of country systems, it will be important to measure and track the ratio of open and competitive bidding to total procurement on a total value basis. 3.31 Also, to improve Ghana’s procurement practices there is the need to go beyond actions by the PPA and include clear incentives from and sanctions by MoFEP. The first step is to have final public procurement plans for the MDAs submitted to the Public Procurement
53 This estimate of total procurement in Ghana appears to be on t9he high side. For instance, as a comparison, the combined public procurement market for goods and services openly advertized among the 15 main countries in Europe added to 16 percent of GDP in 2002. 54 In either case, Ghana still ranks below the threshold for an „A‟ score under the PEFA methodology, which requires that more than 75 percent of the procurement contracts be awarded on an open competitive basis. A „B” pt a „C‟ score requires that either more than 50 percent, or less than 50 percent of the procurement contracts, respectively, be awarded on an open competitive basis. This means that in 2007 Ghana scored a clear „C‟ on the PEFA indicator for „competition, value for money and controls in procurement (the PI-19 indicator), down from a borderline indicator between a „B‟ and a „C‟ score in 2006. The PEFA ranking for this same indicator for other countries in Africa is the following: Rwanda, „A‟, Mauritius, „B+‟, Kenya, „B‟, Cote d‟Ivoire, „C‟. Rwanda ranks particularly high under this indicator, with 82 percent of contract in 2006 awarded on the basis of open competition, accounting for 73 percent of the total value of contracts above the threshold awarded during that year. 55 For instance, half of the entities sampled in the 2007 assessment (258 out of 515 entities) were located outside the regional capitals, while none of the entities were located outside the regional capitals in the 2006 assessment.

- 68 -
Authority (PPA) soon after the approval of the appropriation law by Parliament. These procurement plans would then provide the basis for budget releases by CAGD to these MDAs.
G. DEBT MANAGEMENT
3.32 Improving debt management has been a Government policy goal in recent years, especially since the country became eligible to the Heavily Indebted Poor Countries (HIPC) and Multilateral Debt Relief Initiatives (MDRI). Furthermore, as Ghana moves towards middle income status, the importance of good debt management will increase as the proportion of concessional aid in external finance declines and Ghana becomes more reliant on nonconcessional borrowing to meet its external financing needs. In March 2008 an assessment of debt management capability was undertaken using the Debt Management Performance Assessment (DeMPA) methodology.56 At the Government‟s request, in November 2008, the World Bank followed up with a study of institutional development and capacity building for debt management.
3.33 The DeMPA report concluded that, by and large, Ghana’s mechanisms for debt management were effective. Ghana scored at C or better for 13 out of the 15 Debt Management Performance Indicators (DPIs). Areas identified for improvement, since they did not meet the minimum requirements, were cash flow forecasting and cash balance management, and the publication and updating of a medium term debt management strategy. The study also recommended business continuity planning and a disaster recovery plan.
3.34 Although the budget documents presently contain the Government’s borrowing plans, publication of a separate debt management strategy would enhance fiscal transparency, and be a further step in strengthening the PFM accountability framework. This could be done either through a revision of the present Loans Act or by incorporating the requirement in the FRL, which would also provide for an annual debt report. Strengthening cash management is chiefly a matter of improved forecasting, which in turn would be assisted by the implementation, still to be completed, of a Treasury Single Account (TSA).
3.35 Again, there is a link between strengthening debt management and the MTEF. Having an effective mechanism to manage existing debt, both domestic and external, as Ghana is developing, is clearly important. But the most important challenge, under present circumstances, is controlling the aggregate fiscal deficit, thereby preventing further debt build up. Since total spending reflects the spending pressure at the sector level, a well functioning MTEF, that would ensure that the Government‟s strategic priorities are met, and trade-offs between competing programs are confronted, which underpins sound debt management. 56 The DeMPA (Debt Management Performance Assessment) tool comprises a set of 15 debt management performance indicators (DPIs), which cover the full range of government debt management activities, including the overall environment in which debt management is conducted. Each of the indicators is rated A, B, C or D with C representing the minimum requirement, an „A‟ score representing good practice and „D‟ score representing sub-standard practice. The indicators are grouped into six categories: (i) Governance and strategy development; (ii) Coordination with macro-economic policies; (iii) Borrowing and related financial activities; (iv) Cash flow forecasting and cash flow management; (v) Operational Risk management; and (vi) Other issues. Like the PEFA system, DeMPA enables a government to benchmark its performance and track progress through periodic assessments. Although PEFA does not have an exclusive performance indicator for debt management, PI-16 Predictability in the availability of funds for commitment of expenditures and PI-17 Recording and management of cash balances, debt and guarantees cover areas important to DeMPA, though in less detail. (Ghana scored C in PI-16 and B in PI-17 in the 2006 PEFA).

- 69 -
H. CONCLUSIONS AND RECOMMENDATIONS
3.36 Ghana’s public financial management framework is now quite developed, and is likely to be further strengthened by introducing fiscal responsibility legislation (FRL) and by making statutory the arrangements for managing oil and gas revenues. A FRL could make mandatory the publication of a rolling medium term fiscal strategy, and linked to this, a medium term debt management strategy. A key function of the draft Ghana Petroleum Regulatory Authority bill would be to create a stabilization mechanism to prevent the volatility of international oil and gas prices feeding through to revenue unpredictability.
3.37 BPEMS is now in its tenth year of implementation, yet despite many efforts to roll it out, only a small fraction of expenditures goes through the system, and it continues to operate far below its potential. At the present roll-out rate, BPEMS will be obsolete by the time the process is completed. It is recommended that the Government critically review its options for effectively putting in place a credible and operational IFMIS. In the view of the ERPEFM team, the best option is re-launching the system using standard functionalities (i.e., unmodified) for an upgraded version of Oracle Financials modules, including an Oracle Human Resource Management module for IPPD-2. The new system can then be upgraded regularly to meet the country‟s IFMIS needs.
3.38 A firmer grip on the wage bill is critical for bringing public finances into better balance. The solution for achieving this balance lies with better government pay determination systems, and by relating MDA decisions on staffing to their cost, through a more effective MTEF and annual budget process. An information system that provides comparability of staff strengths and pay across sectors would also help MoFEP regain control over pay determination, aid in annual public sector wage negotiations, and bringing personnel emoluments into a reformed MTEF. These steps would allow annual budgeting to be subjected to realistic medium term ceilings aimed at reversing the seemingly inexorable upward trend of the wage bill.
3.39 Introducing a modern internal audit function that can work in synergy with the external audit function will require action on three fronts. First, there is the need to shift auditing processes from pre-payment audit to adoption of risk based audit concentrating on systemic issues. Second, there is the need to recruit suitable professional staff for these modern control processes, such as it was done to strengthen the career stream for the Internal Revenue Service. Third, there is the need to set up and operationalize the Financial Tribunal to ensure that the findings of the internal audit reports are followed up.
3.40 The implementation of the public procurement framework should be adjusted to measure open competitive procurement by value, not just transaction. Also, senior management needs to give more priority to the procurement function within entities. The first step is to have final public procurement plans for key MDAs submitted to the Public Procurement Authority (PPA) soon after the approval of the appropriation law by Parliament. These procurement plans would then provide the basis for budget releases by CAGD to these MDAs.
3.41 Ghana already has a reasonably well performing government debt management system. The challenge now is to continue strengthening it, particularly in the areas of cash

- 70 -
forecasting and management, and the development and management of a medium term debt management strategy. As is the case with PEFA exercises, the periodic replication of the DeMPA assessment would enable the Government to benchmark and monitor progress.
3.42 The overarching message of this chapter is that strengthening the public financial management systems is central to achieving the Government’s stated objective of reducing the public sector deficit without compromising either the country’s growth prospects or public service delivery. Strengthening these public financial management systems will entail (i) having the Government‟s Budget and Public Expenditure Management System (BPEMS) fully operational and an upgraded Integrated Personnel and Payroll Database (IPPD-2) operating alongside; (ii) transforming the internal audit function and, in this process, strengthening the external audit function; (iii) completing the implementation of the public procurement act; and (iv) upgrading the public external debt reporting system. While these actions to strengthen public financial management systems will contribute toward the ultimate objective of reducing the public sector deficit, it will also be important to have in place an fully operational Medium Term Expenditure Framework (MTEF), that would ensure that the Government‟s strategic priorities are met, and trade-offs between competing programs are confronted. Therefore this review examines the options for operationalizing the MTEF in the next chapter.
Recommendations Short term
Complete the drafting and submission to Parliament of the Financial Responsibility Legislation (FRL), using it as an opportunity to strengthen PFM transparency and accountability, including by making mandatory the publication of the Medium Term Fiscal Framework (MTFF) and linking them to a medium-term debt management strategy.
Ensure that the draft Ghana Petroleum Regulatory Authority bill has effective mechanisms to insulate the budget from price volatility and does not automatically lead to an expansion of the public sector.
Re-launch BPEMS using an updated and unmodified version of Oracle Financials, which would include a human resource module to manage the payroll.
Reactivate the BPEMS Project Steering Committee (PSC), and appoint an overall BPEMS Project Manager responsible for implementing a clear roll-out strategy.
Complete the revision of BPEMS business processes; eliminating the pre-audit function, delineating the authorization controls, cash released to budget holders and the design requirement reports.
Utilize the PSB module of BPEMS for future budget making.
Complete the establishment of the Treasury Single Account (TSA), which will facilitate cash management.

- 71 -
Reinforce hiring controls through the recentralization of hiring decisions and keep public wage increases at fiscally sustainable levels.
Strengthen the internal audit function shifting it from pre-payment auditing to adopting risk-based auditing, concentrating on systemic issues.
Improve the financial reporting infrastructure through timely reconciliation of fiscal and bank information.
Setup and operationalize the Financial Tribunal to ensure that internal audit recommendations are implemented.
Monitor and report on the proportion of public procurement that is open and competitive by value, as well as by transaction.
Reinforce procurement reforms, changing budget incentives by ensuring that budget releases by CAGD are consistent with procurement plans that reflect the Parliament-approved budget appropriations law.
Continue strengthening debt management capacity, particularly through better cash management, including a fully operational treasury single Account (TSA), and the publication of a Medium Term Debt Management Strategy (MTDMS). The latter would be reinforced by an effective Medium Term Expenditure Framework (MTEF).
Medium term
Strengthen the budget‟s annual fiscal reporting, including regular in-year reporting. Stronger in-year budget reporting should also assist in ensuring that budget execution proceeds as planned by providing more readily available information on areas where budget execution is either lagging behind or overachieving. In this context, an upgraded and fully operational BPEMS would greatly facilitate in achieving this objective.
Intensify training of users to roll-out BPEMS and strengthen connectivity and disaster recovery.
Introduce an information system that would provide greater payroll comparability across sectors with a view to resolve present pay anomalies gradually without the risk of giving the wage bill a further boost.
Develop a time-bound process for implementing the payroll management and administration reform, including the introduction of a single pay spine, specifying the pay structure and budgetary implications, to bring more order to the pay setting process while pursuing ways to improve public sector productivity (capacity building and wage levels and structure for incentives and accountability).
Include personnel costs in the overall MTEF to bring staffing decisions into a broader and strategic resource allocation process.
Create an internal audit scheme of service and include staff in a service at a level commensurate with accounting staff.
Conduct a new PEFA assessment to review PFM developments since 2006 and establish a new baseline to measure progress of PFM reforms in the coming years.

- 72 -
Chapter IV: Strengthening the Strategic Role of the Budget
A. INTRODUCTION
4.1 This chapter examines the steps necessary to strengthen the strategic role of the budget by making the Medium Term Expenditure Framework more operational.57 The focus of the chapter is important because making annual budgets reflect the government‟s priorities and be fiscally sustainable over the medium term is especially critical at this junction in Ghana, as the new government inherits a constrained and difficult fiscal situation, requiring immediate corrective action. The good news is that steps can be taken quite quickly to ensure that that the preparation of the 2010 budget is supported by a more effective Medium Term Expenditure Framework (MTEF).
4.2 The main message from this chapter is the need to broaden the comprehensiveness of the MTEF (making it similar to the macroeconomic framework for the annual budget) and then set firm budget ceilings that are endorsed at the Cabinet level. These two steps would encourage the ministries to prepare better budget proposals and, in doing so, confront expenditure trade-offs and prioritize spending decisions. The chapter is organized as follows. Section B describes the current budget preparation process, including the preparation of the MTEF. Section C assesses the current budget preparation practices. Section D outlines key steps to make the MTEF more operational. Section E closes the chapter with a summary of the conclusions and recommendations. Volume II of this year‟s External Review presents a detailed MTEF assessment, with policy recommendations and proposed action plans, which informed the preparation of this chapter.
B. CURRENT BUDGET PREPARATION PROCESS
4.3 The annual budget preparation process in Ghana entails five distinct processes. First, there is a top down process of preparing and finalizing the overall macro-fiscal resource framework and the determination of indicative (not binding) inter-sectoral/inter MDA ceilings, which primarily involves the Ministry of Finance (MoF), but, not at this point, Cabinet. This stage typically takes place during the first quarter of the calendar year. Second, there is the bottom-up process of MDAs (Ministries, Departments and Agencies) preparing their budget estimates, which starts in May/June. Third, there is an interactive process between MoF and MDAs of finalizing the draft budget estimates, normally completed by September. Fourth, there is Cabinet review in October, which usually leads to significant changes. Finally, the budget is presented to the legislature in November, followed by Parliamentary discussion and approval of the final budget, normally during December, in time for the start of the new financial year in January. The Parliament traditionally approves the budget as presented by the Executive, though changes may be made by the latter in the face of adverse criticism. 4.4 The macro-fiscal framework is developed by various departments of MoF working with the revenue agencies to agree on projections of likely domestic tax and non-tax revenues and external resources for the coming three year period. MoF then sets indicative
57 Volume II of this ERPEFM provides a more detailed analysis of the budget process in Ghana and provides recommendations for operationalizing the MTEF.

- 73 -
ceilings for the MDAs for the three years of the MTEF, by source of funds – Government of Ghana (GoG) discretionary funds, funds from Development Partners (DPs), and Internally Generated Funds (IGFs). For discretionary expenditures, separate ceilings are provided for each of the four spending items.58 Initial ceilings reflect the principle that no MDA should be worse off than in the previous budget. In addition, there is an adjustment for once-off events and an attempt is made to incorporate the effects of new policies, as well as the Growth and Poverty Reduction Strategy (GPRS) priorities. At this point, however, Cabinet is not brought into the process to adjust or approve the ceilings. In reality, the basis for the ceilings is the current year‟s expected expenditures, and room is customarily left (typically 15 to 20 percent spending) for later adjustment by Cabinet. The ceilings are then issued to MDAs in the Budget Guidelines, which also contain pro forma tables and instructions on how to complete estimates submissions. No allowance is made for inflation in these Guidelines. Although the ceilings define three year resource envelopes for the MDAs, in reality the focus is on the coming budget year, and there is no evidence that the ceilings for the outer years have any practical effect on resource allocation decisions.
4.5 Within the Guidelines there are ceilings for payroll (Item 1), which are funded by GoG discretionary resources. They are based on current public service staffing and pay levels, adjusted by an annual increment roughly equivalent to expected real economic growth. MDAs, however, are told to construct their personnel emoluments (PE) estimates on the basis of current year salary scales, and instructed not to anticipate any pay adjustments that might be negotiated with public service unions in the coming budget year. Lack of firm data on present staffing levels, however, reduces the precision of this ceiling. The ceilings for administration (Item 2), which include allowances, are typically closely related to the payroll ceilings. The ceilings for other GoG discretionary items (Item 3 – services & Item 4 – investment) represent minimum figures, based primarily on the previous year‟s actual expenditure.
4.6 A separate set of ceilings for external resources, mainly used for investments, is based on current programmed disbursements, adjusted for likely actual disbursements by DP, and may be given one or two years ahead. The ceilings for IGFs are based upon MoF projections.
4.7 Equipped with the Budget Guidelines, MDAs prepare their budget estimates in a bottom-up way, aggregating departmental and district requests which in turn should be guided by sector and sub-sector plans. Many MDAs have sector strategic plans which draw inspiration from the overarching national strategic plan, the GPRS. In some cases, these sector plans feature annual and five year Programs of Work (PoW), capital investment plans (CIPs) or Strategic Investment Plans (SIPs), covering both domestic and externally financed projects. MDAs are likely to have worked with the National Development Planning Commission (NDPC) to ensure that their sector plans and policies are aligned with the GPRS, and may hold internal sector policy reviews to clarify priorities for the forthcoming budget year. Alongside the financial needs submissions, performance information is given, which later will be reflected in the published budget documents.
58 Item 1- personnel emoluments; Item 2 – administration; Item 3 – services; Item 4 – investment.

- 74 -
4.8 A recent development has been the institution of policy hearings between MoF and MDA Chief Directors, immediately following the issue of the Guidelines in May. The hearings are an opportunity to discuss fiscal framework and available resources, and cross sectoral issues. MDAs use this opportunity to present their medium term sector objectives and strategies. While such dialogue is useful, coming after the issue of the ceilings it undermines them, by giving MDAs the impression that the indicative ceilings are really a floor, and more funds will be made available later in the process.
4.9 MDAs then submit their consolidated budget requests to MoF, broken down by detailed inputs, objectives and activities.59 Often submissions are significantly higher than the MoF ceilings, and technical hearings with MoF and NDPC are then held to sharpen priorities, and, hopefully, bring the estimates within the original ceilings, or, alternatively make the case for a higher allocation.
4.10 The next stage is for Cabinet approval of the budget estimates. Rather than endorse the budget as a package, Cabinet typically hears arguments from ministers why their budget envelopes should be increased, and reaches agreement on additional allocations. MoF translates these into final ceilings, which are communicated to MDAs. MoF then reviews revised submissions from MDAs, and adjusts the overall budget estimates accordingly. The Budget Estimates, together with a Budget Statement and the Appropriations Bill are then tabled in Parliament. The Minister of Finance presents the package to Parliament on behalf of the President in the Budget Speech, and the legislature debates and typically approves the Appropriations without significant change. Since the 2006 Budget, Parliament has approved the budget before the beginning of the new budget year on 1 January. In the case of the 2009 budget, the strategy adopted by Government, given that 2008 was an election year, was to submit both the annual budget and an expenditure advance appropriation bill for the first quarter of 2009 to Parliament in mid-November. The advance expenditure appropriation bill was approved by Parliament before end-December, while the budget for the remainder of 2009 was submitted to Parliament on Thursday, March 5, 2009, providing therefore the newly elected Parliament time to review the budget prior to approval before the constitutional deadline of end-March.
A summary of the present budget calendar is given in Box 4.1
59 At present, this detailed breakdown by inputs, objectives and activities is only done for items 3 and 4 of the budget.

- 75 -
Box 4.1: Budget Preparation Timetable
Budget Step Timing Request for input into the budget by civil society and general public January Updating of macro-fiscal framework (MoF) January-March Preparation and circulation of Budget Guidelines (MoF) May MDAs policy review (MDAs) April-June Policy hearings – MDAs, NDPC, and MoF July MDAs prepare budget estimates July-September MDAs submit budget requests to MoF September Budget hearings (“technical hearings”) on MDA requests (MoF) September-October MDAs revise their budget estimates, as needed September-October Submission of draft budget (detailed estimates) to Cabinet October Cabinet recommends changes to MDAs‟ budget allocations October MDAs finalise their detailed budget estimates October Cabinet approves draft budget October MDAs prepare their detailed MTEF volumes October Preparation of Budget Statement (including MDA budget policies and estimates)
August-October
Submission of Budget Statement (including MDA budget policies and estimates) to Parliament
November
Parliamentary Finance Committee discusses and approves MDAs budget estimates
November
Parliament debates and approves Appropriation Bill December Budget information is disseminated to the public, including the preparation of a Citizens Budget
January-February
Source: Based on 2008 and 2009 Budget processes
C. AN ASSESSMENT OF THE CURRENT BUDGET PREPARATION PRACTICES
4.11 An effective strategic planning process is built upon the following foundations: (i) a medium-term perspective to budgetary planning; (ii) a realistic and credible macro-fiscal resource envelope, setting out the overall likely level of all public sector resources over the medium term; (iii) a comprehensive perspective of all public sector resources available; (iv) the explicit linkage of sectoral budgetary allocations to Government policies; and, (v) efficient budget implementation.
Medium Term Perspective to Budgetary Planning
4.12 The GoG’s MTEF performs well on this measure, having presented an aggregate macro-fiscal framework with a multi-year time horizon since the early 2000s. This includes domestic revenues (including IGFs and Statutory Funds), domestic financing, external grants, credits and loans, including budget and project support, HIPC and MDRI resources. While budget comprehensiveness continues to improve,60 the budgetary information is focused primarily on the coming budget year, not the outer years and, at a more detailed level, the multi-year costs of programs are not shown.
60 Indicator PI-7 in the PEFA framework – the extent of unreported government operations – was rated “A” in 2006, with an estimated 94 percent of income and expenditure on aid financed projects captured in fiscal reports.

- 76 -
4.13 Inevitably, resource projections over the medium term are less reliable than the short term, and MoF plans to continue its efforts to improve their quality. Currently, however, the critical issue is not whether these projections prove accurate over the medium term, but the comprehensiveness of the resource envelopes derived from the projections (see section on comprehensiveness further below).
Realistic and Credible Macro-fiscal Resource Framework
4.14 Although projections of individual tax and grant components are sometimes at variance with actual collections, in aggregate these revenue projections have proved quite accurate, robust enough to support a system of first and credible budget ceilings, without the need for revisions during the year. In terms of overall receipts, over the past three years, total revenues and grants have been within 3 percent of projections in the relevant Budget Statement/MTEF.
4.15 Ceilings, which are intended to enforce spending limits and to encourage MDAs to prioritize their expenditures within a hard budget constraint, have, however, not been credible. Each year there are wide variations between the indicative ceilings issued to MDAs at the start of the budget preparation process, and the final MTEF ceilings. Between 2005 and 2007 the difference between the indicative and the final ceilings, in aggregate, ranged from 1 percent in 2005 to 19 percent in 2007. In the latter case, there was a much larger contingency amount in the final ceilings. In response to the malleability of the initial MoF ceilings, the largest 16 MDAs submitted initial spending bids 49 percent higher than their aggregate ceilings. This suggests that the indicative ceilings issued by MoF are simply the latter‟s opening position in a battle for resources, and that line ministries submit spending proposals greatly in excess of the ceilings, confident that they will get significant additional resources from Cabinet. MoF ceilings are thus a “soft” rather than a hard budget constraint, and do not force MDAs to plan within available resources and to confront policy and program trade-offs when spending limits are reached. This in turn has implications for the strategic planning sector ministries undertake, which appear not to be undertaken with an eye upon the envelope of resources likely to be available to the MDA over the medium term. Lack of an effective ceiling setting process encourages MDAs to embark on plans that may not be fully implemented. The policy hearings after the Budget Guidelines have been issued should serve therefore to discuss the expenditure trade-offs that these ceilings entail, rather than to indicated that these ceilings are, in effect, subject to negotiation.
Comprehensiveness 4.16 A MTEF should be comprehensive of all public resources and all public spending to link expenditures to government policies effectively, and to present the overall trade-offs between expenditure alternatives. An analysis of the MTEF indicates that the prioritization process is not comprehensive, representing less than 50 percent of total public expenditure. This arises because, although the aggregate macro-fiscal framework is reasonably comprehensive, the detailed allocations to activities in the MDA estimates volumes are not. The latter cover only services and investments. Allocation and prioritization of personal emoluments and administration expenditure, expenditure of the Statutory Funds, MDAs‟ internally generated funds, HIPC funds and some DP project resources occur outside the MTEF planning process.

- 77 -
Similarly, separate processes govern the allocation of domestic and externally financed investment. These differences result in a significant fragmentation of the budget process. For the 2008 budget, the detailed volumes cover less than half (around 42 percent) of total non-interest appropriated public expenditure.
Linkage of Sectoral Allocations to Government Policies
4.17 An effective strategic budgeting process ensures that sufficient resources are provided to implement the Government’s documented policy priorities, such as the GPRS and the MDGs. This requires both an inter-sectoral allocation process (“top down”) that results in a transparent allocation of resources to sectors and MDAs in line with government priorities, and that trade-offs among competing policy choices are clear to Cabinet when reviewing decisions on allocations. Such allocations have to be approved early in the budget preparation process and communicated to MDAs before they begin their detailed budget submissions. This needs to be complemented by a “bottom-up” process of intra-sectoral/MDA allocation that resolves trade-offs within the sector (or MDA), is based on realistic estimates of the amount of resources to achieve policies in a cost-effective manner, is comprehensive of all spending in the sector, and includes all sector spending in the sectoral analysis.
4.18 The current MTEF preparation process facilitates neither the top-down, nor the bottom up-goals. The format of the current MTEF, while it contains copious detail, does not present strategic information to Cabinet in a way that allows it to see clearly and decide relevant policy trade-offs. There is no separate MTEF policy document which presents the macro-fiscal picture and the strategic allocation issues to Ministers collectively at the start of the budget preparation process, as in many other countries. Rather, the budget ceilings are issued to MDAs without the benefit of prior political consultation and thus endorsement. This means that there is no mechanism for securing political commitment and thus high level backing to the expenditure ceilings that are issued to ministries, departments and agencies. This undermines their credibility, and sets MDAs up to challenge their allocations by later appeals to Cabinet, rather than confront the intra-sectoral trade-offs that may need to be made within their sectors in order to implement Government priorities. Ministries prepare ambitious strategic plans based on needs rather than resource availabilities, and then use the budget process to bargain for as many resources as possible. But since there are never enough resources to implement every MDA‟s strategic plan, in practice, none get implemented effectively.
4.19 Technical hearings, in turn, focus more on the need for additional resources rather than on sector performance and the cost effectiveness of past and planned expenditures (and the results of spending). The dialogue in these hearings is not about performance, but about whether or not additional inputs can be approved.

- 78 -
Budget Implementation 4.20 A long running weakness of the Ghana budget system is the tendency for the budget that is implemented to diverge from the budget as approved at the beginning of the year by Parliament. This divergence was first measured in the 2006 PEFA, and has continued, particularly for expenditure variance at the level of major budget heads, which in the past five years has averaged 26 percent. The reasons appear to be weakness in payroll planning, which was discussed in previous chapters and is explained further below, as well as poor in-year predictability of resource flows to MDAs relative to their spending plans.
4.21 Successful strategic budgeting requires that MDAs have predictability in their receipt of funds through the year, that Treasury releases are in line with agreed MDA expenditure and procurement plans and that these releases take place in a timely and regular manner. There are significant differences between MDAs‟ own cash plans and the timing and amounts of Treasury releases, both by MDA and by spending item, particularly services. There are also gaps between cash plans and cash ceilings, suggesting that the process whereby the Treasury and MDAs agree on cash plans is not working well. It also points to efforts by the Ministry of Finance, which, having failed to hold down the size of MDA budgets during preparation, is now trying to bring the budget back to its originally desired shape through tightly managing the release system.
4.22 Another weakness in budget implementation is the difficulty budget managers have with reviewing budget performance during the year. Because of different systems, it is not possible during budget implementation to report on the budget as planned down to the level of activities.
D. MAKING THE MTEF MORE OPERATIONAL
4.23 Three issues need to be addressed to make the MTEF more operational. The first is to strengthen political commitment to the budget parameters early in the preparation process, thereby enhancing the Cabinet‟s role in the MTEF/budget process, and its ownership of the framework which is to govern budget preparation. It is recommended that Cabinet be engaged early in setting and then supporting the sectoral/MDA ceilings that are issued with the Guidelines. The second is to exert greater control through the budget over the planning and management of the payroll. This requires improving the quality of information on existing remuneration and staffing levels across all services, thus allowing greater comparability across public services and the enforcement of a hard budget constraint on the payroll. Control would be further strengthened if annual pay negotiations could be completed before the beginning of the financial year, incorporating these results in the annual budget. Third, sectoral/MDA planning should be linked more closely with annual budgeting by ensuring that the MTEF includes all categories of budgetary resources, and that sector plans be drawn up not on a “needs” basis, as at present, but reflecting “availabilities” of the MTEF resources envelopes. This in turn has implications for policy making. Until the MTEF coverage is widened, it is difficult for MDAs presenting new policies to Cabinet to determine whether their costs can be fitted within their medium term resource envelopes, since the latter are not comprehensive of all government funds.

- 79 -
Increasing the Political Commitment to the MTEF/Budget Process
4.24 The best way to increase political commitment to the MTEF (as opposed to the annual budget) is to start the budget process with a high level discussion of the macro-fiscal situation, the MTEF and decisions on budget allocations. A feature found in other countries operating MTEF based budgeting is a Budget Framework Paper (BFP) produced by the Finance Ministry early in the budget preparation cycle. Such a step is strongly recommended for Ghana. The BFP would review macro-fiscal developments, analyze the resource requirements of current and proposed Government spending priorities, and update the MTEF resource envelopes. Its introduction would require a revision of the budget calendar, featuring Cabinet review and approval of the ceilings before they are issued to MDAs. Currently the Guidelines are issued to MDAs in May, but by eliminating the re-making of the budget after Cabinet‟s review in October, they could be issued in June and preceded by a BFP process in April/May. To improve accountability and transparency, the document might be published and include a period of consultation with private sector and civil society stakeholders. The BFP could be tied in with the present Policy Hearings, either during drafting or as part of the wider consultation process. The BFP and any resulting consultations would then be reflected in a Cabinet Memorandum drafted by MoF (reflecting also inputs from NDPC) seeking formal approval for the resource envelopes (or ceilings) to be issued with the Budget Guidelines.
4.25 With Cabinet endorsement of the proposed ceilings, detailed budget preparation would then be disciplined by a politically endorsed hard budget constraint. Ministers would have in turn collective ownership of the spending priorities that the ceilings reflect. The BFP would not only contain the ceilings for the forthcoming annual budget, but also indicative envelopes for the outer years, in constant new budget year prices. Once the budget estimates had been scrutinized by MoF, the complete budget would be taken back to Cabinet and the President for final endorsement before tabling in the Parliament. Unless the broader macro-fiscal environment had changed, necessitating a revision in the budget aggregates, there would be no further adjustment to individual MDA budgets.
4.26 This would change the dynamics of the bilateral budget hearings between individual MDAs and MoF. Instead of debating the justification for increasing one input or another, the dialogue could increasingly turn to outputs and results, utilizing the performance information available in the MTEF documents.61 Over time, with progressively greater discretion over inputs, accounting officers would be held accountable for results.
4.27 While MoF might prudently hold back a small (say up to 3 percent) planning reserve, this would intentionally be kept small to prevent MDAs gaining the impression that MoF was holding back on a significant amount of resources which they could compete for. MDAs would be given to understand that the share of one ministry could be increased only
61 These in turn would need to be revised to be fewer in number, linked to programs rather than activities, and made more strategic. Full performance budgeting would not be appropriate for Ghana at this stage, since it would require sophisticated monitoring and statistical systems, a more performance oriented PFM cycle, the strengthening of the analytical and scrutiny capacity within MoFEP, MDAs, Cabinet and Parliament, with the needed political support. In the meantime, performance information of a more strategic nature than presently exists could be incorporated in the budget and used in the budget dialogue, while a performance culture is gradually build, alongside information systems and skills. A start could be made drawing on performance information from the APR process, perhaps on a pilot basis, building incentives for MDAs to develop such capacities.

- 80 -
by reducing the share of another, and to obtain additional resources, they would have to find savings elsewhere within their resource envelopes or persuade another minister to surrender part of his/her share. Use of the planning reserve would be authorized only by a small high level MTEF/Cabinet budget committee on the recommendation of MoF. In turn, this Cabinet committee would monitor the MTEF/budget process, review the proposed resource envelopes, and be supported by a technical working group of MoF officials.
4.28 A sectoral budget review committee comprised of senior officials from across the sector could be established in key sectors to coordinate sectoral policy and review the effectiveness of budgets in implementing these policies. Such committees could also be a focus for dialogue with private sector and civil society stakeholders.
Improving Payroll Planning
4.29 In recent years, the wage bill has been the part of the budget which has expanded fastest, to the point where it now amounts to 11.3 percent of GDP, crowding out other categories of spending and threatening fiscal sustainability. One of the reasons why it has grown uncontrollably has been because it has not been brought within an effective MTEF process. A second reason is the piecemeal character of pay negotiations.
4.30 The first step is to improve MDA reporting on staffing levels, both approved positions and actual staff, backed up by regular inspections, with sanctions for non-reporting units. Next, it is highly desirable to complete public sector pay negotiations before the beginning of the new year, so that the budget presented to Parliament is based upon payroll costs which will not be changed in the course of the year. To avoid leap-frogging between services and to enable the Government to regain greater control over the pay setting process, the ERPEFM supports the use and dissemination of information that allows greater comparability of the pay scale and staff numbers across all the public services. In the short run, it will be necessary to retain separate ceilings for personal emoluments. Overtime, MDAs should be encouraged to take a fresh look at the balance within their budgets between staff and other costs, and be allowed by MoF to progressively shift resources between items as long as the overall resources envelope for the MDA is not breached.62 At the same time, it is recommended that MoF, working with the Office of the Head of the Civil Service, devise a strategy for bringing the total wage bill of the government to a more sustainable level. Introduction of simple payroll modeling software could greatly facilitate this process, by helping the Government explore different strategies of pay reform and rebalancing of staffing levels and their retrenchment and pension implications. In the long run, staff costs will be contained only when MDA heads face a single aggregate resource constraint, and have an incentive to manage their total resources to achieve program objectives by getting the right balance between staff, other current and capital inputs.
62 Initially between Items 1 and 2 of the budget, personnel emoluments and administration, respectively, eventually between the others as well, as MDAs increasingly focus on overall program performance.

- 81 -
4.31 Other features of these wage negotiations would include the following: (i) that both parties have access to common data on the full context in which the negotiations are taking place including essential macro and microeconomic issues and data and the broad budget parameters that provide the frame for negotiations; (ii) wage increases would be linked to increases in public sector productivity, in addition to cost-of-living factors; (iii) the government would have a full understanding of its establishment wage bill, including on-costs, wage bill envelope in the current fiscal year under negotiation and at least two out-years (e.g. MTEF integrated projections); (iv) government would have firm data on wage variations across the public sector which should preferably be minimal on similar job entities amongst MDAs and subvented agencies; (v) government would have a defined cap (which could include a small range rather than a fixed cap) for the total public sector wage bill embedded in the MTEF and the budget; and (vi) the government would have a clear, costed, publicly stated wages policy of what is economically feasible. Wage negotiations could cover a multi-year period, preferably aligned with the MTEF and/or the electoral cycle – 3 to 4 years, with mechanisms that will automatically provide annual adjustments (e.g. CPI changes) or in specified extraordinary circumstances (e.g. sudden large annual increases in food prices).
Sectoral Planning 4.32 There is the need for comprehensive sector planning that encompasses all public revenues and financing, since at present funding from IGFs, statutory funds, HIPC and MDRI resources are mostly outside the ceilings given to the spending units. While the main sectoral ministries and their agencies have made good progress in recent years developing sector and subsector plans, complete with objectives, performance measures and the resources needed for getting there, these plans are not resource constrained, and are based on “needs” rather than “availabilities”. As a consequence, they seldom fit within the Guideline ceilings, encourage the MDA to contest their original allocations and set the stage for Cabinet authorization of additional spending. Even when MDAs are required to scale back their plans to fit within available budget resources, this is often done not by reducing the scope of policy, but by diluting the resources available so that no service delivery unit is funded properly, and efficiency is reduced.
4.33 Avoiding the dilution of sectoral plans and the fragmentation of the budgets can only be resolved once sectoral budget ceilings encompass all the public revenues and financing available to the respective sector. At the moment, however, sectoral budget ceilings cover only GoG discretionary resources and some donor funds.

- 82 -
E. CONCLUSIONS AND RECOMMENDATIONS
4.32 While the MTEF has become well embedded in annual budgeting in Ghana, it does not perform as well as it should as an instrument for making annual budgets which are both affordable and consistent over the medium term, and reflect government priorities. The main weaknesses are the lack of firmness in the ceilings of the Budget Guidelines, the poor control over staffing numbers and the way annual pay increases are negotiated, and the lack of comprehensiveness in MTEF allocations at the MDA level. As a result, the incentives for ministries to prepare better budgets, confront trade-offs and make spending priority decisions are weak.
Recommendations
Short run
Broaden the comprehensiveness of the MTEF (making it similar to the macroeconomic framework for the annual budget) and then set firm budget ceilings that are endorsed at the Cabinet level. At the moment, while the MTEF includes almost all public revenues and financing, the budget ceilings mostly cover only GoG discretionary resources and some donor funds. Revenue and expenditure items such as Internally Generated Funds (IGFs), statutory funds, and HIPC and MDRI resources are mostly outside the budget ceilings provided to the spending units. The MTEF will never become the principal instrument for budget planning and management and for financially sustainable policy making until it is comprehensive of all funding.
Early in the budget preparation cycle introduce a Budget Framework Paper (BFP) to encourage dialogue and consensus on budget priorities, and obtain endorsement by Cabinet of MoF medium term spending ceilings.
Tighten wage bill controls by improving staffing data reporting to MoF, ensuring tighter controls on new positions and bringing staffing within the prioritization mechanisms of the MTEF.
Enforce payroll controls, complete public sector pay negotiations before start of new FY, and proceed with adopting an information system that allows comparability of pay scale and staff numbers across all public services. These steps should help government regain control over the payroll and end the instances of wage leapfrogging within the public sector.

- 83 -
Medium term
Develop sector expenditure strategies to provide a less detailed and more strategic way of allocating resources to expenditure priorities.
Introduce sectoral budget review committees to co-ordinate sectoral policy and strategies and review effectiveness of budgets and resources use against these policies.
Develop payroll modeling software in an effort to improve annual and medium term projected payroll requirements.
Over time, provide more discretion for MDA budget managers by gradually shifting responsibility for expenditure control to their Accounting Officers (e.g. Chief Directors).

- 84 -
Appendix 4.1: Progress in implementing the recommendations of last year’s External Review
1. This appendix reviews the progress in implementing the recommendations of the 2007 ERPFM. These recommendations centered on many of the issues examined in this External Review, namely the drivers of additional public spending in 2006 and 2007 and the need to increase the effectiveness of public financial systems. The recommendations included: (i) strengthening public expenditure management, including by increasing the pro-poor orientation of expenditures the public spending and by ensuring value for money on public investments; (ii) completing the implementation of the Integrated Personnel and Payroll Database (IPDD2) and other measures aimed at reasserting control over the wage bill; (iii) improving the management and processes of the Government‟s Integrated Financial Management and Information System; and (iv) strengthening budget management by reducing budget deviations with more realistic budget formulation and regular reporting on budget execution.
2. The report also focused on developments in public procurement, noting that a strong foundation had been laid for open, competitive and transparent public procurement and a major effort is underway with a view to building understanding of the new system and capacity to manage it. The report urged Ghana therefore to continue building this institutional capacity for public procurement through training and creation of a specialist procurement cadre. It should also refine the Public Procurement Authorities‟ (PPA) monitoring tool, improving information on future tendering opportunities, mainstreaming procurement into the national budget process, making an independent appeals and complaints mechanism operational, undertaking procurement audits, and reforming the procurement regulatory framework.
3. The progress in implementing the recommendations of that report since it was issued in February 2008 has been uneven, reflecting the in part the electoral process that took place in the intervening period. There has been some progress on expenditure management, with the completion of the work on the Public Expenditure Tracking Survey (PETS) and the establishment of the Project Financial Analysis Unit (PFAU) at the Ministry of Finance. There continues to be large budget deviations primarily associated to slippages in the wage bill due to weaknesses in payroll management and control, however. The electoral season also saw an increase in delays in budget releases for items 3 and 4 of the budget. These developments highlighted the importance of the recommendation in last year‟s report about the need to improve the comprehensiveness, quality and timeliness of in-year budget implementation reports. Lastly, progress in further refining the institutional arrangements for public procurement has been mixed. While some training of tender entities has been undertaken, and the Appeal and Complaints Panel at the Public Procurement Authority has been established, the annual Public Procurement Assessments prepared by the Public Procurement Authority still monitor the contracts awarded by number rather than by value.

- 85 -
Box A4.1: Progress in implementing the budgeting recommendations in last year’s External Review
Challenge Identified by the 2007
ERPFM
Recommendation Progress to date
Strengthen the pro-poor orientation of public spending.
Increase further poverty-reducing expenditures, including by targeting regions with higher poverty incidence.
Deepen knowledge about funding gaps faced by regions with high incidence of poverty and efficiency of public spending at sector level.
The 2007-08 PETS was completed but the recommendations are yet to be adopted.
Need to ensure value-for-money on all public investments.
Establish the Project and Financial Analysis Unit (PFAU) at the Ministry of Finance and Economic Planning to ensure robust procedures and to strengthen institutional capacities for planning, prioritizing and managing public investment resource.
Since last year‟s report, the Ghanaian authorities have established the PFAU. Now actions are needed to mainstream and enforce the task assigned to this unit.
Need to better control the wage bill and address identified weaknesses in payroll management and control.
Implement corrective measures to follow up on findings from census of public servants and the audit of the IPPD2 system. Establish a payroll back-up system and finalize the migration of personnel information of subvented agencies onto IPPD-2.
The budget deviation of the wage bill increased from 16% in 2007 to around 30% in 2008. A payroll headcount was conducted in 2008, but was restricted to staff already recorded in IPPD-2, leaving out employees from subvented agencies. The migration of personnel records from subvented agencies onto IPPD2, which is necessary for ensuring effective payroll monitoring, will be completed in 2009.
Need for strengthened processes to plan, develop and manage IFMIS
Implement recommendations from audit of BPEMS
The BPEMs system was expected to run in parallel with the existing software systems until end-December 2008. The parallel systems are however still in place.
Reduce budget deviations. Ensure consistent reporting on the use of contingency by MDA/line item between appropriated and executed budgets, particularly of personal emoluments, and bring forward public sector wage negotiations.
The public sector wage negotiations in 2008 were concluded after the passage of the appropriations bill. Salary negotiations for 2009 are yet to be concluded.
Improve the comprehensiveness, quality and timeliness of in-year and end-year reporting on budget implementation
Include external financed project expenditures and IGFs by MDA in CAGD reports and improve data accuracy by reconciling data before report finalization.
The fiscal reports produced by CAGD only cover the consolidated fund. In-year financial reports contain inconsistencies.

- 86 -
Challenge Identified by the 2007
ERPFM
Recommendation Progress to date
Improve the comprehensiveness, quality and timeliness of in-year and end-year reporting on budget implementation (continued)
Ensure timely public disclosure of monthly CAGD reports on MoF website or Gazette.
During this year, monthly CAGD reports were not disclosed in a timely fashion in the MoF website or Gazette.
Need to improve the comprehensiveness, quality and timeliness of in-year and end-year reporting on budget implementation
Include external financed project expenditures and IGFs by MDA in CAGD reports and improve data accuracy by reconciling data before report finalization
Ensure timely public disclosure of monthly CAGD reports on MoF website or Gazette.
The reports produced by CAGD only cover the consolidated fund. The in-year financial reports contain inconsistencies.
Weaknesses in the budget execution process.
Address factors contributing to variations and delays in the process from commitment to actual expenditures.
Improve budget execution of donor commitments, particularly project funding.
A recent study by the Ministry of Finance and Economic Planning confirms the long delays in budget releases, especially in budget releases for items 3&4 of the budget. There is a need to better monitor and enforce donor commitments.
Increasing Institutional Development Capacity
Build up procurement training programs to sustainable levels by relying on local training institutions.
Establish a national certification system for procurement.
Several tender entities have been trained on basic procurement procedures. Seeking funding from the Swiss development cooperation to implement this system.
Improve the Procurement Assessment Framework
Reconsider strategy, preparation and conduct of future self-assessments (increasing focus on risk factors, and quality assurance) and refine the PPME tool prior to rolling out assessment later in 2007.
The proposed amendments to the assessment report have not been passed into law.
Strengthening internal and external scrutiny of procurement decisions.
Consolidate the Appeals and Complaints Panel, strengthening its independence and making public the number of existing complaints that have been addressed.
The Appeals and Complaints Panel has been established in the Public Procurement Authority.