Embed Size (px)
Citation preview
20960
MAiddle Cist Tow±vSs ac aC ViHLAotAs Circle
,Nio Idk Afr4ica
A ,\tLitioC Revie-W
W 0 1orki Pcaper of tkeA Midd eI EastSe-vies cviand ANo v4 AfrAica
J\Jo. 17
,Aa40st 1999
Pe-gional
]-IjNR
Tke WotlId BcakPt'od4ced by tke
Develop'ent f 6piotp
cd
t ,
A-6ic cand Fremc1k FILE COPY
Pub
lic D
iscl
osur
e A
utho
rized
Pub
lic D
iscl
osur
e A
utho
rized
Pub
lic D
iscl
osur
e A
utho
rized
Pub
lic D
iscl
osur
e A
utho
rized


Regional HNP Knowledge Management
Towards a Virtuous Circle
A Nutrition Review of the Middle East and North Africa
Human Development GroupMiddle East and North Africa Region

TABLE OF CONTENTS
FOREWORD ................................................ V
PREFACE ................................................ vi
ABSTRACT ................................................ vii
ACKNOWLEDGMENT ................................................ viii
ABBREVIATIONS ................................................ ix
EXECUTIVE SUMMARY ................................................ x
1. INTRODUCTION - GOOD NUTRITION AND ECONOMIC PROGRESS: A VIRTUOUS CIRCLE ... 1
2. NUTRITION IN MENA - CURRENT SITUATION AND TRENDS ................................................ 4
2-1. PROTEIN-ENERGY DISORDERS .................................................................... 4....................4
(A) UNDERNUTRITION .................. 4
(B) OBESITY AND DIET RELATED DISEASES ................................... 12
2-2. MICRONUTRIENT DISORDERS ................................... 16(A) IRON .................................................................................................................. 16(B) IODINE .................................................................................................................. 18
(C) VITAMIN A .................................................................................................................. 20
(D) VITAMIN D .................................................................................................................. 21
(E) ZINC ................................................................................................................. 22
3. CAUSES, CONSEQUENCES AND DETERMINANTS OF NUTRITION DISORDERS ...................... 22
3-1. BREASTFEEDING AND COMPLEMENTARY FEEDING .22
3-2. GENDER 23
3-3. EDUCATION AND CULTURAL BACKGROUND .24
3-4. DEMOGRAPHIC CHANGES AND CONFLICTS .26
3-5. ECONOMIC DEVELOPMENT .28
4. IMPROVING NUTRITION IN MENA COUNTRIES ............................................ 30
4-1. MAJOR NUTRITION ISSUES IN MENA COUNTRIES ................................... .......... 30
4-2. POSSIBLE STRATEGIES AND ACTIONS ............................................. 31
5. CONCLUSION - NUTRITION AS A PRIORITY ISSUE ............................................ 37
BIBLIOGRAPHY ............................................ 38
i

BOXES
Box 1: NUTRITION IMPLICATIONS OF QAT CHEWING IN YEMEN ............................ ......................... 10
Box 2: NUTRITION IMPACTS OF RAMADAN ...................... ........................................... 13
Box 3: DELIVERING NUTRITION MESSAGES TO THE PUBLIC ........................................................... 25
Box 4: DISPLACED POPULATION IN SOUTHERN IRAQ ................................................................. 26
Box 5: INFLUENCE OF BORDER CLOSURES IN GAZA ................................................................. 29
TABLES
TABLE 1: HEALTH AND NUTRITION INDICATORS IN MENA COUNTRIES .................... .......................... 5
TABLE 2: STUNTING PREVALENCE IN CHILDREN UNDER 5 YEARS ......................................... ................ 7
TABLE 3: AVERAGE FOOD CONSUMPTION (1989) ................................ ................................. 12
TABLE 4: OBESITY PREVALENCE IN SELECTED OECD COUNTRIES .................................................... 13
TABLE5: ANEMIA PREVALENCE ................................................................. 17
TABLE 6: IODINE DEFICIENCY DISORDERS (IDD) ................................................................. 19
TABLE 7: DIETARY ENERGY INTAKE IN IRAQ BEFORE AND AFTER THE GULF WAR ........... .................. 27
TABLE 8: MAJOR NUTRITION ISSUES IN MENA COUNTRIES ................................................................ 31
TABLE 9: NUTRITION INTERVENTIONS ................................................................. 34
TABLE 10: COSTS OF MICRONUTRIENT FORTIFICATION PROGRAMS ............................ ......................... 35
FIGURESFIGURE 1: STUNTING PREVALENCE AND GNP/C IN MENA COUNTRIES ..................... ........................... 2
FIGURE 2: STUNTING PREVALENCE AND GNP/C IN TUNISIA ................................................................. 3
FIGURE 3: ESTIMATED STUNTING PREVALENCE BY REGION ................................................................. 6
FIGURE 4: TREND OF NATIONAL STUNTING PREVALENCE ................................................................. 7
FIGURE 5: STUNTING PREVALENCE HIGHER IN RURAL AREAS ............................................................... 8
FIGURE 6: STUNTING PREVALENCE BY AGE ................................................................. 8
FIGURE 7: COHORT STUDY OF STUNTING PREVALENCE AMONG BEDOUIN CHILDREN ........... ................ 9
FIGURE 8: CHILD MALNUTRITION IN IRAQ ................................................................. 1 1
FIGURE 9: SEVERE CHILD MALNUTRITION IN IRAQ (MONTHLY AVERAGE) ................ ......................... 11
FIGURE 10: OBESITY PREVALENCE (BMI > 30) ................................................................. 14
FIGURE 1 1: OVERWEIGHT PREVALENCE IN CHILDREN UNDER 5 YEARS ....................... .......................... 14
FIGURE 12: DEATH DUE TO CIRCULATORY SYSTEM DISEASES .............................................................. 15
FIGURE 13: PREVALENCE OF DIABETES MELLITUS .......................... ....................................... 1 5
FIGURE 14: ANEMIA PREVALENCE AMONG WOMEN AND CHILDREN ............................... ...................... 16
FIGURE 15: ANEMIA PREVALENCE IN BAHRAIN ................................................................. 17
FIGURE 16: PROPORTION OF TOTAL POPULATION AT RISK OF IDD ................................... .................... 1 9
FIGURE 17: ESTIMATED CLINICAL VAD PREVALENCE FOR UNDER 5 YEAR CHILDREN ........................ 21
FIGURE 18: EXCLUSIVE BREASTFEEDING UP TO 3 MONTHS ................................................................. 23
FIGURE 19: STUNTING PREVALENCE AND FEMALE SECONDARY SCHOOL ENROLLMENT IN MENA
COUNTRIES ................................................................. 25
FIGURE 20: NUTRITION IMPACTS OF INTERNATIONAL SANCTIONS AGAINST IRAQ ............ ..................... 27
FIGURE 21: PROTEIN CONSUMPTION AND GNP/C IN MENA COUNTRIES ..................... .......................... 28
FIGURE 22: STUNTING PREVALENCE AND GNP/C IN EGYPT ................................................................. 30
ii

ANNEXES
ANNEX 1. NUTRITION DISORDERS - BACKGROUND INFORMATION .................................. 47
1. CHILD MALNUTRITION .47
2. BREASTFEEDING AND WEANING .47
3. FETAL MALNUTRITION .48
4. BODY MASS INDEX (BM. .48
5. PROTEIN, CARBOHYDRATES AND FAT .49
6. NUTRITIONAL ANEMIA .50
7. IODINE 51
8. VITAMIN A .51
9. VITAMIN D .52
10. ZINC 52
11. OTHER MICRONUTRIENTS .53
12: HEREDITARY DISORDERS RESEMBLING NUTRITION DISORDERS .54
ANNEX 2. POSSIBLE NUTRITION INTERVENTIONS AND COSTS . ......................................... 56
1. FOOD ENERGY SECURITY .56
2. MICRONUTRIENTS .57
3. PUBLIC HEALTH .59
4. INFORMATION, EDUCATION AND COMMUNICATION (IEC) .60
5. SOCIAL AND ECONOMIC DEVELOPMENT .60
6. EXAMPLES OF PROGRAM COSTS AND IMPACTS IN OTHER COUNTRIES .60
7. NUTRITION COMPONENTS IN THE CURRENT WORLD BANK PROJECTS ANDNUTRITION SECTOR WORKS IN MENA REGION ......................................................... 64
ANNEX 3: OVERVIEW OF FOOD AND HEALTH ISSUES IN MENA COUNTRIES .................... 65
1. FOOD SUPPLY ..................................................................... 65
2. HEALTH AND POPULATION .................... ................................................. 66
3. BASIC INDICATORS IN MENA COUNTRIES .................................................................. 68
ANNEX 4: SUPPLEMENTARY DATA ANALYSES ...................................................................... 70
1. Low BIRTH WEIGHT ..................................................................... 70FIGURE 1: INFANT MORTALITY RATE (IMR) AND LOW BIRTH WEIGHT IN MENA COUNTRIESFIGURE 2: STUNTING PREVALENCE AND Low BIRTH WEIGHT IN MENA COUNTRIES
2. NUTRITION AND FEMALE EDUCATION ..................................................................... 71FIGURE 3: STUNTING PREVALENCE AND FEMALE SECONDARY SCHOOL ENROLLMENT IN MENA
COUNTRIES
..

FIGURE 4: STUNTING PREVALENCE AND MALE SECONDARY SCHOOL ENROLLMENT IN MENACOUNTRIES
FIGURE 5: UNDERWEIGHT PREVALENCE AND FEMALE SECONDARY SCHOOL ENROLLMENT IN MENACOUNTRIES
FIGURE 6: WASTING PREVALENCE AND FEMALE SECONDARY SCHOOL ENROLLMENT IN MENACOUNTRIES
FIGURE 7: Low BIRTH WEIGHT AND FEMALE SECONDARY SCHOOL ENROLLMENT IN MENACOUNTRIES
FIGURE 8: BREASTFEEDING AND FEMALE SECONDARY SCHOOL ENROLLMENT IN MENA COUNTRIES
3. NUTRITION AND ECONOMIC DEVELOPMENT ...................................................... 74
FIGURE 9: DIETARY ENERGY CONSUMPTION AND GNP/C IN MENA COUNTRIES
FIGURE 10: PROTEIN CONSUMPTION AND GNP/C IN MENA COUNTRIES
FIGURE 11: FAT CONSUMPTION AND GNP/C IN MENA COUNTRIES
FIGURE 12: STUNTING PREVALENCE AND GNP/C IN MENA COUNTRIES
FIGURE 13: UNDERWEIGHT PREVALENCE AND GNP/C IN MENA COUNTRIES
FIGURE 14: WASTING PREVALENCE AND GNP/C IN MENA COUNTRIES
FIGURE 15: Low BIRTH WEIGHT AND GNP/C IN MENA COUNTRIES
FIGURE 16: STUNTING PREVALENCE AND GNP/C IN EGYPT
FIGURE 17: STUNTING PREVALENCE IN RURAL AND URBAN AREAS IN EGYPT
FIGURE 18: STUNTING PREVALENCE AND GNP/C IN TUNISIA
FIGURE 19: STUNTING PREVALENCE IN RURAL AND URBAN AREAS IN TUNISIA
FIGURE 20: FOOD SUPPLY AND GNP/C IN TUNISIA
FIGURE 21: STUNTING PREVALENCE AND FOOD SUPPLY IN TUNISIA
4. MICRONUTRIENT DEFICIENCY ...................................................... 83
(A) IRON ................................................................................................................... 83
(B) IODINE .................................................................................................................. 83
(C) VITAMIN A ................................................................................................................... 84
(D) VITAMIN D ................................................................................................................... 85
(E) ZINC .................................................................................................................. 86
ANNEX 5: MENA NUTRITION DATA TABLES ....... 87
iv

FOREWVORD
The countries of the Middle East and North Africa (MENA) region face unprecedentedchalleng,es. The pace of chanige in the global economy has never been faster, prompting the needfor new strategies to promote economic and social development. Economic development andrising incomes signal a new prosperity and govemments in the region are struggling to sustain theimprovements in the quality of life of their citizens, which they have worked hard to bring about.
Good nutrition is key to maintain or improve health, and people's ability to secure anadequate diet is fundamental to achieving social and economic advances. Since nutrition is amulti-sectoral issue, development and improvement in other sectors can greatly affect nutritionalstatus. Nutrition disorders in turn impede the economic development of a country throughdecreasing educational attainment and economic productivity, and increasing health care costs.Therefore, nutritional status is one of the best proxies to measure poverty and social development.In spite of this critical role, nutrition disorders frequently escape notice. Particularly indeveloping countries, the groups most vulnerable to poor nutrition are women and children,especially if they are rural.
This nutrition review of the MENA region is to develop a base of knowledge and a sectorstrategy, and to help fulfill the World Bank's mandate for poverty reduction. This is the firstcomprehensive overview of nutritional issues in the region, putting together the problems in anoverall economic development context. The review focuses on the health implications ofnutritional issues, and supplements a regional study of food subsidy programs and the regionalhealth, nutrition and population sector strategy paper.
The findings of this review are sometimes troubling, and often surprising. Although thenutritional status of most people in MENA countries has improved over the last two decades,undernutrition and micronutrient deficiencies remain a serious threat to public health. Eventhough nutritional deficiencies are strongly linked to poverty, economic progress does not alwaysimprove nutritional status. Thus, even in well performing economies, progress has been uneven,leaving pockets of poverty in its wake, especially among rural populations. This also suggeststhat not only income but the status of women, their educationial attainment, cultural factors, foodand agriculture policies, and access to various social services including health care and cleanwater are critical factors affecting nutrition and nutritional disorders.
I hope this review will help stimulate country discussions in the context of economic andsocial development among various stakeholders and result in effective policies and strategies forimproving nutrition in the region.
nal DervisVice PresidentMiddle East and North Africa Region
v

PREFACE
Countries which comprise the World Bank's Middle East and North Africa region(MENA) vary widely in their economic development, politics, geographic and environmentalconditions, their health status and other social factors. Until now, World Bank activities in thehealth, nutrition, and population (HNP) sector in MENA have focused mainly on health andpopulation, and although the Bank completed some nutrition sector work in Morocco in 1994,and a case study on food subsidy reform in Tunisia in 1996, a comprehensive assessment ofnutritional issues in the region has never been done.
The World Bank HNP sector board approved this nutrition review in the MENA region todevelop a base of knowledge and a sector strategy, and to help fulfill its mandate for regionalknowledge management. The review assesses nutritional status, focusing on the healthimplications of nutritional issues, but the review's scope do not include the assessment of existingnutrition programs. The review proceeds concurrently with a regional study of food subsidyprograms, both of which supplement the regional HNP sector strategy paper. The review aims to:
* assess the region's nutritional status;* analyze the causes and consequences of nutritional problems and their implications for
health;* suggest a strategy to improve the nutrition and health of the people in the region;- develop a database from available sources and literature.
vi
RESUME
Une bonne nutrition est essentielle au maintien ou a l'amelioration de la sante, et l'aptitude desindividus a s'assurer un regime alimentaire adequat est d'une importance fondamentale pour le progreseconomique et social. L'amelioration de 1'etat nutritionnel des populations est liee au progreseconomique, et ce progres aide frequemment les individus a ameliorer leur etat nutritionnel, engendrantainsi un cercle vertueux.
La presente etude du secteur de la nutrition dans la region Moyen-Orient et Afrique du Nord(MENA) a pour objet l'etablissement d'une base de connaissances et d'une strategie sectorielle. Elle visea situer les problemes dans un contexte de developpement economique global, tout en mettant l'accent surles implications sanitaires des troubles nutritionnels.
La securite alimentaire est en grande partie assuree dans les pays de la region MENA, qui ont vul'etat nutritionnel d'une majorite de leurs habitants s'ameliorer au cours des deux demieres decennies.Mais en depit de ces progres, la sous-alimentation et les carences en micronutriments tels que le fer,l'iode et la vitamine D constituent encore une serieuse menace pour la sante publique. En outre,1'evolution des regimes alimentaires a accru l'incidence des cas d'obesite et des maladies nontransmissibles liees a ces regimes.
Bien qu'il existe une correlation tres etroite entre carences nutritionnelles et pauvrete, le progres6conomique n'engendre pas toujours une amelioration de l'etat nutritionnel. Ameliorer l'education desfemmes et l'acces aux autres services sociaux contribue egalement a abaisser la malnutrition infantile surle long terme. Cette 6tude presente des suggestions sur les mesures qu'il convient de prendre face a troistypes de troubles nutritionnels dans les pays de la region MENA, et sur les options strategiques quis'offrent a la Banque mondiale.
vii

Lsi Jj I aL { ,Jj J j Aj a
vJW1k t.: & -1 - > zJI /:ZAI ¢=1 L4 1--N e.5 ,.LJ ;" L.11 "13L
4tj4I!J LpL.,~~.211el ,c.u cLp ail eau L.) 4
cuiil .. ui j t4 9-A1 lJJmI ;^ M ~;,= ,_;aA Lyi 1,4
)z} 3 1 .tA\} |j: 8;^ '.' * @|} 89\ J -RaG~_)LX
Zl .t-88 .cl ; SI viiill sLSUAi Z3 11 S11_)A
LAII~~ ~~.al VL >418 L) Xsi5pl , 4 1I9 Cji ;S}w} o L
Lj . s> g.Ll x1 U-L JiLYI z-i 0;-- r -4>1 o u+W tlL. s
S~~ *0 >9 VN1 :1VI &-A t\> M Xi L,41 4. YL l
.JL Iaei, a)22 a ;lwIo Ll s-i J L.:jY J1
vii (a)

ABSTRACT
Good nutrition is key to maintain or improve health, and people's ability to secure anadequate diet is fundamental to achieving social and economic advances. Improving people'snutritional status is linked to economic progress, and economic progress often helps peopleimprove their nutritional status, creating a virtuous circle.
This nutrition review in the Middle East and North Africa (MENA) is to develop a base ofknowledge and a sector strategy. The review aims to put the problems in an overall economicdevelopment context, while focusing on the health implications of nutrition disorders.
MENA countries have largely achieved food security and the nutritional status of mostpeople has improved over the last two decades. Despite these achievements, undernutrition andmicronutrient deficiencies, such as iron, iodine, and vitamin D, remain a serious threat to publichealth. In addition, changes in the diet have escalated the incidence of obesity and diet-relatednon-communicable diseases.
Even though nutritional deficiencies are strongly linked to poverty, economic progressdoes not always improve nutritional status. Improving female education and access to othersocial services also contributes to lowered childhood malnutrition over the long term. Requiredactions for three types of nutrition disorders among MENA countries and strategic options for theWorld Bank are suggested.
vii (b)

ACKNOWLEDGMENT
This review paper was prepared by Atsuko Aoyama, Health Specialist, MNSHD, as a partof Regional HNP Knowledge Management programs approved by the HNP Sector Board.Takashi Kadowaki and Yoko Nishimura, Consultants, MNSHD, contributed to data research, datamanagement, and cost analyses. Jacques Baudouy, Sector Director, and George Schieber, SectorLeader, MNSHD, provided overall supervision and guidance. Bonita Brindley provided editorialadvice.
We appreciate and acknowledge the following specialists and colleagues in the WorldBank and other organizations.
Peter Heywood, Principal Health Specialist, EASHN, and Donald Bundy, Consultant,HDNED and Professor of the Welcome Trust Centre for the Epidemiology of Infectious Diseases,Oxford University, generously provided technical advice, critical review, and encouragementthroughout the preparation of the paper.
Samir Miladi, Regional Food and Nutrition Officer of FAO/ RNE, and Anna Verster,Nutrition Advisor of WHO/EMRO, provided a large amount of essential regional data andinformation and valuable comments.
Mercedes de Onis, WHO, Bruno de Benoist, WHO, Cathy Needham, UN ACC/SCN,provided essential data and information on global nutrition issues. Mohamed Abu Jahal, IbrahimAziza, and Samir Radi, Ministry of Health, Palestinian National Authority, shared experiences oftheir field nutrition activities in Gaza. Qaed Obadi, Ministry of Public Health, Republic ofYemen, provided updated information on nutrition activities in Yemen.
Milla Mclachlan, Nutrition Adviser, HDNHE, Judith McGuire, Senior Nutritionist,LCSHD, Dario Berardi, Consultant, AFTH4, Kathy Lindert, Economist, LCSHD, Alan Berg,Consultant, HDNVP, and Laura Tuck, Sector Leader, ECSRE, provided technical advice,valuable comments, data and information. Colleagues of MNSHD, including Setareh Razmara,Bahjat Achikbache, Claire Voltaire, Gail Richardson, Marlaine Lockheed, Eva Jarawan, and EgbeOsifo provided country information and useful comments.
viii

ABBREVIATIONS
ACC/SCN United Nations Administrative Committee on Coordination, Sub-Committee onNutrition
BMI Body mass indexCAS Country assistance strategyEMRO World Health Organization Regional Office for the Eastern MediterraneanESCWA United Nations Economic and Social Commission for Western AsiaFAO Food and Agriculture OrganizationG6PD Glucose-6-phosphate dehydrogenaseGDP Gross domestic productGNP/c Gross national product per capitaHb HemoglobinHDL High-density lipoproteinsHNP Health, nutrition and populationIDD Iodine deficiency disordersIEC Information, education and communicationIMCI Integrated Management of Childhood IllnessIMR Infant mortality rateIQ Intelligence quotientIUGR Intrauterine growth retardationLDL Low-density lipoproteinsMENA Middle East and North AfricaMMR Maternal mortality ratioNCHS National Center for Health StatisticsNGOs Non-governmental organizationsOECD Organization for Economic Cooperation and Development25-OHD 25-hydroxy vitamin DPA Palestinian National AuthorityRDA Recommended dietary allowanceRNE Food and Agriculture Organization Regional Office of the Near EastSD Standard deviationT3 TriiodothyronineT, ThyroxineTFR Total fertility rateTGR Total goiter rateTSH Thyroid stimulating hormoneTV TelevisionU5MR Under five year child mortality rateUAE United Arab EmiratesUN United NationsUNDP United Nations Development ProgrammeUNHCR United Nations High Commissioner for RefugeesUNICEF United Nations Children's FundUS United States of AmericaUSAID United States Agency for International DevelopmentVAD Vitamin A deficiencyWFP World Food ProgrammeWBG West Bank and GazaWHO World Health Organization
1x
EXECUTIVE SUMMARY
Good Nutrition and Economic Progress: a Virtuous Circle
Good health is a crucial element in the quality of life, a prerequisite for better educationalattainment and essential to national economic productivity. In all nations, improving people'snutritional status is linked to economic progress, and economic progress often helps peopleimprove their nutritional status, creating a virtuous circle. Good nutrition is key to maintain orimprove health, and people's ability to secure an adequate diet is fundamental to achieving socialand economic advances.
In spite of the critical role of nutrition in development, malnutrition so frequently escapesnotice that it is referred to as "the silent disaster." Globally, the world is producing enough food,but inequitable access and allocation prevents many people from getting an adequate diet andtherefore their health is at risk. In 1992, the United Nations Food and Agricultural Organization(FAO) estimated that about 841 million people or about one fifth of the world's population werefood energy deficient.
Countries in the Middle East and North Africa (MENA) region have largely achieved foodsecurity in terms of dietary energy intake, except for Yemen and Iraq. Clinical vitamin Adeficiency is largely under control in the region. The nutritional status of most people hasimproved over the last two decades. Economic development and rising incomes signal a newprosperity and govemments in the region are struggling to sustain the improvements they haveworked hard to bring about for their citizens in the quality of life. Despite these achievements,undernutrition and micronutrient deficiencies remain a serious threat to public health. Recently,the prevalence of stunting has increased in several countries-the result of chronic undernutrition.Anemia is widespread among women and children; and there is a high incidence of iodinedeficiency disorders and vitamin D deficiency. Changes in the diet brought about in part by newfound prosperity have escalated the incidence of obesity and diet-related non-communicablediseases such as heart disease and diabetes mellitus.
The numbers are alarming. In MENA countries, it is estimated that over 10 millionchildren suffer from stunted growth, about 90 million people are anemic, and about 85 millionpeople are at risk for iodine deficiency disorders. Even though nutritional deficiencies arestrongly linked to poverty, economic progress does not always improve nutritional status. Forinstance, in Egypt and Tunisia, the number of stunted children increased despite the rise in GNPper capita. This appears to indicate that even in well performing economies, progress has beenuneven, leaving pockets of poverty in its wake, especially among rural populations. Theeconomic costs of nutrition disorders are staggering. Undernourished or anemic adults are lessproductive and childhood stunting leads to an estimated six to eight percent loss in laborproductivity in adulthood. Assuming annual wages of $1,000 per person, stunting of one millionchildren creates a direct income loss of $60 to 80 million per year, plus accompanying health carecosts related to the condition.
In seven countries in the region, stunting affects over 20 percent of children under fiveyears of age, and in nine countries, wasting is prevalent in over five percent-indicating mediumto high levels of childhood malnutrition. This condition is the most serious in Yemen, the poorestcountry in the region, but also stunting prevalence recently increased in Algeria, Egypt, Oman,and Tunisia. Stunting appears to affect boys and girls equally but rural areas are much worse offthan urban, and the gap between rural and urban is widening in Egypt, Morocco, and Tunisia,
x

more evidence that childhood undernutrition is not necessarily linked to lower levels of economicdevelopment.
An improvement in maternal health care could elevate the nutritional status and health ofentire nations. In five MENA countries, low birth weight is a problem for over 10 percent ofbabies, indicating the poor health and nutritional status of many pregnant women. The increasein the incidence of low birth weight correlates with the increase of infant mortality and stunting.But the problem does not end there-low birth weight babies grow into adults who are likely tobe more susceptible to chronic diseases such as hypertension and diabetes mellitus. Countrieslose three times over-first because low birth weight babies are more likely to have repeatedepisodes of illness, or die in infancy; second because those who do survive childhood have areduced ability to lead productive lives; and third because the expense of treating chronic diseasescan cut deeply into the national health budget.
Anemia, which is caused mainly by iron deficiency, is highly prevalent among women andchildren even in wealthier countries in the region, and is likely linked to the higher rate ofmaternal mortality and low birth weight. In MENA countries the major source of iron is cereals,but the diet also contains many substances which inhibit iron absorption, leading to widespreadanemia. In addition to nutritional education to diversify diets and increase the bioavailability ofiron, other control measures could include iron supplementation, iron fortification of staple foods,and public health interventions such as parasitic disease control programs and birth spacing.
Iodine deficiency disorders (IDD) are still high in Syria, Iran, Yemen, and a part of Egypt.Although many MENA countries have already started universal salt iodization programs, furthertechnical inputs and multi-sectoral commitment may be required to achieve sufficient coverage ofiodized salt.
Vitamin D deficiency has been reported among small children and women in Iran, Kuwait,Libya, Morocco, Saudi Arabia, West Bank and Gaza, and Yemen. Infants whose mothers havelow vitamin D levels are more likely to develop vitamin D deficiency symptoms. NVhile vitaminD fortification and supplementation programs are required, information, education andcommunication (IEC) campaigns have to be started urgently. One of the most commonlyavailable sources of vitamin D is sunshine-humans can produce vitamin D if their skin isexposed to sunlight but cultural practices-such as women being heavily veiled, and infants beingconstantly wrapped-prevent it from being synthesized.
Nutrition disorders are caused by nutrient deficiencies but also by unbalanced intakes.Economic development has brought a nutrition transition to many MENA countries. People'snutritional intake patterns change from diets based on cereal and vegetables with a relatively lowintake of dietary energy, to a diet with an higher dietary energy intake and higher intake of animalfat and protein. As a result, obesity is becoming more common, especially in high incomecountries and urban areas. Obesity is more prevalent among adult women than men, in part dueto cultural prohibitions which restrict women's movements. Obesity and excess fat intakes leadto increase of diet related non-commnunicable diseases such as coronary heart diseases anddiabetes mellitus in 10 to 20 years.
Creating the Virtuous Circle: What Can Countries Do?
Good nutrition and health create a virtuous circle-bad nutrition and disease create avicious circle. Nutritional disorders damage health directly by causing disease, but also indirectlyby increasing susceptibility to disease. In turn, diseases cause nutritional disorders by creatingnutrient loss, reducing the body's ability to absorb nutrients, or increasing the body's nutrient
xi
consumption. Children and women are most vulnerable to nutrition disorders because of theirhigher requirements for nutrients for growth and reproduction, their lower status in society andthe family, and other cultural factors. Mothers' health status directly affects that of their children,so the poor nutritional status of women and children also forms an intergenerational viciouscircle. Therefore, national improvement in nutritional status should target this critical group-children aged 6 to 24 months and pregnant women. This also suggests that improving femaleeducation and other social services contribute to lowered childhood malnutrition over the longterm. For example, increased female secondary school enrolment rates in MENA countriescorrelate with a decrease in the numbers of stunted and underweight children.
Many questions remain to be answered. Many national policies, not just those in thesocial sector, affect nutritional outcomes, but these linkages have been inadequately explored.Food and agricultural policies have a major impact on nutrition, but the nature and extent of theseare not yet known because the policies have never been evaluated alongside anthropometric dataand other poverty indicators. Neither have the reasons for the poor correlation between economicdevelopment and nutrition status been fully analyzed. Growing income differentials, unequalaccess to social services and other exclusionary mechanisms might explain some of this polarizeddevelopment, but it requires proper and in depth analyses. The peri-urban poor are an emergingphenomenon which has not been fully studied. Feasibility studies or sector work is needed todesign nutrition interventions such as micronutrient fortification programs. Impacts of existingnutrition programs should be reviewed. Many avenues need to be followed because quantity andquality of data are insufficient to design interventions. Policy makers can select among specificinterventions or comprehensive programs, targeted or universal approaches, but institutional andtechnical capacity building is a prerequisite for sustainable implementation.
Some possible interventions are:
* Comprehensive public health programs targeting children under two years of age andpregnant and lactating women, particularly among rural population.
* Food and micronutrients supplementation including iron, iodine, and vitamin D targeted topregnant and lactating women, adolescent girls, under five year and school age children.
* Micronutrient fortification, such as salt iodization, iron fortification of wheat flour, andvitamin D fortification to edible oil and milk.
* IEC programs delivered through health service channels, schools, community organizations,and mass media which aim to prevent nutrition disorders and promote health activities.
MENA countries' nutrition typology. Possible combinations of nutrition interventions foreach type are as follows:
* Type 1: high malnutrition and micronutrient deficiency; low economic and social indicators;e.g. Yemen, Iraq. Specific nutrition interventions and comprehensive health and socialprograms are required urgently. Decreasing malnutrition of small children and pregnantwomen should be the first priority. International support will be essential.
* Type 2: relatively large population of undernutrition with large urban/rural gaps and highmicronutrient deficiency; relatively well-performing middle income economy with asignificant number of poor; e.g. Iran, Tunisia. Specific nutrition interventions andcomprehensive health and social programs should be targeted to the rural population, urban
xii

poor, women and small children. Food policies should be carefully assessed for theireffectiveness and real nutrition impacts on the vulnerable groups.
* Type 3: high obesity and micronutrient deficiency; relatively high income with pockets ofpoverty and social indicators that are low in comparison with similar level economies in otherregions; e.g. Saudi Arabia, Bahrain. EEC programs for obesity and micronutrient deficienciesprevention and micronutrient fortification programs, plus nutrition and social programstargeted to the vulnerable groups. International agencies may need to provide technicalassistance.
To assist MENA countries in improving nutrition, the World Bank may explore strategicoptions:
* Stimulating country discussions.Disseminate this regional nutrition review among stakeholders in the social and economicsectors in each country to stimulate discussions. Organize a regional conference.
* Put nutrition back on the policy agenda.Nutritional status is one of the best proxies to measure poverty and social development.Nutritional issues should be included in the country assistance strategy (CAS) and bediscussed with the government in the context of economic and social development.
* Support specific programs.The Bank's health sector operations may put more emphasis on nutrition improvement.Current national public health programs can be strengthened with more nutrition activitiesafter carefully estimating program costs to prepare feasible and sustainable financing plans.
* Partner and facilitate technical assistance.To meet international standards, most MENA countries may need technical support forplanning, implementing, and monitoring their nutrition programs. The Bank may facilitatetechnical assistance in partnership with other organizations such as WHO, UNICEF, FAO,and NGOs.
* Coordinate and monitor other sector programs.Poverty reduction programs should use nutrition indicators to assess and adjust the impacts ofinterventions. Other sector operations including water and sanitation, agriculture, education,and industry, can be designed and monitored to produce positive impacts on nutrition.
Improving the nutritional status of people in the MENA countries is a priority-for thewell being of citizens, and for continued economic development and growth. Unfortunately,development strategies to date have fallen short of the nutritional goals expected in any caringand equitable society. In the longer term, it is costly and unsustainable to overlook the needs ofunderprivileged populations, particularly women, children, and rural inhabitants. Targetedinterventions are urgent and essential.
Policymakers must act immediately to put nutrition on the country's priority agenda.Strong political commitment at the highest level is indispensable to implement and sustaineffective nutrition interventions. The World Bank will work together with the governments toachieve the sustainable, equitable, economic, social and human development.
xiii

1. Introduction - Good Nutrition and Economic Progress: a Virtuous Circle
Good health is a crucial element in the quality of life, a prerequisite for better educationalattainment and essential to national economic productivity. In all nations, improving people'snutritional status is linked to economic progress, and economic progress often helps peopleimprove their nutritional status, creating a virtuous circle. Good nutrition is key to maintain orimprove health, and people's ability to secure an adequate diet is fundamental to achieving socialand economic advances.
In spite of the critical role of nutrition in development, malnutrition so frequently escapesnotice that it is referred to as "the silent disaster."t 207 1 Globally, the world is producing enoughfood, but inequitable access and allocation prevents many people from getting an adequate dietand therefore their health is at risk. In 1992, the United Nations Food and AgriculturalOrganization (FAO) estimated that about 841 million people or about one fifth of the world'spopulation were food energy deficient.(70)
The Middle East and North Africa region (MENA)' has largely achieved food security,except for Yemen and Iraq. Clinical vitamin A deficiency is, for the most part, under control inthe region. People's nutritional status has improved in the last two decades. Despite theseachievements, several nutritional deficiency disorders remain serious public health problemswhich need to be addressed by all of the countries: stunting, anemia among women and children,iodine deficiency disorders (IDD), and vitamin D deficiency. Economic development and risingincomes in the region signal prosperity and have also brought about changes in the diet, but thisnutrition transition has been accompanied by an increased incidence of obesity and diet-relatednon-communicable diseases.
And there is worse news. In MENA countries, it is estimated that over 10 million childrensuffer from stunted growth, about 90 million people are anemic, and about 85 million people areat risk for iodine deficiency disorders. Although nutritional deficiencies are strongly linked topoverty, economic progress does not always improve nutritional status. For example, the numberof stunted children increased in Egypt and Tunisia despite the rise in GNP per capita, and in thehigh-income Gulf states, anemia and vitamin D deficiency are common.
The economic costs of nutrition disorders are staggering. Undernourished or anemic adultsare less productive (Annex 2) and childhood stunting leads to an estimated six to eight percentloss in labor productivity in adulthood.(i05 ) Assuming annual wages of $1,000 per person,stunting of one million children creates a direct income loss of $60 to 80 million per year, plusaccompanying health care costs related to the condition.
Despite overall economic development, gaps in income levels occur and may grow wider.This appears to indicate that economic progress is uneven, that rural populations have beenexcluded, and that pockets of poverty are present even in the well performing economies. Thispolarized economic development is not only socially unjust, but also unsustainable. Even arobust economy can collapse under the pressures arising from an inequitable society-particularlywhere something as basic as food is concerned.
The factors affecting people's ability to secure and maintain adequate nutrition arecomplex and linked; they include population growth rates, human migration, the state of
Countries in the MENA region in this paper indicate: Algeria, Bahrain, Egypt, Iran, Iraq, Israel, Jordan, Kuwait,Lebanon, Libya, Morocco, Oman, Qatar, Saudi Arabia, Syria, Tunisia, United Arab Emnirates (UAE), West Bank andGaza (WBG), and Yemen.
1

agriculture, transportation and trade, among others. People's access to health care, education,clean water and sanitation, as well as status of women, affects their nutritional status and theirability to use their food resources wisely. Health problems associated with poor nutrition arewidely observed in low income countries but surprisingly are also found among vulnerablepopulations in middle and high income countries. The issues affecting these groups need to beidentified and addressed to achieve adequate nutrition globally.
Particularly in developing countries, the groups most vulnerable to poor nutrition arewomen and children, especially if they are rural. They have lower social and economic status inthe family and society, and higher nutritional needs for growth and reproduction. In 1995, theWorld Health Organization (WHO) estimated that about 200 million or over 30 percent ofchildren under five years old were malnourished.(223 ) Although many children in developingcountries sicken and die from communicable diseases such as diarrhea, respiratory infection, andmeasles, malnutrition underlies 56 percent of under five year deaths.(256) It not only increasestheir susceptibility to diseases but also delays their recovery from illness. Furthermore, repeatedand prolonged illnesses hinder nutritional intake; thus malnutrition and diseases form a viciouscircle.
Nutrition disorders exist even in high income countries in the MENA region. There is nosignificant correlation between prevalence of wasting, underweight and low birth weight andGNP/c in MENA countries (Annex 4). Even though malnutrition is generally associated withpoverty, economic development has decreased child malnutrition to only a limited extent. Thestunting prevalence in MENA countries drops significantly when the GNP/c increases in therange of low and lower-middle income levels, but the correlation is less significant in the range ofupper-middle income and higher levels (Figure 1). This indicates that although stunting, the mostconstant indicator of chronic child malnutrition, is associated with poverty, general economicdevelopment alone will not be able to eliminate stunting. Since GNP/c indicates only the averageincome level, it may conceal the size and status of underprivileged groups where higherprevalence of child malnutrition may be found.
Figure 1: Stuntinc Prevalence and GNPlc in MENA Countries
40 j
30 -Stunting
Prevalence
20 -
0 010
10~~ I0
0 5000 10000 15000 20000 US$GNP/c
(Source: 207, 228, 249, 254, 255)
2

Nutritional status in rural areas is much worse than in urban areas in most MENA countries(Table 2, Figure 5, 15; Annex 4). That is because overall economic development may havebrought fewer benefits to rural areas, or because investments may not have been well targeted orevenly distributed. When industrialization is concentrated in urban areas it may erode traditionalagricultural production by absorbing labor from the rural areas. In addition when rural peopleproduce more market oriented crops it may reduce their own consumption of agriculturalproducts.(58 ) Unless overall economic development is supplemented with targeted social andrural development, the changes that result may damage the nutritional status of rural people.
Tunisia2 exemplifies a country where economic development has not diminished childmalnutrition (Figure 2). From 1988 to 1995, GNP/c in Tunisia grew steadily, but the incidence ofmalnutrition caused stunting prevalence to increase from 17.9 percent to 22.5 percent-as high as32.6 percent in rural areas, and 14.5 percent in urban areas (Table 2). The gap between urban andrural widened as the national stunting prevalence rose (Figure 5; Annex 4).
Figure 2: Stunting Prevalence and GNPIc in Tunisia
45 - - 2500
40-35 - 2000
-A.~ 30 _1500
o ~~~~~~~~~~~~~~~~~~~~~~~~U,
425 > ~_ 0CD 1000 z~~~~~~~~~~~~~~~~~~~~C
(Source: 5, 228, 255)
Malnutrition commonly refers to a protein-energy deficiency, but another type ofnutritional deficiency results from inadequate intake of micronutrients such as iron, iodine, andvitamin A, among others. This type of nutritional deficiency is referred to as "silent hunger" andcan occur even when protein-energy intake is sufficient. Micronutrient deficiency impedesphysical and mental development, increases morbidity and mortality, and decreases educationalattainment and economic productivity. If widespread, it can significantly retard social andeconomic progress.
2 Preliminary results of 1996/98 survey conducted by the National Institute for Nutrition indicated a significantdecrease of child undernutrition in Tunisia (stunting prevalence: total 9.5 percent, urban 7.6 percent, rural 11.6percent; wasting prevalence 1.3 percent).(field interviews)
3

Most developing countries are undergoing a nutrition transition. This transition occurswhen people's food intake patterns change from a cereal and vegetable based diet with arelatively low intake of dietary energy, to one with a higher dietary energy intake and anincreased portion of animal fat and protein. The nutrition transition is common in high-incomecountries and is also increasingly seen in urban areas and among relatively affluent populations inlow and middle income countries. The nutrition transition signals a higher standard of livingwhich is a welcome development, but it also leads to over-consumption of dietary energy,particularly animal fat, which increases the incidence of obesity and the risk for diet-related non-communicable diseases such as cardiovascular disorders and diabetes mellitus. Preventing thesediseases through nutritional education is inexpensive but unless immediate action is taken,MENA countries will have to face the high cost of treating these diseases later.
A variety of nutrition issues are observed in MENA countries, but to date, the Bank'sactivities in the health, nutrition, and population (HNP) sector in the region have focused mainlyon health and population. Although the Bank completed some nutrition sector work in Moroccoin 1994,(243) and a case study on food subsidy reform in Tunisia in 1996,('9o) there has not been acomprehensive assessment of nutritional issues in the region.
The World Bank HNP sector board approved this nutrition review in the MENA region todevelop a base of knowledge and a sector strategy and to help fulfill its mandate for regionalknowledge management. The review assesses nutritional status, focusing on the healthimplications of nutritional issues, but the review's scope do not include assessments of existingnutrition programs and food policies. The review proceeds concurrently with a regional study offood subsidy programs,(258. both of which supplement the regional HNP sector strategy paper.(253
)
The review aims to:
I assess the region's nutritional status;I analyze the causes and consequences of nutritional problems and their implications for health;* suggest a strategy to improve the nutrition and health of the people in the region;• develop a database from available sources and literature.
2. Nutrition in MENA Countries - Current Situation and Trends
2-1. Protein-Energy Disorders
(A) Undernutrition
Child undernutrition is common in many MENA countries (Table 1). The main indicatorsof child undernutrition are stunting, a condition where attaining normal height for age is hinderedby chronic malnutrition, and wasting, below normal weight for height where the body isemaciated mainly due to acute malnutrition (Annex 1). In seven of the countries in the region,over 20 percent of children under five years old are stunted. In nine of the countries, wasting isobserved in more than five percent of the under five year olds. By international standards, this isconsidered medium to high levels of undernutrition. Additionally, underweight shows a similardistribution pattern although it is generally lower than the figures for stunting. There is noevidence of absolute shortages of food, but despite this, certain children are chronicallyundernourished. Child malnutrition is the most serious in Yemen, the poorest countries in theregion, but overall, child undernutrition is not clearly linked to the level of economicdevelopment among the MENA countries.
4

Table 1: Health and Nutrition Indicators in MENA Countries(Most Recent Data between 1980-1997)
GNP/c Total Population Infant Stunting Wasting Underweight Low Birth Anemia TotalPopulation Annual Growth Mortality (Under 5) (Under 5) (Under 5) Weight (Women) Goiter Rate
Rate Rate(US$) (million) (%) (per 1000 (%) (%)
live births)
Low Income*Yemen 1 260 15.7 j 3.7 93 39 [ 13 39 19 5 - 36 32Lower-middle Income*Egypt 790 63.3 1.8 57 30 5 12 10 17 - 79 5.2Iraq - 20.6 2.1 161 28 9 25 21 18 7.3Morocco 1,110 27.0 2.0 64 24 2 9 9 20 - 40 20Syva 1,120 14.6 2.9 28 27 9 13 11 30-52 73Jordan 1,510 5.6 4.2 21 16 2 9 7 4 -46 -
Algeria 1,600 28.8 2.0 34 18 9 13 9 19 -42 8.5Iran 1,780 70.0 2.5 33 19 7 16 9 20 - 50 30Tunisia 1,820 9.2 1.6 28 23 4 9 8 41 4.3WBG 1,870 2.3 3.7 28 14 6 15 - 23 - 56 -
Lebanon 2,660 3.1 1.9 33 12 3 3 10 27 - 49 15Upper-middle Income*
Oman 4,820 2.3 4.7 15 23 13 23 8 15 - 54 10Libya - 5.6 3.6 j 50 15 . 3 5 5 6 - 6.3Saudi Arabia 7,040 18.8 3.4 1 25 14 3 14 7 5 - 57 1Bahrain 7,840 0.6 3.6 1 18 10 6 7 6 40 - 49 High Income*
Qatar [ 11,600 0.6 5.3 17 8 2 6 5 30Israel I 15,920 5.7 2.6 8 - - - 7 18 - 61 Kuwait j 17,390 1.7 2.7 13 12 3 6 7 31 -42 UAE | 17,400 2.5 3.1 15 6 - _t - _ 6 22 - 62
* The definitions of income groups are: low income as GNP/c $765 or less; lower-middle income as $766-$3,035; upper-middle income as $3,036-$9,385; and high income as $9,386 or more.(Source: 55,148,151, 206, 207, 216, 220, 221, 226, 228, 247, 248, 249, 254, 255)
5

Stunting
Childhood stunting, or chronic undernutrition, is largely due to inappropriate feeding,repeated bouts of childhood illnesses such as diarrhea that reduce the intake and absorption ofnutrients, plus improper care of sick children. Trends in stunting are mixed among children inMENA countries. Figure 3 indicates that stunting in the Near East/North Africa region3 has beenthe second lowest among the six regions in the developing world between 1980 and 1995.However, the decline during that period was only about 0.6 percent per year for the region.(5 )Among MENA countries that conducted multiple national surveys on stunting, there is adisturbing trend. Since 1990, stunting has increased in Algeria, Egypt, Oman and Tunisia.(Figure 4)
Stunting prevalence can be analyzed by looking at children's gender and place ofresidence. Table 2 shows that among girls, stunting is equal to or even lower than that amongboys, and reports from Tunisia and Morocco indicate that there is no significant difference in thetreatment of boys and girls in the duration or intensity of breastfeeding. '56 ) There are significantdifferences between urban and rural populations. In most MENA countries, children from ruralareas are more likely to be stunted than children from urban areas. In fact, rural children in Iran,Morocco, Saudi Arabia, and Tunisia are twice as likely to suffer from stunting. The stuntingprevalence in urban/rural areas has been surveyed more than one time in Egypt, Morocco andTunisia. For the three countries represented, the urban/rural gap is widening, leaving ruralchildren more vulnerable to stunting (Figure 5).
Figure 3: Estimated Stuntina Prevalence by Region
% 70
'20 l t
1980 1995* Near East / North Africa a South America lIID Middle America / CaribbeanE3 South East Asia E9 South Asia C3 Sub-Saharan Africa(ACC/SCN Regions) (Source: 5)
N lear East/North Africa region of ACC/SCN includes Cyprus and Turkey.
6

Figure 4: Trend of National Stunting Prevalence
50
45 -k40 -
c 35 '
30
a 25 -
i 205 +Yemen ,;15 ~-4- Egypt
co ~ Morocco10 -X- Tunisia
X -Algeria5 -- E Oman
0 - l
1970 1975 1980 1985 1990 1995 2000
Year (Source: 5, 228)
Table 2: Stunting Prevalence in Children Under 5 Years(Most Recent Data between 1980-1997)
|Total |Male Female | rban RuralMorocco 24. (24.2 2 1%) (
Low IncomeYemen 39.0 |41.5 36.1 |29.0 44.4Lower-middle IncomeEgypt 29.8 31.0 28.4 22.8 34.4Iraq 27.5 Morocco 24.2 24.2 24.2 13.2 30.0Syria 26.6 27.8 25.8 26.0 27.6Jordan 15.8 16.2 15.5 15.8 27.3Algeria 18.3 18.3 18.2 18.0 18.5Iran 18.9 19.5 18.4 12.2 24.8Tunisia 22.5 22.3 22.6 14.5 32.6WBG 14.2 13.8 14.6 - -
Lebanon 12.2 12.6 11.8 - -
Upper-middle IncomeOman 23.0 23.1 22.9 21.2 25.6Libya 15.1 16.4 13.8 13.9 18.1Saudi Arabia - - - 14.0 41.0Bahrain 9.9 10.3 9.6 12.1 7.8High IncomeQatar 8.1 8.3 8.4 - -
Kuwait 12.2 - - 5.1* 17.3*** High socioeconomic group; ** Low socioeconomic group (Source: 228)
7

Figure 5: Stntinc Prevalence Higher in Rural Areas
20 -
18-
eo A---S
''8
1 6 - Ircc
4 +Tunisia
2 Egypt
0- I I
1987 1988 1989 1990 1991 1992 1993 1994 1995 1996Yea (Sourt 228)
In MENA countries, children under five years old are more likely to suffer from stuntingthan school age children. Figure 6 shows a small decrease in stunting in three MENA countriesby the age of four, while Figure 7 shows the result of cohort studies by the age of ten amongBedouin children in Israel. It is unclear whether these data imply that children can recovergrowth lost earlier to stunting once they have passed through the years of high susceptibility tochildhood illnesses and are old enough to have more control over their own food intake, orwhether they mean that severely malnourished and stunted children die during early childhood.
Figure 6: Stuntinq Prevalence bv Aae
50[I
=C)
8 40
4 - Tu0i
10 ---~ooc
18 0. 199 19019 192 193 19 419596Ag Year) (Soum: 22)
InMEAcontis,chlre udr iv eas l ae oe ikl t sferfrmstn8n

Fiaure 7: Cohort Study of Stuntina Prevalence amonaBedouin Children
35 --Cohort B
30--
._ 25 -2
g20 -- Cohort AIL
e5 15
cf 10 - Cohort A
5--
0
0.75 1.5 5 10
Age (year) (Source: 84)
Low birth weight
Low birth weight, the proximity of intrauterine growth retardation (IUGR), is a sign offetal malnutrition, a condition that is mainly due to the poor health and nutrition of the motherduring pregnancy. The incidence of low birth weight is higher if mothers are of short stature,undernourished, or anemic. Infants born with low birth weights die more frequently duringinfancy, and if they survive, they are more likely to become stunted children (Annex 4). Also,fetal malnutrition increases an individual's susceptibility later in life to chronic diseases such ashypertension and diabetes mellitus.(5' 174)
Over 10 percent of babies in Egypt, Iraq, Lebanon, Syria, and Yemen are estimated to havelow birth weight (Table 1). However, the data on low birth weight may not be robust becauseweighing newborns is not common practice in many developing countries. Available statisticsshow that although 86 percent of babies in Jordan are weighed at birth, in Morocco the figure isonly 22 percent, and only 6 percent in Yemen.(45)
Child malnutrition in several MENA countries
Yemen, Iran, and Iraq present unique cases in the study of child malnutrition in MENAcountries because there are widespread child nutrition problems which have resulted from theunique political, social, and economic context. Yemen is the lowest income country in the regionand has the highest incidence of child malnutrition. Iran has the largest population and althoughmost of its social indicators are comparable to other lower-middle income states in the region, theprevalence of stunting is twice as high in rural areas as it is in the urban areas. In Iraq, war andinternational sanctions have diminished the health and nutritional status of its citizens.
9

Yemen, the lowest income country
In Yemen child health and nutrition problems are more severe than in the region overall.About 20 percent of the population lives below the poverty line,(246) and most social indicators arealso poor-life expectancy at birth is 57 years; the female adult literacy rate is only 26 percent;infant mortality rate (IMR) is 93 per 1,000 live births; and the maternal mortality ratio (MMR) is1,000 per 100,000 live births (Table 1, Annex 3). In 1995, Yemen's rate of immunizationcoverage was only 49 percent,4 compared with over 80 percent for most MENA countries. Lowimmunization coverage leads to high child morbidity, one of the major causes of chronicchildhood malnutrition. Unpublished Yemeni govemment data from 1996 show that 45 percentof children were stunted, 16 percent suffered from wasting, and 38 percent were underweight.('210
Nutritional habits and cultural practices in Yemen appear to exacerbate undernutritioncaused by poverty and poor health. Breastfeeding is nearly universal in the first three months oflife and 80 percent of mothers continue to breastfeed infants up to five months, but only about 40percent of infants are breastfed exclusively. The majority are given sugar water, boiled water,honey, butter-fat or cow's milk cream in the first few hours after delivery. People also believethat if the mother is fearful, angry or sick, breast milk is unsuitable for feeding. Complementaryfoods such as biscuits and wheat porridge are introduced at the age of three to six months. Wheatremains the mainstay of the diet through adulthood which can lead to micronutrient deficiencydisorders. The Yemeni habit of chewing qat, especially by pregnant women and teenagechildren, reduces their nutritional intake (Box 1). In this environment, nutritional intervention isessential but as of October 1998, there were only seven trained nutrition specialists in theMinistry of Public Health.(field interviews) They have backgrounds in medicine, agriculture, and someof them have attended a regional training course in nutrition.
Box 1: Nutrition Implications of Qat Chewing in Yemen
Most of the adults in Yemen chew the leaves of the qat plant as an afternoon socialactivity, usually taking place over a three- to five-hour period. This habit is recently spreadingamong rich and poor, men and women throughout Yemen.
Qat contains an amphetamine-like mild stimulant which causes loss of appetite andinsomnia. Since the active ingredients of qat are secreted in breast milk, it may interfere withthe appetite of breastfeeding infants. The incidence of low birth weight is 20 percent higheramong women who chewed qat during pregnancy. Also, poor households spend an estimated10 to 12 percent of their income on qat, likely displacing some of the resources which couldbe spend for nutritious food and health care.
Although qat is chewed only in Yemen and a limited part of Africa, it provides aninteresting example of the nutritional implications of substance abuse, including tobacco,alcohol, and narcotic drugs.(248)
Iran, rural people are much worse off
The 1995 joint survey by the Iranian government and the United Nations Children's Fund(UNICEF) shows that the incidence of stunting is almost twice as high in rural areas as it is incities. Between the ages of 12 and 23 months, 34 percent of rural children and 18 percent of
4 The Ministry of Public Health reported that the immunization coverage in Yemen increased up to 68 percent byAugust, 1998 (Field interviews)
10

urban children were stunted.("37 ) In the countryside this situation is probably caused by poverty,lack of education and cultural practices.!"', 168) The diet in agricultural areas is based onunleavened bread, and there is little nutritional diversity. There are poor sanitary conditions, highchild morbidity including diarrhea and intestinal parasites, lack of knowledge about child feeding,and a high maternal workload. There are also food taboos, for example, cheese is believed toimpair intellectual development, and eggs are thought to delay speech and cause stammering.Local habits such as geophagia (eating clay) and using sedative drugs on children are hazards thatlikely contribute to nutritional problems and poor health.
Iraq, trade sanctions increase malnutrition
% Figure 8: Child Malnutrition in Iraq3 5 _- --- ---- - ---- --- .--- -. --. ---. ------.-.--.-.-.---.
* StunUng l30 -- . E Underweight
G Wasting25 - 2 Low Birth Weight - -
20 - - 7 -
1 5 -- - - - - - - - - - - - - - - - - - - - - - - ---- ---
1 0 -- -- - - -- - - - - - - - -- - - -
5 -< -- ---- -- - - - - - -- --
01991 1995
Year (Source: 226, 229)
Figure 9: Severe Child Malnutrition in Irag(Monthly Average)
2000 - 18000
1800 - - 16000
1600 - - 14000
e, 1400 - - 12000 .f 1200 1000
180 8000800 - -~~~~~~~~~~80
t 800 / -6000 ''600 - /400 -- | Kwashiorkor 4000
200 -4i _ Marasmus 2000
0 01990 1991 1992 1993 1994
Year(Source: 2261
11

The state of health and nutrition in Iraq continues to deteriorate since the United Nations(UN) imposed trade sanctions in August 1990; children are affected most.(7' 226) Figure 8 showsthat childhood malnutrition increased dramatically between 1991 and 1995. The incidence ofstunting and low birth weight doubled; underweight and wasting quadrupled. Severe forms ofchild malnutrition, marasmus and kwashiorkor, rarely observed before 1990, are increasingrapidly (Figure 9).
(B) Obesity and Diet Related Disease
Higher incomes increase averagefood consumption
Table 3: Average Food Consumption (1989)Energy Protein Fat
(kcal/daylcapita) (g/day/capita) (g/day/capita_Low IncomeYemen 2,142 60.0 T 33.5Lower-middle IncomeEgypt | 3,336 83.5 78.4Iraq 2,887 71.8 75.3Morocco 3,020 81.3 55.6Syria 3,003 78.6 82.7Jordan 2,634 71.4 62.0Algeria 2,866 76.6 61.2Iran 3,181 84.1 62.2Tunisia 3,119 83.3 85.7Lebanon 3,274 86.2 97.1Upper-middle IncomeLibya | 3,324 | 80.5 | 108.3Saudi Arabia 2,874 86.5 82.5High IncomeKuwait I 3,195 95.3 T 104.9UAE 3,309 101.6 111.5
(Source: 150)
Obesity is increasing throughout the world, and the MENA region is no exception to thistrend. Obesity and diet-related non-communicable diseases are a public health issue in mostMENA countries. Table 3 shows average per capita intake of dietary energy, protein and fat.Average intakes' of dietary energy and protein in most MENA countries are higher than theRecommended Dietary Allowance (RDA) (Annex 1). In high income countries, average dietaryenergy consumption exceeds 3,000 kcal/day and consumption of animal products is alsoincreasing. Sugar consumption is increasing in most MENA countries. 75
76) People eat moresugar and fat even during the month of fasting, Ramadan (Box 2).
5Average intakes of total population do not necessarily reflect the presence of undernourished group of population orthe size of the undernourished or overnourished group of population.
12

Box 2: Nutrition Impacts of Ramadan
Ramadan is one of the five pillars of Islam. Throughout the ninth lunar month, Ramadan, allhealthy adult Muslims are obliged to fast from dawn to sunset. Although children, people in ill-healthor traveling, women who are pregnant, lactating or menstruating are permitted to break their fast, it isknown that children as young as nine years old or pregnant women often opt for fasting. Instead of theusual three meals a day, Muslims eat at home with family members-one large meal after sunset, and ifthey need it, a second meal before dawn.
People eat more sugar and fat during Ramadan, plus they work fewer hours and decrease theirphysical activities. Some studies showed significant weight gain during Ramadan, while other studiesshowed decreased dietary energy intake for about 500 kcal/day and decreased body weight. Bodyweight loss could also be largely attributable to negative fluid balance. Most studies indicated increasedblood LDL-cholesterol levels, decreased blood HDL-cholesterol levels, decreased blood triglycerideslevels, significant increase in blood glucose levels, and significant increase in blood uric acid levelsduring Ramadan.
Ramadan fasting does not harm well-nourished healthy people, and it has positive psychologicaleffects. There can be minor complications such as headache and dyspepsia, and a few serious renal orgastrointestinal complications are reported. Several studies showed that pregnant women's Ramadanfasting had no effect on the mean birth weight.
However, it will be necessary to evaluate and monitor the fasting on the middle aged and elderlymore carefully, since the blood biochemical change increases risks of developing or worsening chronicnon-communicable diseases. Women usually cannot decrease household workload during daytime,therefore, the effects of fasting on women, pregnant or non-pregnant, need to be evaluated further.Children and adolescents also need careful evaluation.(79
, 85, 93, 105, 142, 155)
Obesity incidence is on the rise
While the problems of undemutrition are well known in MENA countries, health problemsassociated with being overweight are increasing as parts of these countries become more affluentand urbanized. Obesity is more commonly associated with life in wealthier, developed countries,but is also found in areas where there has been a nutrition transition-that is, when a cereal-baseddiet is replaced by a diet high in calories and animal fat and low in fiber-combined with asedentary lifestyle. Obesity is more prevalent among women than men (Figure 10). Acomparison of Table 4 and Figure 10 shows that the incidence of obesity is higher in high incomeMENA countries than it is in OECD countries. Around 44 percent of the women in Kuwait and38 percent in United Arab Emirates are obese, compared to 25 percent of women in UnitedStates and less than three percent in Japan. Also, Figure 11 shows an increase in the incidence ofoverweight among young children in Egypt and Morocco, which may indicate a trend that alsoexists in other countries in the region.
Table 4: Obesity Prevalence in Selected OECD Countries(Most Recent Data between 1993-1996)
Obesity Prevalence (%)|___ _ [ Male Female
U.S. 19.7 24.7England 15.0 16.5Netherlands 8.4 8.3Japan 1.8 2.6
(Source: 230)
13

Figure 10: Obesity Prevalence(BMI > 30)
50-45 -IMale
IN Female40--
35 -
30-
1 G - l-A
Kuwait UAE Bharain Saudi Arabia Iran
(Source: 230)
Figure 11: Overweight Prevalence in Children Under 5 Years
(Weight/Height +2SD)
12-4- Egypt
10 -a- | Morocco
8
6
4
A~2
0 I I I
1975 1980 1985 1990 1995 2000Year (Source: 228)
14

Faulty diet causes many health problems
MENA countries are likely to face much higher health care costs in the decades to comebecause of diet-related non-communicable diseases. Among women, obesity increases the risk ofcomplications in pregnancy and delivery. Obesity, high intake of animal fat, and low intake ofdietary fiber are risk factors for chronic non-communicable diseases such as coronary heartdiseases, diabetes mellitus, colon and breast cancer.(82 ) Figure 12 shows that circulatory systemdiseases are already a major cause of adult deaths in most MENA countries. The prevalence ofdiabetes mellitus is high in several MENA countries (Figure 13).
It takes 15 to 20 years before the increase in body weight is followed by the onset ofdiabetes, and another 5 to 15 years before diabetes causes more serious complications such asrenal failure, blindness and amputations.(46) This means that MENA countries are likely to facemuch higher costs of health care in 10 to 20 years, unless nutrition interventions to prevent diet-related non-communicable diseases are begun immediately. In the United States where theincidence of obesity has doubled since 1980, the direct and indirect health care costs associatedwith the disease are estimated to be more than $70 billion annually.(' 8 6 238)
Figure 12: Death Due to Circulatory System Diseases(% of Total Death)
Egypt
Jordan
Kuwait
Qatar
Bahrain 11-
Iran _
Iraq -4-
'VBG t
UAE
Oman
Syria _ __I_I_I
0 10 20 30 40 50 %(Source: 138,149,150, 249)
Finure 13: Prevalence of Diabetes mellitus
Kuwait _ .
Saudi Arabia _
Bah rain _ X
0 5 10 15 20 %(Source: 149)
15

2-2. Micronutrient Disorders
(A) Iron
Nutritional Anemia
Nutritional anemia is usually due to iron deficiency and is a common problem throughoutthe world, particularly among children and women of reproductive age. Compared to otherregions, anemia in MENA countries is less prevalent among school-age children, but relativelymore widespread among younger children and women6 (Figure 14). Anemia is common amongwomen and children throughout the MENA region regardless of income level; the incidence inKuwait is similar to that in Egypt and West Bank and Gaza (Table 5).
There are significant gaps between urban and rural and between males and females inchildren's anemia in Bahrain (Figure 15). Anemia is more prevalent in preschool boys, butdecreases considerably when they reach secondary school. The number of anemic girls increasesin intermediate school and, for rural girls, continues to increase into secondary school.Adolescent girls become more susceptible to anemia following menarche, but the number ofurban girls with anemia decreases in secondary school revealing that anemia was prevented forsome.
Figure 14: Anemia Prevalence among Women and Children909 0 -.......... .
60 - -- - -- - - - - --- -- - - - - - - - - - - - - - - -- - - - - - - - - - - - - - - -
60 -3 |p 'a 5Q --
30 -1Children (0.4 y) C hild re n (5-1 4 y) Women (Pregnant) Women (15.59 y)
U Eastern M editerranean F Non-Industrialized AmericasR Non-Industrialized West Pacific M South East AsiaO Africa (WHO Regions)
(Source: 5)
6 The Eastern Mediterranean Region of WHO includes Afghanistan, Cyprus, Djibouti, Pakistan, Somalia, and Sudan,but does not include Algeria and Israel.
1 6

Table 5: Anemia Prevalence(Data from Various Subnational Surveys between 1980-1996)
Children Women Men
Under 5 year | School age Pregnant Reproductive age(%) I (%) (%) I ()%
Low IncomeYemen 1766 5-36 Lower-middle IncomeEgypt 23-90 22-45 21-79 17-71iraqo- - - 18Morocco 27-47 20-40 -
Syria 53 - 49-52 30Jordan 34 - 25-46 4-23Algeria - - 42 19-42Iran >30 - 20-50 -
Tunisia 30 - 41 -
WBG 58-76 40-67 23-56 28-44Lebanon 49 27Upper-middle IncomeOman 40-67 31-78 49-54 15-48 3-24Libya - 1 - - 6 -
Saudi Arabia 36-37 26-55 5-57 - 30-56Bahrain 30-39 21-42 - 40-49 20High IncomeQatar 26 - 30 - -
Israel 44-71 - 10-32 18-61 -
Kuwait - 13-26 40 42 34UAE 28-76 8-95 22-62 - -
(Source: 114,148,151,216,220)
% :Figure 15: Anemia Prevalence in Bahrain
801111 Urban Male
70 - Rurl Male1 Urban Female
60 - Rural Female
50
40
30
20
10
0Preschool Primary school Intermediate Secondary
school school(Source: 151)
17

Anemia riskfactors
The major dietary source of iron in MENA countries is cereals. Unlike heme iron inanimal products, the bioavailability of nonheme iron in cereals is low. Absorption of iron isfurther reduced by the consumption of tannin, phytate, and dietary fiber. People in the regiondrink a lot of tea, which contains tannin, and eat unleavened bread, or bread baked with highextraction rate flour which is high in phytate and dietary fiber. Vitamin C in fruits and vegetablescan increase absorption of nonheme iron, but the amount of fruits and vegetables people eatvaries depending on seasonal availability and cost. Much of the anemia in MENA countries canbe prevented by more diversified diets that include animal products, fruits, and leavened bread.Furthermore, tea should not be consumed with meals and should not be given to small children.
Anemia among children under five years of age is caused by poor feeding practices,childhood illnesses such as diarrhea, and mothers' anemia during pregnancy and lactation.Feeding sweet tea and unleavened bread to infants and toddlers increases their chances ofdeveloping anemia. Intestinal parasites, especially hookworm, may also cause anemia althoughthe prevalence of parasites has not been accurately measured. Schistosomiasis is endemic inEgypt, causing hematuria and anemia. Malaria is a major cause of childhood anemia in manydeveloping countries, but it is endemic only in Yemen in the MENA region and it is resurfacingin Iraq.
Regardless of income level, women in MENA countries are at high risk for anemia due tohigh fertility, short birth intervals, poor maternal health care, and lack of nutrition education.However, lower income can increase the risk of anemia because there is less money for abalanced diet. Women with lower incomes in rural areas are the highest risk group because theyhave less diversified diets and lack access to regular health care. This group requires more urgentattention and specific interventions for their own health and the health of their children. Womenwho do receive antenatal care, may avoid taking iron supplements because they can causestomach discomfort, plus some women believe that the iron pills cause abortion or excessenlargement of the fetus.
Consanguineous marriage is common practice and is an important factor contributing tohereditary diseases endemic in MENA countries which cause disorders similar to nutrientdeficiency (Annex 1). For example, G6PD deficiency and thalassemias cause hemolytic anemia.Premarital genetic counseling would help, but cultural sensitivity must be taken in account.
(B) Iodine
Iodine deficiency disorders (IDD) are a problem in the region because many of thecountries have areas with little iodine in the soil, e.g., the mountainous areas of Iran, Iraq,Lebanon, Morocco, Syria, Tunisia, and Yemen, and also the oases in the deserts of Egypt andLibya. 232 ) The effects of iodine deficiency are even seen in coastal areas, because not all peopleeat seafood due to dietary habits or prohibitively high prices. Previously in the MENA region,goiter was believed to be merely a cosmetic issue, and in some communities, a symbol ofadulthood, i.e. girls starting to develop goiter were considered to be eligible to marry. In 1989,the WHO Eastern Mediterranean Regional Office (EMRO) established a Working Group forcontrol of IDD to reduce total goiter rate (TGR) to 10 percent or less by the year 2000.(233) Thestrategy included national surveys followed by salt iodization and iodized oil supplementationprograms.
18

Figure 16: Proportion of Total Population at Risk of IDD
45
4 0
a: 25 - ----- --- ----------------- - l--- --------------------------------ICA
01994 1997
* Eastern Mediterranean IlD Europe QAmericas
| Western Pacific EgSouth East Asia t3Africa
(WHO Regions) (Source: 5)
Table 6: Iodine Deficiency Disorders (IDD)
Total Goiter Rate Goiter Prevalence Households Consuming(6-11 year old) Based on Various Iodized Salt
(Data between 1981-1994) Subnational Surveys (Data between 1992-1996)
Low IncomeYemen 32 I-]21Lower-middle IncomeEgypt 5.2 12- 43 0Egypt (New Valley) 52 - 82Iraq 7.3 30 - 80 50Morocco 20 18 - 80Syria 73 69 - 77 36Jordan 6- 16 75Algeria 8.5 23 - 71 _
Iran 30 82Tunisia 4.3 15- 51 98Lebanon 15 12 - 70 92Upper-middle IncomeOman 3 10 10 35Libya ] 6.3 20- 55 90Saudi Arabia j - 8-30High IncomeUAE - 46 - 66
(Source: 148,151, 207, 221)
19

The most visible result of iodine deficiency is goiter, the enlargement of the thyroid glandvisible as a swelling in the front of the neck. Other iodine deficiency disorders include impairedphysical and mental development, congenital anomalies, and cretinism (Annex 1). IDD is amajor public health problem in many developing countries. Figure 16 shows the EasternMediterranean Region7 has the highest proportion of people at risk for IDD. In other regions theincidence of IDD has decreased rapidly during the past three years due to effective interventions,but in MENA, salt iodization has begun only recently.
IDD surveillance and control is at different stages in MENA countries (Table 6). In 1989,Iran identified 14 out of 24 provinces as IDD endemic areas and designed control programs forthem. They built 22 salt iodization plants, and by 1995, 76 percent of rural households and 87percent of urban households consumed iodized salt. Iodized oil was also distributed to thehyperendemic areas. In 1990, Syria identified a high total goiter rate of 77 percent in rural areasand 69 percent in urban areas. The single salt producer, the Ministry of Industry, began to iodizesalt in 1992, but it reaches only an estimated 36 percent households. The government hasdistributed iodized oil to children under two years and pregnant women. While no nationwidedata are available, a 1991 survey in Yemen indicated that 78 percent of girls and 60 percent ofboys in Sana'a had goiter, and that there were hyperendemic rural areas where 95 percent or moreof the population had goiter. 210
1 In 1995, the Ministry of Public Health launched a controlprogram in collaboration with UNICEF which aimed to achieve universal salt iodization. By theend of 1998, about 70 percent of salt consumed in urban areas in Yemen are iodized.field interviews)
In West Bank and Gaza, neonatal screening for thyroid stimulating hormone (TSH) iscarried out on all newborns at the public hospitals and clinics since TSH increases in reaction tolow level of thyroid hormones. This screening found 10 positive cases out of 27,000 tested in1994 and 81 positive cases out of 45,000 tested; higher than the incidence in European countrieswhich is around 0.2 per 1000 births.(21 218) Endemic hypothyroidism is observed in Khan Younisarea in Gaza at about 15 percent goiter prevalence. All salt used in West Bank and Gaza isimported from Israel, but the salt is not iodized and Israeli authorities do not allow production ordistribution of iodized salt within West Bank and Gaza. (218 field interviews)
(C) Vitamin A
Clinical vitamin A deficiency (VAD) is largely under control in the MENA region, in fact,it is the only region in the developing world expected to eliminate clinical VAD before the year20008 (Figure 17). Diets in the MENA countries include generous amounts of leafy greenvegetables rich in carotene that are a good source of vitamin A (Annex 1).
A 1992 subnational survey in Yemen observed clinical VAD in around two percent of thesample group, the highest prevalence -three percent-occurred among five and six year oldchildren.(222) Clinical VAD was seen more frequently in boys than girls. Subclinical prevalenceof VAD among one to five year old children was around 62 percent. Subsequently, a one-timevitamin A supplement program was implemented. A pilot program of universal vitamin Adistribution is underway in conjunction with National Immunization Day.
7 Moderate to severe levels of IDD are seen in Afghanistan, Pakistan and Sudan, which are not included in MENAregion.
The Middle East and North Africa Region of UNICEF includes Djibouti and Sudan, but does not include Israel.
20
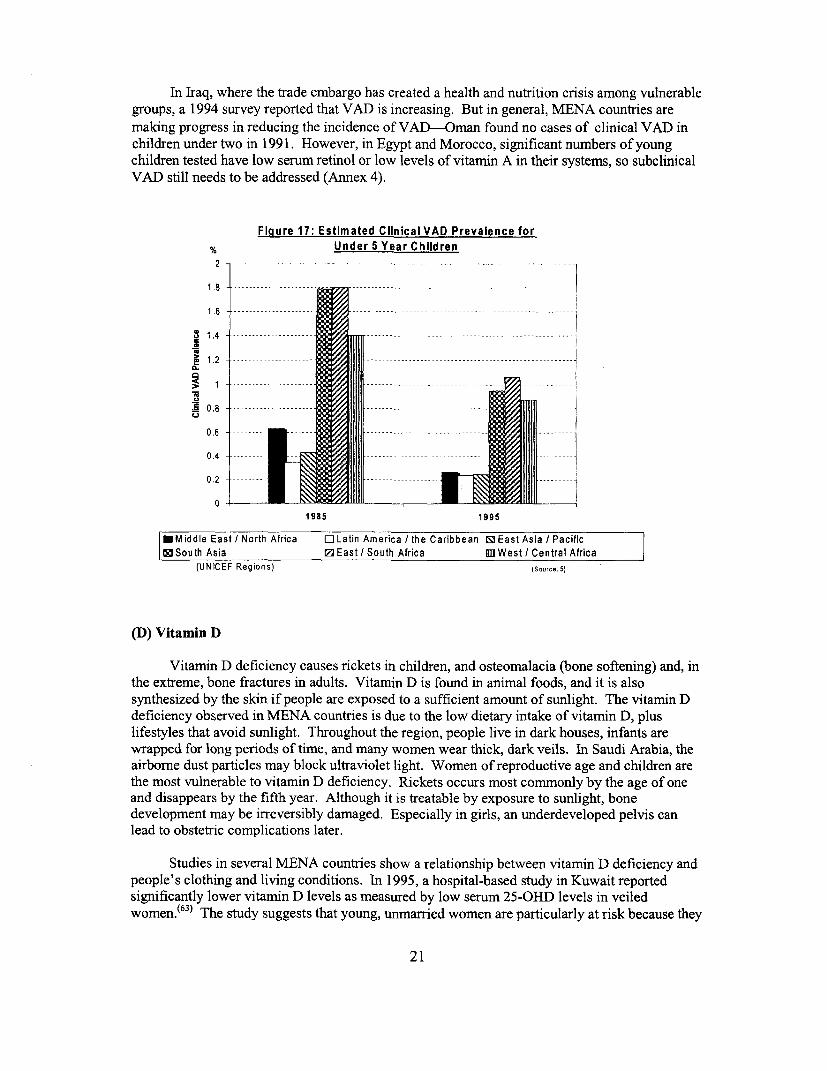
In Iraq, where the trade embargo has created a health and nutrition crisis among vulnerablegroups, a 1994 survey reported that VAD is increasing. But in general, MENA countries are
making progress in reducing the incidence of VAD-Oman found no cases of clinical VAD inchildren under two in 1991. However, in Egypt and Morocco, significant numbers of youngchildren tested have low serum retinol or low levels of vitamin A in their systems, so subclinicalVAD still needs to be addressed (Annex 4).
Fiaure 17: Estimated Clinical VAD Prevalence for% ..... Under 5 Year Children2 ....
1.8
02
1985 1995
EMiddle East/INorth Africa CjLatin America/Ithe Caribbean SlEast Asia?/Pacifics South Asia IZ East?I South Africa III West? /Central Africa
(UNICEF Regions) (Source: -)
(D) Vitamin D
Vitamin D deficiency causes rickets in children, and osteomalacia (bone softening) and, inthe extreme, bone fractures in adults. Vitamnin D is found in animal foods, and it is alsosynthesized by the skin if people are exposed to a sufficient amount of sunlight. The vitamin Ddeficiency observed in MENA countries is due to the low dietary intake of vitamin D, pluslifestyles that avoid sunlight. Throughout the region, people live in dark houses, infants arewrapped for long periods of time, and many women wear thick, dark veils. In Saudi Arabia, theairborne dust particles may block ultraviolet light. Women of reproductive age and children arethe most vulnerable to vitamin D deficiency. Rickets occurs most commonly by the age of oneand disappears by the fifth year. Although it is treatable by exposure to sunlight, bonedevelopment may be irreversibly damaged. Especially in girls, an underdeveloped pelvis canlead to obstetric complications later.
Studies in several MENA countries show a relationship between vitamin D deficiency andpeople's clothing and living conditions. In 1995, a hospital-based study in Kuwait reportedsignificantly lower vitamin D levels as measured by low serum 25-OHD levels in veiledwomen.f63 ) The study suggests that young, unmarried women are particularly at risk because they
21

cover themselves more thoroughly than the older, married women. Young, otherwise healthywomen suffer bone fractures due to vitamin D deficiency. In Saudi Arabia, surveys in 1992showed lower serum 25-OHD levels in urban areas than in rural areas, lower levels amongoccupants of mud or brick houses than tents, and lowest levels in female adolescents andpreschool children.(148 ) Another study revealed that women in higher income households hadhigher levels of serum 25-OHD because they had more animal origin food in their diet, lived inbetter housing, and attended antenatal care more regularly where they received vitamin Dsupplements. (176)
Babies born to mothers with low vitamin D levels are at higher risk for rickets. Studies inSaudi Arabia and Libya report that mothers of infants with rickets had low serum 25-OHDlevels.(6 0
, 67) These infants begin life with low levels of vitamin D and prolonged breastfeeding bymothers with low vitamin D put the infants at higher risk, because breast milk is their main sourceof vitamin D. Infants with rickets have weak muscles and poor suck, have trouble with breastmilk intake, and are often malnourished. In Yemen, a 1972 survey in six villages in the northernpart of Yemen reported that 16.5 percent of children aged six months to four years had rickets,and a 1987 survey in a village in northern Yemen reported an overall prevalence of rickets ashigh as 27 percent among children under five.(210 ) During the last three years in Gaza, the 400cases of rickets found in children under two years of age were treated successfully by introducingsufficient sunbathing. (field interviews)
(E) Zinc
Cases of zinc deficiency were recorded in Egypt and Iran for the first time in the early1960s. (166'167,171) Diets in both countries were based on pulses and unleavened bread made fromwheat flour. In fact, diets in these and other MENA countries are low in bioavailable zinc andhigh in factors that inhibit its absorption. The incidence of zinc deficiency is probably similar tothat of nutritional iron deficiency because both are caused by the same dietary pattern. A zincdeficiency may cause low birth weight, severe anemia, or it may retard growth or sexualmaturation. Zinc deficiency can be controlled by modifying the diet to include improvedvarieties and by reducing phytate through bread leavening and fermentation (Annex 4).
3. Causes, Consequences and Determinants of Nutrition Disorders
3-1. Breastfeeding and Complementary Feeding
Inappropriate feeding practices are major causes of child undernutrition. Three importantissues of child feeding are: exclusive breastfeeding in early life; duration of breastfeeding; andcomplementary feeding. International experts recommend exclusive breastfeeding of infants forabout six months and breastfeeding with good quality complementary foods up to two years.(231'234) Significantly in a region with a large Muslim population, the Koran recommendsbreastfeeding for up to two years.
Figure 18 shows that only about half of mothers or fewer in MENA countries exclusivelybreastfeed their infants for up to three months. Therefore, over half of the infants under threemonths of age are fed complementary foods or breast milk substitutes. The duration ofbreastfeeding is gradually declining in most countries, especially in urban areas. A study in urbanRiyadh, in Saudi Arabia, showed that only 31 percent of non-employed mothers and 12 percent of
22

employed mothers breastfed their infants; the highest income mothers were the least likely tobreastfeed.(9)
As a result, inappropriate complementary feeding and weaning practices are major causesof child undemutrition, which is highest in the age group between six months and two years.These hazardous-practices include abrupt weaning, mixed breast and bottle feeding as early as thefirst month, and the premature introduction of complementary food-all of which are commnonlyfound in MENA countries. Complementary foods include tea, sugar water, rice, wheat, milk,vegetables, and breast milk substitutes, often prepared in unsanitary conditions-infant formuladiluted with unsafe water in an non-sterile bottle. There are also numerous traditional beliefs andvalues that undermine good breastfeeding practices which can leave children undernourished andvulnerable to disease at a very early stage in life. For example, some mothers believe colostrumis harmful to newboms, so they do not start breastfeeding until two days after birth.
Figure 18: Exclusive Breasffeeding up to 3 Months
Egypt T
Iran jAlgeria
Yemen _ _ _ _
Jordan
Morocco _
Oman
Tunisia
o 10 20 30 40 50 60 %
(Source: 207, 210)
3-2. Gender
The poor nutrition and health status of women and female children form an inter-generational vicious circle. Low birth weight infants are more likely to be stunted. Stunted girlsgrow up to be short-height women. Short-height women more frequently suffer from obstetriccomplications which may endanger their own lives, plus that of the fetus and infants. Theincidence of low birth weight is higher among mothers who are short, undernourished, oranemic.(55 ) To break this vicious circle, it is critical to reach females aged 6 to 24 months, as wellas pregnant women.
A young girl's anemia worsens after adolescence, and if she becomes pregnant, her babywill have low birth weight and anemia, plus her own health will deteriorate. Anemia inpregnancy increases the risk of maternal deaths, since it lowers the tolerance to blood loss andresistance to infection. Although 25 percent of matemal deaths are directly due to bleeding and15 percent are due to infection, anemia is a strong contributing factor-depending on the country,anywhere from a quarter to almost all of maternal deaths are linked to anemia. (220, 227) Frequent
23

pregnancies and short intervals between births impede the recovery from worsened nutritionalstatus during pregnancy and lactation.
The prevalence of malnutrition is similar among girls and boys, although gender gaps inthe region are large compared with other regions.("91) This may require further in-depth study todisaggregate the data in relation to other factors such as age, area of residence, socio-economicstatus, birth order, and so forth, even though no significant differences appeared in the aggregatedaverage data.(202)
Cultural norms in the MENA countries may require that, adolescent girls and youngunmarried women receive particular attention. Early marriage can result in pregnancy while themother is still physically growing: this causes extra nutritional burdens. Young women's lowerstatus in the family may deny them nutritious food rich in iron and protein. Unmarried femalesmay develop vitamin D deficiency because they are more heavily veiled and tend to remainindoors. Nutrition disorders including anemia and IDD should be treated before pregnancy,however, unmarried females are less likely to contact health professionals than married womenwho are pregnant or mothers of small children.
Obesity prevalence among women is much higher than that among men. Obesity and diet-related non-communicable diseases increase risks of complications of pregnancy and delivery andtherefore increase maternal and perinatal morbidity and mortality. Sedentary life styles of obesepeople, particularly those who are urban and affluent increase the risk. High obesity prevalenceamong women may be partially due to cultural prohibitions to women's physical exercise.
3-3. Education and Cultural Background
Education
Childhood malnutrition is often caused by improper child feeding and caring practices,therefore, the knowledge and values of caretakers, especially mothers, are very important.Women with secondary and higher education tend to have fewer children which can enable themto provide better care, plus improve their own health and nutritional status. In addition, womenliving in countries that provide them with the opportunity for secondary and higher education aremore likely to have access to additional health and social services.
In MENA countries the incidence of stunting drops significantly with the increase offemale secondary school enrollment rates (Figure 19). (Stunting also drops with the increase ofmale secondary school enrollment rates but the correlation is not statistically significant-Annex4.) Since stunting is the most constant indicator of chronic child malnutrition, higher femaleeducation level, and overall social development as reflected by the female education level, seemto contribute over time to a decrease in child malnutrition.
Education levels influence nutritional status; nutritional status affects children'seducational attainment. Children who are undernourished or anemic can be retarded in theircognitive ability development. Likewise, iodine deficiency disorders (IDD) are a major cause ofmental retardation and impaired physical development in endemic areas. Even moderate forms ofIDD lead to the loss of 10 to 15 IQ points.('8 7 ) Additionally, intrauterine growth retardation andlow birth weight impede children's cognitive and physical development. Thus, nutritionaldisorders cause lower school attainment, and consequently, decrease people's long-termeconomic productivity.
24

Figure 19: Stunting Prevalence andFemale Secondary School Enrollment in MENA Countries
45 -
40 - -
35 -
30 -
le D
120
15- 4 * 4
10 *
10 "'
0 20 40 60 80 100 120 %
Female Secondary School EnirolIment(Source: 207, 226, 228, 2551
Box 3: Delivering Nutrition Messages to the Public
Delivering proper dietary information to the general public, especially children andtheir caretakers, is very important to improve nutritional status. In the early 1 970s, allhouseholds in Kuwait had at least one television set, and in 1991, 87 percent of urbanhouseholds and 41 percent of rural households in Yemen had televisions. The mass mediahas remarkable impacts on food beliefs and practices. After the Tunisian government usedTV spots to encourage people to eat lentils, demand increased to the point where thegoverrnment had to import lentils. Another example is a survey in Bahrain that showed that42 percent of housewives bought a newly advertised beverage, and 59 percent of childrenalways requested food items advertised on TV. Some mass media advertisements encourageover consumption of nutritionally unbalanced food such as snacks and soft drinks.
Messages which may lead to nutritionally unbalanced diets can be found not only inmass media campaigns but also in school textbooks. The UN Food and AgriculturalOrganization Regional Office of the Near East (FAO/RNE) is advising governments aboutthe nutrition implication of messages on the dietary habits of children. FAO/RNE screenedEnglish textbooks used in the Gulf states which contained phrases such as "I like Pepsi, Ilike tea. -- I don't like milk."
But, the food industry can also be a strong ally for delivering nutrition information tothe general public. FAO/RNE has prepared nutrition education materials financed by amultinational company that produces fortified cereals. There are no specific advertisementsin the education materials, however, the company expects that people who have becomemore nutritionally conscious are willing to choose the company's fortified products. Thisinnovative partnership between the public and private sectors suggests a direction of thebetter information, education and communication (IEC) strategy.(49' 150, field interviews)
25

Cultural background
Equity in food distribution is important not only at the national level, but the householdlevel among family members. Households living a traditional lifestyle may allocate insufficientquality and quantity of foods to women and children, even though the total household's nutritionintakes are sufficient and balanced."'08
Information and conmmunication technology has increased people's access to outsideinformation. Commercial messages on television and mass media nutrition campaigns canstrongly influence attitudes and behaviors (Box 3). Unless consumers are educated and protected,they may receive messages with harmful nutritional implications, such as commercial messagesthat encourage over-consumption of soft drinks and snacks.
3-4. Demographic Changes and Conflicts
Demographic changes
The MENA region has high natural population growth rates and significant migration-caused by workers who seek employment in the oil-producing countries and by political unrestand conflict in some countries (Box 4). These demographic issues create pressure on food supplyand often increase imports (Annex 3). Migrant workers usually eam enough to feed themselvesplus send money home to their families. But refugees can strain local resources, and in manycases they require intemational assistance to ensure that they are adequately nourished (Annex 2).
Box 4: Displaced Population in Southern Iraq
People from the marshlands of southern Iraq have had their environment and livelihooddestroyed and now malnutrition is widespread. Many of those who could escape have becomerefugees in Iran.
In early 1991, civil war broke out following the Shiite revolt after the Gulf War. Manypeople fled into the marshlands between the Tigris and Euphrates rivers. An intensifiedmilitary campaign and blockade by the Iraqi government continued during 1993 conducted aforced removal of Shiites in and around the marshes. Extensive army and civil engineeringprojects began to divert water from the marshes and the resulting environmental destructiondepleted local food sources to the point where the remaining inhabitants are no longer able tofeed themselves; neither can they purchase food due to the blockade. Originally about half amillion people lived in the region but by mid-1994, as many as 200,000 had fled their homesand were in hiding in the marshes and up to 50,000 were living in camps in Iran.
While many civil conflicts devastate the economy, in this instance the destructionespecially affects the food chain and lack of food and potable water are among the majorreasons for displacement.(2)
26

Conflicts and economic sanctions - the case of Iraq
Before the Gulf War in 1990, Iraq was an oil-rich country that imported two thirds of itsfood supply. Since the UN sanctions were imposed, Iraq's revenues have plummeted; it is unableto import sufficient food and medicine, or pesticides to control malaria, or materials to rebuildinfrastructure destroyed by the war. Scarcity of food and medicine plus damage to watertreatment and sanitation systems are seriously undermining the health and nutritional status of thepopulation. Although massive starvation has been avoided through an efficient rationing system,sanctions have cut people's diets drastically (Table 7).
Figure 20 shows the dramatic effect the embargo has had on children-malnutrition hasincreased, and many children are more susceptible to disease because they lack medicine andbasic sanitation. In 1995, the UN Security Council instituted the "oil for food" program to helpalleviate the widespread malnutrition caused by sanctions. Since then, the nutritional status ofIraqi children has improved slightly. Until sanctions end and reconstruction begins it will bedifficult for the nutritional status and basic health of the population to recover.
Table 7: Total Dietarv Energy Intake in Iracbefore and after the Gulf War
Year Total Energy Rationsl __________ lKcal/caplday
1984-89 3,3721990 3,150
1991-95 2,250 1,2951997 2,424 2,030
(Source: 71)
Ficgure 20: Nutrition Impacts of International Sanctionsagcainst U eu
% Gulf War UN Resolution 98635 - -UN Sanctions Started (Oil-for-Food)
30 4,25
20
15
10 U Stunting
5 0~~~~~~~~~~~~~~ Underweight5 Wasting
1990 1991 1992 1993 1994 1995 1996 1997Year
ISource; 71, 161, 226, 229)
27
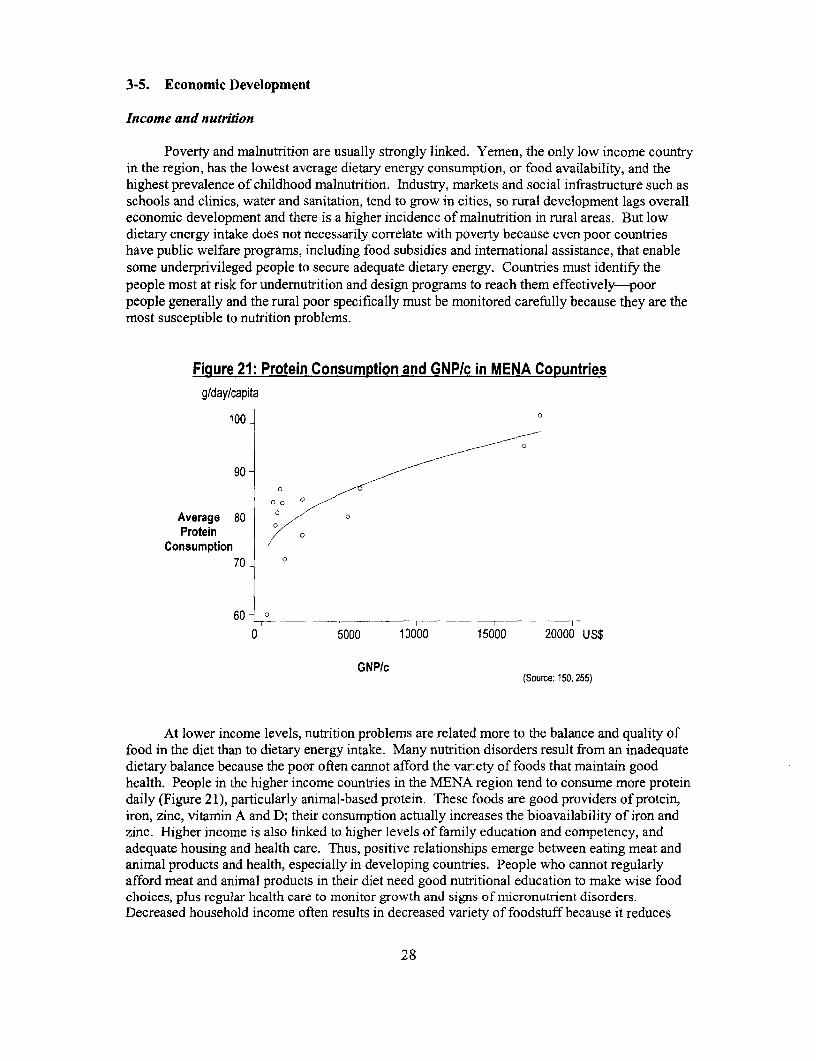
3-5. Economic Development
Income and nutrition
Poverty and malnutrition are usually strongly linked. Yemen, the only low income countryin the region, has the lowest average dietary energy consumption, or food availability, and thehighest prevalence of childhood malnutrition. Industry, markets and social infrastructure such asschools and clinics, water and sanitation, tend to grow in cities, so rural development lags overalleconomic development and there is a higher incidence of malnutrition in rural areas. But lowdietary energy intake does not necessarily correlate with poverty because even poor countrieshave public welfare programs, including food subsidies and international assistance, that enablesome underprivileged people to secure adequate dietary energy. Countries must identify thepeople most at risk for undernutrition and design programs to reach them effectively-poorpeople generally and the rural poor specifically must be monitored carefully because they are themost susceptible to nutrition problems.
Figure 21: Protein Consumption and GNP/c in MENA Copuntriesg/day/capita
100 o
90 /
Average 80-Protein
Consumption70 0
60 - I
0 5000 10000 15000 20000 US$
GNP/c(Source: 150, 255)
At lower income levels, nutrition problems are related more to the balance and quality offood in the diet than to dietary energy intake. Many nutrition disorders result from an inadequatedietary balance because the poor often cannot afford the variety of foods that maintain goodhealth. People in the higher income countries in the MENA region tend to consume more proteindaily (Figure 21), particularly animal-based protein. These foods are good providers of protein,iron, zinc, vitamin A and D; their consumption actually increases the bioavailability of iron andzinc. Higher income is also linked to higher levels of family education and competency, andadequate housing and health care. Thus, positive relationships emerge between eating meat andanimal products and health, especially in developing countries. People who cannot regularlyafford meat and animal products in their diet need good nutritional education to make wise foodchoices, plus regular health care to monitor growth and signs of micronutrient disorders.Decreased household income often results in decreased variety of foodstuff because it reduces
28

purchases of more expensive meat and fruits, even though total dietary energy intake remains thesame (Box 5).
Box 5: Influence of Border Closures in Gaza
The borders of Gaza Strip and West Bank towns are controlled by Israeli authorities evenafter the Palestinian National Authority (PA) took over the administrative responsibilities. It isnot unusual for the borders to be closed for unspecified periods due to Israeli security concerns.This restricts the movement of people and goods which curtails the income of many Palestinians,particularly in Gaza Strip, who depend on labor and trade inside Israel.
In 1996, following a prolonged border closure in February and March, an NGO active innutrition programs in Gaza Strip conducted a rapid household survey on food security. Theresults showed that the mean monthly income decreased by 32 percent; on average, theconsumption of meat fell by 30 percent from 5.3 kg to 3.7 kg/month/household; eggs by 22percent from 105 to 82/month/household; and less than 50 percent of households could still buyfruits and milk during the closure. However, the meals per day did not decrease, and more than90 percent of households could still buy flour and rice; flour consumption remained stable.
This survey illustrates how political instability can affect people's nutritional status.Dietary quality and diversity are most affected, while total dietary energy intake can bestabilized, even during the prolonged border closure. However, nutritional education, forexample advising people about the high nutritional value of many cheap foods, such as vegetablesources of protein and micronutrients, would be useful in this situation.(107' 249)
Dissociation of nutrition status and economic development
The stunting prevalence in Egypt9 declined until 1995, although the rate of decline did notdirectly correlate to the increase of GNP/c (Figure 22). Stunting prevalence actually increasedfrom 22 percent to 30 percent during the rapid economic growth between 1995 and 1996. Theurban/rural gap remained constant during the decline in stunting prevalence, but increased whenthe national stunting prevalence increased (Figure 5; Annex 4).
Egypt has the highest average dietary energy consumption in the region despite its incomelevel and stunting prevalence being the second lowest (Table 1, 3). This is due to the heavy foodsubsidy schemes'° which have increased food availability per capita to levels comparable toindustrialized countries.(74 150) The food subsidy scheme covered 20 food items and in 1981,accounted for almost 20 percent of total government expenditures. But since the late 1980s, aspart of economic structural reform, the Egyptian government gradually decreased the subsidies sothat by 1995, they included only bread, wheat flour, sugar, and edible oil, and accounted for only5.5 percent of total government expenditure.(8 11 258) In that year, bread and wheat flouraccounted for 42 percent of total daily energy consumption in urban households and 23 percent inrural households, thus they are the largest sources of dietary energy in the Egyptian diet.
9 The 1997 interim Egypt Demographic and Health Survey reported a decrease of stunting prevalence and a decrease inthe urban/rural gap, but an increase of wasting prevalence (stunting prevalence: total 24.9 percent, urban 20.0percent, rural 28.2 percent; wasting prevalence: 6.1 percent).(66 )
'° Food subsidy issues are analyzed in the regional study on consumer food subsidiesS258 )
29

Nutritional status is affected by food subsidies, but how they are linked is not yet clear-there was a major food subsidy reform which was completed by 1992, and the stuntingprevalence declined steadily until 1995. The rice subsidy was canceled in 1992, and bread ismore heavily subsidized than wheat flour." This policy may have hurt rural households, sincethey consume more rice and wheat flour and prepare their own bread at home rather thanpurchase it. The persistence of child malnutrition in Egypt is related more to child caringpractices and infectious diseases, such as diarrhea and intestinal parasite infection, than to foodavailability. .(4)
Figure 22: Stunting Prevalence and GNP/c in Egypt
40- 1400
35- ,/* - 1200
S-30 w_g X0;S1000
f 252800~20
600 z
400
-4 GNP/c (US$) 200
O - I 0 - ^-
Year(Source: 5, 228, 255)
4. Improving Nutrition in MENA Countries
4-1. Major Nutrition Issues in MENA Countries
In spite of improvement in income and health status, stunting, or chronic undernutritionamong children under five years of age, is still prevalent in some countries, especially in ruralareas (Table 8). The urban/rural gap is widening: income differences are growing, inequity inaccess to social services exists, and there are other exclusionary factors which explain thispolarized development. But it requires further analyses. Nutrition improvements have laggedeconomic development in Egypt and Tunisia as reflected in their data on stunting prevalence.Morocco, while not as obvious, might also be in the same situation.
Table 8 also illustrates the status of micronutrient deficiencies in MENA countries.Certain deficiencies, particularly iron, are prevalent even in high-income countries. Women and
" Consumer price of bread is about one third of actual production cost.(11)
30
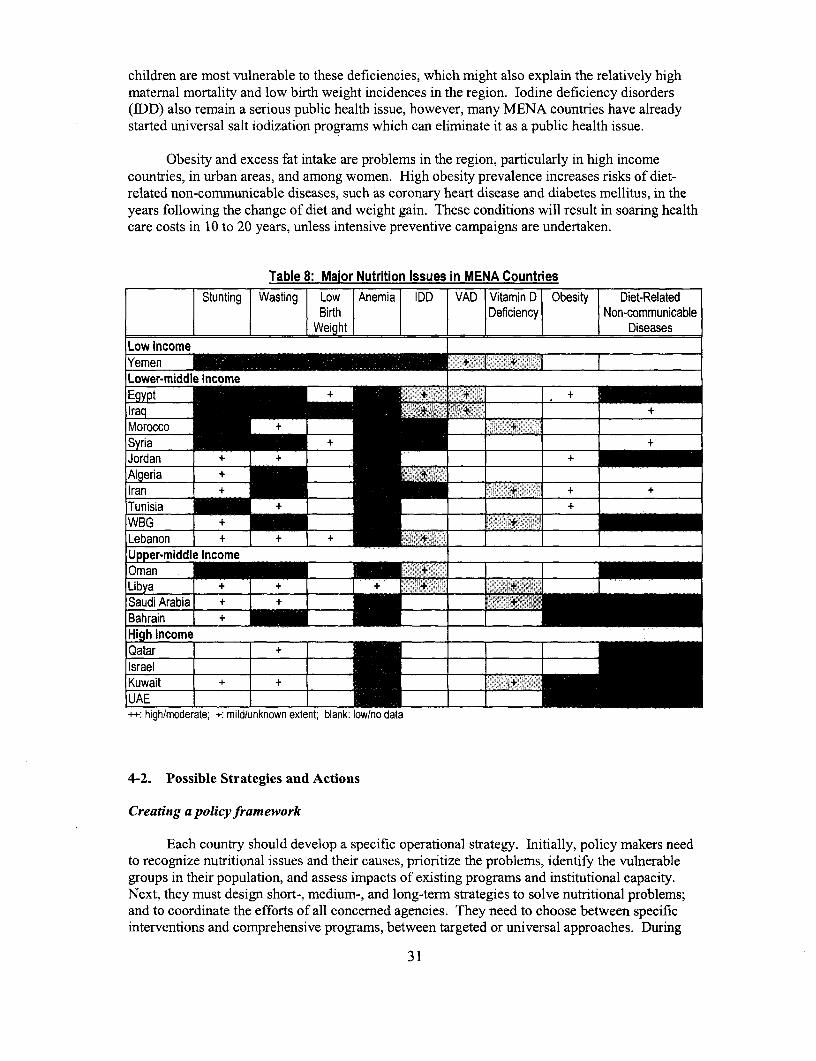
children are most vulnerable to these deficiencies, which might also explain the relatively highmaternal mortality and low birth weight incidences in the region. Iodine deficiency disorders(IDD) also remain a serious public health issue, however, many MENA countries have alreadystarted universal salt iodization programs which can eliminate it as a public health issue.
Obesity and excess fat intake are problems in the region, particularly in high incomecountries, in urban areas, and among women. High obesity prevalence increases risks of diet-related non-communicable diseases, such as coronary heart disease and diabetes mellitus, in theyears following the change of diet and weight gain. These conditions will result in soaring healthcare costs in 10 to 20 years, unless intensive preventive campaigns are undertaken.
Table 8: Maior Nutrition Issues in MENA CountriesStunting Wasting Low Anemia IDD VAD Vitamin D Obesity Diet-Related
l Birth Deficiency Non-communicableWl Weiht Diseases
Low Income ........ ...
Yemen + + Lower-middle Income _s
Egypt +_ _ + .-. + _Iraq_ + 7 , +|Morocco +_ I _ +
tSyria~~~~~~~~~~~~ + +|Jordan L + I +X _ +|Algeria | + _ "~+ XL_Ilran + _+ + +|Tunisia _+ _+|WBG r+ _ U er-middle Income
|Libya I ++ 1 + . ... I .'+ lIISaudi Arabia +__ + I _
|Bahrain I + _|High incomellQatar =
Kuwait | __
++: high/moderate; +: mild/unknown extent; blank: low/no data
4-2. Possible Strategies and Actions
Creating a policy framework
Each country should develop a specific operational strategy. Initially, policy makers needto recognize nutritional issues and their causes, prioritize the problems, identify the vulnerablegroups in their population, and assess impacts of existing programs and institutional capacity.Next, they must design short-, medium-, and long-term strategies to solve nutritional problems;and to coordinate the efforts of all concerned agencies. They need to choose between specificinterventions and comprehensive programs, between targeted or universal approaches. During
31

implementation, progress and impact have to be carefully monitored. As nutrition affects healthmost directly, Ministries of Health should take leading roles in coordinating among sectors,drafting strategies, and implementing interventions.
Since nutrition is a multi-sectoral issue, development and improvement in other sectors cangreatly affect nutritional status. Therefore, the design and preparation of programs in othersectors should always be assessed for their nutrition implications, and during implementation theyshould also be monitored for impact on nutrition. Policy changes in agricultural and trade sectorsshould be monitored for their effect on local food availability and prices. Even within the healthsector, it would be more effective to address risk factors for all nutrition disorders simultaneously.
For instance, Integrated Management of Childhood Illness (IMCI) by WHO and UNICEFis expected to reduce chronic child undemutrition through a comprehensive approach to addressthe health and nutrition problems of small children.(182) IMCI is a comprehensive primary healthcare program including case management of diarrhea, respiratory infection, and malaria, nutritioncounseling and management, and drug management. Although IMCI has been implemented invarious developing countries in the world, only a few MENA countries, such as Egypt andMorocco, started to introduce this approach.
In depth analyses necessary for each country
The real impact of food and agricultural reforms on nutritional status are not completelyunderstood. Despite the fact that nutritional status is one of the best indicators of poverty, peopleresponsible for economic policies and for nutritional assessment do not coordinate policy.Country economic data and nutritional indicators should be analyzed together to figure out whythere are discrepancies between the economic development and nutritional improvement. Priorityissues in each country can be identified only after conducting in depth studies on nutritionalissues and assessments of existing nutrition programs. Before designing interventions, such asmicronutrient fortification programs, feasibility studies or sector work should be conducted.
Various factors, such as household income, status of women, their educational attainmentand other cultural factors, critically affect nutrition and nutritional disorders, however, thesefactors are likely to carry different weights in determining the pattem of nutritional disorders.'2
Clarifying a link between the underlying causal factors and the pattems of nutritional disorderswould lead to more specificity and a prioritization of policy intervention for each nutritiondisorder pattem, and also contribute to stronger policy recommendations at the country level.
Capacity building
Strong institutions and technical capacity are a prerequisite for implementing successfuland sustainable nutrition interventions. Many countries have a shortage of qualified nutritionists,plus they are poorly distributed to address nutrition problems. In Egypt, nutritionists are mainlyhospital based in large urban areas,t24) but most of the countries' nutrition problems are in ruralcommunities. To achieve a critical mass of qualified technical personnel, regional collaborationshould be more encouraged. The WHO/EMRO and the Nutrition Institute in Cairo areconducting regional training courses on nutrition for example.(236 )
12 For example, a study in Jamaica indicated that increased child height correlated to increased education of women in ahousehold, marginally correlated to household income, but did not correlate to father's education.(97)
32

Information, education and communication (IEC)
Many nutritional disorders are not expensive to solve, or they can be avoided if peopleunderstand the risks and change their behaviors. People need to know the elements of good childfeeding practices and how to maintain a balanced diet, regardless of their incomes. Nutritionawareness is essential among the general public, and especially among mothers and caretakers ofsmall children.
Information, education and communication (IEC) programs should be designed to changeactual behaviors of people, and impacts of the programs should be carefully monitored andevaluated. IEC programs can be delivered through many channels: schools, clinics, communities,youth groups and mass media. For example, health professionals can counsel mothers aboutbreastfeeding and appropriate complementary feeding techniques at clinics or by home visit;school health programs can include nutrition education for children and provide supplementalnutrition. Information with nutrition implications in the newspapers, on television, and elsewherehas to be carefully monitored to avoid spreading misleading information and to protectconsumers.
Possible interventions to each nutrition disorder
Possible interventions for nutritional issues are summarized below. The disorders and theirpossible interventions are illustrated in Table 9. Examples of nutrition programs in othercountries, their costs and cost/benefit analyses of long term diet-related benefits of nutritionalsupplements on labor productivity relative to the costs of intervention measures are described inAnnex 2. For example, iron supplementation to rubber plantation workers in Indonesia lead 15 to25 percent increase of productivity (benefit-cost ratio of 260:1); and iron fortification of bread inLebanon is estimated to avert lifetime income loss of $15,000 (benefit-cost ratio of 7,500 to 1).
* Child malnutritionComprehensive public health and nutrition programs targeted to children under two years ofage and their care takers, particularly among the rural population, should include growthpromotion, IMCI, diarrhea control, and nutritional education regarding breastfeeding andappropriate complementary feeding techniques.
* Low birth weightComprehensive maternal health services: e.g., food and iron supplementation and nutritionmonitoring of pregnant women at the antenatal check-up. IEC programs to raise awarenessamong pregnant women and decision makers in the family including husbands and the elders.
* Obesity and diet-related non-communicable diseasesIEC programs to raise awareness of the risks of obesity and diet-related non-communicablediseases. Health promotion activities including physical exercises and nutrition counseling.Experience in industrialized countries shows that there are no single universally acceptedsolution to control obesity epidemic, thus innovative and multidirectional approach will berequired.
* AnemiaIron and folic acid supplementation to pregnant and lactating women, children, andadolescent girls through health service channels, schools and communities. IEC programs topromote proper complementary feeding, diet diversification and modification to increase ironintake and absorption. Iron fortification of staple foods. Parasitic disease control programs.Premarital genetic counseling to decrease hereditary anemic diseases.
33
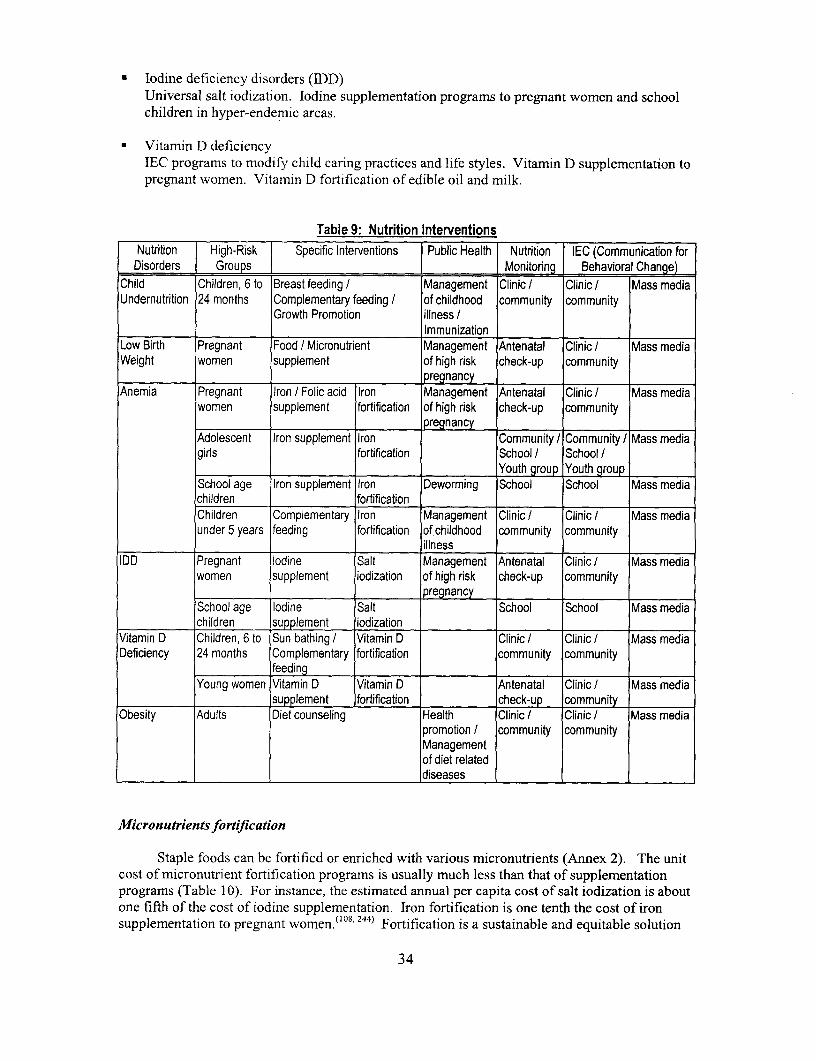
* Iodine deficiency disorders (IDD)Universal salt iodization. Iodine supplementation programs to pregnant women and schoolchildren in hyper-endemic areas.
* Vitamin D deficiencyIEC programs to modify child caring practices and life styles. Vitamin D supplementation topregnant women. Vitamin D fortification of edible oil and milk.
Table 9: Nutrition InterventionsNutrition High-Risk Specific Interventions Public Health Nutrition IEC (Communication forDisorders Groups I Monitoring Behavioral Change)
Child Children, 6 to Breast feeding / Management Clinic ! Clinic / Mass mediaUndernutrition 24 months Complementary feeding! of childhood community community
Growth Promotion illness !Immunization
Low Birth Pregnant Food / Micronutrient Management Antenatal Clinic Mass mediaWeight women supplement of high risk check-up community
pregnancyAnemia Pregnant Iron / Folic acid Iron Management Antenatal Clinic Mass media
women supplement fortification of high risk check-up communitypregnancy
Adolescent Iron supplement Iron Community Community! Mass mediagirls fortification School / School/
_ Youth group Youth groupSchool age Iron supplement Iron Deworming School School Mass mediachildren fortificationChildren Complementary Iron Management Clinic Clinic Mass mediaunder 5 years feeding fortification of childhood community community
illnessIDD Pregnant Iodine Salt Management Antenatal Clinic Mass media
women supplement iodization of high risk check-up communitypregnancy
School age Iodine Salt School School Mass mediachildren supplement iodization
Vitamin D Children, 6 to Sun bathing Vitamin D Clinic Clinic Mass mediaDeficiency 24 months Complementary fortification community community
feeding IYoung women Vitamin D Vitamin D Antenatal Clinic Mass media
supplement fortification check-up communityObesity Adults Diet counseling Health Clinic / Clinic / Mass media
promotion community communityManagementof diet relateddiseases I
Micron utrients fortification
Staple foods can be fortified or enriched with various micronutrients (Annex 2). The unitcost of micronutrient fortification programs is usually much less than that of supplementationprograms (Table 10). For instance, the estimated annual per capita cost of salt iodization is aboutone fifth of the cost of iodine supplementation. Iron fortification is one tenth the cost of ironsupplementation to pregnant women. ( 0 8
1 244) Fortification is a sustainable and equitable solution
34

to ensure micronutrient coverage of the entire population, if the fortification programs are trulyinstitutionalized, as seen in industrialized countries. Fortification of several food items, such aswheat flour and bakery products, rice, salt, sugar, condiment, and milk, is likely to provide thepotential coverage larger than fortification of single food items.
Many MENA countries have started to move forward with universal salt iodization. Allcountries in the region should adopt this policy, including those countries currently not iodizingsalt. Iodine compounds can be also added to potable water for the purpose of both waterpurification and iodization, if water systems permit. Countries should also consider ironfortification of staple foods to decrease the widespread anemia in the region. WHO/EMRO andUNICEF are promoting iron fortification of wheat, as wheat is a major staple food consumed inmany MENA countries.(237)
While fortification programs are very promising, MENA countries are likely to require aninitial investment in technical and institutional capacity building since problems can occur inmonitoring and sustaining the quality of the programs."3 Before implementation, feasibilitystudies are required to identify food consumption patterns, production and distribution systems,legal and institutional framework, and costs and incentive systems. Multi-sectoral commitmentand private sector participation are essential.f24 )
Table 10: Costs of Micronutrient Fortification ProgramsCountry Food Vehicle [ Fortificant 1 Cost (US$ipersonl year) | Year
Several Salt Iodine (50 - 80 ppm) 0.02 - 0.06 1992India Salt Iodine (50 ppm) + Iron (1,000 ppm) 0.12 - 0.18 1991Guatemala Sugar Vitamin A (15,000 lUlkg) 0.29 1994Guatemala Sugar Iron (1.3 %) 0.1 1981Egypt Wheat flour Iron (25-35 ppm) 0.15 1980Venezuela Com flour/ Iron (20 - 50 mg/kg) 0.07 - 0.08 1994
Wheat flour Vitamin A (39,000 lIU/kg)(Source: 121, 237, 244)
Categorizing nutrition issues in MENA countries
Table 8 suggests that MENA countries can be categorized into three types of nutritiondisorder patterns.
* Type 1:High malnutrition and micronutrient deficiency; low economic and social indicators; e.g.,Yemen, Iraq.
* Type 2:Relatively large population with malnutrition, with large urban-rural gaps and highmicronutrient deficiency; relatively well performing middle-income economy with asignificant number of poor; e.g., Iran, Tunisia.
13 Bahrain started fortifying wheat flour with iron and vitamins in 1993, however, the program was discontinued afterone year, primarily because of financial constraints.(37)
35
* Type 3:High micronutrient deficiency and obesity; relatively high income with pockets ofpoverty and comparatively low social indicators; e.g., Saudi Arabia, Bahrain.
Combination of interventions for each type
Type 1 countries require both specific nutrition interventions and comprehensive healthand social programs. Decreasing malnutrition among small children and pregnant women shouldbe the first priority. Particularly among MENA countries, Yemen and Iraq require specialinternational support. Yemen, with the most serious malnutrition problems and the lowestincome level in the region, needs to increase the effectiveness of its social service sector,including nutrition and health. Iraq could rehabilitate in a relatively short time once theinternational sanctions are lifted. The international community should prepare a prioritizedstrategy to rehabilitate the country when the situation allows.
Type 2 countries also require both specific nutrition interventions and comprehensivehealth and social programs targeted to decrease inequity within the country. Nutrition and othersocial programs should be targeted to the rural population and urban poor, particularly womenand small children. Food and agriculture policies should be carefully assessed for effectivenessand real nutritional impacts on the vulnerable groups.'4
Type 3 countries need to emphasize IEC programs for preventing obesity andmicronutrient deficiencies and to proceed with micronutrient fortification programs. Thesecountries also require nutrition, health and social programs targeted to their vulnerable groups.They may need technical assistance to bring their programs up to international standards.
Strategic Options for the World Bank
To assist MENA countries in improving nutrition, the World Bank may consider severalstrategic options listed below:
. Stimulate county discussionThis review, which summarizes major nutrition issues in the region, should be disseminatedamong stakeholders both in the social and economic sectors of MENA countries. This willstimulate discussions in each country and help put nutrition back on the policy agenda. Aregional conference including the public and private sectors, NGOs, and academics may bean option to formulate a regional strategy.
* Put nutrition back on the policy agenda.Nutritional status is one of the best proxies to measure poverty and social development.Therefore, nutrition issues should be taken into account in the country assistance strategy(CAS) and should be discussed with governments in the context of economic and socialdevelopment. For example, the new CAS of Yemen indicates that poverty reduction, health,nutrition and population (HNP), and education are priorities. A system for regularmonitoring of nutrition status has to be established in each country, as well as special surveysto analyze specific issues.
i4 Countries at risk for undernutrition need to design effective programs to reach the poor. In the case of Egypt, theurban poor receive income transfers and secure dietary energy intakes from self-targeted food subsidy programs.(8)
36

* Support specific programs.Bank HNP programs should emphasize nutritional improvement. Nutritional programpackages may include: maternal and child care including health services, IEC, training, andmonitoring; micronutrients and food supplementation; and micronutrient fortification.Nutritional activities in current national public health programs should be strengthened tomeet international standards. To ensure sustainability of the programs, their costs need to becarefully estimated, and feasible financing plans, including donor assistance, need to beprepared. For instance, community involvement will be a key strategic element to sustainprograms in Yemen, where the government's resources are scarce and therefore, the Bankwill pilot a community-based child development project in partnership with UNICEF.
* Partner and facilitate technical assistance.Each country has to improve current programs and prepare new ones to meet internationalnutritional standards. Even those countries that do not require financial assistance may needtechnical support for planning, implementing, and monitoring their nutrition programs. TheBank could facilitate technical assistance in partnership with other organizations such asWHO, UNICEF, FAO, and reputable NGOs, while taking into account of each agency'stechnical advantage. The Bank could also help to coordinate and mobilize the technical andfinancial resources of other agencies, including the private sector.
* Coordinate and monitor other sector programs.The Bank is a unique agency with multi-sectoral expertise. Other sectors, including waterand sanitation, agriculture, education, and industry, can assist in designing and monitoringprograms that produce positive impacts on nutrition. All poverty reduction programs shoulduse nutrition indicators, such as the results of periodic national surveys and specific surveysin intervention and control areas, for assessing the impacts of interventions and adjustingthem. The Bank could support the institutional capacity building of Ministries of Health,which could play a leading role in intersectoral coordination.
5. Conclusion - Nutrition as a Priority Issue
Nutrition disorders impede the economic development of a country. Poor nutritional statuswill lead to poor educational attainment and decreased economic productivity, plus rising healthcare costs. Long term economic loss caused by nutrition disorders should not be underestimatedbecause failing to invest in good nutritional outcomes now will incur even greater costs in thefuture.
Improving people's nutritional status should be a priority for all MENA countries. Thecountries must realize that economic development strategies until now have not improvednutrition as much as expected. Any new development strategy should include specific schemes toimprove nutritional status, particularly among women, children, and rural populations; this wouldalso strengthen economic and social development overall.
Policy makers need to reach a consensus to make nutrition a country's priority amongmany developmental issues. Strong political commitment at the highest level is needed toimplement and sustain effective nutritional interventions. The World Bank will work togetherwith governments to sustain the economic, social, and human development of their countries, andto assure a basic human right of people-adequate and balanced nutrition.
37

Bibliography
1. ACC/SCN. Second Report on the World Nutrition Situation. ACC/SCN Secretariat, Geneva, 1993.
2. ACC/SCN. Update on the Nutrition Situation 1994. ACC/SCN Secretariat, Geneva, 1994.
3. ACC/SCN. Note on Nutrition as a Risk Factor in the Global Burden of Disease (Draft). ACC/SCN Secretariat,Geneva, 1995.
4. ACC/SCN. Update on the Nutrition Situation 1996. ACC/SCN Secretariat, Geneva, 1996.
5. ACC/SCN. Third Report on the World Nutrition Situation. ACC/SCN Secretariat, Geneva, 1997.
6. ACC/SCN. SCN News, Number 15. ACC/SCN Secretariat, Geneva, 1997.
7. Abdul-Ghaffar, N.U., El-Sonbaty, M.R., El-Din Abdul-Baky, M.S., Marafie, A.A., Al-Said, A.M. Stroke inKuwait: a three-year prospective study. Neuroepidemiology, 16, 40-47, 1997.
8. Adams, R.H. Jr. Self-Targeted Subsidies: The Political and Distributional Impact of the Egyptian FoodSubsidy System. The World Bank, Washington, D.C., 1999.
9. Al-Ayed, I.H., Qureshi, M.l. Breastfeeding practices in urban Riyadh. J. Trop. Pediatr., 44, 113-117, 1998.
10. Al-Dashti, A.A., et al. Breast feeding, bottle feeding and dental caries in Kuwait, a country with low-fluoridelevels in the water supply. Community Dent. Health, 12, 42-47, 1995.
11. Ali, S.M., Adams, R. H. Jr. The Egyptian food subsidy system: operation and effects on income distribution.World Devel., 24, 1777-1791, 1996.
12. Al-Isa, A.N., Prevalence of obesity among adult Kuwaitis: a cross-sectional study. Int. J. Obesity and RelatedMet. Disorders, 19, 431-433, 1995.
13. Allen, L. H. The nutrition CRSP: what is marginal malnutrition and does it affect human function? Nutr. Rev.,51, 255-267, 1993.
14. Allen, L.H. Nutritional influences in linear growth: a general review. Eur. J. Clin. Nutr., 48:S 1, S75-S89,1994.
15. Al-Nuaim, A.A., Bamgboye, E.A., Al-Rubeaan, K.A., Al-Mazrou, Y. Overweight and obesity in SaudiArabian adult population, role of socio-demographic variables. J. Commnunity Health, 22, 211-223, 1997.
16. Alnwick, D. Weekly iodine supplements work. Am. J. Clin. Nutr., 67, 1103-1104,1998.
17. Aloui, T., Ayad, M., Fourati, H. Enquete D6mographique et de Sante en Tunisie 1988. Office National de laFamille et de la Population, Direction de la Population / Macro Systems, Inc., Columbia Maryland, 1989.
18. Al-Roomi, K.A., Musaiger, A.O., Al-Awadi, A.H. Lifestyle and the risk of acute myocardial infarction in aGulf Arab population. Int. J. Epidemiol., 23, 931-939, 1994.
19. Al-Shehri, S.N., Farag, M.K., Baldo, M.H., Al-Mazrou, Y.Y., Aziz, K.M. Overview on breastfeeding patternsin Saudi Arabia. J. Trop. Pediatr., S t, 38-44, 1995.
20. Ed. Alwan, A. Prevention and Control of Cardiovascular Diseases. WHO/EMRO, Alexandria, Egypt, 1995.
21. Alwan, A., Modell, B., Bittles, A., Czeizel, A., Hamamy, H. Community Control of Genetic and CongenitalDisorders. WHO/EMRO, Alexandria, Egypt, 1997.
22. Amine, E.K., Al-Awadi, F., Rabie, M. Infant feeding pattern and weaning practices in Kuwait. J. R. Soc.Health, 109, 178-180, 1989.
23. Anonymous. Science and technology: lost without a trace. Economist, 348, 68-69, 1998.
24. Aoyama, A., Ferrinho, P. Arab Republic of Egypt: The Situation of Human Resource Development andManagement in the Health Sector - A Background Document for the Egypt Health Sector Reform Project. TheWorld Bank, Washington, D.C., 1997.
25. Aquaron, R., Zarrouck, K., El-Jarari, M., Ababou, R., Talibi, A., Ardissone, J.P. Endemic goiter in Morocco(Skoura-Toundoute areas in the high Atlas). J. Endocrinol. Invest., 16, 9-14, 1993.
26. Arab Nutrition Society. Dietary Fiber Bibliography and Reviews Vol. 4, No. 2 25-48. Dpt. Nutr., King'sCollege London, London, 1996.
27. Arneil, G. Statement and recommendations for the prevention of micronutrient deficiencies of importance forchildren. Int. Child Health, 9, 107-110, 1998.
28. Arroyave, G., Dary, 0. Manual for Sugar Fortification with Vitamin A. USAID / OMNI / INCAP,Washington, D.C., 1996.
29. Ashworth, A., Khanum, S. Cost -Effective treatment for severely malnourished children: What is the bestapproach? Health Policy and Planning, 12, 115-121, 1997.
38
30. Assami, M., Hercberg, S., Assami, S., Galan, P., Assami, A., Potier de Courcy, G. Assessment of thenutritional status of Algerian women in the reproductive age living in an urban, rural and semi-rural area. Ann.Nutr. Metab., 31, 237-244, 1987.
31. Austin, J. E. Global malnutrition and Cereal Fortification, Ballinger Publishing Co., Cambridge, MA, 1979.
32. Barker, D.J., Martyn, C.N., Osmond, C., Hales, C.N., Fall C.H. Growth in utero and serum cholesterolconcentrations in adult life. BMJ, 307, 1524-1527, 1993.
33. Bamum, H. Evaluating healthy days of life gained from health projects, Soc. Sci. Med., 24, 833-841, 1987.
34. Basta, S.S. and Churchil, A. Iron Deficiency Anemia and the Productivity of Adult Males in Indonesia. TheWorld Bank,, Washington, D.C., 1974.
35. Beard, J.L. Weekly iron intervention: the case for intermittent iron supplementation. Am. J. Clin. Nutr., 68,209-212, 1998.
36. Behrman, J.R. The Economic Rationale for Investing in Nutrition in Developing Countries. VITAL,Philadelphia, 1992.
37. Berg, A. Malnutrition What Can Be Done? - Lessons from World Bank Experience. The Johns HopkinsUniversity Press for The World Bank, Baltimore, 1987.
38. Berg, A., Brems, S. Micronutrient Deficiencies: Present Knowledge on Effects and Control.. The World Bank,Washington, D.C., 1986.
39. Berg, A. New & Noteworthy in Nutrition No. 28. The World Bank, Washington, D.C., 1996.
40. Berg, A. New & Noteworthy in Nutrition No. 29. The World Bank, Washington, D.C., 1997.41. Berg, A. New & Noteworthy in Nutrition No. 30. The World Bank, Washington, D.C., 1998.
42. Berg, A. New & Noteworthy in Nutrition No. 31. The World Bank, Washington, D.C., 1998.
43. Ed. Berkow, R., Fletcher, A.J., Beers, M.H.M. The Merck Manual of Diagnosis and Therapy, 16th Edition.Merck Research Laboratories, Rahway, N.J., 1992.
44. Black, R.E. Therapeutic and preventive effects of zinc on serious childhood infectious diseases in developingcountries. Am. J. Clin. Nutr., 68S, 476S-479S, 1998.
45. Boerma, J.T., Weinstein, K.I., Rutstein, S.O., Sommerfelt, A.E. Data on birth weight in developing countries:can surveys help? WHO Bulletin, 74, 553-559, 1996.
46. Bray, G.A. Obesity: a time bomb to be defused. Lancet, 352, 160-161,1998.
47. Calloway, D.H., Murphy, S.P., Beaton, G.H., Lein, D. Estimated vitamin intakes of toddlers: predictedprevalence of inadequacy in village populations in Egypt, Kenya, and Mexico. Am. J. Clin. Nutr., 58, 376-384,1993.
48. Campino, A. C. The feasibility of a food-coupon progranmme in Brazil. Food Nutr. Bulletin, 13, 210-219,1991.
49. Central Statistical organization (CSO), Pan Arab Project for Child Development (PAPCHILD), MacroIntemational Inc. Yemen Demographic and Matemal and Child Health Survey 1991/1992. CSO l MacroInteml. Inc., Calverton, Maryland, 1994.
50. Chavasit, V., Tonitisirin, K. Triple fortification of instant noodles in Thailand. Food Nutr. Bulletin, 19, 164-167, 1998.
51. Chen, J., Wu, H. Fortification of salt with iodine. Food Nutr. Bulletin, 19, 172-175, 1998.
52. Coskun, T. Binding and irnmunocompromising malnutrition: vitamin A deficiency. Int. Child Health, 9, 73-84, 1998.
53. CRS/CARITAS. Growth Monitoring and Nutrition Education; Impact Evaluation of An Effective appliedNutrition Program in the Dominican Republic. USAID, Washington, D.C., 1988.
54. Dapice, D. A Cost Study of ICDS and TINP. The World Bank,, Washington, D.C., 1987.
55. De Onis, M., Blossner, M., Villar, J. Levels and pattems of intrauterine growth retardation in developingcountries. Eur. J. Clin. Nutr., 52:Sl, S5-S15, 1998.
56. Del Rosso, J.M., Marek, T. Class Action: Improving School Performance in the Developing World throughBetter Health and Nutrition. The World Bank, Washington, D.C., 1996.
57. Delange, F. The disorders induced by iodine deficiency. Thyroid, 4, 107-128, 1994.
58. Ehiri, J.E., Prowse, J.M. Child health promotion in developing countries: the case for integration ofenvironmental and social interventions? Health Policy and Planning, 14, 1-10, 1999.
59. Elbualy, M., Bold, A., de Silva, V., Gibbons, U. Congenital hypothyroid screening: the Oman experience. J.Trop. Med., 44, 81-83, 1998.
60. Elidrissy, A.T., Sedrani, S.H., Lawson, D.E. Vitamin D deficiency in mothers of rachitic infants. Calcif.Tissue Int., 36, 266-268, 1984.
39

61. El-Masri, K. Nutritional status of workers in Jordan. Z. Emahrungswiss, 30, 220-226, 1991.
62. El-Sahn, F. Dietary patterns and nutritional assessment of working children at Abou El-Dardar industrial areain Alexandria city. J. Egypt Public Health Assoc., 67, 119-145, 1992.
63. El-Sonbaty, M.R., Abdul-Ghaffar, N.U. Vitamin D deficiency in veiled Kuwaiti women. Eur. J. Clin. Nutr.,50,315-318, 1996.
64. El-Zanaty, F.H., Sayed, H.A.A., Zaky, H.H.M., Way, A.A. Egypt Demographic and Health Survey 1992.National Population Council / Macro Internl. Inc., Calverton, Maryland, 1993.
65. El-Zanaty, F., Hussein, E.M., Shawky, G.A., Way, A.A., Kishor, S. Egypt Demographic and Health Survey1995. National Population Council / Macro Internl. Inc., Calverton, Maryland, 1996.
66. El-Zanaty, F. Egypt Demographic and Health Survey 1997. Macro Internl. Inc., Calverton, Maryland, 1998.
67. Elzouki, A.Y, Markestad, T., Elgarrah, M., Elhoni, N., Aksnes, L. Serum concentrations of vitamin Dmetabolites in rachitic Libyan children. J. Pediatr. Gastroenter. Nutr., 9, 507-512, 1989.
68. FAO/WHO. International Conference on Nutrition: World Declaration and Plan of Action for Nutrition.FAO/WHO, Rome, 1992.
69. FAO. Nutrition Education for the Public. FAO, Rome, 1995.
70. FAO. Food Security and Nutrition - The World Food Summit Technical Background Documents. FAO,Rome, 1996.
71. FAO/WFP. Special Report: FAO/WFP Supply and Nutrition Assessment Mission to Iraq. FAO/WFP, Rome,1997.
72. FAO/RNE. Summary of the International Conference on Nutrition (ICN) Country Papers for SelectedCountries in the Near East Region. FAO/RNE, Cairo, Egypt, 1993.
73. FAO/RNE. Population Education and Nutrition: Version for Pakistan, Iran and Turkey. FAO/RNE, Cairo,Egypt, 1994.
74. FAO/RNE. The Impact of the Structural Adjustment Programme on Food Production Supply and Consumptionin Egypt. FAO/RNE, Cairo, Egypt, 1995.
75. FAO/RNE. Nutrition Country Profiles for Selected Countries of the Near East Region. FAO/RNE, Cairo,Egypt, 1995.
76. FAO/RNE. Apercu Nutritionnel en Afrique du Nord. FAO/RNE, Cairo, Egypt, 1996.
77. FAO/RNE. Food Balance Sheets for the Near East: 1992-94 Average. FAO/RNE, Cairo, Egypt, 1996.
78. FAO/RNE. Food Balance Sheets for the Arab Countries: 1992-94 Average. FAO/RNE, Cairo, Egypt, 1996.
79. Fedail, S.S., Murphy, D., Salih, S.Y., Bolton, C.H., Harvey, R.F. Changes in certain blood constituents duringRamadan. Am. J. Clin. Nutr., 36, 350-353, 1982.
80. Filteau S.M., Morris, S.S., Abbott, R.A., Tompkins, A.M., Kirkwood, B.R., Arthur, P., Ross, D.A., Gyapong,J.O., Raynes, J.G. Influence of morbidity on serum retinol of children in a community-based study in northernGhana. Am. J. Clin. Nutr., 58, 192-197, 1993.
81. Foo, L.-C. Eliminating iodine deficiency in rural Sarawak, Malaysia: The relevance of water iodization. Am.J. Pub. Health, 88, 680-681, 1998.
82. Food and Nutrition Board, Commission on Life Sciences, National Research Council. Diet and Health.National Academy Press, Washington, D.C., 1989.
83. Food and Nutrition Board, Commission on Life Sciences, National Research Council. Recommended DietaryAllowance 10th Edition. National Academy Press, Washington, D.C., 1989.
84. Forman, M.R., Hundt, G.L., Berendes, H.W., Abu-Saad, K., Zangwill, L., Chang, D., Bellmaker, I., Abu-Saad,1. Undemutrition among Bedouin Arab children: a follow-up of the Bedouin infant feeding study. Am. J. Clin.Nutr., 61, 495-500, 1995.
85. Frost, G., Pirani, S. Meal frequency and nutritional intake during Ramadan: a pilot study. Hum. Nutr. Appl.Nutr.,41A, 47-50, 1987.
86. Garza, C., Frongillo, E.A.Jr. Infant feeding recommendations. Am. J. Clin. Nutr., 67, 815-816, 1998.
87. Gerein, N. Is growth monitoring worthwhile? Health Policy Planning, 3, 181-194,1998.
88. Gibson, R.S. Principles of Nutritional Assessment. Oxford University Press, New York, 1990.
89. Government of Tanzania / WHO / UNICEF Joint Nutrition Support Program IRINGA 1983-1988 EvaluationReport. Govemment of Tanzania / WHO / UNICEF, Dar Es Salaam, 1988.
90. Gross, R., Angeles-Agdeppa, I., Schultink, W.J., Dillon, D., Sastroamidjojo, S. Daily versus weekly ironsupplementation: Programmatic and economic implications for Indonesia. Food Nutr. Bulletin, 18, 64-70,1997.
40

91. Gunaid, A.A., Sumairi, A.A., Shidrawi, R.G., Al-Hanaki, A., Al-Haimi, M., Al-Absi, S., Al-Hureibi, M.A.,Qirbi, A.A., Al-Awlagi, S., El-Guneid, A.M., Shousha, S., Murray-Lyon, I.M. Oesophageal and gastriccarcinoma in the Republic of Yemen. Br. J. Cancer, 71, 409-410, 1995.
92. Hales, C.N., Barker, D.J.P., Clark, P.M.S., Cox, L.J., Fall, C., Osmond, C., Winter, P.D. Fetal and infantgrowth and impaired glucose tolerance at age 64. BMJ, 303, 1019-1022, 1991.
93. Hallak, M.H., Nomani, M.Z.A. Body weight loss and changes in blood lipid levels in normal men onhypocaloric diets during Ramadan fasting. Am. J. Clin. Nutr., 48, 1197-1210, 1988.
94. Hallberg, L. Combating iron deficiency: daily administration of iron is far superior to weekly administration.Am. J. Clin. Nutr., 68, 213-217, 1998.
95. Hambidge, K.M. Zinc deficiency in young children. Am. J. Clin. Nutr., 65, 160-161, 1997.
96. Hammer, J.S. Economic Analysis for Health Projects. The World Bank, Washington, D.C., 199697. Handa, S. Maternal education and child height. Economic Develop. Cultural Change, 47, 421-439, 1999
98. Health and Welfare Statistics Association. 1997 National Public Health Situation Analysis (Kokurnin-Eisei noDoko). Health and Welfare Statistics Association, Tokyo, 1997.
99. Henry, F., Briend, A., Cooper E. Targeting nutritional interventions: Is there a role for growth monitoring?Health Policy and Planning, 4, 295-300, 1989.
100. Hetzel, B.S. The Story of Iodine Deficiency. Oxford University Press, New York, 1989.
101. Hinchliffe, S.A., Lynch M.R., Sargent, P.H., Howard, C.V., Van Velzen, D. The effect of intrauterine growthretardation on the development of renal nephrons. Br. J. Obstet. Gynaecol., 99, 296-301, 1992.
102. Ho, T.J. Economic Issues in Assessing Nutrition Projects: Costs, Affordability and Cost Effectiveness. TheWorld Bank,, Washington, D.C., 1985.
103. Horton, S. Unit Costs, Cost-Effectiveness, and Financing of Nutrition Interventions. The World Bank,Washington, D.C., 1992.
104. Horton, S. Cost analysis of feeding and food subsidy programmes. Food Policy, 192-199, 1993.
105. Hussain, K., Leeds, A.R. Some physiological effects of fasting in Ramadan on healthy Muslims: a review.Dietary Fiber Bibliography and Reviews, 4, 32-36, 1996.
106. Issaacs, P.C. Growth parameters and blood values in Arabic children. Pediatric Nursing, 15, 579-583, 1989.
107. Iyyada, R.A., Hannon, J. Food Security: A Study to Asses the Impact of the Closure on Household FoodSecurity in Gaza. Terre des Hommes, Gaza, 1996.
108. Ed. Jamison, D.T., Mosley, W.H., Measham, A.R., Bobadilla, J.L. Disease Control Priorities in DevelopingCountries. Oxford University Press for The World Bank, New York, 1993.
109. Kavishe, F.P. Can Africa meet the goal of eliminating iodine-deficiency disorders by the year 2000? FoodNutr. Bulletin, 17,262-267, 1996.
110. Kirksey, A., Wachs, T.D., Yunis, F., Srinath, U., Rahmanifar, A., McCabe, G.P., Galal, O.M., Harrison, G.C.,Jerome, N.W. Relation of maternal zinc nutriture to pregnancy outcome and infant development in an Egyptianvillage. Am. J. Clin. Nutr., 60, 782-792, 1994.
111. Kumar, B. Assessment of the Nutritional Status of Children Under 5 in the Gaza Strip. Terre des Hommes,Gaza, 1995.
112. Lampl, M., Veldhuis, J. D., Johnson, M.L. Saltation and stasis: a model of human growth. Science, 258, 801-803, 1992.
113. Lankarani, S., Musaiger, A.O. The state of nutrition in Fars, Iran: areview. Nutr. Health, 7,135-142,1991.
114. Lavon, B., Tulchinsky, T.H., Preger, M., Said, R., Kaufmnan, S. Iron deficiency anemia among Jewish and Arabinfants at 6 and 12 months of age in Hadera, Israel. Isr. J. Med. Sci., 21, 107-112, 1985.
115. Layrisse, M. et al. Early response to the effect of iron fortification in the Venezuelan population. Am. J. Clin.Nutr., 64, 903-7, 1996.
116. Leon, D.A., Lithell, H.O., Vagero, D., Koupilova, I., Mohsen, R., Berglund, L., Lithell, U-B, McKeigue, P.M.Reduced fetal growth rate and increased risk of death from ischaemic heart disease: cohort study of 15000Swedish men and women born 1915-29. BMJ, 317, 241-245, 1998.
117. Levin, H.M. A benefit-cost analysis of nutritional programs for anemia reduction. Res. Observer, 1, 219-245,1986.
118. Levin, H.M. A Benefit-Cost Analysis of Nutritional interventions for Anemia Reduction. The World Bank,Washington, D.C., 1985.
119. Lockheed, M.E. Improving Primary Education in Developing Countries. Oxford University Press for TheWorld Bank, New York, 1991.
41

120. Loevinsohn, B.P., Sutter, R.W., Costales, M.O. Using cost-effectiveness analysis to evaluate targetingstrategies: the case of vitamin A supplementation. Healthy Policy Planning, 12, 29-37, 1997.
121. Lofti, M. Micronutrient fortification of foods: current practices, research, and opportunities. MicronutrientInitiative, Intnl. Agri. Centre, Ottawa, 1996.
122. Lombeck, I., Al-Zubaidy, I.M., Kasperek, K., Feinendegen, L.E., Bremer, H.J. Zinc status of Libyan children--a pilot study. Z. Ernahrungswiss, 22, 1-5, 1983.
123. Maaravi, Y., Ginsberg, G., Cohen, A., Stessman, J., Berry, E.M. The nutritional status of 70 year olds inJerusalem. Isr. J. Med. Sci., 32, 620-625, 1996.
124. Maberly, G.F., Bagrinsky, J., Parvanta, C.C. Forging partnerships among industry, government, and academicinstitutions for food fortification. Food & Nutrition Bulletin, 19, 122-130, 1998.
125. Macario, E., Emmons, K.M., Sorensen, G., Hunt, M.K., Rudd., R.E. Factors influencing nutrition education forpatients with low literacy skills. J. Am, Dietetic Assoc., 98, 559-564, 1998.
126. Macro International Inc. Jordan Demographic and Health Survey 1990. Macro International, Inc., Calverton,Maryland, 1991.
127. Macro International Inc. Fact Sheet of Morocco 1992. Macro International, Inc., Calvcrton, Maryland, 1992.
128. Macro International Inc. Morocco Demographic and Health Survey 1995. Macro International, Inc.,Calverton, Maryland, 1996.
129. Malik, A.N.J., Cutting, W.A.M. Baby feeding: the baby friendly initiative - must adapt and develop to succeed.BMJ, 316, 1548-1549,1998.
130. Martdones-Santander, F. Cost-effectiveness of a nutrition intervention program for pregnant women. Nutr.Res., 11, 295-307, 1991.
131. Martorell, R., Schroeder, D.G. The Morbidity and Mortality Effects of Nutrition Interventions. Evaluation ofthe Impact of Health Interventions, Liege, Belgium, 1995.
132. McGuire, J.S., Popkin, B.M. Helping Women Improve Nutrition in the Developing World - Beating the ZeroSum Game. The World Bank, Washington, D.C., 1990.
133. McGuire, J.S. The Payoff from Improving Nutrition, 1996.134. The Micronutrient Initiative. IDD Prevalence and Control Program Data.; Micronutrient Malnutrition
Prevalence. University of Virginia Health Science Center, Charlottesville, Virginia, 1998.
135. Miladi, S. Prevention and Control of Micronutrient Deficiencies in the Arab Countries. FAO, Bahrain, 1997.
136. The Ministry of Health and Medical Education ! UNICEF. Situation Analysis of Children and Women in Iran.UNICEF, Teheran, Iran, 1990.
137. The Ministry of Health and Medical Education / UNICEF. The Multiple Health Indicator Cluster Survey of theIslamic Republic of Iran, 23-27 September 1995. UNICEF, Teheran, Iran, 1996.
138. The Ministry of Health and Population ! The World Bank. Egypt Health Sector Reform Program (Draft). TheWorld Bank, Washington, D.C., 1997.
139. Mock, N.B., Magnani, R.J., Abdoh, A.A., Konde, M.K. Intra-household correlations in maternal-childnutritional status in rural Guinea: implications for programme-screening strategies. WHO Bulletin, 72, 119-127, 1994.
140. Mohammad, A.M., Ardatl, K.O., Bajakian, K.M. Sickle cell disease in Bahrain: coexistence and interactionwith glucose-6-phosphate dehydrogenase (G6PD) deficiency. J. Trop. Pediatr., 44, 70-72, 1998.
141. Motarjemi, Y., Nout, M.J.R. Food fermentation: a safety and nutritional assessment. WIHO Bulletin, 74, 553-559, 1996.
142. Muazzam, M.G., Khaleque, K.A. Effect of fasting in Ramadan. J. Trop. Med. Hyg., 62, 292-294, 1959.
143. Muhilal, Sumarno, I., Komari. Review of surveys and supplementation studies of anaemia in Indonesia. FoodNutr. Bulletin, 17, 3-6, 1996.
144. Musaiger, A.O., Matter, A.M., Alekri, S.A., Mahdi, A.R. Obesity among secondary school students in Bahrain.Nutr. Health, 9, 25-32, 1993.
145. Ed. Musaiger, A.O., Miladi, S.S. Food Consumption Patterns and Dietary Habits in the Arab Countries of theGulf. FAO/RNE, Cairo, Egypt, 1995.
146. Musaiger, A.O. Nutritional status of infants and young children in the Arabian Gulf countries. J. Trop.Pediatr., 42, 121-124, 1996.
147. Ed. Musaiger, A.O., Miladi, S.S. Proceedings of Workshop on Establishing Food Composition Data for theArab Countries of the Gulf (Gulfoods). FAO/RNE, Cairo, Egypt, 1996.
148. Ed. Musaiger, A.O., Miladi, S.S. Micronutrient Deficiencies in the Arab Middle East Countries. FAO/RNE,Cairo, Egypt, 1996.
42

149. Ed. Musaiger, A.O., Miladi, S.S. Diet-Related Non-Communicable Diseases in the Arab Countries of the Gulf
FAO/RNE, Cairo, Egypt, 1996.
150. Musaiger, A.O., Miladi, S.S. The State of Food and Nutrition in the Near East Countries. FAOIRNE, Cairo,
Egypt, 1997.
151. Ed. Musaiger, A.O., Miladi, S.S. Proceedings of Workshop on Prevention and Control of Micronutrient
Deficiencies in the Arab Gulf Cooperation Council Countries. FAO/RNE, Cairo, Egypt, 1997.
152. Musgrove, P. Feeding Latin America's Children: An Analytical Survey of Food Programs. The World Bank,
Washington, D.C., 1991.
153. Neumann, C.G., Harrison, G.G. Onset and evolution of stunting in infants and children: examples from the
Human Nutrition Collaborative Research Support Program, Kenya and Egypt studies. Eur. J. Clin. Nutr.,
48:SI, S90-S102, 1994.
154. Nilson, A., Piza, J. Food fortification: A tool for fighting hidden hunger. Food Nutr. Bulletin, 19, 49-60, 1998.
155. Nomani, M.Z.A., Hallak, M.H., Nomani, S., Siddiqui, I.P. Changes in blood urea and glucose and theirassociation with energy-containing nutrients in men on hypocaloric diets during Ramadan fasting. Am. J. Clin.
Nutr., 49, 1141-1145, 1989.
156. Obermeyer, C.M., Cardenas, R. Son preference and differential treatment in Morocco and Tunisia. Studies in
Family Planning, 28, 235-244, 1997.
157. Osmond, C., Barker, D.J., Winter, P.D., Fall, C.H., Simmonds, S.J. Early growth and death from
cardiovascular disease in women. BMJ, 307, 1519-1524, 1993.
158. Padilla, M., Delpeuch, F., Le Bihan, G., Maire, B. Les politiques alimentaires en Afrique du Nord. Karthala,
Paris, 1995.
159. Page, L.B., Vandevert, D.E., Nader, K., Page, J.R. Blood pressure of Quash'qai pastoral nomads in Iran inrelation to culture, diet and body form. Am. J. Clin. Nut., 34, 527-538, 1981.
160. Patel, M.S. Eliminating Social Distance Between North and South; Cost-effective Goals for the 1990s.UNICEF, New York, 1989.
161. Pellett, P.L. Nutrition and health in Iraq. Intl. Qrtly. Comm. Health Educ., 17, 109-115, 1998.
162. Perinatal Medicine (Syusanki Igaku) Editorial Committee. Essentials of Perinatal Medicine (Syusanki IgakuHissyu Chishiki) 3rd Edition. Tokyo Igaku-sha, Tokyo, 1991.
163. Phillips, M., Saenz G., Fiedler, J., Rogers, B., Tatian, P., Sanghvi, T., Behrman, J. The Cost and Cost-Effectiveness of School Feeding and School Bonos Programs in Honduras. USAID, Washington, D.C., 1995.
164. Popkin, B.M. Key economic issues. Food Nutr. Bulletin, 19, 117-121, 1998.
165. Popkin, Barry M., Solon, F.S., Fernandez, T., Latham M.C. Benefit-Cost Analysis in the Nutrition Area: AProject in the Philippines. Soc. Sci. Med., 14C, 207-216, 1980.
166. Prasad, A.S., Miale, Jr. A., Farid, Z., Sandstead, H.H., Schulert, A.R., Darby, W.J. Biochemical studies on
dwarfism, hypogonadism and anemia. Arch. Int. Med., 111, 407-428, 1963.
167. Prasad, A.S. Discovery of human zinc deficiency and studies in an experimental human model. Am. J. Clin.Nutr., 53, 403-412, 1991.
168. Rabiee, F., Geissler, C. Causes of malnutrition in young children: Gilan, Iran. J. Trop. Pediat., 36, 165-170,
1990.
169. Ross, J., Horton, S. Economic Consequences of Iron Deficiency (Draft). Micronutrient Initiative, Ottawa,Canada, 1998.
170. Rosso, J.M.D. Investing in Nutrition with World Bank Assistance. The World Bank, Washington, D.C., 1992.
171. Sandstead, H.H. Zinc deficiency: a public health problem? Am. J. Dis. Children, 145, 853-859, 1991.
172. Sampail, Y., Campino, A.C. Food and nutrition interventions in Brazil. Food Nutr. Bulletin, 13, 190-201,1991.
173. Scholz, B.D., Gross, R., Schultink. W, Sastroamidjojo, S. Anaemia is associated with reduced productivity ofwomen workers eve in less-physically-strenuous tasks. Br. J. Nutr., 77, 47-57, 1997.
174. Scrimshaw, N. The relation between fetal malnutrition and chronic disease later in life. BMJ, 315, 825-826,1997.
175. Seidell, J.C. Dietary fat and obesity: an epidemiologic perspective. Am. J. Clin. Nutr., 67:S, 546S-550S, 1998.
176. Serenius, F., Elidrissy, A.T., Dandona, P. Vitamin D nutrition in pregnant women at term and in newly bornbabies in Saudi Arabia. J. Clin Pathol., 37, 444-447, 1984.
177. Shaar, K. H., Shaar, M. A. The nutritional status of children of displaced families in Beirut. Int. J. Epidemiol.,22, 348-357, 1993.
43

178. Solomons, N.W. There needs to be more than one way to skin the iodine deficiency disorders cat: novelinsights from the field in Zimbabwe. Am. J. Clin. Nutr., 67, 1104-1105, 1998.
179 Stafford, M., Lucas, A. Possible association between low birth weight and later heart disease needs to beinvestigated further. BMJ, 316, 1247-1248, 1998.
180. Suharno, D., Muhilal Vitamin A and nutritional anaemia. Food Nutr. Bulletin, 17, 7-10, 1996.181. Sundqvist, J., Wijetunga, M., Assey, V., Gebre-Medhin, M., Peterson, S. Salt iodation and risk of neonatal
brain damage. Lancet, 352, 34-35, 1998.182. Support for Analysis and Research in Africa (SARA)/USAID. Guide for the Introduction of Integrated
Management of Childhood Illness. SARA/USAID, Washington, D.C., 1996.183. Suwanik, R., et al. Iron deficiency anaemia and endemic goitre: selective fortification for their elimination
from the Thai population. J. Med. Ass. Thai, 63, 611-616, 1980.184. Tagwireyi, J., Greiner, T. Nutrition in Zimbabwe - An Update. The World Bank, Washington, D.C., 1994.185. Tamura, T., Goldenberg, R.L. Zinc nutriture and pregnancy outcome. Nutr. Res. Rev., 16, 139-181, 1996.186. Taubes, G. As obesity rates rise, experts struggle to explain why. Science, 280, 1367-1368, 1998.187. Tezic, T. Iodine deficiency disorders and their prevention. Int. Child Health, 9, 67-71, 1998.188. Todd, C. H., Dunn, J.T. Intermittent oral administration of potassium iodide solution for the correction of
iodine deficiency. Am. J. Clin. Nutr., 67, 1279-1283, 1998.189. Tonglet, R. Efficacy of low oral doses of iodized oil in the control of iodine deficiency in Zaire. New Eng. J.
Med., 326, 236-241, 1992.
190. Tuck, L., Lindert, K. From Universal Food Subsidies to a Self-Targeted Program: A Case Study on TunisianReform. The World Bank, Washington, D.C., 1996.
191. UNDP. Human Development Report 1998. Oxford University Press for UNDP, New York, 1998.192. UNICEF. The State of the World Children 1984. Oxford University Press for UNICEF, New York, 1984.193. UNICEF. The State of the World Children 1985. Oxford University Press for UNICEF, New York, 1985.194. UNICEF. The State of the World Children 1986. Oxford University Press for UNICEF, New York, 1986.195. UNICEF. The State of the World Children 1987. Oxford University Press for UNICEF, New York, 1987.196. UNICEF. The State of the World Children 1988. Oxford University Press for UNICEF, New York, 1988.197. UNICEF. The State of the World Children 1989. Oxford University Press for UNICEF, New York, 1989.198. UNICEF. The State of the World Children 1990. Oxford University Press for UNICEF, New York, 1990.199. UNICEF. The State of the World Children 1991. Oxford University Press for UNICEF, New York, 1991.200. UNICEF. The State of the World Children 1992. Oxford University Press for UNICEF, New York, 1992.201. UNICEF. The State of the World Children 1993. Oxford University Press for UNICEF, New York, 1993.202. UNICEF. Child Malnutrition: Progress Toward the World Summit for Children Goal. UNICEF, New York,
1993.203. UNICEF. The State of the World Children 1994. Oxford University Press for UNICEF, New York, 1994.204. UNICEF. The State of the World Children 1995. Oxford University Press for UNICEF, New York, 1995.205. UNICEF. The State of the World Children 1996. Oxford University Press for UNICEF, New York, 1996.206. UNICEF. The State of the World Children 1997. Oxford University Press for UNICEF, New York, 1997.207. UNICEF. The State of the World Children 1998. Oxford University Press for UNICEF, New York, 1998.208. UNICEF. The Health and Nutrition of Women and Children in the Republic of Yemen. UNICEF, Sana'a,
Yemen, 1993.209. UNICEF Jordan Country Programme. The State of the Jordanian Child 1992-1993. UNICEF, Amman, Jordan,
1993.210. UNICEF / The World Bank. The Situation of Women and Children in the Republic of Yemen. UNICEF/The
World Bank, Sana'a, Yemen, 1998.211. University of Indonesia, Opportunity on Micronutrient Interventions. Cost Effectiveness Analysis: Iron
Implementation Program for Female Worker in Selected Companies in Indonesia. University of Indonesia,Jakarta
212. USAID. Comparing the Costs and Effectiveness of Altemative Food Security and Nutrition Programs inHonduras. USAID, Washington, D.C., 1994.
213. USAID, OMNI, John Snow Inc. Economic Analysis of Micronutrient Interventions. USAID, OMNI, JohnSnow Inc., Washington, D.C., 1998.
44

214. Van Den Broek, N. Anaemia in pregnancy in developing countries. British J. Obstet. Gynaecol., 105, 385-391,1998.
215. Van Der Gaag, J. Private and Public Initiatives: Working Together for Health and Education. The World
Bank, Washington, D.C., 1995.
216. Verster, A., Van Der Pols, J.C. Anaemia in the Eastern Mediterranean region. Eastern Medit. Health J., 1, 64-79, 1995.
217. Vial, I., Muchnik, E., Kain, J. The evolution of Chile's main nutrition intervention programmes. Food Nutr.Bulletin, 13, 170-179, 1991.
218. Watson, F. Situation Analysis on Nutrition in Gaza and the West Bank. WHO, Geneva, 1996.
219. WFP. Relief Operations (Emergency and Protracted) Approved during the Period I January - 31 December1995. WFP, Rome, 1996.
220. WHO, Maternal Health and Safe Motherhood Programme/Nutrition Programme. The Prevalence of Anaemiain Women. WHO, Geneva, 1992.
221. WHO, Micronutrient Deficiency Information System. MDIS Working Paper #1: Global Prevalence of IodineDeficiency Disorders. WHO, Geneva, 1993.
222. WHO, Micronutrient Deficiency Information System. MDIS Working Paper #2: Global Prevalence of VitaminA Deficiency. WHO, Geneva, 1995.
223. WHO Nutrition Programme. Nutrition: Highlights of Recent Activities in the Context of the World Declarationand Plan of Action for Nutrition. WHO, Geneva, 1995.
224. WHO. Iodized oil: recommendations to prevent iodine deficiency disorders. WHO Drug Information, 10, 78-79, 1996.
225. WHO, Nutrition Programme / FAO. Preparation and Use of Food-based Dietary Guidelines: Report of a JointFAO/WHO Consultation. WHO, Geneva, 1996.
226. WHO. The Health Conditions of the Population in Iraq since the Gulf Crisis. WHO, Geneva, 1996.
227. WHO / The World Bank. Matemal Health Around the World. WHO, Geneva, 1997.
228. WHO, Programme of Nutrition, Family and Reproductive Health. WHO Global Database on Child Growth andMalnutrition. WHO, Geneva, 1997.
229. WHO / UNICEF. Joint WHO/UNICEF Commentary on Health Pre-Sessional Working Group on the InitialState Party Report of Iraq Committee on the Rights of the Child. WHO/UNICEF, Geneva, 1998.
230. WHO, Division of Noncommunicable Diseases, Programme of Nutrition, Farnily and Reproductive Health.Obesity: Preventing and Managing the Global Epidemic; Report of a WHO Consultation on Obesity. WHO,Geneva, 1998.
231. WHO, Programme of Nutrition, Family and Reproductive Health. Complementary Feeding of Young Childrenin Developing Countries: a Review of Current Scientific Knowledge. WHO, Geneva, 1998.
232. WHO/EMRO. Guidelines for a National Programme for the Control of Iodine Deficiency Disorders in theEastern Mediterranean Region. WHO/EMRO, Alexandria, Egypt, 1988.
233. WHO/EMRO. Iodine Deficiency Disorders: A strategy for control in the Eastern Mediterranean Region.WHO/EMRO, Alexandria, Egypt, 1990.
234. WHO/EMRO/AFRO. Complementary Feeding of Infants and Young Children. WHO/EMRO/AFRO,Alexandria, Egypt, 1996.
235. WHO/EMRO. Guidelines for the Control of Iron Deficiency in Countries of the Eastern Mediterranean MiddleEast and North Africa. WHO/EMRO, Alexandria, Egypt, 1996.
236. WHO/EMRO. Management of Nutrition Progranmmes: Flexible Modules for Training. WHO/EMRO,Alexandria, Egypt, 1998.
237. WHO/EMRO / UNICEF / The Micronutrient Initiative. Fortification of Flour with Iron: In Countries of theEastern Mediterranean Middle East and North Africa. WHO/EMRO, Alexandria, Egypt, 1998.
238. Wickelgren, I. Obesity: how big a problem? Science, 280, 1364-1367, 1998.
239. Williams, S., George, I., Silva, P. Intrauterine growth retardation and blood pressure at age seven and eighteen.J. Clin. Epidemiol., 45, 1257-1263, 1992.
240. The Working Group on Fortification of Salt with Iron. Use of common salt fortified with iron in the controland prevention of anemia - a collaborative study. Am. J Clin. Nutr., 35, 1442-1451, 1982.
241. The World Bank. India: Second Tamil Nadu Nutrition Project. The World Bank, Washington, D.C., 1990.
242. The World Bank. World Development Report 1993. Oxford University Press for The World Bank, New York,1993.
45

243. The World Bank. Kingdom of Morocco: Nutrition and National Development - Issues and Options. TheWorld Bank, Washington, D.C., 1994.
244. The World Bank. Enriching Lives: Overcoming Vitamin and Mineral Malnutrition in Developing Countries.The World Bank, Washington, D.C., 1994.
245. The World Bank. Nutrition Toolkit - Investing in Nutrition with World Bank Assistance. The World Bank,Washington, D.C., 1996.
246. The World Bank. Republic of Yemen: Poverty Assessment. The World Bank, Washington, D.C., 1996.247. The World Bank. Hashimite Kingdom of Jordan: Health Sector Study. The World Bank, Washington, D.C.,
1997.
248. The World Bank. Republic of Yemen: Enhancing Policy Options - A Population Sector Study. The WorldBank, Washington, D.C., 1997.
249. The World Bank. West Bank and Gaza: Medium Term Development Strategy and Public Financing Prioritiesfor the Health Sector. The World Bank, Washington, D.C., 1997.
250. The World Bank. United Arab Emirates: Comprehensive Health Sector Study - Working Papers. The WorldBank, Washington, D.C., 1997.
251. The World Bank. Democratic and Popular Republic of Algeria: Growth, Employment and Poverty Reduction(Green Cover). The World Bank, Washington, D.C., 1997.
252. The World Bank. Assessment of Socio-Economic Conditions in Lebanon (Working Paper). The World Bank,Washington, D.C., 1997.
253. The World Bank. Health, Nutrition and Population in Middle East and North Africa Region (Draft). TheWorld Bank, Washington, D.C., 1997.
254. The World Bank. World Development Report 1997. The World Bank, Washington, D.C., 1997.255. The World Bank. World Development Indicators 1997. The World Bank, Washington, D.C., 1997.256. The World Bank Human Development Network. Sector Strategy: Health, Nutrition, & Population. The World
Bank, Washington, D.C., 1997.257. The World Bank. Republic of Yemen: Agricultural Strategy Note (Yellow Cover). The World Bank,
Washington, D.C., 1998.258. The World Bank. MENA Regional Study on Consumer Food Subsidies (Draft). The World Bank,
Washington, D.C., 1998.259. The World Bank. India: Wasting Away - The Crisis of Malnutrition in India (Draft). The World Bank,
Washington, D.C., 1998.260. Zerfias, A. Review and Analysis of National Programs of Action as They Relate to Nutrition. UNICEF, New
York, 1993.
46

Annex 1. Nutrition Disorders - Background Information
1. Child Malnutrition
Child malnutrition in a certain population is usually evaluated anthoropometrically throughstunting, wasting, and underweight, in comparison with a standard reference population such asthe United States National Center for Health Statistics (NCHS) tables.(88) Severe malnutritionrefers to the status lower than -3SD of the reference population. Moderate malnutrition refers tolower than -2SD but higher than -3SD.
Stunting refers to low height for age, reflecting a relatively long-term malnutrition status.Stunting is slowing of skeletal growth and stature resulted from extended periods of inadequatefood intake and repeated childhood diseases. It is considered to be the most stable parameter forchild malnutrition. Wasting refers to low weight for height, reflecting an acute malnutritionstatus that may be caused by temporary famine, sudden economical depression or a war. It is asensitive index of current nutritional status. Underweight refers to low weight for age. It is ageneral and simple parameter for malnutrition, but doesn't consider height differences.
Marasmus is an extreme form of protein energy malnutrition, characterized by loss ofmuscle mass and adipose tissue. Marasmus results from a prolonged reduction of food intakeunder famine-like conditions. Kwashiorkor is another form of extreme protein energymalnutrition, results from a diet with a low protein content relative to energy. It also arises froman inadequate intake of dietary protein concomitant with acute protein losses induced by trauma,sepsis, and so on. Unlike marasmus, kwashiorkor does not result in a depletion of skeletal muscleprotein: instead the visceral and serum protein pool is depleted and edema occurs.
Unless there are absolute food shortage, child malnutrition is mainly due to incorrect childfeeding practices including complementary feeding, repeated childhood diseases such as diarrheaand respiratory infection, incorrect care of sick children, and lack of personal hygiene andenvironmental sanitation. The incidences of malnutrition are usually the highest among thechildren over six months and under five years of age.
2. Breastfeeding and Weaning
Breastfeeding is internationally promoted as the wide range of benefits is well recognized.It is recommended that breastfeeding should be started immediately after birth, continuedexclusively for about six months, with complementary foods for up to two years. (207 231, 234) Thisis particularly important in developing countries, where bottle feeding practices often fail to meetproper nutritional and sanitary conditions: e.g., baby formula prepared with contaminated wateror too diluted. Baby Friendly Hospital Initiative, started in 1991 by the World HealthOrganization (WHO) and the United Nations Children's Fund (UNICEF), has transformed over12,700 hospitals in 14 countries into centers of support for breastfeeding.(207)
Breast milk contains nutritional substances ideal in quantity and quality for optimal growthand development of infants. In addition to its nutritional value, breast milk favorably changes thepH of stools and the intestinal flora, thus protecting against bacterial diarrhea.(43 ) Colostrum is ahigh caloric, high protein, thin yellow fluid present in the breast before birth and for the first fewdays thereafter, which contains antibodies, lymphocytes and macrophages as well as nutrients.Colostrum also stimulates the passage of meconium of newborn.
47
On average, about 600 - 750 ml breast milk is produced per day. Lactating mothers requireadditional 600 - 800 kcal of dietary energy and 15 g of protein per day.(83 ) Since infants'nutritional requirements increase, complementary solid foods should be introduced after sixmonths. Gradual weaning over weeks or months is recommended.
In addition, breastfeeding provides emotional and psychological benefits to both mothersand infants. Suckling stimulates oxytocin excretion, which stimulates milk secretion as well asuterine contraction and helps postpartum recovery. Prolactin, a hormone regulating milkproduction, inhibits ovulation and causes postpartum amenorrhea. Thus, breastfeeding alsoprovides natural contraception.
3. Fetal Malnutrition
Fetal malnutrition usually reflects the status of health and nutrition of pregnant women.Although intrauterine growth retardation (IUGR) is more suitable for assessing fetal malnutrition,it is often difficult to determine accurate gestational age in developing countries.!55 ) Therefore,low birth weight is usually used for assessing the prevalence of fetal malnutrition.
Low birth weight is defined as the birth weight less than 2,509 g.(5 55) Low birth weightinfants include small for gestational age infants born at term, appropriate for gestational ageinfants born prematurely, and a few normal infants in the lower end of the growth distribution.The prevalence of low birth weight in developing countries is estimated at about 16 percent; it isabout six percent in the industrialized countries. It is sometimes difficult to estimate theincidences of low birth weight in developing countries, since the proportion of the infantsweighed at birth varied greatly: e.g. 86 percent in Jordan, 22 percent in Morocco, and only 6percent in Yemen.(45 )
IIUGR is defined as birth weight below the 10th percentile of the birth weight forgestational age, sex specific, single/twins risk curve.(5) ITUGR is mainly caused by fetalmalnutrition due to maternal malnutrition, pre-eclampsia and other matemal complications,cigarette smoking, and so on. IUGR is also caused by fetal disorders such as chromosomalanomaly and intrauterine viral infection.('62 ) IUGR is estimated at about 24 percent of live birthsin developing countries.
Fetal malnutrition can lead to structural or functional changes in utero that permanentlyincrease susceptibility to chronic diseases. People born with low birth weight are reported toshow higher incidences of high blood cholesterol levels, hypertension, and lower glucosetolerance that may lead to diabetes mellitus.(5,3 2' 92
X 101, 116, 157,174,179, 239) Considering that chronicnon-communicable diseases are increasing in most developing countries, maternal care requiresmore attention for decreasing IUGR and low birth weight infants.
4. Body Mass Index (BMI)
Body Mass Index (BMI) is one of the common indicators of adult overweight and obesity,as well as underweight and adult malnutrition. BMI is calculated through the formula below. 88
)
The incidences of chronic non-communicable diseases such as diabetes mellitus andcardiovascular diseases are lowest when BMI is around 22. Underweight, overweight, andobesity are defined as below.
48

BMI = Weight (kg) I Height (m) 2
Underweight BMI < 20
Overweight BMI > 25
Obesity BMI > 30
5. Protein, Carbohydrates and Fat
Protein, carbohydrates, and fat are macrocomponents of the diet and the principal sourcesof energy: protein, 4 kcal/g; carbohydrates, 4 kcal/g; and fat, 9 kcal/g.(83 )
Proteins account for about three-fourths of the dry matter in most human tissues other thanbone and adipose tissues. Proteins are made up of about 20 common amino acids: nine aminoacids are not synthesized by mammals and are therefore dietary essential, whereas others aresynthesized from dietary sources of carbon, usually from carbohydrates, and nitrogen. Aminoacids are required for the synthesis of body protein and other important nitrogen-containingcompounds, such as creatine, peptide hormones, and some neurotransmitters.
Carbohydrates are the principal dietary sources of energy, particularly in developingcountries. The principal dietary carbohydrates are sugars and complex carbohydrates. Sugarsinclude monosaccharides, such as glucose and fructose, and disaccharides, such as sucrose,maltose, and lactose. Sugars are found in fruits, milk, honey, corn syrups, candies, sweet dessertsand soft drinks. Complex carbohydrates or polysaccharides comprise starches and dietary fibers.Starches are polymers of glucose and found in cereal grains and their products such as bread andrice, potatoes, legumes, and a few other vegetables. Dietary fibers are indigestible complexcarbohydrates such as cellulose, pectin, and algal polysaccharides. Dietary fibers bind to mineralelements and interfere with absorption, although consumption of fiber rich diet is related to areduced risk of cardiovascular diseases and colon cancer.
Fats or tryglycerides are composed of three fatty acids esterified to glycerol. Fats are themost concentrated source of dietary energy and sources of a few essential fatty acids. Fatsfacilitate absorption of fat-soluble vitamins, as well as enhance the palatability of food. Dietarysources of fats are meats, poultry, fish, shellfish, milk and milk products, eggs, edible oils, andmargarine. Cholesterol and phospholipids are major components of all cell membranes and ofmyelin. Cholesterol is also the precursor of the steroid hormones and of the bile acids. Highlevels of LDL-cholesterol in plasma relate an increased risk of atherosclerotic vascular disease,especially coronary heart disease, whereas high levels of HDL-cholesterol are associated with areduced risk.(43
82) The strongest dietary determinant of blood cholesterol levels is the content ofsaturated fatty acids, which are mainly present in animal fats.
Recommended Dietary Allowance (RDA)
US Japan(25-50 year old) (30-39 ear old)
Male Female Male Female
Total Dietary Energy (kcallday)* 2[0 2,500 2,000Protein (g/day) 63 50 70 60Tats contribute about 36 % of total energy in US, whereas 26 % in Japan. (Source: 83, 98)
49

6. Nutritional Anemia
Nutritional anemia is a condition in which the hemoglobin (Hb) content of the blood islower than normal, as a result of a deficiency of one or more essential nutrients--usually iron, lessfrequently folic acid or vitamin B12.-5) Iron deficiency anemia is the most common nutritionaldisorder in both developing and industrialized countries. Protein energy malnutrition usuallyaccompanies nutritional anemia, however, iron deficiency anemia frequently occurs in thoseindividuals with sufficient, or even over intakes of, protein and dietary energy.
Iron is a constituent of Jb, the oxygen carrying molecule of the red blood cells,myoglobin, and a number of enzymes.(8 3) In addition to these functional forms, as much as 30percent of the body iron is found in storage forms such as ferritin and hemosiderin, mainly in thespleen, liver and bone marrow, and a small amount is associated with the blood transport proteintransferrin. Clinical signs of iron deficiency include hypochromic-microcytic anemia, glossitis,spoon nails, loss of energy, tiredness, increased susceptibility to infection and reduction inintellectual performance and work capacity.(5 4 3 2 16
, 235) Measurement of the concentration of Hbin whole blood is the most widely used screening test for iron deficiency anemia.
Hb Levels Indicative of Anemia Epidemiological Criteria
Age / Gender Hb level Prevalence Mild / Moderate Severe AnemiaChildren 6 months -5 years < 11 g/dl Anemia (Hb < 7 g/dI)Children 6 - 14 years < 12 g/dl Severe > 40 % > 10 %Non-pregnant Women < 12 g/dl Moderate 10 -39 % 1 - 9.9 %Pregnant Women < 11 g/dI Mild 1 - 9.9 % 0.1 -0.9 %Adult Men < 13 g/dl (Source: 5, 216, 235)
Iron deficiency arises from inadequate dietary iron intakes, poor absorption, excessive losscaused by gastrointestinal bleeding, menstruation, parasite infection, and so on. Iron is requiredin greater amount during periods of rapid growth. Women of reproductive age lose 50 percentmore iron than men, due to menstrual bleeding. Therefore, women of reproductive age, infantsand young children who require higher iron intakes are more susceptible to iron deficiency. (43, 86,216) Heme iron in animal products such as meat, liver, poultry, seafood, is highly absorbable,while nonheme iron in cereals, vegetables, fruits and dairy products is less bioavailable. Ascorbicacid, or vitamin C, in plant foods increases the absorption of nonheme iron when the two areingested together. On the other hand, tannins, phytate, and dietary fiber, which are found in teaand bran, decrease nonheme iron absorption substantially. These inhibitors can be reduced byfood processing, such as fermentation, sprouting, and cooking.(141
235)
Folic acid and vitamin B12 are water-soluble vitamins which are involved in nucleic acidsynthesis. Deficiency of folic acid or vitamin B12 causes megaloblastic anemia.(43' 83) Vitamin B12(cobalamin) is also involved in synthesis of myelin in the nervous system, and deficiency maycause irreversible neurological abnormalities.
Folic acid is included in green leaves and is essential for cellular replication anddifferentiation. Since the recovery of anemia is usually better through iron and folic acidsupplementation than iron alone, most of the current supplementation programs for pregnantwomen provide both iron and folic acid. Folic acid is known to prevent congenital neural tubedefect when it is supplemented to the folic acid resistant women during the first trimester of
50

pregnancy.(5) Therefore, folic acid should be supplemented when a woman who has previousneural tube defect pregnancies plans to be pregnant again.
7. Iodine
Iodine deficiency disorders (IDD) cover a wide variety of clinical conditions includinggoiter, impaired physical and mental development, abortions, still births, congenital anomalies,increased perinatal and infant mortality, and neurological and myxedematous cretinism.(57 187)
IDD is caused by lack of iodine in the soil of endemic areas, therefore whole populationconsuming local foodstuffs, regardless income levels, are likely to suffer.(232
233) Endemic areasinclude mountainous regions and recurrently flooded plains where iodine in the soil is continuallywashed away, as well as deserts and oases where iodine is hardly supplied by rainfall. Pregnantwomen are the most at risk as IDD may cause irreversible damage to the fetus and infants. Iodinerequirement for children increases with age, so goiter prevalence also increases with age amongchildren in the endemic areas. (221)
Iodine, a trace element present in the human body in minute amounts, is an essentialsubstrate for synthesis of thyroid hormones, i.e. thyroxine (T4) and triiodothyronine (T3) .(83)Iodine is present in food and water largely as inorganic iodide and is absorbed rapidly. Seafoodsare excellent dietary sources of iodine. Natural goitrogens are present in a certain vegetables suchas cabbage, turnips and cassava. Low dietary intakes of iodine decrease thyroid hormonesecretion, resulting increased secretion of thyroid stimulating hormnone (TSH) through thenegative feedback mechanism. If iodine intakes are limited for prolonged periods, hence TSHcontinues to stimulate the thyroid gland, an iodine deficiency goiter is developed.(43)
Surveys of goiter can be done by palpation or ultrasonographic measurement. The totalgoiter rate (TGR) is the prevalence of visible goiter and goiter detectable by palpation.(57
, 221) Themost widely used method of assessing iodine status is to determine urinary iodine excretion in a24-hour urine specimen, or alternatively casual urine specimen in comparison with creatinineexcretion.(88) Serum T3 levels rather increase in clinically euthyroid iodine deficient individuals,whereas T4 levels decrease. Serum TSH concentrations are notably higher in chronic severeiodine deficiency. Congenital hypothyroidism is usually screened by using a TSH cut-off of 20-25 mU/I whole blood (about 40-50 mU/I serum).
Severity of IDD Based on TGR in Schoolagqe Children
IDD Status TGR Prevalence
No IDD / IDD Eliminated <5 %Mild IDD 5- 19.9 %Moderate IDD 20 -29.9 %Severe IDD >30 %
(Source: 221)
8. Vitamin A
Vitamin A, a fat-soluble vitamin, is a group of compounds including retinol, retinaldehyde,and retinoic acid, which is essential for vision, growth, cellular differentiation and proliferation,reproduction and the integrity of the immune system.(5 83
88) Vitamin A requirement increases
51

during periods of rapid growth and development, lactation, and infections including diarrhea andmeasles. (2, 80) Preformed vitamin A is present only in foods of animal origin such as liver, fishliver oil, butter, whole milk and egg yolks. Carotenoid precursors of vitamin A, such as -carotene, a- carotene, and cryptoxanthin, are present in carrots and in dark-green, leafyvegetables such as spinach.
Prominent clinical signs of vitamin A deficiency (VAD) are ocular and range from nightblindness to various signs of xerophthalmia from conjunctival xerosis to corneal ulceration toblindness.(5 43 82) Other less specific sub-clinical signs include loss of appetite, hyperkeratosis,increased susceptibility to infections, delayed recovery, and metaplasia and keratinization ofepithelial cells of the respiratory tract and other organs. Vitamin A, if ingested in very highdoses, causes toxic manifestations, such as headache, vomiting, alopecia, liver damage,spontaneous abortion and birth defects including malformations of the cranium, face, heart, andcentral nervous system.
VAD is commonly assessed by ocular clinical signs.(222) Dietary surveys and food balancesheet data can also be used for assessing vitamin A supply in the diet. Serum retinol levels arethe commonly measured indicators of vitamin A status, using a cut-off of 0.7 gmol/l.(88 ) WHOhas set a prevalence >10 % as defining a public health problem.
9. Vitamin D
Vitamin D, a fat-soluble vitamin, is a generic term of all steroids including vitamin D3(cholecalciferol) and vitamin D2 (ergocalciferol), which is essential for adequate intestinalabsorption of calcium and phosphorus and for regulating bone mineralization.(8 3 ) Dietary sourcesof vitamin D are animal foods such as liver, butter, fatty fish, and egg yolks.
Vitamin D3 is also synthesized in the skin, if exposed to a sufficient amount of sunlight orartificial ultraviolet radiation through photochemical transformation of the precursor, 7-dehydrocholesterol.(88 ) The amount of vitamin D synthesized is dependent on the area of skinexposed, age, the wavelength of the ultraviolet light, the intensity of the light which is affected bytime, season, and latitude. Dark skin with high melanin content requires a much longer exposureto achieve the same degree of synthesis than lighter skin.
Vitamin D deficiency is characterized by inadequate mineralization of the bone.(43, 82) In
children, vitamin D deficiency results in rickets, which is deformation of the skeleton includingabnormal softness of the skull, enlargement of epiphyses of the long bones and costochondraljunction that causes bow legs and knock knees. In the adult, vitamin D deficiency leads toosteomalacia, undermineralization of the bone matrix and in the extreme, bone fractures. Clinicalsigns of vitamin D deficiency have been associated with serum 25-hydroxyvitamin D (25-OHD)concentrations below 3.0 ng/ml.i88
10. Zinc
Zinc is a constituent of more than 200 metallo-enzymes involved in carbohydrate, lipid andprotein metabolism and nucleic acid synthesis and degradation.(83 ) Zinc is essential for cellreplication, tissue repair and growth, stabilization of membranes, hormone production andsecretion. Dietary sources of zinc are meat, liver, eggs, seafood especially oysters, milk and dairy
52

products, cereals and legumes. The bioavailablity of zinc in plant products is lower than that inanimal products, as phytate and dietary fiber reduce the zinc absorption.
The signs of zinc deficiency include loss of appetite, growth retardation, skin changes suchas hyperkeratinization, immunological abnormalities, and delayed secondary sexualmaturation.(16 7' 171) Zinc deficiency may be partially responsible for reduced cell-mediatedimmune function and impaired neurocognitive development in young children.(95 ) Some studiesindicated that zinc deficiency during pregnancy lead to birth defects and low birth weight,whereas other studies failed to show the correlation.!"85 ) Recent studies reported that zincsupplementation enhanced immunity of children against infectious diseases.(23' 44)
Low zinc concentrations in hair samples collected during childhood reflect a chronicsuboptimal zinc status, in case severe protein-energy malnutrition or severe zinc deficiency isabsent. Clinical signs of marginal zinc deficiency in childhood such as impaired growth and poorappetite are usually associated with hair zinc concentrations of less than 70 l.tg/g.
11. Other Micronutrients
Micronutrients Deficiency Disorders
Micronutrients Deficiency Disorders
Iron Anemia, spoon nail
Iodine Cretinism, goiter
Zinc Growth retardation, hypogonadism
Vitamin A Night blindness, xerophtalmia
Vitamin D Rickets, osteomalacia
Vitamin E Hemolysis, neurologic damage
Vitamin K Hemorrhage from deficient prothrombin
Vitamin B1 Beriberi, Wemicke-Korsakoff syndrome
Vitamin B2 Cheliosis, angular stomatitis, comeal vascularization
Niacin Pellagra
Vitamin B6 Convulsions in infancy, anemia, neuropathy, seborrhea-like skin lesions
Folic acid Pancytopenia, megaloblastic anemia
Vitamin B12 Pernicious anemia
Vitamin C Scurvy(Source 5, 43, 83, 88)
In addition to the previously described micronutrients, such as iron, iodine, vitamin A,vitamin D, zinc, folic acid and vitamin B12, there are essential other vitamins, minerals and traceelements: e.g., vitamin B, (thiamin), vitamin B2 (riboflabin), niacin, vitamin B6 (pyridoxine),vitamin C (L-ascorbic acid), vitamin E, vitamin K, calcium, magnesium, copper and selenium.Specific deficiency disorders of these micronutrients are reported, as shown in the above table,however, negative consequences at subclinical level are likely to affect more people.
53

The levels of disorders vary widely from subclinical levels to small numbers of clinicalcases in a limited endemic area to significant numbers of clinical cases in an area wide enough tobe recognized as a public health problem. For example, pellagra, the niacin deficiency disorder,was a public health problem in a part of Africa where the diet is mainly composed of maize,whereas it was reported only in a limited area of Egypt.(88' 184)
12. Hereditary Disorders Resembling Nutrition Disorders
Various hereditary diseases also cause disorders similar to nutrients deficiency: e.g.hemolytic anemia and congenital hypothyroidism. Hemolytic anemia is caused by hemoglobinand red cell metabolism disorders, such as thalassemias, sickle cell diseases, and glucose-6-phosphate dehydrogenase (G6PD) deficiency. "3) Hereditary diseases such as G6PD deficiencyand 3-thalassemia are endemic in the MENA countries, as shown in the Table below. (21
140)
Neonatal screening for congenital hypothyroidism shows the incidences of 0.33 per 1000births in Egypt, 0.71 per 1000 births in Iran, 0.37 per 1000 birth in Saudi Arabia, 0.45 per 1000birth in Oman, and 0.40 per 1000 births in WBG.(21' 59
218) These incidences are higher than theincidences in Europe, which are between 0.2 and 0.28 per 1000 births. While the most commoncause of congenital hypothyroidism in Europe is non-genetic hypoplastic or ectopic thyroid,significant numbers of cases in MENA countries are caused by genetic dyshormonogenesis.
Consanguinity is an important factor in autosomal recessive diseases, since relatedindividuals are much more likely to share the same mutant allele. Only homozygotes havesymptoms of thalassemia major and sickle cell anemia. (43) Prevalence of consanguineousmarriage in MENA countries is estimated at 20-50 percent.(21) G6PD deficiency, although it isinherited as X-linked recessive, females may account for up to 10 percent in the region. Geneticcounseling should be provided to the high risk family members to prevent common hereditarydiseases, while paying attention to the cultural sensitivity of the issue.
54
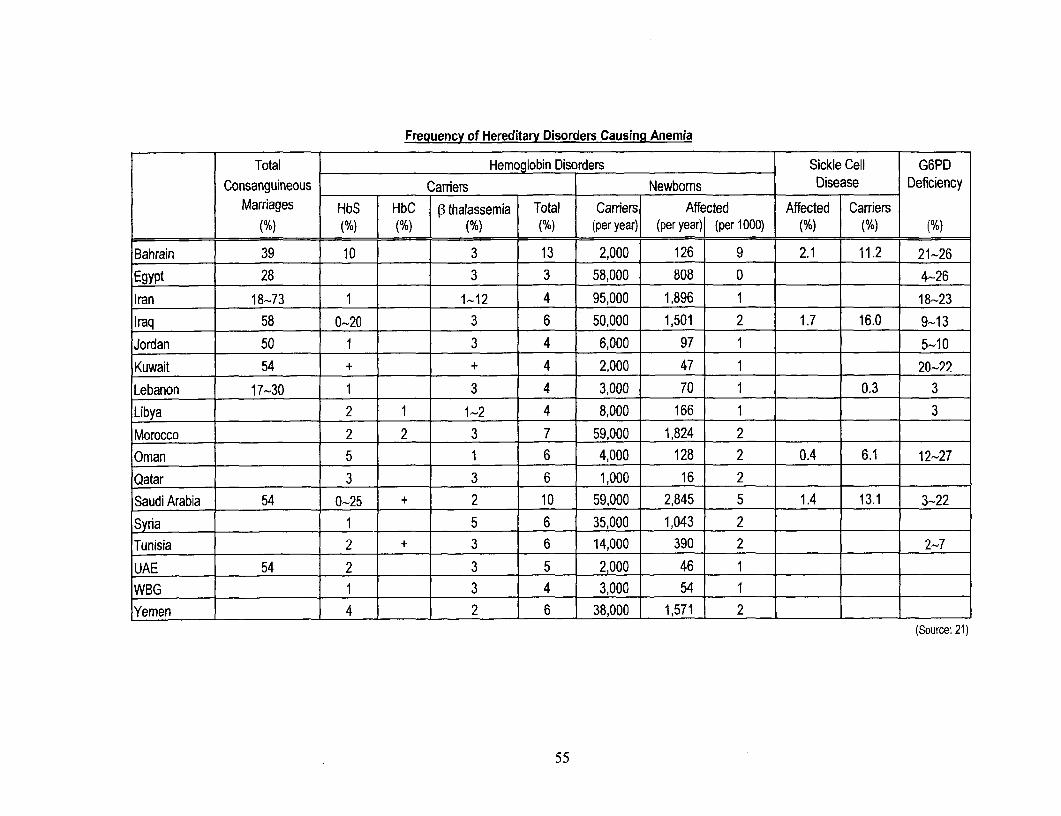
Frequency of Hereditary Disorders Causing Anemia
Total Hemoglobin Disorders Sickle Cell G6PD
Consanguineous Carriers Newboms Disease Deficiency
Marriages HbS T HbC 1 ,3thalassemia Total Carriers| Affected Affected [ Carriers
(%) (%) (%) (%) (%) (per year) (per year) (per 1000) (%) (%) (%)
Bahrain 39 10 3 13 2,000 126 9 2.1 11.2 21-26
Egypt 28 3 3 58,000 808 0 4-26
Iran 18-73 1 1-12 4 95,000 1,896 1 18-23
Iraq 58 0-20 3 6 50,000 1,501 2 1.7 16.0 9-13
Jordan 50 1 3 4 6,000 97 1 5-10
Kuwait 54 + + 4 2,000 47 1 20-22
Lebanon 17-30 1 3 4 3,000 70 1 0.3 3
Libya 2 1 1-2 4 8,000 166 1 3
Morocco 2 2 3 7 59,000 1,824 2
Oman 5 1 6 4,000 128 2 0.4 6.1 12-27
Qatar 3 3 6 1,000 16 2
Saudi Arabia 54 0-25 + 2 10 59,000 2,845 5 1.4 13.1 3-22
Syria 1 5 6 35,000 1,043 2
Tunisia 2 + 3 6 14,000 390 2 2-7
UAE 54 2 3 5 2,000 46 1
WBG 1 3 4 3,000 54 1 .
Yemen 4 2 6 38,000 1,571 2 1
(Source: 21)
55

Annex 2. Possible Nutrition Interventions and Costs
1. Food Energy Security
Emergency assistance
In case of a large-scale famine, drought and other natural disasters, wars and conflicts, anemergency relief operation including food distribution is required. However, in many cases, thegovernment of an affected country can not make necessary interventions, or an effectivegovernment does not exist in the country. Thus, international assistance plays the major role tosecure foods for affected people. United Nations (UN) agencies such as World Food Programme(WFP), United Nations Children's Fund (UNICEF), and United Nations High Commissioner forRefugees (UNHCR), as well as bilateral donor agencies and non-governmental organizations(NGOs), provide emergency relief including food distribution. For example, the below tableshows WFP's emergency relief operations in MENA region in 1995. Emergency assistance cannot be a fundamental solution for securing food, therefore, sustainable developmental assistancemust be followed the emergency phase assistance.
World Food Proaram Relief Operations (Emergency and Protracted) Approved in 1995 in MENA RegionCountry Operation Beneficiaries Total Food Total WFP Cost
(tons) (US$)WBG Rehabilitation of post-conflict victims in the 35,750 1,835 901,591
Gaza Strp and JerichoIraq Food assistance for destitute and vulnerable 2,151,000 184,232 86,178,874
personsAlgeria Food assistance to Western Saharan 80,000 10,220 4,733,947
refugees(Source: 219)
Direct transfer
Public assistance is a tool to secure food and nutrition, particularly dietary energy, for thevulnerable population in the country. Food stamps or ration books are distributed to the eligiblefamilies and individuals to obtain foods or purchase at subsidized prices. It is an effectivemethod in the higher income countries where the eligible population is rather limited and legaland administrative structures are established. However, it is often difficult to define and monitorthe eligibility. Managing the program is rather complicated and it is often difficult for thegovernments of developing countries to run the programs efficiently and effectively. In addition,it is not uncommon that the poor sell the subsidized food to buy other goods.
Food supplement
Supplement foods, as well as micronutrient supplements, can be distributed to the targetpopulation, such as pregnant and lactating women, small children, and school age children indeveloping countries. Supplement foods such as vegetable oil or soybean milk are distributed tothe pregnant women who visit clinics that encourage them to receive antenatal check-ups. Itwould be a better option to give lactating mothers food supplements than to give infants breastmilk substitutes. School feeding schemes also encourage the parents to send their children toschools: e.g., a WFP program in Yemen provides girls attending schools with supplement foods.However, the nutrition impacts of school feeding schemes are rather limited, as the schemescover only a part of nutrition needs of the children.
56

Food subsidy
Food subsidy schemes aim to control the prices of staple foods to secure the availability offoods and alleviate protein energy malnutrition. Some countries universally subsidize foods suchas wheat, bread, sugar, vegetable oil, and milk; other countries use self-targeted mechanisms bysubsidizing only food items that are mainly consumed by the poor. Although food subsidyschemes are usually successful for securing dietary energy, these schemes are often untargeted,benefiting the better off population rather than the poor, become a heavy burden of the statebudget, and discourage efficient and increased agricultural production by keeping prices low.Although most MENA countries have food subsidy schemes, many of them started to review theschemes so that it would target the needy population and be financially sustainable in theframework of structural reform. However, food subsidy issues are often too politically sensitivefor radical reform.'
2. Micronutritents
Fortification
Generally consumed foodstuff can be fortified or enriched with various micronutrients.For example, salt can be fortified with iodine and iron; cereals with iron, vitamin A and B,; milkwith vitamin A and D; and sugar, margarine and edible oil with vitamin A.(5 83. 124, 232,235 244)
Fortification programs are well established in industrialized countries, e.g., Switzerland and theUnited States of America (US) introduced salt iodization programs in the 1920s; and fortifiedmilk is a major dietary source of vitamin D in the US. The unit cost of micronutrient fortificationprograms is usually much less than that of supplementation programs. For instance, estimatedannual per capita cost of salt iodization is US$ 0. 1, while that of iodine supplementation is US$0.5; estimated annual per capita cost of iron fortification is US$ 0.2, while that of iron supplementto pregnant women is US$ .(108, 244) Fortification is a sustainable and fundamental solution, if thefortification programs are truly institutionalized as seen in industrialized countries.
Salt iodization programs are ongoing in several MENA countries, such as Iran, Syria, andYemen. Iran has established 22 salt iodization plants and 76 percent households in rural areasand 87 percent households in urban areas consumed iodized salt by 1995. In Syria, the single saltproducer, Ministry of Industry, has been iodizing salt since 1992, however, it is estimated thatonly 36 percent of households are consuming iodized salt.(221) In Yemen, a universal saltiodization program started in 1995, and about 70 percent of salt consumed in urban areas isiodized by the end of 1998 .(field nterview) Several MENA countries are now planning to start ironfortification of wheat flour.
However, fortification programs cannot succeed unless several important conditions aremet: sufficient technical and institutional capacity to implement and monitor the programs;quality monitoring systems for monitoring concentrations and quality of fortified nutrients;intersectoral coordination among health, industry and transportation for production anddistribution; existence of only limited number of producers for ensuring the coverage of fortifieditems; restriction of leakage of unfortified items; appropriate price setting and incentive systemsfor retailers and consumers; consumer preference that accept fortified food.('6 , 124, 178, 232) Inaddition, reliance on a single fortification approach to control micronutrient deficiencies is often afragile strategy.(5) Therefore, fortifying a variety of different products rather than a single widelyconsumed food may be a better strategy in future.
Food subsidy issues are analyzed in the regional study on consumer food subsidies.(258 )
57
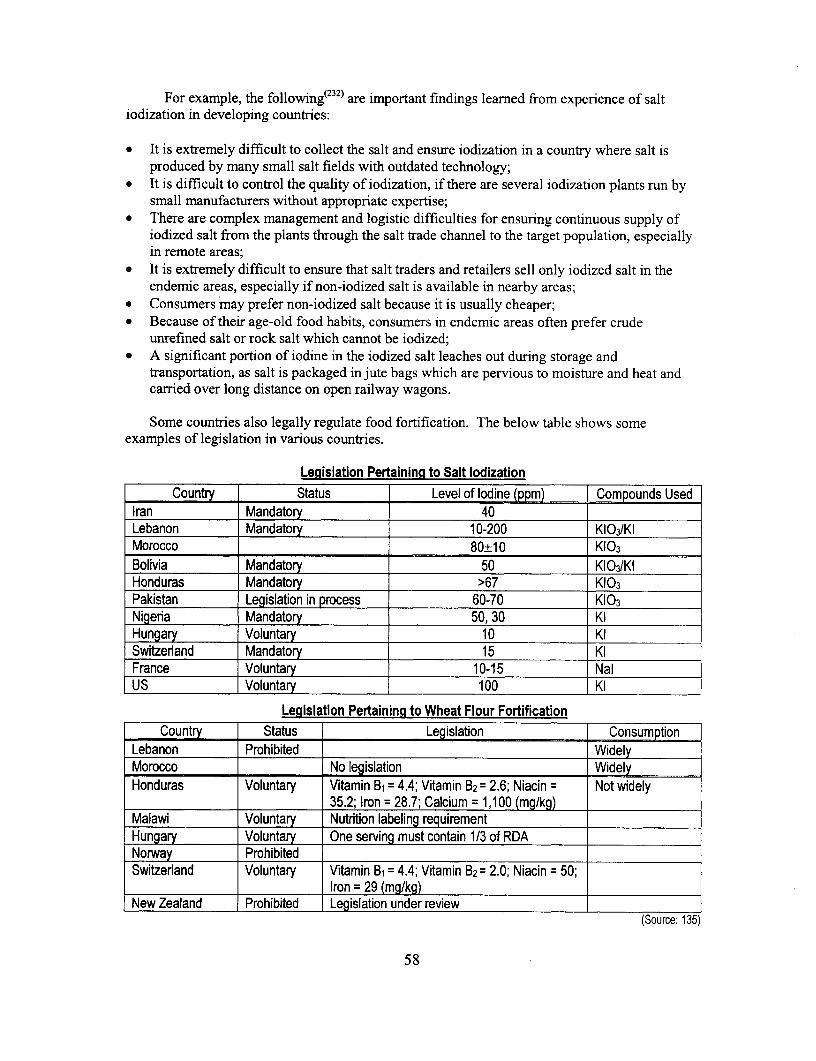
For example, the following(232 ) are important findings leamned from experience of saltiodization in developing countries:
* It is extremely difficult to collect the salt and ensure iodization in a country where salt isproduced by many small salt fields with outdated technology;
* It is difficult to control the quality of iodization, if there are several iodization plants run bysmall manufacturers without appropriate expertise;
* There are complex management and logistic difficulties for ensuring continuous supply ofiodized salt from the plants through the salt trade channel to the target population, especiallyin remote areas;
* It is extremely difficult to ensure that salt traders and retailers sell only iodized salt in theendemic areas, especially if non-iodized salt is available in nearby areas;
* Consumers may prefer non-iodized salt because it is usually cheaper;* Because of their age-old food habits, consumers in endemic areas often prefer crude
unrefined salt or rock salt which cannot be iodized;* A significant portion of iodine in the iodized salt leaches out during storage and
transportation, as salt is packaged in jute bags which are pervious to moisture and heat andcarried over long distance on open railway wagons.
Some countries also legally regulate food fortification. The below table shows someexamples of legislation in various countries.
Legislation Pertaining to Salt lodizationCountry Status Level of Iodine (ppm) Compounds Used
Iran Mandatory 40Lebanon Mandatory 10-200 KI 3IKIMorocco 80±10 K103Bolivia Mandatory 50 KI 3IKIHonduras Mandatory >67 K103Pakistan Legislation in process 60-70 K103Nigeria Mandatory 50, 30 KIHungary Voluntary 10 KISwitzerland Mandatory 15 KIFrance Voluntary 10-15 NalUS Voluntary 100 KI
Legislation Pertaining to Wheat Flour FortificationCountry Status Legislation Consumption
Lebanon Prohibited WidelyMorocco No legislation WidelyHonduras Voluntary Vitamin B1 = 4.4; Vitamin B2= 2.6; Niacin = Not widely
35.2; Iron = 28.7; Calcium = 1,100 (mg/kg)Malawi Voluntary Nutrition labeling requirementHungary Voluntary One serving must contain 1/3 of RDANorway ProhibitedSwitzerland Voluntary Vitamin B, = 4.4; Vitamin B2 = 2.0; Niacin = 50;
Iron = 29 (mg/kg)New Zealand Prohibited Legislation under review
(Source: 135)
58

Supplementation.
Micronutrients can be supplemented directly to the target population, such as pregnant andlactating women and small children. Supplementation programs are usually integrated with otherpublic health interventions, such as maternal and child health care or school health programs.
Pregnant women in many developing countries receive iron and folic acid supplementsduring their antenatal visits. To avoid irreversible disorders of fetus and infants, pregnant womenin the IDD endemic areas should receive oral or intramuscular administration of iodized oil as aninterim measure before salt is fully iodized.(5 188 232) Vitamin A supplementation to children isintegrated with regular health care visits and immunization programs including the NationalImmunization Day.(5 ) It is recommended that lactating women in high VAD areas receive a highdose vitamin A supplement within eight weeks of delivery. Pregnant women should receive alow dose supplement but should avoid the high dose supplement, which may cause toxicdisorders to the fetus. School health programs include iron, iodine, and vitamin Asupplementation to school age children.
Supplementation programs are more targeted to the population in need than to universalfortification, although it is unlikely that all the affected population is covered. The unit costs ofsupplementation programs are usually much higher than that of fortification programs, however,the initial costs of supplementation programs are lower, as they simply utilize the existing publichealth service channels. Supplementation programs integrated to the public health services areefficient and sustainable, however, compliance varies and is hardly monitored, unlesssupplements are injected or orally administered at the presence of health professionals: e.g.,women may not take iron supplement because of the discomfort of side effects andmisconceptions."35' 10) When micronutrient deficiency problems are serious and urgent, specificinterventions such as vitamin A supplementation or intramuscular iodine oil injection campaignsshould be considered.
If people are aware of their needs for micronutrient supplements, as is often the case inindustrialized countries, they are willing to buy supplement tablets. Social marketing ofmicronutrient supplements in combination with nutrition education programs could be tried indeveloping countries.
3. Public Health
An important factor of child malnutrition is repeated childhood diseases such as diarrheaand respiratory infection. These diseases decrease intake and absorption of nutrients and increaseconsumption of dietary energy and other nutrients such as vitamin A.(5' go) Parasite infectionincluding hookworm and malaria causes anemia.
Therefore, public health interventions to prevent and treat childhood diseases, includingimmunization programs, control of diarrhetic diseases, malaria control programs, and dewormingprograms, are expected to improve nutrition status. Water and environment sanitation programsare expected to improve nutrition status, since improving access to clean water and managementof sewage and solid waste reduces risks of communicable diseases, such as diarrhea. Familyplanning programs decrease fertility and increase the intervals between pregnancies, therefore,contribute to reduce undernutrition and anemia among women and children.
Public health interventions used to be specific national programs, such as nationalpopulation projects or national diarrhea control programs. Recently, these interventions are
59
taking more integrated approach. For example, Integrated Management of Childhood Illness(IMCI)('82 ) includes case management of diarrhea, respiratory infection, malaria, and nutritionmonitoring; and school health programs include growth monitoring, deworming, andmicronutrient supplementation.
4. Information, Education and Communication (IEC)
Delivering proper nutrition messages and educating the general public, particularly childcare providers, is one of the most important nutrition interventions. Many nutrition disorders arecaused by incorrect child caring practices, food habits, misallocation of food within a family, andlifestyle choices, but not by absolute shortage of nutritious food. People, especially mothers,need to be educated regarding breastfeeding and weaning practices, food items rich inmicronutrients, combination and preparation of food to maximize absorption of nutrients, obesityas a risk factor of more serious diseases and healthy diet to avoid obesity.
IEC programs should be designed to change actual behaviors of people, and the impacts ofIEC programs should be carefully monitored and evaluated. Nutrition education can be providedinterpersonally at schools, clinics, and communities. A mass media campaign is another strongmeasure to approach wider audience. Many developing countries may require internationaltechnical assistance, as skilled IEC professionals are in shortage and institutional capacity todevelop and continue the programs is weak. In addition, an incentive system needs to bedesigned to motivate health professionals to promote IEC programs.
5. Social and Economic Development
Since undernutrition is strongly related to the levels of poverty, poverty reduction throughsocial and economic development is one of the essential factors to improve nutritional status. Inthe longer term, countries need to secure food supply through developing the agricultural sector,trade and transportation systems, and sound public financing policies. Trade and tariff policies,as well as food subsidy schemes, largely affect agricultural production and food pricing. Fooddistribution systems need to be improved for more equitable allocation of available food within acountry. Since there are significant urban rural gaps in many developing countries,comprehensive rural sector development is required to improve nutrition in rural areas.
6. Examples of Program Costs and Impacts in Other Countries
The following are examples of nutrition intervention programs, their costs and impacts:
* Food supplementation targeted to children and mothers in Latin American countries* Micronutrients fortification in various countries* Iron supplementation to female factory workers in Indonesia* Comprehensive nutrition and health interventions targeted to children in India
Food supplementation
Food supplementation programs targeted to children, pregnant and lactating women arewidely implemented in many countries in various scales. The ration and distribution methodsvary among programs and countries: the annual costs per beneficiary range from around US$4 to
60

over US$60 in the below examples of Latin American countries. Most programs aim to providearound 300-350 kcal per child.
Food Supplementation to Children and Mothers in Latin AmericaBeneficiaries Food rations Costs (1990, US$)
Bolivia 78,000 infants and preschool 250 ml of Chicolac (wheat flour, $1,506.920 (1989)urban children (8 months to 5 years) powdered milk and vegetable $19.32 beneficiaryareas selected by family income, oil); a piece of corn bread. Beneficiaries fee: $0.36
location and nutritional status per child/month(weighed once a year).
Bolivia 75,000 infants and preschool Skim milk, butter oil and wheat $790,523. (1989)rural areas children (8 months to 5 years) flour (donated). Meals are $10.54 / beneficiary
Meals are distributed in a prepared for 260 days a year Beneficiaries contributechurch or households. providing 350 kcal and 16 g to cover transportation,
protein per child. energy costs, and thepacking of food.
Brazil About 2 million children under 2 kg /month (4 kg for adult) of $123 million3 years of age, and pregnant formulated foods and powdered $62.81 I beneficiary.and lactating women, in low- milk. Significantincome households. improvement observed.6 million children under 3 Normally 1 kg each of powdered $104 million (1989)years, and pregnant and milk, sugar, rice, beans, $16.78 beneficiary.lactating women, in low- cornmeal and manioc flour per Results not significant.income households month.
Ecuador 14,888 children under 5 years, 2-3 kg of leche-avana for $4,122,540(1989)23,107 malnourished children, children (237-354 kcal and 13.7- ($3,199,211 donatedand 28,050 pregnant and 20.5 g protein) foods; $27,200lactating women, for a total of 1 kg of leche-avana and 5 kg of transportation; $10,60066,045 in the first trimester of rice for women (1,936 kcal and storage;1990. 50.8 g protein) per month. $885,529 personnel)
$62.42 / beneficiary.Guatemala 197,148 children under 7 1.38 kg each of com and $791,944
years and pregnant and soybean, wheat, and rice, and $4.01 / beneficiarylactating women from low- 0.46 kg of oil are distributed at Similar program whichincome groups. health posts. (639 kcal and 16g provides 894 kcal andNutrition education, protein/day) 26.2 g protein per dayimmunization and other health and costs $27.5 perservices are also provided. beneficiary just for food
costs.Peru 234,451 infants and preschool Monthly ration for an entire $5.077.181
children in day care centers, family is 6 kg bulgur, 3 kg com ($4,494,279 for foodand 84,317 households (about and soybean, 1.5 kg oil and 2 kg $136,000 transportation421,600 persons) at high dry peas (1,756 kcal and 56.4 g $446,902 personnel)risks. Program also provides protein/day, ration for children $7.74/beneficiarynutrition education and growth provides 359 kcal, 9.3 gmonitoring protein/day).
(Source: 152)
61

Micronutrientsfort fication
The popular vehicles for micronutrient fortification are salt, sugar, and cereals. The annualcosts for the fortification per person range from around US$ 0.01 to 0.3, at the highest around$1.00: e.g., the iron fortification of biscuits in Chile.
Costs of Micronutrient Fortification ProgramsCountry Food Vehicle Fortificant Cost (US$/person/ear) Year
Several Salt Iodine (50 - 80 ppm) 0.02 - 0.06 1992India Salt Iodine (50 ppm) + Iron (1,000 ppm) 0.12- 0.18 1991Guatemala Sugar Vitamin A (15,000 llU/kg) 0.29 1994Guatemala Sugar Iron (1.3 %) 0.1 1981Egypt Wheat flour Iron (25 - 35 ppm) 0.015 1980Venezuela Corn flour/ Iron (20 - 50 mg/kg) 0.07 - 0.08 1994
Wheat flour Vitamin A (39,000 lU/kg)(Source: 121, 237, 244)
Estimated costs for the production of iodized salt in developing countries are as below.The average annual cost is US$0.037 per person, which adds 1.2 percent to the retail price of salt.
Estimated Production Costs of Iodized Salt in Developing CountriesAverage Average per person
Range (US$/ton) (US$/ton) per year (US$/5 kg)Cost componentslodine (40-100 ppm) 0.50 - 1.30 0.90 0.0045Processing 2.35 -5.50 4.00 0.0200Extra packing materal (if required) 0 -4.00Administrative overhead 0.60 - 1.50 1.00 0.0050Amortization 0.50 -2.50 1.50 0.0075
Total iodization cost 3.95 -14.80 7.40 0.0370Retail price of salt 250 -1,000 625.00 3.12lodization cost as % of retail price 1.0 - 1.5 % 1.2 % 1.2 %
(Source: 121)
The table below shows estimates of costs and benefits of iron fortification in Lebanon.The calculation assumes that; annual salary is $5000; a person works for 30 years; anemiareduces productivity by 20 percent; and 50 percent of anemia prevalence. Fortified bread couldsupply iron about 60 percent of RDA. The estimation shows a very high benefit-cost ratio of7,500 to 1, regarding the lifetime income.
Costs and benefits of iron fortification; Estimation for Lebanon (US$)Capital costs Feeder and installation ($6,000 x 11 mills x 2 sets) 132,000
Inspection 90,000Annual operation costs Fortificant costs (300,000 ton bread) 90,000Total fortification costs (300,000 ton bread) 312,000Annual fortification cost Per person (110 kg bread!person!year) 0.03Fortification cost per person per lifetime 2Anemia cost per person per lifetime 15,000Benefit - cost ratio 7,500: 1
(Source: 237)
62

Micronutrients supplementation
The Indonesian government launched iron supplementation programs in domesticcompanies in 1996 to reduce the level of anemia from 30 percent to 20 percent by 1998. Ironsupplements (one tablet daily for 90 days or one tablet weekly for 16 weeks) were distributed tofemale factory workers, mainly in reproductive ages, in pay packets, in cafeterias, or in companyclinics. In one of the companies, 35 percent of anemia cases were prevented at the cost of onlyUS$3.47 per worker, or less than US$10 per anemia case prevented.
Costs and Benefits of Iron Supplementation Programs in Sample Companies in IndonesiaProvince East Kalimantan Central Jawa JambiCompany Sumalindo Djarum Kudus Nasari PriimaNumber of workers receiving supplements 637 1,260 100Compliance 92 % 83 % 95 %Cost breakdown (US$)Promotion
Meetings, transportation 50.15 31.34 220.23Personnel 22.57 112.83 78.56
Monitorng and IECPamphlets 242.37 0.00 123.28Personnel and visits 268.28 133.72 251.15
ReportingMeetings, report supplies 109.90 1037.61 36.77Personnel 24.66 112.41 78.14
Administration support 4.60 9.19 3.76Blood Tests 675.30 1,752.19 321.35Iron supplement distnbution
Iron tablets 239.45 572.09 206.85Opportunity costs for workers 199.75 3,349.77 235.27Personnel 22.98 262.43 156.71
Total costs by company (US$) 1,856.66 7,376.09 1,711.66Running costs of province (US$) 356.46 1,200.59 179.69Total costs (US$) 2,213.12 8,576.68 1,891.35Costs per worker (US$) 3.47 6.81 1,8.91No of cases of anemia prevented 223 (35 %) 498 (39 %) 19 (19 %)Cost for case of anemia prevented (US$) 9.90 17.22 99.54Note: US$1.00 = Indonesia RP 2393.0 (January 1997) (Source: 211, 213)
The iron supplementation also improves productivity by raising workers' capacity. It wasreported that anemic women produce an average 5.3 percent less in factory work and perform 6.5hours less housework per week.('73) Another example of iron supplementation program for therubber plantation workers in Indonesia in 1974 showed a dramatic increase in productivity. Afterprovision of iron pills for 60 days (at a cost of $0.13/worker/day), productivity increased byapproximately 15 percent for tappers and 25 percent for weeders. The benefit-cost ratio in termsof latex production could be as high as 260: 1 .(34)
Comprehensive child nutrition intervention
The Second Tamil Nadu Nutrition Project funded by the World Bank aimed to reducesevere malnutrition among preschool children and infant mortality in the state of Tamil Nadu,
63

India. The project targeted more than 5 million children under 72 months of age and 2 millionpregnant and lactating women in disadvantaged population groups.
Estimated Costs of the Second Tamil Nadu Nutrition Project (1991.1998)
Cost (US$ million) Project ComponentA. Service delivery Nutrition and health education; referral services;
1. Nutrition 91.09 therapeutic food supplementation; equipment and drugs2. Health 30.12 for matemal and child health; training for health/nutrition3. Training 6.61 workers.
B. Communications 3.53 Demand stimulation; child feeding and care practices;community involvement.
C. Project management Project coordination office; monitoring and evaluation1. Project coordination office 4.99 systems, a new institution for nutrition communication and2. Communication/Training 1.07 training activities.
center3. Monitoring and evaluation 1.38
Total base cost 138.71Contingencies 0.38Total project cost 139.09
(Source: 241)
7. Nutrition Components in the Current World Bank Projects and Nutrition SectorWorks in MENA Region
Current Lending Proiects
Country FY Project Nutrition ComponentsYemen 1999 Child Development Nutrition management including micronutrient
supplementation and growth monitoring forunder five children through community-basedactivities
Egypt 1998 Health Sector Vitamin A and iron supplementation, growthmonitoring for under five children
Morocco 1996 Social Priority l: Basic Health Matemal and child health componentsincluding breast feeding and ironsupplementation
WBG 1995 Education and Health Rehabilitation School health and nutrition education program
Non-Lending Sector Works
Country FY TitleRegional 1998 Nutrition Issues in the Middle East and North Africa RegionRegional 1998 Consumer Food SubsidyTunisia 1996 From Universal Food Subsidies to a Self-Targeted Program: A Case Study in
Tunisian Reform (prepared by the Agricultural Operations Division, CountryDe artment IMENA).
Morocco 1992 Kingdom of Morocco: Nutrition and National Development Issues and Options
64
MENA Working Paper Series
No. 1. Has Labor Migration Promoted Economic Integration in the Middle East?June 1992. Nemat Shafik, The World Bank and Georgetown University.
No. 2. The Welfare Effects of Oil Booms in a Prototypical Small Gulf State. September, 1992.Ahmed Al-Mutawa, United Arab Emirates University and John T. Cuddington,Georgetown University.
No. 3. Economic and Social Development in the Middle East and North Africa.October, 1992. Ishac Diwan and Lyn Squire, The World Bank.
No. 4. The Link Between Trade Liberalization and Multi-Factor Productivity: The Caseof Morocco. February, 1993. Mona Haddad, The World Bank.
No. 5. Labor Markets in the Middle East and North Africa. February, 1993. ChristopherA. Pissarides, The London School of Economics and Political Science.
No. 6. International Competitiveness of the Private Industry and the Constraints to itsDevelopment: The Case of Morocco. June, 1993. Hamid Alavi, The World Bank.
No. 7. An Extended RMSM-X Model for Egypt: Quantifications of Market-OrientedReforms. September, 1993. Karsten Nimb Pedersen, The World Bank.
No. 8. A Report on the Egyptian Tax System. October, 1993. Mark Gersovitz, Roger H.Gordon and Joel Slemrod, The World Bank.
No. 9. Economic Development and Cooperation in the Middle East and North Africa.November, 1993. IshacDiwan and Lyn Squire, The World Bank.
No. 10. External Finance in the Middle East: Trends and Prospects. December, 1993.Ishac Diwan, John Underwood and Lyn Squire, The World Bank.
No. 11. Tax Incidence on Agriculture in Morocco (1985-1989). April, 1994. Jean-PaulAzam, CERDI, University of Auvergne, Clermont-Ferrand (France), et CSAE,Oxford (U.K.).
No. 12. The Demographic Dimensions of Poverty in Jordan. August, 1994. ChantalWorzala, The World Bank.
No. 13. Fertility and Family Planning in Iran. November, 1994. Rodolfo A. Bulatao andGail Richardson, The World Bank.

No. 14. Investment Efficiency, Human Capital & Migration A Productivity Analysis of theJordanian Economy. May, 1995. Gaston Gelos, Yale University, Department ofEconomics.
No. 15. Tax Effects on Investment in Morocco. August, 1995. David Sewell, ThomasTsiopoulos and Jack Mintz, The World Bank.
No. 16. Reconstruction in Lebanon: Challenges for Macroeconomic Management. April,1999. Daniela Gressani and John Page, The World Bank.