Embed Size (px)
Citation preview
working paper
Public Attitudes Toward EU Mobility and Non-EU Immigration: A Distinction with Little Difference
Authors:
www.reminder-project.eu
Scott BlinderYvonni Markaki
Published: August 2018

This project has received funding from the European Union's Horizon 2020 research and innovation programme under grant agreement No 727072
Deliverable 10.2: Public Attitudes Toward EU Mobility and Non-EU Immigration: A Distinction with Little Difference
Authors: Scott Blinder & Yvonni Markaki
Submitted: June 2018 Paper prepared as part of the REMINDER project
www.reminder-project.eu
Correspondence address:
Scott Blinder, Centre on Migration, Policy and Society, University of Oxford [email protected]
2
Executive Summary
Why do some Europeans support immigration from within the EU, while rejecting
immigration from elsewhere? This paper identifies and attempts to explain the attitudes of
“EU-only inclusionists”: EU nationals who support high levels of immigration, but only from
within the EU. Our analysis takes advantage of an experimental module in the European Social
Survey to explore the demographic and country profile of EU citizens who tend to distinguish
in their preferred levels of immigration inflows, depending on the origin and skill-level of
immigrants. We find that less than 10% of Europeans in our 18-country sample can be
classified as Europe-only inclusionists. We also find that existing theories of immigration
attitudes and EU support, based on identities, resources, and cognitive mobilization, have
relatively little power to explain this pattern, although EU identity is marginally associated
with support for intra-EU mobility.
3
Introduction
In immigration policy, the European Union requires sharp differentiation between EU and
non-EU nationals. Intra-EU mobility is a foundational right for EU nationals, one of the basic,
non-negotiable “four freedoms.”1 On the other hand, member states can and do develop
policies to limit immigration from non-EU countries. Indeed, EU policy discourses even use a
distinct nomenclature for each type of movement: “mobility” exercised by EU nationals
within EU member states, is distinguished from “migration” of “Third Country Nationals
(TCNs)” arriving from outside the EU (Ruhs 2017a).
However, as debates in Britain and Germany have shown (Geddes and Hadj-Abdou
2016), members of European publics often do not seem to make the same sharp distinction
between the two. The disjuncture between elite rhetoric and policy on one hand and public
understandings of immigration on the other hand may pose a significant challenge to the
ongoing stability of the EU. Anti-immigration public opinion, directed toward intra-EU
movement, was essential to the Brexit movement (Goodwin and Milazzo 2017), and has
created pressure in other EU members states to create new restrictions on free movement
(Ruhs 2017b). In the context of freedom of movement across national boundaries within the
EU, anti-immigrant sentiment can “challenge mainstream views on the ‘European project’”
(Geddes and Hadj-Abdou 2016). It is therefore an urgent matter for policy-makers and
scholars alike to understand whether EU citizens recognize the fundamental institutional
distinction between intra-EU mobility and non-EU migration.
However, very little research examines EU citizens’ attitudes toward immigration on
either side of this fundamental policy dividing line. In what follows, we address this gap in the
1 The foundational four freedoms of the EU refer to the movement of goods, capital, services, and labor.
4
literature. We examine when and why EU citizens distinguish between support for internal
EU migration and immigration from outside the EU. We focus, to the extent possible given
available data, on understanding the group that we label “EU-only inclusionists”: individuals
who support intra-EU movement while opposing immigration from the rest of the world.
Thus, we ask: why do some Europeans favor European or EU immigration, when the majority
are either supportive or opposed to migration in general?
The paper begins with an overview of existing theories and evidence that we draw on
to identify and explain EU inclusionism. We test hypotheses derived from leading theories of
both public opinion toward immigration and EU integration (Mayda 2006; L. M. McLaren
2001; Sides and Citrin 2007). We continue with a description of the data, the modelling
strategy, and finally the empirical results.
Our statistical analysis relies primarily on data collected during round 7 of the European
Social Survey (ESS): a large survey data set consisting of over 30,000 respondents from 18 EU
member states, plus Switzerland and Norway. Most available data—and a portion of our
analysis—distinguishes European from non-European immigration, rather than specifying EU
and non-EU origins. However, we leverage an experimental design embedded in the 2014 ESS
that has been unexploited in the literature to date; this design enables us to identify EU-only
inclusionism and investigate its determinants.
Our findings suggest a striking lack of specific support for the contours of migration
policy that are embedded in EU institutions and treaties. Descriptively, the vast majority of
Europeans show the same level of support for migration from within and outside Europe or
the EU, either supporting strong limits on both types of migration or supporting substantial
migration flows from both sources. Even for those who prefer European or EU migration, little
of this support seems to come from identification with the EU. Substantively, these findings
5
make plain the challenge facing supporters of free movement; theoretically, we call for
further research on the links between Europeanness, other forms of identity, and attitudes
toward immigration.
Identifying and Explaining EU Inclusionism in Immigration
Why do Europeans support or oppose immigration? Prior research provides a well-developed
catalogue of answers to this question (see Hainmueller and Hopkins 2014 for review).
According to many scholars, Europeans’ attitudes toward immigration hinge on levels of
perceived threat (Ceobanu and Escandell 2010). Threats can be either symbolic or resource-
based (L. McLaren and Johnson 2007). On the symbolic side, people who see immigrants as
threatening to the dominant culture are more likely to oppose immigration (Riek, Mania, and
Gaertner 2006). This feeling of threat may be more widespread when immigrants are
different from the existing dominant population group in terms of race or ethnicity, religion,
language, or other prominent cultural markers (Ford 2008; Sniderman and Hagendoorn 2007;
Hopkins 2010). Thus, identities—of both the citizens and the potential immigrants—are
critical variables here; when these identities diverge, support for immigration becomes less
likely.
On the resource-based side, immigration opponents may also perceive threats here,
viewing immigrants as threatening to the national economy (Riek, Mania, and Gaertner
2006). However, resource-based opposition to immigration may also stem from relative
positions in the labor market. Economic logic suggests that citizens will be more likely to
oppose immigrants who are competitors in the labor market, but will be more supportive of
immigrants whose skills are complementary to their own. So low-skilled native workers would
6
be expected to favour high levels of high-skilled immigration while restricting low-skilled
immigration; high-skilled native workers should show the opposite pattern (Scheve and
Slaughter 2001; Mayda 2006; O’Rourke and Sinnott 2006; Malchow-Møller et al. 2008;
Chandler and Tsai 2001). Another strand of resource-based theories focuses on the fiscal
impacts of immigration rather than the labor market. The fiscal burden hypothesis argues
that all citizens are expected to prefer high-skilled inflows due to their greater contributions
in taxes and their lower likelihood of requiring public assistance, compared to low-skilled
(Valentino et al. 2017).
In these theories, whether implicitly or explicitly, preferences for restricting
immigration are not always applied across the board to all types of immigrants. Public opinion
distinguishes between immigrants according to their level of education or job skills
(Hainmueller and Hiscox 2010), their reason for immigrating (Blinder 2015), and their racial,
ethnic, national, or religious identities (Ford 2008; Gorodzeisky and Semyonov 2016;
Hainmueller and Hopkins 2014; Bansak, Hainmueller, and Hangartner 2016). In public
opinion, then, it is often true that some immigrants are more acceptable than others.
But is EU citizenship one of the dimensions of difference that matters in public opinion?
Do Europeans distinguish between EU nationals and other prospective immigrants? Despite
the political importance of this distinction (Ruhs 2017b), the literature on public opinion
toward EU vs. non-EU migration is sparse. In fact, the literature lacks up-to-date answers even
for simple descriptive questions, such as whether or not EU citizens are more supportive of
intra-EU mobility than of non-EU migration. The evidence base, while thin and out-of-date,
suggests that this pattern of preferences will not be very common. McLaren (2001) found that
most Europeans have the same attitudes toward immigrants from within and from outside
the EU, and this was at a time when the EU was less heterogeneous economically, prior to EU
7
enlargement in 2004. Gorodzeisky (2011) finds that Europeans do differentiate between
immigrants from poorer and richer European countries, showing that migrants from within
Europe are not all alike in Europeans’ preferences. So we expect that McLaren’s basic
descriptive findings will remain true; if anything, recent trends have made it less likely that
Europeans who support immigration restrictions will make a positive exception for fellow EU
nationals (Ruhs 2017b).
Explaining European or EU Inclusionism
Nonetheless, as noted above, there are important political as well as theoretical reasons to
attempt to understand the determinants of this pattern of preferences. Thus, our hypotheses
focus on identifying potential determinants of the Europe-only or especially “EU-only
inclusionist” pattern of migration preferences. For those EU nationals who do prefer
European or EU migration, what might explain this pattern of preferences? Is it due to loyalty
to the EU itself, or for other reasons? We identify several potential explanations, outlined
below.
We begin with symbolic or identity-based explanations. First and most
straightforwardly, we hypothesize that identification with the EU will be an important
predictor of a preference for European migrants. Scholars have shown that the EU is a locus
of a supranational political identity for at least some citizens (Kentmen-Cin and Erisen 2017;
Risse 2010). As Fligstein, Polyakova, and Sandholtz (2012) put it, “for a significant share of EU
citizens, a European identity exists alongside a national identity” (see also Bruter 2009).
However, many EU citizens do not develop a strong personal identification with the EU; Kuhn
(2017) finds that real transnational interactions spur individuals to identify with the EU, but
8
that these experiences (such as the opportunity to live or study abroad) are confined to a
relatively small subset of society. Nonetheless, for those who do identify with the EU, this
identity is politically consequential, predicting citizens’ support for further EU integration
(Hooghe and Marks 2005; Brinegar and Jolly 2005). Therefore, we hypothesize that
identification with the EU will be associated with Europe-only or EU-only inclusionism: greater
support for immigration from European/EU countries than from outside.
Identity, of course, plays a broader role in the politics of immigration as well. Other
aspects of citizens’ political and social identities may also affect their tendencies to distinguish
between EU and non-EU migrants. As noted above, opposition to immigration is associated
with negative attitudes toward out-groups of various types—racial, ethnic, religious,
linguistic, and cultural. These “symbolic threats” to identity are often used to predict
individual-level opposition to immigration (Ceobanu and Escandell 2010). We suggest that
these cultural identity preferences might also be predictors of the “EU-only inclusionist”
pattern of preferences. This would be the case if EU citizens perceive potential within-EU
migrants as more similar to themselves than potential non-EU migrants on one or more of
these dimensions of identity.
Following this logic, we hypothesize that Europeans who think it is important that
immigrants share the racial, religious, or linguistic characteristics with the majority of the
native-born population will be more likely to show a pro-European bias in their preferences
for immigration admissions. These reasons for EU inclusionist preferences are quite distinct
from the directly pro-EU reasoning outlined above. In this case, the European-ness of
potential migrants is simply a proxy for characteristics such as whiteness, Christianity, or in
some cases linguistic similarity. So EU citizens may hold EU inclusionist preferences not out

9
of any attachment to the EU or Europe itself, but rather as an indirect expression of in-group
favoritism on racial, religious, or linguistic lines.
In addition to perceived symbolic threats, citizens may oppose immigration from a
sense of realistic or resource-based threat. In this economic logic—which is focused on
workers in the paid labor market—citizens should welcome migrants who complement their
own role in the labor market while opposing immigration of potential labor market
substitutes (Facchini and Mayda 2009). Low-skilled “native” workers are expected to oppose
the immigration of more low-skilled workers but welcome the immigration of high-skilled
workers, while high-skilled native workers should hold the opposite set of views. In this
theory, EU citizenship (as well as other identity considerations) is not expected to be a directly
relevant predictor of immigration policy preferences.
However, EU citizenship may be relevant as a proxy for labor market position. In the
present climate, European migrants—from within the EU, in particular—may be viewed as
more likely to fill low-skilled jobs in the labor market, relative to other immigrants who are
subject to movement restrictions. This is a by-product of free movement itself. EU member
states limit immigration from outside the EU, including restrictions based on skill and income
(Kahanec and Zimmermann 2011). Thus, immigration flows to EU countries from outside of
Europe may be disproportionately composed of highly educated and skilled workers, or may
be perceived as such. These real or perceived flows may also feature large numbers of
students who are poised to join that highly-skilled group once they complete their degrees.
On the other hand, because of free movement, EU members states cannot (directly) restrict
the arrivals of low-skilled workers from elsewhere within the EU. Fears of large flows of
unskilled workers have long been a part of anti-migration, anti-EU discourse, crystallized in
the widely circulated trope of the “Polish plumber,” expected by some to flood the European
10
labor markets and drive down wages and employment among native workers (Donaghey and
Teague 2006). Thus, whether through direct experience or media reports, Europeans may
view EU migration as a particular source of low-skilled workers.
Viewing the resource-based theory of immigration attitudes in light of this
characteristic of EU migration, we can generate additional hypotheses. Whereas the imagined
Polish plumber will be in competition with low-skilled native-born workers in France or
Germany, this figure will be a complement rather than a substitute for high-skilled native-
born workers (and perhaps an affordable provider of services, to boot). By this logic, then,
the resource-based theory would predict that low-skilled EU workers will be more likely to
oppose intra-EU migration; support for intra-EU migration, on the other hand, should be more
likely among high-skilled workers.
Finally, we consider the “cognitive mobilization” hypothesis, from the existing literature
on support for the EU and its political projects (see Hobolt and de Vries 2016 for review). In
this view, support for the EU—which we would extend to include intra-EU mobility as a
component of free movement and the four freedoms—is in part a result of citizens taking
political cues from political elites. The EU has long been seen as an elite political undertaking;
individuals who are more engaged in politics have traditionally shown more support for the
EU and for EU integration (Gabel 1998). This pattern may be a function of exposure to, and
acceptance of, political elites’ pro-EU messages (McLaren 2001).
Although elites have become more divided with the rise of Euroskeptic parties and
shifts in ideology (Hooghe and Marks 2009), elites remain substantially more supportive of
the EU than the general public, while Euroskepticism springs disproportionately from the
ideological extremes with less attachment to mainstream parties (Elsas, Hakhverdian, and
Brug 2016). Thus, we would expect that elites on balance continue to provide cues
11
encouraging EU support, for those members of the public who are attentive enough to politics
to receive these cues.
In the case of migration, as noted above, EU orthodoxy draws a sharp distinction
between intra-EU “mobility”—a foundational freedom for EU citizens—and non-EU
migration, which member states have the right to limit and control. We would expect that
elites will send signals supporting intra-EU mobility, and that EU citizens who are more
attentive to politics are more likely to have absorbed this nuanced view on how to prioritize
potential migration inflows. Those who are less attentive to politics are more likely to react
to immigration in broader brush strokes. So, in short, the implication of the cognitive
mobilization hypothesis is that individuals who are more interested in and engaged with
politics, or more attached to mainstream political parties, will be more likely to prefer EU to
non-EU immigration.
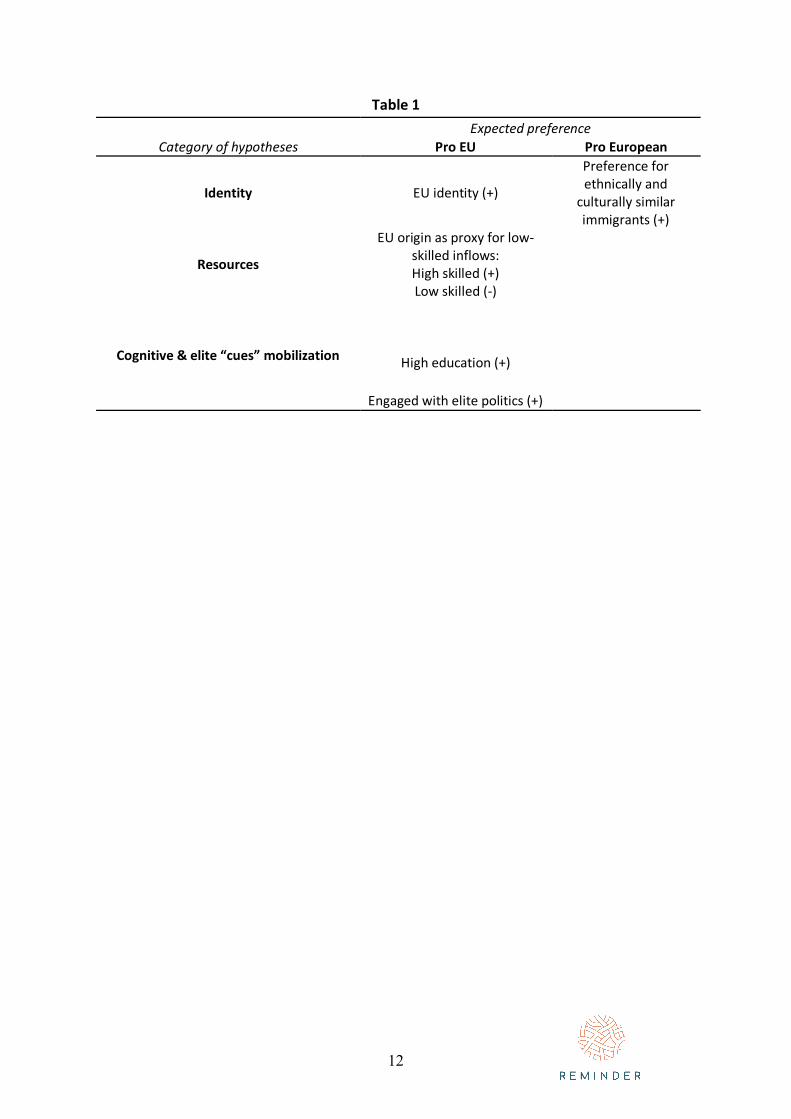
We summarize the key hypotheses of the various relevant theories in Table 1. For each
theoretical perspective, we list the factors associated with increased preference for
immigration either from the EU specifically, or from Europe but not specifically from the EU.
Note that these predictions refer to a relative preference for EU or European migrants. They
are therefore not equivalent to the factors that predict general support for immigration.
Rather, these are hypotheses about EU-only or Europe-only inclusionists: people who are
more supportive of immigration from within Europe than from outside Europe.
12
Table 1 Expected preference
Category of hypotheses Pro EU Pro European
Identity EU identity (+)
Preference for ethnically and
culturally similar immigrants (+)
Resources
EU origin as proxy for low-skilled inflows: High skilled (+) Low skilled (-)
Cognitive & elite “cues” mobilization
High education (+)
Engaged with elite politics (+)
13
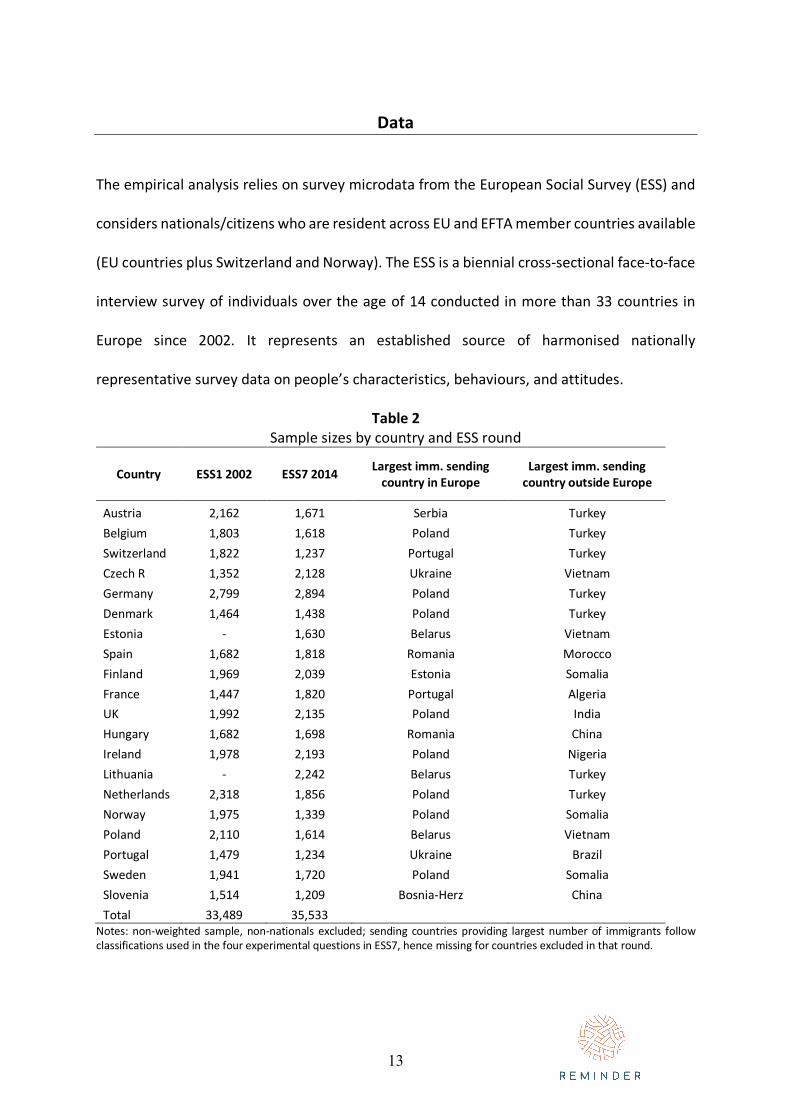
Data
The empirical analysis relies on survey microdata from the European Social Survey (ESS) and
considers nationals/citizens who are resident across EU and EFTA member countries available
(EU countries plus Switzerland and Norway). The ESS is a biennial cross-sectional face-to-face
interview survey of individuals over the age of 14 conducted in more than 33 countries in
Europe since 2002. It represents an established source of harmonised nationally
representative survey data on people’s characteristics, behaviours, and attitudes.
Table 2 Sample sizes by country and ESS round
Country ESS1 2002 ESS7 2014 Largest imm. sending country in Europe
Largest imm. sending country outside Europe
Austria 2,162 1,671 Serbia Turkey Belgium 1,803 1,618 Poland Turkey Switzerland 1,822 1,237 Portugal Turkey Czech R 1,352 2,128 Ukraine Vietnam Germany 2,799 2,894 Poland Turkey Denmark 1,464 1,438 Poland Turkey Estonia - 1,630 Belarus Vietnam Spain 1,682 1,818 Romania Morocco Finland 1,969 2,039 Estonia Somalia France 1,447 1,820 Portugal Algeria UK 1,992 2,135 Poland India Hungary 1,682 1,698 Romania China Ireland 1,978 2,193 Poland Nigeria Lithuania - 2,242 Belarus Turkey Netherlands 2,318 1,856 Poland Turkey Norway 1,975 1,339 Poland Somalia Poland 2,110 1,614 Belarus Vietnam Portugal 1,479 1,234 Ukraine Brazil Sweden 1,941 1,720 Poland Somalia Slovenia 1,514 1,209 Bosnia-Herz China Total 33,489 35,533
Notes: non-weighted sample, non-nationals excluded; sending countries providing largest number of immigrants follow classifications used in the four experimental questions in ESS7, hence missing for countries excluded in that round.
14
Dependent variables We construct two dependent variables by taking advantage of six question items that ask
respondents how many immigrants should be allowed to immigrate (many, some, a few, or
none) with reference to immigrants’ origins from within and outside Europe and skill-level.
The first dependent variable cross-references respondents’ answers to two questions. The
items are otherwise identically worded, but one asks about immigrants from poorer countries
in Europe, whereas the other mentions immigrants from poorer countries outside Europe.
We construct a variable that isolates respondents who prefer different levels of restriction
depending on the origin of immigrants, much like Gorodzeisky’s (2011) use of similar
questions to isolate respondents whose migration preferences differ depending on migrants’
origins from richer versus poorer countries.
Respondents who opted for the same level of restriction in both questions are
classified as either general inclusionists or general restrictionists. Respondents who differed
in their inflow preference are categorised as either Europe inclusionists or non-Europe
inclusionists (for details on coding see Appendix A, Tables 1 & 2). In the 2002 round of the
survey, there is another pair of these questions that references richer countries within and
outside Europe. We repeat our analysis for 2002 using both pairs of these questions
(poorer/richer) as part of robustness tests (see Appendix A for results).
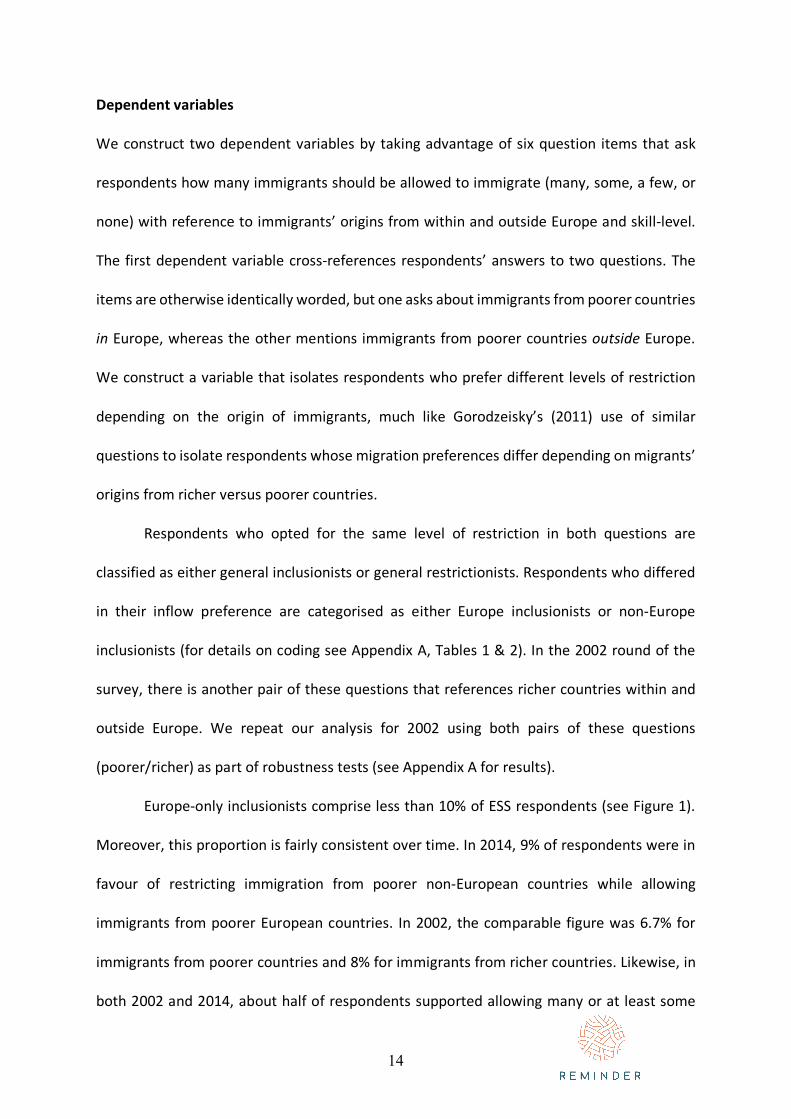
Europe-only inclusionists comprise less than 10% of ESS respondents (see Figure 1).
Moreover, this proportion is fairly consistent over time. In 2014, 9% of respondents were in
favour of restricting immigration from poorer non-European countries while allowing
immigrants from poorer European countries. In 2002, the comparable figure was 6.7% for
immigrants from poorer countries and 8% for immigrants from richer countries. Likewise, in
both 2002 and 2014, about half of respondents supported allowing many or at least some
15
immigrants, irrespective of origin from within or outside Europe. An even smaller portion of
respondents were in favour of allowing many or some from non-European countries, while
restricting immigration from European countries to few or none (between 2% and 3.4%).
Figure 1
Notes: Weighted summary statistics, ESS data (see Appendix A for details)
Summary statistics suggest that only a small proportion of EU residents (at least in the
broad but not complete set of EU countries sampled in the ESS) would prefer relatively large
numbers of immigrants from European countries while at the same time preferring little or
no non-European immigration. However, consistency pressures internal to the ESS survey
instrument might influence the results above. The questions about immigration from poorer
countries within and outside Europe are asked, consecutively, to each respondent. This might
induce pressure on respondents to be consistently pro-immigration or anti-immigration in
their answers to this pair of questions, for a variety of possible motivations. For this reason,
we turn next to dependent variable B, constructed from a controlled experiment embedded
in ESS 7.
16
The ESS immigration module in 2014 included a survey experiment that captures
differences in attitudes toward European and non-European immigration, while avoiding the
consistency pressures that arise from the consecutive question format. Within each country,
the sample of respondents is equally and randomly split to four groups that correspond to
four treatments/specifications. Respondents were asked about their preferred level of just
one of four possible types of immigration. While otherwise identical in wording and response
design, the four types vary on two dimensions related to the characteristics of immigrants:
job-related skills and origin; a) unskilled laborers from poorer European country, b)
professionals from poorer European country, c) unskilled laborers from poorer non-European
country, and d) professionals from poorer non-European country. This design (“between-
subjects” rather than “within-subjects”), again, eliminates concerns about pressure to
provide consistent responses across questions.
In addition, the experimental question enables us to distinguish between attitudes
toward immigration from EU countries and immigration from European countries that are not
part of the EU. The relevant survey question changes depending on the country of the
respondent to reflect the individual country from either within or outside Europe providing
the largest number of immigrants. The individual country of origin in Europe or outside
remains the same across all respondents within each country sample (see Table 2 for
countries mentioned in each sample). Since a complex host of historical and geopolitical
factors are likely to determine the most popular sending country among immigrants for each
destination in Europe, the actual country mentioned as sending the largest number of
migrants varies in a non-random manner for respondents living in different countries. In
places such as the UK, Sweden, and Germany, Poland is mentioned as the poorer country in
Europe providing the largest number of migrants. But for outside Europe, the UK respondents
17
are asked about India, those in Sweden are asked about Somalia, and those in Germany are
asked about Turkey. Depending on the country, some European countries mentioned are
members of the EU, while others are not. In Spain, the question references Morocco and
Romania, while in Portugal it mentions Ukraine and Brazil.
Direct cross-referencing of each respondent’s answers to the different experimental
items is not possible in this case. However, the experimental design allows us to assign
respondents with a value based on their support or opposition to inflows and then include
the origin and skill specification of those inflows (i.e. iteration they received) as a factor within
the estimated model. If we assume that people partly form their views based on the
immigrants they interact with the most, then a question that references the most salient or
recognisable country of origin of immigrants within and outside Europe is likely to improve
reliability in responses, rather than reduce it.
It does however raise some questions around the interpretation of the role of country
of origin when grouped into Europe/non-Europe, if respondents in each country sample are
asked about a different country of birth. But since associations ought to be more consistent
within each country, this should not introduce bias into within-country, individual-level
variation. For this reason, our analysis opts for a multilevel modelling approach, controlling
for country-level effects, and taking this limitation into account in the interpretation of the
results.
In spite of these limitations, an advantage of this experimentally-varied question is
that it allows us to test whether attitudes are more or less negative in countries where the
largest immigrant group are mobile EU citizens, compared to countries where most European
immigrants are not a result of EU mobility. By doing this, and controlling for other potential
factors, we can pinpoint to the role of EU/European inclusion on immigration preferences,
18
above and beyond other reasons such as racial and cultural similarity that might increase
support for migration from only within Europe. Another design implication to note is the lack
of direct reference to the EU or to EU mobility. It is possible that a respondent is generally
supportive to the idea of free movement or to EU inflows but opposes inflows from the
specific origin country mentioned. We are effectively inferring on all EU origins on the basis
of specific countries. The analysis addresses this as far as possible by statistically controlling
for the effect of specific country mentioned both at individual and country level.
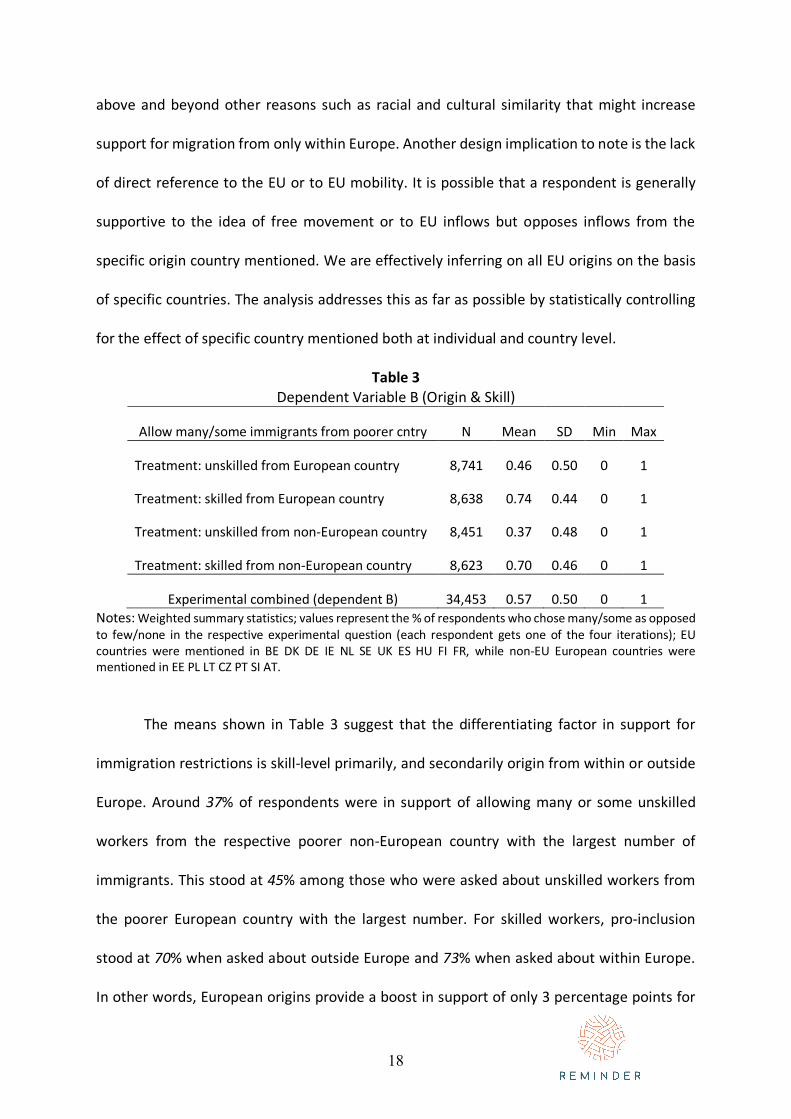
Table 3 Dependent Variable B (Origin & Skill)
Allow many/some immigrants from poorer cntry N Mean SD Min Max
Treatment: unskilled from European country 8,741 0.46 0.50 0 1
Treatment: skilled from European country 8,638 0.74 0.44 0 1
Treatment: unskilled from non-European country 8,451 0.37 0.48 0 1
Treatment: skilled from non-European country 8,623 0.70 0.46 0 1
Experimental combined (dependent B) 34,453 0.57 0.50 0 1 Notes: Weighted summary statistics; values represent the % of respondents who chose many/some as opposed to few/none in the respective experimental question (each respondent gets one of the four iterations); EU countries were mentioned in BE DK DE IE NL SE UK ES HU FI FR, while non-EU European countries were mentioned in EE PL LT CZ PT SI AT.
The means shown in Table 3 suggest that the differentiating factor in support for
immigration restrictions is skill-level primarily, and secondarily origin from within or outside
Europe. Around 37% of respondents were in support of allowing many or some unskilled
workers from the respective poorer non-European country with the largest number of
immigrants. This stood at 45% among those who were asked about unskilled workers from
the poorer European country with the largest number. For skilled workers, pro-inclusion
stood at 70% when asked about outside Europe and 73% when asked about within Europe.
In other words, European origins provide a boost in support of only 3 percentage points for
19
skilled migrants and 8 percentage points for unskilled migrants. By contrast, the increment
for skills is much larger: 28 and 33 percentage points, respectively, for migration from within
and from outside Europe.
Explanatory variables Our first set of explanatory variables relate to the hypothesis that identification with the EU
will predict EU-only inclusionist migration preferences. EU identification is represented by
two ESS questions, asking whether the respondent thinks EU unification has gone too far, and
trusts the European Parliament. These are proxies rather than direct measures, but more
precise identification questions are not available on any survey that also includes the suite of
immigration questions required for our analysis.
In addition, we expect that other forms of identity may predict opposition to EU
migration, or more broadly predict opposition to migration as suggested by group threat
theory. We represent the racial, religious, and cultural identity factors with items on how
important or unimportant respondents think it is for immigrants to have certain
characteristics: fluency in the country’s official language, a Christian background, white racial
identity, and a commitment to the country’s way of life. We also include another item that
taps into cultural chauvinism at a general level, asking to what extent respondents think
‘some cultures are better than others’ as opposed to opting for ‘all cultures are equal’. Finally,
we take account of national identity with a question item asking respondents how close they
feel to their country.
20
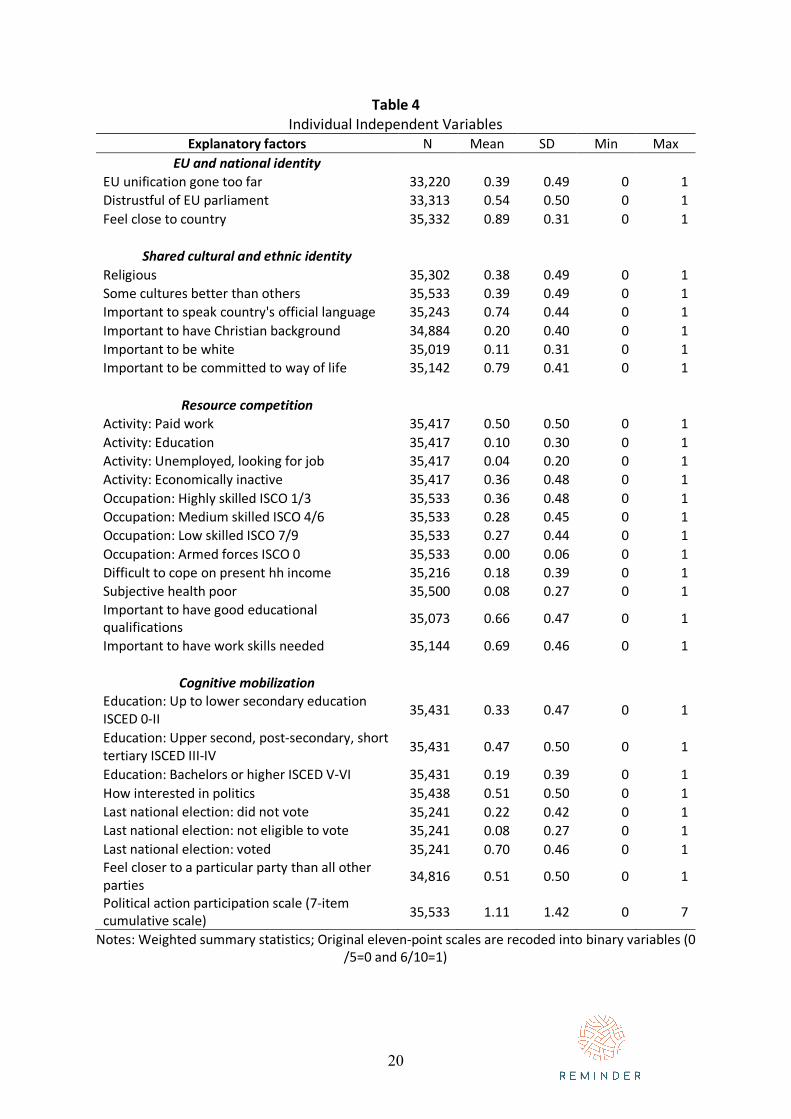
Table 4 Individual Independent Variables
Explanatory factors N Mean SD Min Max EU and national identity
EU unification gone too far 33,220 0.39 0.49 0 1 Distrustful of EU parliament 33,313 0.54 0.50 0 1 Feel close to country 35,332 0.89 0.31 0 1
Shared cultural and ethnic identity Religious 35,302 0.38 0.49 0 1 Some cultures better than others 35,533 0.39 0.49 0 1 Important to speak country's official language 35,243 0.74 0.44 0 1 Important to have Christian background 34,884 0.20 0.40 0 1 Important to be white 35,019 0.11 0.31 0 1 Important to be committed to way of life 35,142 0.79 0.41 0 1
Resource competition Activity: Paid work 35,417 0.50 0.50 0 1 Activity: Education 35,417 0.10 0.30 0 1 Activity: Unemployed, looking for job 35,417 0.04 0.20 0 1 Activity: Economically inactive 35,417 0.36 0.48 0 1 Occupation: Highly skilled ISCO 1/3 35,533 0.36 0.48 0 1 Occupation: Medium skilled ISCO 4/6 35,533 0.28 0.45 0 1 Occupation: Low skilled ISCO 7/9 35,533 0.27 0.44 0 1 Occupation: Armed forces ISCO 0 35,533 0.00 0.06 0 1 Difficult to cope on present hh income 35,216 0.18 0.39 0 1 Subjective health poor 35,500 0.08 0.27 0 1 Important to have good educational qualifications 35,073 0.66 0.47 0 1
Important to have work skills needed 35,144 0.69 0.46 0 1
Cognitive mobilization
Education: Up to lower secondary education ISCED 0-II 35,431 0.33 0.47 0 1
Education: Upper second, post-secondary, short tertiary ISCED III-IV 35,431 0.47 0.50 0 1
Education: Bachelors or higher ISCED V-VI 35,431 0.19 0.39 0 1 How interested in politics 35,438 0.51 0.50 0 1 Last national election: did not vote 35,241 0.22 0.42 0 1 Last national election: not eligible to vote 35,241 0.08 0.27 0 1 Last national election: voted 35,241 0.70 0.46 0 1 Feel closer to a particular party than all other parties 34,816 0.51 0.50 0 1
Political action participation scale (7-item cumulative scale) 35,533 1.11 1.42 0 7
Notes: Weighted summary statistics; Original eleven-point scales are recoded into binary variables (0 /5=0 and 6/10=1)
21
Moving from symbolic to realistic threats, we begin with the respondents’ occupation,
whether current, previous (for the retired), or most recent (for the unemployed), which
should predict attitudes toward immigration inflows of different skill levels. This measure
uses categories based on the International Standard Classification of Occupations (ISCO-08).
We group workers as low-skilled (ISCO 7-9: elementary occupation, plant and machine
operator, or craft and trades worker), medium-skilled (ISCO 4-6: skilled
agricultural/fish/forestry worker, service and sales worker, or clerical support worker), high-
skilled (ISCO 1-3: technician, associate professional/professional, or manager), or in armed
forces occupations (ISCO 0). We also include a measure of economic activity, identified with
four categories using self-reported main activity in last seven days; a) in paid work, b) in
education or training, c) unemployed and actively looking for work, and d) economically
inactive.
In addition to objective economic indicators, we also control for subjective income
perceptions using a question on feelings about household income nowadays (living
comfortably/coping vs difficult/very difficult). The analysis also accounts for self-reported
subjective health status (very good/good/fair vs bad/very bad), a variable that may indicate
concerns over the economic threat or public assistance burden perceived to arise from
immigration. Finally, we also include items asking whether it is important that immigrants a)
have good educational qualifications and b) have needed skills.
To test the cognitive mobilization hypothesis, we include a series of indicators of
interest and engagement in politics. We include interest in politics (very/quite vs hardly/not
at all), whether they voted in the last national election (yes/no/not eligible), and whether
there is a particular political party they “feel closer to than all the other parties” (yes/no). The
political action participation scale is a cumulative scale comprised of seven items asking the
22
respondent (yes=1/no=0) whether they took part in the respective action in the last 12
months: contacted politician or government official, worked in political party or action group,
worked in another organisation or association, worn/displayed campaign badge or sticker,
signed petition, taken part in lawful demonstration, or boycotted certain products. If a
respondent reported “no” in all seven questions, they are assigned a zero, while a respondent
who took part in all actions will be assigned a seven. This scale aims to approximate instances
as well as extent of recent engagement and mobilization with various types of political action
and social activism, which we expect will be associated with political information acquisition,
but without prioritizing any one action specifically.
Education is strongly correlated with political interest and attention to elite messages,
so we incorporate it here as a categorical variable based on the International Standard
Classification of Education (ISCED); a) low education if up to lower secondary (ISCED 0-II), b)
medium education if up to upper second, post-secondary non-tertiary, or short tertiary
(ISCED III-IV), and c) high education if Bachelors Degree equivalent or higher (ISCED V-VI).
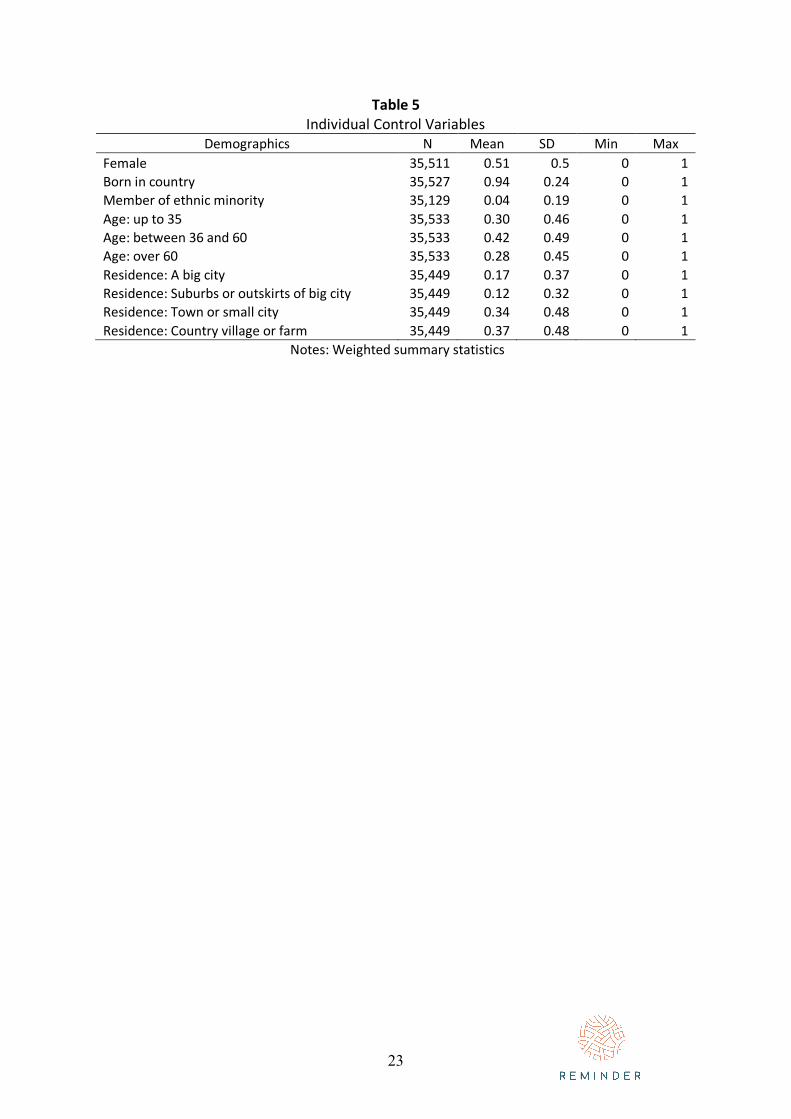
Demographic and other control variables
Our analysis takes into account a series of individual level demographic differences between
respondents, which have been identified by both theory and previous evidence as playing a
role in attitudes towards immigration (see Table 5). We control for gender, three age groups,
birth in country of interview (as opposed to naturalised foreign-born), and self-reported
ethnic minority status. Rural or urban residence is measured with a supplied variable that
identifies whether the respondent lives in a) a big city, b) outskirts of big city/suburbs, c) a
small city or town, or d) in a country village or farm.
23
Table 5 Individual Control Variables
Demographics N Mean SD Min Max Female 35,511 0.51 0.5 0 1 Born in country 35,527 0.94 0.24 0 1 Member of ethnic minority 35,129 0.04 0.19 0 1 Age: up to 35 35,533 0.30 0.46 0 1 Age: between 36 and 60 35,533 0.42 0.49 0 1 Age: over 60 35,533 0.28 0.45 0 1 Residence: A big city 35,449 0.17 0.37 0 1 Residence: Suburbs or outskirts of big city 35,449 0.12 0.32 0 1 Residence: Town or small city 35,449 0.34 0.48 0 1 Residence: Country village or farm 35,449 0.37 0.48 0 1
Notes: Weighted summary statistics
24
Modelling Strategy
Our estimation approach differs depending on the outcome being analysed. Both dependent
measures are operationalised as binary variables that take the value of 1 if the person
expressed the respective inflow preference and 0 otherwise.
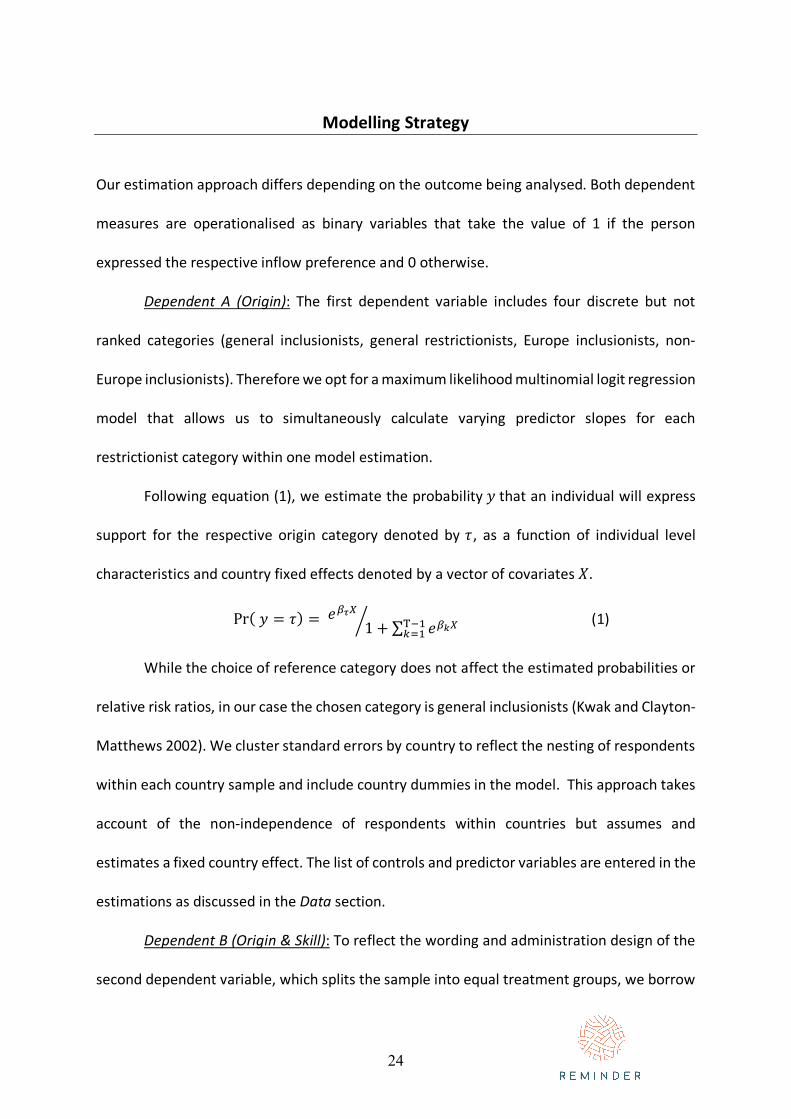
Dependent A (Origin): The first dependent variable includes four discrete but not
ranked categories (general inclusionists, general restrictionists, Europe inclusionists, non-
Europe inclusionists). Therefore we opt for a maximum likelihood multinomial logit regression
model that allows us to simultaneously calculate varying predictor slopes for each
restrictionist category within one model estimation.
Following equation (1), we estimate the probability 𝑦 that an individual will express
support for the respective origin category denoted by 𝜏, as a function of individual level
characteristics and country fixed effects denoted by a vector of covariates 𝑋.
Pr(𝑦 = 𝜏) = 𝑒,-.
1 + ∑ 𝑒,2.345675
8 (1)
While the choice of reference category does not affect the estimated probabilities or
relative risk ratios, in our case the chosen category is general inclusionists (Kwak and Clayton-
Matthews 2002). We cluster standard errors by country to reflect the nesting of respondents
within each country sample and include country dummies in the model. This approach takes
account of the non-independence of respondents within countries but assumes and
estimates a fixed country effect. The list of controls and predictor variables are entered in the
estimations as discussed in the Data section.
Dependent B (Origin & Skill): To reflect the wording and administration design of the
second dependent variable, which splits the sample into equal treatment groups, we borrow
25
our methodological approach from applied epidemiological studies and employ multilevel
modelling. The outcome variable takes the value of 0 if the person opted for restriction in
their respective question, and 1 if they opted for inclusion. The randomly assigned wording
iterations that vary by origin and skills of immigrants are entered as predictors in a mixed-
effects logistic regression model that includes all respondents (level 1) nested within
countries (level 2).
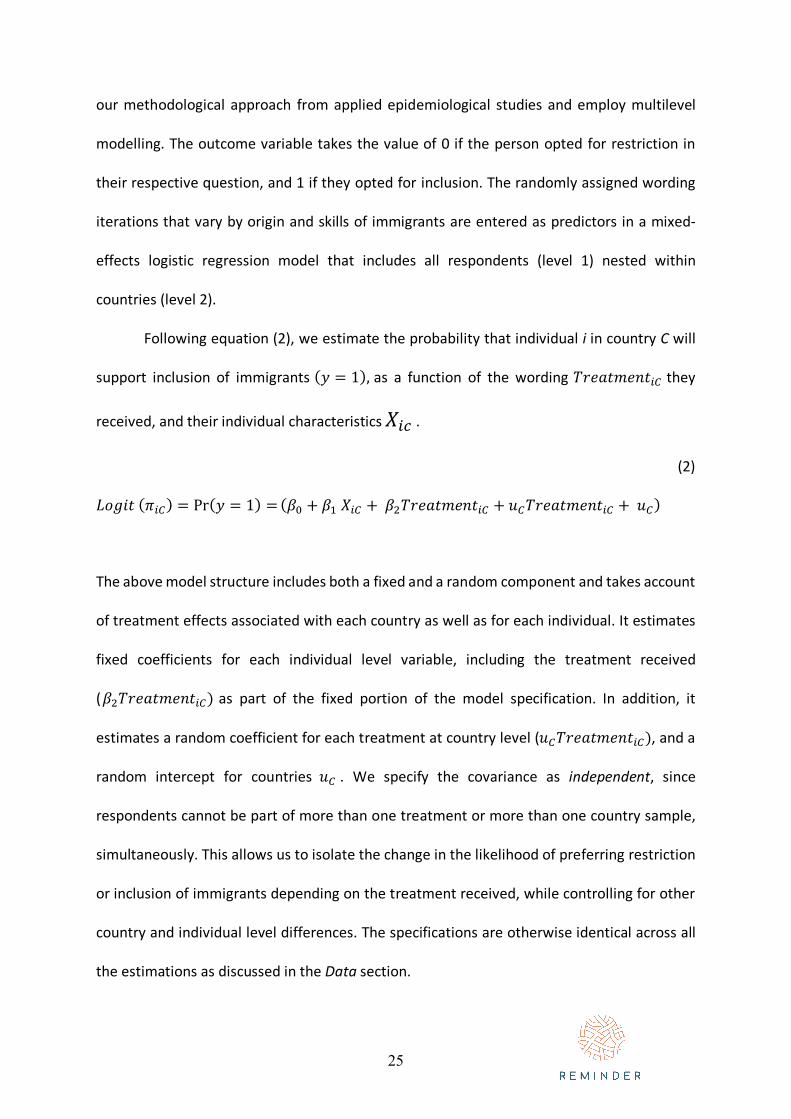
Following equation (2), we estimate the probability that individual i in country C will
support inclusion of immigrants (𝑦 = 1),as a function of the wording 𝑇𝑟𝑒𝑎𝑡𝑚𝑒𝑛𝑡@Athey
received, and their individual characteristics 𝑋@B .
(2)
𝐿𝑜𝑔𝑖𝑡(𝜋@A) = Pr(𝑦 = 1) =(𝛽I + 𝛽5𝑋@A +𝛽J𝑇𝑟𝑒𝑎𝑡𝑚𝑒𝑛𝑡@A + 𝑢A𝑇𝑟𝑒𝑎𝑡𝑚𝑒𝑛𝑡@A +𝑢A)
The above model structure includes both a fixed and a random component and takes account
of treatment effects associated with each country as well as for each individual. It estimates
fixed coefficients for each individual level variable, including the treatment received
(𝛽J𝑇𝑟𝑒𝑎𝑡𝑚𝑒𝑛𝑡@A) as part of the fixed portion of the model specification. In addition, it
estimates a random coefficient for each treatment at country level (𝑢A𝑇𝑟𝑒𝑎𝑡𝑚𝑒𝑛𝑡@A), and a
random intercept for countries 𝑢A . We specify the covariance as independent, since
respondents cannot be part of more than one treatment or more than one country sample,
simultaneously. This allows us to isolate the change in the likelihood of preferring restriction
or inclusion of immigrants depending on the treatment received, while controlling for other
country and individual level differences. The specifications are otherwise identical across all
the estimations as discussed in the Data section.
26
Regression results for both dependent variables are presented following marginal
standardization, which calculates predicted probabilities and/or marginal changes associated
with the values of a predictor for each outcome (inflow preference), while other factors in
the model are considered in their observed values. In simple terms, this approach averages
the estimated effects across actual respondents in the data, rather than presenting the
estimated effect for a person with average characteristics. This is chosen as the most
appropriate method to interpret the average effect of dichotomous factors in the overall
population for binary dependent measures (Muller and MacLehose 2014). For complete
estimation and postestimation results concerning dependent variable A, see Appendix A. For
dependent B, see Appendix B.
27
Empirical Analysis
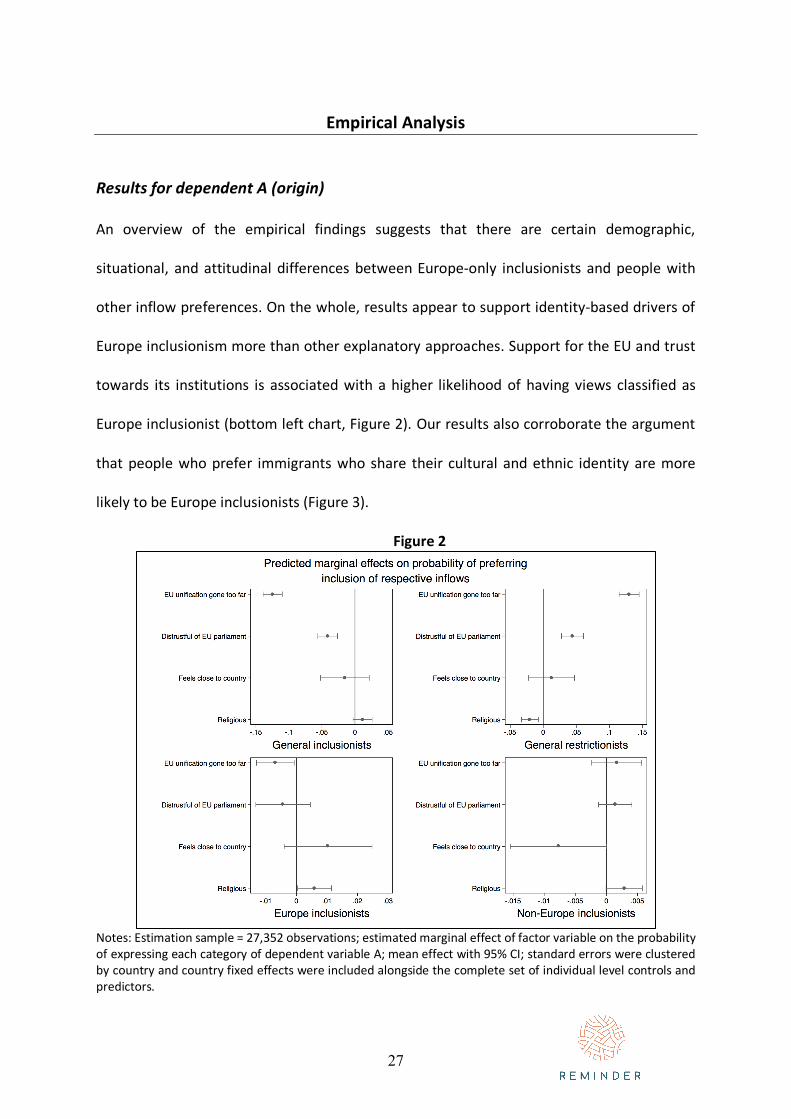
Results for dependent A (origin)
An overview of the empirical findings suggests that there are certain demographic,
situational, and attitudinal differences between Europe-only inclusionists and people with
other inflow preferences. On the whole, results appear to support identity-based drivers of
Europe inclusionism more than other explanatory approaches. Support for the EU and trust
towards its institutions is associated with a higher likelihood of having views classified as
Europe inclusionist (bottom left chart, Figure 2). Our results also corroborate the argument
that people who prefer immigrants who share their cultural and ethnic identity are more
likely to be Europe inclusionists (Figure 3).
Figure 2
Notes: Estimation sample = 27,352 observations; estimated marginal effect of factor variable on the probability of expressing each category of dependent variable A; mean effect with 95% CI; standard errors were clustered by country and country fixed effects were included alongside the complete set of individual level controls and predictors.

28
Thinking that EU unification should go further is associated with, either preferring
European inflows or general inclusion. Those who think that EU unification has gone too far
are more likely to prefer general restrictions or opt for non-European inflows. Expressing
distrust towards the EU parliament shows a similar relationship. Those who are distrustful of
the EU parliament are about 4 percentage points more likely to choose general restrictions,
and slightly less likely to support European inflows only. While the effect is not statistically
very consistent, we find that those who report feeling close to their country are generally
more likely than those who don’t to opt for European inflows or general restrictions, and less
likely to favour general inclusion and non-European inflows. We also find that people who
report feeling religious are more likely than the non-religious people to make an exception
for the inclusion of either European or non-European inflows, and less likely to opt for general
restrictions.
Figure 3
Notes: Estimation sample = 27,352 observations; estimated marginal effect of factor variable on the probability of expressing each category of dependent variable A; mean effect with 95% CI; standard errors were clustered by country and country fixed effects were included alongside the complete set of individual level controls and predictors.
29
Beyond EU identification, other forms of identity are strongly associated with
immigration attitudes, including a specific preference for European immigration. People who
think that some cultures are better than others are about 1.3 percentage points more likely
to prefer European inflows to non-European and 4.8 percentage points more likely to support
general restrictions. Controlling for demographic and other differences, people who do not
value identity and culture related qualifications as important conditions for the inclusion of
immigrants, are more likely to be general inclusionists. Among those who do consider certain
conditions as important for immigrants to have, Europe only inclusionists are more likely to
view being Christian as important. Preferring ethnically white immigrants is associated with a
small but statistically less consistent increase in the likelihood of opting for European only
inflows (by 1.3 percentage points). We should note, however, that all of these factors, as well
as a preference for linguistically-similar immigrants, are even more strongly associated with
general restrictionist immigration attitudes. This is in contrast with EU identification, which is
associated positively with Europe-only inclusionism but negatively with general restrictionist
attitudes.
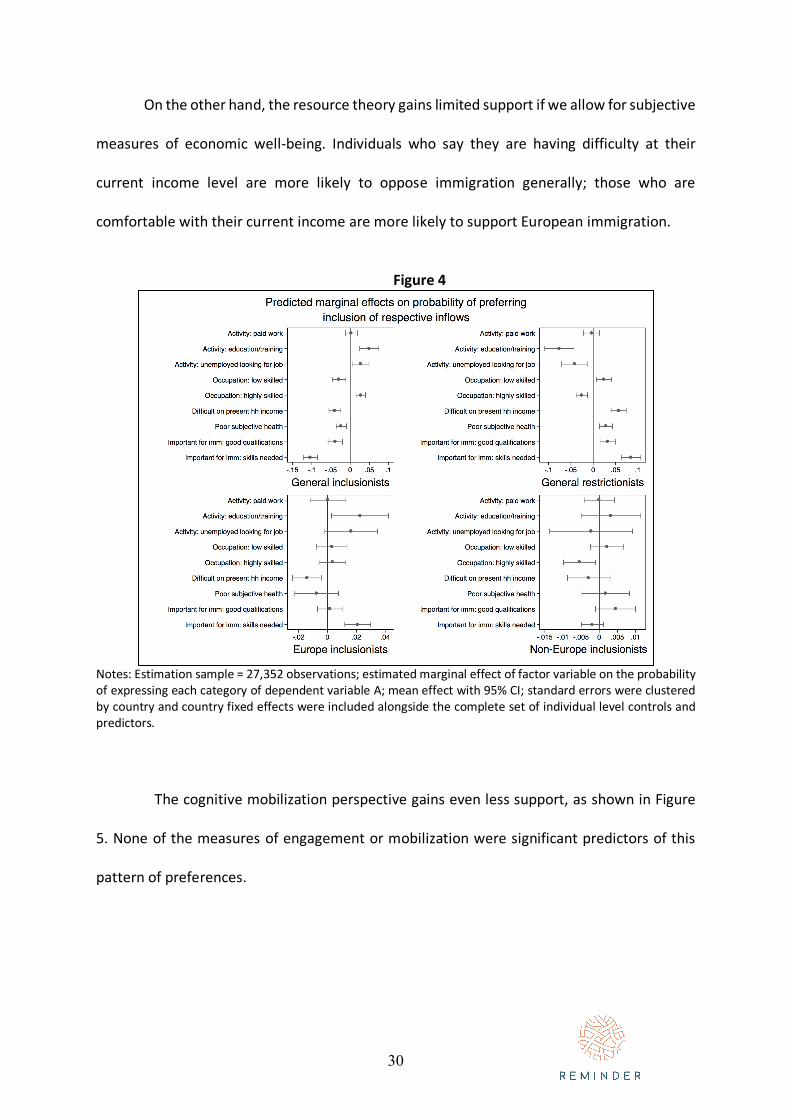
The resource-based view, meanwhile, finds more limited, mixed support at best. As
shown in Figure 4, people in low skilled occupations are more likely to prefer general
restrictions on immigration, and high skilled workers are less likely to do so (relative to
medium skill workers). In contrast, skill level is not strongly associated with European
inclusionism. This contrasts with the predictions of the resource-based account; since
European immigrants are more likely to be low skilled workers, they should be particularly
welcomed by high skilled native workers and opposed by low skilled native workers. Attitudes
toward non-European migrants, more likely to be highly skilled because of existing
immigration restrictions, should show the opposite pattern.
30
On the other hand, the resource theory gains limited support if we allow for subjective
measures of economic well-being. Individuals who say they are having difficulty at their
current income level are more likely to oppose immigration generally; those who are
comfortable with their current income are more likely to support European immigration.
Figure 4
Notes: Estimation sample = 27,352 observations; estimated marginal effect of factor variable on the probability of expressing each category of dependent variable A; mean effect with 95% CI; standard errors were clustered by country and country fixed effects were included alongside the complete set of individual level controls and predictors.
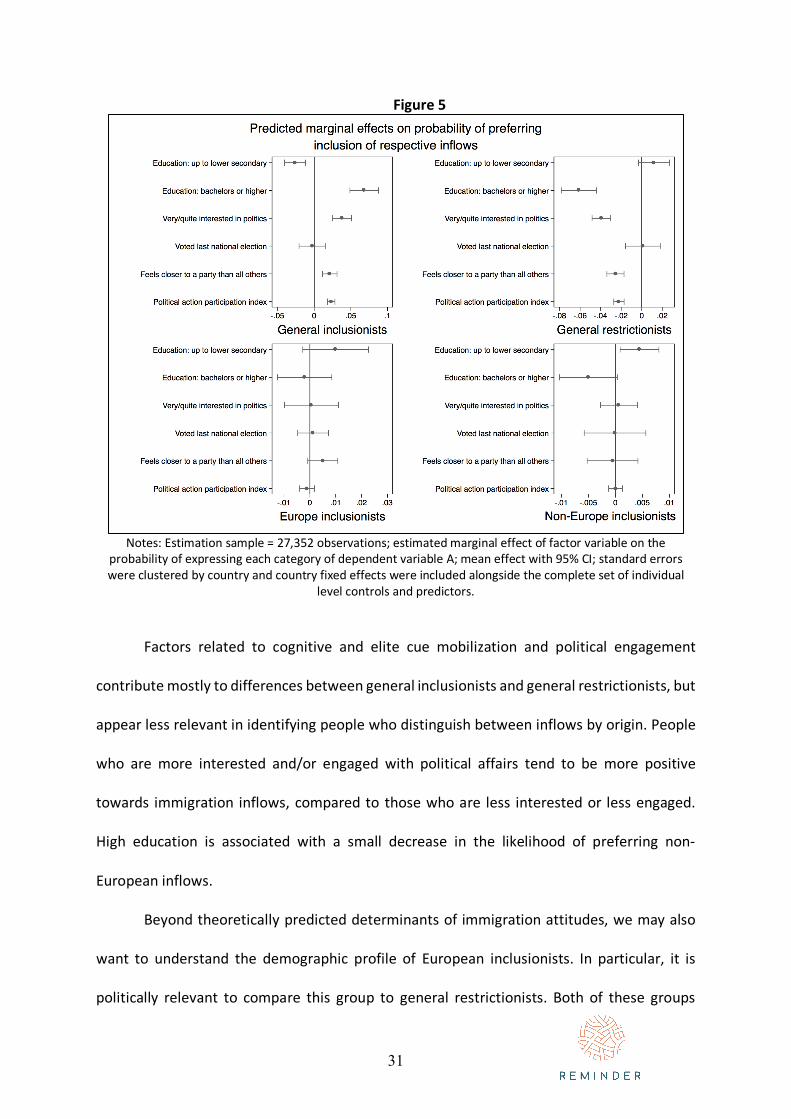
The cognitive mobilization perspective gains even less support, as shown in Figure
5. None of the measures of engagement or mobilization were significant predictors of this
pattern of preferences.
31
Figure 5
Notes: Estimation sample = 27,352 observations; estimated marginal effect of factor variable on the probability of expressing each category of dependent variable A; mean effect with 95% CI; standard errors were clustered by country and country fixed effects were included alongside the complete set of individual
level controls and predictors.
Factors related to cognitive and elite cue mobilization and political engagement
contribute mostly to differences between general inclusionists and general restrictionists, but
appear less relevant in identifying people who distinguish between inflows by origin. People
who are more interested and/or engaged with political affairs tend to be more positive
towards immigration inflows, compared to those who are less interested or less engaged.
High education is associated with a small decrease in the likelihood of preferring non-
European inflows.
Beyond theoretically predicted determinants of immigration attitudes, we may also
want to understand the demographic profile of European inclusionists. In particular, it is
politically relevant to compare this group to general restrictionists. Both of these groups
32
prefer to severely restrict non-European immigration, but Europe inclusionists make an
exception for European immigrants while general restrictionists do not.
We find a few demographic differences. European inclusionists are more likely to be
in education or jobseekers. They are more religious, and more likely to live outside of a big
city. General restrictionists on the other hand tend to be economically inactive and less
religious. Both groups tend to be older than average (higher likelihood of being over 60 years
old). We do not find any statistically significant gender disparities in the probability of
expressing either preference.
To ensure our findings remain robust to the way we have constructed this dependent
variable, we also estimate equation 1 using an alternative version of our dependent variable
that is more sensitive to smaller differences in attitudes toward European vs. non-European
immigration. For more information on coding, see Appendix A Tables 1 & 2. Complete results
of this estimation are available in Appendix A Table 5. As discussed earlier in the paper, we
also conduct a series of sensitivity tests using the first round of ESS data, which was collected
in 2002. We begin by replicating the primary regression (Appendix A, Table 6). Secondly, we
estimate equation 1 with the ESS1 data and the alternative version of dependent variable A
(Appendix A, Table 7). Lastly, we replicate the primary estimation using a copy of dependent
variable A but based on the question wording that mentions richer countries rather than
poorer (Appendix A, Table 8). Despite some differences in effect sizes and in some cases
resulting statistical significance, our broader inferences remain robust to these changes. The
question on support or opposition to further EU unification was not asked in the first round
of the survey. Trust in the EU parliament shows similar effects in both rounds.
33
Results for dependent B (origin & skill) Next, we discuss the empirical results for the experimental dependent variable, which
identifies differentiating inflow preferences by immigrants’ origin (Europe, EU, non-Europe)
and skill level (unskilled, skilled). In this case we employ a mixed effects multilevel logistic
regression where respondents are nested within countries. In the fixed portion of the
equation, the predicted effect of the wording treatment shows to what extent the skill and
origin of immigrants mentioned contributes to a person’s likelihood of supporting inclusion
of inflows, after controlling for other differences between individuals and countries; including
the country level differences in the specific country mentioned as sending the largest number
of immigrants. The random treatment effect at the country level represents how much the
country mentioned contributes to the probability of preferring inclusion, in isolation from any
other differences across countries, or individual characteristics and differences in wording
treatment effects.
Figure 6 shows how the estimated probability of opting for inclusion of inflows varies
depending on the origins and skills of immigrants mentioned. For the two groups asked about
inflows from Europe, the probability is shown separately between those in countries where
the largest sender mentioned is part of the EU, from those in countries where the largest
sender of immigrants mentioned is not a member. The values are estimated based on the
fixed portion of the model, allowing us to isolate the individual fixed effect of origin
mentioned on the probability of opting for inclusion, while controlling for other individual and
country factors. The line at 0.5 separates the probability distribution between those who are
generally predicted to opt for restriction and those who are more likely to support inclusion.
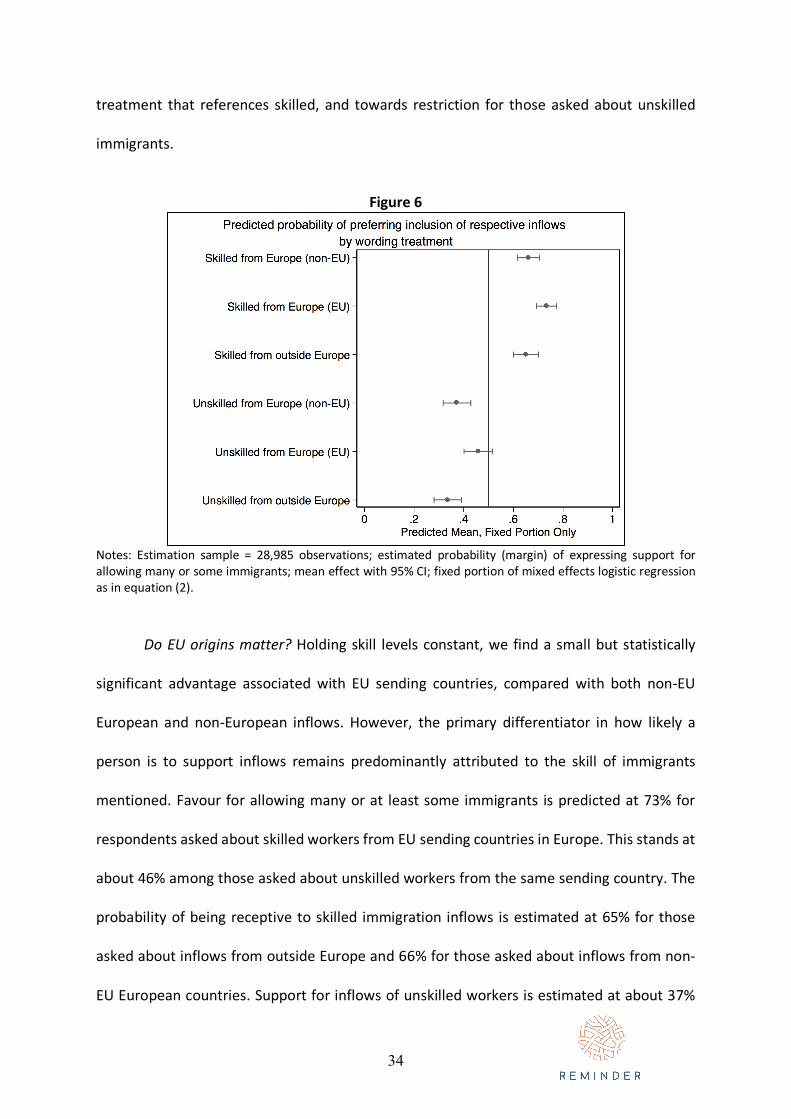
The estimated probability tends to tilt towards inclusion for those assigned the wording
34
treatment that references skilled, and towards restriction for those asked about unskilled
immigrants.
Figure 6
Notes: Estimation sample = 28,985 observations; estimated probability (margin) of expressing support for allowing many or some immigrants; mean effect with 95% CI; fixed portion of mixed effects logistic regression as in equation (2).
Do EU origins matter? Holding skill levels constant, we find a small but statistically
significant advantage associated with EU sending countries, compared with both non-EU
European and non-European inflows. However, the primary differentiator in how likely a
person is to support inflows remains predominantly attributed to the skill of immigrants
mentioned. Favour for allowing many or at least some immigrants is predicted at 73% for
respondents asked about skilled workers from EU sending countries in Europe. This stands at
about 46% among those asked about unskilled workers from the same sending country. The
probability of being receptive to skilled immigration inflows is estimated at 65% for those
asked about inflows from outside Europe and 66% for those asked about inflows from non-
EU European countries. Support for inflows of unskilled workers is estimated at about 37%
35
for people asked about non-EU European inflows, and 34% for people asked about inflows
from outside Europe.
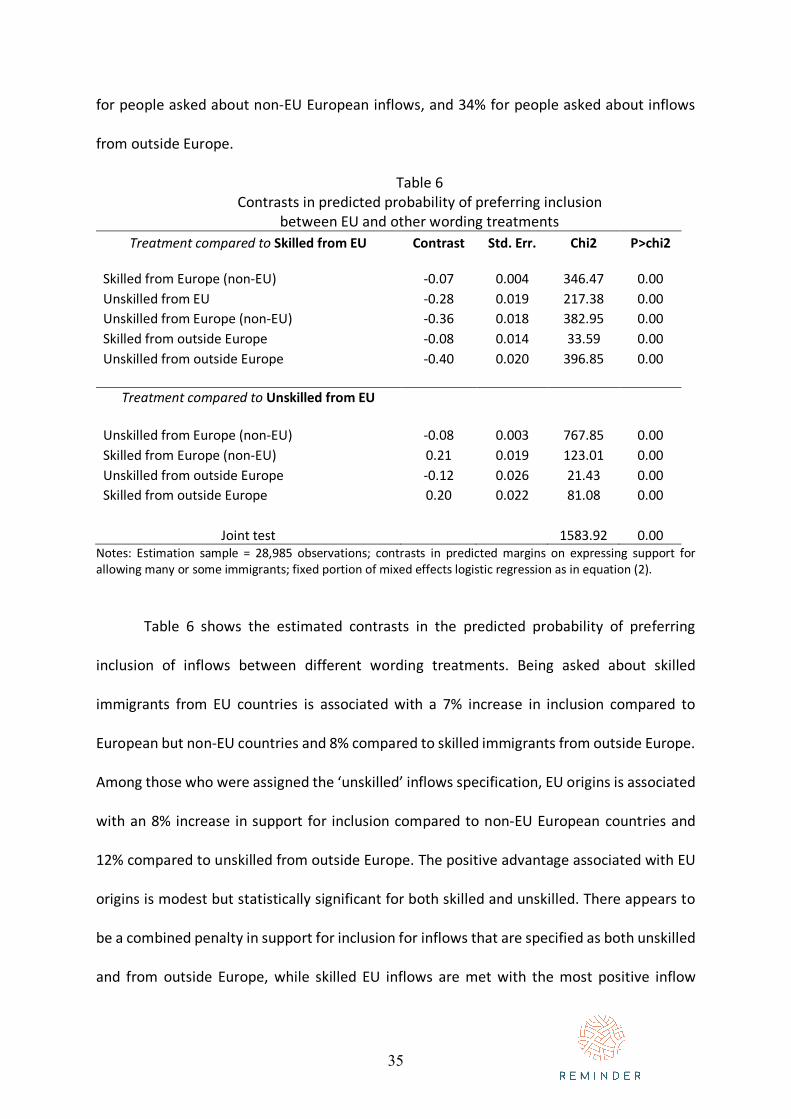
Table 6 Contrasts in predicted probability of preferring inclusion
between EU and other wording treatments Treatment compared to Skilled from EU Contrast Std. Err. Chi2 P>chi2
Skilled from Europe (non-EU) -0.07 0.004 346.47 0.00 Unskilled from EU -0.28 0.019 217.38 0.00 Unskilled from Europe (non-EU) -0.36 0.018 382.95 0.00 Skilled from outside Europe -0.08 0.014 33.59 0.00 Unskilled from outside Europe -0.40 0.020 396.85 0.00
Treatment compared to Unskilled from EU
Unskilled from Europe (non-EU) -0.08 0.003 767.85 0.00 Skilled from Europe (non-EU) 0.21 0.019 123.01 0.00 Unskilled from outside Europe -0.12 0.026 21.43 0.00 Skilled from outside Europe 0.20 0.022 81.08 0.00
Joint test 1583.92 0.00
Notes: Estimation sample = 28,985 observations; contrasts in predicted margins on expressing support for allowing many or some immigrants; fixed portion of mixed effects logistic regression as in equation (2).
Table 6 shows the estimated contrasts in the predicted probability of preferring
inclusion of inflows between different wording treatments. Being asked about skilled
immigrants from EU countries is associated with a 7% increase in inclusion compared to
European but non-EU countries and 8% compared to skilled immigrants from outside Europe.
Among those who were assigned the ‘unskilled’ inflows specification, EU origins is associated
with an 8% increase in support for inclusion compared to non-EU European countries and
12% compared to unskilled from outside Europe. The positive advantage associated with EU
origins is modest but statistically significant for both skilled and unskilled. There appears to
be a combined penalty in support for inclusion for inflows that are specified as both unskilled
and from outside Europe, while skilled EU inflows are met with the most positive inflow
36
attitudes. Our estimates suggest that the penalty in inclusion support attributed to unskilled
versus skilled inflows within the EU is about 28%.
By exploring the random effects portion of the estimation for the groups assigned
Europe as origin, we can assess to what extent there is any residual variation in preferences
attributed specifically to the individual sending country in Europe mentioned as providing the
largest number of immigrants, in isolation from any individual treatment effects. While the
fixed portion of the treatment effect reveals certain broad dynamics that have to do with the
skill level or European and EU origins of immigrants, the random (country-level) portion of
the treatment effects shows substantial variation, both in direction and magnitude.
Furthermore, this variation does not appear consistently tied to whether the sending country
is a member of the EU or not.
Compared to other countries, attitudes to inflows are generally more negative in
countries where Romania (i.e. Hungary and Spain) and Estonia (i.e. Finland) are the sending
countries specified and hold for both skill levels. Other things considered, attitudes to inflows
are more positive in countries where Portugal is mentioned as the largest poorer sender of
immigrants within Europe, but the effect is mostly observed with respect to skilled inflows
(i.e. France and Switzerland). The large variation in the random portion of the treatment
effects, coupled with low intra-class correlation within countries (7%), supports the
expectation that there are additional disparities related to the specific sending country
referenced in the question which are driven by more idiosyncratic, historical, and geopolitical
factors.
Who is most and least likely to support EU inflows? The probability of supporting
inclusion of unskilled workers from EU countries is found lowest among respondents who
work in low-skilled occupations (33%), with low education completed (34%), who report poor
37
health (34%), and those who find it difficult to cope on their present income (35%). The
chances are also lowest among those who think that EU unification has gone too far (35%)
and those saying that being Christian (31%) and white (23%) are important conditions for
immigration. On the opposite direction, the likelihood of opting for inclusion of inflows of
unskilled EU laborers is found highest among respondents who have high education (63%),
and those who think that speaking the country’s official language (61%), having skills needed
(61%), and being committed to the way of life of the country (64%) are unimportant
conditions for immigration. People who scored the highest in the participation index (i.e. had
taken part in all seven actions) are also estimated as generally likely to opt for inclusion (57%).
Support for inflows is overwhelmingly high among all groups of respondents who were
asked about skilled from within the EU. Relatively speaking, however, support tends to vary
in similar directions as for unskilled EU inflows. Support for allowing skilled EU inflows is found
lowest among respondents who value being white (52%) and Christian (60%) as an important
condition for immigrants to have.
The above findings show that support for intra-EU immigration is associated with
many factors that are also associated with support for immigration in general. Additional
analysis focuses on factors that differentiate support for intra-EU migration specifically.
Figures 7 to 10 show how the predicted probability of supporting inflows varies depending on
people’s demographic characteristics and the wording treatment they received, while other
things are held constant (for values see Appendix B, Table 3). Among respondents who were
randomly assigned Europe as the broader region of origin (half of sample), the probability is
shown separately for sending countries that are members of the EU. This breakdown allows
us to pinpoint any potential differences associated with EU versus non-EU European origins,

38
while other factors have been taken into account either by experimental controls (skills) or
statistical controls (other factors).
Figure 7
Notes: Estimation sample = 28,985 observations; estimated probability (margin) of expressing support for allowing many or some immigrants; mean effect with 95% CI; fixed portion of mixed effects logistic regression as in equation (2).
EU support matters, but its estimated impact is almost as much great on support for
non-EU European immigration as for EU inflows. The EU support variable has a slightly larger
marginal effect on support for EU flows, but the differences are substantively small and
statistically significant only for skilled migrants and not for unskilled. This suggests that EU
identity may be a proxy for a more open viewpoint that is associated with openness to
immigration generally; it does not seem that there is a powerful relationship between support
for the EU and specific support for the pattern of immigration policy embedded in EU
institutions (free movement within the EU, restrictions on non-EU immigration including from
within Europe). Expressing concern about EU unification (14%-19%) or distrust of the EU
parliament (5%-12%) is associated with a reduction in the probability of opting for inclusion
of inflows; with the largest gap estimated for the unskilled from EU treatment group. The
39
disparity is not necessarily major, but it lends limited support to the argument that opposition
to mobility of low skilled workers within Europe is especially pronounced among people who
have concerns over the degree of EU unification and are distrustful of EU institutions.
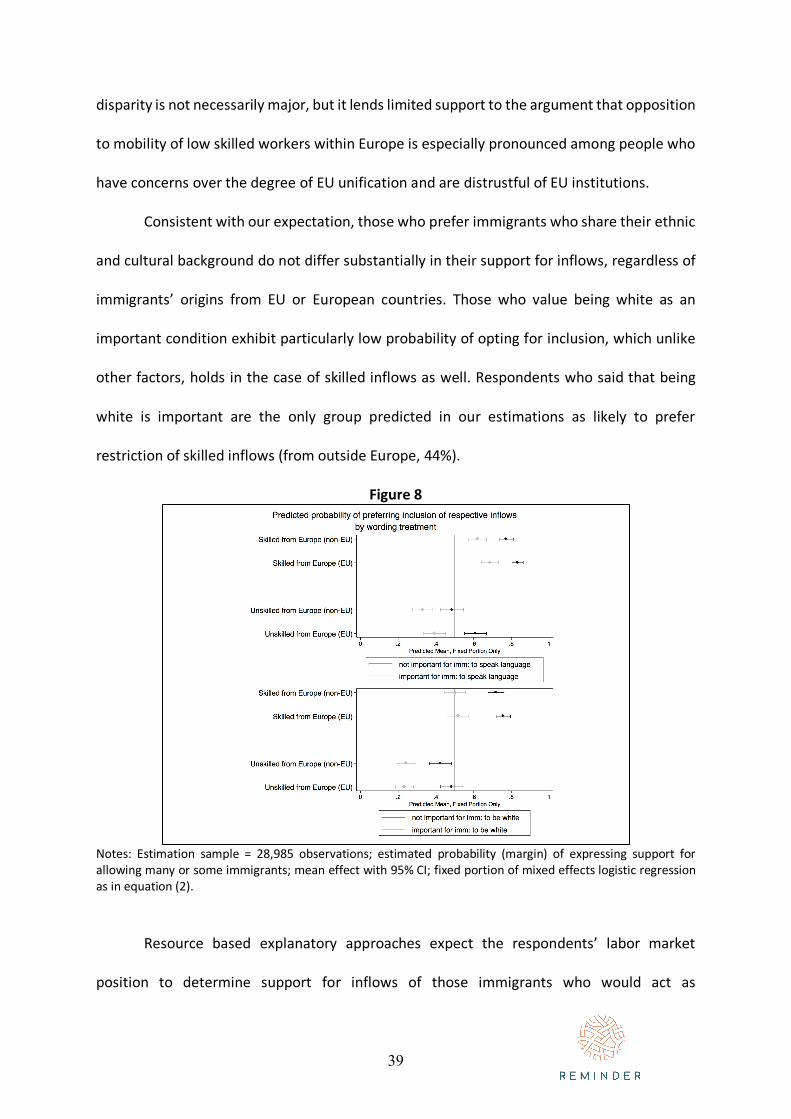
Consistent with our expectation, those who prefer immigrants who share their ethnic
and cultural background do not differ substantially in their support for inflows, regardless of
immigrants’ origins from EU or European countries. Those who value being white as an
important condition exhibit particularly low probability of opting for inclusion, which unlike
other factors, holds in the case of skilled inflows as well. Respondents who said that being
white is important are the only group predicted in our estimations as likely to prefer
restriction of skilled inflows (from outside Europe, 44%).
Figure 8
Notes: Estimation sample = 28,985 observations; estimated probability (margin) of expressing support for allowing many or some immigrants; mean effect with 95% CI; fixed portion of mixed effects logistic regression as in equation (2).
Resource based explanatory approaches expect the respondents’ labor market
position to determine support for inflows of those immigrants who would act as
40
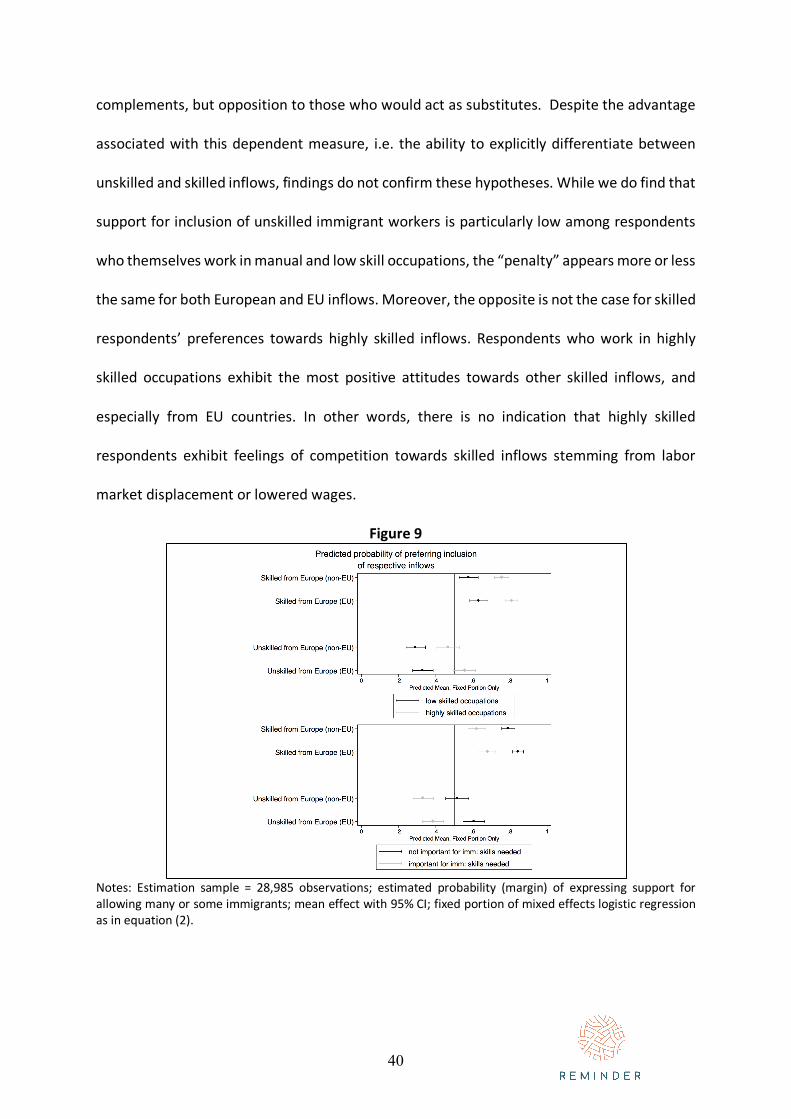
complements, but opposition to those who would act as substitutes. Despite the advantage
associated with this dependent measure, i.e. the ability to explicitly differentiate between
unskilled and skilled inflows, findings do not confirm these hypotheses. While we do find that
support for inclusion of unskilled immigrant workers is particularly low among respondents
who themselves work in manual and low skill occupations, the “penalty” appears more or less
the same for both European and EU inflows. Moreover, the opposite is not the case for skilled
respondents’ preferences towards highly skilled inflows. Respondents who work in highly
skilled occupations exhibit the most positive attitudes towards other skilled inflows, and
especially from EU countries. In other words, there is no indication that highly skilled
respondents exhibit feelings of competition towards skilled inflows stemming from labor
market displacement or lowered wages.
Figure 9
Notes: Estimation sample = 28,985 observations; estimated probability (margin) of expressing support for allowing many or some immigrants; mean effect with 95% CI; fixed portion of mixed effects logistic regression as in equation (2).
41
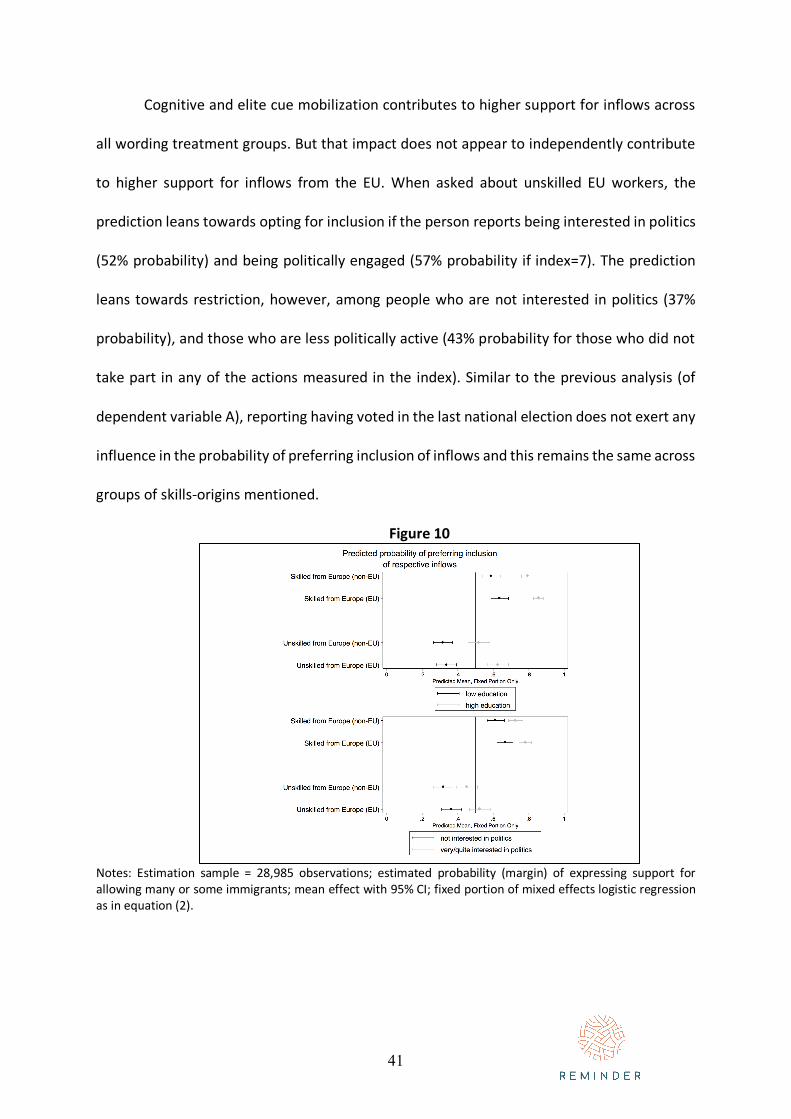
Cognitive and elite cue mobilization contributes to higher support for inflows across
all wording treatment groups. But that impact does not appear to independently contribute
to higher support for inflows from the EU. When asked about unskilled EU workers, the
prediction leans towards opting for inclusion if the person reports being interested in politics
(52% probability) and being politically engaged (57% probability if index=7). The prediction
leans towards restriction, however, among people who are not interested in politics (37%
probability), and those who are less politically active (43% probability for those who did not
take part in any of the actions measured in the index). Similar to the previous analysis (of
dependent variable A), reporting having voted in the last national election does not exert any
influence in the probability of preferring inclusion of inflows and this remains the same across
groups of skills-origins mentioned.
Figure 10
Notes: Estimation sample = 28,985 observations; estimated probability (margin) of expressing support for allowing many or some immigrants; mean effect with 95% CI; fixed portion of mixed effects logistic regression as in equation (2).
42
Model Diagnostics: Intra-class correlation in the level 2 of the model, i.e. countries, is
particularly low at .07, confirming that latent responses to the outcome variable are not
highly correlated within countries (Appendix B, Table 1). If intraclass correlation were
especially high, it would indicate that latent responses of people within the same country
sample correlated too highly (i.e. too similar) and the chance of someone preferring
restriction or inclusion of inflows is primarily attributable to country of residence. The
predicted versus observed classification table suggests reasonable predictive power for our
model estimations. Around 68% of respondents who opted for a few or no inflows in their
respective question were correctly predicted by the model as preferring restriction (Appendix
B, Table 2). Around 75% of respondents who chose many or some inflows in their question
were correctly predicted by the model as preferring inclusion.
In addition to these diagnostic tests, we also try two alternative estimation methods
to ensure our results and conclusions are not particularly sensitive to small changes. We
estimate a logistic regression model with country fixed effects and standard errors clustered
by country, in which the treatment is taken into account as an individual fixed effect
(Appendix B, Table 6). We also replicate equation 2 by estimating a mixed effects logistic
regression where treatment effects are only included in the fixed portion of the equation
(Appendix B, Table 7). There are minor differences but our inferences appear robust.
43
Conclusions
This paper relies on social survey data across twenty European countries to explore the
incidence and determinants of Europe and of EU inclusionism in patterns of preferences for
immigration flows. We identify occasions where respondents (citizens resident across EU and
EFTA countries) express preference for more immigrants to be allowed from within Europe
and/or the EU, than from outside. Further, we examined the determinants of patterns of
immigration preferences, testing explanations derived from several prominent theories of
immigration attitudes and EU support.
Theoretically, the gap between popular preferences and EU requirements suggests a
need to understand the sources of these preferences. Here, our results may raise more
questions than they answer. Even identification with the EU seems to have limited impact on
specific support for intra-EU mobility; support for the EU seems almost as strongly linked to
support for non-EU immigration. The weakness of the cognitive mobilization explanation
contrasts with earlier findings, but may not be surprising given increased political contention
around EU issues. Further work might aim to distinguish whether this result reflects a lack of
elite influence on disaffected citizens, or, instead, ongoing influence by elites who are
increasingly polarized rather than united on issues of immigration and Europe. Our results
also point to the weakness of objective labor market positioning as an explanation for
attitudes toward immigration, as low skilled workers are not particularly opposed to intra-EU
mobility, the largest source of low skilled migrant inflows. On the other hand, subjective
indicators of economic security do have some explanatory power, and our results are
consistent with the fiscal burden hypothesis as well. Future work will incorporate new
44
REMINDER project data on the actual fiscal impact of intra-EU and non-EU inflows, allowing
for an actual empirical examination of this theory.
Politically, our descriptive findings are perhaps the most relevant. As noted earlier,
the EU project depends on broad acceptance of intra-EU mobility. Given the widespread
nature of anti-immigration sentiment across virtually all immigrant-receiving societies, the EU
project in effect requires some portion of the public who prefer restrictionist immigration
policies to make an exception for fellow EU nationals, or at least to tolerate such an exception.
As of now, however, there is relatively little support for such an exception. The vast majority
of support for EU mobility comes from people who support immigration in general; relatively
little comes from individuals who want to restrict immigration but make an exception for the
EU (or for Europe more broadly). Less than 10% of this broad, representative sample of EU
residents prefers inflows of some or many immigrants from Europe while preferring to restrict
immigration from outside Europe to few or none. Similarly, when skills and origins are
manipulated experimentally, we found only a modest preference for EU sending countries
over non-EU European countries. This pattern of preferences contrasts sharply with the
normative position entrenched in EU treaties that dramatically favor EU mobility over non-
EU immigration.
Our exploration of the skills-origins nexus leads to an even more politically pointed
way of putting this dilemma. Opposition to migration of low-skilled workers is widespread
and consistent cross-nationally. Most Europeans hold to this set of preferences, even when
the low-skilled workers in question come from Europe or the EU, and even when the high-
skilled workers come from more distant origins. So, on the one hand, few Europeans register
a preference for EU migrants; on the other hand, majorities reject unskilled immigration and
are not willing to reverse their opinion just because the immigrants involved are part of the

45
EU. This pattern poses an obstacle to support for free movement, which will inevitably include
mobility of low skilled workers in search of better opportunities and wages than they can find
in their countries of origin.
46
Bibliography
Bansak, Kirk, Jens Hainmueller, and Dominik Hangartner. 2016. “How Economic, Humanitarian, and Religious Concerns Shape European Attitudes toward Asylum Seekers.” Science 354 (6309): 217–22. https://doi.org/10.1126/science.aag2147.
Blinder, Scott. 2015. “Imagined Immigration: The Impact of Different Meanings of ‘Immigrants’ in Public Opinion and Policy Debates in Britain.” Political Studies 63 (1): 80–100. https://doi.org/10.1111/1467-9248.12053.
Brinegar, Adam P., and Seth K. Jolly. 2005. “Location, Location, Location: National Contextual Factors and Public Support for European Integration.” European Union Politics 6 (2): 155–80. https://doi.org/10.1177/1465116505051981.
Bruter, Michael. 2009. “Time Bomb? The Dynamic Effect of News and Symbols on the Political Identity of European Citizens.” Comparative Political Studies 42 (12): 1498–1536.
Ceobanu, Alin M., and Xavier Escandell. 2010. “Comparative Analyses of Public Attitudes toward Immigrants and Immigration Using Multinational Survey Data: A Review of Theories and Research.” Annual Review of Sociology 36: 309–328.
Chandler, Charles R., and Yung-mei Tsai. 2001. “Social Factors Influencing Immigration Attitudes: An Analysis of Data from the General Social Survey.” The Social Science Journal 38 (2): 177–88. https://doi.org/10.1016/S0362-3319(01)00106-9.
Donaghey, Jimmy, and Paul Teague. 2006. “The Free Movement of Workers and Social Europe: Maintaining the European Ideal.” Industrial Relations Journal 37 (6): 652–66. https://doi.org/10.1111/j.1468-2338.2006.00426.x.
Elsas, Erika J. van, Armen Hakhverdian, and Wouter van der Brug. 2016. “United against a Common Foe? The Nature and Origins of Euroscepticism among Left-Wing and Right-Wing Citizens.” West European Politics 39 (6): 1181–1204. https://doi.org/10.1080/01402382.2016.1175244.
Facchini, Giovanni, and Anna Maria Mayda. 2009. “Does the Welfare State Affect Individual Attitudes toward Immigrants? Evidence across Countries.” Review of Economics and Statistics 91 (2): 295–314. https://doi.org/10.1162/rest.91.2.295.
Fligstein, Neil, Alina Polyakova, and Wayne Sandholtz. 2012. “European Integration, Nationalism and European Identity.” JCMS: Journal of Common Market Studies 50 (s1): 106–22. https://doi.org/10.1111/j.1468-5965.2011.02230.x.
Ford, Robert. 2008. “Is Racial Prejudice Declining in Britain?” The British Journal of Sociology 59 (4): 609–36. https://doi.org/10.1111/j.1468-4446.2008.00212.x.
Gabel, Matthew. 1998. “Public Support for European Integration: An Empirical Test of Five Theories.” The Journal of Politics 60 (2): 333–54. https://doi.org/10.2307/2647912.
Geddes, Andrew, and Leila Hadj-Abdou. 2016. “An Unstable Equilibrium: Freedom of Movement and the Welfare State in the European Union.” In Handbook on Migration and Social Policy. Cheltenham, UK. https://www.elgaronline.com/view/9781783476282.00022.xml.
Goodwin, Matthew, and Caitlin Milazzo. 2017. “Taking Back Control? Investigating the Role of Immigration in the 2016 Vote for Brexit.” The British Journal of Politics and International Relations 19 (3): 450–64. https://doi.org/10.1177/1369148117710799.
47
Gorodzeisky, Anastasia. 2011. “Who Are the Europeans That Europeans Prefer? Economic Conditions and Exclusionary Views toward European Immigrants.” International Journal of Comparative Sociology 52 (1–2): 100–113. https://doi.org/10.1177/0020715210377158.
Gorodzeisky, Anastasia, and Moshe Semyonov. 2016. “Not Only Competitive Threat but Also Racial Prejudice: Sources of Anti-Immigrant Attitudes in European Societies.” International Journal of Public Opinion Research 28 (3): 331–54. https://doi.org/10.1093/ijpor/edv024.
Hainmueller, Jens, and Michael J. Hiscox. 2010. “Attitudes toward Highly Skilled and Low-Skilled Immigration: Evidence from a Survey Experiment.” American Political Science Review 104 (1): 61–84. https://doi.org/10.1017/S0003055409990372.
Hainmueller, Jens, and Daniel J. Hopkins. 2014. “Public Attitudes Toward Immigration.” Annual Review of Political Science 17 (1): 225–49. https://doi.org/10.1146/annurev-polisci-102512-194818.
Hobolt, Sara B., and Catherine E. de Vries. 2016. “Public Support for European Integration.” Annual Review of Political Science 19: 413–432.
Hooghe, Liesbet, and Gary Marks. 2005. “Calculation, Community and Cues: Public Opinion on European Integration.” European Union Politics 6 (4): 419–43. https://doi.org/10.1177/1465116505057816.
———. 2009. “A Postfunctionalist Theory of European Integration: From Permissive Consensus to Constraining Dissensus.” British Journal of Political Science 39 (1): 1–23. https://doi.org/10.1017/S0007123408000409.
Hopkins, Daniel J. 2010. “Politicized Places: Explaining Where and When Immigrants Provoke Local Opposition.” American Political Science Review 104 (1): 40–60. https://doi.org/10.1017/S0003055409990360.
Kahanec, Martin, and Klaus F. Zimmermann. 2011. “High-Skilled Immigration Policy in Europe.” 1096. Discussion Papers of DIW Berlin. DIW Berlin, German Institute for Economic Research. https://ideas.repec.org/p/diw/diwwpp/dp1096.html.
Kentmen-Cin, Cigdem, and Cengiz Erisen. 2017. “Anti-Immigration Attitudes and the Opposition to European Integration: A Critical Assessment.” European Union Politics 18 (1): 3–25. https://doi.org/10.1177/1465116516680762.
Kwak, Chanyeong, and Alan Clayton-Matthews. 2002. “Multinomial Logistic Regression.” Nursing Research 51 (6): 404.
Malchow-Møller, Nikolaj, Jakob Roland Munch, Sanne Schroll, and Jan Rose Skaksen. 2008. “Attitudes towards Immigration—Perceived Consequences and Economic Self-Interest.” Economics Letters 100 (2): 254–57. https://doi.org/10.1016/j.econlet.2008.02.003.
Mayda, Anna Maria. 2006. “Who Is Against Immigration? A Cross-Country Investigation of Individual Attitudes toward Immigrants.” Review of Economics and Statistics 88 (3): 510–30. https://doi.org/10.1162/rest.88.3.510.
McLaren, Lauren, and Mark Johnson. 2007. “Resources, Group Conflict and Symbols: Explaining Anti-Immigration Hostility in Britain.” Political Studies 55 (4): 709–32. https://doi.org/10.1111/j.1467-9248.2007.00680.x.
McLaren, Lauren M. 2001. “Immigration and the New Politics of Inclusion and Exclusion in the European Union: The Effect of Elites and the EU on Individual–Level Opinions Regarding European and Non–European Immigrants.” European Journal of Political Research 39 (1): 81–108. https://doi.org/10.1111/1475-6765.00571.
48
Muller, Clemma J., and Richard F. MacLehose. 2014. “Estimating Predicted Probabilities from Logistic Regression: Different Methods Correspond to Different Target Populations.” International Journal of Epidemiology 43 (3): 962–70. https://doi.org/10.1093/ije/dyu029.
O’Rourke, Kevin H., and Richard Sinnott. 2006. “The Determinants of Individual Attitudes towards Immigration.” European Journal of Political Economy 22 (4): 838–61. https://doi.org/10.1016/j.ejpoleco.2005.10.005.
Quillian, Lincoln. 1995. “Prejudice as a Response to Perceived Group Threat: Population Composition and Anti-Immigrant and Racial Prejudice in Europe.” American Sociological Review 60 (4): 586–611. https://doi.org/10.2307/2096296.
Riek, Blake M, Eric W Mania, and Samuel L Gaertner. 2006. “Intergroup Threat and Outgroup Attitudes: A Meta-Analytic Review.” Personality and Social Psychology Review 10 (4): 336–53. https://doi.org/10.1207/s15327957pspr1004_4.
Risse, Thomas. 2010. A Community of Europeans?: Transnational Identities and Public Spheres. Cornell University Press. http://www.jstor.org/stable/10.7591/j.ctt7v8r0.
Ruhs, Martin. 2017a. “Labor Immigration Policies in High-Income Countries: Variations Across Political Regimes and Varieties of Capitalism.” SSRN Scholarly Paper ID 3076925. Rochester, NY: Social Science Research Network. https://papers.ssrn.com/abstract=3076925.
———. 2017b. “Free Movement in the European Union: National Institutions vs Common Policies?” International Migration 55 (December): 22–38. https://doi.org/10.1111/imig.12398.
Scheve, Kenneth F., and Matthew J. Slaughter. 2001. “Labor Market Competition and Individual Preferences over Immigration Policy.” The Review of Economics and Statistics 83 (1): 133–45.
Sides, John, and Jack Citrin. 2007. “European Opinion about Immigration: The Role of Identities, Interests and Information.” British Journal of Political Science 37 (3): 477–504.
Sniderman, Paul M., and Louk Hagendoorn. 2007. When Ways of Life Collide: Multiculturalism and Its Discontents in the Netherlands. Princeton, NJ, US: Princeton University Press.
Valentino, Nicholas A., Stuart N. Soroka, Shanto Iyengar, Toril Aalberg, Raymond Duch, Marta Fraile, Kyu S. Hahn, et al. 2017. “Economic and Cultural Drivers of Immigrant Support Worldwide.” British Journal of Political Science, November, 1–26. https://doi.org/10.1017/S000712341700031X.
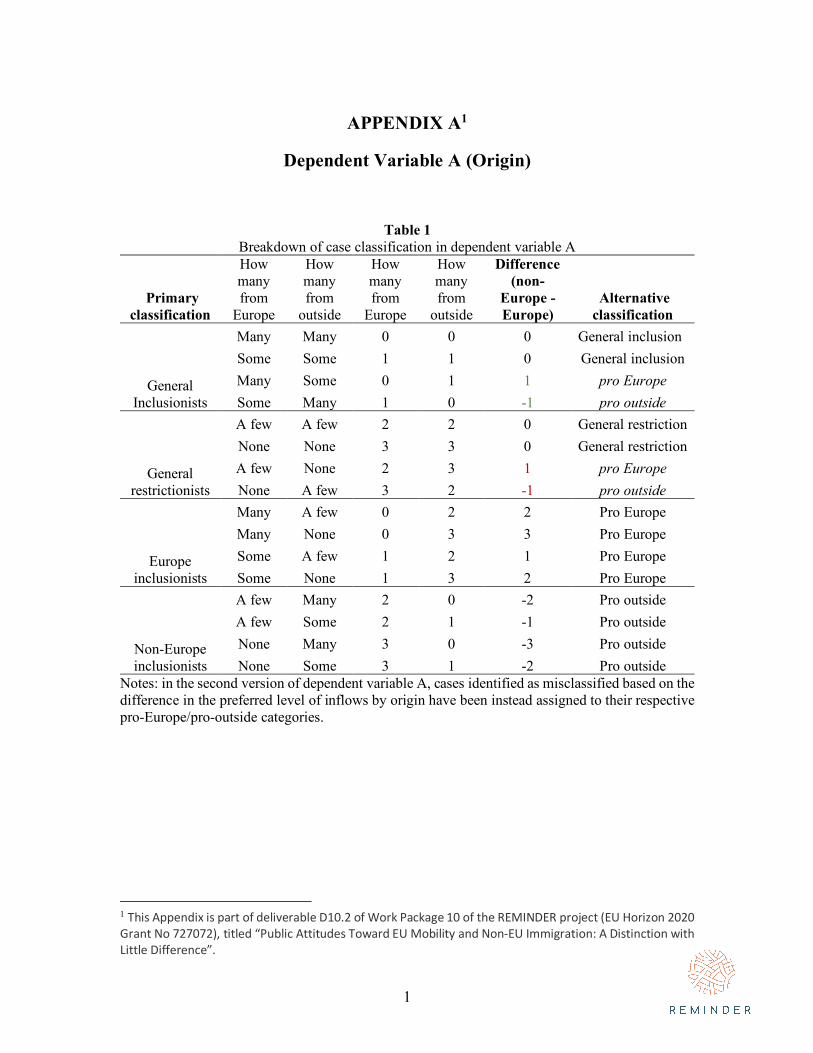
1
APPENDIX A1
Dependent Variable A (Origin)
Table 1 Breakdown of case classification in dependent variable A
Primary classification
How many from
Europe
How many from
outside
How many from
Europe
How many from
outside
Difference (non-
Europe - Europe)
Alternative classification
General Inclusionists
Many Many 0 0 0 General inclusion Some Some 1 1 0 General inclusion Many Some 0 1 1 pro Europe Some Many 1 0 -1 pro outside
General restrictionists
A few A few 2 2 0 General restriction None None 3 3 0 General restriction A few None 2 3 1 pro Europe None A few 3 2 -1 pro outside
Europe inclusionists
Many A few 0 2 2 Pro Europe Many None 0 3 3 Pro Europe Some A few 1 2 1 Pro Europe Some None 1 3 2 Pro Europe
Non-Europe inclusionists
A few Many 2 0 -2 Pro outside A few Some 2 1 -1 Pro outside None Many 3 0 -3 Pro outside None Some 3 1 -2 Pro outside
Notes: in the second version of dependent variable A, cases identified as misclassified based on the difference in the preferred level of inflows by origin have been instead assigned to their respective pro-Europe/pro-outside categories.
1 This Appendix is part of deliverable D10.2 of Work Package 10 of the REMINDER project (EU Horizon 2020 Grant No 727072), titled “Public Attitudes Toward EU Mobility and Non-EU Immigration: A Distinction with Little Difference”.
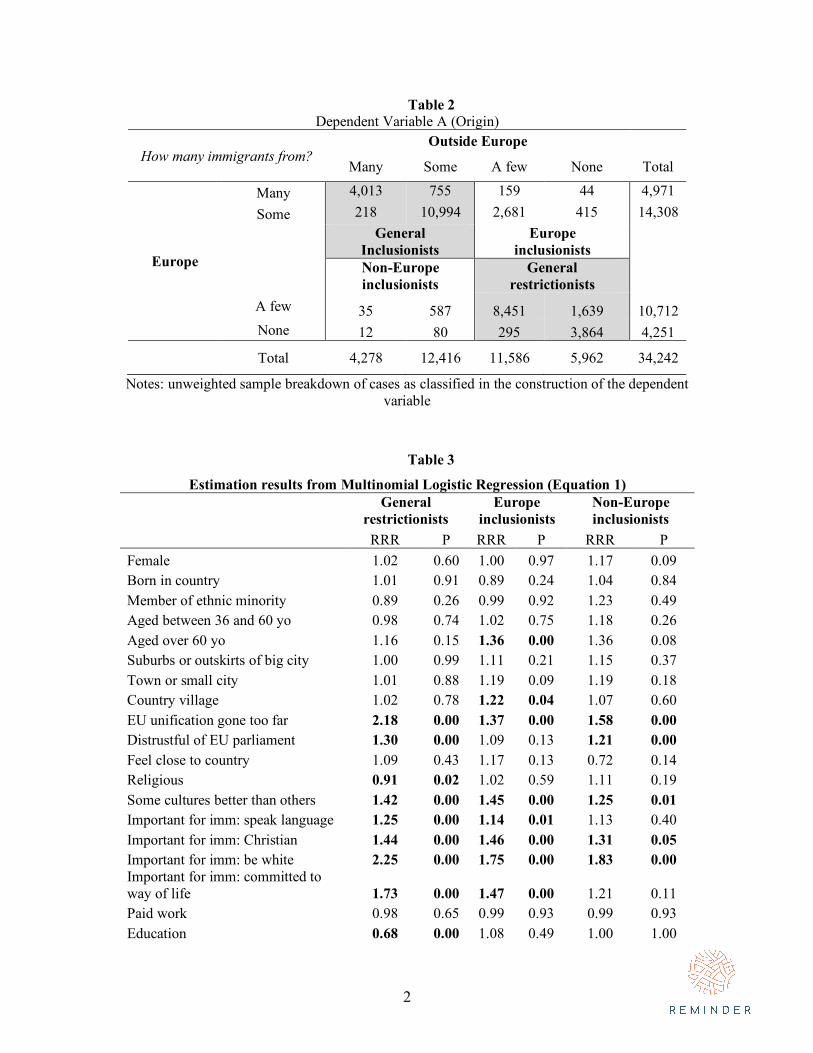
2
Table 2 Dependent Variable A (Origin)
How many immigrants from? Outside Europe
Many Some A few None Total
Europe
Many 4,013 755 159 44 4,971 Some 218 10,994 2,681 415 14,308
General Inclusionists
Europe inclusionists
Non-Europe inclusionists
General restrictionists
A few 35 587 8,451 1,639 10,712 None 12 80 295 3,864 4,251
Total 4,278 12,416 11,586 5,962 34,242
Notes: unweighted sample breakdown of cases as classified in the construction of the dependent variable
Table 3
Estimation results from Multinomial Logistic Regression (Equation 1)
General
restrictionists Europe
inclusionists Non-Europe inclusionists
RRR P RRR P RRR P Female 1.02 0.60 1.00 0.97 1.17 0.09 Born in country 1.01 0.91 0.89 0.24 1.04 0.84 Member of ethnic minority 0.89 0.26 0.99 0.92 1.23 0.49 Aged between 36 and 60 yo 0.98 0.74 1.02 0.75 1.18 0.26 Aged over 60 yo 1.16 0.15 1.36 0.00 1.36 0.08 Suburbs or outskirts of big city 1.00 0.99 1.11 0.21 1.15 0.37 Town or small city 1.01 0.88 1.19 0.09 1.19 0.18 Country village 1.02 0.78 1.22 0.04 1.07 0.60 EU unification gone too far 2.18 0.00 1.37 0.00 1.58 0.00 Distrustful of EU parliament 1.30 0.00 1.09 0.13 1.21 0.00 Feel close to country 1.09 0.43 1.17 0.13 0.72 0.14 Religious 0.91 0.02 1.02 0.59 1.11 0.19 Some cultures better than others 1.42 0.00 1.45 0.00 1.25 0.01 Important for imm: speak language 1.25 0.00 1.14 0.01 1.13 0.40 Important for imm: Christian 1.44 0.00 1.46 0.00 1.31 0.05 Important for imm: be white 2.25 0.00 1.75 0.00 1.83 0.00 Important for imm: committed to way of life 1.73 0.00 1.47 0.00 1.21 0.11 Paid work 0.98 0.65 0.99 0.93 0.99 0.93 Education 0.68 0.00 1.08 0.49 1.00 1.00
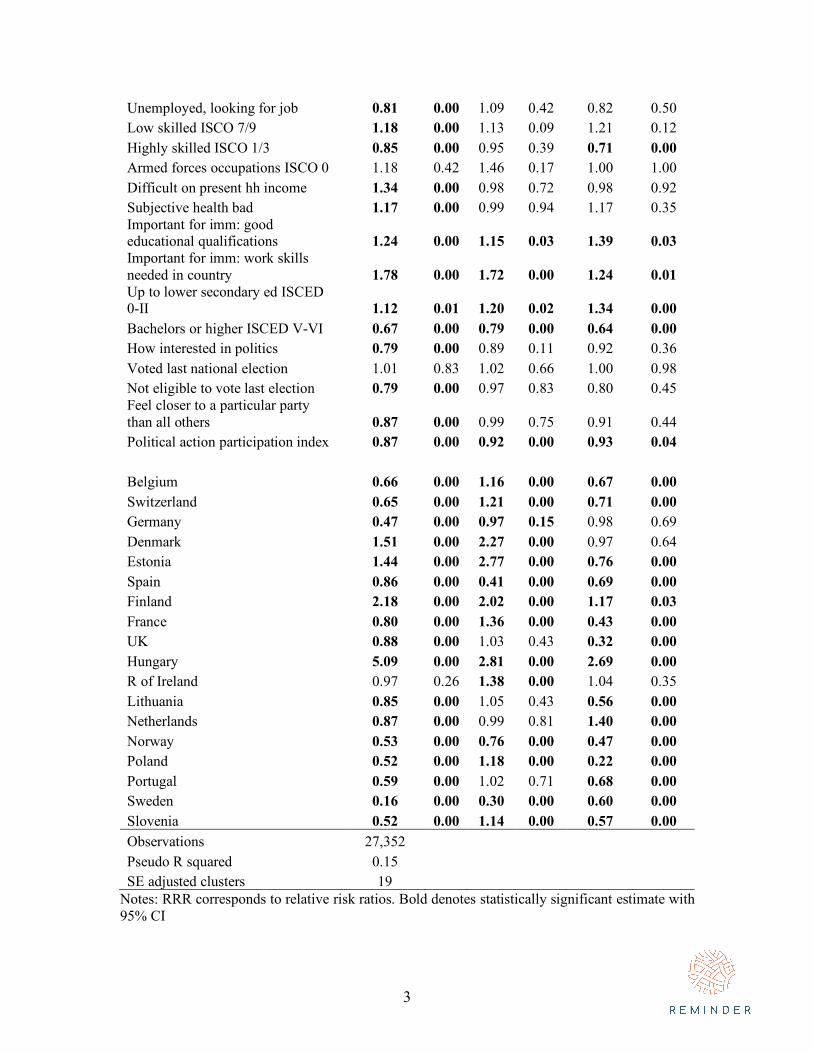
3
Unemployed, looking for job 0.81 0.00 1.09 0.42 0.82 0.50 Low skilled ISCO 7/9 1.18 0.00 1.13 0.09 1.21 0.12 Highly skilled ISCO 1/3 0.85 0.00 0.95 0.39 0.71 0.00 Armed forces occupations ISCO 0 1.18 0.42 1.46 0.17 1.00 1.00 Difficult on present hh income 1.34 0.00 0.98 0.72 0.98 0.92 Subjective health bad 1.17 0.00 0.99 0.94 1.17 0.35 Important for imm: good educational qualifications 1.24 0.00 1.15 0.03 1.39 0.03 Important for imm: work skills needed in country 1.78 0.00 1.72 0.00 1.24 0.01 Up to lower secondary ed ISCED 0-II 1.12 0.01 1.20 0.02 1.34 0.00 Bachelors or higher ISCED V-VI 0.67 0.00 0.79 0.00 0.64 0.00 How interested in politics 0.79 0.00 0.89 0.11 0.92 0.36 Voted last national election 1.01 0.83 1.02 0.66 1.00 0.98 Not eligible to vote last election 0.79 0.00 0.97 0.83 0.80 0.45 Feel closer to a particular party than all others 0.87 0.00 0.99 0.75 0.91 0.44 Political action participation index 0.87 0.00 0.92 0.00 0.93 0.04
Belgium 0.66 0.00 1.16 0.00 0.67 0.00 Switzerland 0.65 0.00 1.21 0.00 0.71 0.00 Germany 0.47 0.00 0.97 0.15 0.98 0.69 Denmark 1.51 0.00 2.27 0.00 0.97 0.64 Estonia 1.44 0.00 2.77 0.00 0.76 0.00 Spain 0.86 0.00 0.41 0.00 0.69 0.00 Finland 2.18 0.00 2.02 0.00 1.17 0.03 France 0.80 0.00 1.36 0.00 0.43 0.00 UK 0.88 0.00 1.03 0.43 0.32 0.00 Hungary 5.09 0.00 2.81 0.00 2.69 0.00 R of Ireland 0.97 0.26 1.38 0.00 1.04 0.35 Lithuania 0.85 0.00 1.05 0.43 0.56 0.00 Netherlands 0.87 0.00 0.99 0.81 1.40 0.00 Norway 0.53 0.00 0.76 0.00 0.47 0.00 Poland 0.52 0.00 1.18 0.00 0.22 0.00 Portugal 0.59 0.00 1.02 0.71 0.68 0.00 Sweden 0.16 0.00 0.30 0.00 0.60 0.00 Slovenia 0.52 0.00 1.14 0.00 0.57 0.00 Observations 27,352 Pseudo R squared 0.15 SE adjusted clusters 19
Notes: RRR corresponds to relative risk ratios. Bold denotes statistically significant estimate with 95% CI
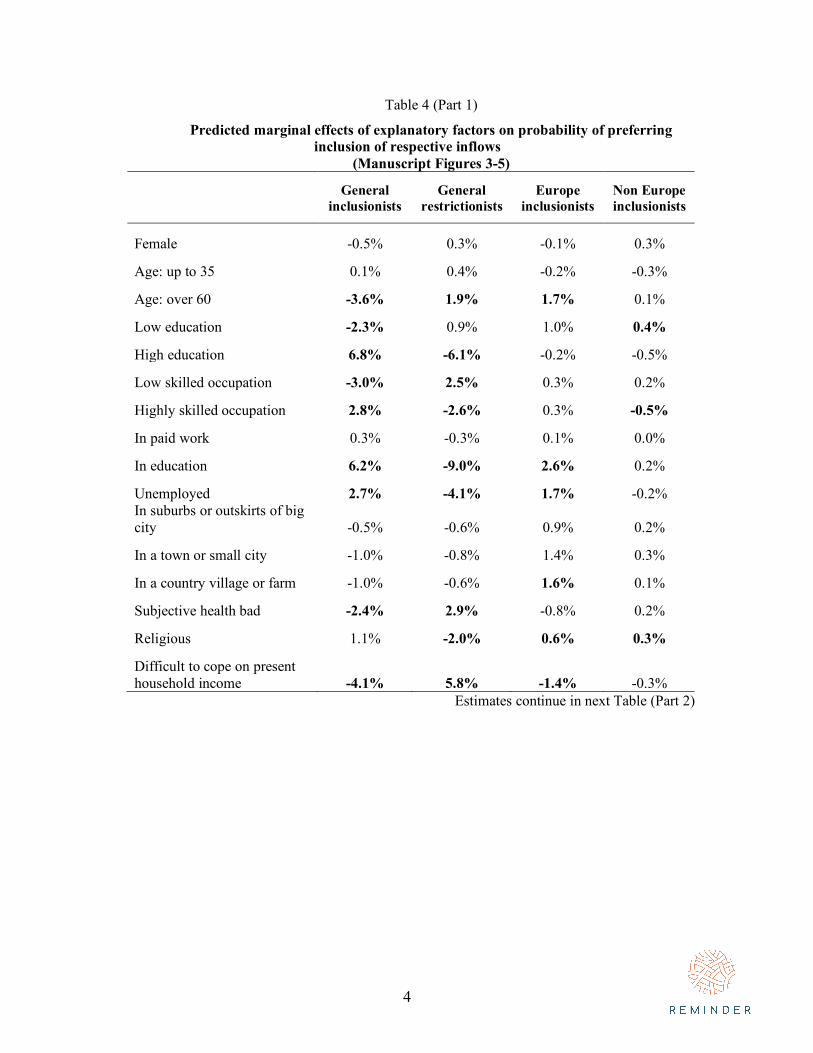
4
Table 4 (Part 1)
Predicted marginal effects of explanatory factors on probability of preferring inclusion of respective inflows
(Manuscript Figures 3-5)
General inclusionists
General restrictionists
Europe inclusionists
Non Europe inclusionists
Female -0.5% 0.3% -0.1% 0.3%
Age: up to 35 0.1% 0.4% -0.2% -0.3%
Age: over 60 -3.6% 1.9% 1.7% 0.1%
Low education -2.3% 0.9% 1.0% 0.4%
High education 6.8% -6.1% -0.2% -0.5%
Low skilled occupation -3.0% 2.5% 0.3% 0.2%
Highly skilled occupation 2.8% -2.6% 0.3% -0.5%
In paid work 0.3% -0.3% 0.1% 0.0%
In education 6.2% -9.0% 2.6% 0.2%
Unemployed 2.7% -4.1% 1.7% -0.2% In suburbs or outskirts of big city -0.5% -0.6% 0.9% 0.2%
In a town or small city -1.0% -0.8% 1.4% 0.3%
In a country village or farm -1.0% -0.6% 1.6% 0.1%
Subjective health bad -2.4% 2.9% -0.8% 0.2%
Religious 1.1% -2.0% 0.6% 0.3%
Difficult to cope on present household income -4.1% 5.8% -1.4% -0.3%
Estimates continue in next Table (Part 2)
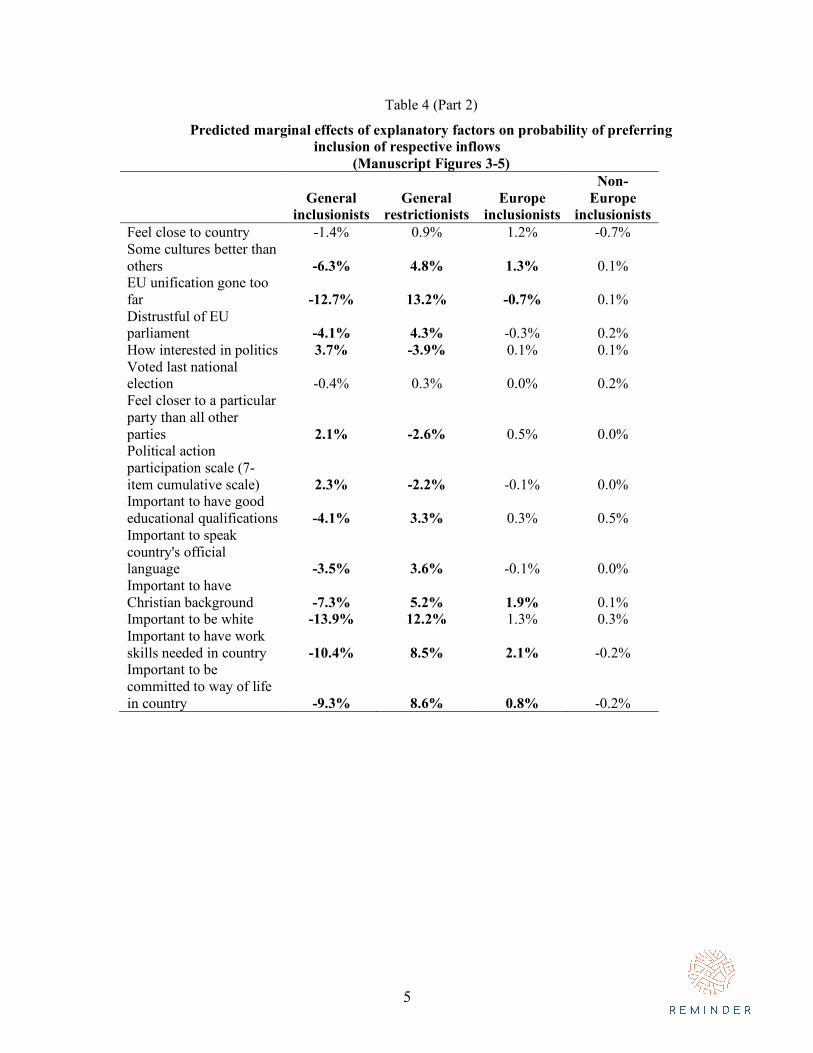
5
Table 4 (Part 2)
Predicted marginal effects of explanatory factors on probability of preferring inclusion of respective inflows
(Manuscript Figures 3-5)
General
inclusionists General
restrictionists Europe
inclusionists
Non-Europe
inclusionists Feel close to country -1.4% 0.9% 1.2% -0.7% Some cultures better than others -6.3% 4.8% 1.3% 0.1% EU unification gone too far -12.7% 13.2% -0.7% 0.1% Distrustful of EU parliament -4.1% 4.3% -0.3% 0.2% How interested in politics 3.7% -3.9% 0.1% 0.1% Voted last national election -0.4% 0.3% 0.0% 0.2% Feel closer to a particular party than all other parties 2.1% -2.6% 0.5% 0.0% Political action participation scale (7-item cumulative scale) 2.3% -2.2% -0.1% 0.0% Important to have good educational qualifications -4.1% 3.3% 0.3% 0.5% Important to speak country's official language -3.5% 3.6% -0.1% 0.0% Important to have Christian background -7.3% 5.2% 1.9% 0.1% Important to be white -13.9% 12.2% 1.3% 0.3% Important to have work skills needed in country -10.4% 8.5% 2.1% -0.2% Important to be committed to way of life in country -9.3% 8.6% 0.8% -0.2%
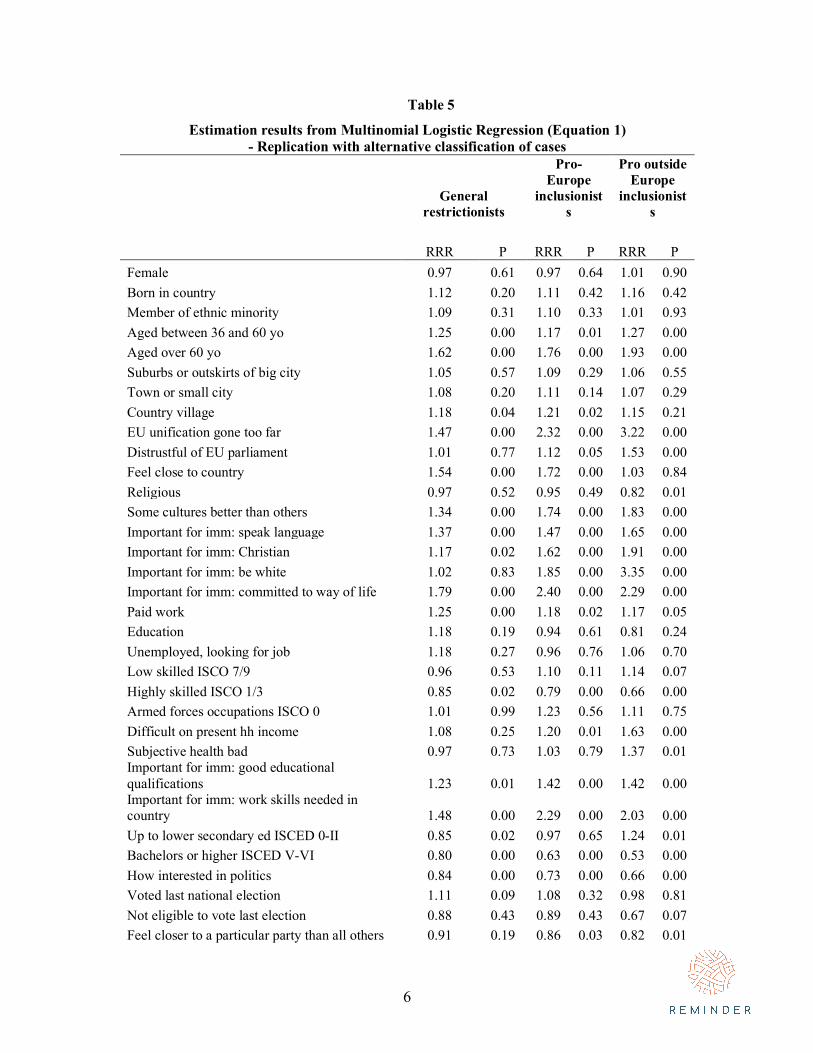
6
Table 5
Estimation results from Multinomial Logistic Regression (Equation 1) - Replication with alternative classification of cases
General
restrictionists
Pro-Europe
inclusionists
Pro outside Europe
inclusionists
RRR P RRR P RRR P Female 0.97 0.61 0.97 0.64 1.01 0.90 Born in country 1.12 0.20 1.11 0.42 1.16 0.42 Member of ethnic minority 1.09 0.31 1.10 0.33 1.01 0.93 Aged between 36 and 60 yo 1.25 0.00 1.17 0.01 1.27 0.00 Aged over 60 yo 1.62 0.00 1.76 0.00 1.93 0.00 Suburbs or outskirts of big city 1.05 0.57 1.09 0.29 1.06 0.55 Town or small city 1.08 0.20 1.11 0.14 1.07 0.29 Country village 1.18 0.04 1.21 0.02 1.15 0.21 EU unification gone too far 1.47 0.00 2.32 0.00 3.22 0.00 Distrustful of EU parliament 1.01 0.77 1.12 0.05 1.53 0.00 Feel close to country 1.54 0.00 1.72 0.00 1.03 0.84 Religious 0.97 0.52 0.95 0.49 0.82 0.01 Some cultures better than others 1.34 0.00 1.74 0.00 1.83 0.00 Important for imm: speak language 1.37 0.00 1.47 0.00 1.65 0.00 Important for imm: Christian 1.17 0.02 1.62 0.00 1.91 0.00 Important for imm: be white 1.02 0.83 1.85 0.00 3.35 0.00 Important for imm: committed to way of life 1.79 0.00 2.40 0.00 2.29 0.00 Paid work 1.25 0.00 1.18 0.02 1.17 0.05 Education 1.18 0.19 0.94 0.61 0.81 0.24 Unemployed, looking for job 1.18 0.27 0.96 0.76 1.06 0.70 Low skilled ISCO 7/9 0.96 0.53 1.10 0.11 1.14 0.07 Highly skilled ISCO 1/3 0.85 0.02 0.79 0.00 0.66 0.00 Armed forces occupations ISCO 0 1.01 0.99 1.23 0.56 1.11 0.75 Difficult on present hh income 1.08 0.25 1.20 0.01 1.63 0.00 Subjective health bad 0.97 0.73 1.03 0.79 1.37 0.01 Important for imm: good educational qualifications 1.23 0.01 1.42 0.00 1.42 0.00 Important for imm: work skills needed in country 1.48 0.00 2.29 0.00 2.03 0.00 Up to lower secondary ed ISCED 0-II 0.85 0.02 0.97 0.65 1.24 0.01 Bachelors or higher ISCED V-VI 0.80 0.00 0.63 0.00 0.53 0.00 How interested in politics 0.84 0.00 0.73 0.00 0.66 0.00 Voted last national election 1.11 0.09 1.08 0.32 0.98 0.81 Not eligible to vote last election 0.88 0.43 0.89 0.43 0.67 0.07 Feel closer to a particular party than all others 0.91 0.19 0.86 0.03 0.82 0.01
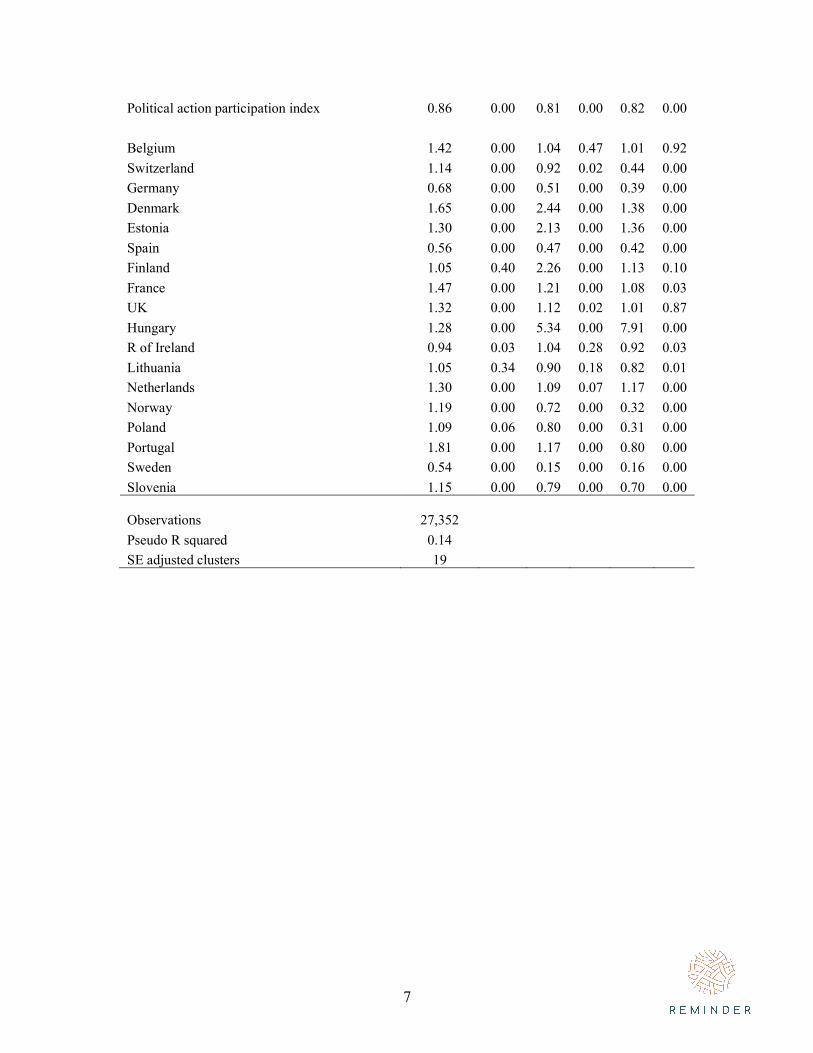
7
Political action participation index 0.86 0.00 0.81 0.00 0.82 0.00
Belgium 1.42 0.00 1.04 0.47 1.01 0.92 Switzerland 1.14 0.00 0.92 0.02 0.44 0.00 Germany 0.68 0.00 0.51 0.00 0.39 0.00 Denmark 1.65 0.00 2.44 0.00 1.38 0.00 Estonia 1.30 0.00 2.13 0.00 1.36 0.00 Spain 0.56 0.00 0.47 0.00 0.42 0.00 Finland 1.05 0.40 2.26 0.00 1.13 0.10 France 1.47 0.00 1.21 0.00 1.08 0.03 UK 1.32 0.00 1.12 0.02 1.01 0.87 Hungary 1.28 0.00 5.34 0.00 7.91 0.00 R of Ireland 0.94 0.03 1.04 0.28 0.92 0.03 Lithuania 1.05 0.34 0.90 0.18 0.82 0.01 Netherlands 1.30 0.00 1.09 0.07 1.17 0.00 Norway 1.19 0.00 0.72 0.00 0.32 0.00 Poland 1.09 0.06 0.80 0.00 0.31 0.00 Portugal 1.81 0.00 1.17 0.00 0.80 0.00 Sweden 0.54 0.00 0.15 0.00 0.16 0.00 Slovenia 1.15 0.00 0.79 0.00 0.70 0.00
Observations
27,352 Pseudo R squared 0.14 SE adjusted clusters 19
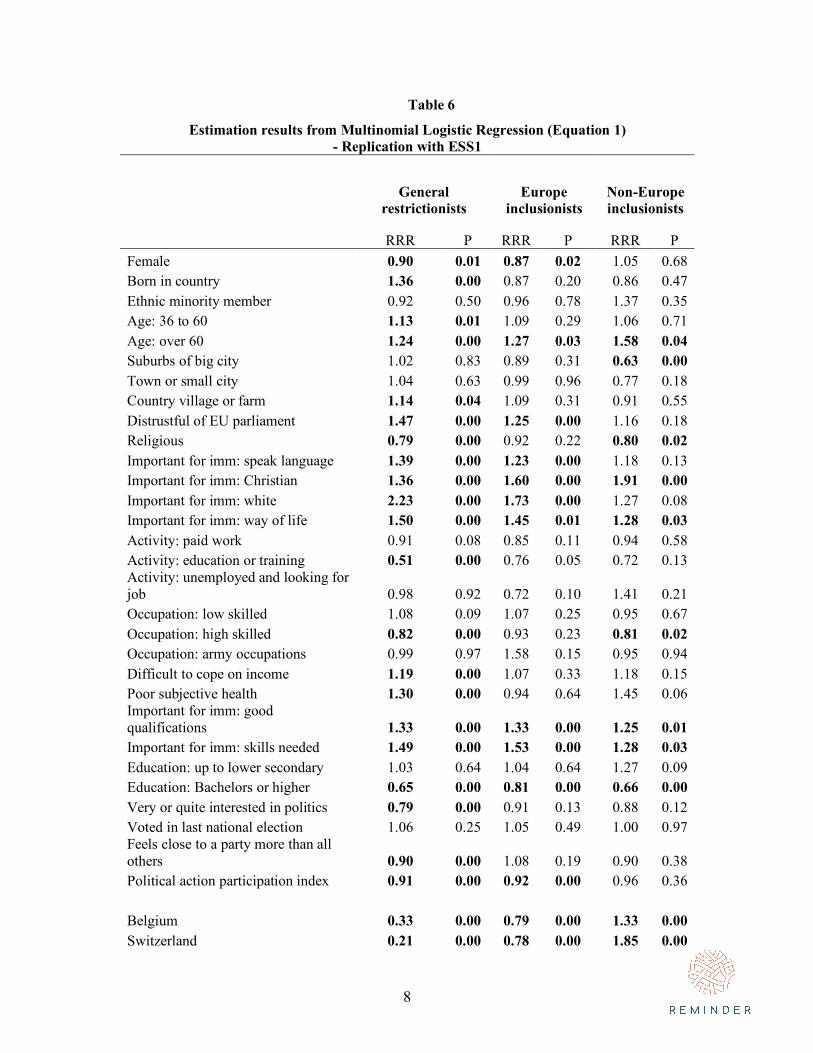
8
Table 6
Estimation results from Multinomial Logistic Regression (Equation 1) - Replication with ESS1
General
restrictionists Europe
inclusionists Non-Europe inclusionists
RRR P RRR P RRR P Female 0.90 0.01 0.87 0.02 1.05 0.68 Born in country 1.36 0.00 0.87 0.20 0.86 0.47 Ethnic minority member 0.92 0.50 0.96 0.78 1.37 0.35 Age: 36 to 60 1.13 0.01 1.09 0.29 1.06 0.71 Age: over 60 1.24 0.00 1.27 0.03 1.58 0.04 Suburbs of big city 1.02 0.83 0.89 0.31 0.63 0.00 Town or small city 1.04 0.63 0.99 0.96 0.77 0.18 Country village or farm 1.14 0.04 1.09 0.31 0.91 0.55 Distrustful of EU parliament 1.47 0.00 1.25 0.00 1.16 0.18 Religious 0.79 0.00 0.92 0.22 0.80 0.02 Important for imm: speak language 1.39 0.00 1.23 0.00 1.18 0.13 Important for imm: Christian 1.36 0.00 1.60 0.00 1.91 0.00 Important for imm: white 2.23 0.00 1.73 0.00 1.27 0.08 Important for imm: way of life 1.50 0.00 1.45 0.01 1.28 0.03 Activity: paid work 0.91 0.08 0.85 0.11 0.94 0.58 Activity: education or training 0.51 0.00 0.76 0.05 0.72 0.13 Activity: unemployed and looking for job 0.98 0.92 0.72 0.10 1.41 0.21 Occupation: low skilled 1.08 0.09 1.07 0.25 0.95 0.67 Occupation: high skilled 0.82 0.00 0.93 0.23 0.81 0.02 Occupation: army occupations 0.99 0.97 1.58 0.15 0.95 0.94 Difficult to cope on income 1.19 0.00 1.07 0.33 1.18 0.15 Poor subjective health 1.30 0.00 0.94 0.64 1.45 0.06 Important for imm: good qualifications 1.33 0.00 1.33 0.00 1.25 0.01 Important for imm: skills needed 1.49 0.00 1.53 0.00 1.28 0.03 Education: up to lower secondary 1.03 0.64 1.04 0.64 1.27 0.09 Education: Bachelors or higher 0.65 0.00 0.81 0.00 0.66 0.00 Very or quite interested in politics 0.79 0.00 0.91 0.13 0.88 0.12 Voted in last national election 1.06 0.25 1.05 0.49 1.00 0.97 Feels close to a party more than all others 0.90 0.00 1.08 0.19 0.90 0.38 Political action participation index 0.91 0.00 0.92 0.00 0.96 0.36
Belgium 0.33 0.00 0.79 0.00 1.33 0.00 Switzerland 0.21 0.00 0.78 0.00 1.85 0.00
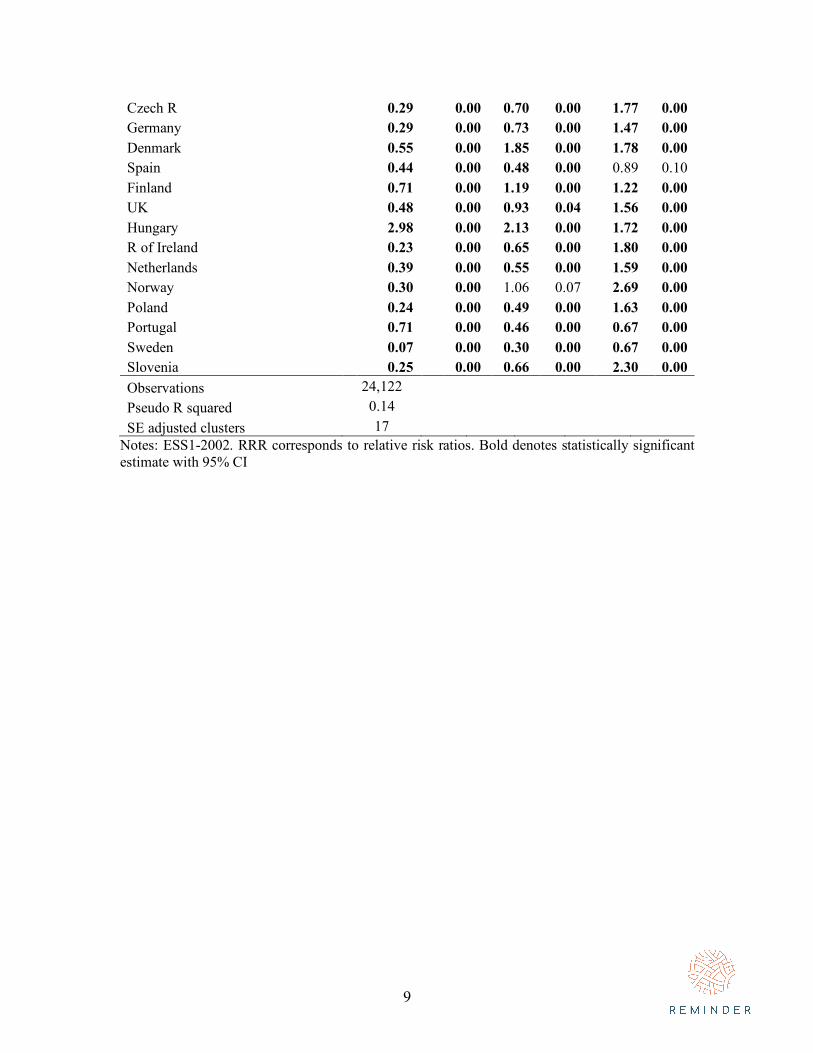
9
Czech R 0.29 0.00 0.70 0.00 1.77 0.00 Germany 0.29 0.00 0.73 0.00 1.47 0.00 Denmark 0.55 0.00 1.85 0.00 1.78 0.00 Spain 0.44 0.00 0.48 0.00 0.89 0.10 Finland 0.71 0.00 1.19 0.00 1.22 0.00 UK 0.48 0.00 0.93 0.04 1.56 0.00 Hungary 2.98 0.00 2.13 0.00 1.72 0.00 R of Ireland 0.23 0.00 0.65 0.00 1.80 0.00 Netherlands 0.39 0.00 0.55 0.00 1.59 0.00 Norway 0.30 0.00 1.06 0.07 2.69 0.00 Poland 0.24 0.00 0.49 0.00 1.63 0.00 Portugal 0.71 0.00 0.46 0.00 0.67 0.00 Sweden 0.07 0.00 0.30 0.00 0.67 0.00 Slovenia 0.25 0.00 0.66 0.00 2.30 0.00 Observations 24,122 Pseudo R squared 0.14 SE adjusted clusters 17
Notes: ESS1-2002. RRR corresponds to relative risk ratios. Bold denotes statistically significant estimate with 95% CI
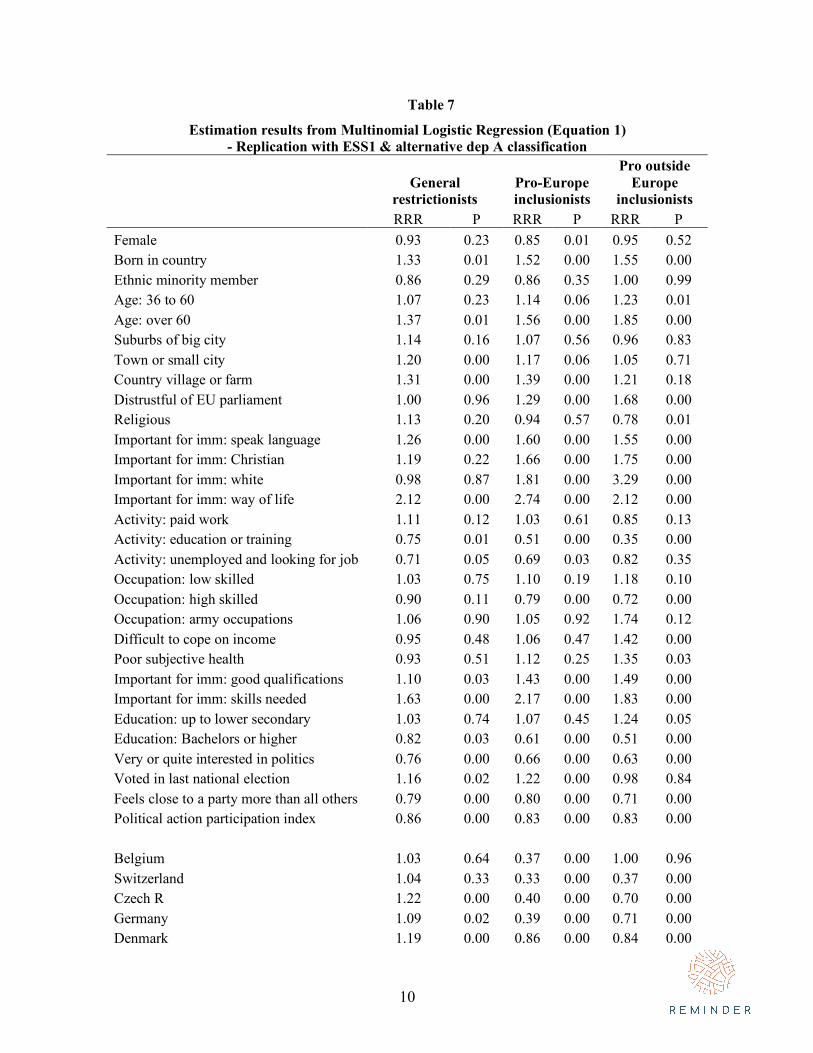
10
Table 7
Estimation results from Multinomial Logistic Regression (Equation 1) - Replication with ESS1 & alternative dep A classification
General
restrictionists Pro-Europe inclusionists
Pro outside Europe
inclusionists RRR P RRR P RRR P Female 0.93 0.23 0.85 0.01 0.95 0.52 Born in country 1.33 0.01 1.52 0.00 1.55 0.00 Ethnic minority member 0.86 0.29 0.86 0.35 1.00 0.99 Age: 36 to 60 1.07 0.23 1.14 0.06 1.23 0.01 Age: over 60 1.37 0.01 1.56 0.00 1.85 0.00 Suburbs of big city 1.14 0.16 1.07 0.56 0.96 0.83 Town or small city 1.20 0.00 1.17 0.06 1.05 0.71 Country village or farm 1.31 0.00 1.39 0.00 1.21 0.18 Distrustful of EU parliament 1.00 0.96 1.29 0.00 1.68 0.00 Religious 1.13 0.20 0.94 0.57 0.78 0.01 Important for imm: speak language 1.26 0.00 1.60 0.00 1.55 0.00 Important for imm: Christian 1.19 0.22 1.66 0.00 1.75 0.00 Important for imm: white 0.98 0.87 1.81 0.00 3.29 0.00 Important for imm: way of life 2.12 0.00 2.74 0.00 2.12 0.00 Activity: paid work 1.11 0.12 1.03 0.61 0.85 0.13 Activity: education or training 0.75 0.01 0.51 0.00 0.35 0.00 Activity: unemployed and looking for job 0.71 0.05 0.69 0.03 0.82 0.35 Occupation: low skilled 1.03 0.75 1.10 0.19 1.18 0.10 Occupation: high skilled 0.90 0.11 0.79 0.00 0.72 0.00 Occupation: army occupations 1.06 0.90 1.05 0.92 1.74 0.12 Difficult to cope on income 0.95 0.48 1.06 0.47 1.42 0.00 Poor subjective health 0.93 0.51 1.12 0.25 1.35 0.03 Important for imm: good qualifications 1.10 0.03 1.43 0.00 1.49 0.00 Important for imm: skills needed 1.63 0.00 2.17 0.00 1.83 0.00 Education: up to lower secondary 1.03 0.74 1.07 0.45 1.24 0.05 Education: Bachelors or higher 0.82 0.03 0.61 0.00 0.51 0.00 Very or quite interested in politics 0.76 0.00 0.66 0.00 0.63 0.00 Voted in last national election 1.16 0.02 1.22 0.00 0.98 0.84 Feels close to a party more than all others 0.79 0.00 0.80 0.00 0.71 0.00 Political action participation index 0.86 0.00 0.83 0.00 0.83 0.00
Belgium 1.03 0.64 0.37 0.00 1.00 0.96 Switzerland 1.04 0.33 0.33 0.00 0.37 0.00 Czech R 1.22 0.00 0.40 0.00 0.70 0.00 Germany 1.09 0.02 0.39 0.00 0.71 0.00 Denmark 1.19 0.00 0.86 0.00 0.84 0.00
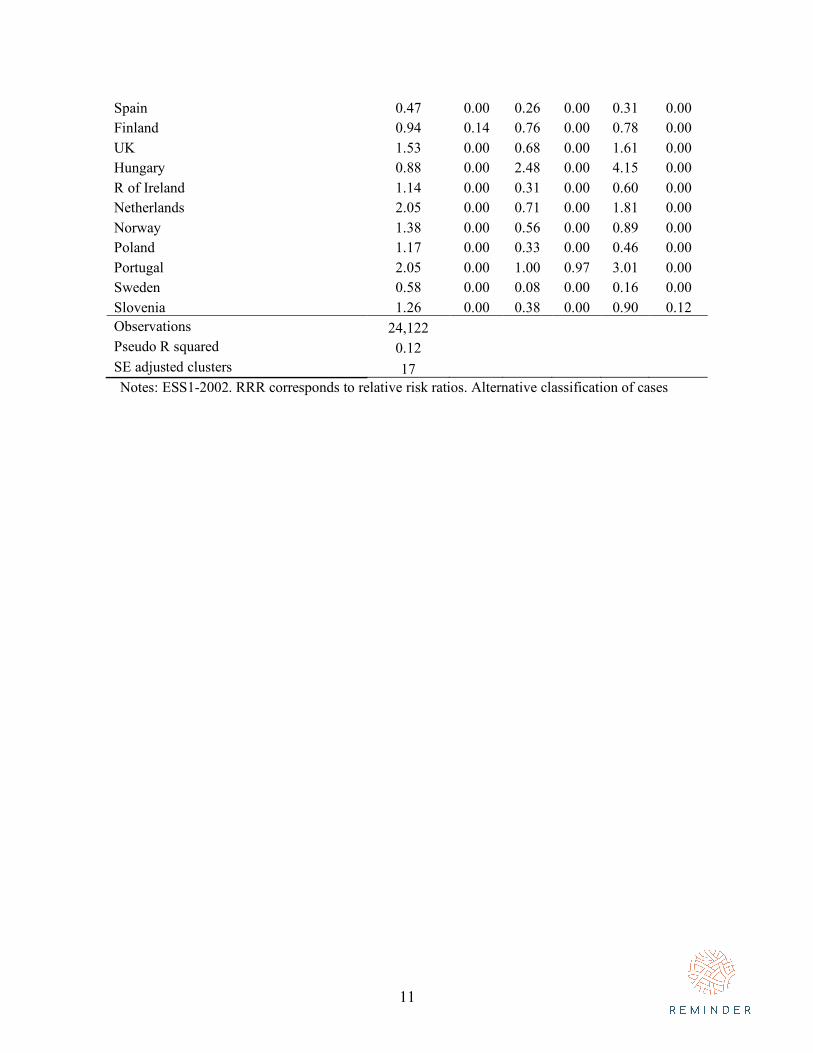
11
Spain 0.47 0.00 0.26 0.00 0.31 0.00 Finland 0.94 0.14 0.76 0.00 0.78 0.00 UK 1.53 0.00 0.68 0.00 1.61 0.00 Hungary 0.88 0.00 2.48 0.00 4.15 0.00 R of Ireland 1.14 0.00 0.31 0.00 0.60 0.00 Netherlands 2.05 0.00 0.71 0.00 1.81 0.00 Norway 1.38 0.00 0.56 0.00 0.89 0.00 Poland 1.17 0.00 0.33 0.00 0.46 0.00 Portugal 2.05 0.00 1.00 0.97 3.01 0.00 Sweden 0.58 0.00 0.08 0.00 0.16 0.00 Slovenia 1.26 0.00 0.38 0.00 0.90 0.12 Observations 24,122 Pseudo R squared 0.12 SE adjusted clusters 17 Notes: ESS1-2002. RRR corresponds to relative risk ratios. Alternative classification of cases
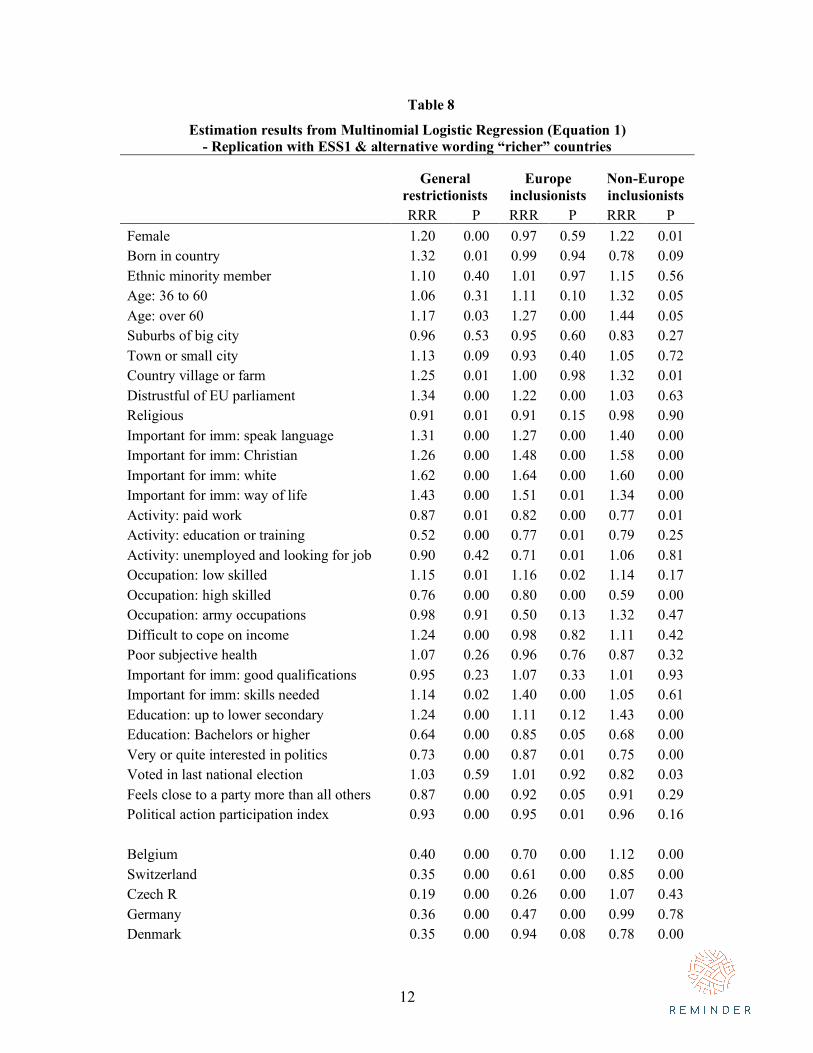
12
Table 8
Estimation results from Multinomial Logistic Regression (Equation 1) - Replication with ESS1 & alternative wording “richer” countries
General
restrictionists Europe
inclusionists Non-Europe inclusionists
RRR P RRR P RRR P Female 1.20 0.00 0.97 0.59 1.22 0.01 Born in country 1.32 0.01 0.99 0.94 0.78 0.09 Ethnic minority member 1.10 0.40 1.01 0.97 1.15 0.56 Age: 36 to 60 1.06 0.31 1.11 0.10 1.32 0.05 Age: over 60 1.17 0.03 1.27 0.00 1.44 0.05 Suburbs of big city 0.96 0.53 0.95 0.60 0.83 0.27 Town or small city 1.13 0.09 0.93 0.40 1.05 0.72 Country village or farm 1.25 0.01 1.00 0.98 1.32 0.01 Distrustful of EU parliament 1.34 0.00 1.22 0.00 1.03 0.63 Religious 0.91 0.01 0.91 0.15 0.98 0.90 Important for imm: speak language 1.31 0.00 1.27 0.00 1.40 0.00 Important for imm: Christian 1.26 0.00 1.48 0.00 1.58 0.00 Important for imm: white 1.62 0.00 1.64 0.00 1.60 0.00 Important for imm: way of life 1.43 0.00 1.51 0.01 1.34 0.00 Activity: paid work 0.87 0.01 0.82 0.00 0.77 0.01 Activity: education or training 0.52 0.00 0.77 0.01 0.79 0.25 Activity: unemployed and looking for job 0.90 0.42 0.71 0.01 1.06 0.81 Occupation: low skilled 1.15 0.01 1.16 0.02 1.14 0.17 Occupation: high skilled 0.76 0.00 0.80 0.00 0.59 0.00 Occupation: army occupations 0.98 0.91 0.50 0.13 1.32 0.47 Difficult to cope on income 1.24 0.00 0.98 0.82 1.11 0.42 Poor subjective health 1.07 0.26 0.96 0.76 0.87 0.32 Important for imm: good qualifications 0.95 0.23 1.07 0.33 1.01 0.93 Important for imm: skills needed 1.14 0.02 1.40 0.00 1.05 0.61 Education: up to lower secondary 1.24 0.00 1.11 0.12 1.43 0.00 Education: Bachelors or higher 0.64 0.00 0.85 0.05 0.68 0.00 Very or quite interested in politics 0.73 0.00 0.87 0.01 0.75 0.00 Voted in last national election 1.03 0.59 1.01 0.92 0.82 0.03 Feels close to a party more than all others 0.87 0.00 0.92 0.05 0.91 0.29 Political action participation index 0.93 0.00 0.95 0.01 0.96 0.16
Belgium 0.40 0.00 0.70 0.00 1.12 0.00 Switzerland 0.35 0.00 0.61 0.00 0.85 0.00 Czech R 0.19 0.00 0.26 0.00 1.07 0.43 Germany 0.36 0.00 0.47 0.00 0.99 0.78 Denmark 0.35 0.00 0.94 0.08 0.78 0.00
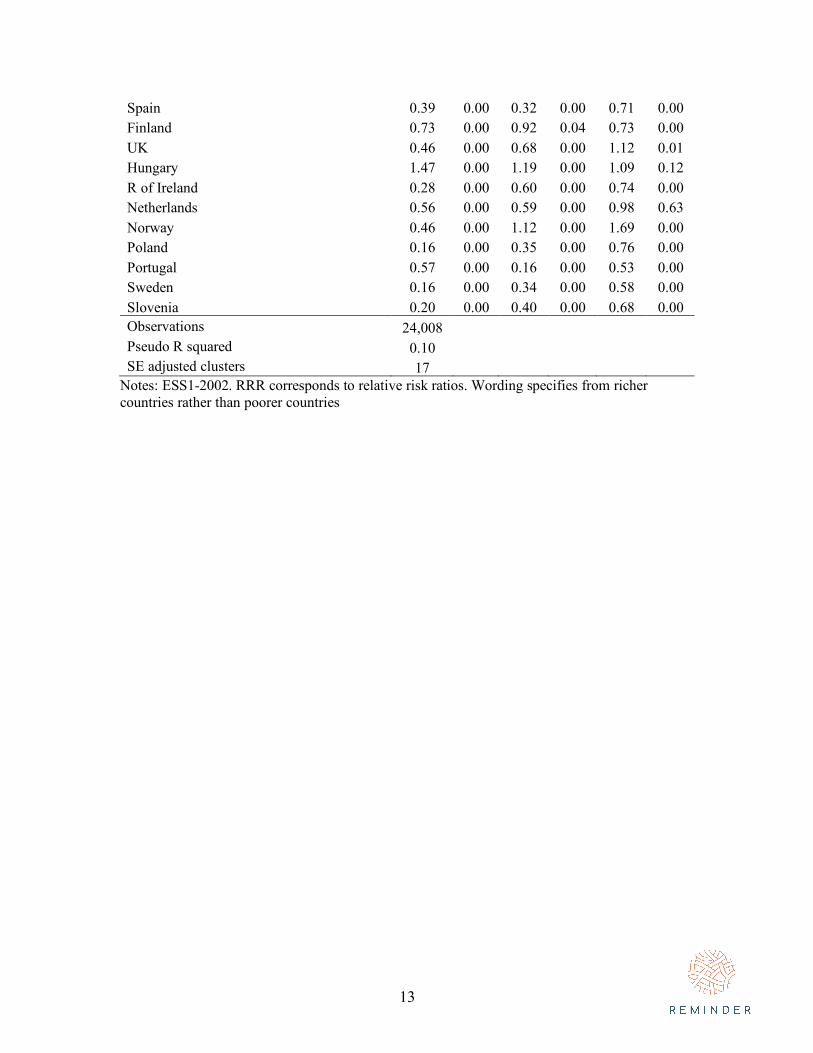
13
Spain 0.39 0.00 0.32 0.00 0.71 0.00 Finland 0.73 0.00 0.92 0.04 0.73 0.00 UK 0.46 0.00 0.68 0.00 1.12 0.01 Hungary 1.47 0.00 1.19 0.00 1.09 0.12 R of Ireland 0.28 0.00 0.60 0.00 0.74 0.00 Netherlands 0.56 0.00 0.59 0.00 0.98 0.63 Norway 0.46 0.00 1.12 0.00 1.69 0.00 Poland 0.16 0.00 0.35 0.00 0.76 0.00 Portugal 0.57 0.00 0.16 0.00 0.53 0.00 Sweden 0.16 0.00 0.34 0.00 0.58 0.00 Slovenia 0.20 0.00 0.40 0.00 0.68 0.00 Observations 24,008 Pseudo R squared 0.10 SE adjusted clusters 17
Notes: ESS1-2002. RRR corresponds to relative risk ratios. Wording specifies from richer countries rather than poorer countries
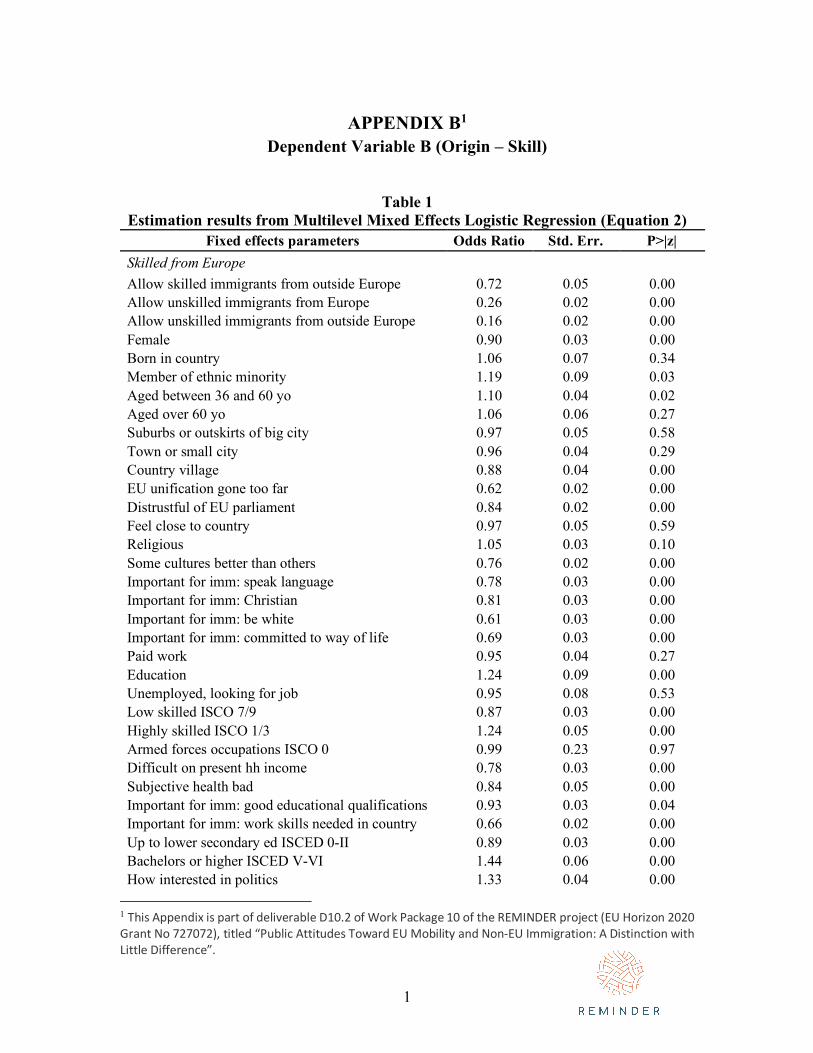
1
APPENDIX B1 Dependent Variable B (Origin – Skill)
Table 1 Estimation results from Multilevel Mixed Effects Logistic Regression (Equation 2)
Fixed effects parameters Odds Ratio Std. Err. P>|z| Skilled from Europe Allow skilled immigrants from outside Europe 0.72 0.05 0.00 Allow unskilled immigrants from Europe 0.26 0.02 0.00 Allow unskilled immigrants from outside Europe 0.16 0.02 0.00 Female 0.90 0.03 0.00 Born in country 1.06 0.07 0.34 Member of ethnic minority 1.19 0.09 0.03 Aged between 36 and 60 yo 1.10 0.04 0.02 Aged over 60 yo 1.06 0.06 0.27 Suburbs or outskirts of big city 0.97 0.05 0.58 Town or small city 0.96 0.04 0.29 Country village 0.88 0.04 0.00 EU unification gone too far 0.62 0.02 0.00 Distrustful of EU parliament 0.84 0.02 0.00 Feel close to country 0.97 0.05 0.59 Religious 1.05 0.03 0.10 Some cultures better than others 0.76 0.02 0.00 Important for imm: speak language 0.78 0.03 0.00 Important for imm: Christian 0.81 0.03 0.00 Important for imm: be white 0.61 0.03 0.00 Important for imm: committed to way of life 0.69 0.03 0.00 Paid work 0.95 0.04 0.27 Education 1.24 0.09 0.00 Unemployed, looking for job 0.95 0.08 0.53 Low skilled ISCO 7/9 0.87 0.03 0.00 Highly skilled ISCO 1/3 1.24 0.05 0.00 Armed forces occupations ISCO 0 0.99 0.23 0.97 Difficult on present hh income 0.78 0.03 0.00 Subjective health bad 0.84 0.05 0.00 Important for imm: good educational qualifications 0.93 0.03 0.04 Important for imm: work skills needed in country 0.66 0.02 0.00 Up to lower secondary ed ISCED 0-II 0.89 0.03 0.00 Bachelors or higher ISCED V-VI 1.44 0.06 0.00 How interested in politics 1.33 0.04 0.00
1 This Appendix is part of deliverable D10.2 of Work Package 10 of the REMINDER project (EU Horizon 2020 Grant No 727072), titled “Public Attitudes Toward EU Mobility and Non-EU Immigration: A Distinction with Little Difference”.
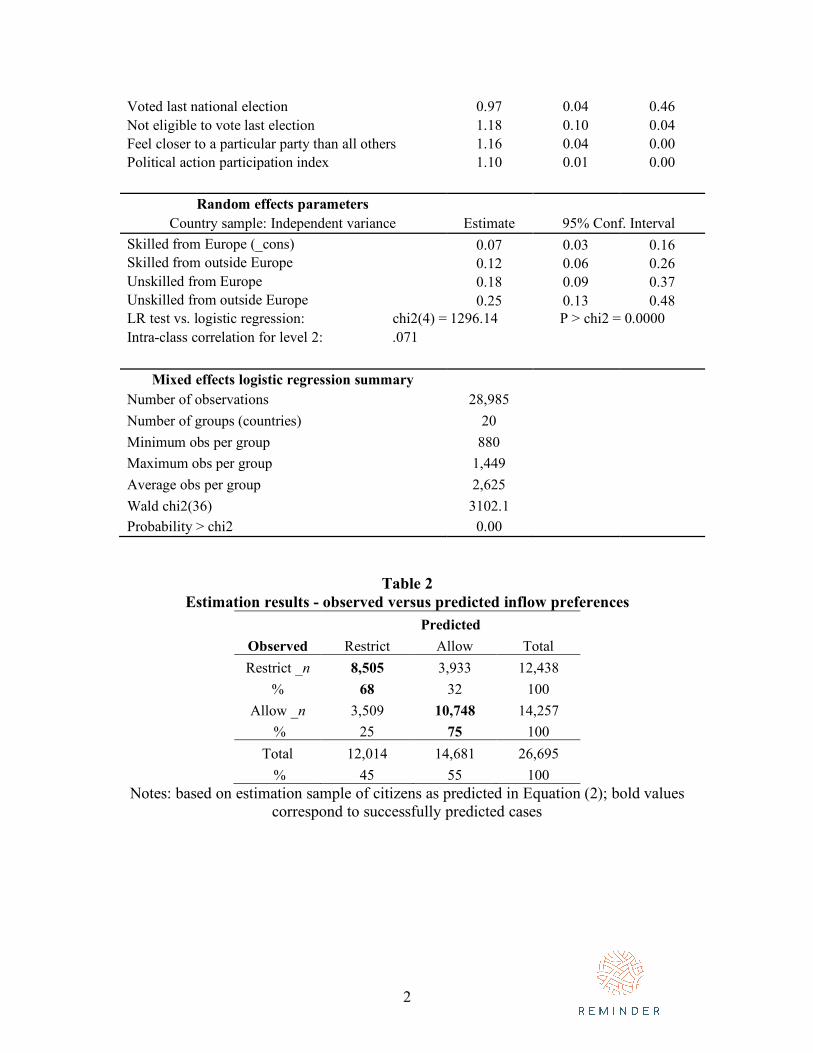
2
Voted last national election 0.97 0.04 0.46 Not eligible to vote last election 1.18 0.10 0.04 Feel closer to a particular party than all others 1.16 0.04 0.00 Political action participation index 1.10 0.01 0.00
Random effects parameters
Country sample: Independent variance Estimate 95% Conf. Interval Skilled from Europe (_cons) 0.07 0.03 0.16 Skilled from outside Europe 0.12 0.06 0.26 Unskilled from Europe 0.18 0.09 0.37 Unskilled from outside Europe 0.25 0.13 0.48 LR test vs. logistic regression: chi2(4) = 1296.14 P > chi2 = 0.0000 Intra-class correlation for level 2: .071
Mixed effects logistic regression summary
Number of observations 28,985 Number of groups (countries) 20 Minimum obs per group 880 Maximum obs per group 1,449 Average obs per group 2,625 Wald chi2(36) 3102.1 Probability > chi2 0.00
Table 2 Estimation results - observed versus predicted inflow preferences
Predicted Observed Restrict Allow Total Restrict _n 8,505 3,933 12,438
% 68 32 100 Allow _n 3,509 10,748 14,257
% 25 75 100 Total 12,014 14,681 26,695
% 45 55 100 Notes: based on estimation sample of citizens as predicted in Equation (2); bold values
correspond to successfully predicted cases
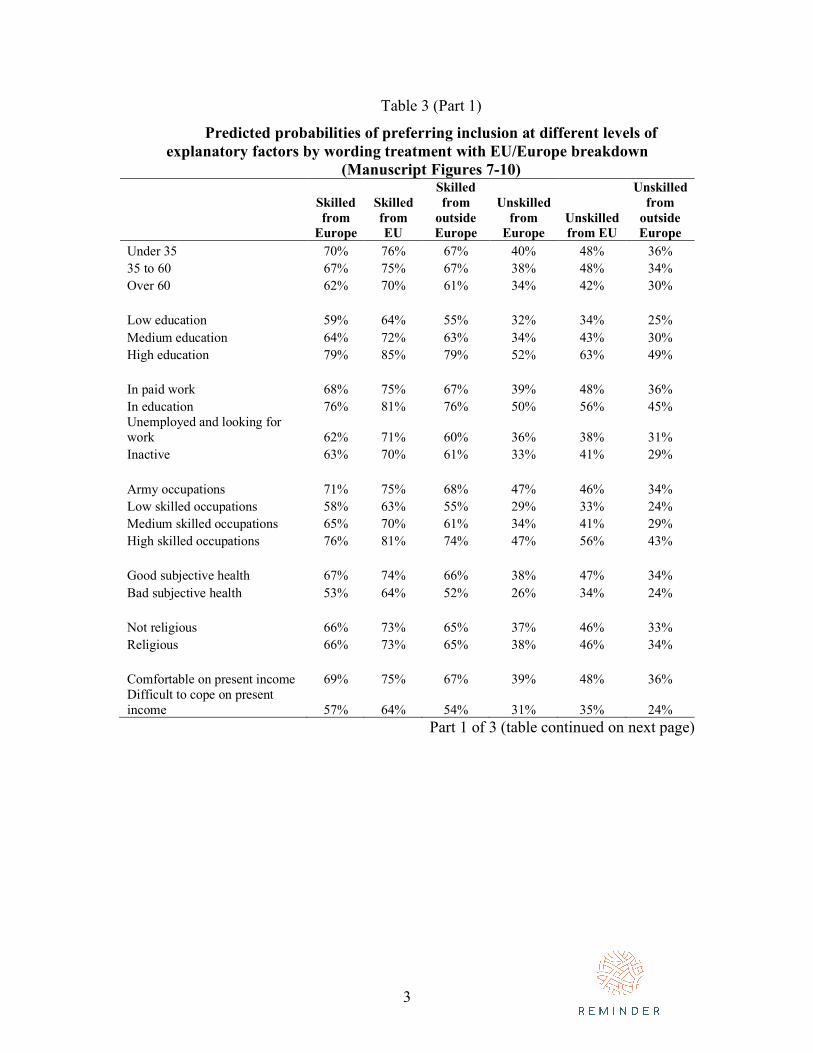
3
Table 3 (Part 1)
Predicted probabilities of preferring inclusion at different levels of explanatory factors by wording treatment with EU/Europe breakdown
(Manuscript Figures 7-10)
Skilled from
Europe
Skilled from EU
Skilled from
outside Europe
Unskilled from
Europe Unskilled from EU
Unskilled from
outside Europe
Under 35 70% 76% 67% 40% 48% 36% 35 to 60 67% 75% 67% 38% 48% 34% Over 60 62% 70% 61% 34% 42% 30%
Low education 59% 64% 55% 32% 34% 25% Medium education 64% 72% 63% 34% 43% 30% High education 79% 85% 79% 52% 63% 49%
In paid work 68% 75% 67% 39% 48% 36% In education 76% 81% 76% 50% 56% 45% Unemployed and looking for work 62% 71% 60% 36% 38% 31% Inactive 63% 70% 61% 33% 41% 29%
Army occupations 71% 75% 68% 47% 46% 34% Low skilled occupations 58% 63% 55% 29% 33% 24% Medium skilled occupations 65% 70% 61% 34% 41% 29% High skilled occupations 76% 81% 74% 47% 56% 43%
Good subjective health 67% 74% 66% 38% 47% 34% Bad subjective health 53% 64% 52% 26% 34% 24%
Not religious 66% 73% 65% 37% 46% 33% Religious 66% 73% 65% 38% 46% 34%
Comfortable on present income 69% 75% 67% 39% 48% 36% Difficult to cope on present income 57% 64% 54% 31% 35% 24%
Part 1 of 3 (table continued on next page)
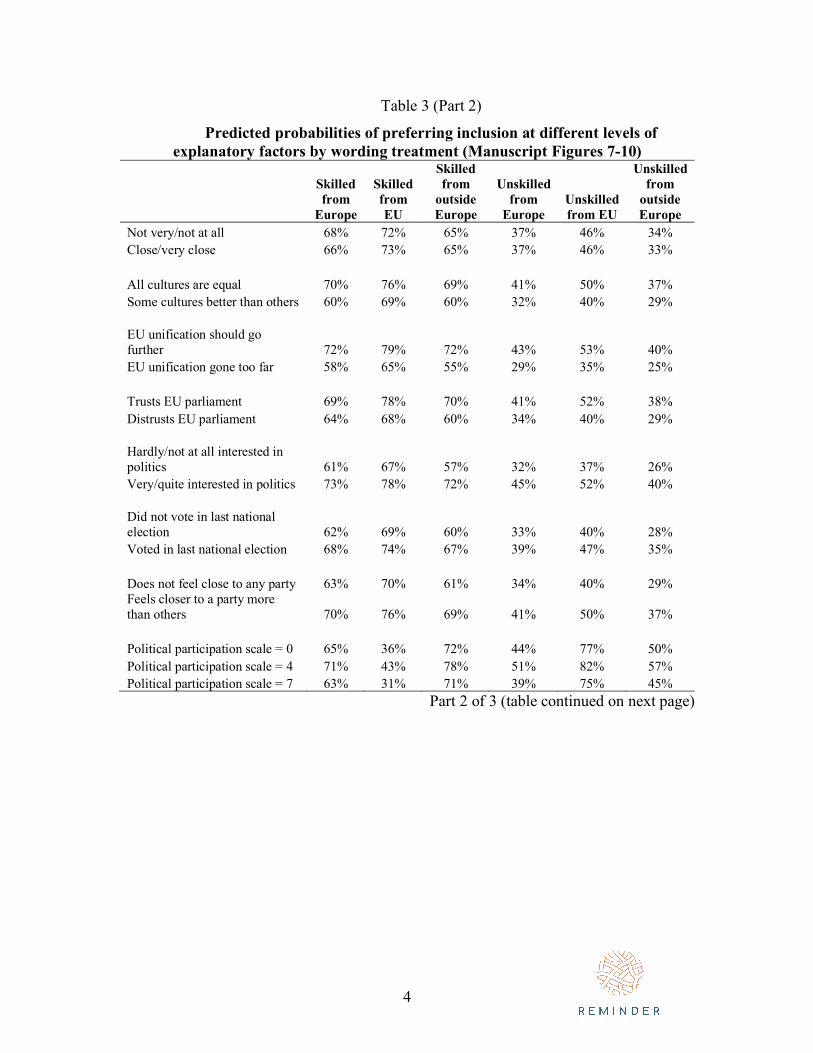
4
Table 3 (Part 2)
Predicted probabilities of preferring inclusion at different levels of explanatory factors by wording treatment (Manuscript Figures 7-10)
Skilled from
Europe
Skilled from EU
Skilled from
outside Europe
Unskilled from
Europe Unskilled from EU
Unskilled from
outside Europe
Not very/not at all 68% 72% 65% 37% 46% 34% Close/very close 66% 73% 65% 37% 46% 33%
All cultures are equal 70% 76% 69% 41% 50% 37% Some cultures better than others 60% 69% 60% 32% 40% 29%
EU unification should go further 72% 79% 72% 43% 53% 40% EU unification gone too far 58% 65% 55% 29% 35% 25%
Trusts EU parliament 69% 78% 70% 41% 52% 38% Distrusts EU parliament 64% 68% 60% 34% 40% 29%
Hardly/not at all interested in politics 61% 67% 57% 32% 37% 26% Very/quite interested in politics 73% 78% 72% 45% 52% 40%
Did not vote in last national election 62% 69% 60% 33% 40% 28% Voted in last national election 68% 74% 67% 39% 47% 35%
Does not feel close to any party 63% 70% 61% 34% 40% 29% Feels closer to a party more than others 70% 76% 69% 41% 50% 37%
Political participation scale = 0 65% 36% 72% 44% 77% 50% Political participation scale = 4 71% 43% 78% 51% 82% 57% Political participation scale = 7 63% 31% 71% 39% 75% 45%
Part 2 of 3 (table continued on next page)
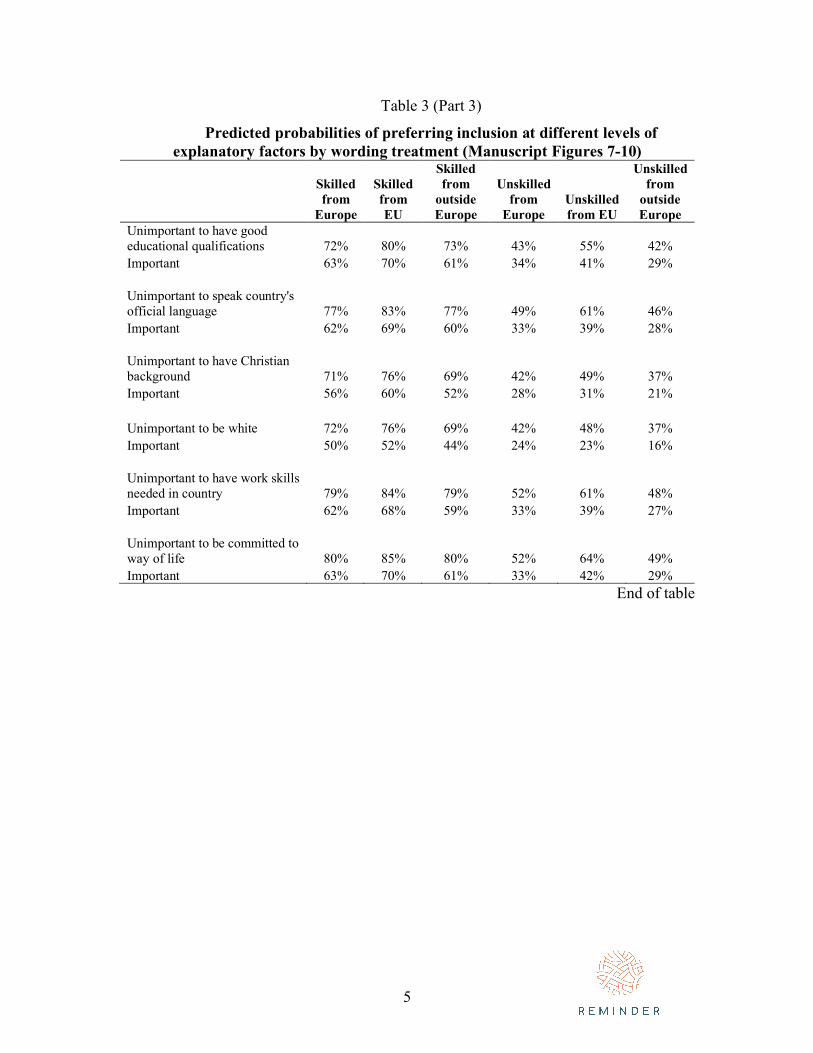
5
Table 3 (Part 3)
Predicted probabilities of preferring inclusion at different levels of explanatory factors by wording treatment (Manuscript Figures 7-10)
Skilled from
Europe
Skilled from EU
Skilled from
outside Europe
Unskilled from
Europe Unskilled from EU
Unskilled from
outside Europe
Unimportant to have good educational qualifications 72% 80% 73% 43% 55% 42% Important 63% 70% 61% 34% 41% 29%
Unimportant to speak country's official language 77% 83% 77% 49% 61% 46% Important 62% 69% 60% 33% 39% 28%
Unimportant to have Christian background 71% 76% 69% 42% 49% 37% Important 56% 60% 52% 28% 31% 21%
Unimportant to be white 72% 76% 69% 42% 48% 37% Important 50% 52% 44% 24% 23% 16%
Unimportant to have work skills needed in country 79% 84% 79% 52% 61% 48% Important 62% 68% 59% 33% 39% 27%
Unimportant to be committed to way of life 80% 85% 80% 52% 64% 49% Important 63% 70% 61% 33% 42% 29%
End of table
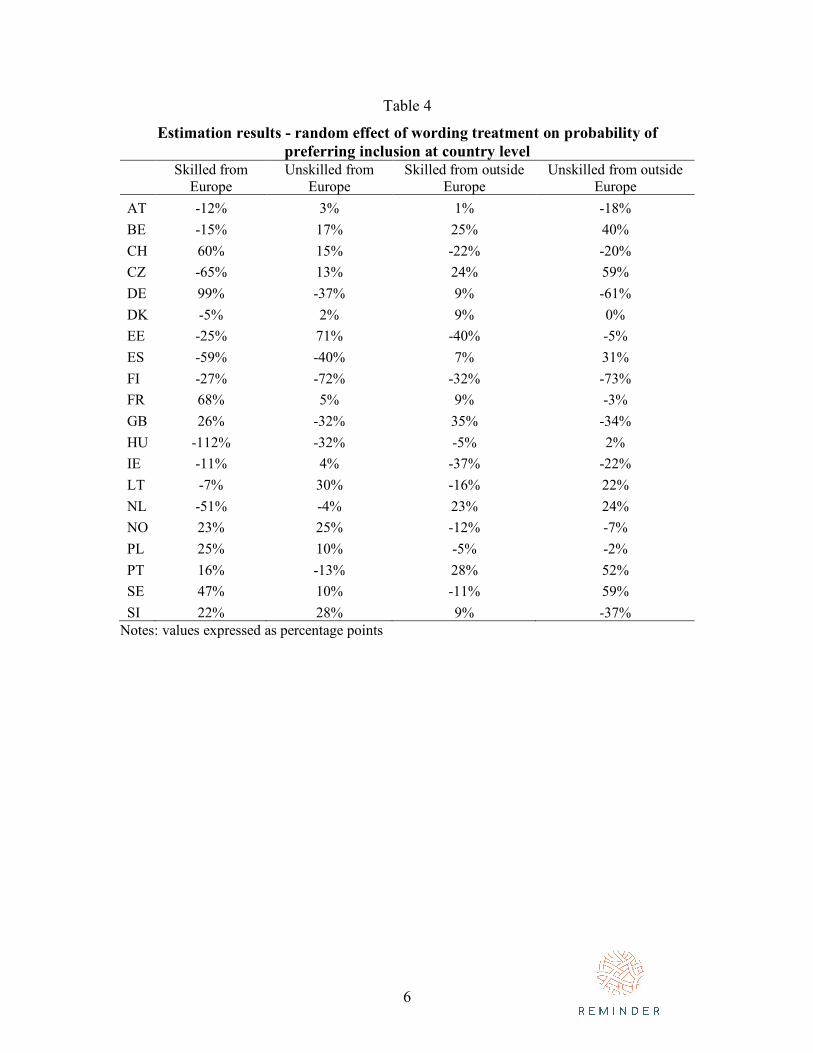
6
Table 4
Estimation results - random effect of wording treatment on probability of preferring inclusion at country level
Skilled from
Europe Unskilled from
Europe Skilled from outside
Europe Unskilled from outside
Europe AT -12% 3% 1% -18% BE -15% 17% 25% 40% CH 60% 15% -22% -20% CZ -65% 13% 24% 59% DE 99% -37% 9% -61% DK -5% 2% 9% 0% EE -25% 71% -40% -5% ES -59% -40% 7% 31% FI -27% -72% -32% -73% FR 68% 5% 9% -3% GB 26% -32% 35% -34% HU -112% -32% -5% 2% IE -11% 4% -37% -22% LT -7% 30% -16% 22% NL -51% -4% 23% 24% NO 23% 25% -12% -7% PL 25% 10% -5% -2% PT 16% -13% 28% 52% SE 47% 10% -11% 59% SI 22% 28% 9% -37%
Notes: values expressed as percentage points
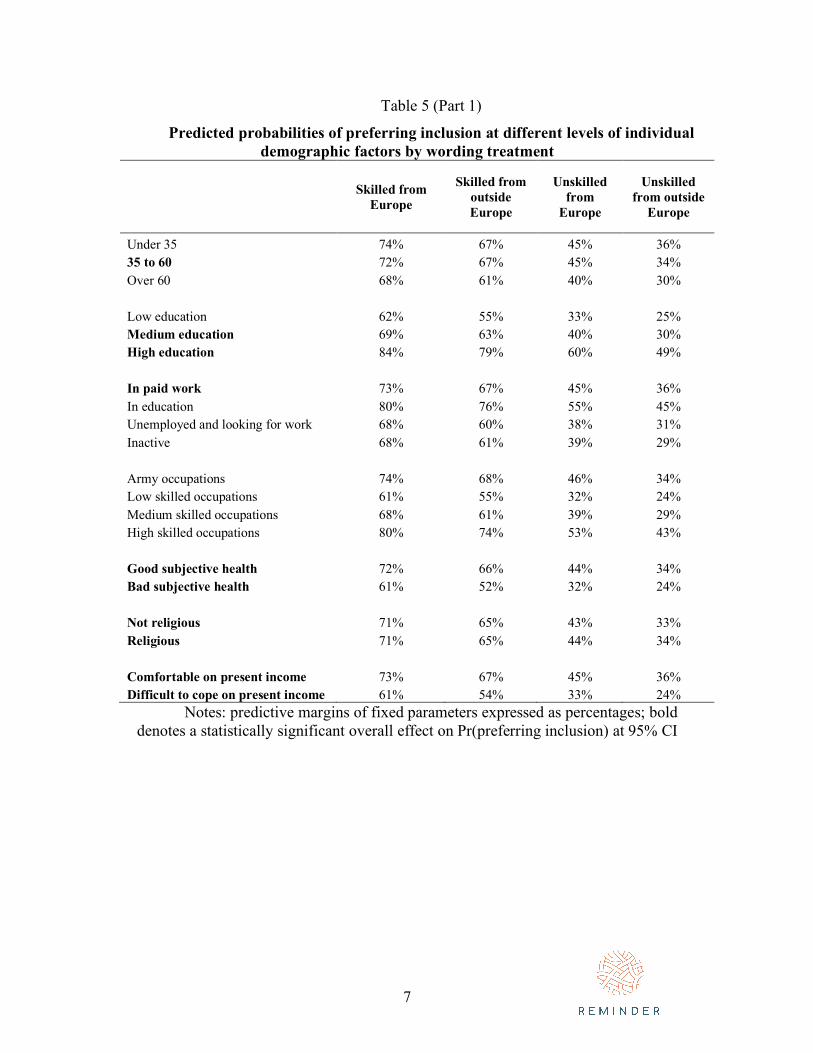
7
Table 5 (Part 1)
Predicted probabilities of preferring inclusion at different levels of individual demographic factors by wording treatment
Skilled from Europe
Skilled from outside Europe
Unskilled from
Europe
Unskilled from outside
Europe
Under 35 74% 67% 45% 36% 35 to 60 72% 67% 45% 34% Over 60 68% 61% 40% 30%
Low education 62% 55% 33% 25% Medium education 69% 63% 40% 30% High education 84% 79% 60% 49%
In paid work 73% 67% 45% 36% In education 80% 76% 55% 45% Unemployed and looking for work 68% 60% 38% 31% Inactive 68% 61% 39% 29%
Army occupations 74% 68% 46% 34% Low skilled occupations 61% 55% 32% 24% Medium skilled occupations 68% 61% 39% 29% High skilled occupations 80% 74% 53% 43%
Good subjective health 72% 66% 44% 34% Bad subjective health 61% 52% 32% 24%
Not religious 71% 65% 43% 33% Religious 71% 65% 44% 34%
Comfortable on present income 73% 67% 45% 36% Difficult to cope on present income 61% 54% 33% 24%
Notes: predictive margins of fixed parameters expressed as percentages; bold denotes a statistically significant overall effect on Pr(preferring inclusion) at 95% CI
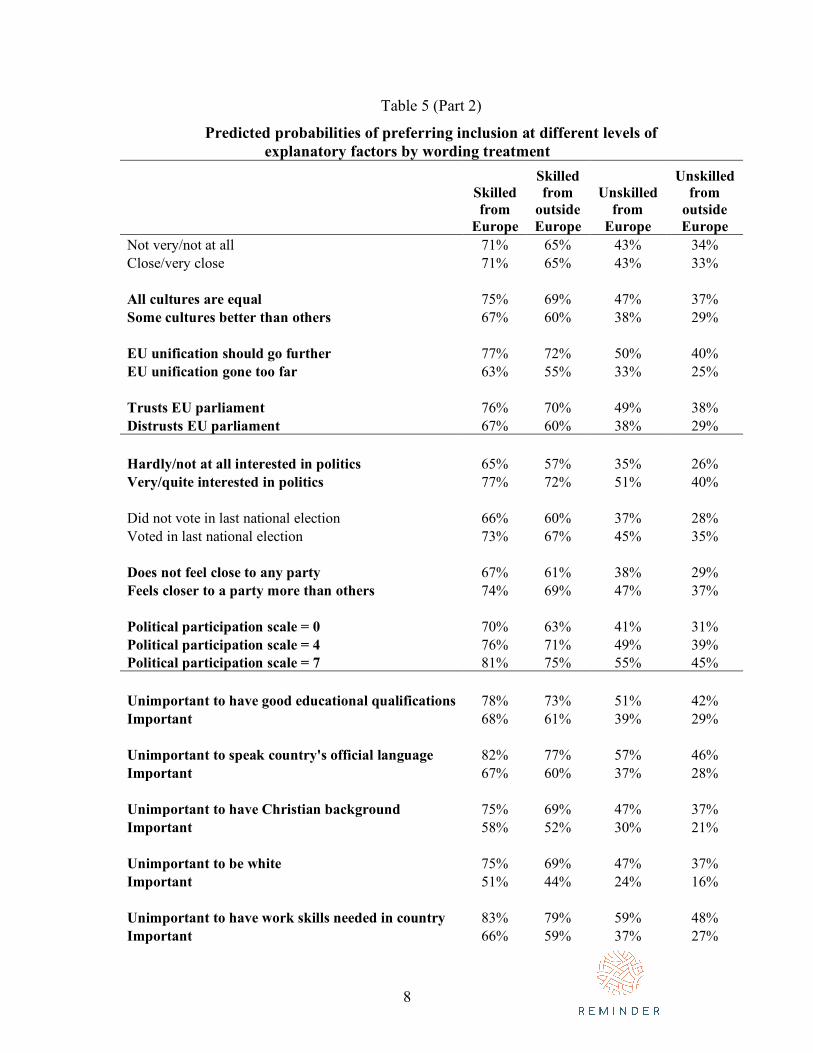
8
Table 5 (Part 2)
Predicted probabilities of preferring inclusion at different levels of explanatory factors by wording treatment
Skilled from
Europe
Skilled from
outside Europe
Unskilled from
Europe
Unskilled from
outside Europe
Not very/not at all 71% 65% 43% 34% Close/very close 71% 65% 43% 33% All cultures are equal 75% 69% 47% 37% Some cultures better than others 67% 60% 38% 29% EU unification should go further 77% 72% 50% 40% EU unification gone too far 63% 55% 33% 25% Trusts EU parliament 76% 70% 49% 38% Distrusts EU parliament 67% 60% 38% 29% Hardly/not at all interested in politics 65% 57% 35% 26% Very/quite interested in politics 77% 72% 51% 40% Did not vote in last national election 66% 60% 37% 28% Voted in last national election 73% 67% 45% 35% Does not feel close to any party 67% 61% 38% 29% Feels closer to a party more than others 74% 69% 47% 37% Political participation scale = 0 70% 63% 41% 31% Political participation scale = 4 76% 71% 49% 39% Political participation scale = 7 81% 75% 55% 45% Unimportant to have good educational qualifications 78% 73% 51% 42% Important 68% 61% 39% 29% Unimportant to speak country's official language 82% 77% 57% 46% Important 67% 60% 37% 28% Unimportant to have Christian background 75% 69% 47% 37% Important 58% 52% 30% 21% Unimportant to be white 75% 69% 47% 37% Important 51% 44% 24% 16% Unimportant to have work skills needed in country 83% 79% 59% 48% Important 66% 59% 37% 27%
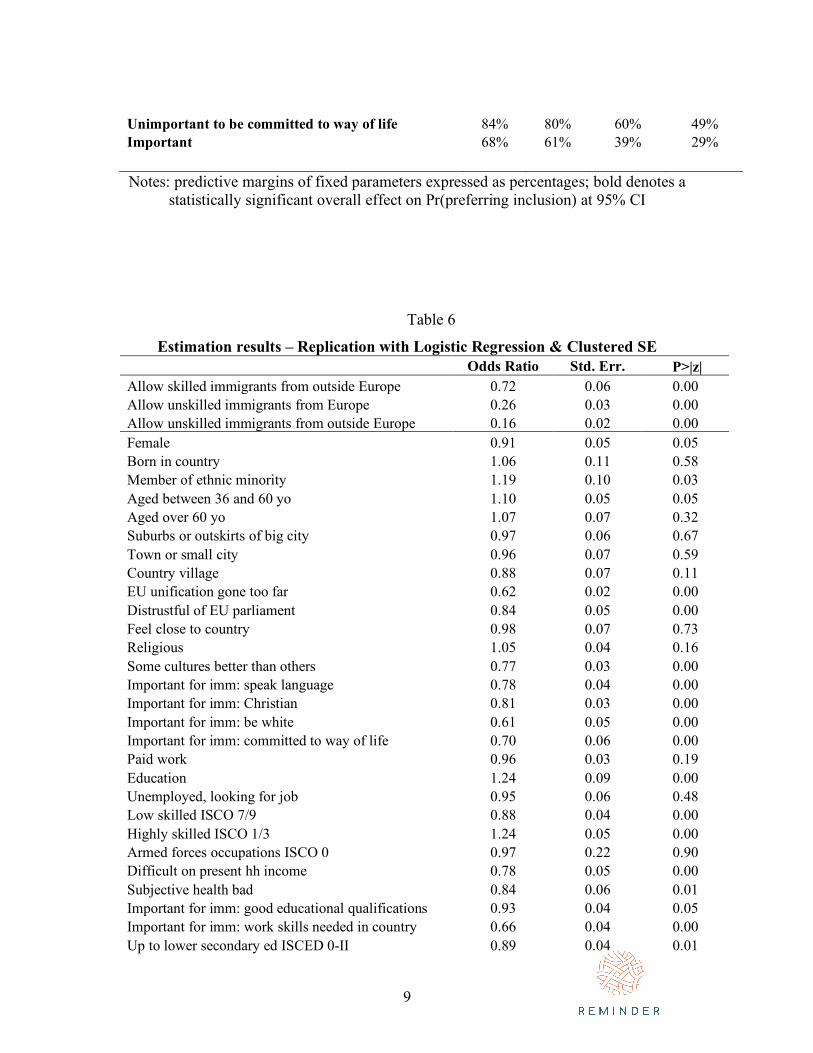
9
Unimportant to be committed to way of life 84% 80% 60% 49% Important 68% 61% 39% 29% Notes: predictive margins of fixed parameters expressed as percentages; bold denotes a
statistically significant overall effect on Pr(preferring inclusion) at 95% CI
Table 6
Estimation results – Replication with Logistic Regression & Clustered SE Odds Ratio Std. Err. P>|z| Allow skilled immigrants from outside Europe 0.72 0.06 0.00 Allow unskilled immigrants from Europe 0.26 0.03 0.00 Allow unskilled immigrants from outside Europe 0.16 0.02 0.00 Female 0.91 0.05 0.05 Born in country 1.06 0.11 0.58 Member of ethnic minority 1.19 0.10 0.03 Aged between 36 and 60 yo 1.10 0.05 0.05 Aged over 60 yo 1.07 0.07 0.32 Suburbs or outskirts of big city 0.97 0.06 0.67 Town or small city 0.96 0.07 0.59 Country village 0.88 0.07 0.11 EU unification gone too far 0.62 0.02 0.00 Distrustful of EU parliament 0.84 0.05 0.00 Feel close to country 0.98 0.07 0.73 Religious 1.05 0.04 0.16 Some cultures better than others 0.77 0.03 0.00 Important for imm: speak language 0.78 0.04 0.00 Important for imm: Christian 0.81 0.03 0.00 Important for imm: be white 0.61 0.05 0.00 Important for imm: committed to way of life 0.70 0.06 0.00 Paid work 0.96 0.03 0.19 Education 1.24 0.09 0.00 Unemployed, looking for job 0.95 0.06 0.48 Low skilled ISCO 7/9 0.88 0.04 0.00 Highly skilled ISCO 1/3 1.24 0.05 0.00 Armed forces occupations ISCO 0 0.97 0.22 0.90 Difficult on present hh income 0.78 0.05 0.00 Subjective health bad 0.84 0.06 0.01 Important for imm: good educational qualifications 0.93 0.04 0.05 Important for imm: work skills needed in country 0.66 0.04 0.00 Up to lower secondary ed ISCED 0-II 0.89 0.04 0.01
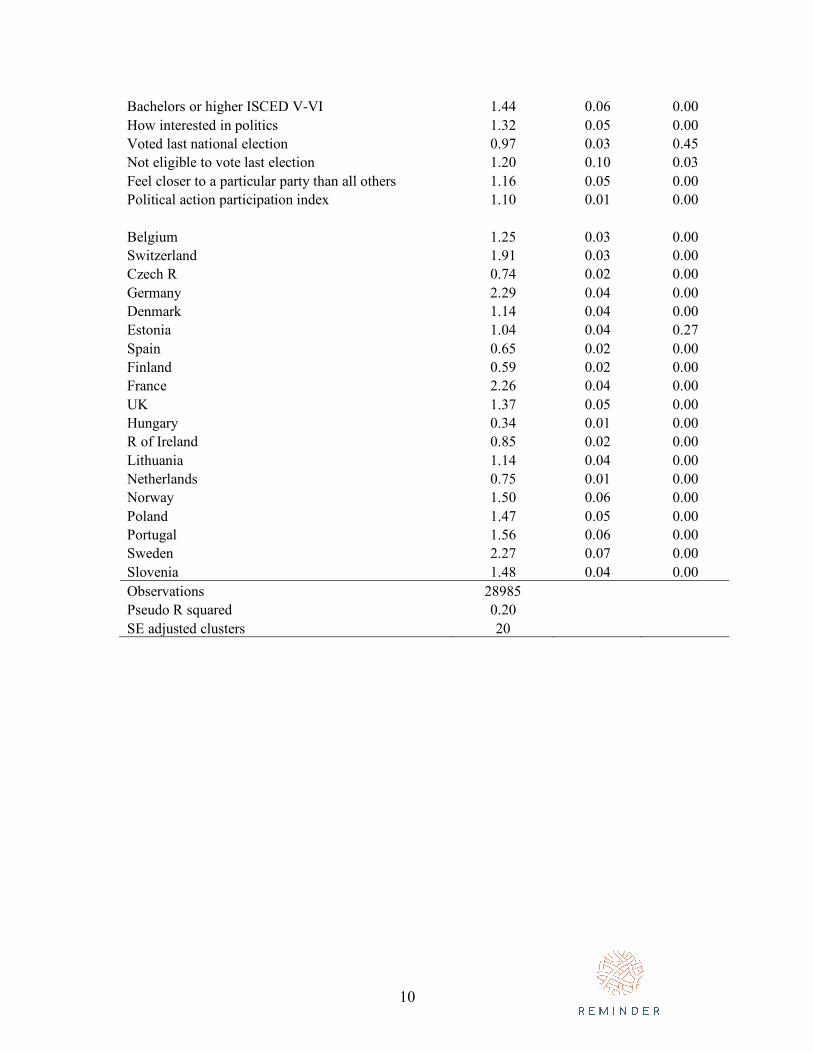
10
Bachelors or higher ISCED V-VI 1.44 0.06 0.00 How interested in politics 1.32 0.05 0.00 Voted last national election 0.97 0.03 0.45 Not eligible to vote last election 1.20 0.10 0.03 Feel closer to a particular party than all others 1.16 0.05 0.00 Political action participation index 1.10 0.01 0.00
Belgium 1.25 0.03 0.00 Switzerland 1.91 0.03 0.00 Czech R 0.74 0.02 0.00 Germany 2.29 0.04 0.00 Denmark 1.14 0.04 0.00 Estonia 1.04 0.04 0.27 Spain 0.65 0.02 0.00 Finland 0.59 0.02 0.00 France 2.26 0.04 0.00 UK 1.37 0.05 0.00 Hungary 0.34 0.01 0.00 R of Ireland 0.85 0.02 0.00 Lithuania 1.14 0.04 0.00 Netherlands 0.75 0.01 0.00 Norway 1.50 0.06 0.00 Poland 1.47 0.05 0.00 Portugal 1.56 0.06 0.00 Sweden 2.27 0.07 0.00 Slovenia 1.48 0.04 0.00 Observations 28985 Pseudo R squared 0.20 SE adjusted clusters 20
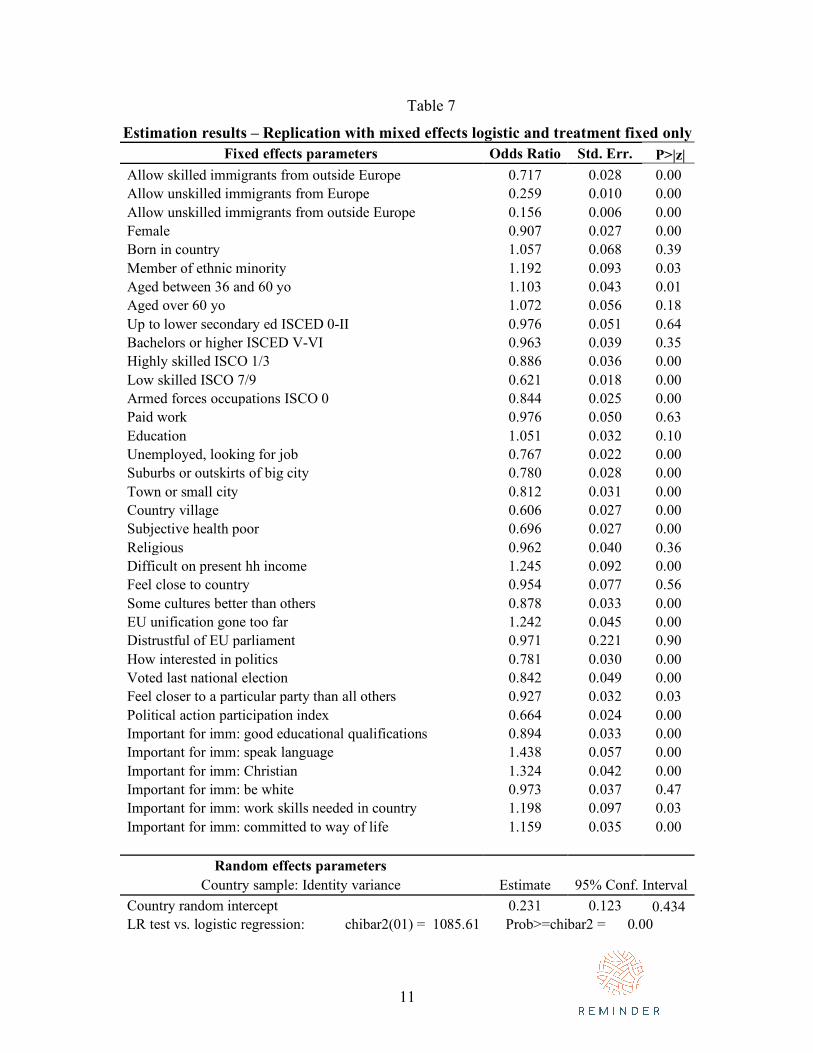
11
Table 7
Estimation results – Replication with mixed effects logistic and treatment fixed only Fixed effects parameters Odds Ratio Std. Err. P>|z|
Allow skilled immigrants from outside Europe 0.717 0.028 0.00 Allow unskilled immigrants from Europe 0.259 0.010 0.00 Allow unskilled immigrants from outside Europe 0.156 0.006 0.00 Female 0.907 0.027 0.00 Born in country 1.057 0.068 0.39 Member of ethnic minority 1.192 0.093 0.03 Aged between 36 and 60 yo 1.103 0.043 0.01 Aged over 60 yo 1.072 0.056 0.18 Up to lower secondary ed ISCED 0-II 0.976 0.051 0.64 Bachelors or higher ISCED V-VI 0.963 0.039 0.35 Highly skilled ISCO 1/3 0.886 0.036 0.00 Low skilled ISCO 7/9 0.621 0.018 0.00 Armed forces occupations ISCO 0 0.844 0.025 0.00 Paid work 0.976 0.050 0.63 Education 1.051 0.032 0.10 Unemployed, looking for job 0.767 0.022 0.00 Suburbs or outskirts of big city 0.780 0.028 0.00 Town or small city 0.812 0.031 0.00 Country village 0.606 0.027 0.00 Subjective health poor 0.696 0.027 0.00 Religious 0.962 0.040 0.36 Difficult on present hh income 1.245 0.092 0.00 Feel close to country 0.954 0.077 0.56 Some cultures better than others 0.878 0.033 0.00 EU unification gone too far 1.242 0.045 0.00 Distrustful of EU parliament 0.971 0.221 0.90 How interested in politics 0.781 0.030 0.00 Voted last national election 0.842 0.049 0.00 Feel closer to a particular party than all others 0.927 0.032 0.03 Political action participation index 0.664 0.024 0.00 Important for imm: good educational qualifications 0.894 0.033 0.00 Important for imm: speak language 1.438 0.057 0.00 Important for imm: Christian 1.324 0.042 0.00 Important for imm: be white 0.973 0.037 0.47 Important for imm: work skills needed in country 1.198 0.097 0.03 Important for imm: committed to way of life 1.159 0.035 0.00
Random effects parameters
Country sample: Identity variance Estimate 95% Conf. Interval Country random intercept 0.231 0.123 0.434 LR test vs. logistic regression: chibar2(01) = 1085.61 Prob>=chibar2 = 0.00
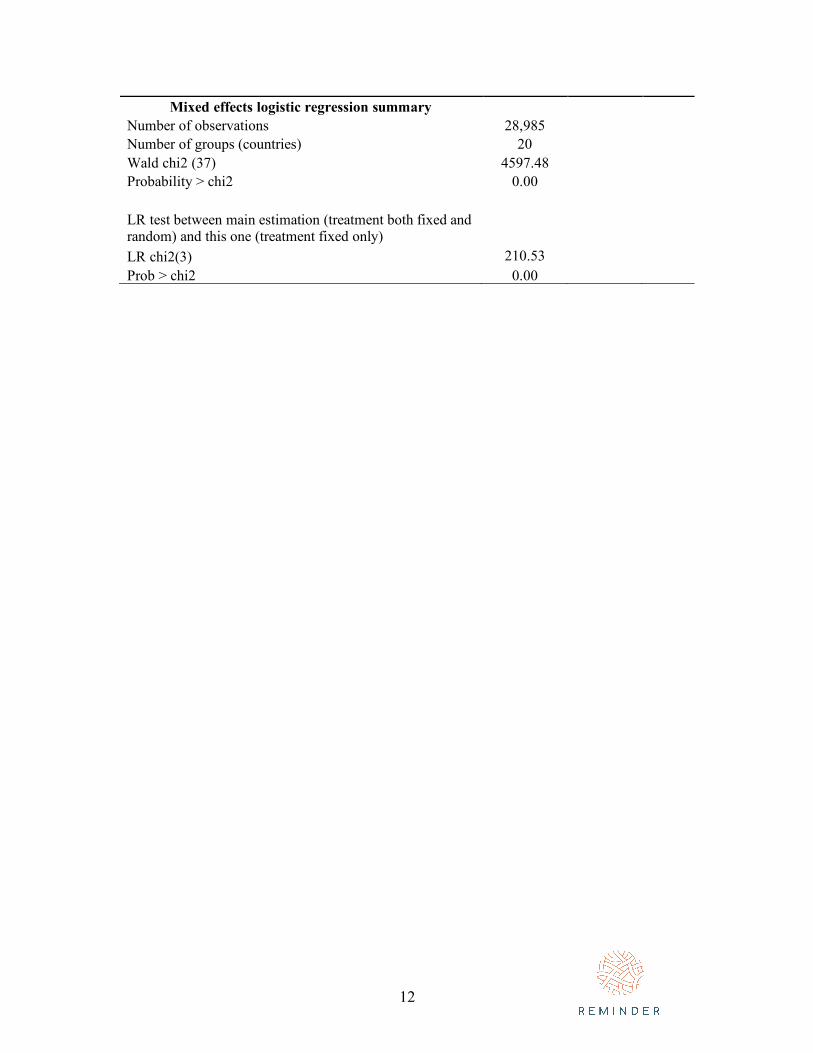
12
Mixed effects logistic regression summary Number of observations 28,985 Number of groups (countries) 20 Wald chi2 (37) 4597.48 Probability > chi2 0.00
LR test between main estimation (treatment both fixed and random) and this one (treatment fixed only)
LR chi2(3) 210.53 Prob > chi2 0.00

This project has received funding from the European Union’s Horizon 2020 research & innovation
programme under grant agreement no 727072
The REMINDER project is exploring the economic, social, institutional and policy factors that have shaped the impacts of free movement
in the EU and public debates about it.
The project is coordinated from COMPAS and includes participation from 14 consortium
partners in 9 countries across Europe