Embed Size (px)
Citation preview

Public Attitudes on Mountaintop Removal
Findings from a Survey of 1,315 Likely General Election Voters in Kentucky, West Virginia, Tennessee, and Virginia
(Including Oversamples of 150 Likely Voters Each in KY and WV)
Celinda Lake, Daniel Gotoff, Kristin Pondel, and Alex DunnLake Research Partners
Washington, DC | Berkeley, CA | New York, NYLakeResearch.com
202.776.9066
Christine MatthewsBellwether Research & Consulting
http://www.bellwether-research.com703.650.5203
Methodology• Lake Research Partners designed and administered this survey that was
conducted by telephone using professional interviewers. The survey reached a total of 1,315 likely General Election voters in Kentucky, West Virginia, Tennessee, and Virginia, including oversamples of 150 likely voters in Kentucky and 150 likely voters in West Virginia. The survey was conducted July 25th through July 31st, 2011. The margin of error for this poll is +/- 2.7%.
• Telephone numbers for the sample were generated from a file of registered voters. The sample was stratified geographically to reflect the expected turnout of voters in the 2012 General Election. The data were weighted slightly by age, education, gender, region, and party identification.
• In interpreting survey results, all sample surveys are subject to possible sampling error – that is, the results of a survey may differ from those that would be obtained if the entire population were interviewed. The size of the sampling error depends upon both the total number of respondents in the survey and the percentage distribution of responses to a particular question. For example, if a response to a given question which all respondents answered was 50%, we could be 95% confident that the true percentage would fall within plus or minus 2.7% of this percentage, or between 47.3% and 52.7%. Of course, the sampling error is greater for subgroups.

Key Findings• Voters across Kentucky, West Virginia, Tennessee, and Virginia solidly oppose
mountaintop removal coal mining by wide margins and across a host of demographic and political divides. Three-quarters support fully enforcing—and even increasing protections in—the Clean Water Act to safeguard streams, rivers, and lakes in their states from mountaintop removal coal mining. Fully 76% of voters across these four states support this proposal, including a 62% majority who feel that way strongly. Just 8% of voters oppose it. Support for this proposal is far-reaching, encompassing solid majorities of Democrats (86%), independents (76%), Republicans (71%), and Tea Party supporters (67%).
• Asked about mountaintop removal outside the context of the Clean Water Act, 38% oppose the practice compared to just 24% who support it, and another 38% of voters who are unsure. When voters are provided with a brief description of the practice, opposition takes on majority status and garners noticeable intensity. That description is as follows: “coal companies in [STATE] mine coal from mountains through a process called mountaintop removal mining where the top of a mountain is removed to extract the coal and waste is disposed in nearby valleys and streams”. In this scenario, fully 57% oppose mountaintop removal and with noticeable intensity (42% strongly oppose), compared to just 20% who support it (10% strongly). On this measure, too, public opinion crosses typical political boundaries, including 64% of Democrats, 60% of independents, and even a 51% majority of Republicans.

Key Findings• Efforts to associate opponents of mountaintop removal with economic costs fly
in the face of public skepticism. In fact, solid majorities of voters in these Appalachian states believe either that “environmental protections are often good for the economy” (40%) or “have little or no impact on the economy” (20%). Just one-quarter of voters (25%) believes that “environmental protections are often bad for the economy”.
• Perhaps it is not surprising then that simulating an engaged debate over mountaintop removal results in a 2:1 ratio of opposition to support, with fully half of voters opposed (50%, including 34% strong oppose) and just 27% in favor of the practice (including 14% strong support).
• In addition, this is a voting issue in these states, as the electorate here is overwhelmingly less likely to support elected officials who are in favor of weakening environmental regulations on mountaintop removal mining (48% less likely, 15% more likely, 37% no difference). By the same token, these voters are prepared to reward elected officials who support strengthening environmental regulations on mountaintop removal mining (48% more likely, 14% more likely, 38% no difference).
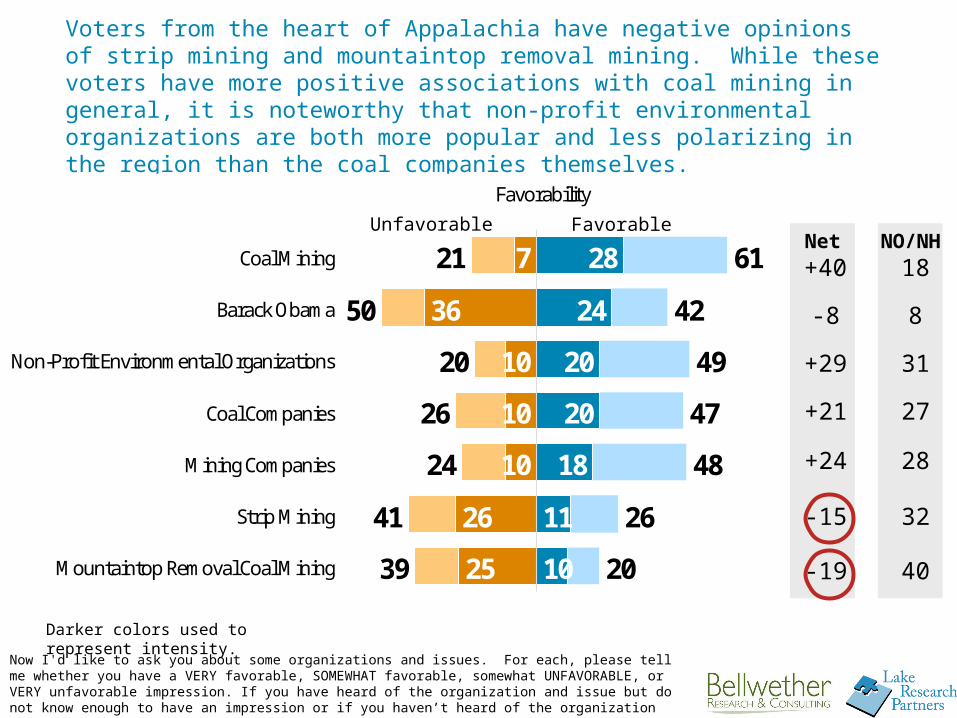
Voters from the heart of Appalachia have negative opinions of strip mining and mountaintop removal mining. While these voters have more positive associations with coal mining in general, it is noteworthy that non-profit environmental organizations are both more popular and less polarizing in the region than the coal companies themselves.
Now I'd like to ask you about some organizations and issues. For each, please tell me whether you have a VERY favorable, SOMEWHAT favorable, somewhat UNFAVORABLE, or VERY unfavorable impression. If you have heard of the organization and issue but do not know enough to have an impression or if you haven’t heard of the organization and issue, just say so, and we will move on.
Net
-8
+40
Favorability
61
42
49
47
48
26
20
21
50
20
26
24
41
39
28
24
20
20
18
11
10
10
10
26
25
36
10
7Coal Mining
Barack Obama
Non-Profit Environmental Organizations
Coal Companies
Mining Companies
Strip Mining
Mountaintop Removal Coal Mining
Unfavorable FavorableNO/NH
8
18
Darker colors used to represent intensity.
+29
+21
31
27
-19
+24
-15
28
40
32
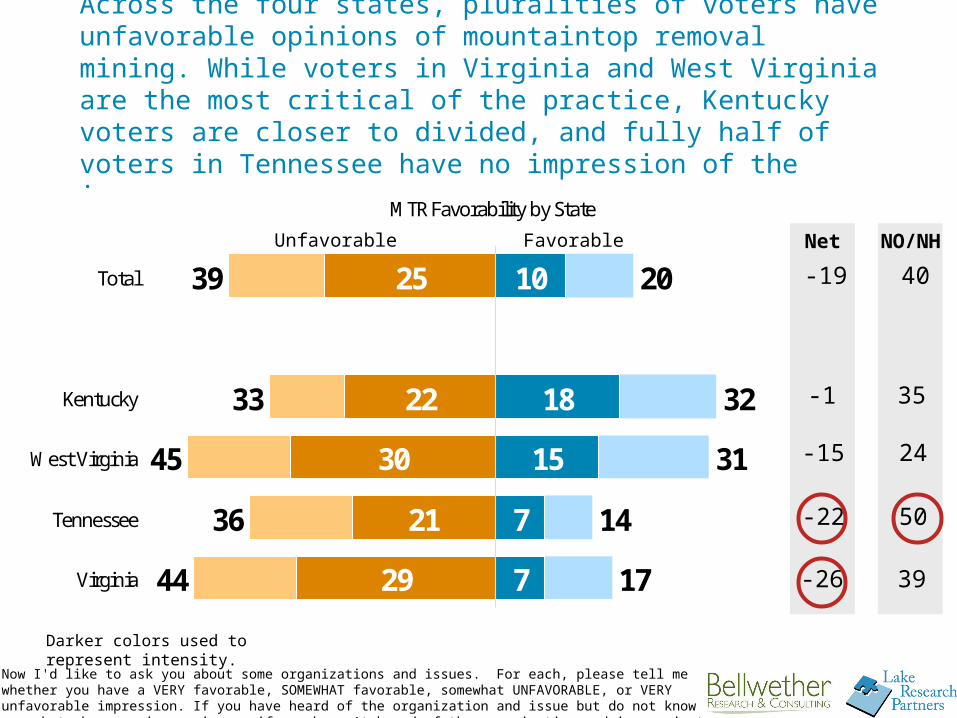
Across the four states, pluralities of voters have unfavorable opinions of mountaintop removal mining. While voters in Virginia and West Virginia are the most critical of the practice, Kentucky voters are closer to divided, and fully half of voters in Tennessee have no impression of the issue.
Now I'd like to ask you about some organizations and issues. For each, please tell me whether you have a VERY favorable, SOMEWHAT favorable, somewhat UNFAVORABLE, or VERY unfavorable impression. If you have heard of the organization and issue but do not know enough to have an impression or if you haven’t heard of the organization and issue, just say so, we will move on.
Net
-19
MTR Favorability by State
20
32
31
14
17
39
33
45
36
44
10
18
15
7
7
30
21
29
22
25Total
Kentucky
West Virginia
Tennessee
Virginia
Unfavorable Favorable NO/NH
40
Darker colors used to represent intensity.
-1
-15
35
24
-26
-22
39
50

Appalachian voters recognize environmental degradation as a nationwide problem. They are less likely to characterize their own states in such critical terms, though few believe the quality of their state’s environment has improved.
Overall, do you think the quality of the environment in the United States (your state) has gotten better, stayed about the same, or gotten worse?
Quality of the Environment...
17
4337
3
19 22
55
4
GottenBetter
GottenWorse
StayedAbout the
Same
DK GottenBetter
GottenWorse
StayedAbout the
Same
DK
-26
In the United States In Your State
-3
Darker colors used to indicate intensity.

Three-quarters of voters in Appalachia support fully enforcing—and even increasing protections in—the Clean Water Act to safeguard streams, rivers, and lakes in their states from mountaintop removal coal mining.
And would you favor or oppose fully enforcing (increasing protections in) the Clean Water Act to safeguard streams, rivers, and lakes in [STATE] from mountaintop removal coal mining, or aren’t you sure?
Stance on Using the Clean Water Act to Safeguard Streams, Rivers, and Lakes
74
818
78
9 13
45
59 64
Favor Oppose Don'tKnow/Not
Sure
Favor Oppose Don'tKnow/Not
Sure
+66
Fully Enforce CWA Increase Protections in CWA
+70
Darker colors used to indicate intensity.

Opposition to mountaintop removal mining outpaces support by a solid double-digit margin. When voters are provided with a brief description of the practice, opposition takes on majority status and garners noticeable intensity.
As you may know, coal companies in [STATE] mine coal from mountains through a process called mountaintop removal mining (where the top of a mountain is removed to extract the coal and waste is disposed in nearby valleys and streams). Do you favor or oppose mountaintop removal mining or are you undecided?
Stance on Mountaintop Removal Mining
22
48
24
38
20
57
10 11 10
2734
42
Favor Oppose Favor Oppose Favor Oppose
*Each question asked of ½ the sample.
Combined *Informed*Uninformed
+14+38
+26
Darker colors used to indicate intensity.

Opposition to mountaintop removal mining transcends typical gender, educational, partisan, and regional divides. Women, college-educated voters, Democrats, and Virginians are among the groups who register the greatest opposition to the practice.
Combined Initial Ballot Contours
48
4649
3847
5953
544744
434845
51
29
30
1818
31
2622
17
1523
1533
15
22Total
Men (48%)Women (52%)
Non-college men (28%)Non-college women (28%)
College men (19%)College women (23%)
Democrats (33%)Independents (27%)Republicans (35%)
Kentucky (21%)West Virginia (8%)
Tennessee (29%)Virginia (42%)
Oppose Favor1734
532
37
25
17
36
37
18
13
2733
Net26

Mountaintop removal is a voting issue to those throughout Appalachia. Nearly half of voters, including a majority of Virginians, would be more likely to support an official who favored strengthening environmental regulations on mountaintop removal mining, outnumbering those who would be less likely to support that official by a ratio of more than 3:1.
Suppose an elected official was in favor of strengthening environmental regulations on mountaintop removal mining? Would that make you more or less likely to support that elected official, or wouldn’t it make any difference?
Likelihood to Support Official Who Favored Strengthening MTR Restrictions
48
14
38
726
Somewhat/Much MoreLikely
Somewhat/Much LessLikely
No Difference
+33
Darker colors used to represent intensity.
Likelihood to Support By StateMuch More Likely %
(Somewhat/Much More Likely %):•Virginia – 28% (55%)•Tennessee – 25% (40%)•West Virginia – 24% (39%)•Kentucky – 23% (47%)
11

An equal number of voters, including a solid majority of West Virginians, is willing to hold their elected officials accountable for weakening environmental regulations on mountaintop removal mining, making it imperative for elected officials and candidates to get on the right side of public opinion on this issue.
Suppose an elected official was in favor of weakening environmental regulations on mountaintop removal mining? Would that make you more or less likely to support that elected official, or wouldn’t it make any difference?
Likelihood to Support Official Who Favored Weakening MTR Restrictions
15
4837
309
Somewhat/Much MoreLikely
Somewhat/Much LessLikely
No Difference
-33
Darker colors used to represent intensity.
Likelihood to Support By StateMuch Less Likely % (Somewhat/Much Less Likely %):
•West Virginia – 36% (56%)•Virginia – 33% (49%)•Kentucky – 27% (46%)•Tennessee – 26% (46%)
12

Efforts to associate opponents of mountaintop removal with economic loss are met with a healthy dose of public skepticism. In fact, majorities of voters across Appalachia believe environmental protections either benefit the economy or have no real impact.
Economic Impact of Environmental Protections
40
20 2514
Often Good Often Little or NoImpact
Often Bad None Of The Above/DK
And which of the following statements comes closer to your own point of view: Environmental protections are often good for the economy, are often bad for the economy, often have little or no impact on the economy?
60

Simulating an engaged debate with each side communicating its most persuasive message, fully half of voters oppose mountaintop removal mining by a margin of nearly 2:1, while a quarter is undecided.
Sometimes over the course of a survey like this people change their minds. Do you favor or oppose mountaintop removal mining or are you unsure?
Stance on Mountaintop Removal After Arguments
27
50
23
1434
Favor Oppose Don't Know
+23
Darker colors used to represent intensity. 14

Mountaintop Removal Arguments
Pro-MTR Message• (Some/Other) people say that coal is an important part of America’s economy
and national security, and killing jobs is the wrong thing to do in this recession. Nearly half of all electricity produced in the U.S. is from coal, and increasing coal mining and using the most efficient methods frees America from our dependence on foreign oil, keeps energy costs low, grows jobs and the local economy.
Anti-MTR Message• (Some/Other) people believe mountaintop removal is bad for the economy
and the environment and is causing ongoing harm to nearby communities, including increasing the number of birth defects and other serious health conditions. Mountaintop removal replaces workers with machines and explosives. It has filled nearly 2,000 miles of Appalachian streams with billions of tons of mining waste, killing wildlife and destroying forests.

Voters show little inclination to shift from their initial opposition to the issue, underscoring the solidity of their views. Women, college-educated voters, Democrats, and Virginians remain among the groups who oppose mountaintop removal mining by the largest margins.
Final Ballot Contours
50
5050
4646
5857
595046
444547
56
35
31
27
23
3422
2824
2425
31
38
2322
Total
Men (48%)Women (52%)
Non-college men (28%)Non-college women (28%)
College men (19%)College women (23%)
Democrats (33%)Independents (27%)Republicans (35%)
Kentucky (21%)West Virginia (8%)
Tennessee (29%)Virginia (42%)
Oppose Favor
1928
1225
32
25
7
30
35
15
9
2533
Net23
Celinda [email protected]
Daniel [email protected]
Kristin [email protected]
Alex [email protected]
Washington, DC | Berkeley, CA | New York, NYLakeResearch.com202.776.9066
Bellwether-Research.com703.650.5203
Christine [email protected]