Embed Size (px)
Citation preview

SAFETY AND QUALITY OF HEALTH CARE SERIES
Number 12
Australian Institute of Health and Welfare
Canberra
Cat. no. HSE 120
Public and private sector medical
indemnity claims in Australia
2009–10

The Australian Institute of Health and Welfare is a major national agency
which provides reliable, regular and relevant information and statistics
on Australia’s health and welfare. The Institute’s mission is
authoritative information and statistics to promote better health and wellbeing.
© Australian Institute of Health and Welfare 2012
This product, excluding the AIHW logo, Commonwealth Coat of Arms and any material owned by a
third party or protected by a trademark, has been released under a Creative Commons BY 3.0
(CC-BY 3.0) licence. Excluded material owned by third parties may include, for example, design and
layout, images obtained under licence from third parties and signatures. We have made all reasonable
efforts to identify and label material owned by third parties.
You may distribute, remix and build upon this work. However, you must attribute the AIHW as the
copyright holder of the work in compliance with our attribution policy available at
<www.aihw.gov.au/copyright/>. The full terms and conditions of this licence are available at
<http://creativecommons.org/licenses/by/3.0/au/>.
Enquiries relating to copyright should be addressed to the Head of the Communications, Media and
Marketing Unit, Australian Institute of Health and Welfare, GPO Box 570, Canberra ACT 2601.
This publication is part of the Australian Institute of Health and Welfare’s Safety and quality of health
care series. A complete list of the Institute’s publications is available from the Institute’s website
<www.aihw.gov.au>.
ISSN 1833-7422
ISBN 978-1-74249-298-8
Suggested citation
Australian Institute of Health and Welfare 2012. Public and private sector medical indemnity claims in
Australia 2009–10. Safety and quality of health care series no. 12. Cat. no. HSE 120. Canberra:
AIHW.
Australian Institute of Health and Welfare
Board Chair
Dr Andrew Refshauge
Director
David Kalisch
Any enquiries about or comments on this publication should be directed to:
Communications, Media and Marketing Unit
Australian Institute of Health and Welfare
GPO Box 570
Canberra ACT 2601
Tel: (02) 6244 1032
Email: [email protected]
Published by the Australian Institute of Health and Welfare
Please note that there is the potential for minor revisions of data in this report.
Please check the online version at <www.aihw.gov.au> for any amendments.
iii
Contents Acknowledgments.............................................................................................................................. iv
Abbreviations ....................................................................................................................................... v
Summary ............................................................................................................................................. vii
1 Introduction .................................................................................................................................... 1
1.1 Background to the report ....................................................................................................... 3
1.2 Collaborative arrangements .................................................................................................. 3
2 The collection .................................................................................................................................. 4
2.1 Data items and definitions ..................................................................................................... 4
2.2 Claim management practices ................................................................................................ 4
2.3 Data completeness and Not known rates .............................................................................. 4
3 Claims for 2009–10 .......................................................................................................................... 6
3.1 Health service setting ............................................................................................................. 6
3.2 Primary incident/allegation type ......................................................................................... 7
3.3 Specialty of clinician ............................................................................................................. 13
3.4 Closed claims: extent of harm and specialty of clinician ................................................. 19
4 Patients who were the subjects of claims ............................................................................... 22
4.1 Sex and age group of claim subject .................................................................................... 22
4.2 Primary incident/allegation type ....................................................................................... 22
4.3 Primary body function/structure affected ........................................................................ 24
5 Administrative and financial characteristics ......................................................................... 35
5.1 Duration of claims ................................................................................................................. 35
5.2 Reserve range of current claims .......................................................................................... 35
5.3 Total claim size of closed claims ......................................................................................... 39
5.4 Mode of claim finalisation.................................................................................................... 41
5.5 Total claim size and health service setting ........................................................................ 43
5.6 Total claim size and specialty of clinician .......................................................................... 46
5.7 Total claim size and extent of harm .................................................................................... 49
Appendix 1: Data items and definitions ........................................................................................ 51
Appendix 2: Data quality statements.............................................................................................. 54
Appendix 3: Public and private sector claim management practices ....................................... 65
Appendix 4: Coding examples for some main data items .......................................................... 67
References ............................................................................................................................................ 69
List of tables ........................................................................................................................................ 70
List of figures ...................................................................................................................................... 72
iv
Acknowledgments
This report has been prepared in consultation with the Medical Indemnity National Collection Coordinating Committee (MINC CC). The members of the Committee include the Australian Government Department of Health and Ageing, the health authorities of each state and territory and private sector medical indemnity insurers. The Australian Institute of Health and Welfare (AIHW) extends its gratitude and appreciation to the members of the MINC CC for the supply of data and invaluable advice during the planning and writing of this report. The members for the purposes of the 2009–10 reporting period were:
• Mandy Anderson—Medical Insurance Group Australia
• Julie Barnes—Western Australia, Department of Health
• Liam Barrett—MDA National
• Troy Browning— Medical Indemnity Protection Society
• Milena Canil—Victoria, Department of Health
• Lisa Clarke—Avant
• Paul Currall—Australian Government Department of Health and Ageing (Chair)
• Simon Fenton —Australian Capital Territory, ACT Health
• Kristy Frost—Queensland, Queensland Health
• Jenny Hargreaves—Australian Institute of Health and Welfare
• Jayne Hay—Tasmania, Department of Health and Human Services
• Olivia King—New South Wales, NSW Ministry of Health
• John Markic—South Australia, SA Health
• Karen McKenzie—Invivo
• David Minty—Insurance Statistics Australia
• Angela Mitchell—Victorian Managed Insurance Authority
• Michele Murphy—New South Wales, NSW Ministry of Health
• Suzi Raczkowski—Medical Indemnity Protection Society
• Natalie Simmons— Medical Insurance Group Australia
• Denise Southwood—Northern Territory, Department of Health and Families
• Lloyd Stuart—Victoria, Department of Human Services
• Julien Wicks—Australian Government Department of Health and Ageing
The report was written and prepared by Liz Berryman and David Bulbeck of the AIHW with advice from George Bodilsen. Elena Ougrinovski and Raheena Abubacker assisted with data management, cleaning and validation.
v
Abbreviations
ACCC Australian Competition and Consumer Commission
AHMAC Australian Health Ministers’ Advisory Council
AIHW Australian Institute of Health and Welfare
APRA Australian Prudential Regulation Authority
DoHA Australian Government Department of Health and Ageing
ISA Insurance Statistics Australia
MDO medical defence organisation
MIDWG Medical Indemnity Data Working Group
MII medical indemnity insurer
MINC Medical Indemnity National Collection
MINC (PS) Medical Indemnity National Collection (Public Sector)
MINC CC Medical Indemnity National Collection Coordinating Committee
NCPD National Claims and Policies Database
PSS Premium Support Scheme
Symbols
. . Not applicable

vi

vii
Summary This report presents information from the Medical Indemnity National Collection for 2009–10. It describes characteristics and costs for public and private sector medical indemnity claims.
Claims
There were 9,415 medical indemnity claims open at some point between July 2009 and June 2010. This included 2,900 new claims opened during the period, and almost 2,650 claims that were closed during the period. There were more new claims in the public than the private sector (1,620 and 1,280 respectively), but there were more claims closed in the private sector than the public sector (1,471 and 1,176 respectively).
Between 2007–08 and 2009–10 the number of all claims in scope increased from 8,555 to 9,415 and the number of new claims increased from 2,255 to 2,900. However, there were more closed claims in 2007–08 (2,675 claims) and 2008–09 (3,093 claims) than in 2009–10.
Cost and duration
More than half (58%) of closed claims were settled for less than $10,000, including 17% where no payment was made. Just 6% were settled for $500,000 or more. Two-thirds (67%) of closed claims were finalised within 3 years of being opened, compared with 14% that took more than 5 years to be settled.
Just 3% of closed claims were finalised through a court decision, compared with 51% finalised through a negotiated settlement with the claimant. The remaining 46% were discontinued (for instance, following the claimant’s withdrawal of the claim).
The alleged incidents and who was involved
As in previous years, the most common allegation of loss for new claims in 2009–10 related to Procedure—for example failure of procedure or post-operative complications (24% of claims). Procedure was followed by Diagnosis (20% of claims) and Treatment (15% of claims).
The most common allegation of harm was Neuromusculoskeletal and movement-related, accounting for 18% of new claims. The categories Digestive, metabolic and endocrine systems and Death (both 12%), Mental and nervous system and Genitourinary and reproductive (both 9%), were also commonly reported. Similar proportions were recorded for 2007–08 and 2008–09 except that the Digestive, metabolic and endocrine systems category was lower.
Almost three-quarters of allegedly affected patients were adults (74% of new claims), with female patients outnumbering males. In the case of persons aged 1–17 the patient was more often male than female. Where the patient was a baby, almost one-third of new claims (30%) were associated with Mental and nervous system effects.
As in 2007−08 and 2008−09, in 2009–10 the two most commonly recorded clinical specialties were General practice (18% of new claims) and Obstetrics and Gynaecology (9% of new claims).
About 24% of closed claims were associated with mild injury to the claim subject, 27% with moderate injury and 18% with severe injury. Severe injury was recorded for a higher proportion of the claims associated with Diagnostic radiology and Urology (29% and 28% respectively) than the claims associated with other clinician specialties. The claim subject’s death was associated with 12% of closed claims.
Claim size was generally less than $10,000 when the injury was mild (78%) and often less than $10,000 when the injury was moderate (50%), but usually $10,000 or more when the injury was severe (65%).

viii

Public and private sector medical indemnity claims in Australia 2009–10 1
1 Introduction
This report presents data on public and private sector medical indemnity claims for the period from 1 July 2009 to 30 June 2010. It is the sixth report of this nature, the first of which was A national picture of medical indemnity claims in Australia 2004–05, published in May 2007 (AIHW 2007).
Medical indemnity insurance provides clinicians with protection against financial loss resulting from claims of alleged negligence or breach of duty during the provision of health-care services. In Australia, this insurance is mainly provided within the public sector by state and territory health authorities. In the private sector, clinicians hold individual policies with medical indemnity insurers (MIIs). Private hospitals also have medical indemnification cover for hospital employees but their claims are out of scope for the Medical Indemnity National Collection (MINC) on which this report is based.
The data presented in this report relate to claims that were open at any time during the reporting period, 1 July 2009 to 30 June 2010. With most but not all of these claims, a formal demand for compensation for alleged harm or other loss resulting from health care had been received by an MII or a public sector claims manager. There are five categories of claims represented in the data: all claims, new claims, closed claims, current claims and reopened claims (Box 1.1).
Most health service settings are either public (notably hospitals) or private (for example, hospitals and general practice clinics). However, it should be noted that a proportion of the claims involving public sector health authorities originate from alleged incidents in private settings, and a proportion of MII claims originate from alleged incidents in public settings. As an example of the former, some jurisdictions offer public cover to medical practitioners working in their private health clinics under particular circumstances (for example, if they are rurally based). As an example of the latter, visiting medical officers who treat private patients in public hospitals are often required to hold private medical indemnification (see the appendix ‘Policy, administrative and legal features in each jurisdiction’ in AIHW 2012).
The report has five chapters, with introductory information provided in Chapter 1 and the background to the collection summarised in Chapter 2. Chapter 3 includes information on the health-care incidents leading to claims, the health service settings in which incidents occurred and the specialties allegedly involved. Chapter 4 includes information on the people affected by claims and the nature of their loss and Chapter 5 provides details about the financial characteristics of claims. There are also four appendices that respectively detail the data items and definitions, the quality of the MINC data, differences between the public and private sectors in their claim management practices, and coding examples for some of the main data items.

2 Public and private sector medical indemnity claims in Australia 2009–10
Box 1.1: Types of claims in scope for the 2009–10 public and private sector report
All claims: public and private sector claims in scope (see below) that were open at any time between 1 July 2009 and 30 June 2010.
New claims: public sector claims in scope that had their reserve set, or private sector claims reported to the Australian Prudential Regulation Authority (APRA), between 1 July 2009 and 30 June 2010. These can be either closed or current.
Closed claims: any claims that were finalised by discontinuation, negotiation or a court decision, between 1 July 2009 and 30 June 2010.
Current claims: any claims in scope that remained open at 30 June 2010.
Reopened claims: current claims that had been considered closed at some point prior to 30 June 2010.
Potential claims: current claims for which a formal demand for compensation for alleged loss or harm has not been received.
Most of the claims in scope are linked to a formal demand for compensation for alleged loss or harm. However the scope also includes public sector potential claims, which are instances of suspected harm reported to the health authority claim manager that are considered likely to result in a formal demand at some point after the reporting period. The scope also includes potential claims in the private sector, where a medical indemnity insurer (MII) has incurred preparatory expenses from investigating incidents reported to the MII by an insured clinician. With those cases, the MII is legally obligated to report the potential claim to the Australian Prudential Regulation Authority (APRA) even if no formal demand for compensation has been received.
Private hospital insurance claims, that is, claims against hospitals as opposed to claims against individual practitioners, are not within the scope of the MINC. However, all claims against clinicians who maintain medical indemnity cover with an MII, and who practise within private hospitals, are included.
A small number of public sector claim records are excluded from particular tables. Some of the records for closed public sector claims aggregate financial data across several similar incidents. However, these claim records include the incident data for only one of the incidents, and the data on the other, similar incidents is contained in linked claim records. Both the claim records that aggregate financial data and their linked claims records are excluded from the tables that compare the cost of closing claims to other variables. This is because, unlike the other closed claims, there is no relationship between the recorded incident and the cost of closing the claim. Also, several of the public sector claim records have been created for the purpose of recording additional payments to some party other than the patient. These records duplicate the incident information already present in the claim record with the information on the payment to the patient. These claim records with duplicate information on the incident are excluded from the tables providing health-care incident data.

Public and private sector medical indemnity claims in Australia 2009–10 3
1.1 Background to the report Health Ministers decided at the Medical Indemnity Summit in April 2002 to establish a ‘national database for medical negligence claims’ to assist with informing future medical indemnity strategies. The collection was intended to help monitor the costs associated with health-care litigation and the financial viability of the medical indemnity insurance sector. The scope of the collection was defined to exclude public liability claims except where these result from health-care intervention.
Collation of data on public sector medical indemnity claims started in 2003, and was followed by publication of data for the second six months of 2002–03 (January to June 2003) in December 2004 (AIHW 2004). Eight financial year reports on the public sector have been published subsequently, the last covering 2008–09 (AIHW 2011a).
In 2004, the Australian Government introduced the Premium Support Scheme (PSS), as part of a comprehensive medical indemnity package to help eligible clinicians meet the cost of their private medical indemnity insurance (Medicare Australia 2010). MIIs provide information on private sector medical indemnity claims to the Australian Government Department of Health and Ageing (DoHA) and the AIHW under arrangements made following the introduction of the PSS. The claims reported by the MIIs to the AIHW are the same claims that they are required to report to the Australian Prudential Regulation Authority (APRA).
Some of the claims reported by MIIs relate to medical defence organisation (MDO) run-off, which is a scheme for claims lodged with private sector medical indemnity insurers in the years when they were still organised as MDOs rather than MIIs. This claims information is combined with the corresponding public sector data supplied to the AIHW by states and territories in the production of the combined sector medical indemnity reports.
Further information on the collection’s background is presented in the Public and private sector medical indemnity claims in Australia 2006–07: a summary report (AIHW 2010).
1.2 Collaborative arrangements The public sector MINC is governed by an agreement between DoHA, AIHW and state and territory health authorities. A second agreement relating to the private sector MINC exists between DoHA, AIHW and individual MIIs. The agreements outline the respective roles, responsibilities and collaborative arrangements of all parties.
The MINC Coordinating Committee (MINC CC) was established in mid-2005 to manage the development and administration of medical indemnity data combined across the public and private sectors and to advise on the public release of these data. The Committee consists of representatives from state and territory health authorities, DoHA, MIIs and the AIHW, and also oversees the production of the combined public and private sector reports.
The AIHW is the national data custodian of public sector medical indemnity data contained in the MINC and is responsible for the collection, quality control, management and reporting of these data. The AIHW receives a combination of aggregated and unit record claims data from the private sector and is also responsible for managing and reporting these data. All data held by the AIHW for the purpose of producing this report are de-identified and treated in confidence by the AIHW. Any release or publication of aggregated public and private sector medical indemnity data is subject to agreement by the members of the MINC CC.

4 Public and private sector medical indemnity claims in Australia 2009–10
2 The collection
2.1 Data items and definitions The MINC includes 23 data items. Definitions, classification codes, a guide for use and a brief history of the development of each item are documented in the Medical indemnity national collection (public sector) data guide, which is available from the AIHW on request. The 2004–05 version of the data guide is also available as an on-line publication.
Some MIIs transmit their claims data directly to the AIHW, while other MIIs transmit claims data to Insurance Statistics Australia (ISA) which are then forwarded as data extracts to the AIHW. Many of the data items collected by ISA are similar to MINC data items, and those data items defined similarly in both collections are chosen for inclusion in the combined database. The MINC data items that map to ISA items are outlined in Appendix 1 (Table A1.1). Some explanation is also included where data items do not map precisely. Definitions of key terms used in this report are also presented in Appendix 1 (Table A1.2).
2.2 Claim management practices There are differences between the public and private sectors in the management of claims, with implications for the interpretation of the combined claims data in this report. The main differences in claim management practices between the two sectors relevant to this report are outlined in Box 2.1. Further information on claim management practices can be found in Appendix 3.
2.3 Data completeness and Not known rates For the period from 1 July 2009 to 30 June 2010, 100% of all public sector claims ‘in scope’, that is, claims known to the jurisdictions as having been open at any time during the reporting period, were reported to the AIHW. The public sector coverage for the 2008–09 report was also 100%, and virtually 100% for the 2007–08 report (AIHW 2011a).
As is the case with the previous combined sector reports, data provided by the private sector for medical indemnity claims are complete, that is, data on 100% of claims legally required to be reported to APRA (Box 1.1) were reported to the AIHW.
The category Not known is used when the relevant information is not currently available. In some cases, the information is expected to become available as the claim progresses. In others, information is incomplete and likely to remain so over the lifetime of the claim.

Public and private sector medical indemnity claims in Australia 2009–10 5
Box 2.1: Claim management practices
The public sector
A medical indemnity claim in the public sector is defined on the criterion of having a reserve placed against the estimated likely cost of settling the claim. Jurisdictions differ in the degree to which the report of a health-care incident triggers the setting of a reserve prior to any formal allegation of loss or harm. Jurisdictions also differ in whether they report these potential claims to the AIHW or not.
In the public sector, the states and territories usually treat any allegations related to a single health-care incident as a single claim, even if it involves more than one health-care professional. All jurisdictions report on the principal clinician specialty involved in the allegation or incident, but (apart from New South Wales) they may also report up to three additional clinician specialties. This additional information can be used to make the public sector data on clinician specialties more like the data for the private sector where, as noted below, the involvement of several clinicians is likely to result in more than one claim.
Private sector medical indemnity insurers
MIIs provide professional indemnity insurance to individual clinicians. It is a common, but not uniform, practice for MIIs to open more than one claim for a single health-care incident if more than one clinician was involved in the incident that gave rise to the allegation of loss or harm. For example, an incident involving both an anaesthetist and an obstetrician may result in the initiation of a separate claim against each clinician.
As a result, individual claim sizes will often be less than the aggregated total cost incurred by the MII(s) for a single allegation of loss or harm. Thus the reported cost of an individual claim in the private sector may not reflect the total payment made by insurers in respect of the claimant(s).
Clinical specialty registration
Clinician specialties in the private sector are recorded according to their specialty as registered with their insurer. This is different from the public sector where clinician specialties are registered as recorded with their employing or contracting health service provider. This difference has led to a methodological decision to combine certain categories of specialties for combined sector reporting, for instance, the public sector specialties of ‘Obstetrics’, ‘Gynaecology’ and ‘Obstetrics and gynaecology’ under ‘Obstetrics and Gynaecology’ (see Appendix 3).
Not known rates tend to be relatively high for new claims, which are those first reported to APRA or reserved during the reporting period. The Not known rate for the data item ‘primary incident/allegation type’ was 19% for new claims compared to 10% for all claims reported during 2009–10. For the data item ‘primary body function/structure affected’, the Not known rate was 19% for new claims and 11% for all claims. For age of claim subject it was 17% for new claims and 15% for all claims; for ‘health service setting’, 18% for new claims and 12% for all claims; and for clinician specialty, 18% for new claims and 8% for all claims.
The interpretation of the proportions presented in chapters 3 to 5 will be affected by the Not known rates particularly where these are in excess of 10%.
6 Public and private sector medical indemnity claims in Australia 2009–10
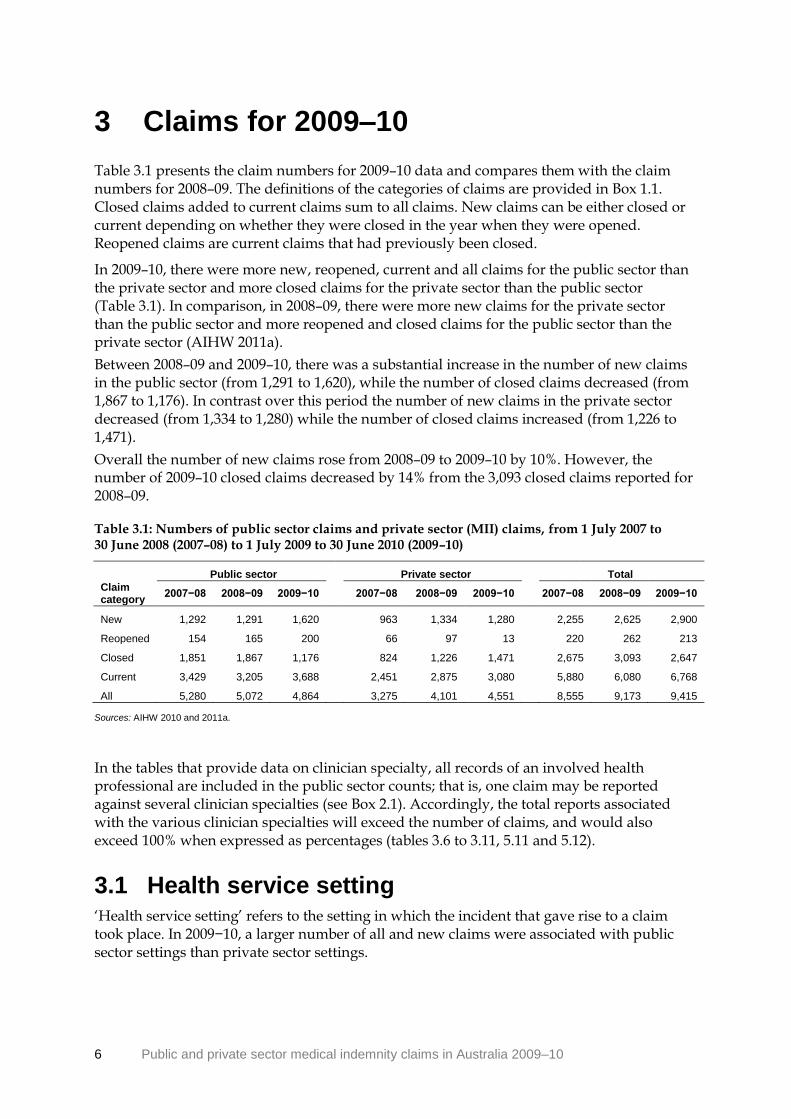
3 Claims for 2009–10
Table 3.1 presents the claim numbers for 2009–10 data and compares them with the claim numbers for 2008–09. The definitions of the categories of claims are provided in Box 1.1. Closed claims added to current claims sum to all claims. New claims can be either closed or current depending on whether they were closed in the year when they were opened. Reopened claims are current claims that had previously been closed.
In 2009–10, there were more new, reopened, current and all claims for the public sector than the private sector and more closed claims for the private sector than the public sector (Table 3.1). In comparison, in 2008–09, there were more new claims for the private sector than the public sector and more reopened and closed claims for the public sector than the private sector (AIHW 2011a).
Between 2008–09 and 2009–10, there was a substantial increase in the number of new claims in the public sector (from 1,291 to 1,620), while the number of closed claims decreased (from 1,867 to 1,176). In contrast over this period the number of new claims in the private sector decreased (from 1,334 to 1,280) while the number of closed claims increased (from 1,226 to 1,471).
Overall the number of new claims rose from 2008–09 to 2009–10 by 10%. However, the number of 2009–10 closed claims decreased by 14% from the 3,093 closed claims reported for 2008–09.
Table 3.1: Numbers of public sector claims and private sector (MII) claims, from 1 July 2007 to 30 June 2008 (2007–08) to 1 July 2009 to 30 June 2010 (2009–10)
Public sector Private sector Total
Claim category
2007−08 2008−09 2009−10
2007−08 2008−09 2009−10
2007−08 2008−09 2009−10
New 1,292 1,291 1,620
963 1,334 1,280
2,255 2,625 2,900
Reopened 154 165 200
66 97 13
220 262 213
Closed 1,851 1,867 1,176
824 1,226 1,471
2,675 3,093 2,647
Current 3,429 3,205 3,688
2,451 2,875 3,080
5,880 6,080 6,768
All 5,280 5,072 4,864 3,275 4,101 4,551 8,555 9,173 9,415
Sources: AIHW 2010 and 2011a.
In the tables that provide data on clinician specialty, all records of an involved health professional are included in the public sector counts; that is, one claim may be reported against several clinician specialties (see Box 2.1). Accordingly, the total reports associated with the various clinician specialties will exceed the number of claims, and would also exceed 100% when expressed as percentages (tables 3.6 to 3.11, 5.11 and 5.12).
3.1 Health service setting ‘Health service setting’ refers to the setting in which the incident that gave rise to a claim took place. In 2009−10, a larger number of all and new claims were associated with public sector settings than private sector settings.
Public and private sector medical indemnity claims in Australia 2009–10 7
Public sector claims can arise from alleged incidents in private sector health settings and vice versa. Therefore the number of claims in public settings and private settings (tables 3.2 and 3.4) does not equal the respective number of public sector and private sector claims in Table 3.1.
Almost half of all claims (48% or 4,513 claims) and new claims (44% or 1,276 claims) were reported as occurring within a public setting. Of these claims, 98% (4,415) of all claims and 97% (1,242) of new claims occurred within a public hospital or day surgery. Other public setting, for instance public community health centres and residential aged care services, was associated with 1% of both all and new claims (tables 3.2 and 3.4).
A private health service setting was the health service setting recorded for 39% (3,678) of all claims and 37% (1,076) of new claims. Of these claims, 40% (1,488) of all claims and 37% (401) of new claims occurred in a private hospital or day surgery (tables 3.2 and 3.4), while about half of all claims (1,811) and new claims (541) were recorded for private medical clinics.
Other private setting, for instance residential aged care services, was associated with 4% of all claims and 5% of new claims (tables 3.2 and 3.4). The health service setting was Not known in 12% of all claims and 18% of new claims.
The proportions of 2008–09 claims by health service setting (AIHW 2011a) were similar to those reported here.
3.2 Primary incident/allegation type ‘Primary incident/allegation type’ describes what is alleged to have gone wrong, that is, the area of possible error, negligence or problem that is determined to be of primary importance in giving rise to the claim. Coding examples for selected incident/allegation types are provided in Appendix 4 (Table A4.2).
The most commonly recorded category was Procedure, accounting for 27% (2,570) of all claims and 24% (707) of new claims (tables 3.2 to 3.5). Diagnosis and Treatment were the next most frequently recorded incident/allegation types and were associated with 24% (2,221) and 15% (1,445) of all claims (respectively). After Procedure, these two incident/allegation types were also the most frequently recorded for new claims with 582 claims (20%) recorded for Diagnosis and 433 claims (15%) recorded for Treatment.
The three most commonly recorded primary incident/allegation types for both all and new claims were Procedure, Diagnosis and Treatment, in that order, from 2004–05 to 2008–09 (AIHW 2007, 2008, 2010, 2011a, 2011b).
General duty of care accounted for 6% of both all and new claims (549 and 174 claims respectively). Except for Not known, the other categories each account for 6% or less of all claims and new claims. The primary incident/allegation type was Not known for 10% of all claims and 19% of new claims. Similar results were obtained from the 2007–08 and 2008–09 claims data (AIHW 2011a, 2011b).
With the 2009–10 claims data, Procedure was the most frequently recorded incident/allegation type for claims arising from an incident that occurred in a public hospital or day surgery. Procedure-related claims accounted for about 30% of all and new claims occurring in this health service setting. Diagnosis was recorded for 24% of all claims and 22%

8 Public and private sector medical indemnity claims in Australia 2009–10
of new claims, while Treatment was recorded for 21% of all claims and new claims in a public hospital/day surgery.
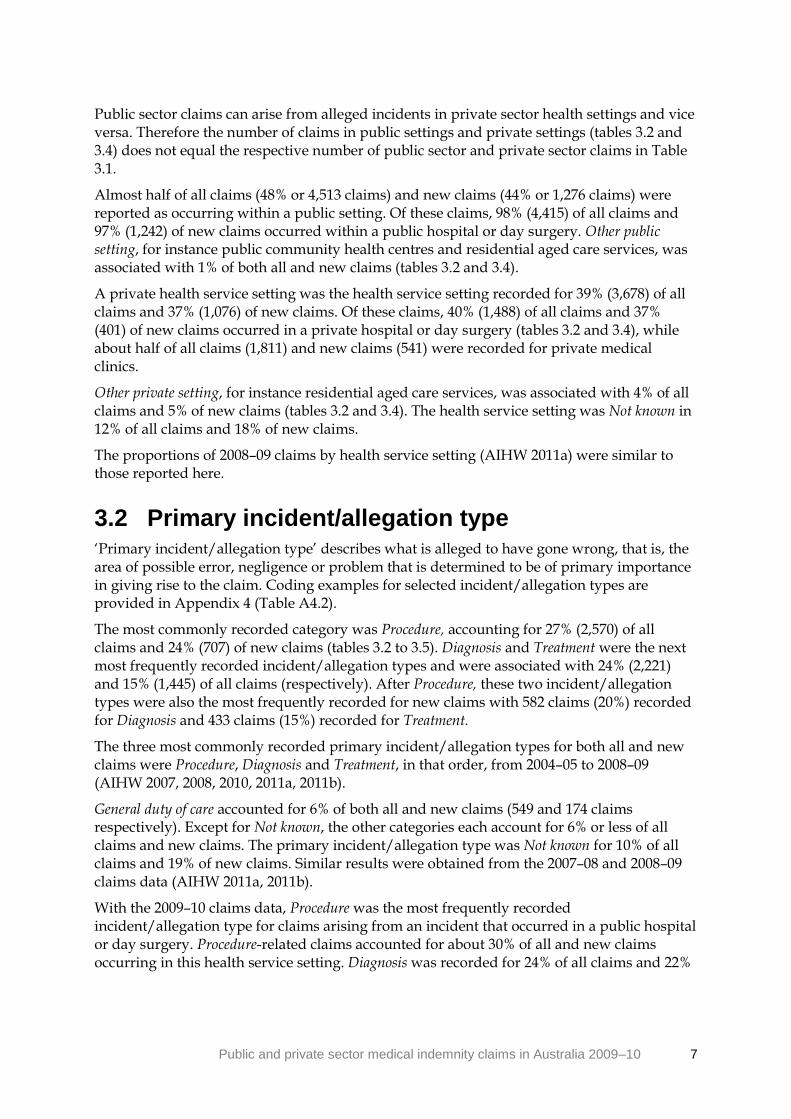
For claims arising from an incident occurring in private hospitals or day surgeries, Procedure was the most frequently recorded primary incident/allegation type, accounting for 58% of all claims and 53% of new claims. However in private medical clinics, Diagnosis was the most frequently recorded primary incident/allegation type, accounting for 44% of all claims and 41% of new claims—a substantial increase in these type of claims from 2008–09 (30% and 19% respectively). In Other private settings, Diagnosis was recorded for 33% of all claims while Consent was recorded for 31% of new claims.
In Other health service settings, Diagnosis and General duty of care accounted for 19% (15 of 80 claims) of all claims. General duty of care accounted for 30% (6 of 20) of new claims.

Public and private sector medical indemnity claims in Australia 2009–10 9
Table 3.2: All claims(a): primary incident/allegation type, by health service setting, 1 July 2009 to 30 June 2010
Health service setting
Primary incident/
allegation type
Public
hospital/day
surgery(b)
Other public
setting(c)
Private
hospital/day
surgery(d)
Private medical
clinic(e)
Other private
setting(f)
Other(g)
Not known Total
Anaesthetic 71 0 100 10 1 1 12 195
Blood/blood
product-related 49 3 6 0 0 1 0 59
Consent 149 2 45 27 86 0 5 314
Device failure(h)
19 0 10 5 3 0 0 37
Diagnosis 1,077 38 102 789 124 15 76 2,221
General duty of
care 282 9 49 156 16 15 22 549
Infection control 39 0 3 8 1 0 1 52
Medication-related 226 3 25 148 13 4 17 436
Procedure 1,347 16 859 210 58 7 73 2,570
Treatment 945 20 154 231 62 11 22 1,445
Other 84 5 100 187 13 23 124 536
Not known 127 2 35 40 2 3 758 967
Total 4,415 98 1,488 1,811 379 80 1,110 9,381
Total per cent 47.1 1.0 15.9 19.3 4.0 0.9 11.8 100.0
(a) Claims that were open at any point during the financial year. Excluded are 34 public sector claims that duplicate the health service setting and primary incident/allegation data recorded in another claim (see Box 1.1).
(b) Includes public psychiatric hospitals.
(c) Includes public community health centres, residential aged care services, hospices and alcohol and drug rehabilitation centres.
(d) Includes private psychiatric hospitals.
(e) Private clinics providing investigation and treatment on a non-residential, day-only basis, including 24-hour medical clinics and general practitioner surgeries.
(f) Includes private residential aged care services, hospices, and alcohol and drug rehabilitation centres.
(g) Includes patient’s home and ‘Medihotels’. Medihotels provide accommodation and hotel services suited to recipients of acute health care services who are able to care for themselves and are making the transition between the community and the acute hospital sector (Victorian Department of Health 2009).
(h) Aligns to ‘Faulty/contaminated equipment’ in the APRA National Claims and Policies Database (NCPD), corresponding to ISA data item 15 (see Appendix 1).
Note: Public sector claims can arise from alleged incidents in private sector health settings and vice versa. Therefore, the number of claims in public sector health settings and private sector health settings does not equal
the respective number of public sector and private sector claims. See Table 3.1 for numbers of public sector and private sector claims.

10 Public and private sector medical indemnity claims in Australia 2009–10
Table 3.3: All claims(a): primary incident/allegation type, by health service setting, 1 July 2009 to 30 June 2010 (per cent)
Health service setting
Primary incident/
allegation type
Public
hospital/day
surgery(b)
Other public
setting(c)
Private
hospital/day
surgery(d)
Private medical
clinic(e)
Other private
setting(f)
Other(g)
Not known Total
Anaesthetic 1.6 0.0 6.7 0.6 0.3 1.3 1.1 2.1
Blood/blood product-related 1.1 3.1 0.4 0.0 0.0 1.3 0.0 0.6
Consent 3.4 2.0 3.0 1.5 22.7 0.0 0.5 3.3
Device failure(h)
0.4 0.0 0.7 0.3 0.8 0.0 0.0 0.4
Diagnosis 24.4 38.8 6.9 43.6 32.7 18.8 6.8 23.7
General duty of care 6.4 9.2 3.3 8.6 4.2 18.8 2.0 5.9
Infection control 0.9 0.0 0.2 0.4 0.3 0.0 0.1 0.6
Medication-related 5.1 3.1 1.7 8.2 3.4 5.0 1.5 4.6
Procedure 30.5 16.3 57.7 11.6 15.3 8.8 6.6 27.4
Treatment 21.4 20.4 10.3 12.8 16.4 13.8 2.0 15.4
Other 1.9 5.1 6.7 10.3 3.4 28.8 11.2 5.7
Not known 2.9 2.0 2.4 2.2 0.5 3.8 68.3 10.3
Total 100.0 100.0 100.0 100.0 100.0 100.0 100.0 100.0
(a) Claims that were open at any point during the financial year. Excluded are 34 public sector claims that duplicate the health service setting and primary incident/allegation data recorded in another claim (see Box 1.1).
(b) Includes public psychiatric hospitals.
(c) Includes public community health centres, residential aged care services, hospices and alcohol and drug rehabilitation centres.
(d) Includes private psychiatric hospitals.
(e) Private clinics providing investigation and treatment on a non-residential, day-only basis, including 24-hour medical clinics and general practitioner surgeries.
(f) Includes private residential aged care services, hospices, and alcohol and drug rehabilitation centres.
(g) Includes patient's home and ‘Medihotels’.
(h) Aligns to 'Faulty/contaminated equipment' in the APRA NCPD (ISA data item 15, Appendix 1).
Notes
1. Public sector claims can arise from incidents in private sector health settings and vice versa. Therefore, the number of claims in public sector health settings and private sector health settings does not equal the respective number of public sector and private sector claims. See Table 3.1 for numbers of public sector and private sector claims.
2. Percentages may not add up exactly to 100.0 due to rounding.

Public and private sector medical indemnity claims in Australia 2009–10 11
Table 3.4: New claims(a): primary incident/allegation type, by health service setting, 1 July 2009 to 30 June 2010
Health service setting
Primary incident/
allegation type
Public
hospital/day
surgery(b)
Other public
setting(c)
Private
hospital/day
surgery(d)
Private medical
clinic(e)
Other private
setting(f)
Other(g)
Not known Total
Anaesthetic 22 0 33 6 0 0 5 66
Blood/blood
product-related 10 0 1 0 0 0 0 11
Consent 25 0 7 6 42 0 0 80
Device failure(h)
7 0 1 2 1 0 0 11
Diagnosis 274 12 29 224 26 4 13 582
General duty of
care 92 2 15 55 1 6 3 174
Infection control 9 0 2 1 0 0 0 12
Medication-related 63 1 10 32 0 1 6 113
Procedure 378 5 214 75 22 2 11 707
Treatment 261 10 43 77 35 2 5 433
Other 25 3 31 44 6 5 43 157
Not known 76 1 15 19 1 0 434 546
Total 1,242 34 401 541 134 20 520 2,892
Total per cent 42.9 1.2 13.9 18.7 4.6 0.7 18.0 100.0
(a) Claims that were opened or notified during the financial year. Excluded are eight public sector claims that duplicate the health service setting and primary incident/allegation data recorded in another claim (see Box 1.1).
(b) Includes public psychiatric hospitals.
(c) Includes public community health centres, residential aged care services, hospices and alcohol and drug rehabilitation centres.
(d) Includes private psychiatric hospitals.
(e) Private clinics providing investigation and treatment on a non-residential, day-only basis, including 24-hour medical clinics and general practitioner surgeries.
(f) Includes private residential aged care services, hospices, and alcohol and drug rehabilitation centres.
(g) Includes patient's home and ‘Medihotels’.
(h) Aligns to 'Faulty/contaminated equipment' in the APRA NCPD (ISA data item 15, Appendix 1).
Note: Public sector claims can arise from incidents in private sector health settings and vice versa. Therefore, the number of claims in public sector health settings and private sector health settings does not equal the
respective number of public sector and private sector claims. See Table 3.1 for numbers of public sector and private sector claims.
12 Public and private sector medical indemnity claims in Australia 2009–10
Table 3.5: New claims(a): primary incident/allegation type, by health service setting, 1 July 2009 to 30 June 2010 (per cent)
Health service setting
Primary incident/
allegation type
Public
hospital/day
surgery(b)
Other public
setting(c)
Private
hospital/day
surgery(d)
Private medical
clinic(e)
Other private
setting(f)
Other(g)
Not known Total
Anaesthetic 1.8 0.0 8.2 1.1 0.0 0.0 1.0 2.3
Blood/blood
product-related 0.8 0.0 0.2 0.0 0.0 0.0 0.0 0.4
Consent 2.0 0.0 1.7 1.1 31.3 0.0 0.0 2.8
Device failure(h)
0.6 0.0 0.2 0.4 0.7 0.0 0.0 0.4
Diagnosis 22.1 35.3 7.2 41.4 19.4 20.0 2.5 20.1
General duty of care 7.4 5.9 3.7 10.2 0.7 30.0 0.6 6.0
Infection control 0.7 0.0 0.5 0.2 0.0 0.0 0.0 0.4
Medication-related 5.1 2.9 2.5 5.9 0.0 5.0 1.2 3.9
Procedure 30.4 14.7 53.4 13.9 16.4 10.0 2.1 24.4
Treatment 21.0 29.4 10.7 14.2 26.1 10.0 1.0 15.0
Other 2.0 8.8 7.7 8.1 4.5 25.0 8.3 5.4
Not known 6.1 2.9 3.7 3.5 0.7 0.0 83.5 18.9
Total 100.0 100.0 100.0 100.0 100.0 100.0 100.0 100.0
(a) Claims that were opened or notified during the financial year. Excluded are eight public sector claims that duplicate the health service setting and primary incident/allegation data recorded in another claim (see Box 1.1).
(b) Includes public psychiatric hospitals.
(c) Includes public community health centres, residential aged care services, hospices and alcohol and drug rehabilitation centres.
(d) Includes private psychiatric hospitals.
(e) Private clinics providing investigation and treatment on a non-residential, day-only basis, including 24-hour medical clinics and general practitioner surgeries.
(f) Includes private residential aged care services, hospices, and alcohol and drug rehabilitation centres.
(g) Includes patient's home and ‘Medihotels’.
(h) Aligns to 'Faulty/contaminated equipment' in the APRA NCPD (ISA data item 15, Appendix 1).
Notes
1. Public sector claims can arise from incidents in private sector health settings and vice versa. Therefore, the number of claims in public sector health settings and private sector health settings does not equal the
respective number of public sector and private sector claims. See Table 3.1 for numbers of public sector and private sector claims.
2. Percentages may not add up exactly to 100.0 due to rounding.

Public and private sector medical indemnity claims in Australia 2009–10 13
3.3 Specialty of clinician The ‘specialty of clinician(s) closely involved in incident’ provides information relating to the specialty of the health care provider or providers who allegedly played the most prominent role(s) in the events that led to a claim. Certain clinician specialties such as General practice are more common in the private sector whereas others such as Emergency medicine are more concentrated in the public sector.
For claims in the MINC public sector collection, up to four codes may be recorded for this data item to cater for those situations that involved more than one clinician (Appendix 3). Thus a single public sector claim may potentially be counted up to four times in tables 3.6 to 3.9. However, for claims in the private sector, only the specialty of the policy holder (an individual clinician) is recorded for each claim.
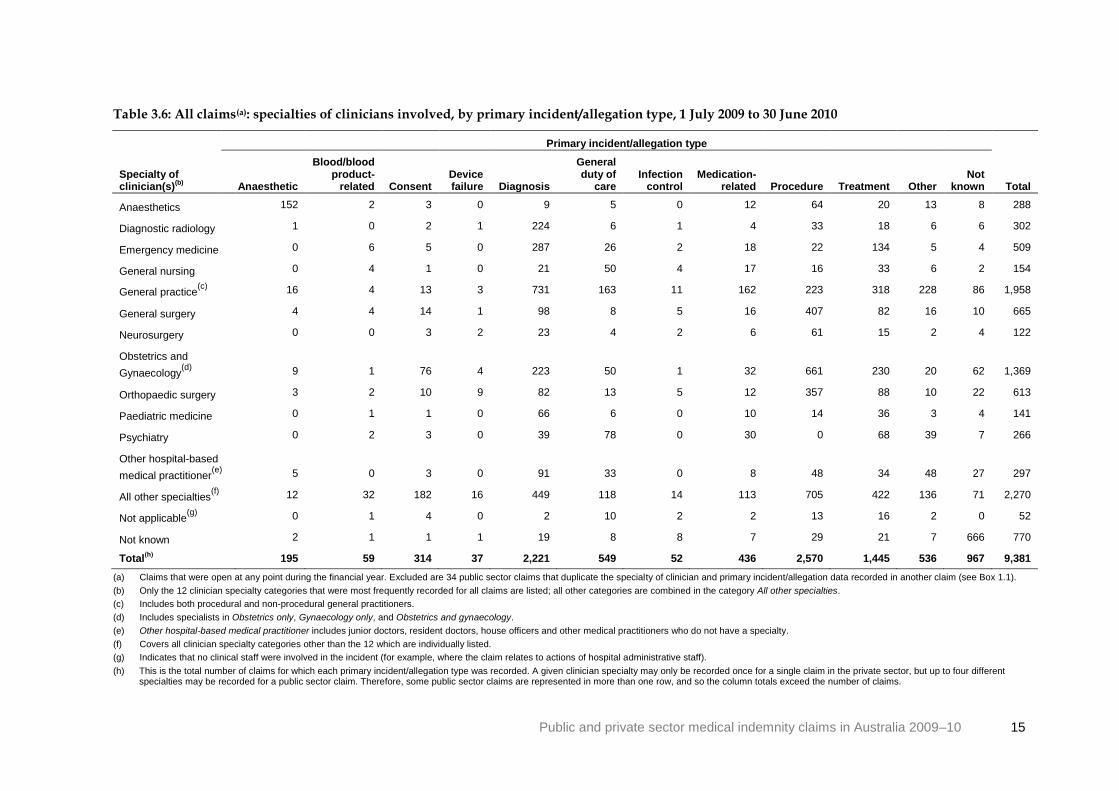
The twelve most commonly recorded clinical specialties during 2009–10 feature in tables 3.6 to 3.9. General practice (1,958 records) and Obstetrics and Gynaecology (1,369 records) were the most frequently recorded specialties, associated with 21% and 15% respectively of all claims—similar proportions to 2008–09 (20% and 16% respectively) (AIHW 2011a). For new claims, the same two specialties were the most frequently recorded, General practice on 522 occasions (18%) and Obstetrics and Gynaecology in 268 cases (9%). For new claims considerably more 2008–09 claims were associated with General practice (690 claims) whereas the number associated with Obstetrics and Gynaecology was similar (277 cases) (AIHW 2011a). Three other frequently recorded clinician specialties in 2009–10 were General surgery, Orthopaedic surgery and Emergency medicine each of which was associated with 5–8% of all and new claims.
The clinical specialties of Obstetrics and Gynaecology, General surgery and Orthopaedic surgery were recorded for about twice the proportion of claims that had Procedure as their incident/allegation type as they were for total claims.
In the case of all claims, 26% of Procedure-related claims were associated with Obstetrics and Gynaecology, 16% with General surgery and 14% with Orthopaedic surgery, compared with the respective percentages of 15%, 7% and 7% for total claims.
When new claims that are Procedure-related are considered, it can be seen that 19% were associated with Obstetrics and Gynaecology, 17% with General surgery and 13% with Orthopaedic surgery, whereas these clinical specialties were respectively recorded for 9%, 8% and 6% of total new claims.
Since 2007–08 the relationship of Obstetrics and Gynaecology, General surgery and Orthopaedic surgery to Procedure-related claims has fluctuated, with the largest change recorded for Obstetrics and Gynaecology (declining from 32% to 26% of all claims).
The specialty of General practice was associated with a relatively high proportion of claims with incident/allegation types of Diagnosis and Medication-related. The proportions were about one-third of all claims (33% and 37% respectively) and new claims (32% and 33% respectively), compared to the 21% of all claims and 18% of total new claims associated with General practice.
The clinical specialties of Emergency medicine and Diagnostic radiology were also recorded for a relatively high proportion of all Diagnosis-related claims, respectively 13% and 10%, compared to the proportions of 5% and 3% for the total of all claims with which these

14 Public and private sector medical indemnity claims in Australia 2009–10
specialties were associated. The association between General practice and Diagnosis-related claims has increased since 2007–08, from 22% of all claims and 28% of new claims, while for Emergency medicine the proportion has decreased from 25% of all Diagnosis-related claims
The specialty of Orthopaedic surgery was associated with about one-fifth of all and new claims with an incident/allegation type of Device failure (24% and 18% respectively), compared to the 7% of all claims and 6% of new claims associated with Orthopaedic surgery.
In the case of claims with a primary incident/allegation type of General duty of care, the proportions associated with Psychiatry and with General nursing were approximately five times the proportion of total claims. Psychiatry was recorded for 14% of both all and new claims with an incident/allegation type of General duty of care, compared to 3% of total claims. Similarly, General nursing was recorded for 9% of both all and new claims with an incident/allegation type of General duty of care, compared to 2% of the totals of all and new claims. The proportions of all Psychiatry and General nursing claims associated with General duty of care declined compared with 2007–08 (from 23% and 19% respectively) (AIHW 2011a, 2011b).
Public and private sector medical indemnity claims in Australia 2009–10 15
Table 3.6: All claims(a): specialties of clinicians involved, by primary incident/allegation type, 1 July 2009 to 30 June 2010
Primary incident/allegation type
Specialty of clinician(s)
(b) Anaesthetic
Blood/blood product-
related Consent Device failure Diagnosis
General duty of
care Infection
control Medication-
related Procedure Treatment Other Not
known Total
Anaesthetics 152 2 3 0 9 5 0 12 64 20 13 8 288
Diagnostic radiology 1 0 2 1 224 6 1 4 33 18 6 6 302
Emergency medicine 0 6 5 0 287 26 2 18 22 134 5 4 509
General nursing 0 4 1 0 21 50 4 17 16 33 6 2 154
General practice(c)
16 4 13 3 731 163 11 162 223 318 228 86 1,958
General surgery 4 4 14 1 98 8 5 16 407 82 16 10 665
Neurosurgery 0 0 3 2 23 4 2 6 61 15 2 4 122
Obstetrics and
Gynaecology(d)
9 1 76 4 223 50 1 32 661 230 20 62 1,369
Orthopaedic surgery 3 2 10 9 82 13 5 12 357 88 10 22 613
Paediatric medicine 0 1 1 0 66 6 0 10 14 36 3 4 141
Psychiatry 0 2 3 0 39 78 0 30 0 68 39 7 266
Other hospital-based
medical practitioner(e)
5 0 3 0 91 33 0 8 48 34 48 27 297
All other specialties(f)
12 32 182 16 449 118 14 113 705 422 136 71 2,270
Not applicable(g)
0 1 4 0 2 10 2 2 13 16 2 0 52
Not known 2 1 1 1 19 8 8 7 29 21 7 666 770
Total(h)
195 59 314 37 2,221 549 52 436 2,570 1,445 536 967 9,381
(a) Claims that were open at any point during the financial year. Excluded are 34 public sector claims that duplicate the specialty of clinician and primary incident/allegation data recorded in another claim (see Box 1.1).
(b) Only the 12 clinician specialty categories that were most frequently recorded for all claims are listed; all other categories are combined in the category All other specialties.
(c) Includes both procedural and non-procedural general practitioners.
(d) Includes specialists in Obstetrics only, Gynaecology only, and Obstetrics and gynaecology.
(e) Other hospital-based medical practitioner includes junior doctors, resident doctors, house officers and other medical practitioners who do not have a specialty.
(f) Covers all clinician specialty categories other than the 12 which are individually listed.
(g) Indicates that no clinical staff were involved in the incident (for example, where the claim relates to actions of hospital administrative staff).
(h) This is the total number of claims for which each primary incident/allegation type was recorded. A given clinician specialty may only be recorded once for a single claim in the private sector, but up to four different specialties may be recorded for a public sector claim. Therefore, some public sector claims are represented in more than one row, and so the column totals exceed the number of claims.

16 Public and private sector medical indemnity claims in Australia 2009–10
Table 3.7: All claims(a): specialties of clinicians involved, by primary incident/allegation type, 1 July 2009 to 30 June 2010 (per cent)
Primary incident/allegation type
Specialty of clinician(s)
(b) Anaesthetic
Blood/blood product-
related Consent Device failure Diagnosis
General duty of
care Infection
control Medication-
related Procedure Treatment Other Not
known Total
Anaesthetics 77.9 3.4 1.0 0.0 0.4 0.9 0.0 2.8 2.5 1.4 2.4 0.8 3.1
Diagnostic radiology 0.5 0.0 0.6 2.7 10.1 1.1 1.9 0.9 1.3 1.2 1.1 0.6 3.2
Emergency medicine 0.0 10.2 1.6 0.0 12.9 4.7 3.8 4.1 0.9 9.3 0.9 0.4 5.4
General nursing 0.0 6.8 0.3 0.0 0.9 9.1 7.7 3.9 0.6 2.3 1.1 0.2 1.6
General practice(c)
8.2 6.8 4.1 8.1 32.9 29.7 21.2 37.2 8.7 22.0 42.5 8.9 20.9
General surgery 2.1 6.8 4.5 2.7 4.4 1.5 9.6 3.7 15.8 5.7 3.0 1.0 7.1
Neurosurgery 0.0 0.0 1.0 5.4 1.0 0.7 3.8 1.4 2.4 1.0 0.4 0.4 1.3
Obstetrics and
Gynaecology(d)
4.6 1.7 24.2 10.8 10.0 9.1 1.9 7.3 25.7 15.9 3.7 6.4 14.6
Orthopaedic surgery 1.5 3.4 3.2 24.3 3.7 2.4 9.6 2.8 13.9 6.1 1.9 2.3 6.5
Paediatric medicine 0.0 1.7 0.3 0.0 3.0 1.1 0.0 2.3 0.5 2.5 0.6 0.4 1.5
Psychiatry 0.0 3.4 1.0 0.0 1.8 14.2 0.0 6.9 0.0 4.7 7.3 0.7 2.8
Other hospital-based
medical practitioner(e)
2.6 0.0 1.0 0.0 4.1 6.0 0.0 1.8 1.9 2.4 9.0 2.8 3.2
All other specialties(f)
6.2 54.2 58.0 43.2 20.2 21.5 26.9 25.9 27.4 29.2 25.4 7.3 24.2
Not applicable(g)
0.0 1.7 1.3 0.0 0.1 1.8 3.8 0.5 0.5 1.1 0.4 0.0 0.6
Not known 1.0 1.7 0.3 2.7 0.9 1.5 15.4 1.6 1.1 1.5 1.3 68.9 8.2
Total(h)
100.0 100.0 100.0 100.0 100.0 100.0 100.0 100.0 100.0 100.0 100.0 100.0 100.0
(a) Claims that were open at any point during the financial year. Excluded are 34 public sector claims that duplicate the specialty of clinician and primary incident/allegation data recorded in another claim (see Box 1.1).
(b) Only the 12 clinician specialty categories that were most frequently recorded for all claims are listed; all other categories are combined in the category All other specialties.
(c) Includes both procedural and non-procedural general practitioners.
(d) Includes specialists in Obstetrics only, Gynaecology only, and Obstetrics and gynaecology.
(e) Other hospital-based medical practitioner includes junior doctors, resident doctors, house officers and other medical practitioners who do not have a specialty.
(f) Covers all clinician specialty categories other than the 12 which are individually listed.
(g) Indicates that no clinical staff were involved in the incident (for example where the claim relates to actions of hospital administrative staff).
(h) In the public sector, up to four different clinician specialties may be recorded for each claim, and so some claims are represented in more than one row in the table. Hence the percentage values, which show the
proportion of claims with each primary incident/allegation type for which each clinician specialty was recorded, cannot be summed vertically to give 100%.

Public and private sector medical indemnity claims in Australia 2009–10 17
Table 3.8: New claims(a): specialties of clinicians involved, by primary incident/allegation type, 1 July 2009 to 30 June 2010
Primary incident/allegation type
Specialty of clinician(s)
(b) Anaesthetic
Blood/blood product-
related Consent Device failure Diagnosis
General duty of
care Infection
control Medication-
related Procedure Treatment Other Not
known Total
Anaesthetics 53 1 1 0 1 1 0 5 28 7 7 4 108
Cardiology 0 0 2 0 9 8 0 5 9 7 2 2 44
Diagnostic radiology 0 0 0 0 47 1 0 1 6 5 0 2 62
Emergency medicine 0 2 1 0 74 9 1 6 4 45 1 1 144
General nursing 0 1 0 0 7 16 1 2 7 12 3 0 49
General practice(c)
7 1 1 2 186 47 1 37 66 91 60 23 522
General surgery 1 1 3 1 36 3 1 4 122 39 7 2 220
Obstetrics and
Gynaecology(d)
3 0 9 0 57 12 0 7 136 29 6 9 268
Orthopaedic surgery 0 1 1 2 18 7 3 6 95 35 2 8 178
Psychiatry 0 1 1 0 12 25 0 8 0 22 12 1 82
Urology 0 0 1 0 7 0 1 0 16 5 5 3 38
Other hospital-based
medical practitioner(e)
1 0 0 0 26 8 0 2 21 9 13 6 86
All other specialties(f)
1 2 60 5 111 31 1 26 186 123 35 13 594
Not applicable(g)
0 1 1 0 0 2 1 1 4 6 0 0 16
Not known 2 0 1 1 11 5 2 4 14 8 4 474 526
Total(h)
66 11 80 11 582 174 12 113 707 433 157 546 2,892
(a) Claims that were opened or notified during the financial year. Excluded are eight public sector claims that duplicate the specialty of clinician and primary incident/allegation data recorded in another claim (see Box 1.1).
(b) Only the 12 clinician specialty categories that were most frequently recorded for new claims are listed; all other categories are combined in the category All other specialties.
(c) Includes both procedural and non-procedural general practitioners.
(d) Includes specialists in Obstetrics only, Gynaecology only, and Obstetrics and gynaecology.
(e) Other hospital-based medical practitioner includes junior doctors, resident doctors, house officers and other medical practitioners who do not have a specialty.
(f) Covers all clinician specialty categories other than the 12 which are individually listed.
(g) Indicates that no clinical staff were involved in the incident (for example where the claim relates to actions of hospital administrative staff).
(h) This is the total number of claims for which each primary incident/allegation type was recorded. A given clinician specialty may only be recorded once for a single claim in the private sector, but up to four different specialties may be recorded for a public sector claim. Therefore, some public sector claims are represented in more than one row, and so the column totals exceed the number of claims.

18 Public and private sector medical indemnity claims in Australia 2009–10
Table 3.9: New claims(a): specialties of clinicians involved, by primary incident/allegation type, 1 July 2009 to 30 June 2010 (per cent)
Primary incident/allegation type
Specialty of clinician(s)
(b) Anaesthetic
Blood/blood product-
related Consent Device failure Diagnosis
General duty of
care Infection
control Medication-
related Procedure Treatment Other Not
known Total
Anaesthetics 80.3 9.1 1.3 0.0 0.2 0.6 0.0 4.4 4.0 1.6 4.5 0.7 3.7
Cardiology 0.0 0.0 2.5 0.0 1.5 4.6 0.0 4.4 1.3 1.6 1.3 0.4 1.5
Diagnostic radiology 0.0 0.0 0.0 0.0 8.1 0.6 0.0 0.9 0.8 1.2 0.0 0.4 2.1
Emergency medicine 0.0 18.2 1.3 0.0 12.7 5.2 8.3 5.3 0.6 10.4 0.6 0.2 5.0
General nursing 0.0 9.1 0.0 0.0 1.2 9.2 8.3 1.8 1.0 2.8 1.9 0.0 1.7
General practice(c)
10.6 9.1 1.3 18.2 32.0 27.0 8.3 32.7 9.3 21.0 38.2 4.2 18.0
General surgery 1.5 9.1 3.8 9.1 6.2 1.7 8.3 3.5 17.3 9.0 4.5 0.4 7.6
Obstetrics and
Gynaecology(d)
4.5 0.0 11.3 0.0 9.8 6.9 0.0 6.2 19.2 6.7 3.8 1.6 9.3
Orthopaedic surgery 0.0 9.1 1.3 18.2 3.1 4.0 25.0 5.3 13.4 8.1 1.3 1.5 6.2
Psychiatry 0.0 9.1 1.3 0.0 2.1 14.4 0.0 7.1 0.0 5.1 7.6 0.2 2.8
Urology 0.0 0.0 1.3 0.0 1.2 0.0 8.3 0.0 2.3 1.2 3.2 0.5 1.3
Other hospital-based
medical practitioner(e)
1.5 0.0 0.0 0.0 4.5 4.6 0.0 1.8 3.0 2.1 8.3 1.1 3.0
All other specialties(f)
1.5 18.2 75.0 45.5 19.1 17.8 8.3 23.0 26.3 28.4 22.3 2.4 20.5
Not applicable(g)
0.0 9.1 1.3 0.0 0.0 1.1 8.3 0.9 0.6 1.4 0.0 0.0 0.6
Not known 3.0 0.0 1.3 9.1 1.9 2.9 16.7 3.5 2.0 1.8 2.5 86.8 18.2
Total(h)
100.0 100.0 100.0 100.0 100.0 100.0 100.0 100.0 100.0 100.0 100.0 100.0 100.0
(a) Claims that were opened or notified during the financial year. Excluded are eight public sector claims that duplicate the specialty of clinician and primary incident/allegation data recorded in another claim (see Box 1.1).
(b) Only the 12 clinician specialty categories that were most frequently recorded for new claims are listed; all other categories are combined in the category All other specialties.
(c) Includes both procedural and non-procedural general practitioners.
(d) Includes specialists in Obstetrics only, Gynaecology only, and Obstetrics and gynaecology.
(e) Other hospital-based medical practitioner includes junior doctors, resident doctors, house officers and other medical practitioners who do not have a specialty.
(f) Covers all clinician specialty categories other than the 12 which are individually listed.
(g) Indicates that no clinical staff were involved in the incident (for example where the claim relates to actions of hospital administrative staff).
(h) In the public sector, up to four different specialties may be recorded for each claim, and so some claims are represented in more than one row in the table. Hence the percentage values, which show the proportion of claims with each primary incident/allegation type for which each clinician specialty was recorded, cannot be summed vertically to give 100%.

Public and private sector medical indemnity claims in Australia 2009–10 19
3.4 Closed claims: extent of harm and specialty of
clinician ‘Extent of harm’ is a record of the extent or severity of overall harm to the claim subject resulting from the alleged incident. In cases where the claim subject has pre-existing impairments, activity limitations and/or participation restrictions, the category recorded for this item reflects only the additional harm or disability due to the incident, over and above any pre-existing conditions. This item is reported for closed claims because the claim subjects’ extent of harm can be difficult to ascertain while a claim is still open.
Beginning with the 2009–10 data, the MIDWG agreed to revise the MINC extent of harm categories to better align with the Insurance Statistics Australia (ISA) ‘severity of loss’ data item (Appendix 1). As a consequence this is the first time that extent of harm data have been included in the public and private sector medical indemnity claims reports.
Of the 2,640 claims closed during 2009–10, 24% (635) were associated with Mild injury, 27% (710) with Moderate injury and 18% (466) with Severe injury. A further 325 claims (12%) were associated with the claim subject’s death and 190 claims (7%) with no harm to the claim subject. There were 314 closed claims (12%) for which the extent of harm was Not known (tables 3.10 and 3.11).
Claims closed between 1 July 2009 and 30 June 2010 were very similar to all claims and new claims during the period in terms of which clinician specialties were most frequently recorded amongst these claims (see Section 3.3). General practice and Obstetrics and Gynaecology were recorded for 24% and 14% (632 and 359 respectively) of closed claims.
The other frequently recorded specialties were General surgery, Orthopaedic surgery and Emergency medicine (196, 184, 156 claims respectively), each associated with 6–7% of claims (Table 3.10). All other specialities, which include all specialties other than the 12 that are individually listed, were recorded for 27% of closed claims.
Moderate injury was the most commonly recorded ‘extent of harm’ category for the majority of clinical specialties (Table 3.11). However, its place was taken by Mild injury for Anaesthetics and General practice (40% and 20% of these claims respectively), by Severe injury for Diagnostic radiology (29% of these claims), and by Death for Psychiatry (27% of these claims).

20 Public and private sector medical indemnity claims in Australia 2009–10
Table 3.10: Closed claims(a): specialties of clinicians involved, by extent of harm, 1 July 2009 to 30 June 2010
Extent of harm
Specialty of clinician(s)
(b)
Mild injury
Moderate injury
Severe injury Death
No body function/ structure affected
Not known Total
Total per
cent
Anaesthetics 36 14 11 7 5 17 90 3.4
Diagnostic radiology 20 25 26 10 6 4 91 3.4
Emergency medicine 33 54 26 36 3 4 156 5.9
General and internal medicine 7 12 5 10 0 5 39 1.5
General nursing 10 15 3 9 1 1 39 1.5
General practice(c)
128 123 100 97 83 101 632 23.9
General surgery 40 82 30 20 10 14 196 7.4
Obstetrics and Gynaecology
(d) 66 116 95 28 12 42 359 13.6
Orthopaedic surgery 40 71 44 4 4 21 184 7.0
Psychiatry 13 13 12 23 13 11 85 3.2
Urology 6 14 11 4 2 2 39 1.5
Other hospital-based medical practitioner
(e) 18 18 8 18 18 25 105
4.0
All other specialties
(f) 227 181 125 65 34 72 704 26.7
Not applicable(g)
7 2 2 2 0 1 14 0.5
Not known 0 1 1 1 2 0 5 0.2
Total(h)
635 710 466 325 190 314 2,640 100.0
(a) Closed claims are claims that were closed between 1 July 2009 and 30 June 2010. Excluded are 12 public sector claims that duplicate the extent of harm and specialty of clinician data recorded in another claim (see Box 1.1).
(b) Only the 12 specialties that were most frequently recorded for closed claims are listed.
(c) Includes both procedural and non-procedural general practitioners.
(d) Includes specialists in Obstetrics only, Gynaecology only, and Obstetrics and gynaecology.
(e) Other hospital-based medical practitioner includes junior doctors, resident doctors, house officers and other medical practitioners who do not have a specialty.
(f) Covers all clinician specialty categories other than the 12 which are individually listed.
(g) Indicates that no clinical staff were involved in the incident (for example, where the claim relates to actions of hospital administrative staff).
(h) This is the total number of claims for which each claim size was recorded. A given specialty may only be recorded once for a single claim in the private sector, but up to four different specialties may be recorded for a public sector claim. Therefore, some public sector claims are represented in more than one row, and so the column totals exceed the number of claims. Also the percentage values in the last column, which show the proportion of claims for which each clinician specialty was recorded, cannot be summed vertically to give 100%.

Public and private sector medical indemnity claims in Australia 2009–10 21
Table 3.11: Closed claims(a): specialties of clinicians involved, by extent of harm, 1 July 2009 to 30 June 2010 (per cent)
Extent of harm
Specialty of clinician(s)(b)
Mild
injury
Moderate
injury
Severe
injury Death
No body
function/
structure
affected
Not
known Total
Anaesthetics 40.0 15.6 12.2 7.8 5.6 18.9 100.0
Diagnostic radiology 22.0 27.5 28.6 11.0 6.6 4.4 100.0
Emergency medicine 21.2 34.6 16.7 23.1 1.9 2.6 100.0
General and internal
medicine 17.9 30.8 12.8 25.6 0.0 12.8 100.0
General nursing 25.6 38.5 7.7 23.1 2.6 2.6 100.0
General practice(c)
20.3 19.5 15.8 15.3 13.1 16.0 100.0
General surgery 20.4 41.8 15.3 10.2 5.1 7.1 100.0
Obstetrics and
Gynaecology(d)
18.4 32.3 26.5 7.8 3.3 11.7 100.0
Orthopaedic surgery 21.7 38.6 23.9 2.2 2.2 11.4 100.0
Psychiatry 15.3 15.3 14.1 27.1 15.3 12.9 100.0
Urology 15.4 35.9 28.2 10.3 5.1 5.1 100.0
Other hospital-based medical
practitioner(e)
17.1 17.1 7.6 17.1 17.1 23.8 100.0
All other specialties(f)
32.2 25.7 17.8 9.2 4.8 10.2 100.0
Not applicable(g)
50.0 14.3 14.3 14.3 0.0 7.1 100.0
Not known 0.0 20.0 20.0 20.0 40.0 0.0 100.0
Total 24.1 26.9 17.7 12.3 7.2 11.9 100.0
(a) Closed claims are claims that were closed between 1 July 2009 and 30 June 2010. Excluded are 12 public sector claims that duplicate the extent of harm and specialty of clinician data recorded in another claim (see Box 1.1).
(b) Only the 12 specialties that were most frequently recorded for closed claims are listed.
(c) Includes both procedural and non-procedural general practitioners.
(d) Includes specialists in Obstetrics only, Gynaecology only, and Obstetrics and gynaecology.
(e) Other hospital-based medical practitioner includes junior doctors, resident doctors, house officers and other medical practitioners who do not have a specialty.
(f) Covers all clinician specialty categories other than the 12 which are individually listed.
(g) Indicates that no clinical staff were involved in the incident (for example where the claim relates to actions of hospital administrative staff).
Note: Percentages may not add up exactly to 100.0 due to rounding.

22 Public and private sector medical indemnity claims in Australia 2009–10
4 Patients who were the subjects of claims
This section provides a profile of the patients involved in the alleged health-care incident (‘sex and age group of claim subject’) and of the patients’ alleged body function/structure affected (‘primary body function/structure affected’). The 2009–10 data are presented in terms of the seven age groups used in the public sector MINC reports, whereas previous public and private sector reports presented data only in terms of those aged less than 1, between 1–17 and 18 or more.
4.1 Sex and age group of claim subject The age of claim subjects refers to their age at the time of the alleged incident that gave rise to the claim. During 2009–10, 9% (810) of all claims and 5% (145) of new claims related to babies aged less than 1, 6% of all and 4% of new claims (566 and 110 respectively) related to persons aged 1–17 and 71% of all claims and 74% of new claims (6,623 and 2,143 claims) were related to adults (aged 18+). The age of the claim subject was not known in 15% (1,392) of all claims and 17% (494) of new claims (tables 4.1 to 4.4).
These proportions were similar to those recorded for 2008–09, although the proportion of claims with an adult claim subject was lower (65% and 60% for all and new claims respectively) and the Not known proportions were higher (19% and 30% for all and new claims respectively) for 2008–09 (AIHW 2011a).
The claim subject was female in more than half of all and new claims in 2009–10 (55% and 53% respectively) and male in just over one-third of all (36%) and new claims (35%). In the case of persons aged 1–17 the claim subject was more often male than female. Similarly, with the 2008–09 data, female adult claim subjects outnumbered male claim subjects, whereas male claim subjects aged 1–17 outnumbered their female counterparts (AIHW 2011a), as with 2009–10.
In 2009–10, the larger number of female compared to male adult claim subjects was particularly a feature of the 18–39 age group. For both all and new claims, the number of female claim subjects was more than twice the number of male claim subjects.
4.2 Primary incident/allegation type In 2009–10, Diagnosis and Procedure were the most frequently recorded incident/allegation types for males, respectively accounting for 27% (919) and 25% (847) of all claims, and 22% (229) and 23% (241) of new claims. Treatment was also often recorded, for 19% of both all and new claims (644 and 194 respectively). With females, Procedure was the most common incident/allegation type, recorded for 32% (1,656) of all claims and 29% (451) of new claims. Diagnosis and Treatment followed in frequency, being respectively recorded for 24% (1,223) and 15% (755) of all claims, and 21% (331) and 15% (224) of new claims. Similar results were found for the 2008–09 claims data (AIHW 2011a).
As in 2007–08 and 2008–09, a relatively high proportion of claims with the claim subject recorded as a baby had a primary incident/allegation type of Procedure and Treatment (AIHW 2011a, 2011b). For 2009–10, this was the case with 28% and 27% respectively of all baby claims and 16% and 21% respectively of new baby claims. Diagnosis on the other hand was more a feature of claims with a person aged 1–17 as the claim subject, and was recorded for 237 (43%) of all claims and 37 (34%) of new claims for that age group (figures 4.1 and 4.2).

Public and private sector medical indemnity claims in Australia 2009–10 23
The proportion of all claims with Procedure as the incident/allegation type varied between 34% for adults aged 60–79 and 22% for adults aged 80 or more. Procedure was the most common incident/allegation type for every adult age category for new claims (figures 4.1 and 4.2).
The data on claim subjects’ age and sex in previous reports up to 2006–07 in this series (AIHW 2007, 2008, 2010) were not presented in a way that allows many direct comparisons with the 2009–10 data. However for new claims since 2004–05, it can be noted that the proportion with baby claim subjects has remained constant at 4–6%, the proportion involving claim subjects aged 1–17 has varied between 4% and 8% and the proportion of adult claim subjects has varied between 60% and 74%. In addition, as of 2006–07 Treatment was recorded for a higher proportion of both all and new claims with babies as the claim subject than claims associated with any other age group.
Figure 4.1: All claims: five most common primary incident/allegation types, by claim subject’s age group, 2009–10 (per cent)
0
10
20
30
40
50
60
70
80
90
<1 1–4 5–17 18–39 40–59 60–79 80 or more
Per cent
Age group (years)
Diagnosis
General duty of care
Medication-related
Procedure
Treatment

24 Public and private sector medical indemnity claims in Australia 2009–10
Figure 4.2: New claims: five most common primary incident/allegation types, by claim subject’s age group, 2009–10 (per cent)
4.3 Primary body function/structure affected The ‘primary body function/structure affected’ specifies the main body function or structure of the claim subject which is alleged to have been affected as a result of the health-care incident. Coding examples for selected categories of this data item are provided in Appendix 4 (Table A4.1).
During 2009–10, the most frequently recorded body function/structure affected was Neuromusculoskeletal and movement-related which was recorded for about 18% of both all claims (1,732 of 9,381) and new claims (505 of 2,892) (tables 4.5 to 4.8). The next three most frequently recorded categories for all claims were Mental and nervous system, Death and Genitourinary and reproductive, recorded for 15% (1,388) and 12% (1,135) and 11% (983) respectively. For new claims, Digestive, metabolic and endocrine systems and Death were the second and third most frequently recorded categories, each recorded for 12% (357 and 344 respectively) of claims (tables 4.5 to 4.8). Those claims where no body function/structure of the claim subject was affected represented 6% (594) of all claims and 7% (215) of new claims.
Neuromusculoskeletal and movement-related was the category most frequently recorded for children aged 1–17 (147 all claims; 22 new claims) and adults aged 40–59 and 60–79. While male adult claims relating to Neuromusculoskeletal and movement-related decreased with increasing age, from 28% to 13% for all claims, for females the pattern was reversed, with the proportion of claims generally increasing as age increased (from 15% to 27% for all claims) (tables 4.5 to 4.8).
In 2009–10, 11% of all claims and 19% of new claims recorded the primary body function/structure affected as Not known. This compares to 12% of all claims and 25% of new claims in 2008–09.
Death was recorded more frequently for male claim subjects being associated with 15% of both all and new claims where the subject was male (519 and 160 claims respectively), compared to just under 10% of both all and new claims where the claim subject was female (482 and 149 respectively). Similar proportions of claims recording Death as the primary body
0
10
20
30
40
50
60
70
80
90
<1 1–4 5–17 18–39 40–59 60–79 80 or more
Per cent
Age group (years)
Diagnosis
General duty of care
Medication-related
Procedure
Treatment
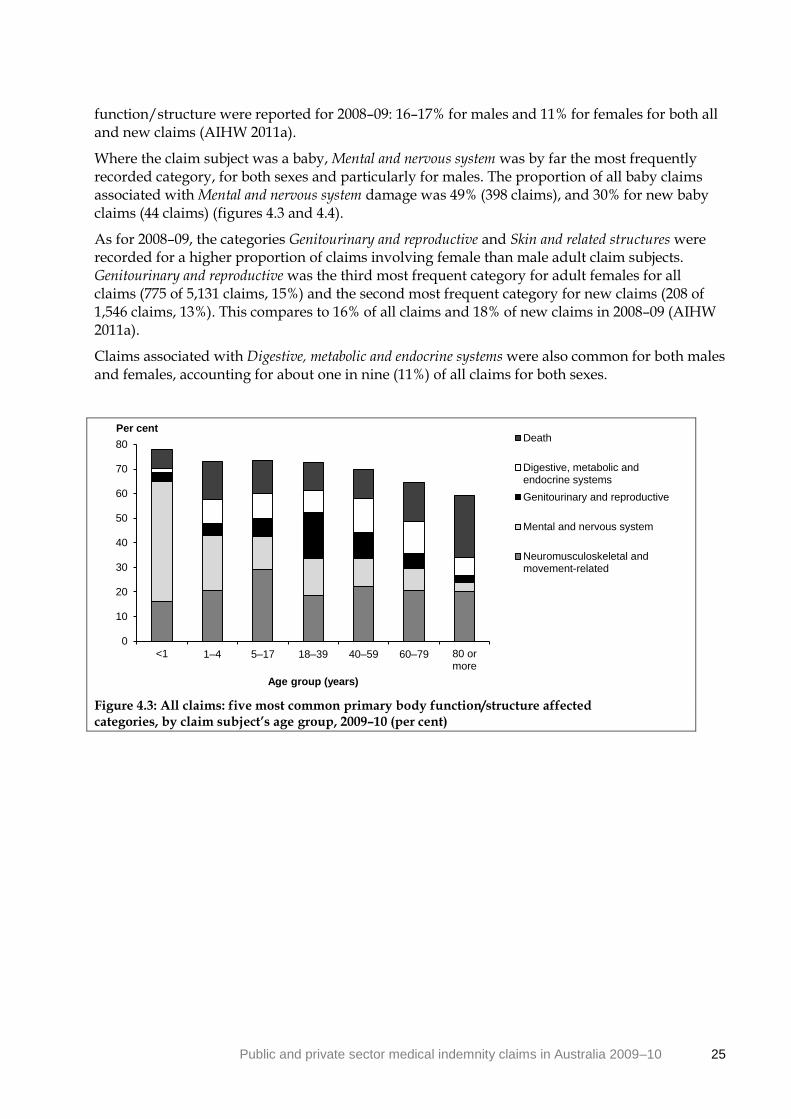
Public and private sector medical indemnity claims in Australia 2009–10 25
function/structure were reported for 2008–09: 16–17% for males and 11% for females for both all and new claims (AIHW 2011a).
Where the claim subject was a baby, Mental and nervous system was by far the most frequently recorded category, for both sexes and particularly for males. The proportion of all baby claims associated with Mental and nervous system damage was 49% (398 claims), and 30% for new baby claims (44 claims) (figures 4.3 and 4.4).
As for 2008–09, the categories Genitourinary and reproductive and Skin and related structures were recorded for a higher proportion of claims involving female than male adult claim subjects. Genitourinary and reproductive was the third most frequent category for adult females for all claims (775 of 5,131 claims, 15%) and the second most frequent category for new claims (208 of 1,546 claims, 13%). This compares to 16% of all claims and 18% of new claims in 2008–09 (AIHW 2011a).
Claims associated with Digestive, metabolic and endocrine systems were also common for both males and females, accounting for about one in nine (11%) of all claims for both sexes.
Figure 4.3: All claims: five most common primary body function/structure affected categories, by claim subject’s age group, 2009–10 (per cent)
0
10
20
30
40
50
60
70
80
<1 1–4 5–17 18–39 40–59 60–79 80 ormore
Per cent
Age group (years)
Death
Digestive, metabolic andendocrine systems
Genitourinary and reproductive
Mental and nervous system
Neuromusculoskeletal andmovement-related

26 Public and private sector medical indemnity claims in Australia 2009–10
Figure 4.4: New claims: five most common primary body function/structure
affected categories, by claim subject’s age group, 2009–10 (per cent)
0
10
20
30
40
50
60
70
<1 1–4 5–17 18–39 40–59 60–79 80 ormore
Per cent
Age group (years)
Death
Digestive, metabolic andendocrine systems
Genitourinary andreproductive
Mental and nervous system
Neuromusculoskeletal andmovement-related

Public and private sector medical indemnity claims in Australia 2009–10 27
Table 4.1: All claims(a): primary incident/allegation type, by sex and age group of claim subject, 1 July 2009 to 30 June 2010
Age group (years)
Primary incident/
allegation type <1 1–4 5–17 18–39 40–59 60–79 80 or more
Not known Total
Males
Anaesthetic 1 0 3 9 29 19 2 5 68
Blood/blood product-related 4 0 3 11 7 4 0 0 29
Consent 7 1 4 18 33 7 0 12 82
Device failure(b)
0 0 0 1 5 4 2 3 15
Diagnosis 87 41 95 220 304 110 9 53 919
General duty of care 16 3 12 47 63 29 5 19 194
Infection control 2 1 4 4 10 5 0 3 29
Medication-related 6 3 7 53 66 25 4 15 179
Procedure 104 13 31 177 294 170 14 44 847
Treatment 100 18 32 164 189 90 8 43 644
Other 3 0 6 19 26 10 2 18 84
Not known 44 5 15 59 71 37 10 52 293
Total males 374 85 212 782 1,097 510 56 267 3,383
Females
Anaesthetic 3 1 1 36 29 26 3 15 114
Blood/blood product-related 1 0 2 8 10 3 0 1 25
Consent 4 1 7 79 77 29 1 22 220
Device failure(b)
1 1 1 8 2 6 0 0 19
Diagnosis 111 34 62 416 380 114 14 92 1,223
General duty of care 7 0 5 107 56 38 14 32 259
Infection control 2 0 0 5 4 4 0 6 21
Medication-related 12 2 6 72 82 34 4 9 221
Procedure 114 14 37 611 572 192 14 96 1,656
Treatment 110 17 23 251 211 76 7 60 755
Other 5 0 4 55 57 20 3 57 201
Not known 31 6 12 168 76 28 11 85 417
Total females 401 76 166 1,816 1,556 567 71 478 5,131
Persons(c)
Anaesthetic 5 1 4 46 58 43 5 33 195
Blood/blood product-related 5 0 5 22 17 7 0 3 59
Consent 11 2 11 97 113 37 1 42 314
Device failure(b)
1 1 1 9 8 10 2 5 37
Diagnosis 201 78 159 649 697 228 23 186 2,221
General duty of care 24 3 19 166 129 72 19 117 549
Infection control 4 1 4 10 14 9 0 10 52
Medication-related 18 5 14 131 149 61 8 50 436
Procedure 223 29 74 796 875 377 28 168 2,570
Treatment 221 35 56 419 409 168 15 122 1,445
Other 8 2 10 83 90 33 5 305 536
Not known 89 13 29 233 155 73 24 351 967
Total persons 810 170 386 2,661 2,714 1,118 130 1,392 9,381
(a) Claims that were open at any point during the financial year. Excluded are 34 public sector claims that duplicate the primary incident/allegation and claim subject demographic data recorded in another claim (see Box 1.1).
(b) Aligns to ‘Faulty/contaminated equipment’ in the APRA NCPD (ISA data item 15, Appendix 1).
(c) ‘Persons’ includes claims for males, females and persons whose sex was indeterminate or unknown.

28 Public and private sector medical indemnity claims in Australia 2009–10
Table 4.2: All claims(a): primary incident/allegation type, by sex and age group of claim subject, 1 July 2009 to 30 June 2010 (per cent)
Age group (years)
Primary incident/ allegation type <1 1–4 5–17 18–39 40–59 60–79
80 or more
Not known Total
Males
Anaesthetic 0.3 0.0 1.4 1.2 2.6 3.7 3.6 1.9 2.0
Blood/blood product-related 1.1 0.0 1.4 1.4 0.6 0.8 0.0 0.0 0.9
Consent 1.9 1.2 1.9 2.3 3.0 1.4 0.0 4.5 2.4
Device failure(b)
0.0 0.0 0.0 0.1 0.5 0.8 3.6 1.1 0.4
Diagnosis 23.3 48.2 44.8 28.1 27.7 21.6 16.1 19.9 27.2
General duty of care 4.3 3.5 5.7 6.0 5.7 5.7 8.9 7.1 5.7
Infection control 0.5 1.2 1.9 0.5 0.9 1.0 0.0 1.1 0.9
Medication-related 1.6 3.5 3.3 6.8 6.0 4.9 7.1 5.6 5.3
Procedure 27.8 15.3 14.6 22.6 26.8 33.3 25.0 16.5 25.0
Treatment 26.7 21.2 15.1 21.0 17.2 17.6 14.3 16.1 19.0
Other 0.8 0.0 2.8 2.4 2.4 2.0 3.6 6.7 2.5
Not known 11.8 5.9 7.1 7.5 6.5 7.3 17.9 19.5 8.7
Total males 100.0 100.0 100.0 100.0 100.0 100.0 100.0 100.0 100.0
Females
Anaesthetic 0.7 1.3 0.6 2.0 1.9 4.6 4.2 3.1 2.2
Blood/blood product-related 0.2 0.0 1.2 0.4 0.6 0.5 0.0 0.2 0.5
Consent 1.0 1.3 4.2 4.4 4.9 5.1 1.4 4.6 4.3
Device failure(b)
0.2 1.3 0.6 0.4 0.1 1.1 0.0 0.0 0.4
Diagnosis 27.7 44.7 37.3 22.9 24.4 20.1 19.7 19.2 23.8
General duty of care 1.7 0.0 3.0 5.9 3.6 6.7 19.7 6.7 5.0
Infection control 0.5 0.0 0.0 0.3 0.3 0.7 0.0 1.3 0.4
Medication-related 3.0 2.6 3.6 4.0 5.3 6.0 5.6 1.9 4.3
Procedure 28.4 18.4 22.3 33.6 36.8 33.9 19.7 20.1 32.3
Treatment 27.4 22.4 13.9 13.8 13.6 13.4 9.9 12.6 14.7
Other 1.2 0.0 2.4 3.0 3.7 3.5 4.2 11.9 3.9
Not known 7.7 7.9 7.2 9.3 4.9 4.9 15.5 17.8 8.1
Total females 100.0 100.0 100.0 100.0 100.0 100.0 100.0 100.0 100.0
Persons(c)
Anaesthetic 0.6 0.6 1.0 1.7 2.1 3.8 3.8 2.4 2.1
Blood/blood product-related 0.6 0.0 1.3 0.8 0.6 0.6 0.0 0.2 0.6
Consent 1.4 1.2 2.8 3.6 4.2 3.3 0.8 3.0 3.3
Device failure(b)
0.1 0.6 0.3 0.3 0.3 0.9 1.5 0.4 0.4
Diagnosis 24.8 45.9 41.2 24.4 25.7 20.4 17.7 13.4 23.7
General duty of care 3.0 1.8 4.9 6.2 4.8 6.4 14.6 8.4 5.9
Infection control 0.5 0.6 1.0 0.4 0.5 0.8 0.0 0.7 0.6
Medication-related 2.2 2.9 3.6 4.9 5.5 5.5 6.2 3.6 4.6
Procedure 27.5 17.1 19.2 29.9 32.2 33.7 21.5 12.1 27.4
Treatment 27.3 20.6 14.5 15.7 15.1 15.0 11.5 8.8 15.4
Other 1.0 1.2 2.6 3.1 3.3 3.0 3.8 21.9 5.7
Not known 11.0 7.6 7.5 8.8 5.7 6.5 18.5 25.2 10.3
Total persons 100.0 100.0 100.0 100.0 100.0 100.0 100.0 100.0 100.0
(a) Claims that were open at any point during the financial year. Excluded are 34 public sector claims that duplicate the primary incident/allegation and claim subject demographic data recorded in another claim (see Box 1.1).
(b) Aligns to ‘Faulty/contaminated equipment’ in the APRA NCPD (ISA data item 15, Appendix 1).
(c) ‘Persons’ includes claims for males, females and persons whose sex was indeterminate or unknown.
Note: Percentages may not add up exactly to 100.0 due to rounding.

Public and private sector medical indemnity claims in Australia 2009–10 29
Table 4.3: New claims(a): primary incident/allegation type, by sex and age group of claim subject, 1 July 2009 to 30 June 2010
Primary incident/ allegation type
Age group (years)
<1 1–4 5–17 18–39 40–59 60–79 80 or more
Not known Total
Males
Anaesthetic 0 0 1 2 8 9 0 2 22
Blood/blood product-related 0 0 1 2 1 1 0 0 5
Consent 0 1 1 3 9 1 0 8 23
Device failure(b)
0 0 0 1 2 2 1 0 6
Diagnosis 6 6 15 53 89 38 4 18 229
General duty of care 3 0 2 9 20 13 2 7 56
Infection control 1 0 1 3 2 2 0 0 9
Medication-related 0 0 2 11 24 8 3 7 55
Procedure 13 2 4 42 103 49 5 23 241
Treatment 10 3 7 49 73 28 4 20 194
Other 1 0 0 3 10 3 0 3 20
Not known 30 3 9 40 46 27 9 16 180
Total males 64 15 43 218 387 181 28 104 1,040
Females
Anaesthetic 0 0 0 6 5 1 2 4 18
Blood/blood product-related 0 0 1 1 6 7 0 9 24
Consent 0 0 1 13 17 9 0 10 50
Device failure(b)
1 1 0 1 0 1 0 0 4
Diagnosis 13 5 9 109 113 32 5 45 331
General duty of care 1 0 1 29 27 16 7 9 90
Infection control 0 0 0 0 1 1 0 0 2
Medication-related 0 0 1 8 25 12 2 2 50
Procedure 10 0 7 141 190 58 8 37 451
Treatment 15 3 5 59 85 29 1 27 224
Other 2 0 0 5 12 6 3 17 45
Not known 22 3 7 103 45 24 8 45 257
Total females 64 12 32 475 526 196 36 205 1,546
Persons(c)
Anaesthetic 1 0 1 9 17 17 2 19 66
Blood/blood product-related 0 0 2 3 3 2 0 1 11
Consent 0 1 2 16 28 11 0 22 80
Device failure(b)
1 1 0 2 3 3 1 0 11
Diagnosis 20 13 24 169 208 71 9 68 582
General duty of care 4 0 5 49 53 31 9 23 174
Infection control 1 0 1 3 3 3 0 1 12
Medication-related 0 0 3 25 49 21 5 10 113
Procedure 23 4 11 187 295 112 13 62 707
Treatment 30 6 12 109 162 58 5 51 433
Other 3 0 0 17 27 11 3 96 157
Not known 62 6 18 146 97 56 20 141 546
Total persons 145 31 79 735 945 396 67 494 2,892
(a) Claims that were opened or notified during the financial year. Excluded are eight public sector claims that duplicate the primary incident/allegation and claim subject demographic data recorded in another claim (see Box 1.1).
(b) Aligns to ‘Faulty/contaminated equipment’ in the APRA NCPD (ISA data item 15, Appendix 1).
(c) ‘Persons’ includes claims for males, females and persons whose sex was indeterminate or unknown.

30 Public and private sector medical indemnity claims in Australia 2009–10
Table 4.4: New claims(a): primary incident/allegation type, by sex and age group of claim subject, 1 July 2009 to 30 June 2010 (per cent)
Age group (years)
Primary incident/
allegation type <1 1–4 5–17 18–39 40–59 60–79 80 or more
Not known Total
Males Anaesthetic 0.0 0.0 2.3 0.9 2.1 5.0 0.0 1.9 2.1
Blood/blood product-related 0.0 0.0 2.3 0.9 0.3 0.6 0.0 0.0 0.5
Consent 0.0 6.7 2.3 1.4 2.3 0.6 0.0 7.7 2.2
Device failure(b)
0.0 0.0 0.0 0.5 0.5 1.1 3.6 0.0 0.6
Diagnosis 9.4 40.0 34.9 24.3 23.0 21.0 14.3 17.3 22.0
General duty of care 4.7 0.0 4.7 4.1 5.2 7.2 7.1 6.7 5.4
Infection control 1.6 0.0 2.3 1.4 0.5 1.1 0.0 0.0 0.9
Medication-related 0.0 0.0 4.7 5.0 6.2 4.4 10.7 6.7 5.3
Procedure 20.3 13.3 9.3 19.3 26.6 27.1 17.9 22.1 23.2
Treatment 15.6 20.0 16.3 22.5 18.9 15.5 14.3 19.2 18.7
Other 1.6 0.0 0.0 1.4 2.6 1.7 0.0 2.9 1.9
Not known 46.9 20.0 20.9 18.3 11.9 14.9 32.1 15.4 17.3
Total males 100.0 100.0 100.0 100.0 100.0 100.0 100.0 100.0 100.0
Females
Anaesthetic 0.0 0.0 0.0 1.3 1.0 0.5 5.6 2.0 1.2
Blood/blood product-related 0.0 0.0 3.1 0.2 1.1 3.6 0.0 4.4 1.6
Consent 0.0 0.0 3.1 2.7 3.2 4.6 0.0 4.9 3.2
Device failure(b)
1.6 8.3 0.0 0.2 0.0 0.5 0.0 0.0 0.3
Diagnosis 20.3 41.7 28.1 22.9 21.5 16.3 13.9 22.0 21.4
General duty of care 1.6 0.0 3.1 6.1 5.1 8.2 19.4 4.4 5.8
Infection control 0.0 0.0 0.0 0.0 0.2 0.5 0.0 0.0 0.1
Medication-related 0.0 0.0 3.1 1.7 4.8 6.1 5.6 1.0 3.2
Procedure 15.6 0.0 21.9 29.7 36.1 29.6 22.2 18.0 29.2
Treatment 23.4 25.0 15.6 12.4 16.2 14.8 2.8 13.2 14.5
Other 3.1 0.0 0.0 1.1 2.3 3.1 8.3 8.3 2.9
Not known 34.4 25.0 21.9 21.7 8.6 12.2 22.2 22.0 16.6
Total females 100.0 100.0 100.0 100.0 100.0 100.0 100.0 100.0 100.0
Persons(c)
Anaesthetic 0.7 0.0 1.3 1.2 1.8 4.3 3.0 3.8 2.3
Blood/blood product-related 0.0 0.0 2.5 0.4 0.3 0.5 0.0 0.2 0.4
Consent 0.0 3.2 2.5 2.2 3.0 2.8 0.0 4.5 2.8
Device failure(b)
0.7 3.2 0.0 0.3 0.3 0.8 1.5 0.0 0.4
Diagnosis 13.8 41.9 30.4 23.0 22.0 17.9 13.4 13.8 20.1
General duty of care 2.8 0.0 6.3 6.7 5.6 7.8 13.4 4.7 6.0
Infection control 0.7 0.0 1.3 0.4 0.3 0.8 0.0 0.2 0.4
Medication-related 0.0 0.0 3.8 3.4 5.2 5.3 7.5 2.0 3.9
Procedure 15.9 12.9 13.9 25.4 31.2 28.3 19.4 12.6 24.4
Treatment 20.7 19.4 15.2 14.8 17.1 14.6 7.5 10.3 15.0
Other 2.1 0.0 0.0 2.3 2.9 2.8 4.5 19.4 5.4
Not known 42.8 19.4 22.8 19.9 10.3 14.1 29.9 28.5 18.9
Total persons 100.0 100.0 100.0 100.0 100.0 100.0 100.0 100.0 100.0
(a) Claims that were opened or notified during the financial year. Excluded are eight public sector claims that duplicate the primary incident/allegation and claim subject demographic data recorded in another claim (see Box 1.1).
(b) Aligns to ‘Faulty/contaminated equipment’ in the APRA NCPD (ISA data item 15, Appendix 1).
(c) ‘Persons’ includes claims for males, females and persons whose sex was indeterminate or unknown.
Note: Percentages may not add up exactly to 100.0 due to rounding.

Public and private sector medical indemnity claims in Australia 2009–10 31
Table 4.5: All claims(a): primary body function/structure affected, by sex and age group of claim subject, 1 July 2009 to 30 June 2010
Age group (years)
Primary body function/
structure affected <1 1–4 5–17 18–39 40–59 60–79 80 or more
Not known Total
Males
Cardiovascular, haematological,
immunological and respiratory 28 6 10 46 77 48 3 16 234
Death 20 14 32 120 192 93 21 27 519
Digestive, metabolic and
endocrine systems 6 7 16 82 150 63 3 45 372
Genitourinary and reproductive 16 7 16 40 61 34 4 9 187
Mental and nervous system 197 20 29 103 126 43 1 27 546
Neuromusculoskeletal and
movement-related 48 17 59 220 253 98 7 35 737
Sensory functions and structures 5 5 13 38 72 51 5 9 198
Skin and related structures 3 5 6 39 60 19 1 10 143
Voice and speech 1 1 3 5 5 4 0 0 19
No function/structure affected 7 0 3 24 28 14 1 26 103
Not known 43 3 25 65 73 43 10 63 325
Total males 374 85 212 782 1,097 510 56 267 3,383
Females
Cardiovascular, haematological,
immunological and respiratory 27 1 8 86 100 37 2 18 279
Death 37 11 19 166 124 73 12 40 482
Digestive, metabolic and
endocrine systems 7 9 23 152 215 78 6 83 573
Genitourinary and reproductive 11 1 11 452 229 32 0 39 775
Mental and nervous system 188 17 24 291 172 54 4 41 791
Neuromusculoskeletal and
movement-related 80 18 52 273 344 129 19 57 972
Sensory functions and structures 4 7 7 50 71 50 6 20 215
Skin and related structures 6 5 7 109 153 44 1 36 361
Voice and speech 0 0 1 4 16 7 0 1 29
No function/structure affected 4 2 6 57 37 24 8 52 190
Not known 37 5 8 176 95 39 13 91 464
Total females 401 76 166 1,816 1,556 567 71 478 5,131
Persons(b)
Cardiovascular, haematological,
immunological and respiratory 58 7 19 141 182 90 5 44 546
Death 62 26 52 300 329 177 33 156 1,135
Digestive, metabolic and
endocrine systems 14 17 39 236 371 144 9 142 972
Genitourinary and reproductive 27 8 28 500 293 68 4 55 983
Mental and nervous system 398 38 53 400 300 101 5 93 1,388
Neuromusculoskeletal and
movement-related 130 35 112 495 606 230 26 98 1,732
Sensory functions and structures 9 13 21 88 143 104 11 34 423
Skin and related structures 10 10 13 149 216 63 2 52 515
Voice and speech 1 2 4 9 21 11 0 2 50
No function/structure affected 11 2 10 95 76 40 9 351 594
Not known 90 12 35 248 177 90 26 365 1,043
Total persons 810 170 386 2,661 2,714 1,118 130 1,392 9,381
(a) Claims that were open at any point during the financial year. Excluded are 34 public sector claims that duplicate the primary body function/structure affected and claim subject demographic data recorded in another claim (see Box 1.1).
(b) ‘Persons’ includes claims for males, females and persons whose sex was indeterminate or unknown.

32 Public and private sector medical indemnity claims in Australia 2009–10
Table 4.6: All claims(a): primary body function/structure affected, by sex and age group of claim subject, 1 July 2009 to 30 June 2010 (per cent)
Age group (years)
Primary body function/
structure affected <1 1–4 5–17 18–39 40–59 60–79 80 or more
Not known Total
Males
Cardiovascular, haematological, immunological and respiratory 7.5 7.1 4.7 5.9 7.0 9.4 5.4 6.0 6.9
Death 5.3 16.5 15.1 15.3 17.5 18.2 37.5 10.1 15.3
Digestive, metabolic and endocrine systems 1.6 8.2 7.5 10.5 13.7 12.4 5.4 16.9 11.0
Genitourinary and reproductive 4.3 8.2 7.5 5.1 5.6 6.7 7.1 3.4 5.5
Mental and nervous system 52.7 23.5 13.7 13.2 11.5 8.4 1.8 10.1 16.1
Neuromusculoskeletal and movement-related 12.8 20.0 27.8 28.1 23.1 19.2 12.5 13.1 21.8
Sensory functions and structures 1.3 5.9 6.1 4.9 6.6 10.0 8.9 3.4 5.9
Skin and related structures 0.8 5.9 2.8 5.0 5.5 3.7 1.8 3.7 4.2
Voice and speech 0.3 1.2 1.4 0.6 0.5 0.8 0.0 0.0 0.6
No function/structure affected 1.9 0.0 1.4 3.1 2.6 2.7 1.8 9.7 3.0
Not known 11.5 3.5 11.8 8.3 6.7 8.4 17.9 23.6 9.6
Total males 100.0 100.0 100.0 100.0 100.0 100.0 100.0 100.0 100.0
Females
Cardiovascular, haematological, immunological and respiratory 6.7 1.3 4.8 4.7 6.4 6.5 2.8 3.8 5.4
Death 9.2 14.5 11.4 9.1 8.0 12.9 16.9 8.4 9.4
Digestive, metabolic and endocrine systems 1.7 11.8 13.9 8.4 13.8 13.8 8.5 17.4 11.2
Genitourinary and reproductive 2.7 1.3 6.6 24.9 14.7 5.6 0.0 8.2 15.1
Mental and nervous system 46.9 22.4 14.5 16.0 11.1 9.5 5.6 8.6 15.4
Neuromusculoskeletal and movement-related 20.0 23.7 31.3 15.0 22.1 22.8 26.8 11.9 18.9
Sensory functions and structures 1.0 9.2 4.2 2.8 4.6 8.8 8.5 4.2 4.2
Skin and related structures 1.5 6.6 4.2 6.0 9.8 7.8 1.4 7.5 7.0
Voice and speech 0.0 0.0 0.6 0.2 1.0 1.2 0.0 0.2 0.6
No function/structure affected 1.0 2.6 3.6 3.1 2.4 4.2 11.3 10.9 3.7
Not known 9.2 6.6 4.8 9.7 6.1 6.9 18.3 19.0 9.0
Total females 100.0 100.0 100.0 100.0 100.0 100.0 100.0 100.0 100.0
Persons(b)
Cardiovascular, haematological, immunological and respiratory 7.2 4.1 4.9 5.3 6.7 8.1 3.8 3.2 5.8
Death 7.7 15.3 13.5 11.3 12.1 15.8 25.4 11.2 12.1
Digestive, metabolic and endocrine systems 1.7 10.0 10.1 8.9 13.7 12.9 6.9 10.2 10.4
Genitourinary and reproductive 3.3 4.7 7.3 18.8 10.8 6.1 3.1 4.0 10.5
Mental and nervous system 49.1 22.4 13.7 15.0 11.1 9.0 3.8 6.7 14.8
Neuromusculoskeletal and movement-related 16.0 20.6 29.0 18.6 22.3 20.6 20.0 7.0 18.5
Sensory functions and structures 1.1 7.6 5.4 3.3 5.3 9.3 8.5 2.4 4.5
Skin and related structures 1.2 5.9 3.4 5.6 8.0 5.6 1.5 3.7 5.5
Voice and speech 0.1 1.2 1.0 0.3 0.8 1.0 0.0 0.1 0.5
No function/structure affected 1.4 1.2 2.6 3.6 2.8 3.6 6.9 25.2 6.3
Not known 11.1 7.1 9.1 9.3 6.5 8.1 20.0 26.2 11.1
Total persons 100.0 100.0 100.0 100.0 100.0 100.0 100.0 100.0 100.0
(a) Claims that were open at any point during the financial year. Excluded are 34 public sector claims that duplicate the primary body function/structure affected and claim subject demographic data recorded in another claim (see Box 1.1).
(b) ‘Persons’ includes claims for males, females and persons whose sex was indeterminate or unknown.
Note: Percentages may not add up exactly to 100.0 due to rounding.

Public and private sector medical indemnity claims in Australia 2009–10 33
Table 4.7: New claims(a): primary body function/structure affected, by sex and age group of claim subject, 1 July 2009 to 30 June 2010
Age group (years)
Primary body function/ structure affected <1 1–4 5–17 18–39 40–59 60–79
80 or more
Not known Total
Males
Cardiovascular, haematological,
immunological and respiratory 5 2 3 10 21 9 0 4 54
Death 4 2 5 31 71 26 10 11 160
Digestive, metabolic and
endocrine systems 0 1 5 25 53 31 1 26 142
Genitourinary and reproductive 1 1 2 8 21 10 1 2 46
Mental and nervous system 22 1 4 27 30 14 0 10 108
Neuromusculoskeletal and
movement-related 5 4 10 54 90 36 4 16 219
Sensory functions and structures 0 0 0 9 23 11 1 4 48
Skin and related structures 0 3 1 9 17 6 1 5 42
Voice and speech 0 0 2 1 2 1 0 0 6
No function/structure affected 1 0 0 5 13 9 1 10 39
Not known 26 1 11 39 46 28 9 16 176
Total males 64 15 43 218 387 181 28 104 1,040
Females
Cardiovascular, haematological,
immunological and respiratory 5 0 1 12 25 7 0 6 56
Death 10 2 6 40 45 23 7 16 149
Digestive, metabolic and
endocrine systems 1 2 6 39 83 24 2 41 198
Genitourinary and reproductive 3 0 3 110 63 10 0 19 208
Mental and nervous system 20 1 2 49 46 16 1 12 147
Neuromusculoskeletal and
movement-related 4 3 5 72 105 51 8 31 279
Sensory functions and structures 0 2 2 14 25 13 2 7 65
Skin and related structures 0 0 0 22 50 16 1 13 102
Voice and speech 0 0 0 1 8 2 0 1 12
No function/structure affected 0 0 2 12 18 7 6 20 65
Not known 21 2 5 104 58 27 9 39 265
Total females 64 12 32 475 526 196 36 205 1,546
Persons(b)
Cardiovascular, haematological,
immunological and respiratory 10 2 5 25 48 19 0 14 123
Death 19 5 12 82 122 52 17 35 344
Digestive, metabolic and
endocrine systems 2 4 11 65 141 56 3 75 357
Genitourinary and reproductive 4 1 5 124 85 20 1 22 262
Mental and nervous system 44 2 6 79 77 33 1 23 265
Neuromusculoskeletal and
movement-related 10 7 15 127 197 89 12 48 505
Sensory functions and structures 0 3 2 23 48 25 3 11 115
Skin and related structures 1 3 1 32 68 22 2 19 148
Voice and speech 0 1 2 2 10 3 0 2 20
No function/structure affected 1 0 3 30 39 18 7 117 215
Not known 54 3 17 146 110 59 21 128 538
Total persons 145 31 79 735 945 396 67 494 2,892
(a) Claims that were opened or notified during the financial year. Excluded are eight public sector claims that duplicate the primary body function/structure affected and claim subject demographic data recorded in another claim (see Box 1.1).
(b) ‘Persons’ includes claims for males, females and persons whose sex was indeterminate or unknown.

34 Public and private sector medical indemnity claims in Australia 2009–10
Table 4.8: New claims(a): primary body function/structure affected, by sex and age group of claim subject, 1 July 2009 to 30 June 2010 (per cent)
Age group (years)
Primary body function/ structure affected <1 1–4 5–17 18–39 40–59 60–79
80 or more
Not known Total
Males
Cardiovascular, haematological,
immunological and respiratory 7.8 13.3 7.0 4.6 5.4 5.0 0.0 3.8 5.2
Death 6.3 13.3 11.6 14.2 18.3 14.4 35.7 10.6 15.4
Digestive, metabolic and
endocrine systems 0.0 6.7 11.6 11.5 13.7 17.1 3.6 25.0 13.7
Genitourinary and reproductive 1.6 6.7 4.7 3.7 5.4 5.5 3.6 1.9 4.4
Mental and nervous system 34.4 6.7 9.3 12.4 7.8 7.7 0.0 9.6 10.4
Neuromusculoskeletal and
movement-related 7.8 26.7 23.3 24.8 23.3 19.9 14.3 15.4 21.1
Sensory functions and
structures 0.0 0.0 0.0 4.1 5.9 6.1 3.6 3.8 4.6
Skin and related structures 0.0 20.0 2.3 4.1 4.4 3.3 3.6 4.8 4.0
Voice and speech 0.0 0.0 4.7 0.5 0.5 0.6 0.0 0.0 0.6
No function/structure affected 1.6 0.0 0.0 2.3 3.4 5.0 3.6 9.6 3.8
Not known 40.6 6.7 25.6 17.9 11.9 15.5 32.1 15.4 16.9
Total males 100.0 100.0 100.0 100.0 100.0 100.0 100.0 100.0 100.0
Females
Cardiovascular, haematological,
immunological and respiratory 7.8 0.0 3.1 2.5 4.8 3.6 0.0 2.9 3.6
Death 15.6 16.7 18.8 8.4 8.6 11.7 19.4 7.8 9.6
Digestive, metabolic and
endocrine systems 1.6 16.7 18.8 8.2 15.8 12.2 5.6 20.0 12.8
Genitourinary and reproductive 4.7 0.0 9.4 23.2 12.0 5.1 0.0 9.3 13.4
Mental and nervous system 31.3 8.3 6.3 10.3 8.7 8.2 2.8 5.9 9.5
Neuromusculoskeletal and
movement-related 6.3 25.0 15.6 15.2 20.0 26.0 22.2 15.1 18.0
Sensory functions and
structures 0.0 16.7 6.3 2.9 4.8 6.6 5.6 3.4 4.2
Skin and related structures 0.0 0.0 0.0 4.6 9.5 8.2 2.8 6.3 6.6
Voice and speech 0.0 0.0 0.0 0.2 1.5 1.0 0.0 0.5 0.8
No function/structure affected 0.0 0.0 6.3 2.5 3.4 3.6 16.7 9.8 4.2
Not known 32.8 16.7 15.6 21.9 11.0 13.8 25.0 19.0 17.1
Total females 100.0 100.0 100.0 100.0 100.0 100.0 100.0 100.0 100.0
Persons(b)
Cardiovascular, haematological,
immunological and respiratory 6.9 6.5 6.3 3.4 5.1 4.8 0.0 2.8 4.3
Death 13.1 16.1 15.2 11.2 12.9 13.1 25.4 7.1 11.9
Digestive, metabolic and
endocrine systems 1.4 12.9 13.9 8.8 14.9 14.1 4.5 15.2 12.3
Genitourinary and reproductive 2.8 3.2 6.3 16.9 9.0 5.1 1.5 4.5 9.1
Mental and nervous system 30.3 6.5 7.6 10.7 8.1 8.3 1.5 4.7 9.2
Neuromusculoskeletal and
movement-related 6.9 22.6 19.0 17.3 20.8 22.5 17.9 9.7 17.5
Sensory functions and
structures 0.0 9.7 2.5 3.1 5.1 6.3 4.5 2.2 4.0
Skin and related structures 0.7 9.7 1.3 4.4 7.2 5.6 3.0 3.8 5.1
Voice and speech 0.0 3.2 2.5 0.3 1.1 0.8 0.0 0.4 0.7
No function/structure affected 0.7 0.0 3.8 4.1 4.1 4.5 10.4 23.7 7.4
Not known 37.2 9.7 21.5 19.9 11.6 14.9 31.3 25.9 18.6
Total persons 100.0 100.0 100.0 100.0 100.0 100.0 100.0 100.0 100.0
(a) Claims that were opened or notified during the financial year. Excluded are eight public sector claims that duplicate the primary body function/structure affected and claim subject demographic data recorded in another claim (see Box 1.1).
(b) ‘Persons’ includes claims for males, females and persons whose sex was indeterminate or unknown.

Public and private sector medical indemnity claims in Australia 2009–10 35
5 Administrative and financial characteristics
5.1 Duration of claims The start date for measuring the duration of a claim is either the date the claim first had a reserve placed (public sector claims) or the date the claim was reported by the insured medical practitioner to a private insurer (private sector claims). The end date for measuring claim duration is either 30 June 2010 (for claims still open at this time) or the date the claim was closed (for claims closed between 1 July 2009 and 30 June 2010).
Of the claims open at the end of the period, 20% (1,350 of 6,768) had been open for less than 6 months, 66% (4,435 claims) for up to 2 years and 80% (5,389 claims) for up to 3 years (tables 5.1 and 5.2). A lower proportion of claims had been open for less than 6 months than the 30% recorded for 2008–09, reflecting less claims opened during the second half of the financial year in 2009–10. For the 2009–10 period 9% (632 of 6,768) had been open after more than 5 years’ duration, the same proportion as for 2007–08 and 2008–09 (AIHW 2011a, 2011b).
Of the claims closed during the period, 7% (195 of 2,647) had been open for less than 6 months, 47% (1,252 claims) for up to 2 years and 67% (1,763 claims) for up to 3 years (tables 5.1 and 5.2). About 14% (379 of 2,647) of closed claims had been open for more than 5 years. In comparison, a lower proportion of claims closed in 2008–09 had been open for over 5 years (9%), but the proportion that had been open for up to 3 years was similar (AIHW 2011a). Of claims reopened during the period, 32% had lasted for a duration of more than 5 years.
5.2 Reserve range of current claims The ‘reserve range’ of a claim is the estimated cost, in broad dollar ranges, which is set by the jurisdictional authority or MII against each claim. Tables 5.3 and 5.4 present data relating the reserve range of current claims to their duration.
About 70% of claims (4,741) had a reserve of less than $100,000, including 35% (2,395 claims) with a reserve of less than $10,000. There were 510 current claims (7%) with a reserve set between $250,000 and <$500,000 and 551 (8%) with a reserve set at $500,000 or above.
For claims with a reserve set at less than $10,000, 56% (1,353 of 2,395 claims) had been open for less than 1 year, contrasting with the 8% (182 claims) open for more than 4 years and 5% (124 claims) open for more than 5 years (Figure 5.1).
Claims with their reserve set at $250,000 to <$500,000, and especially $500,000 or more, tended to have remained open for a longer period of time than other current claims. The proportions of these claims open for more than 5 years were respectively 13% in the $250,000 to <$500,000 range (64 of 510 claims) and 32% of those reserved for at least $500,000 (175 of 551 claims). These proportions are the same as those recorded for 2008–09 (AIHW 2011a).
The association between higher reserve sizes and the length of time a claim is open is illustrated in Figure 5.1.

36 Public and private sector medical indemnity claims in Australia 2009–10
Figure 5.1: Current claims: length of claim (months), by reserve range, 30 June 2010 (per cent)
0
10
20
30
40
50
60
70
80
90
100
<$10,000 $10,000–<$100,000 $100,000–<$500,000 $500,000 or more
Per cent
Reserve range
Over 60 months
37–60 months
25–36 months
13–24 months
12 months or less

Public and private sector medical indemnity claims in Australia 2009–10 37
Table 5.1: All claims: status of claim, by duration of claim (months), at 30 June 2010
Duration of claim at 30 June 2010 (months)
Status of claim <6 6–12 13–18 19–24 25–30 31–36 37–42 43–48 49–54 55–60 >60 Total
New claims (1 July 2009 – 30 June 2010) 1,481 1,419 . . . . . . . . . . . . . . . . . . 2,900
Reopened 1 7 11 12 20 20 14 28 20 11 69 213
Closed 195 358 368 331 302 209 191 138 103 73 379 2,647
Claims open at 30 June 2010 1,350 1,454 903 728 530 424 259 216 160 112 632 6,768
. . Not applicable.
Notes
1. Duration of claim is calculated from ‘date reserve set’ (if known) or else ‘date of report’. For closed claims it is calculated to the date the claim was closed, and for other claims to 30 June 2010.
2. Closed claims in the MII collection include claims that are closed and no more payments are expected, or all recoveries expected from third parties other than reinsurers have been received.
3. Reopened claims include claims that have previously been recorded as closed, but have then been re-opened and are active.
Table 5.2: All claims: status of claim, by duration of claim (months), at 30 June 2010 (per cent)
Duration of claim at 30 June 2010 (months)
Status of claim <6 6–12 13–18 19–24 25–30 31–36 37–42 43–48 49–54 55–60 >60 Total
New claims (1 July 2009 – 30 June 2010) 51.1 48.9 . . . . . . . . . . . . . . . . . . 100.0
Reopened 0.5 3.3 5.2 5.6 9.4 9.4 6.6 13.1 9.4 5.2 32.4 100.0
Closed 7.4 13.5 13.9 12.5 11.4 7.9 7.2 5.2 3.9 2.8 14.3 100.0
Claims open at 30 June 2010 19.9 21.5 13.3 10.8 7.8 6.3 3.8 3.2 2.4 1.7 9.3 100.0
. . Not applicable.
Notes
1. Duration of claim is calculated from ‘date reserve set’ (if known) or else ‘date of report’. For closed claims it is calculated to the date the claim was closed, and for other claims to 30 June 2010.
2. Closed claims in the MII collection include claims that are closed and no more payments are expected, or all recoveries expected from third parties other than reinsurers have been received.
3. Reopened claims include claims that have previously been recorded as closed, but have then been reopened and are active.
4. Percentages may not add up exactly to 100.0 due to rounding.

38 Public and private sector medical indemnity claims in Australia 2009–10
Table 5.3: Current claims(a): reserve range, by duration of claim (months), at 30 June 2010
Duration of claim(b)
Reserve range <6 6–12 13–18 19–24 25–30 31–36 37–42 43–48 49–54 55–60 >60 Total
Less than $10,000 728 625 286 194 173 113 64 30 35 23 124 2,395
$10,000–<$30,000 161 216 176 142 103 79 39 34 18 16 60 1,044
$30,000–<$50,000 76 108 67 56 38 28 11 16 15 7 40 462
$50,000–<$100,000 142 170 135 98 62 57 31 29 24 18 74 840
$100,000–<$250,000 152 207 120 117 82 72 52 35 23 11 95 966
$250,000–<$500,000 59 84 71 76 33 30 31 34 13 15 64 510
$500,000 or more 32 44 48 45 39 45 31 38 32 22 175 551
Total 1,350 1,454 903 728 530 424 259 216 160 112 632 6,768
(a) Current claims are claims that are open, including reopened claims, at 30 June 2010.
(b) Duration of claim is calculated from ‘date reserve set’ (if known) or else ‘date of report’ to 30 June 2010.
Table 5.4: Current claims(a): reserve range, by duration of claim (months), at 30 June 2010 (per cent)
Duration of claim(b)
Reserve range <6 6–12 13–18 19–24 25–30 31–36 37–42 43–48 49–54 55–60 >60 Total
Less than $10,000 30.4 26.1 11.9 8.1 7.2 4.7 2.7 1.3 1.5 1.0 5.2 100.0
$10,000–<$30,000 15.4 20.7 16.9 13.6 9.9 7.6 3.7 3.3 1.7 1.5 5.7 100.0
$30,000–<$50,000 16.5 23.4 14.5 12.1 8.2 6.1 2.4 3.5 3.2 1.5 8.7 100.0
$50,000–<$100,000 16.9 20.2 16.1 11.7 7.4 6.8 3.7 3.5 2.9 2.1 8.8 100.0
$100,000–<$250,000 15.7 21.4 12.4 12.1 8.5 7.5 5.4 3.6 2.4 1.1 9.8 100.0
$250,000–<$500,000 11.6 16.5 13.9 14.9 6.5 5.9 6.1 6.7 2.5 2.9 12.5 100.0
$500,000 or more 5.8 8.0 8.7 8.2 7.1 8.2 5.6 6.9 5.8 4.0 31.8 100.0
Total 19.9 21.5 13.3 10.8 7.8 6.3 3.8 3.2 2.4 1.7 9.3 100.0
(a) Current claims are claims that are open, including reopened claims, at 30 June 2010.
(b) Duration of claim is calculated from ‘date reserve set’ (if known) or else ‘date of report’ to 30 June 2010.
Note: Percentages may not add up exactly to 100.0 due to rounding.

Public and private sector medical indemnity claims in Australia 2009–10 39
5.3 Total claim size of closed claims The ‘total claim size’ is the total amount paid to the claimant, as well as any legal or investigative defence costs, recorded in broad dollar ranges for closed claims (following a negotiated outcome, a court order or a decision by the claim manager to discontinue a claim). The amount paid to the claimant includes any interim payments and may include claimant legal costs. Tables 5.5 and 5.6 present data relating the claim size to the duration of closed claims.
There were 58% (1,524 claims) closed for less than $10,000, including 17% (443 of 2,647 claims) closed for no cost. In 2009–10, 147 claims (accounting for 6% of closed claims) were settled for over $500,000.
About 42% (185 of 443 claims) closed for no cost had durations between 25 and 42 months. The proportions of these no-cost claims settled within 6 months or taking more than 4 years to settle were small, both 8% (respectively 36 and 35 claims).
Half of claims closed for a cost of less than $10,000 (544 of 1,081 claims) were settled in 6 months to 2 years, as were 43% of claims settled for between $10,000 and <$30,000 (130 of 301 claims). About 14% of claims took more than 5 years to be settled, compared to 9% in 2008–09 (AIHW 2011a). A duration of 5 years or more was recorded for 23% (40 of 172) of claims settled for $50,000 to <$100,000, 29% (38 of 132) of claims settled for between $250,000 and <$500,000, and 44% (65 of 147) of claims settled for $500,000 or more. The association between increasing claim size and a longer duration to close the claim is illustrated in Figure 5.2.
Figure 5.2: Closed claims: total claim size, by duration of claim (months), 1 July 2009 to 30 June 2010 (per cent)
0
10
20
30
40
50
60
70
80
90
100
$0–<$10,000 $10,000–<$100,000 $100,000–<$500,000 $500,000 or more
Per cent
Total claim size
Over 60 months
37–60 months
25–36 months
13–24 months
12 months or less

40 Public and private sector medical indemnity claims in Australia 2009–10
Table 5.5: Closed claims(a): total claim size, by duration of claim (months), 1 July 2009 to 30 June 2010
Duration of claim(b)
Total claim size <6 6–12 13–18 19–24 25–30 31–36 37–42 43–48 49–54 55–60 >60 Total
Nil 36 59 52 53 64 58 63 23 12 4 19 443
$1−<$10,000 140 224 187 133 118 63 44 25 21 17 109 1,081
$10,000–<$30,000 11 34 49 47 32 21 20 17 13 10 47 301
$30,000–<$50,000 2 12 20 18 18 13 5 8 5 3 22 126
$50,000–<$100,000 6 9 17 26 12 9 21 13 9 10 40 172
$100,000–<$250,000 0 13 29 23 33 26 21 22 21 15 39 242
$250,000–<$500,000 0 3 11 20 14 11 6 14 11 4 38 132
$500,000 or more 0 1 3 11 11 8 11 16 11 10 65 147
Total(c)
195 358 368 331 302 209 191 138 103 73 379 2,647
(a) Closed claims are claims that were closed between 1 July 2009 and 30 June 2010.
(b) Duration of claim is calculated from ‘date reserve set’ (if known) or else ‘date of report’ to the date when the claim was closed.
(c) There were three private sector claims where the total claim size was not known. These claims are included in the totals for ‘duration of claim’ even though the Not known row is not presented.
Table 5.6: Closed claims(a): total claim size, by duration of claim (months), 1 July 2009 to 30 June 2010 (per cent)
Duration of claim(b)
Total claim size <6 6–12 13–18 19–24 25–30 31–36 37–42 43–48 49–54 55–60 >60 Total
Nil 8.1 13.3 11.7 12.0 14.4 13.1 14.2 5.2 2.7 0.9 4.3 100.0
$1−<$10,000 13.0 20.7 17.3 12.3 10.9 5.8 4.1 2.3 1.9 1.6 10.1 100.0
$10,000–<$30,000 3.7 11.3 16.3 15.6 10.6 7.0 6.6 5.6 4.3 3.3 15.6 100.0
$30,000–<$50,000 1.6 9.5 15.9 14.3 14.3 10.3 4.0 6.3 4.0 2.4 17.5 100.0
$50,000–<$100,000 3.5 5.2 9.9 15.1 7.0 5.2 12.2 7.6 5.2 5.8 23.3 100.0
$100,000–<$250,000 0.0 5.4 12.0 9.5 13.6 10.7 8.7 9.1 8.7 6.2 16.1 100.0
$250,000–<$500,000 0.0 2.3 8.3 15.2 10.6 8.3 4.5 10.6 8.3 3.0 28.8 100.0
$500,000 or more 0.0 0.7 2.0 7.5 7.5 5.4 7.5 10.9 7.5 6.8 44.2 100.0
Total(c)
7.4 13.5 13.9 12.5 11.4 7.9 7.2 5.2 3.9 2.8 14.3 100.0
(a) Closed claims are claims that were closed between 1 July 2009 and 30 June 2010.
(b) Duration of claim is calculated from ‘date reserve set’ (if known) or else ‘date of report’ to the date when the claim was closed.
(c) There were three private sector claims where the total claim size was not known. These claims are included in the totals for ‘duration of claim’ even though the Not known row is not presented.
Note: Percentages may not add up exactly to 100.0 due to rounding.
Public and private sector medical indemnity claims in Australia 2009–10 41
5.4 Mode of claim finalisation A claim can be finalised through a variety of processes, such as a court decision, negotiation or discontinuation (including the claim being withdrawn by the claimant). The definition of these finalisation modes is provided in Appendix 4 (Table A4.3). Of the 2,646 claims closed between 1 July 2009 and 30 June 2010 with known mode of finalisation, 78 (3%) were finalised through a court decision, 1,352 (51%) were finalised through negotiation and 1,216 (46%) were discontinued (tables 5.7 and 5.8).
Discontinuation was the most frequently recorded mode of finalisation for claims closed for no cost (86% or 380 claims) or for a cost of less than $30,000 (55% or 760 claims). Discontinuation was rarely recorded for claims closed for $50,000 or more (45 of 693 claims, or 6%).
The number of nil cost claims that were discontinued decreased from 869 claims in 2008–09 (AIHW 2011a) to 380 claims in 2009–10. This decrease is at least partly due to the introduction of a coding rule for the 2009–10 public sector claims that allowed data providers to ‘rescind’ claims if legal action had not commenced and no expenses had been incurred (‘$0 discontinued potential claims’), rather than report them as discontinued closed claims (AIHW 2012). This decrease is reflected in the lower proportion of nil cost claims and discontinued claims in 2009–10 (17% and 46% respectively) compared with 2008–09 (30% and 65% respectively).
Almost 89% (614) of the 693 claims with a claim size of $50,000 or more were settled through negotiation.
Court decisions were the least frequently recorded mode of claim finalisation for the 2009–10 reporting period, especially if the claim size was less than $10,000. The proportion of closed claims finalised via a court decision was 3% (78 of 2,647 claims), and was 1% (5 of 443) when no payment was made. These proportions are similar to those in 2008–09 (AIHW 2011a).
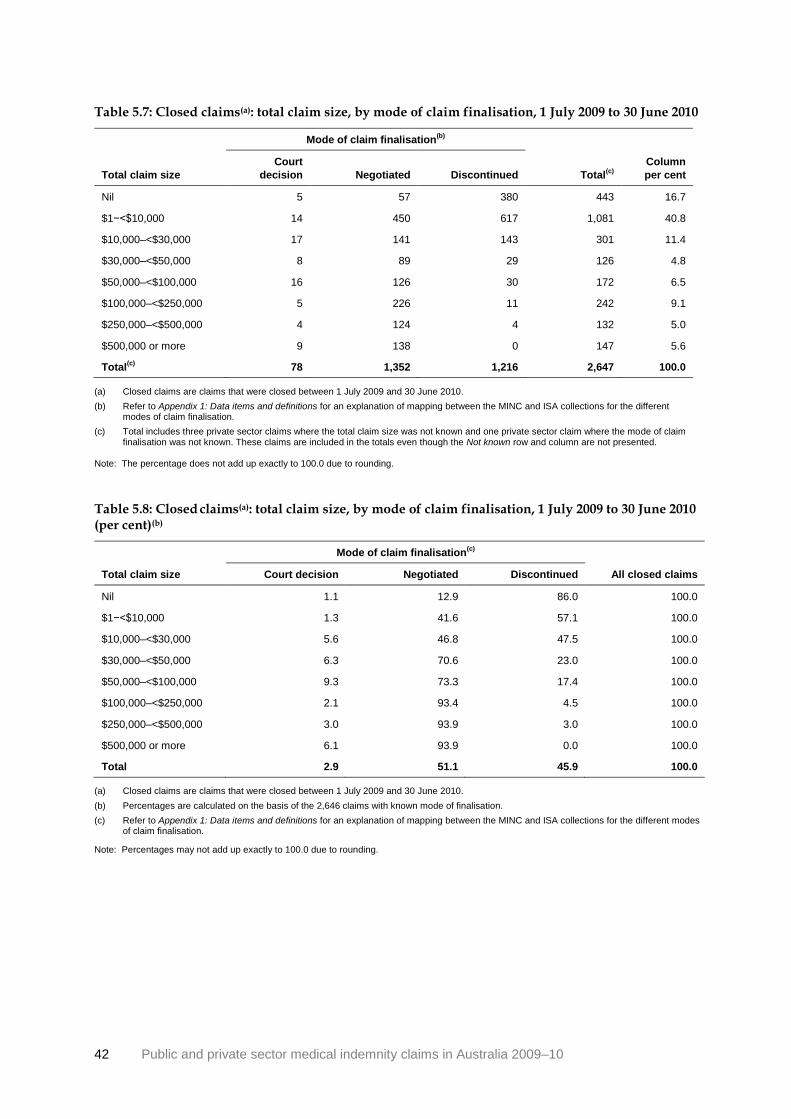
42 Public and private sector medical indemnity claims in Australia 2009–10
Table 5.7: Closed claims(a): total claim size, by mode of claim finalisation, 1 July 2009 to 30 June 2010
Mode of claim finalisation(b)
Total claim size
Court
decision Negotiated Discontinued Total(c)
Column
per cent
Nil 5 57 380 443 16.7
$1−<$10,000 14 450 617 1,081 40.8
$10,000–<$30,000 17 141 143 301 11.4
$30,000–<$50,000 8 89 29 126 4.8
$50,000–<$100,000 16 126 30 172 6.5
$100,000–<$250,000 5 226 11 242 9.1
$250,000–<$500,000 4 124 4 132 5.0
$500,000 or more 9 138 0 147 5.6
Total(c)
78 1,352 1,216 2,647 100.0
(a) Closed claims are claims that were closed between 1 July 2009 and 30 June 2010.
(b) Refer to Appendix 1: Data items and definitions for an explanation of mapping between the MINC and ISA collections for the different modes of claim finalisation.
(c) Total includes three private sector claims where the total claim size was not known and one private sector claim where the mode of claim finalisation was not known. These claims are included in the totals even though the Not known row and column are not presented.
Note: The percentage does not add up exactly to 100.0 due to rounding.
Table 5.8: Closed claims(a): total claim size, by mode of claim finalisation, 1 July 2009 to 30 June 2010 (per cent)(b)
Mode of claim finalisation(c)
Total claim size Court decision Negotiated Discontinued All closed claims
Nil 1.1 12.9 86.0 100.0
$1−<$10,000 1.3 41.6 57.1 100.0
$10,000–<$30,000 5.6 46.8 47.5 100.0
$30,000–<$50,000 6.3 70.6 23.0 100.0
$50,000–<$100,000 9.3 73.3 17.4 100.0
$100,000–<$250,000 2.1 93.4 4.5 100.0
$250,000–<$500,000 3.0 93.9 3.0 100.0
$500,000 or more 6.1 93.9 0.0 100.0
Total 2.9 51.1 45.9 100.0
(a) Closed claims are claims that were closed between 1 July 2009 and 30 June 2010.
(b) Percentages are calculated on the basis of the 2,646 claims with known mode of finalisation.
(c) Refer to Appendix 1: Data items and definitions for an explanation of mapping between the MINC and ISA collections for the different modes of claim finalisation.
Note: Percentages may not add up exactly to 100.0 due to rounding.

Public and private sector medical indemnity claims in Australia 2009–10 43
5.5 Total claim size and health service setting In 2009–10, the proportions of closed claims related to the various health service settings (tables 5.9 and 5.10) were similar to the proportions recorded for all and new claims (Section 3.1). Public hospital or day surgery accounted for 46% (1,224) of closed claims. This category was followed by Private medical clinic recorded for 22% (567) of closed claims, and Private hospital/day surgery, recorded for 17% (436) of closed claims.
As previously noted, 17% of closed claims did not involve any payment (Table 5.7). Of these claims 70% occurred within a private health setting (304 of 437 claims). Just over one-quarter (28%) of claims associated with a Private hospital or day surgery and 26% associated with a Private medical clinic were no cost claims. When all of the public health service settings are combined, there were 9% (110 of 1,253 claims) closed for no cost, compared to 27% (304 of 1,147 claims) in private settings where no cost was involved.
Settled claims with a claim size of $100,000 or more accounted for 20% of all closed claims (520, after excluding the seven claims for which there was no relationship between claim size and health service setting). These claims made up a larger proportion of claims associated with public settings (364 of 1,253 claims, 29%) than claims associated with private settings (126 of 1,147 claims, 11%). However, some or all of this discrepancy may be due to different claim management practices between the two sectors. As noted in Section 2.2, public sector claim sizes also generally reflect the costs associated with all providers associated with a single health-care incident, whereas in the private sector the costs arising from a single incident may be spread across several claims.

44 Public and private sector medical indemnity claims in Australia 2009–10
Table 5.9: Closed claims(a): total claim size, by health service setting, 1 July 2009 to 30 June 2010
Health service setting
Total claim
size
Public
hospital/day
surgery(b)
Other
public
setting(c)
Private
hospital/day
surgery(d)
Private
medical
clinic(e)
Other
private
setting(f)
Other(g)
Not
known Total
Nil 108 2 124 146 34 3 20 437
$1–<$10,000 447 13 165 242 79 14 121 1,081
$10,000–<$30,000 144 4 38 73 11 2 29 301
$30,000–<$50,000 64 1 23 23 1 2 12 126
$50,000–<$100,000 101 4 20 34 6 3 4 172
$100,000–<$250,000 166 5 28 25 6 1 10 241
$250,000–<$500,000 84 0 18 13 6 0 11 132
$500,000 or more 109 0 19 10 1 0 8 147
Total(h)
1,224 29 436 567 144 25 215 2,640
Per cent 46.4 1.1 16.5 21.5 5.5 0.9 8.1 100.0
(a) Closed claims are claims that were closed between 1 July 2009 and 30 June 2010. Excluded are seven public sector claims where there is no relation between claim size and the health service setting (see Box 1.1).
(b) Includes public psychiatric hospitals.
(c) Includes public community health centres, residential aged care services, hospices, and alcohol and drug rehabilitation centres.
(d) Includes private psychiatric hospitals.
(e) Private clinics providing investigation and treatment on a non-residential, day-only basis, including 24-hour medical clinics and general practitioner surgeries.
(f) Includes private community health centres, residential aged care services, hospices, and alcohol and drug rehabilitation centres.
(g) Includes patientʼs home and ʽMedihotelsʼ.
(h) There were three private sector claims where the total claim size was not known. These claims are included in the totals for ʽhealth service settingʼ even though the Not known row is not presented.
Note: Public sector claims can arise from incidents in private sector health settings and vice versa. Therefore, the number of claims in public
settings and private settings does not equal the respective number of public sector and private sector claims. See Table 3.1 for numbers
of public sector and private sector claims.

Public and private sector medical indemnity claims in Australia 2009–10 45
Table 5.10: Closed claims(a): total claim size, by health service setting, 1 July 2009 to 30 June 2010 (per cent)(b)
Health service setting
Total claim size
Public
hospital/day
surgery(c)
Other
public
setting(d)
Private
hospital/day
surgery(e)
Private
medical
clinic(f)
Other
private
setting(g)
Other(h)
Not
known Total
Nil 8.8 6.9 28.4 25.7 23.6 12.0 9.3 16.6
$1–<$10,000 36.5 44.8 37.8 42.7 54.9 56.0 56.3 40.9
$10,000–<$30,000 11.8 13.8 8.7 12.9 7.6 8.0 13.5 11.4
$30,000–<$50,000 5.2 3.4 5.3 4.1 0.7 8.0 5.6 4.8
$50,000–<$100,000 8.3 13.8 4.6 6.0 4.2 12.0 1.9 6.5
$100,000–<$250,000 13.6 17.2 6.4 4.4 4.2 4.0 4.7 9.1
$250,000–<$500,000 6.9 0.0 4.1 2.3 4.2 0.0 5.1 5.0
$500,000 or more 8.9 0.0 4.4 1.8 0.7 0.0 3.7 5.6
Total(i)
100.0 100.0 100.0 100.0 100.0 100.0 100.0 100.0
(a) Closed claims are claims that were closed between 1 July 2009 and 30 June 2010. Excluded are seven public sector claims where there is no relationship between the cost of the claim and the health service setting (see Box 1.1).
(b) Percentages are calculated on the basis of the 2,637 claims with known total claim size.
(c) Includes public psychiatric hospitals.
(d) Includes public community health centres, residential aged care services, hospices, and alcohol and drug rehabilitation centres.
(e) Includes private psychiatric hospitals.
(f) Private clinics providing investigation and treatment on a non-residential, day-only basis, including 24-hour medical clinics and general practitioner surgeries.
(g) Includes private community health centres, residential aged care services, hospices, and alcohol and drug rehabilitation centres.
(h) Includes patientʼs home and ʽMedihotelsʼ.
(i) There were three private sector claims where the total claim size was not known. These claims are included in the totals for ʽhealth service settingʼ even though the Not known row is not presented.
Notes
1. Public sector claims can arise from incidents in private sector health settings and vice versa. Therefore, the number of claims in public
settings and private settings does not equal the respective number of public sector and private sector claims. See Table 3.1 for numbers
of public sector and private sector claims.
2. Percentages may not add up exactly to 100.0 due to rounding.

46 Public and private sector medical indemnity claims in Australia 2009–10
5.6 Total claim size and specialty of clinician Data and commentary on the proportions of recorded clinical specialties for closed claims are presented in Section 3.4. With respect to the 12 clinician specialty categories that were most frequently recorded for closed claims, between 40% (Psychiatry, 34 claims) and 68% (Diagnostic radiology, 62 claims) of claims for each clinician specialty were closed for less than $10,000. One-fifth (19 claims, 22%) of claims with a clinician specialty of Psychiatry settled for $10,000–<$30,000, while just under one-quarter (9 claims, 23%) with a clinician specialty of General and internal medicine closed for $100,000−<$250,000. Obstetrics and Gynaecology and Urology had the highest proportion of claims settled for $250,000 or more (70 claims, 19% and 7 claims, 18% respectively).

Public and private sector medical indemnity claims in Australia 2009–10 47
Table 5.11: Closed claims(a): specialties of clinicians involved, by total claim size, 1 July 2009 to 30 June 2010
Total claim size
Specialty of clinician(s)(b)
Nil cost $1–
<$10,000 $10,000– <$30,000
$30,000– <$50,000
$50,000– <$100,000
$100,000– <$250,000
$250,000– <$500,000
$500,000 or more Total
(c)
Anaesthetics 16 46 6 4 3 5 4 5 90
Diagnostic radiology 33 29 6 5 3 10 4 1 91
Emergency medicine 16 62 15 9 13 27 6 16 164
General and internal medicine 5 13 3 2 4 9 2 1 39
General nursing 5 17 5 2 3 1 2 3 38
General practice(d)
114 275 89 34 43 43 18 17 633
General surgery 19 72 24 13 16 28 11 13 196
Obstetrics and Gynaecology(e)
42 136 37 16 24 37 27 43 362
Orthopaedic surgery 33 65 16 8 13 20 15 14 184
Psychiatry 6 28 19 3 9 10 7 3 85
Urology 4 15 4 3 4 1 3 4 39
Other hospital-based medical
practitioner(f)
11 61 14 7 3 1 4 4 105
All other specialties(g)
135 286 70 22 42 62 41 38 697
Not applicable(h)
1 6 3 2 0 1 0 1 14
Not known 2 1 1 0 0 0 0 1 5
Total(i)
437 1,081 301 126 172 241 132 147 2,640
(a) Closed claims are claims that were closed between 1 July 2009 and 30 June 2010. Excluded are seven public sector claims where there is no relation between claim size and clinician specialty (see Box 1.1). The clinician specialty totals may be slightly different than those presented in Table 3.10 because different public sector claims are excluded from the counts.
(b) Only the 12 clinician specialty categories that were most frequently recorded for closed claims are listed; all other categories are combined in the category All other specialties.
(c) There were three private sector claims where the total claim size was not known. These claims are included in the totals for ‘specialty of clinician(s)’ even though the Not known column is not presented.
(d) Includes both procedural and non-procedural general practitioners.
(e) Includes specialists in Obstetrics only, Gynaecology only, and Obstetrics and gynaecology.
(f) Other hospital-based medical practitioner includes junior doctors, resident doctors, house officers and other medical practitioners who do not have a specialty.
(g) Covers all clinician specialty categories other than the 12 which are individually listed.
(h) Indicates that no clinical staff were involved in the incident (for example where the claim relates to actions of hospital administrative staff).
(i) This is the total number of claims for which each claim size was recorded. A given specialty may only be recorded once for a single claim in the private sector, but up to four different specialties may be recorded for a public sector claim. Therefore, some public sector claims are represented in more than one row, and so the column totals exceed the number of claims.

48 Public and private sector medical indemnity claims in Australia 2009–10
Table 5.12: Closed claims(a): specialties of clinicians involved, by total claim size, 1 July 2009 to 30 June 2010 (per cent)
Total claim size
Specialty of clinician(s)(b)
Nil cost $1–
<$10,000 $10,000–<$30,000
$30,000–<$50,000
$50,000–<$100,000
$100,000–<$250,000
$250,000–<$500,000
$500,000 or more Total
Anaesthetics 17.8 51.1 6.7 4.4 3.3 5.6 4.4 5.6 100.0
Diagnostic radiology 36.3 31.9 6.6 5.5 3.3 11.0 4.4 1.1 100.0
Emergency medicine 9.8 37.8 9.1 5.5 7.9 16.5 3.7 9.8 100.0
General and internal medicine 12.8 33.3 7.7 5.1 10.3 23.1 5.1 2.6 100.0
General nursing 13.2 44.7 13.2 5.3 7.9 2.6 5.3 7.9 100.0
General practice(c)
18.0 43.4 14.1 5.4 6.8 6.8 2.8 2.7 100.0
General surgery 9.7 36.7 12.2 6.6 8.2 14.3 5.6 6.6 100.0
Obstetrics and Gynaecology(d)
11.6 37.6 10.2 4.4 6.6 10.2 7.5 11.9 100.0
Orthopaedic surgery 17.9 35.3 8.7 4.3 7.1 10.9 8.2 7.6 100.0
Psychiatry 7.1 32.9 22.4 3.5 10.6 11.8 8.2 3.5 100.0
Urology 10.3 38.5 10.3 7.7 10.3 2.6 7.7 10.3 100.0
Other hospital-based medical practitioner
(e) 10.5 58.1 13.3 6.7 2.9 1.0 3.8 3.8 100.0
All other specialties(f)
19.4 41.0 10.0 3.2 6.0 8.9 5.9 5.5 100.0
Not applicable(g)
7.1 42.9 21.4 14.3 0.0 7.1 0.0 7.1 100.0
Not known 40.0 20.0 20.0 0.0 0.0 0.0 0.0 20.0 100.0
Total(h)
16.6 40.9 11.4 4.8 6.5 9.1 5.0 5.6 100.0
(a) Closed claims are claims that were closed between 1 July 2009 and 30 June 2010. Excluded are seven public sector claims where there is no relation between claim size and clinician specialty (see Box 1.1).
(b) Only the 12 clinician specialty categories that were most frequently recorded for closed claims are listed; all other categories are combined in the category All other specialties.
(c) Includes both procedural and non-procedural general practitioners.
(d) Includes specialists in Obstetrics only, Gynaecology only, and Obstetrics and gynaecology.
(e) Other hospital-based medical practitioner includes junior doctors, resident doctors, house officers and other medical practitioners who do not have a specialty.
(f) Covers all clinician specialty categories other than the 12 which are individually listed.
(g) Indicates that no clinical staff were involved in the incident (for example where the claim relates to actions of hospital administrative staff).
(h) In the public sector, up to four different specialties may be recorded for each claim, and so some claims are represented in more than one row in the table. Hence the percentage values, which show the proportion of claims of each claim size for which each clinician specialty was recorded, cannot be summed vertically to give 100%.
Note: Percentages may not add up exactly to 100.0 due to rounding.

Public and private sector medical indemnity claims in Australia 2009–10 49
5.7 Total claim size and extent of harm There is a strong relationship between claim size and extent of harm (Figure 5.3). Where the extent of harm was No body function/structure affected, 17% of claims were closed for no cost and 59% for $1–<$10,000. Similar proportions were recorded for Mild injury (28% closed for no cost, 50% for $1–<$10,000 and <1% for $500,000 or more). In the case of Moderate injury, 16% of claims were closed for no cost and 34% for $1–<$10,000, compared to 4% closed for $500,000 or more. In contrast, the proportion of claims with Severe injury that were closed for less than $10,000 was 35%, while 20% were closed for $500,000 or more (tables 5.13 and 5.14).
Where Death was the recorded extent of harm, 10% of claims were closed for no cost, 70% for less than $100,000 and just 2% for $500,000 or more.
Figure 5.3: Closed claims: total claim size, by extent of harm, 1 July 2009 to 30 June 2010 (per cent)
0
10
20
30
40
50
60
70
80
90
100
$0–<$10,000 $10,000–<$100,000 $100,000–<$500,000 $500,000 or more
Per cent
Total claim size
Death
Severe injury
Moderate injury
Mild injury

50 Public and private sector medical indemnity claims in Australia 2009–10
Table 5.13: Closed claims(a): total claim size, by extent of harm, 1 July 2009 to 30 June 2010
Extent of harm
Total claim size Mild
injury Moderate
injury Severe injury Death
No body function/ structure affected
Not known Total
Nil cost 177 113 54 31 33 29 437
$1–<$10,000 320 244 110 132 112 163 1,081
$10,000–<$30,000 67 76 45 48 27 38 301
$30,000–<$50,000 27 41 21 15 5 17 126
$50,000–<$100,000 22 56 34 32 8 20 172
$100,000–<$250,000 18 96 67 42 2 16 241
$250,000–<$500,000 1 54 44 18 0 15 132
$500,000 or more 3 30 91 7 0 16 147
Total 635 710 466 325 190(b)
314 2,640
(a ) Closed claims are claims that were closed between 1 July 2009 and 30 June 2010. Excluded are seven public sector claims where
there is no relation between claim size and extent of harm (see Box 1.1).
(b) Includes three private sector claims where the total claim size was not known.
Table 5.14: Closed claims(a): total claim size, by extent of harm, 1 July 2009 to 30 June 2010 (per cent)(b)
Extent of harm
Total claim size
Mild
injury
Moderate
injury
Severe
injury Death
No body function/
structure affected
Not
known Total
Nil cost 27.9 15.9 11.6 9.5 17.4 9.2 16.6
$1–<$10,000 50.4 34.4 23.6 40.6 58.9 51.9 40.9
$10,000–<$30,000 10.6 10.7 9.7 14.8 14.2 12.1 11.4
$30,000–<$50,000 4.3 5.8 4.5 4.6 2.6 5.4 4.8
$50,000–<$100,000 3.5 7.9 7.3 9.8 4.2 6.4 6.5
$100,000–<$250,000 2.8 13.5 14.4 12.9 1.1 5.1 9.1
$250,000–<$500,000 0.2 7.6 9.4 5.5 0.0 4.8 5.0
$500,000 or more 0.5 4.2 19.5 2.2 0.0 5.1 5.6
Total 100.0 100.0 100.0 100.0 100.0 100.0 100.0
(a) Closed claims are claims that were closed between 1 July 2009 and 30 June 2010. Excluded are seven public sector claims where
there is no relation between claim size and extent of harm (see Box 1.1).
(b) Percentages are calculated on the basis of the 2,637 claims with known total claim size.
Note: Percentages may not add up exactly to 100.0 due to rounding.

Public and private sector medical indemnity claims in Australia 2009–10 51
Appendix 1: Data items and definitions
Insurance Statistics Australia (ISA) received claims data from several MIIs and then transmits the data to the AIHW. Accordingly, only those data items which are compatible between the ISA database and the MINC (Table A1.1) are available for inclusion in combined sector medical indemnity reports. Table A1.2 provides definitions of key terms used in this report.
Table A1.1: MINC and ISA data items used for this report
MINC data item ISA data item Definition of MINC and ISA data items and
explanation of mapping between collections
4 Claim subject’s date of birth 36 Claimant/patient year of
birth
Year of birth of claim subject.
This data item is used to calculate claim subject’s age at
incident using MINC item 10, ‘Date incident occurred’ and
ISA item 9, ‘Date of loss’.
5 Claim subject’s sex 37 Claimant/patient sex Sex of the claim subject.
6a Primary incident/allegation
type
15 Cause of loss Description of the area of alleged error, negligence or
problem that primarily gave rise to the claim.
There is concordance between the ISA and the MINC
data item.
8a Primary body
function/structure affected
16 Body functions or
structures affected
The primary body function or structure of the claim
subject alleged to have been affected.
There is concordance between these items.
Death is not included in the ISA item, instead being
identified using ISA item 17, ‘Severity of injury –patient
dies from this incident’.
9 Extent of harm 17 Severity of loss This data item was mapped as outlined below.
Severity of loss (17) MINC Extent of harm
L1, L2 maps to Mild injury
M1, M2 maps to Moderate injury
S1, S2 maps to Severe injury
S6 maps to Death
10 Date incident occurred 9 Date of loss Date the alleged harm occurred.
12 Health service setting 14.3 Venue where procedure
performed
The venue where health care was delivered, whether
public or private sector or other, whether a hospital/day
surgery or other.
There is concordance between these items.
14 Specialties of clinicians
closely involved in incident
14.2 Specialty of practitioner
at the time the incident
occurred
Clinical specialties of the health care providers involved in
the alleged harm that gave rise to the claim.
The categories for these items align well between the
collections. The ISA specifications have separate codes
for several allied health and complementary medicine
fields which are subsumed within the MINC category
‘Other allied health (including complementary medicine)’.
In the ISA collection, ‘student practitioner or intern’ is a
separate category. MINC codes students based on the
specialty they are training in, and classifies interns with
‘other hospital-based medical practitioners’.
(continued)

52 Public and private sector medical indemnity claims in Australia 2009–10
Table A1.1 (continued): MINC and ISA data items used for this report
MINC data item ISA data item Definition of MINC and ISA data items and
explanation of mapping between collections
15 Date reserve placed
10 Date of report This ISA item is the date on which the matter is notified to
the insurer. It may occur slightly before or after the date
that the MII sets a reserve, which corresponds to ‘date
reserve placed’ in the MINC. Because of this potential
discrepancy these two data items are not identical.
16 Reserve range 20 Gross payments to date
22 Gross case estimate at
end of reporting period
Estimate of the cost of the claim upon its finalisation.
For current claims, the ISA items divide the reserve
amount between the amount already paid and the amount
expected to be paid. Addition of these two dollar amounts
produces the reserve estimate, which can be mapped to
MINC ranges.
18 Date claim file closed
11 Date finalised Calendar month and year in which the claim was settled,
or a final court decision was delivered or when the claim
file was closed because the claim had been inactive for a
long time.
19 Mode of claim finalisation
1 Settled through
state/territory-based complaints
processes
2 Settled through court-based
alternative dispute resolution
processes
3 Settled through statutorily
mandated compulsory
conference process
4 Settled—other
5 Court decision
8 Discontinued commenced
claim
9 Discontinued potential claim
7 Not yet known
20 Total claim size
18.2 Settlement outcome A = Award X = No award
N = Negotiated
W = Withdrawn
20 Gross payments to date
Description of the process by which the claim was closed.
This data item was mapped as outlined below.
Settlement
outcome
(18.2)
MINC Mode
of claim
finalisation
A maps to 5
X maps to 5
N maps to 1, 2, 3 or 4
W maps to 8 or 9
The mapping is not exact because a claim may be
withdrawn as part of an active settlement process rather
than through discontinuation of an inactive claim.
The amount to be paid to the claimant in settlement of the
claim, plus defence legal and investigation costs,
recorded in broad dollar ranges. ISA records exact dollar
amounts. These were mapped to MINC ranges.
21 Status of claim
20 Commenced (not yet
finalised)
30 Claim file closed
32 Structured settlement—claim
file open
33 Structured settlement—claim
file closed
40 Claim previously closed now
reopened
3 Status at end of reporting
period
C for Current
F for Closed
R for Reopened
Status of the claim in terms of the stage in the process
from commencement to finalisation.
MINC category 20 maps to ISA ‘C’.
MINC categories 30, 32 and 33 map to ISA ‘F’.
MINC 40 maps to ISA ’R’.

Public and private sector medical indemnity claims in Australia 2009–10 53
Table A1.2: Definitions of key terms
Term Definition
Claim A demand for compensation for harm or other loss that allegedly resulted from health
care.
Claimant The person who has made the claim. The claimant may be the claim subject or some
other party claiming for loss allegedly resulting from harm involving health care.
Claim subject The person who received the health-care service and was involved in the incident that is
the basis for the claim, and who suffered or may have suffered loss as a result of harm.
Current claim A claim that has yet to be finalised.
Closed claim Public sector – A claim which has been closed (total claim size determined), settled or
where a final court decision has been made, including claims finalised with total claim size
yet to be determined.
Medical indemnity insurers – A claim for which no more payments are expected and all
expected recoveries have been received from third parties other than re-insurers.
Harm Death, disease, injury, suffering and/or disability experienced by a person.
Health care Services provided to individuals or communities to promote, maintain, monitor, or restore
health.
Health-care professional A person who is registered by a state or territory to provide medical, nursing or allied
health care.
Insured A health-care professional who holds a medical indemnity policy with a medical
indemnity insurer or indemnity with a state or territory government. A health-care facility
insured under state or territory insurance arrangements.
Loss Any adverse consequence of the alleged harm experienced by the claimant, including
financial loss.
Medical indemnity A form of professional liability insurance specific to the provision of health care.
Medical indemnity claim A claim for compensation for harm or other loss that allegedly resulted from health care.
Medical indemnity insurer A body corporate authorised under section 12 of the Insurance Act 1973, or a Lloyd’s
underwriter within the meaning of that Act, which, in carrying on insurance business in
Australia, enters into contracts of insurance providing medical indemnity cover.
Other party Any party or parties not the direct recipient of health care but claiming loss allegedly
resulting from health care.
Reopened claim A current claim that had been previously categorised as closed.

54 Public and private sector medical indemnity claims in Australia 2009–10
Appendix 2: Data quality statements
Medical Indemnity National Collection (Public Sector)
Summary of key issues
• The Medical Indemnity National Collection (Public Sector), or MINC (PS), is a dataset that contains information on the number, nature and costs of public sector medical indemnity claims in Australia. Medical indemnity claims are claims for compensation for harm or other loss allegedly due to the delivery of health care.
• Data on medical indemnity claims may change over the life of a claim as new information becomes available or the reserve amount set against the likely cost of closing the claim is revised. For this reason, data reported for a single year’s claims are subject to change over time. Readers should refer to the latest published report for the most up-to-date information on past years’ claims.
• Although there are coding specifications for national medical indemnity claims data, there are some variations in how jurisdictional health authorities report medical indemnity claims.
Description
The MINC (PS) contains information on medical indemnity claims against providers covered by public sector medical indemnity arrangements. The health service may have been provided in settings such as hospitals, outpatient clinics, private general practitioner surgeries, community health centres, residential aged care facilities or mental health-care establishments or during the delivery of ambulatory care.
States and territories receive their data from public sector medical indemnifiers and government health service providers. They use their data to monitor and regulate the costs incurred from claims of harm or other loss allegedly caused through the delivery of health services covered by public sector medical indemnity arrangements.
The MINC (PS) includes:
• basic demographic information on the ‘claim subject’ (patient) at the centre of an alleged health-care incident
• related information such as the type of incident or allegation, the health service context and the clinician specialties involved
• the reserve amount set against the likely cost of settling the medical indemnity claim
• the time between setting the reserve and closing the medical indemnity claim, and
• the cost of closing the medical indemnity claim and the nature of any compensatory payments.
The MINC (PS) includes data for January to June 2003 and for each financial year from 2003–04 to 2009–10. The 2009–10 data covers the period from 1 July 2009 to 30 June 2010.

Public and private sector medical indemnity claims in Australia 2009–10 55
Institutional environment
The Australian Institute of Health and Welfare (AIHW) is a major national agency set up by the Australian Government under the Australian Institute of Health and Welfare Act 1987 to provide reliable, regular and relevant information and statistics on Australia's health and welfare. It is an independent statutory authority established in 1987, governed by a management Board, and accountable to the Australian Parliament through the Health and Ageing portfolio.
The AIHW aims to improve the health and wellbeing of Australians through better health and welfare information and statistics. It collects and reports information on a wide range of topics and issues, ranging from health and welfare expenditure, hospitals, disease and injury, and mental health, to ageing, homelessness, disability and child protection.
The Institute also plays a role in developing and maintaining national metadata standards. This work contributes to improving the quality and consistency of national health and welfare statistics. The Institute works closely with governments and non-government organisations to achieve greater adherence to these standards in administrative data collections to promote national consistency and comparability of data and reporting.
One of the main functions of the AIHW is to work with the states and territories to improve the quality of administrative data and, where possible, to compile national datasets based on data from each jurisdiction, to analyse these datasets and disseminate information and statistics.
The Australian Institute of Health and Welfare Act 1987, in conjunction with compliance to the Privacy Act 1988, (Cth) ensures that the data collections managed by the AIHW are kept securely and under the strictest conditions with respect to privacy and confidentiality. For further information see the AIHW website www.aihw.gov.au.
Data for the MINC (PS) are supplied to the AIHW by state and territory health authorities under the terms of the MINC (PS) Agreement. The MINC (PS) Agreement governs the AIHW’s collection and use of the MINC (PS) data. The Agreement includes the state and territory health authorities, the Australian Government Department of Health and Ageing, and the AIHW as co-signatories. Representatives from all of these agencies make up the Medical Indemnity Data Working Group (MIDWG), which oversees the MINC (PS).
Timeliness
According to the MINC (PS) Agreement, data are provided annually by August following the financial year to which the data relate. Data cleaning and validation are scheduled for completion during the following October. For the 2009–10 year, data were received between July and October 2010, and validation was completed in March 2011.
The AIHW’s publication of the MINC (PS) data in Australia’s public sector medical indemnity claims 2009–10 was originally planned for release in May 2011. It is being released in May 2012.
Accessibility
Australia’s public sector medical indemnity claims 2009–10 is the eighth report in its series. All are available without charge on the AIHW website. Links to the reports are listed sequentially at: <http://www.aihw.gov.au/aihw-statistical-information-on-medical-indemnity-claims-in-australia/>.

56 Public and private sector medical indemnity claims in Australia 2009–10
Interactive data cubes for MINC PS 2009–10 data will follow the release of the Australia’s public sector medical indemnity claims 2009–10 report.
Release or publication of MINC data requires the unanimous consent of the MIDWG. Interested parties can request access to MINC (PS) aggregated data not available online or in reports via the Communications, Media and Marketing Unit on (02) 6244 1032 or via email to [email protected].
Interpretability
Information to aid in the interpretation of the data in Australia’s public sector medical indemnity claims 2009–10 is presented in Chapter 2 and ‘Appendix 2: MINC data items and key terms’ of the report.
Relevance
Scope and coverage
The MINC (PS) includes information on medical indemnity claims against the public sector including ‘potential claims’. A potential claim is a matter considered by the relevant authority as likely to materialise into a claim and that has had a reserve placed against it. The MINC (PS) does not include information on health-care incidents or adverse events which do not result in an actual claim or which are not treated as potential claims.
There is some variation between jurisdictions in terms of which cases fall within the scope of the MINC (PS), due to different reserving practices. For 2009–10, 100% of all public sector claims considered by jurisdictions to fall within scope were reported to the AIHW.
Many of the data items in the MINC (PS) collect information on the patient or ‘claim subject’, the person who received the health-care service and was involved in the health-care incident that is the basis for the claim, and who may have suffered, or did suffer, harm or other loss as a result. The patient may or may not be a claimant, that is, the person(s) pursuing the claim. In the case of potential claims there may be no claimant. Information is not collected on the claimant as such.
Reference period
The MINC (PS) 2009–10 data covers new claims that had a reserve amount set against them between 1 July 2009 and 30 June 2010, previously closed claims that were reopened during the year, and ongoing claims from the previous year.
Indigenous identification
Information on Indigenous identification was not collected in 2009–10.
Accuracy
Data quality
States and territories are primarily responsible for the quality of the data they provide. However, the AIHW undertakes extensive validations on receipt of data. Data are checked for valid values, logical consistency and historical consistency. Potential errors are queried with jurisdictions, and corrections and resubmissions may be made in response to these edit queries. The AIHW does not adjust data to account for possible data errors or missing or incorrect values.

Public and private sector medical indemnity claims in Australia 2009–10 57
Missing data
From 2006–07, every jurisdiction has supplied data for all key data items. However, there are two data items for which data were not provided by New South Wales. These are:
• Additional incident/allegation type
• Additional body functions/structures affected—claim subject.
Also, New South Wales has provided data only on the principal clinician for the data item ‘specialty of clinicians closely involved in incident’. The other jurisdictions also record the principal clinician but can include data on up to three additional clinician specialties.
Not known responses
The time required to collect all the information relevant to a medical indemnity claim can be lengthy. A coding of Not known is used when information is not currently available but may become available during the lifetime of a claim. When claims are new, the Not known rates for some data items can be quite high. This means that the proportions for the coded values for these same claims will change in the future as Not known codings are replaced with the relevant information.
Not applicable responses
The circumstances of a claim may make a data item not applicable; for instance, ‘specialty of clinicians closely involved in incident’ would be Not applicable if no clinician was involved. For the data items ‘nature of claim—loss to claim subject’ and ‘nature of claim—loss to other party/parties’ the difference between Not known and Not applicable is sometimes not clear-cut and the codes have sometimes been used interchangeably.
Incident/allegation category definitions
Three incident/allegation categories, Treatment, Medication-related and Procedure, have not been fully defined. There appear to be some interventions recorded as Treatment by some jurisdictions but as Medication-related or Procedure by other jurisdictions.
Coherence
The AIHW’s MINC database holds the most up-to-date information available on Australia’s public sector medical indemnity claims. Several jurisdictions have audited their medical indemnity claims collections in recent years, or detected changes that should be made to the claim records, and all changes are reflected in the MINC database. As a result of these changes, the data reported by the AIHW on medical indemnity claims for any particular year is subject to change. Readers should refer to the latest published report for the most up-to-date information on past years’ claims.
There have been a number of enhancements to the MINC (PS) specifications since the initial data collection in 2003. While the enhancements have been designed to retain comparability with previously collected data, the following changes to the 2009–10 data specifications require comment.
Mode of claim finalisation
A new Discontinued potential claim coding option was introduced. Discontinuation means that the claim file is closed without there being any court decision or negotiated settlement with a claimant. Prior to 2009–10, to discontinue a potential claim data providers were required to also give it a claim commencement date, and report it as a Discontinued commenced claim.

58 Public and private sector medical indemnity claims in Australia 2009–10
Status of claim
A new coding option Rescinded—not a medical indemnity claim was introduced for erroneous claim records and potential claims that in retrospect should not have had a reserve set against them because their likelihood of eventuating into an actual claim was low. Prior to 2009−10, when data providers wanted to remove these sorts of claim records from their list of current claims, they either reported the claim as closed or requested the AIHW to delete the claim from the master database. This coding option has resulted in a marked drop in the proportion of claims discontinued for $0 compared with the data published for previous years.
Nature of claim—loss to claim subject/other parties
For both data items, Medical costs was recognised as a separate category rather than being subsumed under Other loss. This change improves the alignment of these data items with the ‘Gross Claim Payments by Heads of Damage’ data item (No. 25) in the Australian Prudential Regulation Authority (APRA) National Claims and Policies Database (NCPD). However, where these data items are reported on in Australia’s public sector medical indemnity claims 2009–10, Medical costs have been subsumed under Other loss, so as to allow comparability with previous years’ data.
Extent of harm
Three of the ‘extent of harm’ categories were changed to bring them into alignment with the World Health Organization’s International Classification of Functioning, Disability and Health, and also to allow the codes recognised for NCPD data item 17 ‘Severity of injury’ to be mapped on to the MINC (PS) codes. Analysis of the claims data demonstrated continuity between the 2009−10 categories and those of previous years. By and large, claims that used to have an extent of harm Temporary—duration of less than 6 months were now coded Mild injury, and claims that used to have an extent of harm Minor, with duration of 6 months or more or Major, with duration of 6 months or more were now respectively coded Moderate injury and Severe injury.
Claim subject’s date of birth
Prior to 2009–10, only the claim subject’s year of birth was collected. Collection of the claim subject’s date of birth allows more accurate calculation of the claim subject’s age at the time of the incident.
Claim record particulars flag
The great majority of claim records involve a single reserve amount set for a single health-care incident or chain of health-care incidents, with the total costs to the health authority (both legal/investigative and claimant payments) recorded as part of the claim record. The exceptions to the general rule are notified with the ‘claim record particulars flag’ data item introduced in 2009–10, as detailed in Box 2.1 of Australia’s public sector medical indemnity claims 2009–10.
Use of Not known as a coding option for closed claims
The option to record Not known for closed claims was restricted to rare circumstances only. Consequently there was a marked drop in the Not known rates for claims closed in 2009–10 compared to previous years. There was also greater consistency between jurisdictions in using the Not applicable coding option (rather than Not known) to record the absence of any compensatory payment to the claim subject, and/or another party, when a claim was closed.
Public and private sector medical indemnity claims in Australia 2009–10 59
Comparison with other collections
A number of MINC (PS) data items are identical or similar to NCPD data items collected on private sector medical indemnity claims by APRA and by Insurance Statistics Australia (ISA) on behalf of APRA. The Medical Indemnity National Collection (Private Sector) held at the AIHW is based on data items in common between the MINC PS and the NCPD data collected by ISA. Public and private sector data for 2009–10 are jointly reported in the AIHW’s Public and private sector medical indemnity claims in Australia 2009–10 report, and in previous reports in the same series for earlier years.
60 Public and private sector medical indemnity claims in Australia 2009–10
Medical Indemnity National Collection (Private Sector)
Summary of key issues
The Medical Indemnity National Collection (Private Sector), or MINC (Private Sector), is a dataset that contains information on the number, nature and costs of private sector medical indemnity claims in Australia. Medical indemnity claims are claims for compensation for harm or other loss allegedly due to the delivery of health care.
• Data on medical indemnity claims may change over the life of a claim as new information becomes available or the reserve amount set against the likely cost of closing the claim is revised.
• Although there are coding specifications for private sector medical indemnity claims data, there are some variations between medical indemnity insurers (MIIs) in how they report medical indemnity claims.
Description
Medical doctors and some other clinicians who work in the private sector are required to hold professional indemnification to cover costs of claims for compensation arising from
allegations of problems with the delivery of health-care services.
The MINC (Private Sector) contains data about claims managed by private sector medical indemnity insurers. The claims reported by the MIIs to the AIHW are the same claims that
they are required to report to the Australian Prudential Regulation Authority (APRA).
The MINC (Private Sector) includes:
• basic demographic information on the ‘claim subject’ (patient) at the centre of the alleged health-care incident
• related information such as the type of incident or allegation and the clinician specialties involved
• the reserve amount set against the likely cost of settling the medical indemnity claim
• the time between setting the reserve and closing the medical indemnity claim, and
• the cost of closing the medical indemnity claim and the nature of any compensatory payments.
The MINC (Private Sector) includes data for each financial year from 2005–06 to 2009–10. The 2009–10 data cover the period from 1 July 2009 to 30 June 2010.
Institutional environment
The AIHW is a major national agency set up by the Australian Government under the Australian Institute of Health and Welfare Act 1987 to provide reliable, regular and relevant information and statistics on Australia's health and welfare. It is an independent statutory authority established in 1987, governed by a management Board, and accountable to the Australian Parliament through the Health and Ageing portfolio. The AIHW aims to improve the health and wellbeing of Australians through better health and welfare information and statistics. It collects and reports information on a wide range of topics and issues, ranging

Public and private sector medical indemnity claims in Australia 2009–10 61
from health and welfare expenditure, hospitals, disease and injury, and mental health, to ageing, homelessness, disability and child protection.
The Institute also plays a role in developing and maintaining national metadata standards. This work contributes to improving the quality and consistency of national health and welfare statistics. The Institute works closely with governments and non-government organisations to achieve greater adherence to these standards in administrative data collections to promote national consistency and comparability of data and reporting.
One of the main functions of the AIHW is to work with the states and territories to improve the quality of administrative data and, where possible, to compile national datasets based on data from each jurisdiction, to analyse these datasets and disseminate information and statistics.
The Australian Institute of Health and Welfare Act 1987, in conjunction with compliance to the Privacy Act 1988, (Cth) ensures that the data collections managed by the AIHW are kept securely and under the strictest conditions with respect to privacy and confidentiality. For further information see the AIHW website www.aihw.gov.au
In 2004, the Australian Government introduced the Premium Support Scheme (PSS) as part of a comprehensive medical indemnity package to help eligible clinicians meet the cost of their private medical indemnity insurance. Under the PSS the Australian Government entered into standard contracts with MIIs which require MIIs to provide medical indemnity claims data to the AIHW.
The MINC Coordinating Committee (MINC CC) oversees the AIHW’s collection and use of the MINC (Private Sector) data. The MINC CC includes representatives from the state and territory health authorities, the Australian Government Department of Health and Ageing, the AIHW and each of the MIIs.
Timeliness
The AIHW approaches MIIs and/or their reporting agent (Insurance Statistics Australia (ISA)) for MINC (Private Sector) data once the public sector medical indemnity claims data have been received and are on track for final validation. The AIHW received, cleaned and validated the MINC (Private Sector) 2009–10 data over the period May to August 2011.
The AIHW is publishing data from the MINC (Private Sector) in the Public and private sector medical indemnity claims in Australia 2009–10 report in May 2012. The original planned date for release of the report was June 2011.
Accessibility
Public and private sector medical indemnity claims in Australia 2009–10 is the sixth report in its series. All are available without charge on the AIHW website. Links to the reports are listed sequentially at:<http://www.aihw.gov.au/aihw-statistical-information-on-medical-indemnity-claims-in-australia/>.
Any other release of private sector medical indemnity claims data, or aggregated public and private sector data, is subject to unanimous consent by the members of the MINC CC. Apart from claim numbers by sector, all published data that uses MINC private sector data combines it with public sector data.
62 Public and private sector medical indemnity claims in Australia 2009–10
Interpretability
Information to aid in the interpretation of the combined public and private sector medical indemnity claims data may be found in ‘Appendix 1: Data items and definitions’ of the Public and private sector medical indemnity claims in Australia 2009–10 report. The information specifies how the public and private sector code values relate to each other and any areas where there is not complete agreement between the two sets of code values.
Relevance
Scope and coverage
The MINC (Private Sector) includes information on medical indemnity claims against individual practitioners who were covered by insurance with an MII for the purposes of the claim. In 2009–10, as in previous years, all private sector medical indemnity claims legally required to be reported to APRA were reported to the AIHW.
Most of the reported claims in scope have arisen from a formal demand for compensation for alleged harm or other loss to the patient and/or a related party. The scope also includes cases where an MII has incurred preparatory expenses from investigating health-care incidents reported to the MII by an insured clinician. With those cases, the MII is legally obliged to report the potential claim to APRA even if no formal demand for compensation has been received.
Private hospital insurance claims, that is, claims against hospitals or hospital employees, do not fall within the scope of the MINC (Private Sector). However, all claims against clinicians who maintain medical indemnity cover with an MII, and who practise within private hospitals, are included.
The MINC (Private Sector) does not include information on health-care incidents or adverse events which have not led to a claim for compensation or which have not resulted in preparatory costs to an MII.
Many of the data items in the MINC (Private Sector) collect information on the patient or ‘claim subject’, the person who received the health-care service and was involved in the health-care incident that is the basis for the claim, and who may have suffered or did suffer, harm or other loss as a result. The patient may or may not be a claimant, that is, the person(s) pursuing the claim. Where the MII is investigating a case reported by an insured clinician, there may be no claimant. Information is not collected on the claimant as such.
Reference period
The MINC (Private Sector) 2009–10 data includes new claims in scope that have arisen between 1 July 2009 and 30 June 2010, previously closed claims that were reopened during the year, and ongoing claims from the previous year.
Indigenous identification
No information on claim subjects’ Indigenous identification is collected.
Accuracy
The MINC (Private Sector) includes a combination of unit record and aggregated claims data. The data received from MIIs as unit records is in accordance with the specifications of the Medical Indemnity National Collection (Public Sector). The data received in aggregated form had been coded according to the specifications of the ISA version of the National

Public and private sector medical indemnity claims in Australia 2009–10 63
Claims and Policies Database (NCPD). As detailed in Appendix 1 of the report, there is concordance between most MINC (Public Sector) and ISA NCPD codes. However, there are three data items where the alignment between the two sets of coded data is not exact, which may introduce minor inaccuracies to the aggregated private sector data.
Data quality
Data providers are primarily responsible for the quality of the data they provide. However, the AIHW undertakes extensive validations on receipt of data. Data are checked for valid values, logical consistency and historical consistency. Potential errors are queried with data providers, and corrections and resubmissions may be made in response to these edit queries. The AIHW does not adjust data to account for possible data errors or missing or incorrect values.
Not known responses
The time required to collect all the information relevant to a medical indemnity claim can be lengthy. A coding of Not known is used when information is not currently available but may become available during the lifetime of a claim. The interpretation of the proportions for a number of data items will be affected by the relatively high Not known rates, especially for claims that are new, which tend to have the highest Not known rates.
Coherence
The MINC (Private Sector) specifications were developed as a common ground between two previously established data set specifications. One of these was the AIHW’s MINC (Public Sector) in use for recording public sector medical indemnity claims data. The other was the National Claims and Policies Database (NCPD) developed by APRA for claims data from MIIs. In consultation with APRA and the AIHW, ISA developed an expanded version of the NCPD. This allowed ISA to report to APRA claims data from MIIs that were members of the Medical Indemnity Insurance Association of Australia, and to report to AIHW claims data from the same MIIs.
The reported data from the MINC (Private Sector) are the common ground between the MINC (Public Sector) and the ISA version of the NCPD.
In 2009−10 the MINC (Public Sector) ‘extent of harm’ categories were revised to better align with the NCPD data item 17 ‘severity of loss’ categories. As a consequence extent of harm data are able to be reported for the first time for 2009–10.
The public sector and private sector differ in how they deal with claims against multiple clinicians. In the public sector, in most cases a single claim record is created for each health-care incident or chain of health-care incidents, and (except for New South Wales) the involvement of multiple clinician specialties is recorded by recording up to three additional specialties as well as the principal specialty. For MIIs, it is a common practice to open more than one claim for a single health-care incident if more than one clinician was involved in the incident that gave rise to the allegation of harm or other loss. As a result, individual claim sizes will often be less than the aggregated total cost incurred by the MII(s) for a single allegation of harm or other loss. Thus the reported cost of an individual claim in the private sector may not reflect the total payment made by insurers in respect of the claimants. Also, where clinician specialty data are combined across the public and private sectors, the public sector claim record may include multiple clinician specialties, and so the total number of recorded clinician specialties will exceed the number of claims.

64 Public and private sector medical indemnity claims in Australia 2009–10
In addition, clinician specialties in the private sector are recorded according to their specialty as registered with their insurer rather than with their employing or contracting health service provider (as in the public sector). This difference has led to a methodological decision to combine the Obstetrics, Gynaecology and Obstetrics and gynaecology categories, as well as the General practitioner—procedural and General practitioner—non-procedural categories, for combined sector reporting

Public and private sector medical indemnity claims in Australia 2009–10 65
Appendix 3: Public and private sector claim management practices
The public sector
Arrangements for public sector medical indemnity insurance are governed by state and territory legislation and associated policies. Claim management practices vary between jurisdictions, and in some jurisdictions there are different processes for small and large claims. Claims are managed in-house by the state or territory health authority for some jurisdictions; in others, a body independent from the health authority manages claims. Some legal work may be outsourced to private law firms. A full explanation of the policy, administrative, and legal features of each jurisdiction is available in Australia’s public sector medical indemnity claims 2009–10 (AIHW 2012).
An allegation of harm or, in some jurisdictions, a health-care incident that could lead to a public sector medical indemnity claim is notified to the state or territory claims management body by the health facility concerned. If the likelihood of a claim eventuating is considered sufficiently high, a reserve is placed, based on an estimate of the likely cost of settling the claim. Various events can signal the start of a claim: for example, a writ or letter of demand may be received from the claimant’s solicitor, or the defendant may make an offer to a claimant to settle a matter before a writ or letter has been issued. As a claim progresses the reserve is monitored and adjusted if necessary.
In the public sector, the defendant of a claim is typically the health authority responsible for having employed or contracted the health-care professional(s) alleged to have been negligent in the performance of their duties. Accordingly the allegation of harm usually gives rise to a single claim even if more than one health-care professional is involved. This is a different practice from the private sector where a single claimant can generate multiple claims—one for each clinician being sued. Another difference is that nurses and administrative staff, who would generally be hospital employees rather than individually insured clinicians in terms of private sector medical indemnification, may well be amongst the professionals involved in public sector claims. Some jurisdictions cover claims against private clinicians working in public hospitals as well as claims against the hospital (and its employees).
Most public sector records within the MINC correspond to a single claim related to a claimant, usually the ‘claim subject’ but sometimes a dependent or other relative. Where there are two claimants, the claim subject and one other party, this would also be treated as a single claim. However, there is more variation where the claimants are multiple other parties, in which case the jurisdiction may record multiple claims (Box 1.1). Also, it is possible for a single claim to cover multiple claim subjects; for instance, a class action with a single plaintiff who represents several people who collectively bring a claim to court.
A public sector claim may be finalised in several ways—through state/territory-based complaints processes, court-based alternative dispute resolution processes, or in court. In some jurisdictions, settlement through a mandated conference process must be attempted before a claim can go to court. In some cases, a settlement is agreed between the claimant and defendant, independent of any formal process. In addition, a claim file that has remained inactive for a long time may be closed. Claims that have been closed can subsequently be reopened.

66 Public and private sector medical indemnity claims in Australia 2009–10
The private sector
MIIs provide professional indemnity insurance to individual clinicians. Typically, a separate claim is opened for each clinician implicated in the allegation of loss or harm. This is so the relevant proportion of the overall cost of claims can be allocated against the policy limits of individual clinicians, and is an explicit requirement of both the High Cost Claims Scheme and the Exceptional Claims Scheme. (Under the High Cost Claims Scheme, the Australian Government reimburses medical indemnity insurers, on a per claim basis, 50% of the insurance payout over $300,000 up to the limit of the practitioner’s cover, for claims notified on or after 1 January 2004. The Exceptional Claims Scheme is the Australian Government’s scheme to cover clinicians for 100% of the cost of private practice claims, either a single very large claim or an aggregate of claims, that are above the limit of their medical indemnity contracts of insurance, so that clinicians are not personally liable for ‘blue sky’ claims.) Also, claims related to a single allegation of loss or harm could appear on more than one MII database when individual defendants hold medical indemnity insurance with different insurers. Where a public hospital is involved, claims may appear on both MII and health authority databases.
As a result of the above, the reported cost of an individual claim in the private sector may not reflect the total payment made by each insurer in respect of the claimant(s). Also, the reported number of claims cannot be assumed to equal the number of clinical incidents leading to claims against insured clinicians.
MIIs derive an estimate for the likely cost of a claim. This is referred to as the ‘reserve’, which is the expected total amount of payment to be made on behalf of the insured clinician. It takes into account estimated payments to be made by any other clinicians and institutions (for example, hospitals) involved. Estimated plaintiff and defendant legal costs are included in the reserve. Estimates are reviewed regularly. When the claim is closed, the incurred cost represents all costs paid (usually, on behalf of a single insured) in respect of the claim including legal costs.
‘Potential claims’ in the private sector claims are considered in scope for the purposes of this report if preparatory legal expenses have been incurred and the claim has been reported to APRA. They are not included if the only action taken is to record an estimate relating to a possible claim that may ensue against an insured clinician.
MIIs charge different premiums for different clinical specialties based on the complexity of the medical procedures typically performed by the insured clinician (ACCC 2009). In addition, private sector clinicians are not covered to practise outside of their registered specialty or specialties. Accordingly, they are subject to financial incentives to adjust their provision of services in line with affordable premium levels, in ways that do not apply to public sector practitioners. As an example of differences in average premiums, an obstetrician pays approximately twice what a gynaecologist does, and procedural general practitioners pay more than non-procedural general practitioners, especially if the procedures include cosmetic surgery or obstetrics (ACCC 2009). The MINC CC has recommended, for the purposes of the combined sector report, that the AIHW combine the MINC Obstetrics, Gynaecology and Obstetrics and gynaecology categories, as well as the General practitioner—procedural and General practitioner—non-procedural categories. This is to minimise the distortions that may arise from assuming strict comparability between the public and private sector specialty categories.

Public and private sector medical indemnity claims in Australia 2009–10 67
Appendix 4: Coding examples for some main data items
Table A4.1: Coding examples for ʽbody function/structureʼ categories
Body function/structure coding category Examples of types of harm
1. Mental functions/structures of the
nervous system
Psychological harm (for example, nervous shock)
Subdural haematoma
Cerebral palsy
2. Sensory functions of the eye, ear and
related structures
Loss of hearing
Loss of sight
3. Voice and speech functions/structures
involved in voice and speech
Dental injuries
Injuries to the structure of the nose or mouth
4. Functions/structures of the
cardiovascular, haematological,
immunological and respiratory systems
Injury to the spleen or lungs
Generalised infection/sepsis
Deep vein thrombosis
Vascular or arterial damage
Conditions affecting major body systems, such as cancer that has progressed and no longer affects a single body part or system
5. Functions and structures of the
digestive, metabolic and endocrine
systems
Injury to the gall bladder, bowel, pancreas or liver
6. Genitourinary and reproductive functions
and structures
Injury to the breast
Injury to male or female reproductive organs
Injury to the kidneys, ureters or bladder
7. Neuromusculoskeletal and
movement-related functions and
structures
Loss of function due to inappropriate casting of joint
Loss of function due to restricted blood flow and
nerve damage
Paralysis
8. Functions and structures of the skin and
related structures
Burns
9. Death ‘Death’ is recorded where the alleged harm was a contributory cause of the death of the claim subject
10. No body function/structure affected Failed sterilisation, where there is no consequent harm to body functions or structures

68 Public and private sector medical indemnity claims in Australia 2009–10
Table A4.2: Coding examples for selected incident/allegation types
Incident/allegation
type Example of incident or allegation
Consent Failure to warn
Medication-related Includes type, dosage and method of administration issues
Procedure Failure to perform a procedure
Wrong procedure performed
Wrong body site
Post-operative complications
Failure of procedure
Post-operative infection
Intra-operative complications
Treatment Delayed treatment
Treatment not provided
Complications of treatment
Failure of treatment
Other Medico-legal reports
Disciplinary inquiries and other legal issues
Breach of confidentiality
Record keeping/loss of documents
Harassment and discrimination
Table A4.3: Coding examples for mode of claim finalisation
Mode of
finalisation
Explanation
Court
decision
From MII claims data ─ includes claims where damages were awarded to the plaintiff
by the court (either initially or on appeal) and where the case was awarded against the
plaintiff by the court (either initially or on appeal) and the MII incurs costs only. In the
public sector data Court decision includes claims where a court decision has directed
the outcome of a claim.
Negotiated From public sector claims data ─ includes proceedings conducted in state/territory
health rights and health complaints bodies; mediation, arbitration, and case appraisal
provided under civil procedure rules; settlement conferences required by statute as
part of a pre-court process; and other instances where a claim is settled part way
through a trial. Negotiated from MII claims data includes settlement outcomes where
an amount is paid to the plaintiff other than by court direction.
Withdrawn From public sector claims data ─ includes claims that have been closed due to
withdrawal by the claimant, or operation of statute of limitations, or where the claim
manager decided to close the claim file because of long periods of inactivity, and
instances where a claim is discontinued part way through a trial. Withdrawn claims
from MII claims data include claims where the claimant withdrew the claim and the MII
incurs costs only.

Public and private sector medical indemnity claims in Australia 2009–10 69
References
ACCC (Australian Competition and Consumer Commission) 2009. Medical indemnity insurance, sixth monitoring report. Canberra: ACCC.
AIHW (Australian Institute of Health and Welfare) 2004. First medical indemnity data collection report: public sector. January to June 2003. Health working paper no. 6. Canberra: AIHW (web only). <http://www.aihw.gov.au/publications/index.cfm/title/10092>.
AIHW 2007. A national picture of medical indemnity claims in Australia 2004–05. Safety and quality of health care series no. 1. Cat. no. HSE 48. Canberra: AIHW.
AIHW 2008. Public and private sector medical indemnity claims in Australia 2005–06: a summary. Safety and quality of health care series no. 4. Cat. no. HSE 58. Canberra: AIHW.
AIHW 2010. Public and private sector medical indemnity claims in Australia 2006–07: a summary. Safety and quality of health care series no. 6. Cat. no. HSE 86. Canberra: AIHW (web only). <http://www.aihw.gov.au/publications/index.cfm/title/10740>.
AIHW 2011a. Public and private sector medical indemnity claims in Australia 2008–09. Safety and quality of health care series no. 10. Cat no. HSE 112. Canberra: AIHW.
AIHW 2011b. Public and private sector medical indemnity claims in Australia 2007–08. Safety and quality of health care series no. 7. Cat. no. HSE 90. Canberra: AIHW (web only). <http://www.aihw.gov.au/publication-detail/?id=10737418323>.
AIHW 2012. Australia’s public sector medical indemnity claims 2009–10. Safety and quality of health care series no. 11. AIHW Cat. no. HSE 119. Canberra: AIHW.
APRA (Australian Prudential Regulation Authority) 2009. National Claims and Policies Database. Viewed 4 November 2011, <http://www.ncpd.apra.gov.au/Home/Home.aspx>.
Medicare Australia 2010. Medical indemnity for insurers. Viewed 4 November 2011, <http://www.medicareaustralia.gov.au/provider/patients/medical-indemnity-insurers.jsp>.
Victorian Department of Health 2009. Framework for medihotels in Victorian public health services. Viewed 4 November 2011, <http://www.health.vic.gov.au/emergency/medihotel-framework.pdf>.

70 Public and private sector medical indemnity claims in Australia 2009–10
List of tables
Table 3.1: Numbers of public sector claims and private sector (MII) claims, from 1 July 2007
to 30 June 2008 (2007–08) to 1 July 2009 to 30 June 2010 (2009–10) ...................................... 6
Table 3.2: All claims: primary incident/allegation type, by health service setting, 1 July 2009 to 30 June 2010 .............................................................................................................................. 9
Table 3.3: All claims: primary incident/allegation type, by health service setting, 1 July 2009 to 30 June 2010 (per cent) .......................................................................................................... 10
Table 3.4: New claims: primary incident/allegation type, by health service setting, 1 July 2009 to 30 June 2010 ............................................................................................................................ 11
Table 3.5: New claims: primary incident/allegation type, by health service setting, 1 July 2009 to 30 June 2010 (per cent) .......................................................................................................... 12
Table 3.6: All claims: specialties of clinicians involved, by primary incident/allegation type, 1 July 2009 to 30 June 2010 ........................................................................................................ 15
Table 3.7: All claims: specialties of clinicians involved, by primary incident/allegation type, 1 July 2009 to 30 June 2010 (per cent) ...................................................................................... 16
Table 3.8: New claims: specialties of clinicians involved, by primary incident/allegation type, 1 July 2009 to 30 June 2010 ........................................................................................................ 17
Table 3.9: New claims: specialties of clinicians involved, by primary incident/allegation type, 1 July 2009 to 30 June 2010 (per cent) ...................................................................................... 18
Table 3.10: Closed claims: specialty of clinicians involved, by extent of harm, 1 July 2009 to 30 June 2010 ................................................................................................................................ 20
Table 3.11: Closed claims: specialty of clinicians involved, by extent of harm, 1 July 2009 to 30 June 2010 (per cent) .............................................................................................................. 21
Table 4.1: All claims: primary incident/allegation type, by sex and age group of claim subject, 1 July 2009 to 30 June 2010 ......................................................................................... 27
Table 4.2: All claims: primary incident/allegation type, by sex and age group of claim subject, 1 July 2009 to 30 June 2010 (per cent) ....................................................................... 28
Table 4.3: New claims: primary incident/allegation type, by sex and age group of claim subject, 1 July 2009 to 30 June 2010 ......................................................................................... 29
Table 4.4: New claims: primary incident/allegation type, by sex and age group of claim subject, 1 July 2009 to 30 June 2010 (per cent) ....................................................................... 30
Table 4.5: All claims: primary body function/structure affected, by sex and age group of claim subject, 1 July 2009 to 30 June 2010 ............................................................................... 31
Table 4.6: All claims: primary body function/structure affected, by sex and age group of claim subject, 1 July 2009 to 30 June 2010 (per cent) ............................................................. 32
Table 4.7: New claims: primary body function/structure affected, by sex and age group of claim subject, 1 July 2009 to 30 June 2010 ............................................................................... 33
Table 4.8: New claims: primary body function/structure affected, by sex and age group of claim subject, 1 July 2009 to 30 June 2010 (per cent) ............................................................. 34
Table 5.1: All claims: status of claim, by duration of claim (months), at 30 June 2010 ...................... 37
Table 5.2: All claims: status of claim, by duration of claim (months), at 30 June 2010 (per cent) ..... 37

Public and private sector medical indemnity claims in Australia 2009–10 71
Table 5.3: Current claims: reserve range, by duration of claim (months), at 30 June 2010 ................ 38
Table 5.4: Current claims: reserve range, by duration of claim (months), at 30 June 2010 (per cent) ..................................................................................................................................... 38
Table 5.5: Closed claims: total claim size, by duration of claim (months), 1 July 2009 to 30 June 2010 ................................................................................................................................ 40
Table 5.6: Closed claims: total claim size, by duration of claim (months), 1 July 2009 to 30 June 2010 (per cent) .............................................................................................................. 40
Table 5.7: Closed claims: total claim size, by mode of claim finalisation, 1 July 2009 to 30 June 2010 ................................................................................................................................ 42
Table 5.8: Closed claims: total claim size, by mode of claim finalisation, 1 July 2009 to 30 June 2010 (per cent) .............................................................................................................. 42
Table 5.9: Closed claims: total claim size, by health service setting, 1 July 2009 to 30 June 2010 ..... 44
Table 5.10: Closed claims: total claim size, by health service setting, 1 July 2009 to 30 June 2010 (per cent) ..................................................................................................................................... 45
Table 5.11: Closed claims: specialties of clinicians involved, by total claim size, 1 July 2009 to 30 June 2010 ................................................................................................................................ 47
Table 5.12: Closed claims: specialties of clinicians involved, by total claim size, 1 July 2009 to 30 June 2010 (per cent) .............................................................................................................. 48
Table 5.13: Closed claims: total claim size, by extent of harm, 1 July 2009 to 30 June 2010 ................ 50
Table 5.14: Closed claims: total claim size, by extent of harm, 1 July 2009 to 30 June 2010 (per cent) ..................................................................................................................................... 50
Table A1.1: MINC and ISA data items used for this report ...................................................................... 51
Table A1.2: Definitions of key terms ............................................................................................................ 53
Table A4.1: Coding examples for ‘body function/structure’ categories ................................................. 67
Table A4.2: Coding examples for selected incident/allegation types ..................................................... 68
Table A4.3: Coding examples for mode of claim finalisation ................................................................... 68

72 Public and private sector medical indemnity claims in Australia 2009–10
List of figures
Figure 4.1: All claims: five most common primary incident/allegation types, by claim subject’s age group, 2009–10 (per cent) ................................................................................................... 23
Figure 4.2: New claims: five most common primary incident/allegation types, by claim subject’s age group, 2009–10 (per cent) ................................................................................... 24
Figure 4.3: All claims: five most common primary body function/structure affected categories, by claim subject’s age group, 2009–10 (per cent) ................................................................... 25
Figure 4.4: New claims: five most common primary body function/structure affected categories, by claim subject’s age group, 2009–10 (per cent) ............................................... 26
Figure 5.1: Current claims: length of claim (months), by reserve range, 30 June 2010 (per cent) ...... 36
Figure 5.2: Closed claims: total claim size, by duration of claim (months), 1 July 2009 to 30 June 2010 (per cent) .............................................................................................................. 39
Figure 5.3: Closed claims: total claim size, by extent of harm, 1 July 2009 to 30 June 2010 (per cent) ..................................................................................................................................... 49


![Fiscal Current state of Housing Indemnity, Ltd.July 10, 2008 Registered as small-claims and short-term insurer. [Kanto Finance Bureau (small-claims and short-term insurance) No. 34]](https://img.dokumen.tips/doc/110x75/5fc431a161c83634c24580a4/fiscal-current-state-of-housing-indemnity-ltd-july-10-2008-registered-as-small-claims.jpg)