Embed Size (px)
Citation preview
Public Affairs 856Trade, Competition, and
Governance in a Global EconomyLecture 11/20/2016
Instructor: Prof. Menzie ChinnUW MadisonSpring 2016

Administrative Issues• Course website:
http://www.ssc.wisc.edu/~mchinn/web856_s16.html
• OH: MW 4-5, 7418 Soc Sci• Textbook: Feenstra/Taylor, International
Trade• Additional Readings: from CRS, CBO,
web, Econbrowser• NYT, FT, WSJ, Economist

Administrative Issues
• Grading: 10% PS, 50% 2×MT, 40% paper• Dates:
- MT on 2/24, 4/6- Paper due on Fri, 5/6
• Make-ups: None. Points are re-allocated if you have a legitimate excuse. No late assignments accepted (must be handed in during lecture)

Robert C. Feenstra and Alan M. TaylorInternational Trade, Third Edition / International Economics, Third Edition
Copyright © 2014 by Worth Publishers
Robert C. Feenstra and Alan M. TaylorInternational Trade, Third Edition / International Economics, Third Edition
Copyright © 2014 by Worth Publishers

Robert C. Feenstra and Alan M. TaylorInternational Trade, Third Edition / International Economics, Third Edition
Copyright © 2014 by Worth Publishers
Robert C. Feenstra and Alan M. TaylorInternational Trade, Third Edition / International Economics, Third Edition
Copyright © 2014 by Worth Publishers
Robert C. Feenstra and Alan M. TaylorInternational Trade, Third Edition / International Economics, Third Edition
Copyright © 2014 by Worth Publishers
Robert C. Feenstra and Alan M. TaylorInternational Trade, Third Edition / International Economics, Third Edition
Copyright © 2014 by Worth Publishers
Barriers to Trade
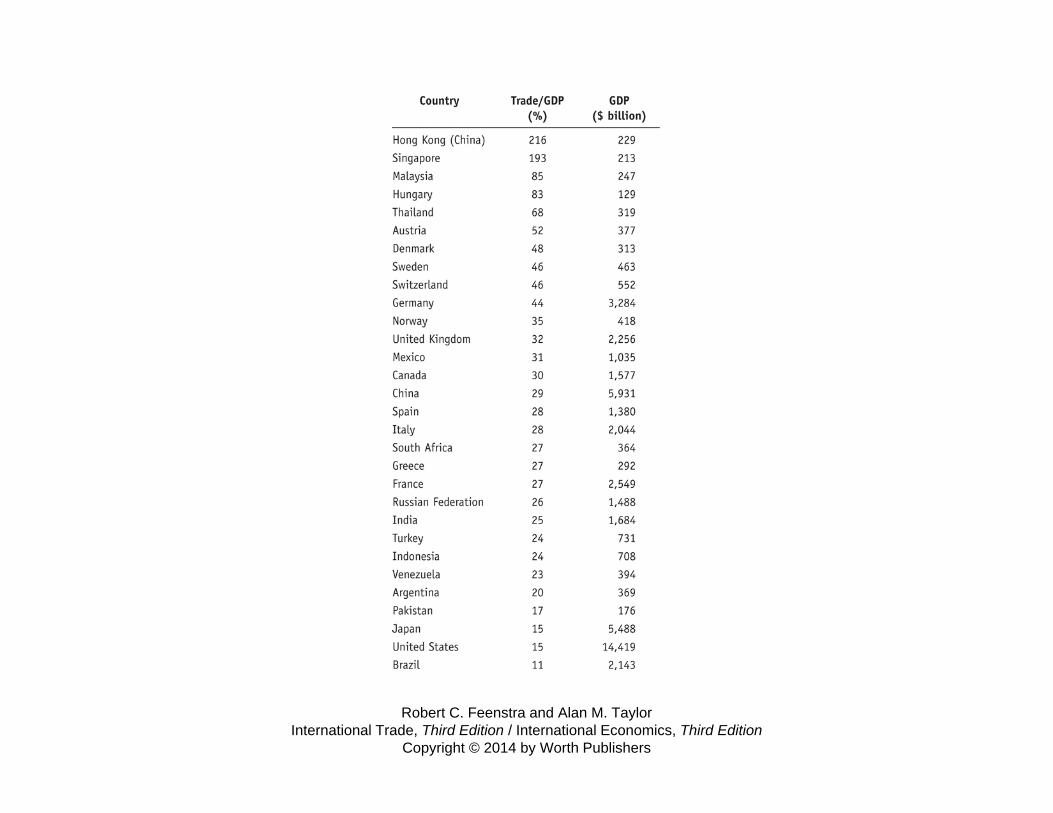
• Trade barriers refer to all factors that influence the amount of goods and services shipped across international borders.
• Barriers to trade change over time as policies, technology, etc. change.
• Figure 1.3 shows the ratio of trade in goods and services to GDP for a selection of countries over time.
• We can look at important events that have affected trade.

Barriers to Trade
• The First “Golden Age” of Trade– 1890–1913– Ended with the beginning of WWI– Significant improvements in transportation
• Steamship and railroad
– U.K. had highest ratio of trade to GDP at 30%
Barriers to Trade
• Inter-War Period– 1913–1920 showed decreases in trade for
Europe and Australia due to WWI and aftermath.
– After 1920 the ratio fell in all other countries and was made worse by the Great Depression which began in 1929.
– U.S. adopted high tariffs—Smoot-Hawley tariffs—in June 1930, some as high as 60%.

Barriers to Trade
• Inter-War Period– Tariffs backfired as other countries retaliated—
the average world-wide tariff rate rose to 25% by 1933.
– Import quotas—limitations on the quantity of an imported good—were also instituted during this time.
– High tariffs and restrictions lead to a dramatic fall in world trade with large costs to the U.S. and the world economy.
Barriers to Trade
• Inter-War Period– This decline in the world economy lead the Allied
countries to meet after WWII to develop policies to keep tariffs low.
• General Agreement on Tariffs and Trade (GATT) which became the World Trade Organization (WTO)
– Chapters 8–11 look at trade policies and the international institutions that govern their use.
– Conclusion—high tariffs reduce the amount of trade and impose large costs on countries involved.

Barriers to Trade
• Second “Golden Age” of Trade– After WWII, some countries were able to
increase trade back to WWI levels quickly.– The end of WWII, the reduction of tariffs from
GATT, and improved transportation contributed to the increase in trade.
• Shipping container was invented in 1956.
– World trade grew steadily after 1950 with many countries exceeding their pre-WWI trade peak.

Robert C. Feenstra and Alan M. TaylorInternational Trade, Third Edition / International Economics, Third Edition
Copyright © 2014 by Worth Publishers

Robert C. Feenstra and Alan M. TaylorInternational Trade, Third Edition / International Economics, Third Edition
Copyright © 2014 by Worth Publishers

Migration and Foreign Direct Investment
• International trade, migration, and foreign direct investment (FDI) all affect the economy of a nation that opens its borders to interact with other nations.
• Now that we have introduced international trade, we need to introduce migration and FDI.

Map of Migration
• Figure 1.5 shows a map of the number of migrants around the world.
• Values shown are number of persons in 2000 who were living (legally or illegally) in a country different from where they were born.
• Two sources of data are used• The bolder the line, the more migrants

Robert C. Feenstra and Alan M. TaylorInternational Trade, Third Edition / International Economics, Third Edition
Copyright © 2014 by Worth Publishers
Map of Migration
• However, international trade can act as a substitute for movements of capital and labor across borders.– Trade can raise the living standard of workers
in the same way that moving to a higher-wage country can.
– As trade has increased worldwide, more workers are able to work in export industries.
• This allows them to benefit from trade without moving to another country.
Map of Foreign Direct Investment
• FDI occurs when a firm in one country owns a company in another country.
• Figure 1.6 shows the principal flows of FDI in 2000. – Again, thicker lines indicate higher levels of
FDI.• In 2000 there were FDI flows of $1.3 trillion into
or out of OEDC countries.• This value is more than 90% of total world FDI.

Robert C. Feenstra and Alan M. TaylorInternational Trade, Third Edition / International Economics, Third Edition
Copyright © 2014 by Worth Publishers

Map of Foreign Direct Investment
• Unlike migration, most FDI occurs between OECD countries.
• Two ways FDI can occur– Horizontal FDI occurs when a firm from one
country owns a company in another industrial country.
• Purchase of Rockefeller Center in New York by Japanese investor

Map of Foreign Direct Investment
• Reasons for Horizontal FDI– Having a plant abroad allows the parent firm to avoid
any tariffs or quotas from exporting to a foreign market since it produces locally.
– Having a foreign subsidiary abroad also provides improved access to that economy because the local firms will have better facilities and information for marketing products.
– An alliance between the production divisions of firms allows technical expertise to be shared.

Map of Foreign Direct Investment
• Vertical FDI occurs when a firm from an industrial country owns a plant in a developing country.
– This usually occurs to take advantage of lower wages in the developing country.
– Firms have moved to China to avoid tariffs and acquire local partners to sell there.
– China joined the WTO in 2001 and has reduced tariffs, but firms have remained, and autos are now being exported from China.