Embed Size (px)
Citation preview

DOCUMENT RESUME
ED 243 914 TM 840 206
AUTHOR Marsh, Herbert W.TITLE Relationships among Dimensions of Self-Attribution,
Dimensions, of Self-Concept and AcademicAchievements.
PUB DATE L Oct 83NOTE 32p.; Parts are marginally legible due to faint
print.\\PUB TYPE Reports - Research/Technical (143) --
Tests/Evaluation Instruments (160)
EDRS pRICE MFO1 /PCO2 Hlus Postage.DESCRIPTORS Academic Ability; *Academic Achievement; *Attribution
Theory; Foreign Countries; Grade 5; *IndividualDifferences; Intermediate Grades; *Locus of Control;Psychological Characteristics; *3elf Concept; *SelfConcept Measures-
IDENTIFIERS Australia (Sydney)
ABSTRACTIn a sample of 559 fifth-grade students, measures
were collected to assess: (1) dimensions of self-attribution forcauses of academic outcomes; (2) multiple dimensions of self-concept;and (3) academic achievements. The empirically-derived_dimensions pfacademic self-attribution replicated and extended results of previous,research, but failed to support bipolar dimensions (e.g.,internal-external, stable-unstable) found when characteristics of theattributional situation are manipulated. Overall, students whoattribute academic success to ability (and to a lesser extent toeffort) and who do not attribute failure to a lack of ability (and toa,lesser extent not to a lack of effort) were found to have betteracademic self-concepts (based upon self-reports, and self-conceptsinferred by peers and by teachers); and better academic achievement(based on test scores and teacher ratings). The specificity and thepredictability of the observed pattern of relationships supports theconstruct validity of interpretations based upon both theSelf-attribution and self-concept instruments. (Author)
*v*********************************************************************Reproductions supplied by EDRS are, the best that can be made
from the original document.***********************************************************************

Relationships Amon9 Dimensions ofSelf-attribution, Dimensions of
Self-concept and Academic Achievements
Herbert W. Marsh
The University of Sydney
1 October, 1933
Runniril HeaJ: Self-attrributions
2
':PERMISSION TO REPRODUCE THISMATERIAL HAS BEEN GRANTED BY
gxk.rii
TO THE EDUCATIONAL RESOURCESINFORMATION CENTER (ERIC).'
U.S. DEPARTMENT OF EDUCATION_NATIONAL INSTITUTE OF EDUCATIONEDUCATIONAL RESOURCESINFORMATION
CENTER fE/7C1
M. This document has been reproduc;n1 asreserved from the person or organizationonginatIng n.
Minor changes have been made to Improvereproduction <paltry.
Point of view Or OptrOOOS stated in this docu.mein do not necessarily reprewmt °than! NIE
position or Poky

Relationships Among Dimensions ofSelf- attribution,- Dimensions of _
Self-concept and Academic Achievements
ABSTRACT
In a sample of 559 fifth ,4hade Students measures-were collected to
assess: 1) ditheitibei of self- attribution for causes of academiC
outcomes; 2) multiple dimensions of self-concept; and, 3 academic
athiel.i0Ments. The empirically derived dimensions of academic self-
attribution replicated and extended results of previous research, but
failed to. support bipolar dimensions (e.g., internal-external, stable-
unstable) found when characteristiLs of the attribUtitinaI situation
are manipulated. Overall, students who ,attribute academic success to
ability :and to a leater extent to effort? and who do NOT attribute
failure tb a laCk'Of abilit, (and to a lesser e.(t.e(A not to a. lac): of
effOrt) Were found to have: 1?. better academic self -cm rcepts (based
upon Self-reports; and self-concepts inferred by peers and b, .
teachers); and better academic achievement (based on test SCOr:C7,
and teacher ratin9s. The speLificit and the predictabilit; of the
the cbser.,ed pattern of relationships supports the' construct validitr.'
of interpretation::: baccd upon both the self-attribUtion and self-
concept instrumsnts.

Relationships Among Dimensions ofSelf-attributionE Dimensions of
Self-concept and Academic AchievementS
Attribution researchers ask subjects for their perceptions. of the
cause of a particular outcome and examine the perceived causes (3.e.,
attributions) which people use to explain events. They argue that
perceived causes of success and 'failure have important implications
and these have been wide', applied in educational settings..
IndivIduAl difference in the way children attribute outcomes to suci
causes as ability; effort and luck are related to school performance,
self-concept, and academic behaviors (Bar -Tal. 1979; Marsh, et al.,
1934; Weiner, 1979). Nevertheless, self-attribution is a hypothetical2
cchstruct whose usefulness must be shown through the demonstration of
its construct validity..
In different experimental contexts, attribution researchers
examine individual differences in the,way subjects explain their own
behavior in different settings (A dispositionalor trait emphasis) and
examine how systematic manipulations in the context alter,attributions.*
(a situational or state emphasis). In both types of study subjects
Are tplicalI presented with depicting success or failure
and asked to judge the likelihood of eaehiaf a Series of possible
causes for the outcome (e.g., ability, effort, luck, task difficulty).
Drspositional studies asi. subjects to make ,self- attributions about
their own behavior, while situational studies typically ask for
attributions about a hypothetical other person. Dispositional studies
generally give subjects little infOrmAtion about the cause of the
outcome in the stimu 1,45, while stimuli in situational studies provide
detailed infOrmation: For e:,(ample a subject in a dispositional study,
may be told only that heishe did poorly on a math test and asked to
judge the l'ike'lihood of arious causes, while subjects in a situational
study ma/ be told that a hypothetical other person did poorly and that
the person is intelligent, th,it the test was easy, and that .the person
did not study very hard for it. In situational reseach,componentS of
the stimulis''aresystematically varied (e.g., the hypothetical person
was or was not intelligent, the test was easy or difficult, etc.) and
effectS of tfe situational manipulations which generalize across
.subjects are sought. In dispositional research attributional
tendencies in individual subjects which generalize across situations
are sought. It is important to emphasize that neither approach is
inherently superior and that the attribution process is affected b/
both 'situational and dispositional tendencies. Nevertheless, tt is

"Self-attributions 2
clearly inappropriate to assume that findings from one approach will
generalize to the other; though the mistake is common in attribution
research (see Marsh; et al.; 1984). The focus of thiS study is on the.
identification!ofdispositional tendencies. in the way children form
attributions about academic outcomes, and how. these relate to other
constructs.
The Study of individual dif-ferences in self-attribUtions stems
primarily from "locus of control" research (Potter; 1966) where a
generalized expectancy for the internal or external control of events
is hypothesized. Marsh et al. (1984) have recently argued that such
diSpOSitional tendencies may be specific to particular content areas
Such as academic achievement or even to particular subject areas
within an academic setting (e.g., verbal. or mathematical achievement).4
Attribution theorists place more emphasis on different causes (.9..
ability, effort, luck, etc.) and stress the, effects situational
variables whic are experimentally .manipulated. ThUs, Weiner ('1972,
i°74) argued fOr a two-dimensional taxonomy where bipolar dimensions'
are locus tinternaI-e4:ternaI) and stability (stable-unStable). Hence,
perceieed causes can be classified into one of four types representing
the .2 x 2 = 4 combinatiens of the endpoints of the to dimensions
(e.g.; ability is an internal, stable causal. While this earlier:
formulation ha=_ been the basic.: of must research, Weiner (19-'9;' 1 °)30)
. has more recent: e postulated a third dimension of controllabilite,
(controllabl - uncontrollable). which results in eight cells or gees
of attributid 2 ,-. 2 2.
Weiner's mL,11, whtLh is based upon a logical analysi, of the
4Ltribc.itibei process; has been quitg heuristic, and a large bud;; of-
empirical supportefur the model°is summarized be Weiner- (e.g. lee,
1980). Despite this empirical support. many problems still remain
(see Marsh, et al.. 1924 for further discussion). Certain
combinations appear to be mutuall:4 exclusive (e.g.,
externalicontrollable) so that some of the eight cells Weiner
model ma4 be empt4. Weiner has nut specified whether his theoretical
dimensions are orthogonal, though this seems unlit:el./. The
relationship between these dimensions and outcome (i.e.; success or
failure) has riot been specified adequate14. The measurement of
attributions is typical). conducted with ad hoc instruments with
untested psichometric properties. The classification of causes (e.g.,
abilitNas internal/stable, and effort as internaliunstable) cannot be
made independent of the particular attribution context (see Weiner. in
Seli-attributions 3
press). Most. importantly for the present reaearch, sup/poet comes
almost.entirely from situational research, and there is little
research to test whether or not these theoretical dimensions also
describe dispositronal differences in the way sUbjects perceive causes
of their own behavior. The dispOsitional-Situational distinction is
particularly confused here in that, the term "dimeasiorna. normally
refers to factors which reSalt from indiVidual tVifferenee raaeareh.
Factor analytic studies of dispositional tendencies in the
attribution process typically fail to support the theoretical
dimensions found in situational research. Fennema ,(Feanema, Wolleat
Pedro, Note 1) and Relich (Note 2) independently developed self-
attribution scales for performance in mathematies. Eat:le was desigeea
to measure +our scales derived from Weiner's eaF.Iaet- model ,and
considered outcomes representing both success and failure, The Reiich
Steely resulted in five clearly defined +actors: ability (where.
items representing ability attributions for success oateamet -- i.e.,
success/ability items -- and failure /ability itema loaded in opposite
directions); 2) success/effort; 3) failure/effort; 4) suteessitask
difficulty and success/luck; and 5) failure tase/difficulte and
failUre/luck. Faceprs idertified in the Fennema data (see Marsh, et
al., 1984) were consist.:: t with thes-eeeee et-atiet-theatwo effort
scales did noteappear as aeparate factors. Marsh et al. (1984)
designed a self- attribution instrument to measure the IS scales
representing the factorial combination of three facets; academic
content (math, reading, and general school); outcome (success or
failure); and perceived d'ause (abilite, effort, and external causes).
Factor analysis of responses to that instrument reselted in seven
factors;"three failure factors representing ability, effort and
external causes, two success factors representing effort and external
causes, and two content-specific factors represehting primarily
ability in math and ability in reading. This research led the authors
to conclude that dispositional tendencies in the attribution process
are specific to outcome, perceived cause, and content.
In self- concept research, a relationship between attributional
tendencies and self-concept is frequently hypothesized,- but the
theoretical basis of this hypothesis is seldom elaborated. In a
review of the theoretical and empirical basis for this relationehip,
Marsh et al. (1904) argued that a favorable self:concept was
consistent with attributions to ability and effieft as perceived causes
of success, but not with a disposition to Attribute failure to a lack
Of Offoat and particularly not to a lack of ability. On the basis of

Self-attributions 4
this review and their empirical :findings tr=y concluded that academic
Self-concept is substantially correlated with success/ability and
success /effort attributions (positively), and with failure/ability
attributions (negatively); and less substantially correlated with
failure effort attribUtiOnt (begati-VOIy).; Also; the magnitude of
these correlatiteit is IargeSt when self attributions and self-concepts
involve the same area of academic content (e.g.; reading or
mathematics);
The Present Study.
The purpose of the present study is to replicate and expand
findings from the Mareh et al. (1984) study.' The findings are based
upon a refined version of the Sydney AttribUtion SCale (SAS) used in
the earlier research, a MUltidiMenSibrial self-concept measure. self-
concepts inferred be peers and by teachers; achievement test scores _in
math and reading; and teacher ratings of student academic abilities.eA 72-item revision of the SAS was used instead of the 130-item
instrument employed in the earlier studs. Dimensions underleing the
self-attributions were examined with both coneentional/exploratory
factor analytic techniques considered earlier and also with
confirmatory factOr analeses. The addition of self-concepts Inferred
by teashers and tie Ceee. as well as the self-report measure used
preeibUtlY, provides a stronger basis for examining the self
attribution /self- concept relationship. The collection of a wide
variety of. achievement scores in this study also allows the
examination of relationships between self-attributions and academis
achievement: On the basis of the literature review and empirical
results from the earlier research it is predicted that:
1) Self-attribution responses-to the SAS willdefine severefgttsriacorresponding to: readsng-abilitY;_Math ability; suCecssieffort;success/external causes; failure ability; failure/effort; andfailure/sKternal causes.
e e2) AtadeMit.eSelf-COnCeptS will_be_substantialle correlated_wittesuccesS/ahilite and_successLeffoct_attributions (positiveleis withfailure/ability attribution; (negatively), less substantiallycorrelated with failure/effort attributions (negaeivele). and leastcorrelated with success/eSternal and failure/external scales. Themagnitude of correlations which are predicted to be substantial willbe largest when both self-concept and selfeettribution measures arespecific to the same academic subject (i.e., reading or math). Thispattern of results is also predicted to generalize to self-conceptsinferred by teachers and by peers.
3) Academic achievement scores will be most highly correlated Withsuccess/ability (positively) and failure/ability 'negatively) scales,and less substantially correlated with effort scales. Again, themagnitude of correlations predicted to be substantial will be largestwhen achievement and self- attributions aro specific to the sameacademic subje0.
,TheSe pedictiohn emphasize both the convergence of measures
whiCh are theoretically or logically connected; and divergence of

Self-attributions 5
measures which are designed to measure separate components. Thus the
pattern of results is as important as the actual magnitude of
correlations, and follows an approach to construct validity which is
based upon the logic of multitrait-multimethod analysis (see Marsh,
1982; Marsh, et al., 1984);
METHOD.
Sample and Procedures.
Subjects were were the 559 fifth grade students (mostly 10 year
olds) enrolled in 19 fifth grade classes in one of seven private
Catholic schools in Sydney, Australia. Most of the students attended
single-sex classes (18 of the 19 classes). Children in the sample
came from families which varied in-Seatideebreamic status from lower-
midd4e to upper middle CIatt. Across all the children in the study.
atadefirit abilitiet were about average. Data considered are part of a
larger project which is described. in more detail by Marsh. Smith e
:_.arses (Note 3i.
The self- concept and self-attribution measures were administered
by one of the authors to intact.classes of no more than 34 students.
For both self-report instruments several practice examples were given
along with instructions to ensure that pupils understodd what was
expected of them, and then the items were read aloud at a fairly rapid
pace (there-eh thildree had copies of the instruments in front of them
and could toel along with the researcher). After students had
completed the self-concept instrument, they were asked to write their
name on a second cope of the SDO and to exchange papers with a pupil
.sitting beside them. They were then asked to take the new survey to a
different desk so that they were sitting besides a different pupil and
to complete the survey as if they were the pupil whose name was on the
paper. Thus, the task of the peer was to "predict" the responses made
by the subject. Care was taken to ensure that the subject and the
selected peer did not ditetiSt the subject's responses. While the
various ih5tt-ilt-Aoht; were being administered to the students; the
classroom teacher was asked to complete a rating sheet about each
child which included abilite ratings for readine,math and school
subjects in general, and inferred selt'sconcept ratings In the same
scales as assessed be the self-concept instrumerrt. Teacher ratings
were made with a nine- -point response scale varying froiii "1 very
poor" to '9 very good." Some teachers were unable to complete the
ratings until later, and one teacher declined to complete the forms at
;

Self-attributions 6
The'achievement feSts were distributed to the schools, by the
researchers, but were actually administered by the classroom teacherstemsir
during a regular class session before te,e administratiOn of the self-
report measures.-These tests were then scored by the researchers with
the understanding that feedback would be given to the schools. Two of
the schools declined to participate in the achievement testing, though
they did agree to the administration of the self-report measures and
to complete teacher ratin9s.
Tetinm Materiales.
Sydney Attribution Scale (SAS). The purpose of the SAS le to
measure students perceptions of ;causes of their'academic success and
failure. The revised version used in this study is designed to
measure 12 scales which result from the factorial zoimbinatton of throe
facets: atedeeic (Memath or Rereading); outcome (Sesuccess Or
Fefailure); and perceived eause (A=abilite, Eeeffort, or X=e,ternal
causes). Thus RSA ar readingisuecessiability refers to the scale
represented by items whieh measure attrIbUtiOnS to abilit: as the
cause of success in reading. Each of the 12 scales i5 measured b 6
of the terns. The instrument consists of 24 brief scenarios
descrhin4 e =:tuation in which the student is to suppose him/herself
jr . 6 Slt6.-.2.fl Lit; ecademic success or failure: With each
scer.erice three,,randemli ordered, plausible causes fur the outcome
and student, mete Independent ratings of each cause along J +tee-en:lit
respcnse =sele -chid, Xaries from "1-False" to "5-True." The rat:onele
for tne design Of the SAS is lesr.ribel be Marr,h, et al. (1934). The
revr.lt7,1 ..ersime differs from thet eerlir ersien in that i items
(inetead of le, were oolocted to represent each scale, and the 51,'
scales relatine tc "school sobjects i.n general" were e,(cluded. Ar.
e.:ample of one of t,.o scenarios and the three causes is as fol:ows:
A preliminary item analysis of responses to the S1415 iconduetel
with the commercially available SPSS program, See Hull & N1Pi 19t"311
indicated that none of the SAS items in any of the 12 scales was a
negative diecrinator. and that 67 of the 72 items had "corrected
item-total correlations" !see Hull & Nie, 1911) of at least 0.30.
Coefficient alphas for the sis. success scales (0.69 to 0.e4 -- median
9

Self-attributions 7
= 0.82) were 9enera le hi9her than for the six failure, Ui.elye (0.
to .0.7'5 -- median = 0.66). For purposes of this stud;; based upun
results deecribed later and the results of Marsh et al. (1984), eight
scores were used to summarize responses to the SAS. Six of these
scores (successiability, success/effort, success / external,
failure/abiIity, failure/effort, and failure/external) Were 'obtaint'el
by summing responses to reading and math items, , 'ile thetwo content\
specifi factors were defined only by reading items of only by math
items (these scores and their empirical support ere discussed later iri
more detail). These eight score=_ had coefficient alphas ranging from
0.70 to 0.N86 (median = 0.23) and only the score representing
attributios to external causes for failure outcomes had an alpha leee
than 0.30. :Thus, despite the considerable reduction in the length of
the SAS,the.- scores used in the analysis are reasonably reliable.
gel( e ceet Measurese The Self Description Questionnaire (830)
measures sev In components of preadolescent self-concept derived from
Shavelson's model i3havelson, Hubner & Stanton, 1976; Marsh &\
Shavelson, Not 4). These consist of self-concepts in -four
nonacademic areas (Physical Ability, Phesical Appearance, Peer\Relationships; *d Parent ReIationehips) and three academic areas
(Reacting; Math and General School). A description of the seven-scale
instrumentr its theoretical rationale, the wording of the items,
reliabilities and six separate factor analyses are presented elsewhere
(Marsh, Barnes, Cairns & Tidman, in press; Marshi Parker & Smith,
1933; Marsh, Peich & Smith, 1923; Marsh, Smith & Barnes, 1987). This
research has ehown the seven 2,30 scales to be reliable (coefficient
alpha'S in the 0,20's and 0.90's), moderately correlated with measures
of correspondine academic abilities (r's from .3 to .7), and ln
agreement with Self-coneepts inferred by primary school teachers.
Ie, the current vernitienf the tDO an eighth component of
General-Self (which is, similar to the self- esteem scale described be
Posenber9, 1965) has been added. Coefficient alpha's for the eight
SD0 scales in this study varied between 0.71i and 0.9X (median = 0.87).
Total scores representieg the sun of the four neeacademic scales (Tat
--NAM and the -sum oi the three academic scales (Tot ACIP each had
Coefficient alphas of 0.91. The resUlts of conventioreall
exploratory faetor analyses and confirmatOey fecter analyses of
responses to the $30 for this data provide strong qappoi-t for the
eight factors which this version of the SDO is designed to measure;
Furthermore, similar analyses of the in4errel self - concerts completed
by the peers in the presene study also identify the eight factors.

Self - attributions
The results of these analyses are phesented_ elsewhere (Marsh, Note 5;
Marsh, Smith & Barnes, Note 3).
Factor score coefficients (see Nle, et al., 19751 were determined. -
as part of the oblique factor analysis of the responses t.C. the SDQ;
and were used to compute factor scores LO represent the eight SDQ
factors. The same net of factor'score coefficients was also used to
compute interred self-concpot scores for the peer responses. Teachers
responded to eight summary ratings designed to represent each of the
eight SDQ factors%and these ratings served aindicators of self-
concepts as inferred by teachers. Agreement between .student self-
concepts. self-concepts inferred by. peers, and self-concopts infrred
by teachers is significant, though modest, and is specific to
particular dimensions of self-concept. This multitrait-multimethod
analysis is described elsewhere in ,-Ireater detail iMarsti Smith
Barnes, Note 3):
Ach1:2Lement Neasur, Rea1in9 achievement was assessed with\
the
comprehenstsin and word :.nowlede sections of the Primary ReadIng
Sur-.re:: Tests 1976. The word knowled9e section consists of 0
multiple choice sYnohm Items and takes 20 minutes to admin:ster,
while the comprehehs:oh saction consists of 30 multiple-choice items
and takes 30 mtrAtes to administer. -Scores from the two sections hid
split-half reliabilittes of 3.87 and 0.92 respectively, and correlated
0.73 with ei-ch other, For purposes of this study scOres from each of
the two sect%ch were standardi:ed to have mean = 0.0 and SD = 1.0.
and then 51imme1 to form a total score. Mathematics achievement was
assessed with the Class Achiefement Test in Mathematics (CATIN 4/5)
examination whth .,'based upon an 'Australian avera9e' syllabus
iACER. 49'91. this moth tests,consists of 45 multipl-choice items
and takes about mtnotes to complete: The split-half reliabtlit: of
this score was 0.0n. re?*cher ratings of ability 1_0 readin9,
mathemat ins, it schcJp! subjects in gen9rai WPrC, also taken to be
ihdit tors of ac alem i F Arhtvemt:
Stati stical
There were JImost no is responses to either the 'f^i7. or the
SDQ (less than 1/4 of 17.) ,and the mean response was substituted for
the few missing values which_did occur. HOWOVeY. 40^ the teacher
ratings of academic abiiit/ there were 36 missing ca,. (63/43.
representing primarily students from nne class whero the teacher did
not complete the ratings, end 142 missing valaes (75%) for the
achievement tests. representing primarily students trom two ,choolu
.11

Sel:f-attributions_9
which Aid not'administer the achievement tests. For purposes of this
stady,pair-wise deletion of .missing data'was used in the determination
Of .t;he,Orrelatitina (tbe Nie; et al.a 1975). Howeverl, similar
Ctirreiationa based upon only those cases which had no missing data--__
were near the same as thote actually reported. Thus, While the large_
number of missing values for the/achievement measures dbtS require
that the results be interpreted cautiously; it is unlikely to have had
any substantial effect.
For purposes rf this study t:e six items from each of the 12 SAS
Scales were divided into three item-pairs such that the'first two
items Were assigned to the first pair, toe next two items to the next
pair, and the last two items to the third Item-pair. Factor analyses
were performed on responses to these 36 item-pairs representing the 72
Items. First; conventional/exploratory factor analyses Were performed
with the commercially available SPSS program (Nie; et al.; 1975) using
iterated communalityestimates, a Kaiser normaIizat;lion; and an oblique
rotation to the final solution. Confirmatory factor analyses (CFA)
were also condUtted with the commercially available LISREL V program
(JoreSkiig & Stirb0m, 1931). In the CFA models we hypothesized
SOlUtiOnS based upon differeht numbers of factors here the factors
-are correlated out the erroruniqueness terms fior the measured
variables are uncorrelated. The ability of the proposed models tO fit
responses to .the SAS was determined by an examination of the parameter
gS,timates, the ratio of the chi-square td .The degrees of freedom;
coefficient d (Beriter t BOhott. 1931); and the root mean square
residual which Is based upon differences between the original and
reproduced cerrelation matrices (ilorskog h Sorbomi 1931)'. A more
detailed presentation of confirmatory factor analysis and how
goodness-of-fit is evaluated beyond the scope of this paper, btit is
discussed al;;ewhere (BentlsrE. tonett, 1931; JoreGkog SorbOM; 1991;
Marsh Z Hocc:Jar; 1933; in oress; Marti-fame t Mcri.arvey; 1920; Wolfle,
1981).
PESUI.TSj
Facor Anal.,zses of Resoonses to the SAS.
ResUltS of th0 Cdriventional/exploratory factor analysis of
respOriCOS to the SAS clearly identify the seven factorshipothesized
fe-tifti the results of the Marsh et al. (1994) study. The
tOCCess/effort; success/external, failure/ability, failure/effor, and
fallure/e.44,4ernal factors are each defined by items representing both
reading and mathematics, while the reading and math factors are
Content spec-1+1c. Both the reading and math faCtOrs are defined


Self- attributions 10
primarily by success/ability items(wh-ich load posit3velyl0 and to a
,lesser extent by failure/abili -ty items (which load negatively) and
success /effort items (which load positively).
Insert Tabled About Here
The ability of plausible, alternat.ivembdelt .to fit the data was
tested with confirmatory factor analysis-(see Table 2). Though
several different indicators of;"glicidnesS=of7fit" are presented, we
eMphasize coefficient d inour discUssion. Coefficient d scales- the
observed chi - square along a scale of zero to 1.0 where zero represents
the fit of a null model while 1.0 represents' a perfect fit. The lOgit
° Of this coefficient is similar to that developed for ANOVA MOdelt
where the ratio of two variance components (e.g., eta squared) is used
to infer the proportion of variance explained by an effect; However,
the conclusions discussed below also follow from an inspection of each
of the other goodness-of-fit indicatOrs.
Insert Table 2 About Here
The one-fattor model (model 1) tests the ability of a single
retebh50 tendency (i.e.. the internal-external dimenslon proposed in
"locus of c:iltrcil" research) to describe resOonses, blit it clearly
must be rejected. The two-factor model (modWI 2) proposes separate
factors to account for responses to success and failure outcomes.
While its ability to fit the data is subStantially better than model 1
(.48 vs. .34) it also must te rejected; The three-factor model (model
3) proposes fatterS corresponding to each of the three causes
(ability; effort, and external causes). Model 3 does not even do as
Well as model 2. so it is also rejected. The six-factor tOlUtiOri
(Model 4); a combination of models2 & 3, proposeS separate factors
representing each pause separately +Or success and failure outcomes.
This model proposeS that attributions are specific to outcome and
cause, are not specific to content area. MOdel 4 represents a
substantial improvement over the firSt three models; but still does
not fit the data adequately.
MOdelt 5 - 9 each propose seven-factor solutions similar to that
depicted in Table 1, but differ in the way that the reading and the_
math -factors are defined (see Table 2). In Model 5 tht. reading and
the math factor are each defined by succeSs/ability and
success/failure items; in model 6 the success /effort- items also are
allowed to load on the content specific factors; and so forth so that
for model 9 theo_readtng factor Isrdefined by all the reading items and_
13

Self-attribetions 11
the math factor is defined by all the math items. Even the weakest of
the seven-factor solutions (model 5) represents a sebetatitial
improvement over the Six-fattor solution (.78 vs; 0e66). While the
differences between the models are statistically significant in each
Case except the difference between models 8 9 the differences are
not large. For example the differerce,In ceeffictet d's for models 5
and 9 (0.78 vs. 0.82) is less than half of the difference between
models 5 and 4 (0.78 vs. 0.66). Model 5 corresponds most closely with
our charaCterizition of the reading and math sperific factors as
ability factors. Model 6 appears to correspond most closely to the
results ref the cmnventional/exploratory model shown in Table I;
Models 7 14 8 each'represent marginal improvements, while model 9 does
no better than model 8 (i.e.; does not differ significantly from it)
and can be eliminated from further consideration.
Model 10 proposes that each of the 12 SAS scales represents a
separate factor. The ability of this model to fit the data differs
little -from the seven-factor solutions. Furthermore; the model is
ill-defined in that twb.of the correlations among the:12 factors are
greater than 1;0 and others approach 1.0; su9gesting that the model is
over-defined. We reject this model on these bases.
In the seven-factor models (models 5 9), the highest loadings
on the reading and on the math factors occur for the success/ability
and to a lesser extent the failure/ability items. Inspection of the
parameter' estimates for model 6 indicates that factor loadings for the
success/ ffort items are much smaller than for the success/ability. and
.failurei ilite items. Also,in models 7. 3 and 9, ehile loadines for
the failure/effort and success/externaI items are statistically
significant and in the expected direction, .the magnitude of the
loadings is quite small. In,model 9, the loadings for the
failure/external etems general', do not even reach statistical
significance and this accounts for why model 9 fits the data no better
than model 8. Hence, these analyses not only support the necessity of
seven factors to explain the data, but also support our
characterization of the two content-specific factors as ability
factors; Thus; we prefer to define the content specific factors with
the ability items (as in model 5), even though model 8 received
stroneersempirical support. In subsequent analyses; the reading and
math attribution scores as depicted in both models 5 and 8 will be
considerede(see Table 3).
In summary, the results of both cenventional/exploratory and

Self-attributions 12
confirmatory factor analyses support the seven attribution factors
hypothesized to underlie responses to the SAS. These results
demonstrate that attributions] dispositions' are wilte specific to
outcome and cause, and to a lesser extent to content area (at least
fOr ability attributions). Mere, as in Marsh et al. (1964); the
CM-it-et-it specificity occurs prtmarily with attributiori4 of ability.
Relationshig to 'sternal Criterig;
Se-If-concept. Correlations between the responses to the SDQ and
the SAS (see Table 3) support the predicted relationships. The three
.
academic self-conceptt, and their tottl; are substantially correlated
with succedt/Ability and success/effort scales (positively) and with
the failUre/ability scale (negatively), less substantially correlated
With the failure/effort scale (negatively), and nearly uncorrelated
with the two external scales. The four sonacadeMit telf-concepts; and
their totali are less correlated with the SAS Scares; The largest
correlations between the self-concept and self - attribution scores,
also as predicted, occur betWeen the two reading specific scores and
between the two math specific scores. These correlations are
substantially larger than the other coefficients, and clearly support -
the Content specificity of both self-concept and self-attribUtiont.
Insert Table 3 Ahout Here
In addition to the self-concepts based upon the student's own
self.-reports, self-concepts inferred from responses by teachers and by
responses -from peers were also collected. The size of the
correlatiOnS betWeen self-attributions and inferred self-concepts are
consitteritIS lower than those described abovei but the pattern of
results is very similar (see Table 3). This similarity is quite
important; because it demonstrates that the predicted pattern of
relationships between self-conceptand self-attSibUtion is not limited
to results based upcn two self-report instruments completed by the
same person. Alternative explanations for the self-concept/self-
attribution relationships which are based upon a response bias or
method/halo effettho longer seem viablewhen self-concepts are
inferred by external observers.
Achievement Scores.- The pattern of correlationS betWeen
achievement indicators and self-attributions suppOrtt the predictions
and the findingssgeneralize across results frtim both achievement tests
and teaches ratings of academic ability. Reading achievement
indicators are most highly correlated with self-attributions in
reading/ability, positively correlated with ability/success
15

Self-attributions 13
attributions, negatively correlated with ability/failure attributions,
and less substantially correlated with the effort scales. Math
achievement indicators are most highly correlated with self-.
attributions.in math/ability, positively correlated with
ability/success attributions, negatively correlated with
ability/failure attributions, and less substantially correlated with
the effort scales,
werePredictions pere not made for correlations betWeen the
achievement scores and the external attributions; Intuitively, we
suspected success /external attributions would have zero-to-low-
negative correlations with achievement (i.e., saying "Trued to causes
Such as luck, task difficult, etc. would he related CO poorer
achievement) while correlations with failurelexternal. attributions
11
would be zero-to-low-po -tive. Marsh et al. (1984) only considered
one achievement indicat r -- a reading achievement test -- which was/
not emphasized in their results. The sign of the observed
correlations in the earlier research was in the predicted direction
and the external/failure scales did have near -zero correlations with
achievement, but the success/external correlations were quite
substantial. Though less pronounced, this asymmetry in the pattern of
correlations occurs in the present investigation as well.
Failurelester:nal attributions are virtually uncorrelated with
achievement indicators. while success/external attributions are.
significantly (negatively) correlated with achievement indicators.
Nevertheless. the replication of this pattern of result suggests the
need for further investigation.
Summary & Di-scuss-ion
The purpose of this study was to replicate and expand findings
Marsh et al. (1904), and strong support was demonstrated for a
detailed set of predictions based einn the earlier research. Seven
factors were hypothesized to underlie self-attributaon responses to
the SAS.
factors.
Conventional/exploratory factor analyses identified these
Confirmatory factor analyses demonstrated that the seven-
factor sortition provided a reasonable fit to the data while other
plausible models did not. The pattern of correlations between Self-
attributions and self-concepts found previously was replicated, and a,
similar pattern was identified when self-condepts were inferred from
responses by teachers and from responses by peers. Support for the
predicted pattern of self-attribution/academic achievement
relationships,was found, and a similar pattern was observed with bbth
16

Self attributions 14
academic test scores and teacher ratings of academic ability. In
general, students who attribute their academic success to their own
ability and, to a lesser extent, their own effort tend to have better
academic skills and higher academic self-concepts. Students who
attribute their academic failures to their lack of ability and, to a
lesser extent, to their lack of effort tend to have poorer academic
-Ski-11S andTbWer academic self-concepts7 Academic self-attributions
and academic self- concepts are also specific to particular content
areas so that attributions in .erbal areas do not generalize to those'
about math outcomes.
In their review of the theoretical and empirical basis of the
self-concept/self-attribution relationship, Marsh et aI. 11934l found
a consensus of support for the hypothesis that academic self-concept
is most positively correlated to successlabiIity attributions and most
negatively correlated with failure/ability attributions. However,
there was considerable controversy about the relationship between
academic self-concept and effort attributions. Some theoretical
accounts argu that academic self-concept should be negatively
correlated witn cessieffort attributions and positively correlated
with failure:effort attributions (e.g., Nichols, 1979), other
researchers argued for e4act.1, the opposite pattern le.g.. Bar-Tal,
1973), a few argued for an asymmetry in the pattern of correlations
(e.g., Covington t: Omelich; 1979); and most did not make explicit
predict:on- Marsh et al. 1984) predicted; that academic self-
concept would be substantially correlated (positively) with
success/effort attributions and less substantially correlated
(negatively) with failure /effort attributions, and demonstrated
empirical support for the prediction. This asymmetry-was demonstrated
again here. For example. total academic self-concept (Tbt ACD in
Table 3) correlates 0.52, 0.47' and -0.45 with success/ability;
success /effort, and failure/ability, but only -0;30 with
failureleffort (which is significantly smaller than each of the other
correlations; p < .001). The same pattern of results is observed in
. self-concepts inferred by peersi but not in self- concepts inferred b/
teachers. We suspect that when teachers are asked to tnfer academic
self-concepts, their ratings are more strongly influenced by
objectively defined academic ability than. are the students4 acteal
sell_e_concepts, and this may explain why the pattern of results differs
somewhat for them.
Marsh et; p.1. (1994) did not emphasize the slf-
attribution/academic achievement relationship. However. based upon

-Self-attributions15
that study we predicted that ability attributions would be. more highly
Correlated with ability than with effort attributions and we
intentionally avoided making predictions abbut external attributions).
The* predictions were supported, though it £6 interesting to note that
:failure/ability attribUtiOnS are more substantially correlated
(negatiVely mult R = 0.41) than success/ability attributions
(positively - - -=-1) . 3217 though-nu asymmetry eras found Syr
correlations with the effort attributions which were smaller (MUlt R's
= 0.19 & 0:n). Apparently, attributions of effort are related more
strongly to academic Self-concept (partitularly when the outcome is a
success) than to academic achievement. ThiS pattern is intuitively
logical; is similar to findings from MarSh, et al; (1984)i and also
is consistent with the, speculations Offered by Covington & Omelich
(1979). The findings alSo may explain why the self-attribution/self-
concept relatiOnShip is mr-e like the self-attribution/academic
AthieVeMeht relationship when self-concepts are inferred from teacher_
ratings;
Results described here and in Marsh, et al, (1984) argue that
attributions are quite specific to outcome and the type of cause, and
to a lesser e'tent the area of academic content. The content
specificity of the attributions is quite clear for abili-ty
attributibeitr, bUt not for attributions to effort and external causes.
Our interpretation of these results is that stUdents see their ability
in verbal and mathematical areas as reasonably distinct, while they
perceive that the amount of effort which they put into different
subject areas as more similar. Weiner (in press) makes a similar
point based upon 'findings by Foersterling & Engelken (1981) and his
further research. He suggests that ability in physics provides no
information about ability in German, but that trying hard in physics
is predictive of trying hard in German; The content specificity of
the AttribUtibna will also depend upon the similarity of the two
content areas, and may not be so apparent for similar subjects (e.g.,
physics and mathematics).
Our emphasis here, and in Marsh et al. (1984) has been on ability
and effort attributions, and not on attributions to external causes;
The decision to combine a myriad of external causes into a single
scale was partially pragmatic in an attempt to keep the length of the
SAS reasonable; but was also based upon results from the Fennema study
and particularly the Relish study discussed earlier. -However, several
anomalieS make-us uncomfortable with this decision. First, the
18

Self- attributions ib
internal consistency of responses to failure/external items (0.70) is
Substantially 1-er than for the success/external scale (0.83) or any
Of the other Stales (GAO to 0.86). Secondly, our intuition and other
theoretical accounts suggest that the tendency to externalize
attibutions should be negatively correlated for success and 40r
failure outcomes, but the observed correlations, are statistically
Third, attributing success toexternal
causes is substantially correlated Oith Academic achieveMent
significant and Rogitive.,7
(negatively), while attribUting failure to external causes is nearly
uncorrelated with achievemeht. Only for.the self.-concept/self-.,.
attribution relationship did the two scales perform similarly in thi-A
each was nearly uncorrelated with academic self-concept. EVeii here,
however, we expected the correlations to have the opposite sign (for
the same reason teat we expected the scales to be negatively
correlated), but they did not.
We have no explanation fOr the anomalies which occur with the two
external scal6S, bUt the consistency of their occurrence across the
two studitt argues that they require further research. Several
Observations may provide some clues. .Success/ability and
Success/effort scales are substantially correlated with each othee.;
but nearly uncorrelated with success/external. Failure/ability and
failure/effort scales are substaht?ally correlated With each other and
postively correlated with the failureieternal scale_ This means that
children who are unwillihg to attribUte failure to a lack of ability
and effort are altb unwilling to attribute it to external causes.
This paradoxical finding may,be related to
finding that students with high self-concepts judged all causes of
_failure to be unlikely. The self-serving bias where self-
attributions for success are more 'internal' than ft* attributions to
failure (see Marsh, et al., 1934) may pla.);, a roll?. Finally, it would
be important to determine if the anomalies are consistent across
different types of external causes luck, task difficulty,
health, environmental influences; other people -- teachers, parents.
etc.);
WO haVe iptentionaliy not attempted to makecausal inferences
about the relationships among self-attribut'ons,- self-tonceptt, and
academic abilities for a variety of reasons. First, the nature of
this study and state the of attribution research db not Warrant this
level of theorizing. Instead, our emphasis has been on the
the Ickes E. Layden (1973)
development of reliable and valid measurement procedures, and on the
validation of the Self-attri bution construct. Without this level of

!;
Self-attributions 17
basiC understanding of the self - attribution process, further research
is likely to be unproductive. Second, the cross-sectional and
correlational design of this study make it unlikely that alternative
causal models -- or even causal predominance -- could be validly
tested. Finally, we feel that the variables in question are
interwoven in a network of 'rec'iprocal relationships such that a
change in academic self-concept,,6 academic academic
attributions is likely to "CAUSE.* a change in th- others. If this is
the case, the search for which variables cause hat is likely to be
counter-OrbdUttiVe; even if longitudinal and experimental data were
available and appropriate statistical techniques were developed.
Instead; we see the three sets of variables as forming a dynamic
equilibrium such that if any one is changed or inconsistent with the
others, there must be a change in the balance among them in order to
reestablish the equilibrium.
20

Self-attributions 18
Reference NotesFenneima. E., Wolleat, &,Pedro, J. D. -Mathematicsattribution scale. Journal Supplemental Abstract Service,/Washington,' D. C.: APR (MS.:1837), 1979
'2 Relich, J. Attribution and its relation lo other_affective_variables in predicting and inducing'_arithmetic_achlevement:An attributionaI approach to_increased,_selfefficacy,:andachievement in_Atithmetfc.__Dept._of_EdUcation, The,Uhiveeity of Sydney, Australia, 1982.
,
3 - Marsh;,_. H. Smithi I. D., & Barnes, 3. Dimensions of self-.conr-ntl Agreement between ratings by self., by peers, and byter fin preparation)..
4 - Marsh. H. W., & Shavelson, R. J.Self-toncept: Measurement andinterpretation Of its structure (A paper submitted for _
publication.) Department of Education, University of Sydney; 1983.
5 - Marsh, H. W. The bias of negatively worded items in_rating scalesfor young children. Department of Education; University ofSydney, 1983;
REFERENCES'
Australian Council for- Educational Research (ACER). ACER PrimaryReading Survey Tests. Hawthorni, Australia: ACER, 1976.
Australian_ Council for Edacationat/Resea:rch (ACER).' Class AchievementTest in Mathematics 1-CATIM'415+. Hawthorn, Australia: ACER, 1979.
Bar-Tal, D. Attributional analysis of achievement-related behaVibr;Review of Eduoational Research,. 1978, 481 259-271.
Bentler. P. M. & Bonett, D. -G; Significance-tests and goodness -offit in the analysis of- :covariance structures. PsychoinsicaiBulletin. 1980,-881 588-606. .
_ _ . _ _
Campbell,-D.-T;,& Fitko;_lior: _W. Convergent_and_discriminant_valfdationby multitrait-multimethod matrix. Psychological Bulietrni 1959. -56,.. 81-105;
Covington; Effort: The.double-edged sword inschool_achleveoent. Journal of Educational Psychology, 1979,71,1: 169-182. /
Foersterling. F., & Enoelken, R. Expectancies in relation to- successand failure:; causal attributions, and perceived task similarity.Personality and Social Psychological Bulletin,. 1981, 7; 578-582.
Hull, C. H.,. & Nie, N. H. ,SPSS,UUdate 7z9. New Yorkl'1981.
Ickes, W.. 3., & Layderi,_ M. -.A; AttribUtiOnal styles.. In J. -H.- Harvey;W. 3. Ickes,,& R; F._ Kidd ( eds),__New,,d1rections_in attributionresearch (Vol. 2); Hillsdale, N.36: E-rlbaum Press, 1978.
lot-esubg;_te.. G._&_Sorbom,_D. LISPEL V: Analysis of Lfnear2tructural.Relatioos_Bylhe Method of Maximum Lfketihood,Chicago: International Educational Services. 1981.
Marsh,_ H. W., Barnes, J., Cairns, L., & Tidman, M. The SelfDescription Questionnaire ( ,SDQ): Age effects in the structurelevel of self-concept for-'preadolescent children. Journal ofEducational Psygholosy. in press. -.
Marsh,. H. W., Cairns, Barnes,- 3., --& Debus, R. -
The relationship between dimensions -of self-attribUtiOn anddimensions of self-concept. -Journal of EducationalPsychology,. 1984, (in pe,ott);
Marsh,-H.-W;,-& Heittbae- D;. tonfitMatory_factor_analysis_of.
multitrait-multimet'hod matrices. Journal of EducationalMeasurement; 1983._ (in press).
Marsh,_H.__W._L_Hocevar, D. The factorial invariance of students'evaluations of college teaching. American Educ- ational ResearchJournal (in press). -
ft.
and

Self-attribUtions 19
Marsh; H; &_Smith, I. D. Preadolescent self.,-concept: Its relation to- self-concept as inferred by teachers andtd-ACademic_ability. British Journal of EAgcati-n-nal PsIghology.I983 221 60-78.
Marsh_Hi_W., Relict); J. D. & Smith,: I. D. Self-concept: Theconstruct validity of interpretations.based upon_the_SDO; Journal4± Personality and Social Psychntggy,.1983, ani 173-187..
Marsh, H. W.4 ti Smith, I. D. Multitraitmultimethodranalyses_of twoself-concept instruments. JournAl of Educational Psychology1982, 74, 430-440.
Marsh, H. W., SMith;_r;_LL & Barnes, 3 - Multitralt- multi-methodanalyses bf the,,Self Deszription_QuestionnaAre:_ Student7teacheragreement-on multidimensional ratings of student self-concept.AMOriCan EdUgetional Research Iournal-I 1983, 20; 333-357.'
Marshi_H._W.,_Smith._I._D., Butler; S. & Barnes, J. Self-concept:Reliabilityi dimensionality, validity, and the measurement ofchange. Journal of Edugational Psychology." 1983, in press.
Maruyama, G. & McGarvey, B. Evaluating causal models; Anapplication of maximum likelihood analysis -of- structuralequations. Psyghologigal 1980, 87; 502-512;
Nicholls, J. Development of perceptidkof own attainment_and causalattributions-for success'. and faliur% in reading. Journal ofEducational Psyghology,. 1979; 71j,P4-99.
Ni6;-N.-H.i_HU11;_C; Jenkins,_J._G._Steinbrenner, K. & Bent.D;_H; 'Statistical Package for the Social Sctences-i- New York:McGt-aw-Hill; 1975;
Rbsenbergi_M; Society and the adolescent chi-id Princeton: PrincetonUniversity Press, 1965.
Rotter; J. B. Generalized expectancies for internal-verSUS-external control of reinforcement. Psychological Monographsj1966, SO (Whole No. :609).
Shavelson; R. J. te Bolus, R. Self-concept: The interplaytheory and methods. Journal of Educational Psycholoq,6 1982,74, 3-17.
Shavelson, P. J., Hubner, J. J.__& Stanton, _GC.__Validation ofconstruct-interpretations. Review of Educational Research, 1976,46,-1, 407-441;
Weiner; B; _Theories_of motivation: From mechanism to cognition.Chicago: Rand McNally; 1972.
Weineri_B-1Ed.) Aghievement motfvetfon and attribution thebe'i.Morristown, N. J.: General Learning Press, 1974.
Weiner._13._A_theory of motivation for some clasarbom _experiences. Journal of Educational Psychdloax, 1979; 73-25.
Weiner, B. Human motivation. New York: Holt; Rinehart &Winston, 1980.
Weiner; B;- SOme-methodolOgicalpitfalls_in_attributional research.Journal of EdUcationaI Psysholggyi. in press.
Wialfle; L. M. Causal_ models with unmeasured variables: Anintroduction to_LISREL. Paper presented at the Annual- Meeting -ofthe American Educational Research Association, Las Angeles, 1981.
o

T I 1.14.1
TABLE
Summary of Conventional/exploratory_FactorAnalysip of Responses to the SD8 Io
Variables
RSAP1RSAP2RSAF3
Oblique
ReadAbil
6773SO
Factor Pattern. Matrix
Math Succ Succ Fail1Fail FailAbil Efft Extr Abil Efft Extr-
10 1? -06 -06 04 .-0108 13 -12 -05 03 .:.,;03
19 -02 02 -06 -01 '01
RSEP1 . ..!t) -03 62 -15- 05 -08 03RSEP2 35 16 49 00 13 -10 -01RSEP3 11 06 61 09 09 03 -07
RSXP1 -14 05 -18 53 14 -07 04RSXP2 -11 09 -04 69 -02 08 10RSXP3 -10' 02 02 69 08 04 01
MSAPI 08 73 03 -09 01 01 03MSAP2 10 78 OS -14 -01 _08 01
MSAP3 20 74 04 04 05 -04 II
MSEPI -03 39 25 04 -20 03 -02MSEP2 01 20 47 04 -10 02 06MSEP3 10 49 30 06 -07 01 10
MSXPI 0? -16 07 53 01 04 07MSXP2 05 -02 -03, 72 -04 00 02MSXP3 00 -05 04 64 -02 05 10
RFAP1 -35 13 01 04 53 17 -04RFAP2 -35 18 -05 00 55 15 -04RFAP3 -36 12 13 04 46 33 -08
RFEPI -05 04 -04 -03 15 53 -02RFEP2 -05 15 -18 02 14 54 09RFEP3 -26 08 04 15 12 .57 -03
RFXPI -08 03 15 -01 12 -00 49PFXR2 03 02 7_13 14 10 -07 55RFXP3 03 07 -16 07 -16 -02 62
MFAP1 08 --32 -05 65 55 10 10MFAP2 10 -30 05 10 57 09 04MFAP3 13 -33 -06 13 45 17 01
MFEPI 13 10 -35 OS 40 30 03MFEP2 06 -01 -02 03 -05 68 01MFEP3 06 -25 14 12 12 52 03
MFXP1 04 -OS 12 -10 25 24 29MFXP2 08 02 -09 17 04 -15 64MFXP3 -03 -04 1? -03 -10 17 52
_ Factdr Pattern Correlation%Read Math Site Succ Fail Fa41 FailAbil Abil Efft Extr Abil Efft E).tr
Read Abil 100Math Abil 10 100Succ Efft .29 25 100Succ Extr -12. -08 -07 100-Fail Abil -18 -18 -07 14' 100
Efft -15 -02 00 t1 47 100Fail Extr 06 06 02 08 11 100
Note: MeASUred variables are the_three_ltem_;00irs_1P4i PZ__&433 which_tepretent'eath 04 tho_I2_SAS scales; The sca;.es are_des19nateci with
Mb thtee letters- representing content (R=readin9 urM=Math); outComeAS=success or F=failure)i and cause (A=ability.E=Offort; X=external).
23

Self-attributions 21
TABLE 2SOMMat.ieS-of Goodness of Fit Indtces for the CFA Models
DeStribin9 ResponSes to the SAS
Model Description chi df chi'Sql RATS C.oeffsquare df ratit. d
0'1 Null Model - 3,798 030 13.96- .222 ......._
1) One "General" factor 5,814 594 9.79 ;136 .339
2) Success (S)-& Failure (F)factors
4,563 593 7.69 I 1-0 .481
3) Ability (A), Effort XE);and External (X) fattors
4,828 591 t .17 .123 .451
4) SA,_SE, S:-;; VA; FE; FX 2;958 5.9 5.11 .089 .664Factors )
.--\
5) SE, SX;_FA, FE, FX Factors 1;955 56', 3.45 .077 .773.p1us_Readin9 & Math factorsdefined by SA-& FA items
i,
6) As in model 5 with Reading i ,,:y 561 3.08 . .067 .804& Math factors defined b/SA, FA & SE items
7) As Model 5 with Peadin9 1v631 555 2-94 .064 ;81.5
Math factors defined b/ SA,SE,-FA & FE items
3) AS MOdel 5 (with-Pead1ri9 &_ 1,562 549 7.85 ;.O61Math-factors defined b/ SA;SE; s::, FA t FE items
9) As_Model_5 'with_Reading 1,554 543 .327Math factors defined_ty SA,SE. SX, FA; FE
1r PSA, PSE, MSA; MSE; 1.135 578 2.131 .061 .871'PFA, PFE, MFA.
.LIFE &MFY factor
Note: Model 10 was'ill-definei in that twoof the conrelatiops amon thefactors exceeded 10.
24

. 4 TABLE 3 .
Correlations Between SAS Scales and Criterion Scores
t
aSAS Scale Scar s
N.
Read Math Read Math Succ Su c Succ Fail Pail FailCritei-ion Abil Abil Abl' Abl'Abil Ef t Extr Abil Efft ExtrVariables ----, ---- ---- ---- ---- ---- ----tudent
SeIi-goncepts'Phys Appr /16 20 20 21 21 23 -04 -15 -/4 -01Phys Abil 08 15 10 18 13 16 -0' -10 -09 -n4PiiierS- 17 45 15 115 17 23 -01 -15 -06 -0'Parents_ 05 a: 09 II 06 19 -04 -09- -06 -10ME NACD 17 20 25 21 32 -05 -13 -13 -03
Reading 62 13 57 19 37 23 -19 -38 -28 -04Math 09 59 13 52 3Q 4 -06 -30 -15 -06Schaal_ 24 41 29 40 38 -10 -78 -21 -i3Tot ACD 44 52 45 51 52 e 47 -16' -45 -30 -11
,
General 35 42 36 11 43 41 -13 -35 -20 -02
Self:c2nceptsInferred bvPeersPhys Appr -10 -06 -06 -04 -08 04 00 08 05 -07Phis Abil 01 00 02 03 -02 03 -05 -03 00 -0'Peers -01 00 00 02 -04 03 -03 -03 00 02Parent 01 01 05 03 02 15 01 -01 -03 -04Tot NACe -03 02 01 01 -04 09 -02 01 01 '-05
Reading 28 161 27 18 19 11 -IA -23 -13 -05Math_ 14 --,
-.- 13 27 27 22 -0' -19 00 -02School 13 2' 14 22 21 20 -10 ,--15 -03 -05Tot ACD 21 27 21 ,26 '26 22 -14 -22 -07 -05
General 03 00 CS ^2 -02 07 -07 -05 01 -04
SeIf_canceptsInferred byTeachersPhys Appr 03 11 11 12 :2 -12Phis Abil 03 19 10 20 15 12 -16Peers- 02 02 ,:,7 10 '7'i 01 -17Parent__ 08 06 13 05 01 05 -11Tot MACD 11 15 16 :o 6.-29 -12
-15-17-07
-15-Cl
--ml
Reading ,.. 24 ,6 ,_ 23 12 -26 -32 -20__
Math._ 24 38 -7--. 78 26 18 -26 -74 -lo -06
tchoolTot ACD
20 32 1110 31 74
73. -...)
-7-,-,-.
16 -26 -11 -13 -0417 -23 -76 -21 70
General 4 12 21 24 26 16 -:;'1 -72 -i-. -07
Achrievemen-1Test ScoresReading 41 25Math 20 37 20
r4,
TeacherAtiltRatingsPeadingMathSchool
,2
79
^2,2, 2 0,1 -25 -3822 00 -24
-21 0-12 06
24 '116 2n 11 -29 _1-33 25 5' 2'! 1.m . -22 -1174 72 --4 1774 -2? -7A -16
Multiple P'sBased on.i-ireActrievftmentIndIcatorsMalt R 44 12 41 11 ---, 1° .32 11 22 12
a - Two variations of the readirrl and-math scales-for-the SAS_erconsidered, where-Read Abil RSA - REA, Math Abil MSA - MFAi__.Read Abl" --,- RSA + RSE - P.S: RFA_- RFE, and math Abl*'_, MS6 + MSEMSX - MFA MFE. These correspond most closely to_factors_defloed inmodelli 5 and -9 -in Table-2, though scares corresponding to the utl;ermodels resulted ,in similar correlations;
NOTE: Coefficients are - presented without decimal points.Correlations with an absolute value greater than .12are statistically significant (p < .01, two-tailed).
25,

Grade/
NemoGirl Year
School Teacher
-S-YDNET-ATTRISUTTON-SOALE
This-le not_a_test, _There_are no right or wrong answerS. There Are a number Of things listed that xouldhappen in school or at home - you are asked to show how true orfalse each reason for this happening is
for you.
LoOk at the first-example. Someone called Terry has filled this ones,.
Sornetim.iiTrue
Neatly SometimesFaT" True True
MostlyFalse
I. Suppose-you won-a reee-st-the Sports Carnival.It would probably be beesuse
a ypu were Jac lucky
b you are a good runner e
..
. ,
c you tricd'hard to run fast I I
(TirrY Put a tick in the FsiTsm_box for the first reason- because -for Terry that reason-was-not_true_at all. _
Terry put a-tick-In the-True_box_for the second reason because Terry is a very good runner and always sins 4,
races. Terry put a tick-liEthe Naetly True box for the last reason because Terry did try pretty, hardto rue
fast and it was mostly true).
Now let's look et the second example. Someone named Chyle has I:lied this one in,
2. Suppose that you painted-a-picture st-school_lind_evertooe_said it was terible. it would probably
be because
. a you are bed painter
b you only tried' little
c they did not like you
I
Pt(Mr** has ticked Sow.C.---vr-Tiruem Sometimes False for the first-reason because-Ch-tis_ie only_i_bad_iiatatst
.sometimes,--Chris _bas_ticked_Mostl True for the second reason because Chris tried only a little -on- most- of --
the painting. -Chris ticked-Soatly'True on-thh-last-reasonisecause_it 1,_mossly_trumchit orortone in the Dines
does not like Chris and would have said the painting was terrible for ttl.t reaaon).
!Owner TRY THESE EXAMPLES
7. Suppose that-you made-a model sod it fell to piecesas soon as you finished it. It would probably be because
you are good at making models
b you did-not work carefully on it
c the glue was bid
I == = =I I. =c
A, Supy....se that you wrote a story that the teacher saidwas-very good. It would probably be because
a you write good tortest L---J
b you tried very hard L ----1
e the teacher ltkes you t F7779 777-1
DO NOT TALK TO ANYONE ABOUTJOUR ARSwERS OR LOOK AT ANYONE ELSE's rarrir7
0 Copyright 1982L Cairns and H. W. Marsh
UniattaitY of Sydney


1.
SometimesTrue
Mostly Sometimes dfosilyFalse false False True True
Suppose your_teachar ohose you to he in th_top reading groupin your class. It would probably be because
a you are, good at reading
71h you work hard at reading
b
c the teacher made mistake
112. Suppose_you have_to swap_books with someone_to _correct_ some
maths exercises-and-no one wants to give you their book.This is probably because
a nobody likes you very much
b you are careless in your work and with corrections L r
c everyone knows you do maths badly = =3' Lttr: =rrtnt;:rdtgtri!:gn!* rilrp:1141:;::s.r."1*.n
the story was too hard for everyone nnnEk you are poor read.-
LI D I n s
b
c you should have road it mote carefully Ej I I
. Suppose_the teecher wanted_you to -help correct somemath, tests. This is probably because
you are one of the best students in maths
h it was your turn to do it
c you always try to do well at Maths
S. Supocso the school librarian Wants someone to help count'books and you are chosen. This is probably because;
merre,:r sitting!Lnear the teacher when the librarian. ;
b you always work hard and carefully in maths
g you are one of the best pupils in your maths class . . . .
6. Suppose the teacher asked you to read aloud part of storyfor_the class and you had trouble doing this. It Li probablybecause
you are bed at reading aloud .
you had to read the hardest part of the etofy
c you were careless about reeding the story
7. SUypome_you get_a maths question wrong in elites. It isprobably because,
yo4 often have trouble in maths,.
15 the question was hard
= LT!
r"---
I,C--"!
s you never pay attention in *ache lessons
I. Suppose you are chosen from your school to take part instate meths competition. This is probably because
you will try your best , I
b you wore lucky
you are 5001 at Maths
___i b
16.---.... .-,..
! C
4=.----1
71L_1.........4 L__!: i___J LI b7-7 77 I e
LJ
tu.

9. Suppose you start a new Awry in reading end _you lind it hardto understand straight away. it is probably because
a the teacher picks hard stories -.
4b you were day dreaming
S000ttmewTrue
Mostly Sometime.. SwabsFalse False False Trur True
c your reading is poor
10. SUPPORe_yOur_perenta tell-you that your reading is good.It would probably be because
a you really work herd at reading
b you always do well at reading
'c they are only being nice
11. SuPpoam the Olass.was //eked to_choole* the_beet five people inmaths. If they chose you it would be because
a you really are one of the best at maths
b you work hard to be good at maths
E they like you
12. SuppOse you get a maths problem tO do on the_boerd_in front ofthe class and you do it wrong. This is probably because
a you are unlucky to be asked the hardest problem
b you always have trouble solving problems
you did it too quickly and made a silly mr.take
13. Tilptor;_altit,r,b11/1;t: says you are doing badly in res no work.
p.
Li
I__ r
you are lacy in reading
b the teacher doesn't like you
c you alv.ys do badly in reading
14. Suppose you ere chOsento read out story to all the parentsat special assembly. It would probably be because
no one else wonted to do it
b you are good reader
c you have been working hard on your roading all year. , . .
i
lb.work and you t;:"T" d:dould7;!gb:teltc fe:rb::1:Yee. "'ding
you earned it by working hard-;
g you were lucky
c your reading is good. . . . . . . . . . . . . .
16. lumos the tasochar sham you. nmoveyof doing mrsirttUrg in !lotto andyou get it wrong. This is probably because
a you should pay more attention
b the teacher explains things badly
c anything in maths is hard for you
2
b
L----1

17. Suppose that the toactstrAgaked-pscole in your class to try out to reada pwm on TV ohm, but did ?CT ask you. It would Ambay he bacausx
b
your reading is not good enough
you_decided to play instead of trying to get thepoem ready . . . . . . . . . . . . ..........
c the teacher forgot to ask you
18. fltip=i7oggyabrg:=1 in front of your class.
a you Cr. good at reading
False
flb the story we. an eery one e F---7
c you made special effort to read it
19. Suppose the_teacher tells you not to help a friend with theirmath.. This would probably be because
a you should work harder on your own maths
b you make A lot of mistakes in maths yourself
Suretire*'True
Soreflre*false
Lifl1 ;
gustlyTrue True
; = a
b
Lii Li L_J 1
Li Li Libr--,
Ti1 1-1 77 1 I
c it is unfair
20. Suppuse-the-tsacher-asks'-youto-collect and_count_tbe moneyfor an excursion trip. It would probably be because
a it is your turn to collect money this time
b you always try hard in maths cl
1
Syouueare good at maths and F---1
21. Suppose you did really well on a reading test. It isprobably becaute_
you were lucky
b you tried very hard
c you always d6 well in reading tests
22. Suspect you find it hard to understand story you arereading. It is probably because
n you need to try harder at reading
b you are a poor reader
c Cho story is boring
23. Suppose you did badly in math. test. This is probablybecause
a you always do badly in math, tests
b you spend too little time studying maths
c the test was hard for everyone
24. Suppose the-teacher chooses-you to_do_a lopecial'problemin math.. It would probably be becalm'
a you know more maths than most children
b you would work harder on it than your clan mate.
c nobody else wanted to do it
29
L
TiLii
Ti b
flThlLiIc
Li ii 1'= 6
ELi jc
LiLi
rmb
n 1 a
Ti
Ti Ti

Name
1,
SELF DESCRIPTION QUESTIONNAIRE
Boy _ Girl Grade/Year
Age -School Teacher
This is a chance to look at yourself. It is not a tent There are no right answers and everyone-will havedifferent answers. Be sure -thatyour answers thraw_how you hel abdirt yourself_ PLEASE DO NOT TALKABOUT YOUR ANSWERS WITH ANY0f. ELSE We will keep your answers private end not show themto anyone.
. _
When you are ready to begin, please read each sentence and decide your answer. (You may reed quietly toyourself as I read aloud.) Them are five possible answers for each question - - 'True", "Fals4", JIMthree answers in between. There are five boxes next to each sentence, one for each of the answers. Theanswers are written at the top of the boxes. Choose your answer to a sentence and put a ti& (,) in thebox under the answer you choose. DO NOT say your answer out loud or talk about it with anyone else.
Before you start there are three examples below. Somebody named Bob has already answered two of thesesentences to show you how to do it. In the third one you must choose your own answer and put in yourown tick ( ). - _ .
SOME.TIMES
MOSTLY FALSE; -MOSTLYFALSE FACE SOME TRUE 'TRUE
TIMESTRUE
_.EXAMPLES
1. I like to read comic books. 1 EEI_
_ (Bob put a tick in the box under the answer "TRUE". This means that he.really reed comrc*books-It Bob did not like to read comic books very much, he would have answered "FALSE" or"MOSTLY FALSE".)
2. In general, I am neat and fidy 2 11 E3 =I 2(Bob answered "SOMETIMES FALSE. SOMETIMES TRUE" betause he Is not wry neat; but he isnot very messy either:)
3. I like to watch T.V.
(For this sentence you have th charts the answer that's best for you-First yoUrnustclecide if thesentence a "TRUE" or "FALSE" or somewhere in between. If you really like to watch T.V. a lotyou would answer 'TRUE" by putting a tick in the last box. If you hate watching T.V. you wouldanswer "FALSE" by putting a tick in the first box. If your answer is somewhere in between then youwould choose one of the other three boxes.)
If you want tO Change ad answer you have marked you should_cross out_the_tick_and Put a_new tick inmother box on the same line. For all the sentences be sure that your tick is on the same line as the sentenceyou are answerin_g. You should have one answer and only one answer for each sentence. Do not leave outany of the sentences.
If-you have any questions put up your hand. Turn over the page and begin. Once you have started; PLEASEDO NOT TALK.
© H. W. Muth and I. CO. Smith.The University of Sydney
;1981
3O

1: I am good looking ..-____--_------
2. I'm good at all SCHOOL SUBJECTS --.--.
3:
ihmtveFALSE FALSE
SOME.Times'MAE. MOSTLYSOW, TRUE TRUETRUETRUERT
1=11=1 =1 1
3 B LD ®=1 =I 34.. I get good marks in READING ...---.-.. 4 =1 =I Ej ED r.=] 45: My parents understand me ....-------
6. I hate MATHEMATICS .--..-.-......-
7. I have lots of friends
8. I like the way I look .
9: I enjoy doing work in all SCHOOL SUBJECTS
10. I like to run and play hard .......... ..--.-..
7
I= =I 5
E=1 ED CI Q6
=I C=I E3 7
E:71 =I C] =I 39 ED :=1
r-=;1 =laI like READING ..... 11 ED C3 =I Bil
10
12. My.parents are usually unhappy or disappointed --
I= =I =I =113.'4:=1 E7.1 E:3 =14
1:=1 1=1 =119
13: Work in MATHEMATICS is easy for me
J14. I make friends easily
15: I have a pleasant looking face
16. I get good markst all SCHOOL SUBJECTS 16=1 B =11 ED =116
17=18B E.] ED 1:::=1i8
=1.19
17: I hate sports and games ............... .....-.- ......
18. I'm good at READING
19: I like my parents
20. I look forward to MATHEMATICS
21: MOO kids have more friends than I do
22. I am a nice looking person
23: I hate all SCHOOL SUBJECTS
e24. I enjoy sports and games
25. I am interested in READING
My parents like me
3.
17'
20= CD CD Cl =2021= =I =1 =1 =212iED BBQQ22.23B I= Q E_1 23
41=E1 I= I==1 =I I= 112525
21=3 = Q26
EWESEWES
minx peorttYYule FALSE SOM. TAUE TRUE
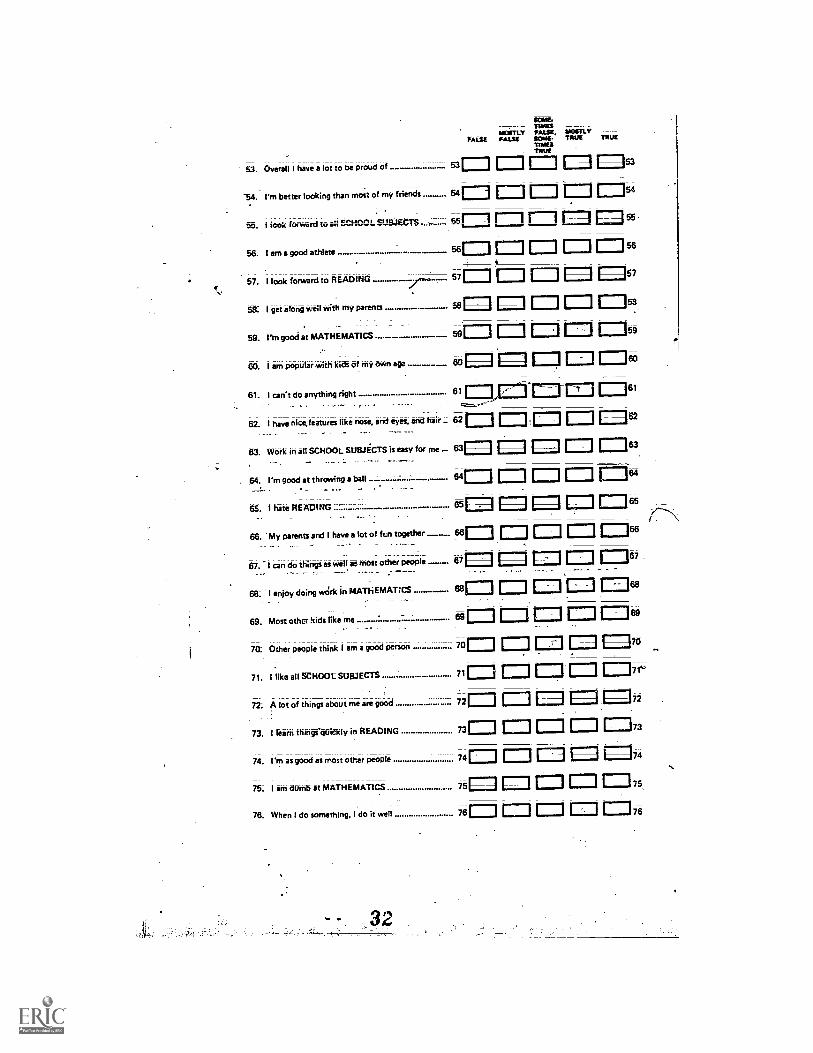
53. OverallOverall have a lot to be Proud of 53= I-1 ED34. I'm better looking than most of my friends ---- 54 =j =194
55. I took forward to all SCHOOL SUBJECTS 56r r1 =1 55
56. I am a good athlete --.- .... .--....-.--. = 56
57. I look forward to READING /"- 57=1 ED ED E =157
58: I get along well with my parents .---.-- 58j j ED =58
59. I'M good at MATHEMATICS 59= QED 1=1 =159
60. I am popular with kids of my own a
81. I can't do anything right -....-..-..---. 61 E.36
62. I have nice,features like nose, and eye*, and 62 = == =6263. Work in all SCHOOL SUBJECTS is easy for me 63 ®® M =16364. I'm good at throwing a ball 54= =1 EJ =65. I hate BEADING ...-.-------.-----.--- 65
66. -My parents and I have a lot of ft.n together 68 ED = = =66=1 =I E=I65
67.- I can do things as well as most other people . =I ED"68. I enjoy doing wank in MATHEMATICS ----- 68E3 EEI =E6
69. Most other Rids like me_
.. 69
70. Other people think I am a good person ----- 70=1 E:1
71. L like all SCHOOL SUBJECTS
72. A lot of things about me are good
73. I team thingi'quiCkly in READING
74. I'm as good as most othair people
75. I am dUmb at MATHEMATICS 75
76. When I do something, I do it well
71 r---11=3 cat-i2= ED =I I= =72
1:= =7374E3 C3 =7174
No %. 32
i6=c= C:3 = =75
= =76
eT