Embed Size (px)
Citation preview
PT423 A national strategy to reduce cadmium in potatoes
M McLaughlin CSIRO Land and Water

PT423 This report is republished by the Horticultural Research and Development Corporation to pass on information concerning horticultural research and development undertaken for the potato industry.
The research contained in this report was funded by the Horticultural Research and Development Corporation with the financial support of the potato industry.
All expressions of opinion are not to be regarded as expressing the opinion of the Horticultural Research and Development Corporation or any authority of the Australian Government.
The Corporation and the Australian Government accept no responsibility for any of the opinions or the accuracy of the information contained in this report and readers should rely upon their own enquiries in making decisions concerning their own interests.
Cover price: $22.00 (GST Inclusive) ISBN 0 7341 0112 0
Published and distributed by: Horticultural Research & Development Corporation Level 6 7 Merriwa Street Gordon NSW 2072 Telephone: (02)9418 2200 Fax: (02) 9418 1352 E-Mail: [email protected]
© Copyright 2000
HRD\C
HORTICULTURAL RESEARCH & DEVELOPMENT CORPORATION
Partnership in horticulture

C S I R O
D SOLTH AUSTRALIAN
RESEARCH AND DEVELOPMENT UNIVERSITY OF
ADELAIDE
A national strategy to reduce cadmium in potatoes
Dr M ,J. McLaughlin CSIRO Land and Water / CRC for Soil & Land Management, Glen Osmond, South Australia, 5064
FINAL REPORT
HORTICULTURAL RESEARCH AND DEVELOPMENT CORPORATION PROJECT PT423, January 1999
CSIRO LAND and WATER

HRDC Project PT423
Dr M. J. McLaughlin CSIRO Land and Water PMB 2, Glen Osmond
SA 5064
Tel: 08 8303 8433 Fax: 08 8303 8565
Any recommendations contained in this report do not necessarily represent current HRDC policy. No person should act on the basis of the contents of this report, whether as to matters of fact or opinion or other content, without first obtaining specific, independent, professional advice in respect of matters set out in this publication.
l

INDEX
CHAPTER PAGE NOS.
TITLE
1 4-7 INDUSTRY SUMMARY
2 8-10 TECHNICAL SUMMARY
3 11 CONCLUSIONS/RECOMMENDATIONS
4 12 DIRECTIONS FOR FUTURE RESEARCH
5 13-15 GRANT DETAILS 1994-1998
6 16-18 DETAILS OF PROJECT
7 19 CSIRO PERSONNEL AND COLLABORATORS INVOLVED IN PROJECT
8 20-22 SCIENTIFIC OUTCOMES
9 23-25 TECHNOLOGY TRANSFER/INDUSTRIAL LIAISON
10 26-141 TECHNICAL PAPERS Introductory technical information, research methodology, results and discussion of the data in relation to the objectives are presented in a series of papers which are listed as Appendices below.
APPENDIX 1 26-42 Prediction of cadmium concentrations in potato tubers (Solatium tuberosum L.) by pre-plant soil and irrigation water analyses (from Aust. J. Soil Res. 37,191-208)
APPENDIX 2 43-76 Uptake and partitioning of cadmium and macro- and micro-nutrients in potato (Solatium tuberosum L.)
APPENDIX 3 77-85 Effect of sulfate on cadmium uptake by plants in solution culture (from Plant and Soil 202,211-216)
APPENDIX 4 86-95 Effect of sulfate on cadmium uptake by plants in soils (from Plant and Soil 202,217-222)
2

APPENDIX 5 96-107 Uptake of Cd and Zn in relation to complexation by organic molecules (from pp. 113-118, In Plant Nutrition for Sustainable Food Production and Environment, Xfflth International Plant Nutrition Colloquium, T, Ando, K. :'l^itt,T.:B^^:H.''MatBiinNito,:S; Mori and J. Sekija (Eds.)
APPENDIX 6 108-114 Reducing cadmium uptake by addition of ameliorants to soil - urban waste materials (from Proc. 16th World Congress Soil Science, Montpellier, France, August 1998)
APPENDIX 7 115-121 Reducing cadmium uptake by addition of ameliorants to soil - industrial waste materials (from pp. 453-460 In "Contaminated Soil '98. Proceedings of the Sixth International FZK/TNO Conference on Contaminated Soil, 17-21 May 1998, Edinburgh, UK." Thomas Telford Ltd, London)
APPENDIX 8 122-128 Reducing cadmium uptake by large additions of zinc to soil - glasshouse experimentation
APPENDIX 9 129-133 Reducing cadmium uptake by addition of ameliorants to soil - field experimentation
APPENDIX 10 134-139 Physical properties of field soils treated with Cd-reducing ameliorants
APPENDIX 11 140 Grower brochures 1 - Managing cadmium in potatoes for quality produce
APPENDIX 12 141 Grower brochures 2 - Cadmium in potatoes - managing the risk from saline irrigation water
3

1. INDUSTRY SUMMARY
A Project funded by the Horticultural Research and Development Corporation (HRDC) was
conducted between July 1994 to June 1998, to devise techniques to control cadmium
accumulation in potato tubers. The specific objectives of the study were to investigate the
following:
• To undertake an industry extension program, to increase grower awareness of the
cadmium issue and communicate research findings to date,
• to develop a predictive test for growers to identify high risk soils and environments in
relation to cadmium quality of tubers,
• identify, test and evaluate amelioration strategies to overcome the problem of high
cadmium concentrations in potato tubers in certain regions of southern Australia identified
previously as most likely to produce potato tubers exceeding the maximum permissible
concentration of 0.05 mg cadmium kg"1 fresh weight,
• to investigate the residual value of fertilizer cadmium in soils and determine the long-term
availability of cadmium in soils.
Both field and glasshouse experiments were conducted, with all State Departments of
Agriculture in southern Australia being involved at various stages of the investigation. Work
focussed in southern Australia as this region has the greatest incidence of high cadmium
concentrations in potato tubers. The original objective of studying residual value of fertilizer
cadmium in soils, to be studied by Agriculture WA, was dropped when this organisation
withdrew from the project as a result of an internal reorganisation.
INDUSTRY EXTENSION
• A glossy 8-page brochure entitled "Managing Cadmium in Potatoes for Quality Produce"
was released through the CRC for Soil and Land Management in September 1996
(Appendix 11).
4
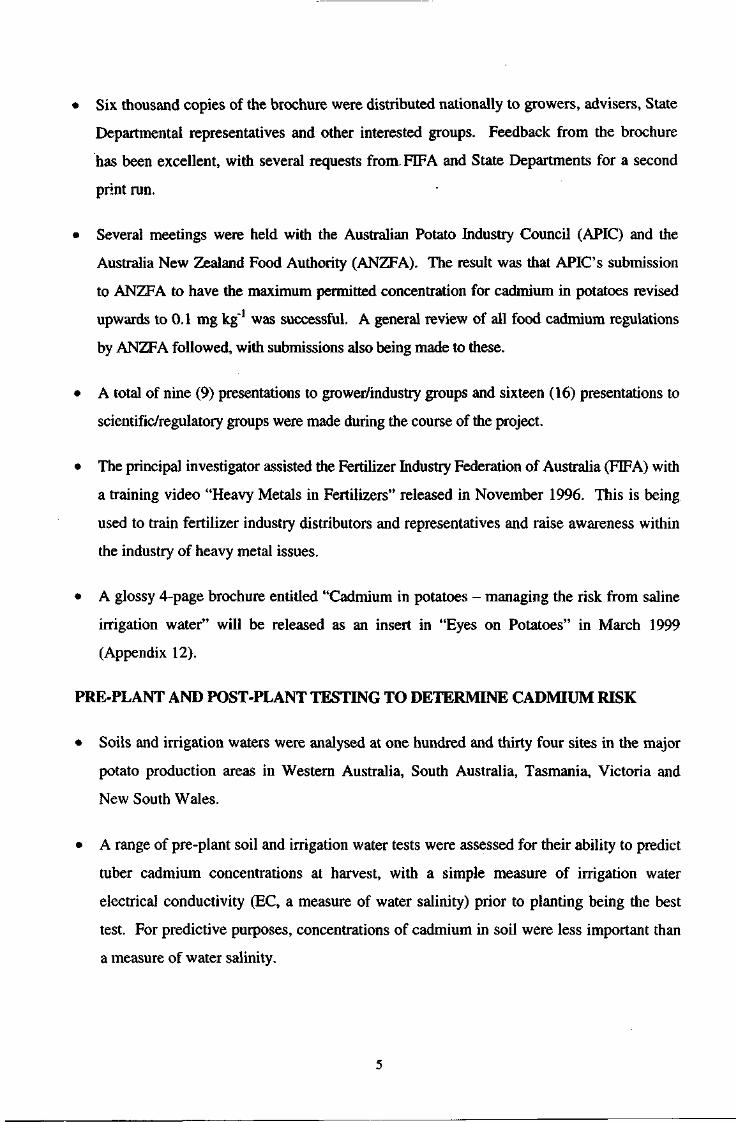
• Six thousand copies of the brochure were distributed nationally to growers, advisers, State
Departmental representatives and other interested groups. Feedback from the brochure
has been excellent, with several requests from FIFA and State Departments for a second
print run.
• Several meetings were held with the Australian Potato Industry Council (APIC) and the
Australia New Zealand Food Authority (ANZFA). The result was that APIC's submission
to ANZFA to have the maximum permitted concentration for cadmium in potatoes revised
upwards to 0.1 mg kg"1 was successful. A general review of all food cadmium regulations
by ANZFA followed, with submissions also being made to these.
• A total of nine (9) presentations to grower/industry groups and sixteen (16) presentations to
scientific/regulatory groups were made during the course of the project.
• The principal investigator assisted the Fertilizer Industry Federation of Australia (FIFA) with
a training video "Heavy Metals in Fertilizers" released in November 1996. This is being
used to train fertilizer industry distributors and representatives and raise awareness within
the industry of heavy metal issues.
• A glossy 4-page brochure entitled "Cadmium in potatoes - managing the risk from saline
irrigation water" will be released as an insert in "Eyes on Potatoes" in March 1999
(Appendix 12).
PRE-PLANT AND POST-PLANT TESTING TO DETERMINE CADMIUM RISK
• Soils and irrigation waters were analysed at one hundred and thirty four sites in the major
potato production areas in Western Australia, South Australia, Tasmania, Victoria and
New South Wales.
• A range of pre-plant soil and irrigation water tests were assessed for their ability to predict
tuber cadmium concentrations at harvest, with a simple measure of irrigation water
electrical conductivity (EC, a measure of water salinity) prior to planting being the best
test. For predictive purposes, concentrations of cadmium in soil were less important than
a measure of water salinity.
5

• When irrigation water EC exceeded 3.0 dS m1 , there was a 50% probability that tubers
grown with this water would exceed the new Cd MPC (0.1 mg cadmium kg"1 fresh
weight).
• Testing of the crop after planting is a valid way to determine tuber cadmium
concentrations at harvest. Plant top material should not be sampled, as cadmium
concentrations vary markedly with stage of growth in shoots, but not in tubers. Small
tubers, 10-20 mm length, should be sampled from 60 days onwards to estimate harvested
crop quality.
• Sulfate salinity in irrigation water was found unlikely to have the same effect as chloride
in increasing tuber cadmium concentrations.
SOIL TREATMENTS TO REDUCE TUBER CADMIUM CONCENTRATIONS
• A wide range of potential ameliorants were tested for their ability to reduce tuber cadmium
concentrations. Materials were low-cost and many were sourced from urban and industrial
waste streams.
• In glasshouse experiments, several promising ameliorants were identified, with large
reductions in tuber cadmium concentrations found using copper-rich water treatment
residuals (solid waste materials produced after treatment of water to potable standard) as a
soil ameliorant.
• Field validation trials of ameliorants confirmed that liming is ineffective in reducing tuber
cadmium concentrations. Several ameliorants were able to reduce tuber cadmium
concentrations under commercial conditions, including copper and zinc salts, a natural clay,
magnesite (magnesium carbonate) plus zinc, and ferrous smelter waste.
• Disappointingly, while reductions in tuber Cd concentration due to soil amelioration were
statistically significant, the magnitude of the changes were not large enough to prove
agronomically useful.
6

• Liming is still not recommended as a pre-plant soil treatment to reduce tuber cadmium
concentrations. There are some indications that liming should be performed several years
prior to potato growth to ensure reductions, rather than increases, in tuber cadmium
concentrations.
• Given the difficulty in modifying crop cadmium uptake under field conditions, and the
poor performance of all ameliorants, detection and avoidance of saline soils and irrigation
waters is imperative if crop cadmium quality is to be assured.
7
2. TECHNICAL SUMMARY
PRE-PLANT AND POST-PLANT TESTING TO DETERMINE CADMIUM RISK
• Soils and irrigation waters were analysed at one hundred and thirty four sites in the major
potato production areas in Western Australia, South Australia, Tasmania, Victoria and
New South Wales.
• Irrigation waters were analysed for electrical conductivity (EC), major cations and anions.
Cadmium was extracted from soil using aqua regia (1:3 HNC^HQ), EDTA
(ethylenediamine-N,N,N',N'-tetraacetate), DTPA (diethylene-triamine-pentaacetate), 0.01
M CaCl2, 0.01 M Ca(N03)2, 0.1 M CaCl2 and 1.0 M NH4NO3. The preferred test
procedure was validated in a subsequent sampling and analysis program at 39 sites.
• Irrigation water quality (EC or CI concentration), measured prior to planting, explained the
greatest variation in tuber Cd concentrations. Of the soil test procedures, only Cd
extracted by 0.01 M CaCl2 significantly improved the predictive capacity of water EC.
These two measures explained over 55% of the variance in tuber Cd concentrations.
• The data set were transformed to generate a probability curve for exceeding Cd
concentrations of either 0.05 or 0.1 mg kg"1 FW, the latter being the current maximum
permitted concentration (MPC) in Australia for potato tubers.
• The observation that soil Cd concentration had little influence on predicted tuber Cd
concentrations can be attributed to a number of possible factors. Potatoes are grown on
mostly light textured soils, with reasonable fertilizer (and hence Cd) histories. Hence soil
and management variability, normally addressed by a soil test, was not fully expressed.
Furthermore, the number of data points representing high Cd concentrations in tubers
(around 0.1 mg kg"1 fresh weight) was not large, so that these soils could have had similar
chemical characteristics. In this situation, soil Cd would be unrelated to tuber Cd
concentrations.
8

• Investigations of Cd, and other element, uptake by potatoes in relation to stage of plant
growth confirmed that plant shoot material is a poor indicator of tuber Cd concentrations.
Cadmium concentrations in plant shoots increased with plant age, while tuber Cd
concentrations remained fairly constant with growth stage.
• Cadmium concentrations in potato shoot material was approximately ten times higher than
in tubers.
• Investigations of uptake of Cd complexed by sulfate indicated that while this ion complexes
Cd in the soil solution and appears to be equally available as the free aquo Cd ion, addition
of sulfate to soils in irrigation does not increase plant uptake of Cd. This is hypothesised to
be due to the effect of sulfate in increasing Cd retention by soil particles.
• Investigations of the uptake of Cd complexed by model organic compounds indicated that
plants do not only take up the free aquo ion from solution. Large molecular weight Cd-
organic complexes appear to cross the root membrane and are translocated to plant shoots.
This contradicts the free ion activity model for metal uptake by plants, which states that only
free (uncomplexed) metal ions are biologically active.
SOIL TREATMENTS TO REDUCE TUBER CADMIUM CONCENTRATIONS
• A range of soil ameliorants was tested to assess if tuber Cd concentrations could be
markedly reduced in saline water/soil areas. The basis for the amelioration treatments was to
either increase the sorption of Cd by soil (using clay materials), or to block Cd uptake by the
plant (using copper and zinc treatments). Magnesite (MgCOs) was also included as a low-
calcium liming agent, with the aim to determine if lime-induced increases in crop Cd
concentrations, observed in this and previous projects, was due to calcium effects on Cd
desorption.
• The clay materials were a mixture of industrial and urban by-product materials (coal-
washing clays, water treatment residuals (WTRs), industrial clays (bentonites and zeolite),
natural mined clays, by-products slags, dusts and muds from the ferrous- and alumina-
smelting industries, sewage biosolids and sand-washing clays. The WTRs were derived
from both Fe and Al-based chemical flocculation processes for drinking water treatment, as
well as one material incorporating activated carbon (Alum+C WTR).
9

• All the clay materials markedly increased the sorption capacity of soil for Cd, but in
glasshouse experiments the greatest reductions in Cd uptake were obtained with copper-rich
WTRs. It was hypothesised that copper in these materials was blocking Cd uptake by the
potato roots. Copper phytotoxicity also occurred concomitant with the large (>80%)
reductions in tuber Cd concentrations.
• Assessment of these materials under field conditions, as well as assessement of the ability of
low rates of copper sulfate alone to reduce Cd uptake, was carried out at three field sites in
the Upper South East and Adelaide Hills regions of South Australia.
• None of the ameliorants adversely affected tuber yield, nor did they produce tubers of
unacceptable chemical quality (excepting Cd).
• Copper and zinc treatments reduced Cd concentrations at all sites, as did magnesite plus Zn,
a natural subsoil clay and a by-product dust from the ferrous smelter industry. Reductions
were not sufficient to lower tuber Cd concentrations to below the MPC at the two sites in the
Upper South East.
• Salinity effects again dominated differences between sites in terms of Cd accumulation by
tubers, indicating the importance of accurate and timely predictive testing of soil and
irrigation water quality.
10

3. CONCLUSIONS/RECOMMENDATIONS
• A widespread system of testing of irrigation waters and soils should be adopted by growers
prior to planting of potato crops. In this way, salinity hazards can be identified early, and
crops grown in areas having better quality water, and lower concentrations of extractable
cadmium in soil.
• Post-plant testing of small early tubers (60 day) for cadmium should be adopted where
cadmium problems are identified. Analysis of shoot material should not be used as a
diagnostic tool.
• If cadmium is suspected as a problem, lime should not be applied to soils at planting, but
several years earlier in the crop rotation. Low calcium materials should be used e.g.
dolomitic lime or magnesite.
• Where cadmium is suspected to be a problem, low rates of zinc as zinc sulfate, or copper as
copper sulfate, could be applied to the soil and incorporated prior to planting. Care needs to
be exercised to avoid crop damage by use of high copper/zinc application rates.
11

4. DIRECTIONS FOR FUTURE RESEARCH
• Given the difficulty in modifying cadmium concentrations in tubers through amelioration of
the soil, research should focus on a more fundamental understanding of cadmium uptake by
the potato plant (currently under way in HRDC PhD studentship project 96020). This should
allow development of new strategies to block cadmium uptake at the root surface.
• Molecular techniques to modify cadmium uptake by the potato plant should be investigated,
either to block cadmium transport in the phloem to the developing tuber, or to sequester
cadmium in the shoots.
• The long-term availability of cadmium in soils, an objective not addressed by this project as
Agriculture WA withdrew their participation, still requires investigation. Cadmium is
continually being added to soils, so that knowledge of the eventual fate of this cadmium is
essential.
12

5. GRANT DETAILS 1994-98 1. PROJECT TITLE A national strategy to reduce cadmium accumulation in potato crops
2. Organisation
Project Number PT(96)423
CSIRO Land and Water (formerly Division of Soils) PMB2 Glen Osmond SA 5054
Administration contact
Name Ms Kathy Heinze Title Business Development Manager Salutation Kathy Phone 08 8303 8696 Fax 08 8303 8590 Email Kathy.Heinze @ adl.clw.csiro.au
3. Project Chief Investigator
Name Dr Mike McLaughlin Title Principal Research Scientist Salutation Mike Phone 08 8303 8433 Fax 08 8303 8565 Email [email protected]
4. Project Start 01 July 1994 Project Completion 30 June 1998
5. Project Cost Year Amount($)
1994/95 139,938 1995/96 140,818 1996/97 129,730 1997/98 93,277
Total 503,763
6. Keywords Potatoes, cadmium, soil testing, ameliorant
7. Objectives for each year of the project
The objectives of the project were;
13

Yearl
To commence grower education programs to ensure the industry is aware of the current research findings. To commence development of a robust and reliable predictive test to allow growers to avoid soils/environments where potato production is likely to produce tubers exceeding the MPC for cadmium. To commence research on residual value of fertilizer cadmium in soils. To determine why lime is ineffective in reducing tuber cadmium
Year 2
To complete development of the predictive test for cadmium to allow identification and avoidance of environments posing a cadmium "hazard" and commence research on ameliorative options where cadmium is identified as a problem.
Year 3
To complete research of residual value of fertilizer cadmium in soils, identify soils where cadmium is likely to pose hazards in the future given current fertilizer cadmium inputs and complete studies of new ameliorative strategies to reduce cadmium uptake by crops in problem areas. To ensure cadmium issues are incorporated in decision support software assisting growers with crop nutrition.
Year 4
Field testing of promising new ameliorants. The most promising ameliorants from Year 3 be investigated at 3 field sites in 1997/98 - two sites in the Upper South East of South Australia and one in the Adelaide Hills.
8. Milestones
Task Task Description Start End 1 Appoint staff 01/07/94 30/09/94 2 Organise structure of soil/water/plant sampling program 01/07/94 30/09/94 3 Define sampling strategy for predictive test 01/07/94 30/09/94 4 Pre-plant sampling of all sites for cadmium test 01/08/94 31/03/96 5 Produce grower information sheet on cadmium in potatoes 01/10/94 31/12/95 6 Field/glasshouse experiments to assess liming effectiveness 01/10/94 31/12/95 7 Analysise soils/tubers/waters for predictive test 01/01/95 30/06/96 8 Incorp. cadmium information into decision support system 01/07/95 30/06/96 9 Prepare reports and publications - review meeting 01/01/96 30/06/96 10 Field experiments with new amelioration technology 01/08/96 31/03/97 11 Prepare reports, cadmium update brochure and publications 01/10/96 30/06/97
Additional milestones for proposed extension of project 12 Glasshouse expts. - effect of sludge Cu on crop/soil quality 01/07/97 31/03/98 13 Field trials (3) to evaluate new amelioration technology 01/10/97 30/04/98 14 Assessment of commercial applicability of new technology 01/05/98 30/06/98
14

9. Industry Financial Support
Levy paying industries Total Contribution
Potato $251,822
15

6. DETAILS OF PROJECT The Problem
(i) Nature of problem
There is worldwide concern for health issues related to food purity. Many countries are legislating both to limit the level of potentially toxic elements in foodstuffs, and to limit the concentration of these elements in soil amendments such as fertilizers, liming materials and organic wastes. In Australia the NFA had legislated to restrict the cadmium concentration in vegetables to less than 0.05 mg kg"1 wet weight (in 1994). Potatoes and other vegetables, notably the root and leafy vegetables, constitute an important part of the Australian diet (about 100 kg person"1 year"1) and all have cadmium concentrations well above the norm of most Australian foods (excepting animal offal products).
(ii) Circumstances giving rise to the problem.
The problem has arisen in two ways, one practical and the other perceptual. Firstly, the high requirement of many potato crops for phosphorus, combined with the high content of cadmium in phosphates from our traditional island phosphate rock sources, and the need of potatoes in particular for soils of moderately light texture coupled with irrigation with poor quality water, have created conditions allowing elevated cadmium levels in those crops. Secondly, world-wide concern for environmental purity has encouraged governments to impose stricter controls on soil amendments containing toxic metals.
Strict controls by means of MPC values have been introduced into the legal framework to guard against a perceived risk to public health but do provide a possible constraint on some commercial production if enforced strictly.
(iii) Procedure
The project was a national project involving CSIRO Land and Water (formerly Divisions of Soils) and Division of Horticulture and the CRC for Soil and Land Management, State Departments of Agriculture in Western Australia and South Australia, and liaison with State Departments in Tasmania, Victoria and New South Wales. The project was an extension of current work on cadmium accumulation in potatoes funded under HRDC projects VG 006 (CSIRO), PT212 (National), PT102 (WADA) and PT107 (SARDI) which were due for completion in 1994. At the request of HRDC a combined project proposal was developed which coordinated activity in various organisations into one umbrella project. Work in the above projects and project V/0011/R1 (Tas. DPI) indicated that;
1) High cadmium concentrations in potato tubers are a regional phenomenon, with tubers cadmium concentrations exceeding the current maximum permissible concentration (MPC) of 0.05 mg kg-1. Violations of the MPC generally occur in WA, SA, Victoria and to a lesser extent in Tasmania, New South Wales and Queensland. The levels of cadmium found in tubers are over 4 times the MPC in certain areas of S A and up to double the MPC in WA and Victoria.
2) High tuber cadmium concentrations tend to be related to (in order of importance) soil chloride concentrations, potato cultivar, soil zinc status and possibly soil acidity.
16

3) The major ameliorative measure to reduce cadmium uptake by crops traditionally suggested overseas (i.e. liming of soil to reduce soil acidity) has met with limited success in the field in Australia to date, despite encouraging results from glasshouse liming trials.
4) Potato variety has been found to have a marked influence on cadmium concentrations in tubers and some advanced breeding material shows further potential to reduce cadmium uptake.
5) The only fertilizer management strategies to show minimal success in reducing tuber cadmium concentrations (at that time) were zinc applications and changing potassium fertilizer to the sulfate form where water quality was already good.
From a review of current research opportunities discussed at the recent HRDC-sponsored cadmium workshop for the Australian Potato Industry, the following questions were identified as requiring investigation and the proposed project was structured around these identified priority components;
(iv) Components
1) A need was highlighted for Industry extension/education, in collaboration with Industry.
2) Can a predictive soil test be developed to identify problem situations prior to crop planting so that farmers can avoid problem soils/environments?
3) How quickly does the plant-availability of cadmium decline with time? As most soils receive more cadmium in fertilizer than is taken off in produce, it is critical that we determine how long the cadmium added to soil in fertilizer remains in a plant available form. This question is critical in the discussion of future limits for both cadmium in plants, soils and fertilizers.
4) Why has the use of lime in reducing tuber cadmium concentrations been unsuccessful to date in Australia and can other soil ameliorants or amelioration technology be used?
(v) Modification to work plan during project
A number of factors led to changes in the original workplan of the project over the duration of the project.
1) Reorganisation of the administration and structure of Agriculture WA resulted in Component 3 being dropped from the project and unused funds from Agriculture WA returned to the project. This objective was pursued under collaboration with the CRC for Soil and Land Management (Dr Rebecca Hamon).
2) A lack of suitable sites for liming trials in South Australia (due to an extensive program of liming of pastures in the Adelaide Hills region in 1995 and 1996) necessitated refocussing of this component to identifying new ameliorative measures, other than liming, for reducing tuber cadmium concentrations. This was felt to be more focussed to grower needs, rather than determining why liming is ineffective.
3) As a result of work under (2) above, the project was extended for a fourth year to test in the field under commercial conditions the promising ameliorants identified by glasshouse experimentation.
17
4) Additonal experiments were performed to examine the timing of cadmium uptake by potatoes, in relation to other nutrients (Section 10, Appendix 2). This was needed to determine if plant tests could be used as an indicator of tuber cadmium uptake, and also to determine if management measures to control cadmium uptake needed to be pre-plant or could be during the growth cycle. This component of the project also simultaneously provided significant amounts of data for the CROPTEST nutritional decision support software developed by SARDI.
5) With assistance from visiting scientists and students from overseas institutions, several experiments were conducted to investigate the impact of sulfate salinity on cadmium uptake by plants. Similarly, experiments were performed on how organic molcules affect cadmium uptake by plants as part of a study tour to the Catholic Univeristy, Leuven, Belgium, by the Principal Investigator in 1996 (Section 10, Appendices 3 and 5).
18

7. CSIRO AND COLLABORATING PERSONNEL INVOLVED IN THE PROJECT
CSIRO
Dr M.J.McLaughlin Dr R. Correll Ms M.K.Smart Ms G. Cozens MrS. Andrew Ms K.T.Sellar
SA Research and Development Institute/Primary Industries SA
Mr Norbert Maier Mr Chris Korczynski
Dept. Soil Science, The University of Adelaide
Dr Cameron Grant Ms Suzanne Macks
WADA
Mr Alan McKay
Victorian Dept. Agriculture
Mr Rene de Jong
Tasmanian Dept. Primary Industries and Fisheries
Dr Leigh Sparrow
NSW Agriculture
Mr Stephen Wade
19
8. SCIENTIFIC OUTCOMES To date 13 papers have been published in internationally refereed books, journals or conference proceedings during the course of the project. A further 4 journal papers are currently in preparation.
Six conference papers/abstracts have been presented during the course of the project.
Furthermore, a book titled "Cadmium in Soils and Plants" will be published by Kluwer Academic Press in 1999 and forms part of the outcomes of this project.
Book chapters/journal papers published/conference papers submitted during the course of the project
Some of the papers below have part of their data derived from the preceding project, Project VG006 "Effect of soil conditions and fertilizers on cadmium in vegetables - a national approach", but were written and publisheed during the period of this project.
Book chapters
1) McLaughlin, M.J., Smolders, E. and Merckx, R. 1998. Soil:root interface: Physicochemical processes. Pp. 233-277 In "Soil Chemistry and Ecosystem Health." Ed. P.M. Huang. Soil Science Society of America, Madison, WI.
2) McLaughlin, M.J., Parker, D.R. and Clarke, J.M. 1998. Metals and micronutrients: food safety issues. In Special Book Publication of Field Crops Research, Eds. R. Welch and R. D. Graham, (in press). Elsevier Scientific Pubications Ltd., Ireland.
3) Grant, C.A., Bailey, L.D., McLaughlin, M.J. and Singh, B.R. 1999. Management techniques to reduce cadmium transfer from soils to plants. A review. In "cadmium in Soils and Plants" Eds. M.J.McLaughlin and B.R. Singh. Kluwer Academic Publishers, Dordrecht, The Netherlands (in press).
Journal papers
4) Maier, N.A., McLaughlin, M.J., Heap, M., Butt, M., Smart, M.K., and Williams C.M.J. 1997. Effect of current season applications of calcitic lime on pH, yield and cadmium concentration of potato (Solanum tuberosum L.) tubers. Nutr. Cycl. Agroecosys. 47: 1-12.
5) McLaughlin, M.J., the late Tiller, K.G. and Smart, M.K. 1997. Speciation of cadmium in soil solutions of saline/sodic soils and relationship with cadmium concentrations in potato tubers. Aust. J. Soil. Res. 35: 1-16.
6) McLaughlin, M.J., Maier, N.A., Rayment, G.E., Sparrow, L.A., Berg, G., McKay, A., Milham, P., Merry R.H. and Smart, M.K. 1997. Cadmium in Australian potato tubers and soils. J. Environ. Qual. 26: 1644-1649.
7) McLaughlin, M.J., Andrew, S.J., Smart, M.K. and Smolders, E. 1998. Effects of sulfate on cadmium uptake by Swiss chard: I. Effects on complexation and calcium competition in nutrient solutions. Plant Soil 202: 211-216.
20
8) McLaughlin, M.J., Lambrechts, R.-M., Smolders, E. and Smart, M.K. 1998. Effects of sulfate on cadmium uptake by Swiss chard: EL Effects due to sulfate addition to soil. Plant Soil 202: 217-222.
9) McLaughlin, MJ., Maier, N.A., Correll, R., Smart, M.K., Sparrow, L.A. and McKay, A. 1999. Prediction of cadmium concentrations in potato tubers (Solarium tuberosum L.) by pre-plant soil and irrigation water testing. Aust. J. Soil Res. (in press).
Conference papers
10) McLaughlin, M.J., Smolders, E., Merckx, R. and Maes, A. 1997. Plant uptake of cadmium and zinc in chelator-buffered nutrient solution depends on ligand type. pp. 113-118, /« Plant Nutrition for Sustainable Food Production and Environment, XJHth International Plant Nutrition Colloquium, T, Ando, K. Fujita, T. Mae, H. Matsumoto, S. Mori and J. Sekija (Eds.), Kluwer Academic Publishers, Dordrecht, Holland.
11) McLaughlin, M.J., Hamon, R.E., Maier, N.A., Correll, R., Smart, M.K. and Grant, CD. 1998. Screening of phytoremediation and in-situ immobilisation techniques to remediate cadmium-contaminated agricultural soils, pp. 229-236 In "Proceedings National Soils Conference - Environmental Benefits of Soil Management", Brisbane, Australia, April 1998. Aust. Soil Sci. Soc. Inc., Sydney.
12) McLaughlin, M.J., Maier, N.A., Correll, R.L., Smart, M.K. and Grant, CD. 1998. In-situ immobilisation techniques to remediate cadmium-contaminated agricultural soils, pp. 453-460 In "Contaminated Soil '98. Proceedings of the Sixth International FZK/TNO Conference on Contaminated Soil, 17-21 May 1998, Edinburgh, UK." Thomas Telford Ltd, London.
13) McLaughlin, M.J., Maier, N.A. and Smart, M.K. 1998. Use of industrial byproducts to remediate saline cadmium-contaminated soils to protect the food chain. In Proc. 16th World Congress Soil Science, Montpellier, France, August 1998.
Conference abstracts
1) McLaughlin, M.J. and Tiller, K.G. 1994. Chloro-complexation of cadmium in soil solutions of saline-sodic soils increases phyto-availability of cadmium, pp. 195-196. In Proc 15th Int. Congr. Soil Sci., Acapulco, Mexico, July 1994.
2) McLaughlin, M.J., Kookana, R. and Naidu, R. 1995. Complexation of Cd in the soil-plant system and impact on soil and food quality. Invited presentation to the 10th National Convention of the Royal Australian Chemical Institute, September 1995.
3) Andrew, S.J., Hamon, R.E., and McLaughlin, M.J. 1997. Uptake of cadmium and zinc by Australian wheat cultivars. pp. 325-326 In "Proceedings Fourth International Conference on the Biogeochemistry of Trace Elements", Berkeley, June 1997.
21

4) McLaughlin, M.J., Andrew, S.J., Smart, M.K. and Smolders, E. 1997. Effect of sulfate complexation in solution on uptake of cadmium by plants, pp. 121-122 In "Proceedings Fourth International Conference on the Biogeochemistry of Trace Elements", Berkeley, June 1997.
5) McLaughlin, M.J., Smolders, E., Merckx, R. and Maes, A. 1997. Effect of organic ligands on uptake of cadmium and zinc by plants in chelator-buffered nutrient solution, pp. 115-116 In "Proceedings Fourth International Conference on the Biogeochemistry of Trace Elements", Berkeley, June 1997.
6) McLaughlin, M.J., Maier, N.A., Correll, R., Smart, M.K., Sparrow, L.A. and McKay, A. 1997. Prediction of cadmium concentrations in potato tubers (Solarium tuberosum L.) by pre-plant soil and irrigation water testing, pp. 153-154 In "Moving Towards Precision With Soil and Plant Analysis. Australian Soil and Plant Analysis Council 2nd National Conference", Launceston, Tasmania, November 1997.
22

9. TECHNOLOGY TRANSFER/INDUSTRY LIAISON
During the course of the project, the Principal Investigator held several meetings with growers, scientists and industry to review the issues, determine research and management priorities and to pass information and research outcomes to industry.
1) Industry meetings
The main industry presentation was to the Australian Potato Industry Council (APIC)/HRDC meeting, held on 12th November 1996 in Melbourne. Data from the project was presented and distribution and feedback from the cadmium information brochure was reviewed.
In addition, several meetings were held with representatives from APIC and the (then) National Food Authority, regarding the application by APIC to have the maximum permitted concentration for cadmium in potatoes revised upwards, using data from this and previous CSIRO cadmium projects. These were successful as judged by the revision of the potato (and all food) MPCs for cadmium in August 1997.
2) Grower/Scientific presentations (unpublished)
A number of talks were given to growers/scientists as part of the project.
1) "Fertilization and cadmium uptake by agricultural crops" to the International Fertilizer Development Centre, Muscle Shoals, Alabama, USA, July 1994.
2) "Impact of salinity on agricultural crop quality - mechanisms and implications" to USDA Environmental Chemistry Labs., Beltsville, Maryland, July 1994.
3) "Impact of salinity on agricultural crop quality - mechanisms and implications" to Department of Crop and Soil Sciences, University of Georgia, Athens, Georgia, USA, July 1994.
4) "Impact of salinity on cadmium uptake by potatoes" to Institute for Sustainable Irrigation Management, Tatura, August 1994.
5) "Cadmium update" Tatiara Potato Growers meeting, Bordertown, SA, October 1994.
6) "Cadmium update" Koo-wee-rup/Thorpedale crisping growers meeting, Coralyn, Victoria, October 1994.
7) "Cadmium speciation and cadmium uptake by plants" to the University of Adelaide Plant Membrane Biology Group, November 1994.
8) "Cadmium uptake by plants as affected by chloride - speciation and plant uptake in field soils and in nutrient solutions" to Department of Agriculture, University of Queensland, November 1994.
9) "Managing cadmium accumulation in irrigated potato crops" to Agriculture WA, Baron Hay Court, South Perth, WA, May 1995.
10) "Cadmium Update", to Tatiara Potato Grower's Association, Bordertown, SA, August 1995.
23

11) "Cadmium", to The Crisping Group of South Australia, Hahndorf, SA, September 1995.
12) "Cadmium Speciation in Relation to cadmium Availability to Plants" to Institute of Environmental Science and Engineering, Technical University of Denmark, October 1995.
13) "Regulating soils for minimising risks due to cadmium", invited presentation to New South Wales Environment Protection Agency, Sydney, March 1996.
14) "Impact of salinity on cadmium uptake by crops" to Catholic University Leuven, Belgium, June 1996.
15) "Impact of salinity on cadmium uptake by crops" to Netherlands National Institute for Public Health, Utrecht, Netherlands, September 1996.
16) "Cadmium speciation in soils and uptake by plants" to Department of Soil Science, University of Reading, UK, September 1996.
17) "Cadmium speciation in soils and uptake by plants" to Rothamsted Experimental Station, Harpenden, UK, September 1996.
18) "Cadmium uptake by plants - impact of speciation" invited presentation to Agricultural University Norway, As, Norway, September 1996.
19) "Effect of organic ligands on cadmium uptake by plants" to Department of Soil Science, University of Adelaide, Adelaide, October 1996.
20) "Managing agricultural land contaminated by metals in fertilizers and wastes". Invited Plenary Lecture to International Conference on Remediation of Degraded Lands, Hong Kong, December 1996.
21) "Cadmium update" Tatiara Potato Growers meeting, Bordertown, SA, February 1997.
22) "Can water treatment sludges improve food quality?" to Australian Water Quality Centre, Bolivar, March 1997.
23) "Soil salinity and Cd uptake by plants" to USDA Soil Salinity Research Laboratory, Riverside, USA, June 1997.
24) "Cadmium update" Tatiara Potato Growers Annual General Meeting, Bordertown, S A, August 1997.
3) Industry liaison
Throughout the project, close contact has been maintained with the fertilizer industry through the Fertilizer Industry Federation of Australia (FIFA), Ltd. Through one of the member companies, Incitec Pty Ltd, the Principal Investigator participated in a Fertilizer Industry training video "Heavy Metals in Fertilizers" released in November 1996. In addition, assistance was provided to FIFA in review of a chapter on "Heavy Metals in Fertilizers and Agriculture" in their "Australian Soil Fertility Manual", and to Incitec Pty Ltd, for review of their "Agri-Topic - Heavy Metals in Fertilizers and Agriculture" released in October 1996.
24

Close contact was also been kept with the Australia New Zealand National Food Authority (ANZFA, formerly NFA) and several discussions were held with them regarding the review of the food cadmium regulations. During July-August 1994, technical assistance was provided to the Australian Potato Industry Council to lodge a submission to the NFA to have reviewed upwards the maximum permitted concentration for cadmium in potatoes.
4) Articles/leaflets/media
A glossy 8-page brochure entitled "Managing Cadmium in Potatoes for Quality Produce" was released through the CRC for Soil and Land Management in September 1996 (Appendix 11). Six thousand copies of this were distributed nationally to growers, advisers, State Departmental representatives and other interested groups. Feedback from the brochure has been excellent, with several requests from FIFA and State Departmennts for a second print run.
A second brochure entitiled "Cadmium in potatoes - managing the risk from saline irrigation water", with the same format as the first brochure, is almost complete and should be released in February 1999 as an insert in "Eyes on Potatoes". This summarises results from the predictive test component of this project (Component B, Section 6.iv above). A copy is enclosed at the end of this report (Appendix 12).
5) Decision support software
The findings of this and previous projects have now been included in the "CROPTEST" decision support software for growers and technical advisers released by SARDI in December 1998. A hypertext information library is part of this software, so that fertilization options and nutritional management are linked to cadmium management. This will enhance awareness of cadmium issues by consultants and growers, and will influence crop and fertilizer management decisions to minimise cadmium accumulation in crops.
25

10. TECHNICAL PAPERS
APPENDIX 1 Prediction of cadmium concentrations in potato tubers (Solatium tuberosum L.) by pre-plant soil and irrigation water analyses
Introduction
Potatoes have been identified as a major component of human dietary intake of cadmium (Cd) in Australia (Anon. 1992), and Australian regulations governing maximum permitted concentrations (MPCs) for Cd in root and tuber vegetables have recently been set at 0.1 mg kg"1 on a FW basis (Anon. 1997). A number of areas in Australia have the potential to produce potato tubers in excess of the new MPC, due to particular combinations of soil and environmental factors (McLaughlin et al. 1997a). It is therefore important that growers are able to identify soils and environments where tubers are likely to exceed the MPC, preferably prior to soil preparation and crop planting, so that site selection can be effectively used as a management tool to minimise Cd in fresh and processed produce.
There have been a number of investigations of the use of chemical extractants to predict Cd concentrations (or uptake) into plants in both glasshouse and field studies, with varying degrees of success (Symeonides and McRae 1977; Sauerbeck and Styperek 1985; Whitten and Ritchie 1991; He and Singh 1991; Mench et al. 1994; Andrewes et al. 1996). However, none of the above studies satisfy the criteria necessary for the development of a predictive test capable of being used under all commercial conditions. We contend that these test criteria are that:
1) it should account for the major environmental factors known to affect crop Cd concentrations (McLaughlin et al. 1994a; 1996);
2) it should be relatively simple, inexpensive and robust;
3) it should be calibrated under field conditions across a wide range of soil types;
4) it should be independently validated; and
5) it must be truly predictive i.e. measurements prior to planting of the crop must be correlated against plant Cd measurements at harvest, and not a correlation between measurements on soil and plant samples at the same point in time. This is particularly important in irrigated crops where soil properties, such as pH, EC and CI concentrations, can change markedly throughout the growth season (Maier et al. 1997).
This paper reports the development of a pre-plant test for Cd risk in irrigated potato soils which was designed to satisfy the above criteria. The results have been expressed in a graphical format to enable an estimate of the probability that a crop will exceed the MPC of Cd.
26

Materials and methods
Sampling of soils and irrigation waters before planting
One hundred and thirty four sites were chosen in spring 1994, prior to soil preparation for the summer cropping season. The sites include representatives from the major potato production areas in Western Australia, South Australia, Tasmania, Victoria and New South Wales. The possibility that spatial variability would confuse the relationships between pre-plant measurements and tuber Cd concentrations was minimised by sampling tubers and soils from the exact same location at each site. Soils at the sites were sampled by taking 5 cores to 150 mm depth within an area 1 m in diameter using a stainless steel corer in September 1994 to February 1995, prior to cultivation and soil preparation by growers. Soil cores from each sampling point were bulked, thoroughly mixed and a one kilogram sample taken. The area was then permanently marked by placing a Scothmark™ Ball Marker (which contains an electronic transponder) at 70 cm depth in the centre of the sampling area. This depth was assessed as being sufficient to prevent disturbance of the transponder by cultivation practices.
The soils were chosen on the basis that they represented the main potato production soils in southern Australia. Soil Orders (Isbell 1996) sampled were predominantly Ferrosols, Podosols, Sodosols and Chromosols with a wide range of chemical characteristics (Table 1). Soils were air-dried and crushed to pass a 2 mm sieve, prior to mixing and subsampling for chemical analysis.
Table 1. Selected chemical characteristics of soils and irrigation waters prior to planting (n=134)
Characteristic Range Median Mean
KA
pH (water)A
EC (dS m"1)* Extractable CI (mg kg"1) Extractable P (mg kg"1)8
Total Cd (mg kg"1)0
Total Zn (mg kg"1)0
PH EC (dS m"1) CaOngL"1) MgdngL"1) Na (mg L"1) StmgL"1) CHmgL"1)
Soil 4.8-8.1 5.8 5.8
0.02-1.07 0.11 0.15 5-660 25 56 5-459 53 69
0.01-0.60 0.11 0.18 1-130 15 28
igation water 6.4-9.2 7.7 7.7
<0.01-4.1 0.43 0.90 1-245 13 32 1-105 13 23 3-501 58 118 <l-72 4 12 1-1118 170 270
^ 1:5 soil:water ratio B Colwell (1963) C Aqua regia digest
27

Irrigation water samples were also taken prior to crop planting by placing 250 mL water from the irrigation supply line into a polypropylene bottle. Waters were stored at 4°C prior to analyses.
Sampling of soils, waters and tubers at crop maturity
At crop maturity sampling points were located at each site using a EMS II Marker Locator™ tuned to the frequency of the buried transponder. Potato crops were sampled by hand digging tubers from a i m square area above the transponder. Twelve to 15 tubers in the size range 80-450 g were collected, with any severely diseased or damaged tubers discarded. Tuber cultivar was noted and tubers were brushed free of soil and transported to the laboratory for analysis.
Soil in the row down to the furrow depth was thoroughly mixed and a one kilogram sample taken by compositing four subsamples. Soils were air-dried and crushed to pass a 2 mm sieve.
Irrigation water was sampled at crop maturity as outlined previously.
Soil and water analyses
Soil pH and electrical conductivity (EC) were determined in a water suspension of soil using a 1:5 soil solution ratio (Rayment and Higginson 1992). Chloride (CI) was extracted from soil using water at a soil:solution ratio of 1:5 (Rayment and Higginson 1992). Chloride in the filtered (Whatman No. 42) solution was determined using an automated ferricyanide method (APHA 1992). Phosphorus (P) was extracted from soils using the method of Colwell (1963).
Total and extractable Cd concentrations in soils were determined using the following methods:
(1) Total Cd: total Cd concentrations in soil were determined by boiling 2 g soil with 8 mL aqua regia (HNC^HCl, 1:3 ratio) at 110°C for 2 h. The mixture was cooled, diluted to volume with 0.08 M HNO3 spiked with indium as an internal standard and filtered through a 0.22 um filter.
(2) EDTA-extractable Cd: Cd was extracted by shaking soils for seven days with 0.05 M sodium EDTA (disodium ethylenediamine-N,N,N',N'-tetraacetate) at pH 6.0 using a soil:solution ratio of 1:2.5 (Clayton and Tiller 1979).
(3) 0.01 M CaCl2-extractable Cd: 5 g soil was shaken for 4 h with 25 mL extracting solution. In preliminary experiments, 4 h was found to be a sufficiently long extraction time to allow equilibrium between soil and solution to occur. The suspensions were then centrifuged (10 min. at 4000 RCF), filtered through a 0.22 um filter and diluted 5-fold with 0.08 M HNO3 spiked with indium as an internal standard.
(4) 0.01 M Ca(NC»3)2-extractable Cd: as above only Cd was extracted from soils using 0.01 M Ca(N03)2 solution. Activity of Cd2+ ion in these solutions was determined by the ligand desorption method of Fujii etal. (1983), as outlined previously (McLaughlin etal. 1997b).
5) 0.1 M CaCl2-extractable Cd: as for method 3 except 0.1 M CaCl2 was used as the extraction solution (modification of the method of Sauerbeck and Styperek 1985).
28

6) NtijNCVextractable Cd: 4 g soil was extracted with 40 ml 1.0 M NH4NO3 for 1 h (Symeonides and McRae 1977). Samples were centrifuged at 4000 RCF for 20 min and filtered through a 0.22 urn filter. The solution was diluted 5-fold with 0.08 M HN03
spiked with indium as an internal standard.
7) DTPA-extractable Cd: soils were extracted using DTPA (diethylenetriaminepentaacetic acid plus buffer in CaCh) according to the method of Lindsay and Norvell (1969).
Zinc was also extracted from soils using methods 1 and 2.
Concentrations of Cd and Zn in solutions were determined using either a flame or graphite furnace Varian Spectra AA-400 atomic absorption spectrophotometer (GFAAS) equipped with deuterium background correction. Orthophosphoric acid (methods 2, 3, and 7) and palladium (method 4) were used as modifiers. Inductively-coupled plasma mass spectrometry (ICP-MS) using indium as an internal standard (methods 1, 3, 5 and 6) was also used. Due to the very low Cd concentrations in dilute Ca solutions, a comparison was made between ICP-MS and GFAAS analysis of Cd concentrations in extracts from method 3.
Measurement of pH and EC of irrigation waters was according to the methods of Rayment and Higginson (1992). Waters were filtered through a 0.45 |iim filter and cations, sulfur, boron and P in irrigation water were determined by ICP atomic emission spectroscopy. Concentrations of chloride (CI) were determined using an automated ferricyanide method (APHA 1992).
Tuber analysis
Tubers were first cleaned in deionised water and a 10-20 mm longitudinal slice taken from the stem end to the bud end of each tuber. Tuber material was then oven dried and ground < 250 um. A subsample of the ground dried material (0.5 g) was digested by boiling under convection heating with 7 mL concentrated HNO3 acid and Cd concentration in the solution was determined by GFAAS (McLaughlin et al. 1997a). Analysis of NBS rice flour (Ref.No.l568A) by the above method gave a Cd concentration of 0.023 ± 0.001 mg kg"1, compared to the certified value of 0.022 ± 0.002 mg kg"1. All tuber Cd concentrations are expressed on a fresh weight basis (FW).
Statistical analysis
Relationships between soil and irrigation water test procedures and tuber Cd concentrations were determined using Pearson's correlations. Prediction of the concentration of tuber Cd concentration was assessed using multiple regression against pairs of the soil and water measurements described above. A logarithmic transformation of the tuber Cd concentration was required to give normality and homoscedasticity of the residuals from the regression.
Analyses of probabilities of exceedence of MPCs were performed using a generalised linear model (GLM) with a binomial error and logistic link (McCullagh and Nelder 1989). Because the water quality and soil Cd are unique for each site, there is only a single realisation of the binomial process for each set of predictors. This analysis provided a linear model of A,
where X = log where p is the probability of exceeding a pre-determined tuber Cd \-p
concentration. This was considered preferable to modeling p directly because A was found to
29

be approximately linearly related to the important soil or water parameters whereas p was not. The predictions of p were obtained from the fitted A s using the inverse logistic transform
_ exp(A)
1 + exp(A)
All analyses were performed in GENSTAT (Rothamsted Experimental Station 1995).
Test validation
The preferred method for assessing Cd risk was tested in the 1995/96 season by sampling 39 sites in South Australia, Victoria and Tasmania prior to crop planting as outlined previously. At crop maturity tubers were sampled and the Cd concentrations in tubers compared to those predicted by the preferred methodology.
Ability of the preferred method to accurately predict exceedance of the MPC of 0.1 mg kg"1
FW was determined using a Chi square (%2) comparison.
Results
Soil and water analyses
The soils had a wide range of pH values, Cd concentrations and extractable P concentrations (Table 1). Irrigation waters ranged from high quality, having low concentrations of soluble salts, to very poor quality where soluble salt concentrations were high (ECs >3.0 dS m"1). Sodium and CI were the dominant ions in the irrigation waters (Table 1). For all States there was a good relationship between irrigation water EC (R2=0.95, P<0.001) or CI (R2=0.95, P<0.001) concentrations at planting and those at harvest, with the slope of the relationship close to 1 for all States (Fig. 1).
4.5 T
0.5 1.0 1.5 2.0 2.5 3.0 3.5
Irrigation water EC prior to planting (dS nr1)
4.0 4.5
Fig. 1. Relationship between EC of irrigation water measured at planting and at harvest. Fitted line is Y = 0.02+1.01X (i?2=0.95; P<0.001).
Soil characteristics also changed markedly between planting and harvest. Soil pH changes between planting and harvest varied from a drop of 2.2 units to an increase of 1.3 units (data
30

not shown), while changes in soil EC varied from +0.7 to -0.7 dS m"1. Overall, soil salinity tended to increase due to irrigation and was positively correlated (/?2=0.46, P<0.001) to irrigation water EC measured prior to planting (Fig. 2).
0.80 T
0.60
E 0.40
o) -0.20 <C
° -0.40
-0.60
-0.80
•+% jH 1—• -1 jl • 1 1 1 1
' •W2).5f l» 1.00 1.50 2,00 2.50 3.00 3.50 4.00 4.50
Irrigation water EC (dS nr1)
Fig. 2. Relationship between irrigation water quality and change in soil EC between planting and harvest. Fitted line is Y=-0.008+0.121X CR2=0.46; P<0.001).
Concentrations of Cd extracted from soils using the various reagents are shown in Table 2.
Table 2. Concentrations of Cd (jig kg*1) extracted from soils by the various reagents (n=134).
Cd concentration Soil test method Range Median Mean
Hgkg'1
EDTA 20-406 85 126 DTPA 10-361 54 61 0.1MCaCl2 1-225 47 54 I.OMNH4NO3 1-111 13 17 0.01 M CaCl2 1-60 8 12 0.01 M Ca(N03)2 0-55 6 9
Cd2+ activity (nM)A <0.01-6.9 0.9 1.4
A Activity of the free Cd2+ ion in the 0.01 M CaCl2 and 0.01 M Ca(N03)2 extracts calculated according to the method of Fujii et al (1983).
EDTA, DTPA and 0.1 M CaCl2 extracted the greatest amount of Cd from the soils, followed by the 1.0 M NH4NO3 solution and the dilute Ca salts. There was excellent agreement between Cd concentrations determined by GFAAS and ICP-MS for the 0.01 M CaCl2
31

extractant (R2=0.9S, P<0.001, Fig. 3). Concentrations of Cd extracted by the weaker Ca salts and the NH4NO3 solutions were low in comparison to the other procedures, but well within the detection limits of the instrumental analysis. The limits of reporting (LOR) using the GFAAS and ICP-MS procedures for soil Cd determined by extraction with 0.01 M CaCl2 and Ca(N03)2, calculated as 5 times the detection limit, were 1.25 and 0.5 \ig kg"1, respectively. The LOR for extractable Cd using the 1.0 M NH4NO3 procedure was 1 u.g kg"1.
? ; 2 0 T
co 16 + < < LL
^ 12 + >>
.£ 8 -E *
CD CD
T3 •o O
4 -
0
Observed values Fitted Line
Y=-0.00003+1.08X R2=0.98
4 8 12 16 Cd determined by ICP-MS (ug L1)
20
Figure 3. Relationship between Cd in 0.01 M CaCl2 extracts of soil determined by GFAAS and ICP-MS. Fitted line is Y=-0.00003+1.08X : R2=0.98 (P<0.001).
As expected, there was also a close correlation between amounts of Cd extracted by the various reagents, with total, EDTA- and DTPA-extractable Cd being closely correlated, and Cd concentrations extracted by the salt solutions (0.01 M CaCl2, 0.01 M Ca(N03)2, 0.1 M CaCl2 and 1.0 M NH4NO3) also highly correlated (Table 3). Cadmium was generally positively correlated to extractable P concentrations, and in the all the salt extracts increased exponentially as soil pH decreased below about 5.5, as shown in Fig. 4 for NH4NO3.
Tuber cadmium concentrations
The range, median and mean tuber Cd concentrations (mg kg" FW) were 0.006-0.296, 0.039 and 0.052, respectively. Eleven of the 134 tuber samples had Cd concentrations exceeding the MPC of 0.1 mg kg"1 FW, and 41 samples had Cd concentrations between 0.05 and 0.1 mg kg"1
FW. There was a significant effect (P<0.05) of tuber cultivar on tuber Cd concentrations, with cultivars Russet Burbank and Sebago having lower Cd concentrations than Kennebec and Pontiac, in line with previous findings (McLaughlin etal. 1994b).
Tuber Cd concentrations were not strongly correlated with soil pH, EC, CI nor with any soil Cd (or Zn) test procedure performed on soil samples taken prior to planting (I^<0A). The greatest amount of variation in tuber Cd concentrations was accounted for by a measure of pre-plant irrigation water quality (either EC or CI concentration) and this could be slightly improved by including a measure of extractable Cd. Similar fits were obtained from various
32

combinations of these measures, the best being with irrigation water CI concentration and Cd extracted by 0.01 M CaCl2 (Table 4). High CI concentrations in irrigation waters prior to planting led to tubers having high Cd concentrations (Fig. 5). The equation for prediction tuber Cd (mg kg"1 FW) was;
Log(Tuber Cd) = -1.793 (±0.039) + 0.00099 (±0.00008) CI + 0.0130 (±0.0022) Cd (Eq.l)
where CI is the CI concentration in the irrigation water (mg L"1) and Cd is the concentration of soil Cd extracted by 0.01M CaCl2 (p.g kg"1). The standard error of the parameter estimates are shown in parentheses.
Table 3. Simple linear correlation matrix between amounts of Cd and Zn extracted from soils, soil pH and extractable P (n=134). Values for correlation coefficient (r) numerically greater than 0.17,0.22, and 0.28 are significant at P= 0.05,0.01 and 0.001 level respectively
Factor Values for correlation coefficient (r)
pH Ext. P EDTA EDTA DTPA 0.01M 0.01M Total Total NH4NO3
Cd Zn Cd CaCl2 Ca(N03)2 Zn Cd Cd Cd Cd
pH Ext. P -0.21 EDTA-Cd -0.02 0.40 EDTA-Zn 0.09 0.13 0.19 DTPA-Cd 0.02 0.39 0.81 0.21 0.01 MCaCl2-Cd -0.64 0.40 0.17 0.04 0.21 Ca(N03)2-Cd -0.62 0.32 0.15 0.00 0.16 0.97 Total Zn -0.08 0.16 0.43 0.42 0.19 -0.18 -0.17 Total Cd -0.10 0.50 0.96 0.21 0.75 0.20 0.17 0.52 NH4N03-Cd -0.63 0.53 0.35 0.05 0.27 0.88 0.87 0.02 0.41 0.1MCaCl2-Cd -0.48 0.65 0.61 0.20 0.62 0.70 0.63 0.16 0.64 0.81
_ 120 "
b> •
o> 100 "
o 80 "
& xs 2 60 -
i 40-X
z 2 20 " q
> .
• •
• •
• • •
4 m U B
> as m
m la | 0 H 4. 0
i
5.0 i
6.0
Soil ph
7.0
i
1 1 8.0 9.0
Fig. 4. Relationship between soil pH and Cd extracted from soil using 1.0 M NH4NO3.
33

0.30 T •
• #
* •
i 1 1 — i m — i 1 1
0.00 0.50 1.00 1.50 2.00 2.50 3.00 3.50 Log10 (CI) in irrigation water (mg L1)
Fig. 5. Relationship between tuber Cd concentration and CI concentration in irrigation water measured prior to planting.
Table 4. Analysis of variance table for multiple regression of tuber Cd concentration (mg kg"1 FW, log transformed) on irrigation water CI concentration and 0.01 M CaCl2-extractable Cd in soil
Change in model
d.f. Sum of squares
Mean Square
Variance ratio % Variation
+ C1 + CaCl2-Cd Residual
Total
1 1
131
133
7.084 1.981 7.302
16.367
7.084 1.981 0.056
0.123
127.08*** 35.54***
43.2 12.2 44.6
100.0
*** P<0.001
The equation for the probability predictions for tuber Cd concentrations exceeding 0.05 mg kg"1 FW based on the EC of the irrigation water (dS m"1) was,
A = -1.82 (±0.32) + 1.53 (± 0.29) EC (Eq.2)
For tuber Cd concentrations exceeding 0.1 mg kg"1 FW the equation was
I = -7.14 (± 1.58) + 2.465 (± 0.599) EC (Eq.3)
The backtransformed probabilities are shown in Figure 6. A similar equation was obtained using irrigation water CI. A lower deviance was obtained with irrigation water CI for predicting tuber Cd concentrations above 0.05 compared to EC, but EC gave better predictions for concentrations exceeding 0.1 mg kg"1 FW (Table 5). The equation based on EC was preferred because of the ease of EC determinations.
0.25 -
2 I I c CD O c o o TJ O i _ 0) .a 3
0.20 -
2 0.15 -
0.10 -
0.05
ono
MPC
34
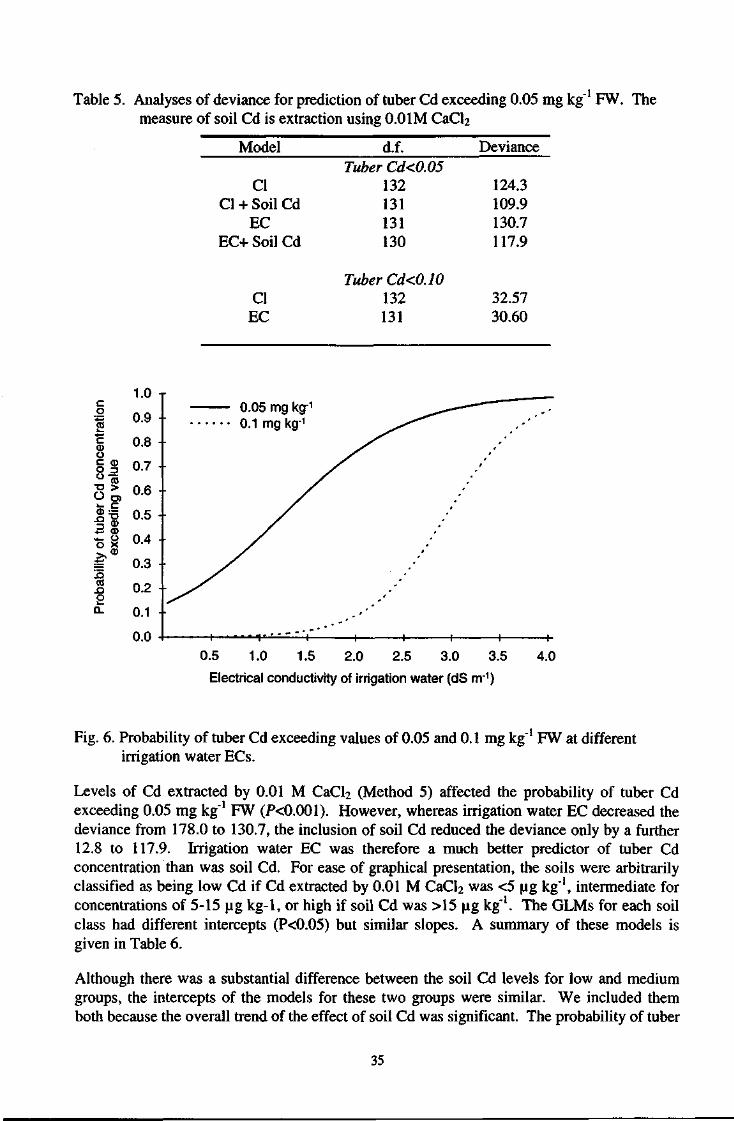
Table 5. Analyses of deviance for prediction of tuber Cd exceeding 0.05 mg kg' FW. The measure of soil Cd is extraction using 0.01M CaCl2
Model d.f. Deviance Tuber Cd<0.05
CI 132 124.3 CI + SoilCd 131 109.9
EC 131 130.7 EC+ SoilCd 130 117.9
CI EC
Tuber Cd<0.10 132 32.57 131 30.60
c o
+-> c o o s ® O 3
°« •D >
O o> 51 Is *- o O X
15 CO .a o
1.0
0.9
0.8
0.7
0.6
0.5
0.4
0.3
0.2
0.1
0.0
0.05 mg kg1
0.1 mg kg1
0.5 1.0 1.5 2.0 2.5 3.0 3.5
Electrical conductivity of irrigation water (dS rrr1)
4.0
Fig. 6. Probability of tuber Cd exceeding values of 0.05 and 0.1 mg kg"1 FW at different irrigation water ECs.
Levels of Cd extracted by 0.01 M CaCl2 (Method 5) affected the probability of tuber Cd exceeding 0.05 mg kg"1 FW (P<0.001). However, whereas irrigation water EC decreased the deviance from 178.0 to 130.7, the inclusion of soil Cd reduced the deviance only by a further 12.8 to 117.9. Irrigation water EC was therefore a much better predictor of tuber Cd concentration than was soil Cd. For ease of graphical presentation, the soils were arbitrarily classified as being low Cd if Cd extracted by 0.01 M CaCl2 was <5 u.g kg"1, intermediate for concentrations of 5-15 ug kg-1, or high if soil Cd was >15 u,g kg"1. The GLMs for each soil class had different intercepts (P<0.05) but similar slopes. A summary of these models is given in Table 6.
Although there was a substantial difference between the soil Cd levels for low and medium groups, the intercepts of the models for these two groups were similar. We included them both because the overall trend of the effect of soil Cd was significant. The probability of tuber
35

Cd concentration exceeding the 0.05 level is shown for each class in Fig. 7. The 11 cases where Cd exceeded the MPC of 0.1 mg kg"1 FW were insufficient to enable similar curves to be constructed for this MPC.
Table 6. Intercept and slope of relationship between X (A = log , where p is the \-p
probability of exceeding a tuber Cd concentration 0.05 mg kg"1 FW) and irrigation water EC for soils with low, medium and high extractable soil Cd.
Cd Level Average soil Cd Intercept Slope Hgkg-1
Low 3.0 -2.66 ±0.57 1.83 ±0.34 Medium 9.0 -2.39 ±0.53 1.83 ±0.34 High 206 -1.24 ±0.37 1.83 ±0.34
0.0 0.5 1.0 1.5 2.0 2.5 3.0 3.5 4.0
Electrical conductivity of irrigation water (dS rrr1)
Fig. 7. Probability of tuber Cd exceeding 0.05 mg kg"1 FW for soils of low, medium and high levels of 0.01 M CaCl2-extractable Cd.
Test validation
Tuber Cd concentrations in the validation samples varied from 0.007 to 0.145 mg kg"1 FW with only five samples exceeding the MPC. Using pre-plant EC as the predictor of tuber Cd concentration, predictions of tuber Cd exceeding the MPC were reasonable, with the predicted probability of MPC violations agreeing well with the observed (Table 7).
There was still considerable variation in the data however, with one tuber Cd value being low when violation of the MPC was predicted to be highly probable (point A in Figure 8) and others in excess of the MPC but only having a low probability of violation predicted by the model (e.g. points B and C in Fig. 8).
c o
Is O T C O) o -* u O
XI Z3
o E in o d
»- c o--6 £% CD Q)
.O P
36

On further investigation, it was found that point A had an extremely low (<1 |j.g kg"1) CaCl2-extractable Cd concentration in soil, and soil Cd was not included in the model for predicting probabilities of violating the 0.1 mg kg"1 FW Cd level. For point B it was found that irrigation water EC at this site prior to planting was 0.23 dS m"1, which by harvest had risen to 2.48 dS m"1. There was no ready explanation for why the tuber Cd concentration was high for point C yet the predicted probability of exceeding the MPC was very low.
Table 7. Observed and expected frequency of incidences of tuber Cd exceeding or meeting the MPC of 0.10 mg kg"1 FW
Tuber Cd (mg kg"1
FW) Observed
(O) Expected
(E) (0-E)2/E
>0.10 5 4.15 0.174 <0.10 34 34.85 0.021 Total 39 39 0.194A
' x2 value not significant at P=0.05.
- v 0 1 6 " ^go.uiB £ J? 0.12 eg "o> •§ E 0.10
i | °-08
% 5 0.06
§ 8 004
o 0.02
0.00
MPC
+ + + 0.2 0.4 0.6 0.8
Probability of exceeding MPC
1.0
Fig. 8. Predicted probability of tuber Cd exceeding MPC (0.1 mg kg"1 FW) in relation to observed tuber Cd concentrations for validation samples. Points A, B and C are discussed in text.
Discussion
Compared to soil testing for prediction of crop response to macronutrient element concentrations in soils, testing to predict concentrations of trace metals in crops has been problematic. Not least of these problems are the analytical difficulties of determining trace concentrations of elements in soil extracts. For this reason, and to mimic the mechanisms which plant roots utilise to access micronutrients in soil, micronutrient elements have traditionally been extracted from soils with strong chelating agents such as DTPA and EDTA (Brown et al. 1960; Lindsay and Norvell 1969), which provided concentrations of trace metals in solution easily measurable by flame atomic absorption techniques. With improvements in
37
analytical methodology over the last 2 decades, ultra-trace concentrations of metals can now be routinely detected in solution using GFAAS, ICP-MS or voltammetric and potentiometric techniques, allowing the investigation of the utility of less aggressive extractants for determining the amount of "plant-available" metals in soil. Examples of this class of extractant are 0.01 M CaCl2 and 1.0 M NH4NO3 (Symeonides and McRae 1977; Whitten and Ritchie 1991; Andrewes et al. 1996). GFAAS is equally effective as ICP-MS in determining trace concentrations of Cd in neutral salt extracts of soil, with the former instrumentation being more widely available and less expensive. Limits of reporting for Cd (5 times the detection limit) using GFAAS were 0.25 |Ltg L"1 in solution, or 1.25 |i.g kg"1 soil, which was sufficient for the amounts of Cd extracted by 0.01 M CaCl2 from these agricultural soils.
Only a small fraction of the total Cd in soil was solubilised by the weak salt solutions at moderate to high pH values (>6.0), but this fraction increased considerably as soil pH fell below 6.0. In weak Ca salts the fractional increase was from 0.002 to 0.373, and in NH4NO3 from 0.003 to 0.855 (data not shown). Whitten and Ritchie (1991) also found soil pH markedly affected solubility of Cd in 0.01 M CaCl2 solution, and more recently Priiess (1995) showed the marked effect of pH on metal solubility in 1.0 M NH4NO3. Cadmium retention to soils is highly pH dependent, and it has been widely observed that as soil pH falls, Cd retention decreases markedly (Garcia-Miragaya and Page 1978; Tiller et al. 1979). However, this increasing solubility of Cd at lower soil pH values did not translate into increased availability of Cd to the potato plants, as soil pH (at either planting or harvest) was unrelated to tuber Cd concentrations. It is unclear why soil pH and pH changes associated with liming have not been found to have a significant effect on tuber Cd concentrations in this and related studies (McLaughlin et al. 1994a, 1997a; Maier et al. 1997), although there are several other reports indicating soil pH and liming may have little effect on plant Cd concentrations under field conditions (Pepper et al. 1983; Andersson and Siman 1991; Sparrow et al. 1993; Li et al. 1996).
Few soil tests procedures for Cd have been calibrated or tested under commercial conditions. Indeed, early experiments (Symeonides and McRae 1977) investigating soil extractants to estimate plant-available Cd used soils that had been amended to high levels (100 mg kg"1) with Cd salts, well outside the range of concentrations found in most agricultural or even urban contaminated soils. Furthermore, Symeonides and McRrae (1977) used 3 levels of Cd addition (0, 50 and 100 mg kg"1), so that strong relationships between soil and plant Cd measurements were likely as the resulting regression relationships were highly leveraged. Rayment (1994) compared a range of Cd extractants for their relationship with potato Cd concentrations from a survey of 21 locations in Queensland (7 properties with 3 sampling locations at each site and 3 depths of sampling). For surface soils (0-10 cm), only Cd extracted by EDTA was significantly related (R2 = 0.27) to tuber Cd concentrations. Surprisingly, other extractants were either inversely related to tuber Cd, or the relationship was quadratic. Lee et al. (1996) found good correlation between soil and plant Cd measurements due to the soils being amended with Cd salts. Other workers who used unamended soils generally used only a small number of soils, mostly in glasshouse trials. For example, Andrewes et al. (1996) used 5 soils, with 3 of these having additional Cd added as fertiliser, Krishnamurti et al. (1995) used 11 soils and Whitten and Ritchie (1991) used only 3 soils with Cd availability varied by lime treatment. Most of the above studies reported strong relationships (i?2>0.8) between extractable Cd in soil and Cd levels in plants. On the other hand, studies conducted on field soils unamended with salts often find much poorer relationships. He and Singh (1993) used a wide range of soils (133) and found that Cd concentrations in oats and grasses were significantly but not strongly related (R2 = 0.21,
38

P<0.001) to Cd extracted from soils using 1.0 M NH4NO3. Garrett et al. (1998) compared 1 M NH4CI and 0.1 M Na4P2C«7 as extractants for soil Cd in a series of 34 soils in Canada to predict Cd in durum wheat grain, and found Cd extracted by both procedures could explain greater than 70% of the variation in grain Cd concentration. However, even these tests were not truly predictive in that the relationships between plant and soil Cd concentrations were determined on soil and plant samples taken at the same time (usually crop maturity). This may only lead to significant errors if soil properties controlling Cd uptake vary between the time of sampling (prior to cultivation) and the time of Cd uptake by the crop e.g. salinity introduced through irrigation, cultivation and profile mixing after sampling, pH shifts due to fertilization, etc.
In our studies, soil and irrigation water samples were taken at harvest as well as prior to planting, as we were concerned that irrigation water quality could change throughout the growing season and therefore affect the relationship between any pre-plant soil or water measurement and final tuber Cd concentration. Water quality may change due to growers changing source of supply e.g. from bore to farm dam, or due to changes in the storage itself e.g. increasing salinity in farm dams over summer due to evaporation. Soil ECs may also vary due to fertiliser management, rainfall and evapotranspiration through the crop growth cycle. Fortunately irrigation water quality did not markedly change during the season at most sites, as evidenced by the data in Fig. 1. The importance of considering potential increasing (or decreasing) salinity in irrigation water between planting and harvest is seen in the validation test, where one poor prediction (using the pre-plant water quality as a predictor) was due to a 10-fold increase in water salinity over the season.
Despite a wide range of soil test procedures being evaluated, tuber Cd concentrations were best predicted prior to planting by measuring irrigation water EC. This is a simple and inexpensive determination, yet was able to explain almost half of the variation in tuber Cd concentrations at harvest. The dominant effect of EC is through the effect of CI in the water (McLaughlin et al. 1994a), increasing the mobility of Cd in the soil/root zone (Smolders and McLaughlin 1996). The only soil test which significantly improved the prediction of tuber Cd concentrations was 0.01 M CaCl2, accounting for a further 12% of the variation in tuber Cd concentrations, with the effect more evident at lower levels of irrigation water salinity. This extractant has been used before at various strengths for extracting Cd from soils (Sauerbeck and Styperek 1985; Whitten and Ritchie 1991; Fujii et al. 1983; Rayment 1994). The advantage of this extractant over the other extractants for the soils studied here is that the CI in the extracting solution assists desorption of Cd from soil surfaces by the accompanying cation (Ca), probably mimicking the action of CI in the irrigation waters. Consideration of the ionic activity of Cd2+ in the extraction solution (McLaughlin et al. 1997b) using the technique of Fujii et al. (1983) did not improve the predictive capacity of the method. Despite the significant additional variance in tuber Cd accounted for by Cd extracted by 0.01 M CaCl2, a measure of irrigation water EC was four times more effective in predicting tuber Cd concentration. It is surprising that soil Cd was not related more strongly to tuber Cd concentrations, as salinity can only have a marked effect on Cd uptake if Cd is present in the soil and available to be mobilised by CI. Most of these soils had had prior P fertilisation over a number of years, so that enough Cd had probably already accumulated in the soil to allow the effect of salinity to be well expressed.
Despite the ability of the proposed procedure to predict the probability of exceeding tuber Cd concentrations at either the 0.05 or 0.1 mg kg"1 FW level, a significant amount (>40%) of the variation in tuber Cd concentrations remained unexplained. This may be due to other factors
39

not included in the test, such as soil texture, soil organic matter content, tuber variety or due to grower management practices not reflected by the pre-plant measurements e.g. tactical N, P or micronutrient fertilizer applications, which can all affect Cd availability to plants (McLaughlin et al. 1996). Tuber variety could be included in an assessment of Cd risk, using the rankings for Cd accumulation by commercial varieties currently available (McLaughlin et al. 1994b). However, given the very wide range of growing conditions, soils and varieties studied here, it is perhaps not surprising that a significant percentage of the variation remains unexplained, as has been found in other studies covering a similarly wide range of soils (He and Singh 1993). Nevertheless, the proposed procedure provides growers with useful information with which to select sites for potato cropping in order to minimise the risks of producing crops exceeding the chosen target values.
References
Andersson, A., and Siman, G. (1991). Levels of cadmium and some other trace elements in soils and crops as influenced by lime and fertilizer level. Acta Agriculture Scandinavica 41,3-11.
Anon. (1992). The 1992 Australian Market Basket Survey. National Food Authority.' (Australian Government Printing Service: Canberra, ACT, Australia.)
Anon. (1997). Periodic Commonwealth Gazette. Amendment to the Food Standards Code -Standard A12 - Metals and Contaminants in Food. (Australian Government Printing Service: Canberra.)
Andrewes, P., Town, R. M., Hedley, M. J., and Loganathan, P. (1996). Measurement of plant available cadmium in New Zealand soils. Australian Journal of Soil Research 34,441-52.
APHA - American Public Health Association (1992). 'Standard Methods for the Examination of Water and Wastewater.' 18th Edn. (APHA: Washington, DC.)
Brown, J. C , Tiffin, L. O. and Holmes, R. S. (1960). Competition between chelating agents and roots as factors affecting absorption of iron and other ions by plant species. Plant Physiology 35, 878-86.
Clayton, P. M., and Tiller, K. G. (1979). A chemical method for the determination of heavy metal content of soils in environmental studies. CSIRO Australia Division of Soils Technical Paper No. 41.
Colwell, J.D. (1963). The estimation of the phosphorus fertilizer requirements of wheat in southern New South Wales by soil analysis. Australian Journal Experimental and Agricultural Husbandry 3, 100-7.
Fujii, R., Hendrickson, L. L., and Corey, R. BJ (1983). Ionic activities of trace metals in sludge-amended soils. The Science of the Total Environment 28, 179-90.
Garcia-Miragaya, J., and Page, A. L. (1978). Sorption of trace quantities of cadmium by soils with different chemical and mineralogical composition. Water, Air, and Soil Pollution 9, 289-99.
Garrett, R.G., MacLaurin, A.I., Gawalko, E.J., Tkachuk, R. and Hall, G.E.M. (1998). A prediction model for estimating the cadmium content of durum wheat from soil chemistry. Journal of Geochemical Exploration (in press).
40

He, Q. B., and Singh, B. R. (1991). Assessment of plant-available cadmium in newly and old cultivated soils of Norway. International Conference, Heavy Metals in the Environment 2.
He, Q. B., and Singh, B. R. (1993). Plant availability of cadmium in soils I Extractable cadmium in newly and long-term cultivated soils. Acta Agriculture Scandinavica. Section B. Soil and Plant Science 43, 134-41.
Isbell, R. F. (1996). The Australian Soil Classification. CSIRO Publishing, Collingwood, Victoria.
Krishnamurti, G. S. R., Huang, P. M., Van Rees, K. C. J., Kozak, L. M., and Rostad, H. P. W. (1995). A new soil test method for the determination of plant-available cadmium in soils. Communications in Soil Science and Plant Analysis 26, 2857-67.
Lee, D.-Y., Chiang, P.-H., and Joung, K.-H. (1996). Determination of bioavailable cadmium in paddy fields by chelating resin membrane embedded in soils. Plant and Soil 181, 233-9.
Li Y.-M., Chaney R. L., Schneiter A. A., and Johnson B. L. (1996). Effect of field limestone on cadmium content of sunflower (Helianthus annuus L.) leaves and kernels. Plant and Soil 180, 297-302.
Lindsay, W. L. and Norvell, W. A. (1969). Equilibrium relationships of Zn2+, Fe3+, Ca2+ and H+ with EDTA and DTPA in soils. Soil Science Society of America Proceedings 33, 62-68.
Maier, N. A., McLaughlin, M. J., Heap, M., Butt, M., and Smart, M. K. (1997). Effect of current season applications of calcitic lime on pH, yield and cadmium concentration of potato (Solanum tuberosum L.) tubers . Nutrient Cycling in Agroecosystems 47, 1-12.
McCullagh, P. and Nelder, J. A. (1989). Generalised linear models (second edition). Chapman and Hall, London.
McLaughlin, M. J., Tiller, K. G., Beech, T. A., and Smart, M. K. (1994a). Soil salinity causes elevated cadmium concentrations in field-grown potato tubers. Journal of Environmental Quality 23, 1013-8.
McLaughlin, M. J., Williams, C. M. J., McKay, A., Gunton, G., Jackson, K., Dowling, B., Kirkham, R., Partington, D., Smart, M. K. and Tiller, K. G. (1994b). Effect of potato variety on cadmium accumulation in potato tubers. Australian Journal of Agricultural Research 45, 1483-95.
McLaughlin, M. J., Maier, N. A., Rayment, G. E., Sparrow, L. A., Berg, G., McKay, A., Milham, P., Merry R. H. and Smart, M. K. (1997a). Cadmium in Australian potato tubers and soils. Journal of Environmental Quality 26,1644-1649.
McLaughlin, M. J., Tiller, K. G., Naidu, R., and Stevens, D. P. (1996). Review: The behaviour and environmental impact of contaminants in fertilizers. Australian Journal of Soil Research 34, 1-54.
McLaughlin, M. J., the late Tiller, K. G., and Smart, M. K. (1997b). Speciation of cadmium in soil solution of saline/sodic soils and relationship with cadmium concentrations in potato tubers. Australian Journal of Soil Research 35, 1-17.
Mench, M., Vangronsveld, J., Didier, V., and Clijsters, H. (1994). Evaluation of metal mobility, plant availability and immobilization by chemical agents in a limed-silty soil. Environmental Pollution 86, 279.
41

Pepper, I. L., Bezdicek, D. F., Baker, A. S. and Sims, J. M. (1983). Silage corn uptake of sludge-applied zinc and cadmium as affected by soil pH. Journal of Environmental Quality 12, 270-275.
Priiess, A. (1995). Vorsorgewerte Und Prufwerte Fiir Mobile Und Mobilisierbare, Potentiaell Okotoxische Spurenelemente in Boden. PhD Thesis, Universitat Fridericana zu Karlsruhe, Wendlingen, Germany.
Rayment, G. E. (1994). Cadmium in Queensland vegetables and associated soils. MAgrSci Thesis, University of Queensland, St. Lucia, Brisbane, Australia.
Rayment, G. E., and Higginson, F. R. (1992). 'Australian Laboratory Handbook of Soil and Water Chemical Methods.' (Inkata Press: Melbourne.)
Rothamsted Experimental Station (1995). 'GENSTAT® for Windows.' (Rothamsted Experimental Station: Harpenden, UK).
Sauerbeck, D. R., and Styperek, P. (1985). The significance of soil parameters for improving the correlation between plant and soil cadmium contents. FAO European Cooperative Network on Trace Elements, Newsletter, 4th Issue. Coordinating Centre of the State Univ. Belgium, 15pp.
Smolders, E., and McLaughlin, M. J. (1996). Effect of CI and Cd uptake by swiss chard in nutrient solution. Plant and Soil 179, 57-64.
Sparrow, L. A., Salardini, A. A. and Bishop, A. C. (1993). Field studies of cadmium in potatoes (Solanum tuberosum L.). I. Effects of lime and phosphorus on cv. Russet Burbank. Australian Journal of Agricultural Research 44, 845-853.
Symeonides, C , and McRae, S. G. (1977). The assessment of plant-available cadmium in soils. Journal of Environmental Quality 6, 120-3.
Tiller, K. G., Nayyar, V. K., and Clayton, P. M. (1979). Specific and non-apecific sorption of cadmium by soil clays as influenced by zinc and calcium. Australian Journal of Soil Research 17, 17-28.
Whitten, M. G., and Ritchie, G. S. P. (1991). Calcium chloride extractable cadmium as an estimate of cadmium uptake by subterranean clover. Australian Journal of Soil Research 29, 215-21.
42

APPENDIX 2 Uptake and partitioning of cadmium and macro- and micro-nutrients in potato (Solarium tuberosum L.).
Introduction
Knowledge of nutrient and cadmium uptake and partitioning between different plant parts, nutrient and cadmium removal in the harvested portion, rate of growth and total dry matter production, is useful to develop efficient and sustainable nutrient and cadmium management strategies.
The concentration of nutrients and cadmium in plants is affected by many factors, including nutrient mobility, which need to be understood to develop an effective plant sampling procedures, and to ensure that interpretations and recommendations, based on plant test data, are valid.
The objective of this experiment was to determine the uptake and partitioning of cadmium and macro- and micro- nutrients in potato.
Materials and Methods
A glasshouse experiment was conducted at the SARDI Plant Research Centre during August -November, 1995. The experimental design was a randomized block, with 12 sampling times replicated 5 times. The cultivar grown was Pontiac.
The experimental procedure was as follows:
I. A siliceous sand from a site in the Mt Lofty Ranges (Mt Compass) was used in the experiment. The soil was air dried and sieved to <5 mm before use. To characterise the soil, a sub-sample was collected for chemical and physical analysis. For each experiment 300 mm diameter, free draining pots and 15 kg of air dry soil were used.
n. The soil from each pot was spread on a plastic sheet to <10-15 mm in depth. Basal N, P, K fertilisers, supplying equivalent to 150 kg N ha"1 (as ammonium nitrate), 100 kg P ha"1 (as single superphosphate) and 150 kg K ha"1 (as potassium sulfate), were broadcast evenly over the soil and then thoroughly mixed into the soil. Approximately two thirds of the soil was replaced into the pot.
m. Immediately prior to planting, a subsample of soil was collected from each pot for chemical analysis.
IV. Tuber seed pieces of the cv. Pontiac (one per pot) were planted on the 21st of August and covered with 2-3 cm of soil, after which the pots were placed in a glasshouse. For each pot, the remaining soil was added when the plants were 25-30 cm tall to minimize the risk of tubers developing above the soil surface.
V. Depending on stage of growth, the plants were watered 1-6 times a week using mains water. On the 8th, 18th and 29th of September and the 6th of October the plants were fertilised with Aquasol, and on the 13th, 16th and 27th of October, with potassium nitrate. The side-dressings were applied to ensure these nutrients did not limit growth or tuber yield. During growth, each plant was supported by a trellis.
43

VI. Twelve times during the growing season a plant was randomly selected from each replicate for fractionation. Plants were harvested on the 15th (first harvest), 21st and 28th of September, 5th, 12th, 19th and 26th of October and 2nd, 9th 17th
(final harvest) of October. 24th and 30th
VII. The plants were separated into tubers, stolons, stems, younger leaves (leaves 1-6) and older leaves (leaves > 6). Each fraction was rinsed in 0.1% Decon, deionised reverse osmosis water and blotted dry. Fresh and dry weights were determined prior to chemical analysis.
Chemical analysis of plant materials
Cadmium. Sub-samples (0.1 g) of the dried ground plant materials were digested with concentrated nitric acid until the digest mixture was clear. The digest solution was diluted to 10 ml using 0.016M nitric acid. All samples were digested in duplicate with blanks and internal reference materials in each batch. Cadmium concentrations in the digest solutions were determined using an atomic absorption spectrophotometer with graphite furnace atomisation and deuterium background correction. Orthophosphoric acid was used as a modifier.
Other elements. Concentrations of B, Ca, Cu, Fe, K, Mg, Mn, S and Zn in the digest solutions were determined using Inductively-Coupled Plasma Atomic Emission Spectroscopy.
Results and Discussion
1. Cadmium
1.1. Accumulation of cadmium in the plant
Cadmium accumulation was positive during the vegetative and tuber bulking periods, up to 80 days after planting (See Figure 1.1).
Dry matter product ion and Cd uptake
300
a 200
a 100
A--Dry matter
-m- cd uptake
120
100
80
60
40
20
O Q.
25 31 38 45 52 59 66 73 80 88 95 101
Days after planting
Figure 1.1. Total dry matter production and cadmium uptake. Data are for the cv. Pontiac grown in pots in a glasshouse
44

Cadmium uptake by tops+stolons+tubers parallelled growth or dry matter production for tops+stolons+tubers. The uptake of cadmium was relatively constant during the period 25-80 days after planting (Figure 1.1).
1.2 Accumulation of cadmium by different plant parts
The distribution of cadmium among the different plant parts, varied during the growing season. Data for the cv. Pontiac, show that during the period 40-50 days after planting cadmium uptake was in the order, older leaves > tubers, stems and younger leaves > stolons (see Figure 1.2). In contrast at > 80 days after planting, the order was tubers » older leaves > younger leaves > stems > stolons (Figure 1.2).
Cadmium accumulation in plant tissue
70 r
60
50
40
2 30
20
10
-»—Leaves 1-6
-•—Leaves >6
-± — Stems
-K— Stolons
-•— Tubers
* K K*—*—«
10 20 30 40 50 60 70 80 90 100 110
Days after planting
Figure 1.2. Cadmium uptake by different plant fractions. Data are for the cv. Pontiac grown in pots in a glasshouse
At the final harvest, 62.2% of the total cadmium accounted for was removed in tubers compared with only 23.3% in older leaves (leaves >6), 8.8% in younger leaves, 5.2% in stems and 0.5% in stolons. During the period 66-95 days after planting, older leaves lost 34.4% of the cadmium contained at day 66 (See Figure 1.2).
1.3 Cadmium in leaf, stem, stolon, tuber and root
Data for the cv. Pontiac, presented in Figure 1.3, show cadmium concentrations for different plant parts, and how they change relative to one another, during the growing season.
45

( ! "I
Cadmium levels in plant tissue
4.0
3.5
¥ •o 3.0 D>
o> 2.5 F
* » • •
ion
2.0
a c 1.5 <D O c o o 1.0
T) O
O.b
0.0
10 20 30 40 50 60 70 80 90 100 110
Days after planting
Figure 1.3. Cadmium concentrations in different plant parts during the growing season. Data are for the cv. Pontiac, grown in pots in a glasshouse.
During tuber bulking cadmium concentrations in the different plant parts were generally in the order: leaves > stems > stolons > tubers. (See Figure 1.3). Cadmium levels in tubers were relatively stable during the growing season. In contrast, levels in younger leaves (younger leaves) showed a consistent increase.
2. Phosphorus
2.1. Accumulation of phosphorus in the plant
Phosphorus accumulation was positive during the vegetative and tuber bulking periods (see Figure 2.1).
-A— Stems • — Stolons
-+—Tubers
46

Total dry matter production and P uptake
700
600
500 -a c
400 % CD
300 < | • o . 0)
200 2
100
0
25 31 38 45 52 59 66 73 80 88 95 101
Days after planting
Figure 2.1. Total dry matter production and phosphorus uptake. Plants were grown under an adequate phosphorus fertiliser regime. Data are for the cv. Pontiac grown in pots in a glasshouse
The data presented in Figure 2.1 for the cv. Pontiac, grown with adequate phosphorus supply, show that during the vegetative-early tuber set period (< 52 days after planting) phosphorus accumulation was more rapid than dry matter production (ie. growth). In contrast, 59-95 days after planting when rapid tuber bulking occurred, the rate of dry matter production, was greater than phosphorus accumulation. McCollum (1978) reported similar patterns of phosphorus accumulation, which was positive until at least 72 days after emergence, and the P-uptake curve lay above, but essentially parallel to, the growth curve until the plants approached maturity. Our data showed similar trends.
2.2 Accumulation of phosphorus by different plant parts
The distribution of phosphorus among the different plant parts, varied during the growing season. Data for the cv. Pontiac presented in Figure 2.2 show that 40-50 days after planting phosphorus uptake was in the order, older leaves > tubers » younger leaves (young leaves) > stems > stolons. In contrast, at > 80 days after planting, the order was tubers > » leaves, stems and stolons.
c .2
s c o •G 3
•o o
E £> D
47

Phosphorus accumulation in plant tissue
600
100
500
- • - -Leaves 1-6
500 - * - -Stems
=r p
lant
)
400 -x-
—•-
Stolons
- Tubers 3 3 E
300 -
upta
ke
200 ;
f ^ f t - -•*' -x i j t i l l i f f r i r - j l s ^ ; 10 20 30 40 50 60 70 80 90 100 110
Days after planting
Figure 2.2. Phosphorus uptake by different plant fractions. Plants were grown under an adequate phosphorus fertiliser regime. Data are for the cv. Pontiac grown in pots in a glasshouse
Older leaves (during the vegetative-early tuber bulking period) and tubers (during tuber bulking) are major sinks for phosphorus (See Figure 2.2). For example, at 101 days after planting (final harvest), 96.7% of the total phosphorus accounted for was translocated to tubers, compared with only 2.8% in leaves, 0.4% in stems and 0.1% in stolons. Christensen and Jackson (1981) for the cv. Russet Burbank, reported that the uptake of phosphorus by whole tops, leaves and roots increased as phosphorus supply increased. For 31 day old plants with adequate P supply, phosphorus uptake was in the order, whole tops > leaves > » roots. Jackson and Haddock (1959) for the cv. Russet Burbank, and Ezeta and McCollum (1972) for Solanum andigena (cv. Renacimiento), reported similar trends for phosphorus accumulation in tops and tubers. Jackson and Haddock (1959) found that tops accumulated phosphorus until 95 days after planting. Thereafter (95-152 days after planting), tops lost 45% of the phosphorus contained at 95 days. In our study with the cv. Pontiac, tops accumulated phosphorus until 45-52 days after planting and during this period, older leaves were the main sink for phosphorus. However, during the period 52-95 days after planting, older leaves (leaves >6) lost 91.7% of the phosphorus contained at day 52 (See Figure 2.2). Loss of phosphorus from vegetative tissue may be due to retranslocation from tops to tubers and leaf senescence. McCollum (1978) reported that 82% of the total phosphorus accounted for was located in tubers. Jackson and Haddock (1959) found that at the end of the season, tubers of the cv. Russet Burbank accounted for approximately 83% of the phosphorus taken up by the plant
2.3 Phosphorus uptake rates
Nutrient uptake rates by tubers depend on bulking rates and duration of the tuber bulking period. Based on data presented in phosphorus accumulation and removal for the cv. Pontiac,
48

growing tubers may accumulate phosphorus at a rate of 0.52 kg ha"1 day"1 when averaged over the tuber bulking period. Westermann (1993) presented uptake data for a range of cvv. grown in America, including: Russet Burbank, 0.41-0.59 kg ha"1 day"1; Norchip 0.34-0.48 kg ha"1
day"1; and Kennebec, 0.63-0.90 kg ha"1 day"1. Ezeta and McCollum (1972) for Solanum andigena (cv. Renacimiento), reported that tubers accumulated phosphorus at approximately 0.32 kg ha"1 day"1. Jackson and Haddock (1959) reported that for the cv. Russet Burbank, maximum absorption of phosphorus occurred 88-95 days after planting, and during this period, tubers absorbed phosphorus at 0.25 kg ha"1 day"1.
Ezeta and McCollum (1972) and Harris (1992, p. 166) have tabulated phosphorus uptake rates for different cultivars and countries.
2.4 Phosphorus in leaf, stem, stolon, tuber and root
Ezeta and McCollum (1972) for Solanum andigena (cv. Renacimiento), presented concentrations in different plant fractions, and at 116 days after planting (total growth period was 195 days) the order was, leaves > stems ~ roots+stolons+below ground stems; at 172 days the order was, leaves » tubers > roots+stolons+below ground > stems. Data for the cv. Pontiac, presented in Figure 2.4, show phosphorus concentrations for different plant parts, and how they change relative to one another, during the growing season.
Phosphorus levels in plant tissue
Figure 2.4. Phosphorus concentrations in different plant parts during the growing season. Data are for the cv. Pontiac, grown in pots in a glasshouse. Plants were grown under an adequate phosphorus fertiliser regime
During tuber initiation (25-38 days after planting), phosphorus concentration in the different plant parts were in the order: older leaves > younger leaves > stems > stolons > tubers. In contrast, 80 - 100 days after planting, concentrations were in the order, tubers > leaves and stolon > stems. Jackson and Haddock (1959) presented data showing that 74 days after planting, phosphorus concentrations in tubers were greater than in tops, particularly late in the season (116-152 days after planting). Painter (1979) also presented data showing that, late in
49

the season, phosphorus concentrations in tubers (0.29%) were greater than levels in tops (0.21%).
3. Potassium
3.1. Accumulation of potassium in the plant
Potassium accumulation was positive during the vegetative and tuber bulking periods, up to 80 days after planting. (See Figure 3.1).
Total dry matter production and K uptake
300 - 7 / W l 300
—A— Dry matter • — • — • — " ^
I25° £0
—•—K uptake / , ^ * 6000
d/6 / *—* 5000 * ~ 2 0 0 o P / •
upt ct
i
/ • * 4000 S-
| 1 5 0 Q.
f / 1 CD
| 1 5 0 Q. / -'A 3000 J g 100 / *
pla
cS jm^ 1 / 2000 3 E J*^ ~~~""#/' *m~"
& 50 v^/A^' 1000
0 ^ - - A "
r> 0
25 31 38 45 52 59 66 73 80 88 95 101
Days after planting
Figure 3.1. Dry matter production and potassium uptake by tops+stolons+tubers. Plants were grown under an adequate potassium fertiliser regime. Data are for the cv. Pontiac grown in pots in a glasshouse
Potassium uptake by tops+stolons+tubers closely paralleled growth or dry matter production for tops+stolons+tubers. The steepest portion of both curves occurred between 52 and 80 days after planting (Figure 3.1). Jackson and Haddock (1959) and Ezeta and McCollum (1972) presented similar curves for potassium uptake by tops+tubers.
3.2. Accumulation of potassium by different plant parts
The distribution of potassium among the different plant parts, varied during the growing season. Data for the cv. Pontiac, show that 40 days after planting potassium uptake was in the order, older leaves > tubers • younger leaves • stems > stolons. In contrast at > 60 days after planting, the order was tubers > » older leaves > younger leaves > stems > stolons (See Figure 3.2).
50

Potassium accumulation in plant tissue
6000
5000
Q- 4000
£ 3000 a> tg
§" 2000
1000
0 10 20 30 40 50 60 70 80 90 100 110
Days after planting
Figure 3.2. Potassium uptake by different plant fractions. Data are for the cv. Pontiac, grown in pots in a glasshouse. Plants were grown under an adequate potassium fertiliser regime
At the final harvest, 82.1% of the total potassium accounted for was removed in tubers, compared with only 14.0% in leaves; 3.8% in stems and 0.1% in stolons. Jackson and Haddock (1959) found that at the end of the season, tubers of the cv. Russet Burbank accounted for approximately 89% of the potassium taken up by the plant. Jackson and Haddock (1959) for the cv. Russet Burbank, and Ezeta and McCollum (1972) for Solanum andigena (cv. Renacimiento), reported similar trends for potassium accumulation in tops and tubers. Jackson and Haddock (1959) found that tops accumulated potassium until 95 days after planting. Thereafter (95-152 days after planting), tops lost 80% of the potassium contained at 95 days. In our study, during the period 66-95 days after planting, older leaves (leaves >6) lost 52.4% of the potassium contained at day 66 (See Figure 3.2).
3.3. Potassium uptake rates
Nutrient uptake rates by tubers depend on bulking rates and duration of the tuber bulking period. Based on data presented in potassium accumulation and removal for the cv. Pontiac, developing tubers may accumulate potassium at a rate of 4.8 kg ha"1 day"1 when averaged over the tuber bulking period. Westermann (1993) presented uptake data for a range of cultivars grown in America, including: Russet Burbank, 3.1-4.0 kg ha"1 day"1; Norchip 2.5-3.2 kg ha"1
day"1; and Kennebec, 4.6-6.1 kg ha"1 day"1. Ezeta and McCollum (1972) for Solanum andigena (cv. Renacimiento), reported that tubers accumulated potassium at approximately 5.6 kg ha"1
day"1. The maximum rate was 6.6 kg K ha"1 day"1.
Ezeta and McCollum (1972) and Harris (1992, p. 166) have tabulated potassium uptake rates for different cultivars and countries.
-•—Leaves 1-6
-•— leaves >6
-*—Stems
--X— Stolons
- •— Tubers
51

3.4. Potassium in leaf, stem, stolon, tuber and root
Ezeta and McCollum (1972) for Solanum andigena (cv. Renacimiento) presented potassium concentrations in different plant fractions. At 137 days after planting (total growth period was 195 days) the order was, leaves > stems > tubers > roots+stolons+below ground stems. Data for the cv. Pontiac, presented in Figure 3.4, show potassium concentrations for different plant parts and how they change relative to one another during the growing season.
14
12
10 s
• D
# 8 C o
V*
tra
6 r <o o c o u 4 *
2
0 10 20 30 40 50 60 70 80 90 100 110
Days after planting
Figure 3.4. Potassium concentrations in different plant parts during the growing season. Data are for the cv. Pontiac, grown in pots in a glasshouse. Plants were grown under an adequate potassium fertiliser regime
During tuber initiation and early tuber bulking stages (25-45 days after planting), potassium concentration in the different plant parts were in the order: stems » older leaves > younger leaves » stolons • tubers. In contrast, 55-90 days after planting, concentrations were higher in leaves compared with stems. Ward (1959) presented data showing that potassium concentrations in different tissues of one month old plants were in the order, stem > leaf > tuber > root. The differences were greater in plants at adequate to high plane of potassium nutrition, compared with deficient plants. Data presented by Tiwari et al. (1982) for the cv. 'Kufri Chandramkhi' grown with deficient and adequate potassium supply, show that potassium concentrations at maturity were in the order: top > tuber > root.
4. Calcium
4.1. Accumulation of calcium in the plant
Calcium accumulation was positive during the vegetative and tuber bulking periods, up to 80 days after planting. (See Figure 4.1).
52

I Dry matter production and Ca uptake
Figure 4.1. Dry matter production and calcium uptake by tops+stolons+tubers. Plants were grown under an adequate calcium fertiliser regime. Data are for the cv. Pontiac grown in pots in a glasshouse
Calcium uptake by tops+stolons+tubers parallelled growth or dry matter production for tops+stolons+tubers. The steepest portion of the calcium uptake curve occurred 39-58 days after planting (Figure 4.1). Ezeta and McCollum (1972) presented similar curves for calcium uptake by tops+tubers and dry matter production. Uptake of calcium reached a maximum of 60 kg ha"1 at 137 days after planting. After this date calcium accumulation decreased, which may have been due to leaf drop. Data presented in Figure 4.1, show that for the cv. Pontiac maximum uptake of 30.3 kg ha"1 occurred 80 days after planting.
4.2. Accumulation of calcium by different plant parts
The distribution of calcium among the different plant parts, varied during the growing season. Data for the cv. Pontiac, show that 30 days after planting calcium uptake was in the order, older leaves > stems > younger leaves • stolons • tubers. In contrast at > 70 days after planting, the order was older leaves » younger leaves » stems • tubers > stolons (See Figure 4.2).
53

Calcium accumulation in plant tissue ] 300 r
50
—•-- Leaves 1-6
250 HB~ - leaves >6
- A - -Stems '-•
plan
200 X Stolons
m —•-- Tubers 3 -rS 150 f= / 0) / .*
pta 100 M
3 y CO m O /
-+\
vf
X j^^o^,—X, „,„x-' X- -X 10 20 30 40 50 60 70 80 90 100 110
Days after planting
Figure 4.2. Calcium uptake by different plant fractions. Data are for the cv. Pontiac, grown in pots in a glasshouse. Plants were grown under an adequate calcium fertiliser regime
At the final harvest, 63.0% of the total calcium accounted for was removed in older leaves, compared with only 19.3% in younger leaves, 8.9% in tubers, 8.5% in stems and 0.3% in stolons. Ezeta and McCollum (1972) for Solanum andigena (cv. Renacimiento), reported similar trends for calcium accumulation in tops and tubers.
4.3. Calcium in leaf, stem, stolon, tuber and root
Ezeta and McCollum (1972) for Solanum andigena (cv. Renacimiento), presented concentrations in different plant fractions, the order at 137 days after planting (total growth period was 195 days) was, leaves (1.51%) > roots+stolons+below ground stems (0.92%) > stems (0.84%) » tubers (0.09%). Data for the cv. Pontiac, presented in Figure 4.3, show calcium concentrations for different plant parts, and how they change relative to one another, during the growing season.
54

Calcium levels In plant tissue
2.8
2.4
5 2.0 T3
s? 1K
c o 01
ntr
1.2 0) o c o o 0.H CO o
0.4
0.0
10 20 30 40 50 60 70 80 90 100 110 Days after planting
Figure 4.3. Calcium concentrations in different plant parts during the growing season. Data are for the cv. Pontiac, grown in pots in a glasshouse. Plants were grown under an adequate calcium fertiliser regime
During tuber initiation and early tuber bulking stages (25-40 days after planting), calcium concentrations in the different plant parts were in the order: older leaves • stems > younger leaves • stolons > tubers. In contrast, 55-90 days after planting, the order was: leaves » stems > stolons > tubers (See Figure 4.3). Painter (1979) also presented data showing that, late in the season, calcium concentrations in tubers (0.074%) were much lower than concentrations in tops (0.92%). Locascio and Rhue (1990) showed that calcium concentrations in whole tops (0.69-0.96%) sampled at early flowering were higher than concentrations in recently matured leaves (0.38-0.63%).
5. Magnesium
5.1. Accumulation of magnesium in the plant
Magnesium accumulation was positive during the vegetative and tuber bulking periods, up to 80 days after planting. (See Figure 5.1).
55

/
Dry matter production and Mg uptake 1 ^ _ J 300
—*—Dry . 400 300
matter 400
itter
pro
duct
ion
(g/p
lan
-*•
to
o o
o o
uptake / A—A~ M
g uptake (m
g/pla
o o
o o
CO
C
M
E /
100 Jl
Dry
Vr<". o 25 38 52 66 80 95
Days after planting
Figure 5.1. Dry matter production and magnesium uptake by tops+stolons+tubers. Plants were grown under an adequate magnesium fertiliser regime. Data are for the cv. Pontiac grown in pots in a glasshouse
Magnesium uptake by tops+stolons+tubers parallelled growth or dry matter production for tops+stolons+tubers. The uptake of magnesium was relatively constant during the period 25-80 days after planting (Figure 5.1). Ezeta and McCollum (1972) presented similar curves for magnesium uptake by tops+tubers and dry matter production. Uptake of magnesium reached a maximum of 31 kg ha"1 at 137 days after planting. After this date magnesium accumulation decreased, which may have been due to leaf drop. Data presented in Figure 5.1, show that for the cv. Pontiac maximum uptake of 23.0 kg ha"1 occurred 80 days after planting.
5.2. Accumulation of magnesium by different plant parts
The distribution of magnesium among the different plant parts, varied during the growing season.
Data for the cv. Pontiac, show that during the period 31-66 days after planting magnesium uptake was in the order, older leaves > stems = younger leaves • tubers > stolons. In contrast at > 73 days after planting, the order was tubers » older leaves > younger leaves = stems > stolons (See Figure 5.2).
56
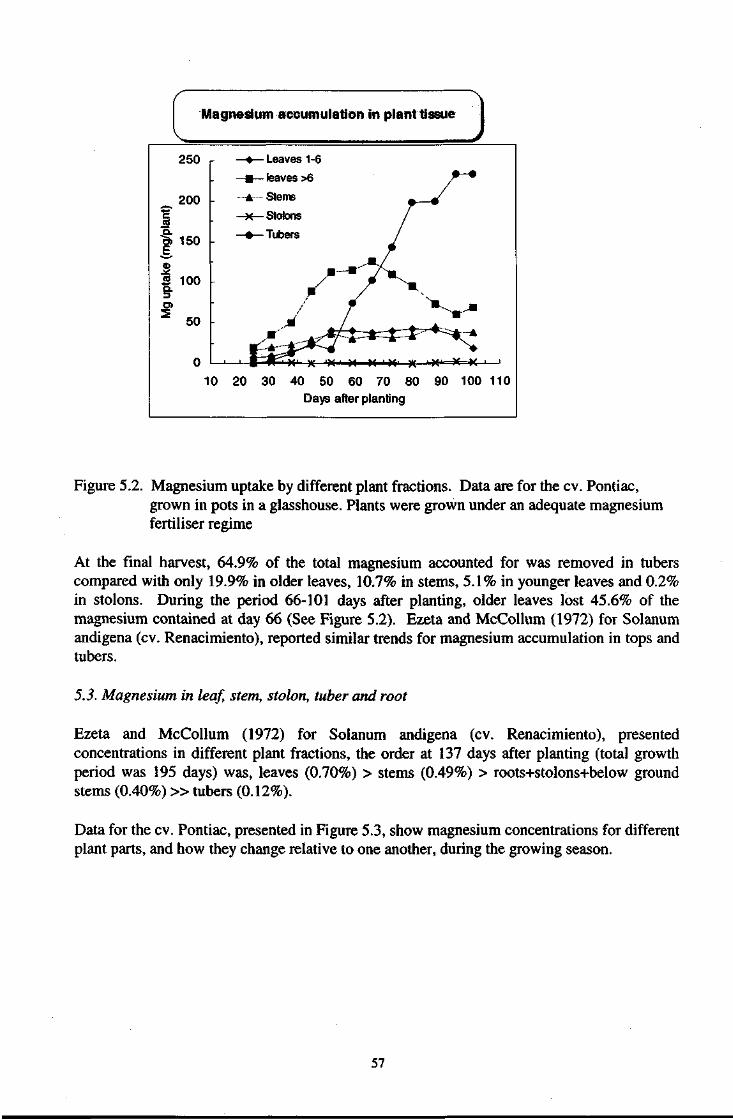
Magnesium accumulation in plant tissue J
10 20 30 40 50 60 70 80 Days after planting
90 100 110
Figure 5.2. Magnesium uptake by different plant fractions. Data are for the cv. Pontiac, grown in pots in a glasshouse. Plants were grown under an adequate magnesium fertiliser regime
At the final harvest, 64.9% of the total magnesium accounted for was removed in tubers compared with only 19.9% in older leaves, 10.7% in stems, 5.1% in younger leaves and 0.2% in stolons. During the period 66-101 days after planting, older leaves lost 45.6% of the magnesium contained at day 66 (See Figure 5.2). Ezeta and McCoUum (1972) for Solanum andigena (cv. Renacimiento), reported similar trends for magnesium accumulation in tops and tubers.
5.3. Magnesium in leaf, stem, stolon, tuber and root
Ezeta and McCoUum (1972) for Solanum andigena (cv. Renacimiento), presented concentrations in different plant fractions, the order at 137 days after planting (total growth period was 195 days) was, leaves (0.70%) > stems (0.49%) > roots+stolons+below ground stems (0.40%) »tubers (0.12%).
Data for the cv. Pontiac, presented in Figure 5.3, show magnesium concentrations for different plant parts, and how they change relative to one another, during the growing season.
57

Magnesium levels in plant tissue J 1.4 j- - • Leaves
1-6 —•— Leaves
12 >6 ---A- Stems
..A A"
"°. 1.0 5S
- —X— Stolons ^.4 A"
.2 0.8 £3
- -•—Tuber / : / J k ^ \ A x ..^
.A- A'' rf^ \ / ^ | > i | i = * - -A" / f
j i 7 * o 0.6 u c
-
-•—Tuber / : / J k ^ \ A x ..^
.A- A'' rf^ \ / ^ | > i | i = * - -A" / f
j i 7 * N | 0 . 4 5 - • - • '
0.2
00 -
0.2
00 -
10 20 30 40 50 60 70 80
Days after planting
90 100 110
Figure 5.3. Magnesium concentrations in different plant parts during the growing season. Data are for the cv. Pontiac grown in pots in a glasshouse. Plants were grown under an adequate magnesium fertiliser regime
During tuber initiation and early tuber bulking stages (25-40 days after planting), magnesium concentrations in the different plant parts were in the order: stems > leaves > stolons > tubers. In contrast, 59-80 days after planting, concentrations in stems and leaves were similar (See Figure 5.3). Painter (1979) also presented data showing that, late in the season, magnesium concentrations in tubers (0.15%) were lower than concentrations in tops (0.48%). Similarly, Carpenter (1963) found that concentrations in tubers were less than in tops, for example, 62 days after planting concentrations in tubers were in the range 0.29-0.31% compared with 1.19-1.37% in tops. Yuan (1985) reported that magnesium concentrations in vegetative tissue of the cv. Atlantic sampled one day before harvest, were higher than concentrations in tubers (1.9-2.0 vs 0.09%). Locascio and Rhue (1990) showed that magnesium concentrations in whole tops sampled at early flowering were higher than concentrations in recently matured leaves, however, the magnitude of the difference varied between years. In 1980, concentrations in whole tops were in the range 1.11-1.22% and were consistently higher than concentrations in recently matured leaves, which ranged from 0.71-0.74%. In contrast, in 1981 magnesium concentrations in whole tops (0.92-1.03%) were similar to concentrations in leaf tissue (0.85-1.08%). f
6. Sulfur
6.1. Accumulation of sulfur in the plant
Sulfur accumulation was positive during the vegetative and tuber bulking periods, up to 88 days after planting (See Figure 6.1).
58

Dry matter production and S uptake
)
300 —ir-iDry
500 300 matter
500
jlant)
-•—8 A uptake / ,><f"~*- 400
• & jy CO
•=- 200 // c c "O P / * 300 &T t ! C?
r pr
odu
K 200 | g 100 0)
3 CO y ^ ~W ' i - *
E ^S I
>. ^ * 100 O
o o 25 31 38 45 53 59 66 73 80 88 95 101
Days after planting
Figure 6.1. Dry matter production and sulfur uptake by tops+stolons+tubers. Plants were grown under an adequate sulfur fertiliser regime. Data are for the cv. Pontiac grown in pots in a glasshouse
Sulfur uptake by tops+stolons+tubers parallelled growth or dry matter production for tops+stolons+tubers. The uptake of sulfur was relatively constant during the period 53-88 days after planting (Figure 6.1).
6.2. Accumulation of sulfur by different plant parts
The distribution of sulfur among the different plant parts, varies during the growing season. Data for the cv. Pontiac, show that during the period 25-53 days after planting sulfur uptake was in the order, older leaves (leaves >6) >stems, tubers and younger leaves > stolons. In contrast, during the period 59 to 88 days after planting, the order was tubers » older leaves > younger leaves > stems ~ stolons (See Figure 6.2).
59

Sulfur accumulation in plant tissue ]
JO
E. I o.
CO
rrrHil 10 20 30 40 50 60 70 80 90 100 110
Days after planting
Figure 6.2. Sulfur uptake by different plant fractions. Data are for the cv. Pontiac, grown in pots in a glasshouse. Plants were grown under an adequate sulfur fertiliser regime
At the final harvest, 84.6% of the total sulfur accounted for was removed in tubers compared with only 10.6% in older leaves (leaves >6), 3.6% in younger leaves, 0.9% in stems, and 0.3% in stolons. During the period 59-95 days after planting, older leaves lost 62.6% of the sulfur contained at day 59 (See Figure 6.2).
6.3. Sulfur in leaf, stem, stolon, tuber and root
Data for the cv. Pontiac, presented in Figure 6.3, show sulfur concentrations for different plant parts, and how they change relative to one another, during the growing season.
60
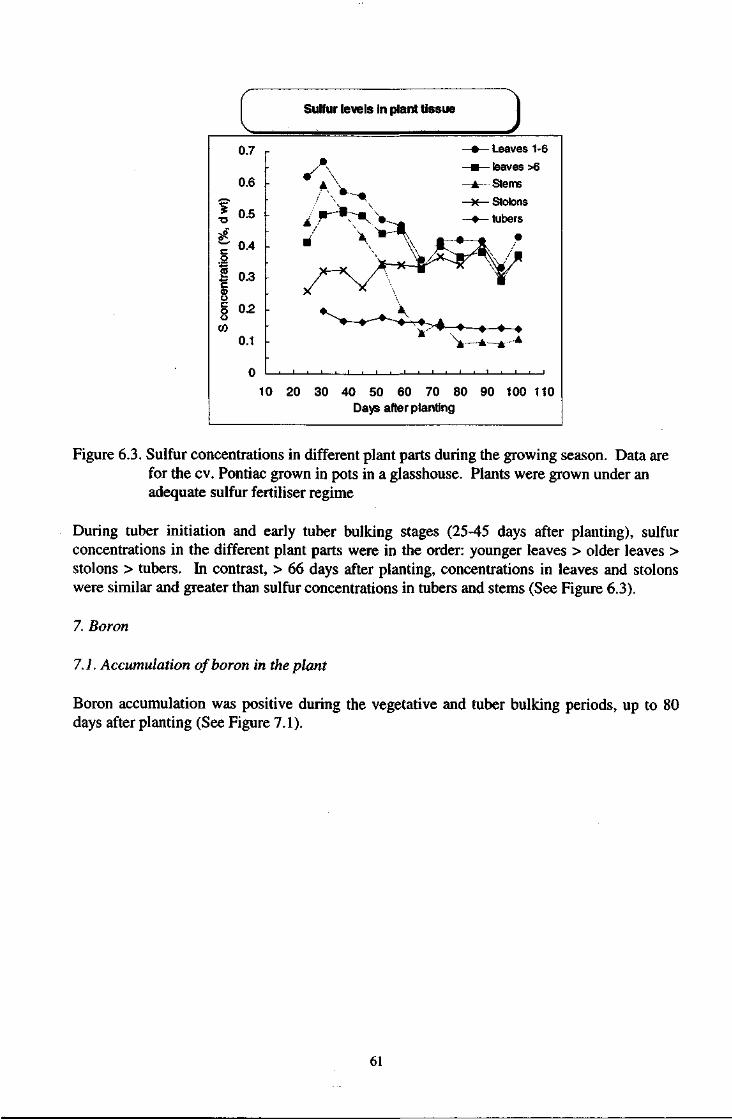
Sulfur levels in plant tissue J 0.7
0.6
0.5
0.4
0.3
0.2
0.1
Leaves 1-6
\ * - - * - *
_i i ' i i i i i i i i i i
10 20 30 40 50 60 70 80 90 100 110 Days after planting
Figure 6.3. Sulfur concentrations in different plant parts during the growing season. Data are for the cv. Pontiac grown in pots in a glasshouse. Plants were grown under an adequate sulfur fertiliser regime
During tuber initiation and early tuber bulking stages (25-45 days after planting), sulfur concentrations in the different plant parts were in the order: younger leaves > older leaves > stolons > tubers. In contrast, > 66 days after planting, concentrations in leaves and stolons were similar and greater than sulfur concentrations in tubers and stems (See Figure 6.3).
7. Boron
7.1. Accumulation of boron in the plant
Boron accumulation was positive during the vegetative and tuber bulking periods, up to 80 days after planting (See Figure 7.1).
61
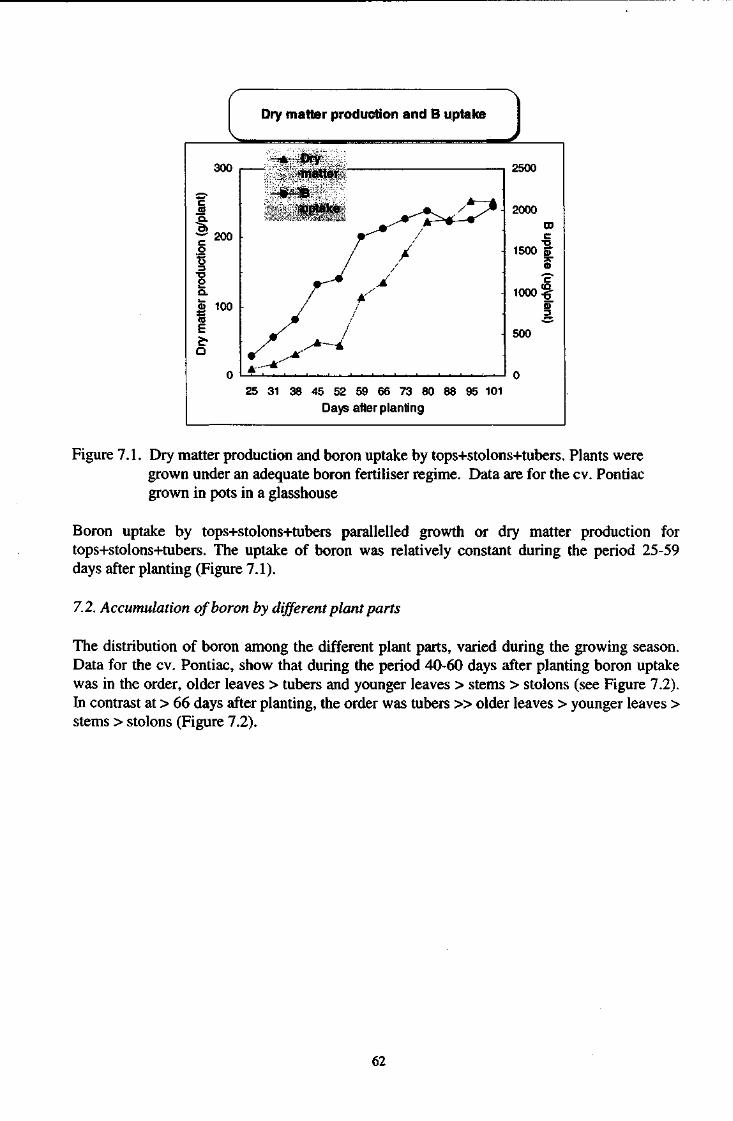
Dry matter production and B uptake ] --* Dry
300 2500 300 matter
2500
^^ - • - B la
nt
uptake ^ - - • ^ A — •
2000
* j * ^ ^ , * ~ CD * - 200 c
f ' TJ
uctio
/ > 1500 &
CD
•o *~* S • - - * ^ CQ Q.
/ * - 1000 !§• a> 100 o>
/ i 3 ce m ^J E . 500 £< / ^^~~~-4 Q m -*•'
0 trr*. 0 0
25 31 38 45 52 59 66 73 80 88 95 101
0
Days after planting
Figure 7.1. Dry matter production and boron uptake by tops+stolons+tubers. Plants were grown under an adequate boron fertiliser regime. Data are for the cv. Pontiac grown in pots in a glasshouse
Boron uptake by tops+stolons+tubers parallelled growth or dry matter production for tops+stolons+tubers. The uptake of boron was relatively constant during the period 25-59 days after planting (Figure 7.1).
7.2. Accumulation of boron by different plant parts
The distribution of boron among the different plant parts, varied during the growing season. Data for the cv. Pontiac, show that during the period 40-60 days after planting boron uptake was in the order, older leaves > tubers and younger leaves > stems > stolons (see Figure 7.2). In contrast at > 66 days after planting, the order was tubers » older leaves > younger leaves > stems > stolons (Figure 7.2).
62

Boron accumulation in plant tissue J
10 20 30 40 50 60 70 80 90 100 110
Days after planting
Figure 7.2. Boron uptake by different plant fractions. Data are for the cv. Pontiac, grown in pots in a glasshouse. Plants were grown under an adequate boron fertiliser regime
At the final harvest, 66.2% of the total boron accounted for was removed in tubers compared with only 23.7% in older leaves (leaves >6), 6.7% in younger leaves, 3.2% in stems and 0.2% in stolons. During the period 59-95 days after planting, older leaves lost 63.3% of the boron contained at day 59 (See Figure 7.2).
7.3. Boron in leaf, stem, stolon, tuber and root
Data for the cv. Pontiac, presented in Figure 7.3, show boron concentrations for different plant parts, and how they change relative to one another, during the growing season.
63

Boron levels in plant tissue J 60 r - • - Leaves 1-6
- —•— leaves >6
c- 50 -Tk—Stems f" ^ \ -*—Stolons / • ' ' * \ \
2 40 "&> E c 30
—•—Tuber * / \ " - -» Ji
I I 20 o c o o m 10
*" * * • - * -•— A • . . .
o • » • » • » • « 4 4__^
10 20 30 40 50 60 70 80 90 100 110 Days after planting
Figure 7.3. Boron concentrations in different plant parts during the growing season. Data are for the cv. Pontiac grown in pots in a glasshouse. Plants were grown under an adequate boron fertiliser regime
During tuber bulking boron concentrations in the different plant parts were in the order: leaves » stems and stolons > tubers (See Figure 7.3). Gupta et al. (1985) reported that transpiration, xylem stream and leaf venation affected the accumulation of boron in leaves. They also cited work showing that the distribution of boron was not uniform within plant parts, for example, boron accumulates in the margin of leaves. Vimala et al. (1990) for the cv. Famosa, reported that mean (sem) boron concentrations in leaves (27.1 ± 0.54 mg kg"1) and stems (22.6 ± 0.22 mg kg"1) were greater than in tubers (4.3 ±0.13 mg kg"1). Painter (1979) also presented data showing that, late in the season, boron concentrations in tubers (6 mg kg"1) were lower than concentrations in tops (26 mg kg"1). Eaton (1944) for the cv. British Queen, reported that boron levels in leaves were greater than in tubers, for example, in plants grown in solution with 1 mg B kg"1 contained 98 mg kg"1 boron in leaves and 22 mg kg"1 in tubers. Mac Vicar et al. (1946) presented data for the cvv. Triumph, Cobbler, Chippewa and Rural New Yorker which showed that mean boron concentrations in tubers were in the range 7.8-10.7 mg kg"1, depending on soil type. Rosen et al. (1991) showed that boron concentrations in recently matured leaves sampled 74 days after planting (34 or 55 mg kg"1) were greater than concentrations in tubers (5.7 or 6.4 mg kg"1). Roberts and Rhee (1990) found that boron concentrations in tops were greater than in vines, for example, in 1986 concentrations in tops were in the range 32-88 mg kg"1, compared with 4.5-12.2 mg kg"1 in tubers. Similarly in another experiment conducted in 1987, concentrations in tops were in the range 27-120 mg kg'1, compared with 4.4-9.9 mg kg"1 in tubers.
64

8. Copper
8.1 Accumulation of copper in the plant
Copper accumulation was positive during the vegetative and tuber bulking periods (See Figure 8.1).
( Dry matter production and Cu uptake )
v_ J
300 ~*—Dry 800
300
matter • 800
~# -Cu " ^ _ ^ # ^ ** uptake —s^-^t^ 600 j?
Dry
mat
ter (
g/pl
a
100
200
:/f ;
uptake (ug/plant)
o o
o o
•* C
M
o 25 31 38 45 52 59 66 73 80 88 95 101
Days after planting
Figure 8.1. Dry matter production and copper uptake by tops+stolons+tubers. Plants were grown under an adequate copper fertiliser regime. Data are for the cv. Pontiac grown in pots in a glasshouse
Copper uptake by tops+stolons+tubers parallelled growth or dry matter production for tops+stolons+tubers. The uptake of copper was relatively constant during the vegetative and tuber bulking periods. The decrease in uptake during the period 45-52 days after planting corresponded to a rapid increase in tuber bulking rate (Figure 8.1).
8.2. Accumulation of copper by different plant parts
The distribution of copper among the different plant parts, varied during the growing season.
Data for the cv. Pontiac, show that during the vegetative period copper uptake by different tissues was in the order, older leaves > younger leaves > stems and stolons. In contrast during tuber bulking and maturation periods accumulation in different tissues was in the order, tubers» older leaves > younger leaves > stems and stolons (See Figure 8.2).
65

Copper accumulation in plant tissue ]
10 20 30 40 50 60 70 80 90 100 110
Days after planting
Figure 8.2. Copper uptake by different plant fractions. Data are for the cv. Pontiac, grown in pots in a glasshouse. Plants were grown under an adequate copper fertiliser regime
At the final harvest, 85.3% of the total copper accounted for was removed in tubers compared with only 11.5% in older leaves, 0.6% in stems, 2.3% in younger leaves and 0.3% in stolons. During the period 45-95 days after planting, older leaves lost 73.0% of the copper contained at day 45 (See Figure 8.2).
Mathur and Levesque (1983) for the cv. Kennebec grown in pots, reported copper uptake associated with the highest yields were, 0.13-0.20 mg pot"1 by tops and 0.14-0.22 mg pot"1 by tubers. In the experiment with Pontiac presented in Figure 8.2, copper uptake by tops (leaves+stems) and tubers at the final harvest was 0.1 lmg pot"1 (ie. per plant) or 0.64 mg pot \ respectively. Sharma and Arodra (1992) also reported that accumulation of copper by tubers (27.8 - 30.9 g ha"1) was greater than by haulms (tops; 15.8 -18.1 g ha"1).
8.3. Copper in leaf, stem, stolon, tuber and root
Data for the cv. Pontiac, presented in Figure 8.3, show copper concentrations for different plant parts, and how they change relative to one another, during the growing season.
66

/" \ Copper levels In plant tissue 1
V 1 24 r
_ 0 _ Leaves 1-6 • " " \ —»— leaves >6
20 \ ^^ V A Stems % \ x Stolons •o16 \ d> ^ —•—Tuber .* ^ ) • 1 "-" ^ v'1 £ 1 2 c g 2 8 c 4 / \ ^ u i 4 ^^^*jg. o 3 o
o ; * - • ' ; * r * - , * r - * * . ,
1 0 20 30 40 50 60 70 80 90 100 110 Days after planting
Figure 8.3. Copper concentrations in different plant parts during the growing season. Data are for the cv. Pontiac grown in pots in a glasshouse. Plants were grown under an adequate copper fertiliser regime
During tuber initiation and early tuber bulking stages (31-52 days after planting), copper concentrations in the different plant parts were in the order: younger leaves > older leaves > stem, stolon and tuber (See Figure 8.3). In contrast, late in the season (> 80 days after planting), concentrations in the different tissues were in the order, stolons > leaves > tubers > stems. Painter (1979) presented data showing that, late in the season, copper concentrations in tubers (10 mg kg"1) were slightly higher than concentrations in tops (7 mg kg"1). Vimala et al. (1990) for the cv. Famosa, reported that mean (sem) copper concentrations in leaves (11.4 ± 0.97 mg kg"1) and stems (12.6 ±1.66 mg kg"1) were greater than in tubers (1.3 ± 0.10 mg kg"1). Locascio and Rhue (1990) showed that copper concentrations in whole tops sampled at early flowering were higher than concentrations in recently matured leaves, however, the magnitude of the difference varied between years. In 1980, concentrations in whole tops were in the range 10-11 mg kg"1 and were consistently higher than concentrations in recently matured leaves, which ranged from 4-5 mg kg"1. In contrast, in 1981 copper concentrations in whole tops (5-8 mg kg"1) were not consistently higher than concentrations in leaf tissue (4-10 mg kg" *). Rosen et al. (1991) showed that copper concentrations in recently matured leaves sampled 74 days after planting (eg. 41-162 mg kg"1) were greater than concentrations in tubers (eg. 4.8-5.7 mg kg"1).
9. Zinc
9.1. Accumulation of zinc in the plant
Zinc accumulation was positive during the vegetative and tuber bulking periods, up to 80 days after planting. (See Figure 9.1).
67

r Dry matter production and Zn uptake 1
\ _ -J --A-Dry
300 5000 300 matter 5000 nt
) - * - Z n A T - * - - * — * . pl
a uptake / ^ "*- 4000 „ , 1> f \ * ^ *~~* 3
c 200
1 / *
C
3000 & 7r
3 J / CD po 1 J "c" Q. A- ._V . , ' ' 2000 <e fc 100
plant
E ^ / / 1000 ~ £•
* ~ r < Q * ~ r < o
* ~ r < o
25 31 38 45 52 59 66 73 80 88 95 101
Days after planting
Figure 9.1. Dry matter production and zinc uptake by tops+stolons+tubers. Plants were grown under an adequate zinc fertiliser regime. Data are for the cv. Pontiac grown in pots in a glasshouse.
Zinc uptake by tops+stolons+tubers parallelled growth or dry matter production for tops+stolons+tubers. The uptake of zinc was relatively constant during the period 52-80 days after planting (Figure 9.1). Tiwari and Dwivedi (1991) for the cv. Kufri Chandramukhi, concluded that total zinc uptake followed a similar pattern to dry matter production.
9.2. Accumulation of zinc by different plant parts
The distribution of zinc among the different plant parts, varied during the growing season.
Data for the cv. Pontiac, show that during the period 25-52 days after planting, zinc uptake was in the order, older leaves >stems, younger leaves and tubers > stolons. In contrast at > 52 days after planting, the order was tubers > » older leaves = stems > younger leaves > stolons (See Figure 9.2).
68

Zinc accumulation in plant tissue ] I I f
!
4000
3500
3000
2500
2000
1500
1000
500
0 &"~X i-K ft- -
10 20 30 40 50 60 70 80 90 100 110 Days after planting
Figure 9.2. Zinc uptake by different plant fractions. Data are for the cv. Pontiac, grown in pots in a glasshouse. Plants were grown under an adequate zinc fertiliser regime
At the final harvest, 80.7% of the total zinc accounted for was removed in tubers compared with only 9.7% in older leaves, 6.9% in stems, 2.5% in younger leaves and 0.2% in stolons. During the period 45-101 days after planting, older leaves lost 40.8% of the zinc contained at day 45 (See Figure 9.2). Yuan et al. (1985) for the cv. Atlantic, reported that total zinc uptake by tubers was 120 or 180 g ha"1, compared with uptake by vegetative tissue of 220 or 260 g ha"
Smith (1977) cited work showing that redistribution of zinc and other trace elements commenced after flowering and at harvest tubers accounted for 48.8-69.8% of the total zinc in the plant. Tiwari et al. (1982) for the cv. 'Kufri Chandramkhi', reported a mean total zinc uptake of 362.4 g ha"1, of this 48, 32 and 20% was accounted for by tuber, top and root. Christensen and Jackson (1981) found that depending on phosphorus and zinc supply, zinc uptake by potato leaves ranged from 13 to 50 u g plant"1, and by total tops from 25 to 89 ng plant"1. Jackson and Carter (1976) for the cv. Russet Burbank, reported that zinc uptake ranged from 0.15 to 0.69 mg plant"1 depending on the fertiliser applied and placement. Trehan and Grewal (1984) used pot experiments to determine zinc deficiency and toxicity limits for the cv. Kufri Chandramukhi. They found that the uptake of zinc was in the range 1.22-3.17 mg pot"1 during summer and 0.88-2.43 mg pot"1 during winter. Tiwari and Dwivedi (1991) for the cv. Kufri Chandramukhi, showed that zinc uptake by tubers depended on soil zinc status and rate of zinc applied. For soils low in zinc ^O.emgkg" 1 DTPA-Zn), zinc uptake ranged from 103.6 to 173.5 g ha"1 depending on the rate of zinc applied, at medium soil zinc status (0.6-1.0 mg kg"1 DTPA-Zn), it ranged from 194.8 to 229.9 g ha"1, and for soils high in zinc (>1.0 mg kg"1 DTPA-Zn), from 214.2 to 232.6 g ha"1. Sharma and Grewal (1988) also for the cv. Kufri Chandramukhi, grown on an alluvial sandy loam (Ustochrept; pH7.7-7.9), found that zinc uptake by tubers was in the range 39.7-67.0 g ha"1, depending on the micronutrient applied (Zn, Mn, Fe or Cu) or the method of application (soil, spray or seed soaking). The minimum uptake was 35.8 g Zn ha'1 in the control plots. Sharma and Arodra (1992) for the cv. Kufri Chandramukhi, showed that zinc uptake by tubers (77-151 g ha"1) was greater than uptake by haulms (20-28 g ha"1).
69

9.3. Zinc in leaf, stem, stolon, tuber and root
Data for the cv. Pontiac, presented in Figure 9.3, show zinc concentrations for different plant parts, and how they change relative to one another, during the growing season.
Zinc levels in plant tissue J 180 r- —•Leaves 1-6
_ 160
-D 140 d>
* 12° *•" 100 c o is so
-
A
/ V v
—•— Leaves >6
* Stems
—K— Stolons
• Tubers
* *
8 60 u
I 40 15 20
-
* ^ ^ « ^ - ^ * ^ * -•"—-#-— •'"'
o - • • IT T ~^_
10 20 30 40 50 60 70 Days after planting
80 90 100 110
Figure 9.3. Zinc concentrations in different plant parts during the growing season. Data are for the cv. Pontiac grown in pots in a glasshouse. Plants were grown under an adequate zinc fertiliser regime.
During the vegetative and tuber bulking stages, zinc concentrations in stems were greater than concentrations in leaves and stolons (See Figure 9.3). Overall, concentrations were lowest in tubers. The sudden decrease in stem zinc concentration 52-59 days after planting corresponded with the onset of rapid tuber bulking, see accumulation of zinc in the plant and accumulation of zinc by different plant parts. Vimala et al. (1990) for the cv. Famosa, reported that mean (sem) zinc concentrations in leaves (157.3 + 3.31 mg kg"1) and stems (84.8 ± 1.79 mg kg"1) were greater than in tubers (12.1 ± 0.32 mg kg"1). Painter (1979) presented data showing that, late in the season, zinc concentrations in tubers (18 mg kg"1) were less than concentrations in tops (24 mg kg"1). Yuan et al. (1985) for the cv. Atlantic, found that zinc concentrations in tops, sampled one day before harvest, (192 or 197 mg kg"1) were greater than concentrations in tubers (22 or 25 mg kg"1). Locascio and Rhue (1990) showed that zinc concentrations in whole tops sampled at early flowering were lower than concentrations in recently matured leaves, however, the magnitude of the difference varied between years. In 1980, concentrations in whole tops were in the range 36-42 mg kg"1 and were consistently lower than concentrations in recently matured leaves, which ranged from 49-68 mg kg"1. In contrast, in 1981, zinc concentrations in whole tops (34-50 mg kg"1) were not consistently lower than concentrations in leaf tissue (38-42 mg kg'1). Rosen et al. (1991) showed that zinc concentrations in recently matured leaves sampled 74 days after planting (eg. 17-19 mg kg"1) were greater than concentrations in tubers (eg. 8.8-14.5 mg kg"1). Data presented by Tiwari et al. (1982) for the cv. 'Kufri Chandramkhi' gfown with adequate potassium and zinc supply,
70

show that zinc concentrations at maturity were slightly higher in tubers (50.8-61.0 mg kg"1) compared with tops (45.2-50.0 mg kg"1) and roots (43.7-51.0 mg kg"1). Boawn and Leggett (1964) reported zinc levels in roots, stems and leaves (4th or 5th) of the cv. Russet Burbank. When zinc supply was adequate, the order was roots (41 or 55 mg kg"1) > stems (20 or 21 mg kg"1) > leaves (16 or 17 mg kg"1). In plants showing severe deficiency symptoms, zinc concentration in roots (32 mg kg"1) was greater than concentrations in stems (17 mg kg"1) and leaves (17 mg kg"1).
Trehan and Grewal (1983) for the cv. Kufri Chandramukhi, reported that the distribution of zinc between different plant parts varied with zinc and phosphorus supply. They found that at low P, zinc levels in the plant were highest in the roots (98 mg kg"1), intermediate in stem and leaves (56 mg kg"1) and lowest in nodes (43 mg kg"1). With increasing P supply, zinc concentrations increased in roots, stems and nodes but decreased in leaves.
Soltanpour et al. (1970) for the cv. Russet Burbank, presented zinc levels in leaf (4th and 5th from the top) and stem (3rd to 6th node from the top) tissue. Differences in zinc levels between the two tissues appears to depend on the source and rate of zinc used and method of placement. For example, at location 7 and using ZnEDTA as the source, for the band placement, zinc levels in stems (33-42 mg kg"1) were greater than in leaves (25-28 mg kg"1) For the disc application, the differences in concentrations between stem (24-30 mg kg"1) and leaf (23-28 mg kg"1) tissues was less. Omran et al. (1991) reported zinc levels in leaves (sampled late in the season) and mature tubers of the cv. King Edward. For winter crops, concentrations in leaves were in the range 23-70 mg kg"1, and in tubers, 11-45 mg kg"1. For summer crops, the ranges were 17-40 mg kg'1 in leaves and 12-36 mg kg"1 in tubers.
10. Manganese
10.1. Accumulation of manganese in the plant
Manganese accumulation was positive during the vegetative and tuber bulking periods, up to 80 days after planting (See Figure 10.1).
Manganese uptake by tops+stolons+tubers parallelled growth or dry matter production for tops+stolons+tubers. The uptake of manganese was relatively constant during the period 25-66 days after planting (Figure 10.1).
10.2. Accumulation of manganese by different plant parts
The distribution of manganese among the different plant parts, varied during the growing season.
Data for the cv. Pontiac, show that during the period 25-38 days after planting, manganese accumulation in the different tissues was in the order, older leaves > younger leaves and stems > tubers and stolons (See Figure 10.2). In contrast, during the period 52-95 days after planting, manganese had accumulated rapidly in the older leaves and the order was, older leaves » younger leaves > tubers > stems » stolons (Figure 10.2).
71

Dry matter production and Mn uptake
V 1 300 r
200
c
§ c o '•§ 3 o S 100 CO
E £< Q
±11 J 1 I I L 4 1 I I 1 I 1 I I I I 1 U
7000
6000
5000 =
4000 §•
3000 4
2000 §
-j 1000
0
25 31 38 45 52 59 66 73 80 88 95 101
Days after planting
Figure 10.1. Dry matter production and manganese uptake by tops+stolons+tubers. Plants were grown under an adequate manganese fertiliser regime. Data are for the cv. Pontiac grown in pots in a glasshouse
Manganese accumulation in plant tissue J c a
•8 _3_
CO
(0
Q .
C
4500 4000 ' Leaves 1-6
— leaves >6 3 5 0 0 I" ^Ster rs 3000 I- —K— Stolons
2500
2000
1500
1000
500
0
•J—-—•
'V -4— Tubers
10 20 30 40 50 60 70 80 90 100 110 Days after planting
Figure 10.2. Manganese uptake by different plant fractions. Data are for the cv. Pontiac, grown in pots in a glasshouse. Plants were grown under an adequate manganese fertiliser regime
At the final harvest, only 19.1% of the total manganese accounted for was removed in tubers compared with 56.8% in older leaves, 14.3% in younger leaves, 9.7% in stems and 0.1% in stolons. During the period 66-95 days after planting, older leaves lost 27.2% of the manganese contained at day 66 (See Figure 10.2). Yuan et al. (1985) for the cv. Atlantic,
72

reported that total manganese uptake by tubers was 20 or 40 g ha"1, compared with uptake by vegetative tissue of 620 or 750 g ha"1. Sharma and Grewal (1988) also for the cv. Kufri Chandramukhi, grown on an alluvial sandy loam (Ustochrept; pH 7.7-7.9), found that manganese uptake by tubers was in the range 68.1-89.9 g ha"1, depending on the micronutrient applied (Zn, Mn, Fe or Cu) or the method of application (soil, spray or seed soaking). The minimum uptake was 67.3 g Mn ha"1 in the control plots. Vimla et al. (1990) for the cv. Famosa, reported that removal of manganese by different plant parts was in the order leaves (648.2 g ha"1) > stems (205.5 g ha"1) > tubers (25.8 g ha"1).
10.3. Manganese in leaf, stem, stolon, tuber and root
Data for the cv. Pontiac, presented in Figure 10.3, show manganese concentrations for different plant parts, and how they change relative to one another, during the growing season.
Manganese levels in plant tissue J
ri>
1 o c o o
360 _ 0 _ Leaves 1-6
320 -m--A-
Leaves >6 X ' N .
Stems W^\^*\ 280
240
- X -
- —•-
- Stolons H. / mS t
-Tubers / " » — » - " 5 ' /
200 " rf / A
160
120 -A'' / * \ / A
80
40
n
10 20 30 40 50 60 70 80 90 100 110 Days after planting
Figure 10.3. Manganese concentrations in different plant parts during the growing season. Data are for the cv. Pontiac grown in pots in a glasshouse. Plants were grown under an adequate manganese fertiliser regime.
During the period 25-31 days after planting, manganese concentrations in the different plant parts were in the order: older leaves > stems> younger leaves > stolons > tubers. In contrast, 45-101 days after planting, concentrations were in the order: older leaves > younger leaves > stems > stolons > tubers (See Figure 10.3). Painter (1979) presented data showing that, late in the season, manganese concentrations in tubers (7 mg kg"1) were lower than concentrations in tops (32 mg kg"1). Vimala et al. (1990) for the cv. Famosa, reported that mean (sem) manganese concentrations in leaves (1216.8 ± 26.4 mg kg"1) and stems (368.3 ± 10.3 mg kg"1) were greater than in tubers (6.8 ± 0.2 mg kg"1). Locascio and Rhue (1990) showed that manganese concentrations in whole tops sampled at early flowering were higher than concentrations in recently matured leaves, however, the magnitude of the difference varied
73

between years. In 1981, concentrations in whole tops were in the range 37-70 mg kg" and were consistently higher than concentrations in recently matured leaves, which ranged from 22-37 mg kg"1, hi contrast, in 1980, manganese concentrations in whole tops (30-46 mg kg'1) were not consistently higher than concentrations in leaf tissue (24-43 mg kg"). Rosen et al. (1991) showed that manganese concentrations in recently matured leaves sampled 74 days after planting (eg. 71-85 mg kg"1) were greater than concentrations in tubers (eg. 10.7-12.3 mg kg"1). Yuan et al. (1985) for the cv. Atlantic, found that manganese concentrations in tops, sampled one day before harvest, (472 or 650 mg kg"1) were greater than concentrations in tubers (4 or 5 mg kg"1). Lee (1972) for the cv. Netted Gem, reported manganese levels in upper tops (top of the plant down to and including the third mature leaf), lower plant tops (remaining portion down to the base of the stem) and roots. Concentrations were in the order, roots > lower tops > upper tops. For example, for the 2 mg kg"1 Mn treatment, concentrations in the different plant parts were roots, 10,004 mg kg"1, lower tops, 4,173 mg kg"1 and upper tops, 2,431 mg kg"1. Bolle-Jones (1955) for the cv. Majestic (1950 experiment), presented mean manganese concentrations for different plant parts namely, laminae, 59 mg kg"1; stems and petioles, 68 mg kg"1; tubers, 11.0 mg kg"1; and roots, 199 mg kg"1.
References
Boawn, L. C , and Leggett, G. E. (1964). Phosphorus and Zinc Concentrations in Russet Burbank Potato Tissues in Relation to Development of Zinc Deficiency Symptoms. Soil Science Society of America Proceedings. 28,229-232.
Bolle-Jones, E. W. (1955). The effect of varied nutrient levels on the concentration and distribution of manganese within the potato plant. Plant and Soil 6,43-60.
Bouma, D. (1983). Diagnosis of mineral deficiencies using plant tests. In "Encyclopedia of Plant Physiology, New Series Volume 15 A, Inorganic Plant Nutrition". (Eds. A Lauchli and R.L. Bieleski). Springer-Verlag: Berlin, pp. 120-46.
Carpenter, P. N. (1963). Mineral accumulation in potato plants as affected by fertilizer application and potato variety. Bulletin 610. Maine Agricultural Experiment Station, University of Maine.
Christensen, N. W., and Jackson, T. L. (1981). Potential for phosphorus toxicity in zinc stressed corn and potato. Soil Science Society of America, Journal 45,904-909.
Dunn, L. E., and Rost, C. O. (1948). Effect of fertilizers on the composition of potatoes grown in the Red River Valley of Minnesota. Soil Science Society of America, Proceedings 13, 374-379.
Eaton, F. M. (1944). Deficiency, Toxicity and Accumulation of Boron in Plants. Journal of Agricultural Research. 69,237-277.
Ezeta, F. N. and, McCollum, R. E. (1972). Dry-matter production, and nutrient uptake and removal by Solanum andigena in the Peruvian Andes. American Potato Journal 49, 151-163.
74

Gupta, U. C , Jame, Y. W., Campbell, C. A., Leyshon, A. J. and Nicholaichuk, W. (1985). Boron Toxicity and Deficiency: A Review. Canadian Journal of Soil Science. 65,381-409.
Harris, P. M. (1992). Mineral Nutrition. In "The Potato Crop. The Scientific Basis for Improvement." (Ed. P. M. Harris), Second Edition, Chapman & Hall, London.
Jackson, R. D., and Haddock, J. L. (1959). Growth and Nutrient Uptake of Russet Burbank Potatoes. American Potato Journal 36,22-28.
Jackson, T. L., and Carter, G. E. (1976). Nutrient Uptake by Russet Burbank Potatoes as Influenced by Fertilisation. Agronomy Journal. 68,9-12.
Lee, C. R. (1972). Interrelationships of aluminium and manganese on the potato plant. Agronomy Journal 64, 546-549.
Locascio, S. J., and Rhue, R. D. (1990). Phosphorus and Micronutrient Sources for Potato. American Potato Journal. 67,217-226.
MacVicar, R., Tottingham, W.E., and Rieman, G.H. (1946). Boron Supply and BoronContent of Potatoes. Soil Science. 62,337-340.
Maier, N. A., Heap, M., Butt, M., McLaughlin, M. J., and Smart, M. (1995). Development of crop management strategies for improved productivity and quality of potatoes grown on highly acid soils. HRDC Final Report.
Mathur, S. P., and Levesque, M. P. (1983). Effect of Liming on the Yield, Nutrition and Copper Status of Potatoes, Carrots and Onions grown sequentially in two Peat Soils. Canadian Journal of Soil Science. 63,229-244.
McCollum, R. E. (1978). Analysis of potato growth under different P regimes. 1. Tuber yields and allocation of dry matter and P. Agronomy Journal 70, 51-57.
Omran, M. S., Waly, T. M., El-Shinnawi, M. M., and El-Sayed, M. M. (1991). Effect of macro- and micro-nutrients application on yield and nutrients content of potatoes. Egyptian Journal of Soil Science. 31, 27-42.
Painter, C. G. (1979). Nutrient use by potato vines and tubers. Current Information Series No. 470. College of Agriculture, University of Idaho.
Roberts, S., and Rhee, J. K. (1990). Boron utilization by potato in nutrient cultures and in field plantings. Communications in Soil Science and Plant Analysis 21,921-932.
Rosen, C , Lauer, F., Birong, D. and America, L. (1991). Nitrogen and boron utilization by potato: effects on tuber quality and implications for groundwater quality. Minnesota Agricultural Experimental Station Miscellaneous Publication No. 71, pp. 23-40.
Sharma, U. C , and Arodra, B. R. (1992). Uptake of zinc, manganese, iron and copper by potato as affected by applied potassium. Madras Agricultural Journal 79,250-255.
75
Sharma, U. C , and Grewal, J. S. (1988). Relative effectiveness of methods of micronutrient application to potato. Journal of the Indian Society of Soil Science 36,128-132.
Smith, O. (1977). Potatoes: Production, Storing, Processing. Second Edition. The Avi Publishing Company, Inc. Westport, Connecticut, pp. 269-271.
Soltanpour, P. N., Reuss, J. O., Walker, J. G., Heil, R. D., Lindsay, W. L., Hansen, J. C , and Relyea, A. J. (1970). Zinc experiments on potatoes in the San Luis Valley of Colorado. American Potato Journal. 47,435-443.
Tiwari, K. N., and Dwivedi, B. S. (1991). Effect of native and fertiliser zinc on the tuber yield and zinc uptake by potato in Udic Ustochrepts of Uttar Pradesh. Journal of the Indian Society of Soil Science 39,396-398.
Tiwari, K. N., Nigam, V., and Pathak, A. N. (1982). Effect of Potassium and Zinc Applications on Dry-matter Production and Nutrient Uptake by Potato Variety "Kufri chandramukhi" (Solanum tuberosum L.) in an Alluvial Soil of Uttar Pradesh. Plant and Soil. 65,141-147.
Trehan, S. P., and Grewal, J. S. (1983). Zinc-phosphorus interaction in potato. Indian J. Ecol. 10, 215-222.
Trehan, S. P., and Grewal, J. S. (1984). Deficiency and Toxicity Limits of Zinc and Copper for Potato in Acidic Hill Soils of Simla. Fertiliser News. 29,33-36.
Vimala, P., Yeong, N. H., and Shukor, N. (1990). Nutrient removal studies on potato (Solanum tuberosum). MARDI Res. J. 18,267-72.
Ward, G. M. (1959). Potassium in plant metabolism. II. Effect of potassium upon the carbohydrate and mineral composition of potato plants. Canadian Journal of Plant Science 39, 246-252.
Westermann, D. T. (1993). Fertility Management. In: Potato Health Management. (Ed. R.C. Rowe), APS Press, USA. pp 77-86.
Yuan, T. L., Hensel, D. R., Mansell, R. S., and Rhue, (1985). Yield and nutrient content of potato on a sandy Humaquept with high levels of accumulated Ca and P. Proceedings of the Soil and Crop Science Society of Florida 44,68-71.
76

APPENDIX 3 Effect of sulfate on cadmium uptake by plants in solution culture
Introduction
Cadmium uptake by potatoes is now known to be enhanced by high chloride (CI) concentrations in irrigation water. Salinity in irrigation water may also be due to high concentations of sulfate (SO42). A visiting student from Wageningen Agricultural University in the Netherlands, Rose-Marie Lambrechts, and a visiting Postdoctoral Fellow from the Catholic University of Leuven in Belgium, collaborated with this project to investigate if SO42" salinity has the same effect on plant Cd uptake as CI. Swiss chard, was used as an indicator species, to keep minimise experimentation times.
In solution, increasing concentrations of CI lead to reductions in activity of the free Cd ion (Cd2+), so that increasing CI" salinity should reduce Cd uptake by plants, in addition to any effects of increased ionic strength on root function. Recently, solution culture experiments have demonstrated that increasing concentrations of CI in solution indeed reduce Cd uptake by plants, but not to the extent predicted by reductions in Cd2+ activity (Smolders and McLaughlin, 1996a). In experiments where activities of Cd2+ were constant across increasing CI concentrations using organic ligands or chelex resins to buffer Cd2+ (Smolders and McLaughlin, 1996a; Smolders and McLaughlin, 1996b), Cd uptake by plants was increased by CI, suggesting that chloro-complexes of Cd were either transported across the plasma membrane or helped to overcome a diffusional limitation to uptake of Cd2+.
As S0 4 is also a component of irrigation waters and soil solutions, and as S0 4 may also reach concentrations in soil solution sufficient to significantly complex Cd2+ (McLaughlin et al., 1997), it is important that the effects of SO4 complexation on Cd uptake by plants be understood. This paper presents data on the effect of S04 on Cd uptake in nutrient solution where interactions with soil are excluded, and Appendix 4 details experiments using soil-grown plants.
Materials and methods
Plant growth - nutrient solution experiments
Seeds of Swiss chard (Beta vulgaris L., cv. Fordhook Giant) were moistened with tap water and allowed to germinate in the dark (25 °C). Seedlings were transplanted to 8.3-L pots containing continuously aerated complete nutrient solutions. Solution composition was the same as the basic nutrient solution described by Smolders and McLaughlin (1996a).
During the initial growth period no Cd was added. At 9 days after sowing (DAS), seedlings were thinned to about 12 per pot prior to imposing experimental SO4 treatments (see below). Activities of Fe3+ in solution were buffered using N,N'-bis(2-hydroxybenzyl)-ethylenediamine-N,N'-diacetate (HBED) because of its high selectivity for Fe3+ compared to Cd2+ (Martell and Smith, 1974). HBED was prepared as an 8 raM stock solution according to Chaney (1988) from HBED (acid form) and a 10 % molar excess FeCl3 to ensure that virtually no free HBED was left in solution. The pH of all solutions was adjusted to 6.10 ± 0.1 and maintained at this pH during plant growth using MES buffer to avoid pH effects on Cd uptake
77
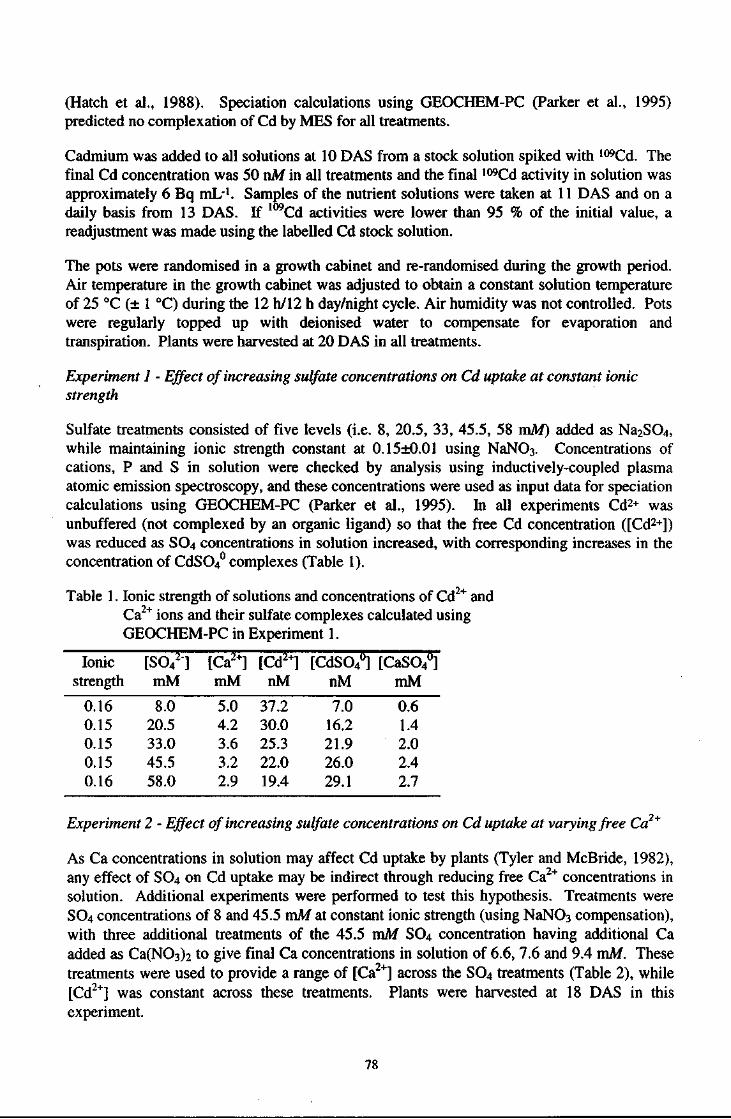
(Hatch et al., 1988). Speciation calculations using GEOCHEM-PC (Parker et al., 1995) predicted no complexation of Cd by MES for all treatments.
Cadmium was added to all solutions at 10 DAS from a stock solution spiked with 109Cd. The final Cd concentration was 50 nM in all treatments and the final 109Cd activity in solution was approximately 6 Bq ml/1. Samples of the nutrient solutions were taken at 11 DAS and on a daily basis from 13 DAS. If 109Cd activities were lower than 95 % of the initial value, a readjustment was made using the labelled Cd stock solution.
The pots were randomised in a growth cabinet and re-randomised during the growth period. Air temperature in the growth cabinet was adjusted to obtain a constant solution temperature of 25 °C (± 1 °C) during the 12 h/12 h day/night cycle. Air humidity was not controlled. Pots were regularly topped up with deionised water to compensate for evaporation and transpiration. Plants were harvested at 20 DAS in all treatments.
Experiment 1 - Effect of increasing sulfate concentrations on Cd uptake at constant ionic strength
Sulfate treatments consisted of five levels (i.e. 8, 20.5, 33, 45.5, 58 mM) added as Na2S04, while maintaining ionic strength constant at 0.15±0.01 using NaNC«3. Concentrations of cations, P and S in solution were checked by analysis using inductively-coupled plasma atomic emission spectroscopy, and these concentrations were used as input data for speciation calculations using GEOCHEM-PC (Parker et al., 1995). In all experiments Cd2+ was unbuffered (not complexed by an organic ligand) so that the free Cd concentration ([Cd2+]) was reduced as SO4 concentrations in solution increased, with corresponding increases in the concentration of CdSC«40 complexes (Table 1).
Table 1. Ionic strength of solutions and concentrations of Cd2+ and Ca2+ ions and their sulfate complexes calculated using GEOCHEM-PC in Experiment 1.
Ionic" [SO42] [Ca2+] [Cd2+] [CdSO40] [CaSO4
0] strength mM mM nM nM mM
0.16 8.0 5.0 37.2 7.0 0.6 0.15 20.5 4.2 30.0 16.2 1.4 0.15 33.0 3.6 25.3 21.9 2.0 0.15 45.5 3.2 22.0 26.0 2.4 0.16 58.0 2.9 19.4 29.1 2.7
Experiment 2 - Effect of increasing sulfate concentrations on Cd uptake at varying free Ca +
As Ca concentrations in solution may affect Cd uptake by plants (Tyler and McBride, 1982), any effect of SO4 on Cd uptake may be indirect through reducing free Ca2+ concentrations in solution. Additional experiments were performed to test this hypothesis. Treatments were SO4 concentrations of 8 and 45.5 mM at constant ionic strength (using NaN03 compensation), with three additional treatments of the 45.5 mM SO4 concentration having additional Ca added as Ca(NOs)2 to give final Ca concentrations in solution of 6.6, 7.6 and 9.4 mM. These treatments were used to provide a range of [Ca2+] across the S0 4 treatments (Table 2), while [Cd2+] was constant across these treatments. Plants were harvested at 18 DAS in this experiment.
78

Table 2. Concentrations of total Ca, free Ca , free Cd + ions and their sulfate complexes calculated using GEOCHEM-PC in Experiment 2.
Ionic! [SO42] [NCV] [CaT]a [Ca2+] [Cd2+] [CdS04°] [CaS04°] strength mM nM mM mM nM nM mM
0.14 8.0 108.0 5.6 4.9 37.0 7.7 0.6 0.15 45.5 33.0 5.6 3.2 22.0 26.0 2.4 0.15 45.5 35.0 6.6 3.8 22.1 25.8 2.8 0.16 45.5 36.9 7.6 4.4 22.1 25.7 3.2 0.16 45.5 40.5 9.4 5.5 22.6 25.2 3.9
a CaT = total Ca concentration in solution
Analyses
At harvest, plants were divided into shoots and roots. Roots were blotted dry and individual shoot and root fresh weight was recorded. Root samples were washed for 30 min in a 200 mL CaCl2 (10 mM) and Cd(N03)2 (10 uM) solution prior to oven drying. This wash was included to desorb extracellular (non-absorbed) 109Cd. In a preliminary experiment, 109Cd efflux from roots was measured as a function of washing time and found to be virtually complete after 30 min washing (Smolders and McLaughlin, 1996a).
Shoots and roots of all plants (12) grown in each pot were pooled and oven dried (70 °C). Dried shoot samples were weighed and ground in a mortar. 109Cd activity in duplicate subsamples of the ground material was determined in a Phillips 4800 gamma counter. Dried roots were transferred into counting vials and ,09Cd activity determined without prior grinding. Geometry effects on counting efficiency and absorption of the radiation by the plant material were found to be negligible. The average coefficient of variation between these analytical duplicates was about 2 %. Stable Cd was measured in HN03 digests of some shoot samples by flameless atomic absorption spectrophotometry to confirm Cd concentrations determined from activities of 109Cd.
Statistical analysis
Treatment effects were analysed by linear regression analyses using solution SO4 as the independent variable. Cadmium speciation in selected treatment solutions was calculated using GEOCHEM-PC (Parker et al., 1995). As ionic strengths were the same in all treatments, solution ion activities were directly proportional to solution ion concentrations across treatments. The formation constant (log K) used for the CdS04° species was 2.45 (Lindsay, 1979).
Results
Plant root and shoot dry weights were unaffected by sulfate treatments in both experiments (Figure 1).
Similarly, plant dry weights were unaffected by Ca treatments in Experiment 2 (data not shown).
Despite solution concentrations of the free Cd2+ ion decreasing almost 50% by increasing solution S04 concentrations from 8 to 58 mM (Table 1), Cd uptake by plants was unaffected by S04 treatments (Figure 2).
79

~ 2.5-• *->
o S 2-Q" T sn g • — — S- ^ ©0
W) 1.5"
* 1 0 -
I 0.5-
0.(F
1 •
LSD 1 » 9 • # - •
1 1 1 1 1
0 10 20 30 40 50
Sulfate concentration (mM) 60
Figure 1. Effect of S04 concentration in nutrient solution on shoot (•) and root (•) dry weights at constant solution ionic strength.
0.25
^ 0.20
•* g0.15
§ ^ 0 . 1 0
c o 0.05
1.75 1.50 1.25
cd
a a O
a -S o 1.00 y S 0.75 0.50
0.25
0.00
OH
8 20.5 33 45.5 58
Sulfate concentration (mM)
Figure 2. Effect of SO4 concentration in nutrient solution on shoot and root Cd concentrations (± SD) at constant solution ionic strength.
80

Concentrations of CdSO40 species in solution increased four-fold from 7.0 to 29.1 nM across
the same range of sulfate concentrations. Concentrations of the free Ca2+ ion also decreased across SO4 treatments, due to ion pairing in solution.
In Experiment 2 where solution SO4 concentrations were 45.5 mM, addition of Ca to the nutrient solutions to boost the concentration of free Ca2+ up to and exceeding the levels found in low S04 treatments (Table 2), had no effect on plant Cd concentration (Figure 3). Concentrations of free and complexed Cd were constant across these treatments (Table 1). Cadmium concentrations in plants were slightly lower than in Experiment 1.
0.16 0.14 0.12
^ «j 0.10 g0.08
mm
ol
g0 .06
mm
ol
0.04 V |V
a 0.02 0 1.4 C3
4—>
a 1.2
<u 0 1.0 0 C/3 0 "S 0.8
T3 0 u tf 0.6 •+-»
0.4
0.2
0.0 8.0 45.5 45.5 45.5 45.5
Ca 5.6 5.6 6.6 7.6 9.4 Ion concentration (mM)
Figure 3. Effect of increasing Ca and SO4 concentrations (total) on shoot and root Cd concentrations (± SD) at constant solution ionic strength.
Discussion
If the free metal is the only species taken up by plant roots, uptake should be reduced in line with the reduction in free Cd activity ((Cd2+)), or with reductions in Cd concentration ([Cd2+]) if ionic strength is kept constant. The data presented here show that Cd uptake by plants from solution is unaffected by increasing concentrations of SO4, despite SO4 causing a reduction in free Cd2+ ion activity due to the formation of CdSCV complexes. The lack of effect of S04
was consistent at both constant Ca concentration (Ca2+ activity decreasing) and at constant
81

Ca + activity (Ca concentration increasing to compensate for Ca complexation by SO4). The effects were unrelated to ionic strength effects due to the increasing SO4 concentrations, as these were maintained constant by compensation with NaN03. There are three possible explanations for these observations.
The first possible explanation is that the formation constants used for the calculation of Cd complexation by S04
2" are incorrect. This appears unlikely as the Cd2+-S042" system has been
well studied, and Helmke et al. (1997) have recently shown (using Donnan dialysis with a cation exchange membrane) that the concentrations of free Cd2+ in SC<4-rich solutions were identical to those calculated with the CdS04° formation constant provided by Lindsay (1979).
The second possible explanation for the data is that the complexed CdSO40 species provide an
effective buffer for the uptake of Cd2+ at the root membrane i.e. alleviating a diffusional limitation of Cd transport through the unstirred layer of solution around the root and in the apoplast. The apoplast is a highly charged zone (due to carboxylic acids and other organic functional groups) forming a barrier to movement of cations to sites of uptake (Grignon and Sentenac, 1991). A similar postulate was made concerning the enhancing effect which CI has on uptake of Cd by plants from solution even where Cd2+ activity is held constant (Smolders and McLaughlin, 1996b).
The third possible explanation for these data is that the CdS04° ion is taken up by plant roots with an efficiency equivalent to Cd2+. Recently, we have demonstrated that Cd2+ complexes with CI" (CdCln
2n) also appear to be available to plants (Smolders and McLaughlin, 1996a;b), and current experiments with isolated membranes from giant algal cell (Cham sp.) also suggest that CdCln
2n complexes may indeed be membrane permeable (Dunbar, Reid, McLaughlin and Hamon, unpublished data). While CdSO4
0 is uncharged, it is still a highly polar ion pair and presumably is labile in the sense that dissociation would be rapid in the presence of a strong sink for Cd2+. While uncharged molcules have the potential to be lipophilic, and hence diffuse freely through the apoplast and across cell membranes, it is unknown if the apparent uptake of CdSO4
0 found in this study can be attributed to this characteristic.
While it has been generally stated that only free metal ions are transported across membranes, there is some evidence, especially in the marine toxicology literature, that some uncharged metal complexes may move freely across biological membranes (Phinney and Bruland, 1994; Vercauteren and Blust, 1996). For example, Phinney and Bruland (1994) found that Cu2+
bound to dithiocarbamate or oxine formed an uncharged complex which was freely available to the marine diatom Thalassiosira weissflogii. Similarly, Vercauteren and Blust (1996) found that the uptake of divalent Zn by the common mussel Mytilus edulis was enhanced through the formation of a lower charged Zn-histidine complex.
We noted no effects of Ca on Cd uptake, even though the range of Ca concentrations was narrow in order to compensate for reductions in free Ca2+ activities through the formation of CaS04° complexes. Calcium is known to inhibit uptake of zinc and nickel by plants (Chaudhry and Loneragan, 1972; Gabbrielli and Pandolfini, 1984) and to reduce toxicity of Cd to plants (Hosono et al., 1979; Sadana and Takker, 1983), although the latter studies often failed to account for indirect alleviation of metal toxicity through reduced ion activities by addition of Ca salts. Jarvis et al. (1976) also found Ca inhibited plant Cd uptake. However, in that study the addition of Ca to the solutions as CaC^ confounds the interpretation of the data, as chloro-complexation of Cd would also have been important. Tyler and McBride (1982) found that adding CaSQ4 to solution and increasing Ca concentrations from 1 to 5 mM had no
82
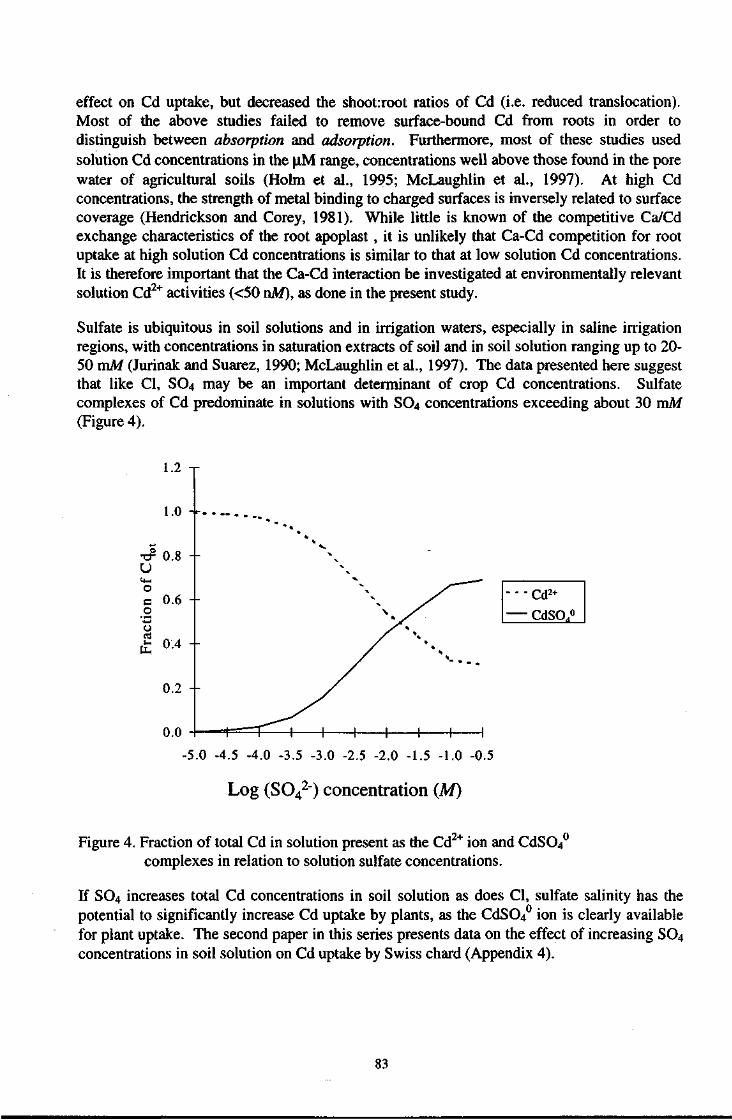
effect on Cd uptake, but decreased the shoot:root ratios of Cd (i.e. reduced translocation). Most of the above studies failed to remove surface-bound Cd from roots in order to distinguish between absorption and adsorption. Furthermore, most of these studies used solution Cd concentrations in the jiM range, concentrations well above those found in the pore water of agricultural soils (Holm et al., 1995; McLaughlin et al., 1997). At high Cd concentrations, the strength of metal binding to charged surfaces is inversely related to surface coverage (Hendrickson and Corey, 1981). While little is known of the competitive Ca/Cd exchange characteristics of the root apoplast, it is unlikely that Ca-Cd competition for root uptake at high solution Cd concentrations is similar to that at low solution Cd concentrations. It is therefore important that the Ca-Cd interaction be investigated at environmentally relevant solution Cd2+ activities (<50 nM), as done in the present study.
Sulfate is ubiquitous in soil solutions and in irrigation waters, especially in saline irrigation regions, with concentrations in saturation extracts of soil and in soil solution ranging up to 20-50 mM (Jurinak and Suarez, 1990; McLaughlin et al., 1997). The data presented here suggest that like CI, SO4 may be an important determinant of crop Cd concentrations. Sulfate complexes of Cd predominate in solutions with SO4 concentrations exceeding about 30 mM (Figure 4).
1.2 -r
---Cd2 +
CdSO,0
-5.0 -4.5 -4.0 -3.5 -3.0 -2.5 -2.0 -1.5 -1.0 -0.5
Log (S042") concentration (Af)
Figure 4. Fraction of total Cd in solution present as the Cd2+ ion and CdSO40
complexes in relation to solution sulfate concentrations.
If SO4 increases total Cd concentrations in soil solution as does CI, sulfate salinity has the potential to significantly increase Cd uptake by plants, as the CdS04° ion is clearly available for plant uptake. The second paper in this series presents data on the effect of increasing SO4 concentrations in soil solution on Cd uptake by Swiss chard (Appendix 4).
83

References
Chaney R L 1988 Plants can utilize iron from Fe-N,N'-Di-(2-Hydroxybenzoyl)-ethelenediamine-N,N'-diacetic acid, a ferric chelate with 106 greater formation constant than Fe-EDDHA. J. Plant Nutr. 11, 1033-1050.
Chaney R L and Hornick S B 1978 Accumulation and effects of cadmium on crops. Cadmium 77: Proc 1st Int. Cadmium Conf. San Francisco, pp 125-140, Metal Bulletin Ltd, London.
Chaudhry F M and Loneragan J F 1972 Zinc absorption by wheat seedlings: 1. Inhibition by macronutrient ions in short-term experiments and its relevance to long-term zinc nutrition. Soil Sci. Soc. Amer. Proc. 36, 323-331.
Gabbrielli R and Pandolfmi T 1984 Effect of Mg2+ and Ca2+ on the response to nickel toxicity in a serpentine endemic and nickel-accumulating species. Plant Physiol. 62, 540-544.
Grignon C and Sentenac H 1991 pH and ionic conditions in the apoplast. Annu. Rev. Plant Physiol. Plant Mol. Biol. 42,103-128.
Hatch D J, Jones L H P and Burau R G 1988 The effect of pH on the uptake of cadmium by four plant species grown in flowing solution culture. Plant Soil 105, 121-126.
Helmke P A, Salam A K and Li Y 1997 Measurement and behaviour of indigenous levels of the free, hydrated cations of Cu, Zn and Cd in the soil-water system. In: Proceedings of the Third International Conference on the Biogeochemistry of Trace Metals, Paris, May 1994. Eds. R Prost and D Adriano (in press).
Hendrickson L L and Corey R B 1981 Effect of equilibrium metal concentrations on apparent selectivity coefficients of soil complexes. Soil Sci. 131,163-171.
Holm P E, Andersen S and Christensen T H 1995 Speciation of dissolved cadmium: Interpretation of dialysis, ion exchange and computer (GEOCHEM) methods. Water Res. 29, 803-809.
Hosono M, Rii P, Tachibana Y and Ohta Y 1979 The effect of calcium in alleviating heavy metal toxicities in crop plants. I. Effects of calcium concentration in nutrient solutions on the retarded growth of rice and tomato plants. Soil Sci. Plant Nutr. 25,466-471.
Jarvis S C, Jones L H P and Hopper M J 1976 Cadmium uptake from solution by plants and its transport from roots to shoots. Plant Soil 44,179-191.
Jurinak J J and Suarez D L 1990 The chemistry of salt-affected soils and waters. In: Agricultural Salinity Assessment and Management, Ed. K.K. Tanji, pp.42-63, Amer. Soc. Civil Eng., New York.
Li U-M, Chaney R L and Schneiter A A 1994 Effect of soil chloride level on cadmium concentration in sunflower kernels. Plant Soil 167,275-280.
Lindsay W L 1979 Chemical Equilibria in Soils, John Wiley & Sons, New-York.
Lund W 1990 Speciation analysis-Why and how? Fresenius. J. Anal. Chem. 337, 557-564.
84

Martell A E and Smith R M 1974 Critical Stability Constants. Vol. 1, Amino acids. Plenum Press, New York.
McLaughlin M J, Tiller K G, Beech T A and Smart M K 1994 Soil salinity causes elevated cadmium concentrations in field-grown potato tubers. J. Environ. Qual. 23,1013-1018.
McLaughlin M J, the late Tiller K G and Smart M K 1997 Speciation of cadmium in soil solution of saline/sodic soils and relationship with cadmium concentrations in potato tubers. Aust. J. Soil Res. 35, 1-17.
McLaughlin M J, Tiller K G, Naidu R and Stevens D G 1996 Review: The behaviour and environmental impact of contaminants in fertilizers. Aust. J. Soil Res. 34,1-54.
McLaughlin M J, Andrews S, Smart M K and Smolders E 1998 Effects of sulfate on cadmium uptake by Swiss chard: H Effects due to sulfate addition to soil. Plant Soil (submitted).
Parker D R, Chaney R L and Norvell W A. 1995 "Chemical Equilibrium Models: Applications to Plant Nutrition Research." In Soil Chemical Equilibrium and Reaction Models, Special Publication No. 42, pp. 163-200 R.H. Loeppert, A.P.Schwab, and S.Goldberg (Eds.) Wisconsin, Madison, USA: Soil Science Society of America.
Phinney J T and Bruland K W 1994 Uptake of lipophilic organic Cu, Cd and Pb complexes in the coastal diatom Thalassiosira weissflogii. Environ. Sci. Technol. 28, 1781-1790.
Sadana U S and Takker P N 1983 Effect of calcium and magnesium on zinc absorption and translocation in rice seedlings. J. Plant Nutr. 6, 705-715.
Smolders E and McLaughlin M J 1996a Effect of CI on Cd uptake by Swiss chard in nutrient solution. Plant Soil 179, 57-64.
Smolders E and McLaughlin M J 1996b Chloride increases cadmium uptake in swiss chard in a resin-buffered nutrient solution. Soil Sci. Soc. Amer. J. 60, 1443-1447.
Tyler L D and McBride M B 1982 Influence of Ca, pH and humic acid on Cd uptake. Plant Soil 64, 259-262.
Vercauteren K and Blust R 1996 Bioavailability of dissolved zinc to the common mussel Mytilus edulis in complexing environments. Mar. Ecol. Prog. Ser. 137, 123-132.
85
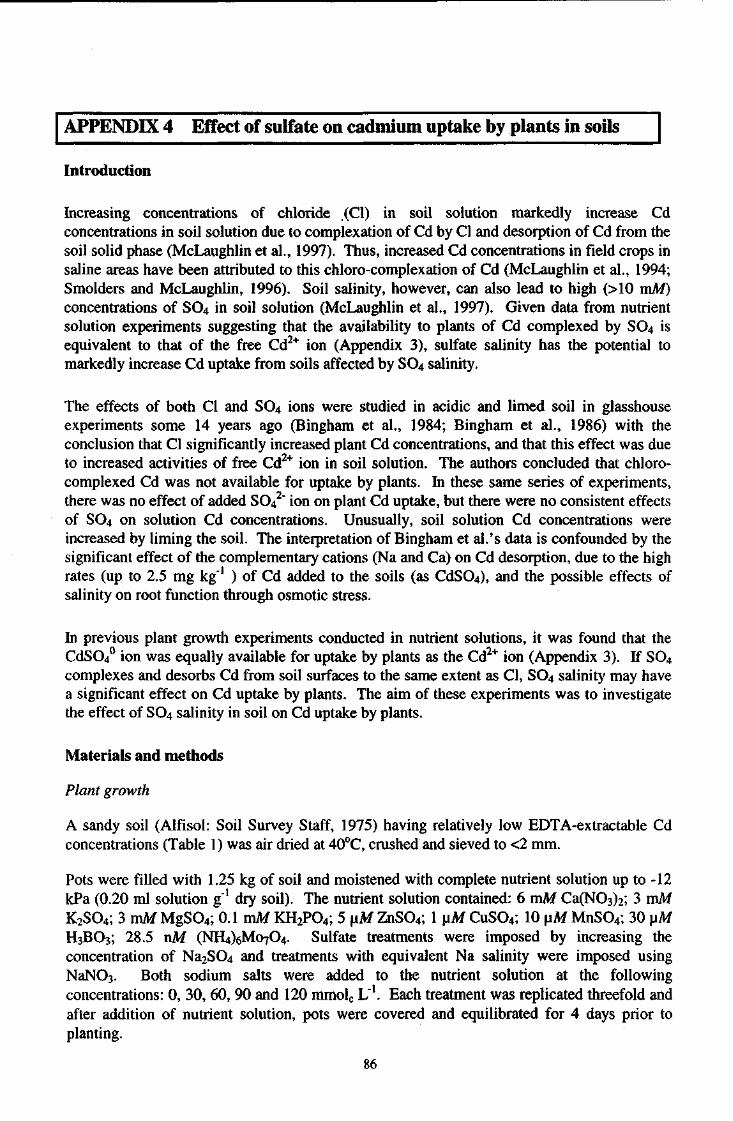
APPENDIX 4 Effect of sulfate on cadmium uptake by plants in soils
Introduction
Increasing concentrations of chloride (CI) in soil solution markedly increase Cd concentrations in soil solution due to complexation of Cd by CI and desorption of Cd from the soil solid phase (McLaughlin et al., 1997). Thus, increased Cd concentrations in field crops in saline areas have been attributed to this chloro-complexation of Cd (McLaughlin et al., 1994; Smolders and McLaughlin, 1996). Soil salinity, however, can also lead to high (>10 mM) concentrations of S0 4 in soil solution (McLaughlin et al., 1997). Given data from nutrient solution experiments suggesting that the availability to plants of Cd complexed by S0 4 is equivalent to that of the free Cd2+ ion (Appendix 3), sulfate salinity has the potential to markedly increase Cd uptake from soils affected by SO4 salinity.
The effects of both CI and SO4 ions were studied in acidic and limed soil in glasshouse experiments some 14 years ago (Bingham et al., 1984; Bingham et al., 1986) with the conclusion that CI significantly increased plant Cd concentrations, and that this effect was due to increased activities of free Cd2+ ion in soil solution. The authors concluded that chloro-complexed Cd was not available for uptake by plants. In these same series of experiments, there was no effect of added SO42" ion on plant Cd uptake, but there were no consistent effects of SO4 on solution Cd concentrations. Unusually, soil solution Cd concentrations were increased by liming the soil. The interpretation of Bingham et al.'s data is confounded by the significant effect of the complementary cations (Na and Ca) on Cd desorption, due to the high rates (up to 2.5 mg kg"1 ) of Cd added to the soils (as CdS04), and the possible effects of salinity on root function through osmotic stress.
In previous plant growth experiments conducted in nutrient solutions, it was found that the CdSO4
0 ion was equally available for uptake by plants as the Cd2+ ion (Appendix 3). If SO4 complexes and desorbs Cd from soil surfaces to the same extent as CI, SO4 salinity may have a significant effect on Cd uptake by plants. The aim of these experiments was to investigate the effect of SO4 salinity in soil on Cd uptake by plants.
Materials and methods
Plant growth
A sandy soil (Alfisol: Soil Survey Staff, 1975) having relatively low EDTA-extractable Cd concentrations (Table 1) was air dried at 40°C, crushed and sieved to <2 mm.
Pots were filled with 1.25 kg of soil and moistened with complete nutrient solution up to -12 kPa (0.20 ml solution g"1 dry soil). The nutrient solution contained: 6 mM Ca(N03)2; 3 mM K2S04; 3 mM MgS04; 0.1 mM KH2P04; 5 uM ZnS04; I uM CuS04; 10 \xM MnS04; 30 uM H3BO3; 28.5 nM (NH4)6Mo704. Sulfate treatments were imposed by increasing the concentration of Na2S04 and treatments with equivalent Na salinity were imposed using NaN03. Both sodium salts were added to the nutrient solution at the following concentrations: 0, 30, 60, 90 and 120 mmolc L"1. Each treatment was replicated threefold and after addition of nutrient solution, pots were covered and equilibrated for 4 days prior to planting.
86

Table 1. Soil characteristics.
Characteristic pH (water)t 54~ Clay(%) 9 Silt (%) 10 Sand(%) 81 Total C(%) 1.4 EDTA-extractable Cd (mg kg"1)* 0.31
t 1:5 soilrwater ratio. $ according to the method of Clayton and Tiller (1975).
Seeds of Swiss chard (Beta vulgaris L., cv. Fordhook Giant) were germinated on filter paper moistened with a solution containing 0.2 mM CaSC>4 and 0.03 mM H3BO3. Two days after sowing (DAS), 10-15 germinated seeds were transplanted per pot. The soil surface was covered with polyethylene beads to reduce evaporation and the pots were placed in a growth cabinet. Temperature in the growth cabinet was maintained at 25 °C (± 1 °C) during the 12 h/12 h day/night cycle. Photosynthetically active radiation was 300 umol quanta m"2 s"1. Pots were re-randomised daily. Daily evapotranspiration was measured gravimetrically and soil moisture potential maintained at -12 kPa using alternately demineralised water or nutrient solution (without Na2S04 or NaN03 salts). The number of plants per pot was reduced to 5 at 13 DAS.
Plants (tops only) were harvested at 19 DAS. The shoot of each plant was weighed and all plant tops from the same pot were pooled and oven dried (70 °C). Shoot dry weight was recorded and plant samples were ground in a mortar.
Analyses
Subsamples (50 mg) of the dried and ground plant material were digested with concentrated nitric acid (1.5 mL). The digest solution was diluted to 20 mL using 0.016 M nitric acid. All samples were digested in duplicate with blanks and an in-house quality control material in each batch. Every second batch digested included two reference materials (rice flour from the National Institute for Environmental Studies, Japan, and cabbage leaves from the Institute of Physics and Nuclear Techniques, Poland) having certified concentrations of Cd.
Cadmium concentrations in the digest solutions were determined using an atomic absorption spectrophotometer with graphite furnace atomization (GFAAS) and deuterium background correction. Orthophosphoric acid (1% v/v) was used as a matrix modifier.
Concentrations of Ca, Cu, Fe, Mg, Mn, Mo, P, S and Zn in the digest solutions were determined by inductively coupled plasma atomic emission spectroscopy (ICP-AES). Each plant sample was digested in duplicate and the average of each analysis was taken as the observation of one independent replicate (pot).
Soil samples were taken from each pot at harvest by subsampling from the entire pot. Visible roots were removed by handpicking and soil solution was displaced from the soil by centrifugation (4000 RCF, 30 min). Extracted solutions were then centrifuged at 25000 RCF for 60 min and filtered (<0.2 um). The pH of the solutions was measured immediately. Concentrations of CI, SO42" and NO3" in the soil solutions were measured by Ion
87

Chromatography (Dionex, AS4A-SC column) and cations by ICP-AES. Cadmium concentrations in the soil solution were determined by GFAAS. Any effects of high salt concentrations on measured Cd concentrations were determined using the method of standard addition.
Speciation ofCd in soil solution
Speciation of Cd in the soil solution was estimated with the computer program GEOCHEM-PC (Parker et al., 1995) using the measured total elemental concentrations as input data (averages for each treatment). The formation constant (log K) of CdSO/ complex was (corrected to zero ionic strength) 2.5. Carbon dioxide in the solutions was assumed to be ten times greater than atmospheric, although varying this parameter had little effect on computed activities of Cd species. Given the high salt concentrations used and the weak association of Cd with organic ligands (Alloway et al., 1984), complexation of Cd by organic ligands was not considered.
Statistical analysis
Treatment effects were assessed by linear regression analyses or ANOVA using a factorial design with anions (N03, S04) and salt rate (added 0, 30, 60, 90 and 120 mmolc L"1) as the treatments.
Results
Soil solution data
In the NO3" treatments, soil solution pH decreased by approximately 0.6 units from 7.7 to 7.1 with increasing rate of NO3" addition, while in SO4 treatments the decrease was greater (1.3 units).
Concentrations of Ca, K, Mg, Mn, and Zn in soil solution were significantly increased by increasing additions of both salts, with small differences between NO3 and SO4 treatments (data not shown).
Concentrations of NO3 and SO4 measured in soil solution at plant harvest were similar to those added, although it appeared that some SO4 was lost from solution at higher concentrations (Figure 1).
Concentrations of Cd in soil solution were significantly increased (P<0.05) in the SCVtreated soils, while increases in the NCVtreated soils were smaller and less consistent (Table 2). Activities of Ca2+ in soil solution were unaffected by NO3 treatments but significantly reduced by SO4 treatments (Table 3).
Activities of Cd2+ (calculated by GEOCHEM-PC) were increased by both NO3 and S04
treatments, but these changes were inconsistent with anion concentrations in soil solution (Table 3). The largest and most consistent effect was that SO4 treatments significantly increased activities of CdSC»40 in soil solution.
88

0 20 40 60 80 100
Nominal anion concentration (mmol L"1) 120
Figure 1. Relationship between measured anion concentrations in soil solution and concentrations predicted after treatment with salt solutions. Symbols are measured concentrations of NO3 ( • , ) and SO4 (O, ) and lines represent 1:1 relationships between measured and nominal anion concentrations.
Table 2. Effect of anion type and anion concentration (mmolc L"1) on measured total Cd concentrations in soil solution.
Anion 0 30 60 90 120 cone.
Anion Nitrate Sulfate
23.4 23.4
Solution Cd (nM)
18.9 75.6 43.4 67.8 63.4 63.4
44.5 70.1
LSDt (P<0.05) 20.0
t Interaction LSD for Anion x Concentration
Plant dry weights
Plant dry weights were significantly reduced by increases in both SO4 and NO3 concentrations in soil solution. However, at any given salt addition rate there were no significant differences in plant dry weights between these treatments (Figure 2).
89

Table 3. Effect of anion type and added anion concentration (mmolc L"1) on activity of Ca2+, Cd2+, and CdSO4
0
complexes in solution.
Ion CJF "oF CdS04u
Anion NO3 S04 2-
N03" S(V N03" SO. 2-
Activity of ionic species Concn. (mM) (nM)
(mmolc L) 0 2.7 2.7 6.7 6.7 7.8 7.8 30 2.8 2.6 5.3 13.6 4.6 30.9 60 3.2 1.9 19.5 10.8 15.3 32.7 90 3.0 1.6 10.6 9.3 7.8 35.3 120 2.9 1.4 10.6 9.3 7.1 41.1
LSDt 0.5 5.1 7.0 (P<0.05)
t Interaction LSD for Anion x Concentration
0.18 T
^ 0 . 1 6 -3,0.14--
^ 0 . 1 2 -• 4 — >
§ 0 . 1 0 -£0 .08-
•1*0.06--g 0.04 --
wO.02-
0.00
O -
o o
on n
0 20 40 60 80 100 120 Soil solution anion concentration (mmol L1)
Figure 2. Effect of increasing concentrations of N0 3 ( • ) and SO4 (O) in soil solution on shoot dry weights. Fitted lines are linear regression lines:
NaNQ3 Y=0.181-0.001X: R2=0.79, P<0.001 Na2S04 Y=0.187-0.0009X: RZ=0.67, P<0.001
90

Uptake of elements by plants
Concentrations of Ca, K, Mg and Mn in plant shoots were decreased as rates of salt application increased, while there was no consistent effect on plant Zn concentrations. Concentrations of Ca in plants in S04 treatments were significantly lower than those in N0 3
treatments (data not shown).
Concentrations of Cd in plant shoots were not significantly affected by the N0 3 treatments but were marginally but significantly (P<0.05) increased by the S04 treatments (Figure 3).
P 5 T
15 I. 20 +
15 +
10 +
a o •i-H • * - >
h a O a o o
<-> 5 -4—>
o o
si on 0
o o
IP——«
0 20 40 60 80 100 120 Soil solution anion concentration (mmolc L
_1)
Figure 3. Effect of increasing concentrations of N03 ( • ) and S0 4 (O) in soil solution on shoot cadmium concentrations. Fitted lines are linear regression lines:
NaN03 Y=12.5+0.031X: R2=0.19, P=0.21 Na2S04 Y=l 1.6+0.077X: R2=0.44, P=0.04
Cadmium uptake by plants was not consistently affected by either the N0 3 treatments or the S0 4 treatments, until anion concentrations reached 120 mmolc L"1 when Cd uptake was decreased in both treatments (Table 4). Cadmium uptake in N0 3 treatments was generally slightly less than in S0 4 treatments.
Discussion
In previous experiments, plant uptake of Cd was unaffected by additions of S0 4 to nutrient j2+ solution despite free Cdz+ activities decreasing markedly (Appendix 3), suggesting that the
CdS04° ion is equally available to plants as the Cd2+ ion. In the companion experiments reported here, S0 4 increased Cd concentrations in soil solution but Cd uptake by plants was only marginally increased. This is in contrast to the effect of CI, which markedly increased both solution Cd concentrations and Cd uptake by plants (Smolders et al., 1998).
91

Table 4. Effect of anion type and added anion concentration (mmolc L"1) on Cd uptake by plants.
Anion 0 30 60 90 120 cone.
Cd uptake (nmol pot") Anion
Nitrate 18.2 16.6 18.4 15.7 7.3 Sulfate 18.2 21.4 17.5 23.8 12.6
LSDt 4.8 (P»0.05)
t Interaction LSD for Anion x Concentration
Previous evidence for additions of sulfate to soil increasing plant Cd concentrations are equivocal and open to conflicting interpretations for a number of reasons (Bingham et al., 1986; Salardini et al., 1993; Sparrow et al., 1994; McLaughlin et al., 1995). Bingham et al. (1986) added varying levels of Na2SC«4 to a limed and unlimed sandy loam soil (Abruptic Durixeralf) leading to SO4 concentrations in saturation paste extracts of up to 25 mM. Cadmium was also added to the soils as Cd(NC»3)2 to levels reaching 2.5 mg kg"1, and Cd availability was assessed using Swiss chard. The authors did not find an overall significant effect of SO4 on plant Cd concentrations. It is interesting to note, however, that in the unlimed soil amended with only 0.25 mg Cd kg"1, Cd concentration in Swiss chard increased from 4.7 mg kg"1 to 7.4 mg kg"1 with increasing rate of SO4 application. Unusually, liming significantly increased total Cd and Cd2+ concentrations in saturation paste extracts. Despite these increases in solution Cd due to liming, plant Cd concentrations were significantly reduced, a result the authors suggested was due to Ca competition effects on Cd uptake. The addition of high amounts of Cd salts led to high solution Cd concentrations (up to 6 uM), so that Cd was likely to be bound much less strongly than in representative agricultural soils (Hendrickson and Corey, 1981), so that ion exchange of Cd with Na or Ca complicated interpretation of liming or SO4 effects.
Salardini et al. (1993) compared the effect of KCl, KNO3 and K2SO4 on Cd concentrations in seeds of poppies {Papaver somniferum L.) grown under leaching and non-leaching situations in pots in the glasshouse. There appeared to be no significant difference between KNO3 and K2SO4 treatments in either leached or unleached pots (despite the authors conclusions to the contrary), while addition of KCl increased seed Cd concentrations in unleached pots and decreased seed Cd in leached pots. In the same experiments, addition of ZnSC«4 decreased Cd concentrations compared to ZnCl2, while addition of gypsum generally tended to increase seed Cd concentrations. While it is difficult to draw firm conclusions about effects due to SO4 from their data, the effects of CI and gypsum were clear. The latter effect was suggested by the authors to be due to the impact of Ca and increased ionic strength in soil solution decreasing Cd retention by soil surfaces, thereby increasing Cd availability to plants.
Sulfate is a commonly found in high concentrations in soil solutions and in irrigation waters, e.g. Jurinak and Suarez (1980) reported from a survey of well and river waters in USA that median S0 4 concentrations were 3.6 and 4.1 mM respectively, while in saturation extracts of a range of salt-affected soils, median SO4 concentrations were 29.4 mM. In a survey of irrigated soils in South Australia, McLaughlin et al. (1997) reported that concentrations of SO4 in soil
92

solution ranged from 0.5 to 24.8 mAf, with mean and median concentrations of 7.9 and 6.9 mM. As these solution concentrations were found in soils wetted to -5 kPa in the laboratory, it is likely that concentrations would be higher in soil solution in the field where evaporation and transpiration concentrate salts in the solution, particularly in sodic soils where low Ca concentrations prevent the precipitation of solid phase CaSCv In soils with these concentrations of SO4, it is therefore likely that a considerable proportion of the inorganic Cd in soil solution is complexed by SO4. In our experiments, concentrations of SO4 found in soil solution were slightly lower than the concentrations added, but we were unable to determine if this was due to anion sorption or precipitation. The latter was unlikely as Ca concentrations in solution did not markedly decrease in line with increasing addition of SO4.
The concentration of the free Cd2+ ion in soil solution is highly buffered by soil components so that if SO4 were to behave similarly to CI and have little effect on soil surface charge (except through ionic strength effects), increasing the soil solution SO4 concentration to approximately 60 mmolc L"1 should double the total Cd concentration in solution, through complexation and desorption of Cd from soil surfaces (assuming free Cd2+ activity is highly buffered and constant with increasing salt in solution). However, S04 is itself adsorbed by soil surfaces to a much greater extent than CI, so that while SO4 complexation may tend to increase solution Cd concentrations, the greater negative charge imparted to soil surfaces through SO4 adsorption may also increase Cd retention and reduce solution concentrations. Thus, effects of SO4 on Cd retention by soil are less clear than those for CI. For example, Garcia-Miragaya and Page (1976) found that SO4 reduced Cd sorption by montmorillonite to a much smaller extent than CI, while Benjamin and Leckie (1982) found that increasing S04
concentrations in solution also reduced Cd sorption by model oxides (amorphous iron oxide, silica and gibbsite) but had no effect on Cd sorption by lepidocrocite. Hoins et al. (1993) found that increasing SO4 increased Cd retention by goethite.
Given the data in the above studies and those reported here, it would appear that SO4 will not have the same marked effect on plant Cd uptake as does CI and therefore S0 4 salinity of irrigation waters will not increase crop Cd concentrations to the same extent as CI. The effect of gypsum in increasing Cd concentrations in crops, where this occurs (Salardini et al., 1993) is therefore unlikely to be due to SO4 complexation, but is more likely to be due to Ca displacing Cd from exchange sites on soil into soil solution (Christensen, 1984), or due to increasing ionic strength reducing Cd sorption (Garcia Miragaya and Page, 1976). These effects are evidently dominant (Salardini et al., 1993) over any Ca-Cd competition for uptake at the root membrane (Tyler and McBride, 1982), which raises questions as to the strength of the Ca-Cd competition for uptake at environmentally relevant Cd activities in solution. Tyler and McBride (1982) studied Ca-Cd interactions at Cd2+ activities several orders of magnitude in excess of those normally encountered in agricultural soil solutions (<10 nM). Further studies should investigate cationic interactions with Cd uptake at these solution activities.
Reference List
Alloway B J, Tills A R and Morgan H 1984 The speciation and availability of cadmium and lead in polluted soils. Trace Subst. Env. Hth. 18,187-201.
Benjamin M M and Leckie J O 1982 Effects of complexation by CI, S04, and S2O3 on adsorption behaviour of Cd on oxide surfaces. Environ. Sci. Technol. 16, 162-170.
93

Bingham F T, Sposito G and Strong J E 1984 The effect of chloride on the availability of cadmium. J. Environ. Qual. 13, 71-74.
Bingham F T, Sposito G and Strong J E 1986 The effect of sulphate on the availability of cadmium. Soil Sci. 141, 172-177.
Christensen T H 1984 Cadmium soil sorption at low concentrations: I. Effect of time, cadmium load, pH, and calcium. Water Air Soil Pollut. 21,105-114.
Clayton P M and Tiller K G 1975 A chemical method for the determination of heavy metal content of soils in environmental studies. CSIRO Australia Division of Soils Technical Paper No. 41.
Garcia-Miragaya J and Page A L 1976 Influence of ionic strength and inorganic complex formation on the sorption of trace amounts of Cd by montmorillonite. Soil Sci. Soc. Am. J. 40, 658-663.
Hendrickson L L and Corey R B 1981 Effect of equilibrium metal concentrations on apparent selectivity coefficients of soil complexes. Soil Sci. 131,163-171.
Hoins U, Charlet L and Sticher H 1993 Ligand effect on the adsorption of heavy metals: The sulfate-cadmium-goethite case. Water Air and Soil Poll. 68, 241-255.
Jurinak J J and Suarez D L 1990 The chemistry of salt-affected soils and waters. In: Agricultural Salinity Assessment and Management, Ed. K.K. Tanji, pp.42-63, Amer. Soc. Civil Eng., New York.
McLaughlin M J, Tiller K G, Beech T A and Smart M K 1994 Soil salinity causes elevated cadmium concentrations in field-grown potato tubers. J. Environ. Qual. 23, 1013-1018.
McLaughlin M J, Maier N A, Freeman K, Tiller K G, Williams C M J and Smart M K 1995 Effect of potassic and phosphatic fertilizer type, phosphatic fertilizer cadmium content, and additions of zinc on cadmium uptake by commercial potato crops. Fert. Res. 40, 63-70.
McLaughlin M J, the late Tiller K G and Smart M K 1997 Speciation of cadmium in soil solution of saline/sodic soils and relationship with cadmium concentrations in potato tubers. Aust. J. Soil Res. 35,1-17.
McLaughlin M J, Andrews S, Smart M K and Smolders E 1998 Effects of sulfate on cadmium uptake by Swiss chard: I. Effects of complexation and calcium competition in nutrient solutions. Plant Soil (submitted).
94

Parker D R, Norvell W A and Chaney R L 1995 GEOCHEM-PC: A chemical speciation model for IBM and compatible computers. In: Chemical Equilibrium and Reaction Models, Eds. R H Loeppert et al., pp. 253-269, SSSA Spec. Pub. No. 42. Soil Science Society of America, Madison. WI.
Salardini A A, Sparrow L A and Holloway R J 1993 Effects of potassium and zinc fertilizers, gypsum and leaching on cadmium in the seed of poppies (Papaver somniferum L.). In: Plant Nutrition - from Genetic Engineering to Field Practice, Ed. N J Barrow, pp. 795-798, Kluwer Academic Publishers, Dordrecht, the Netherlands.
Smolders E and McLaughlin M J 1996 Chloride increases cadmium uptake in Swiss chard in a resin-buffered nutrient solution. Soil Sci. Soc. Am. J. 60,1443-1447.
Smolders E, Lambrechts R-M, McLaughlin M J and the late Tiller K G 1997 Effect of soil solution chloride on Cd availability to Swiss chard. J. Environ. Qual. (in press).
Soil Survey Staff 1992 Keys to soil taxonomy. Soil Manage. Support Serv. Tech. Monogr. No. 19, 5th ed. Pocahontas Press, Blacksburg, Virginia.
Sparrow L A, Salardini A A and Johnstone J 1994 Field studies of cadmium in potatoes {Solarium tuberosum L.). JH. Response of cv. Russet Burbank to sources of banded potassium. Aust. J. Agric. Res. 45, 243-249.
Tyler L D and McBride M B 1982 Influence of Ca, pH and humic acid on Cd uptake. Plant Soil 64, 259-262.
95

APPENDIX 5 Uptake of Cd and Zn in relation to complexation by
organic molecules
Introduction
It is well known that cadmium (Cd) uptake by potatoes is enhanced by increasing concentrations of CI in soil, and that this effect is due to the plant taking up Cd complexed by CI ions (Smolders and McLaughlin 1996b). Data presented in Appendices 3 and 4 indicate that sulfate in irrigation waters is unlikely to have any adverse impact on crop quality. A further consideration is the effect of organic molecules in waters and soil on uptake of trace metals by plants. This study was performed under a collaborative arrangement with the Catholic University of Leuven, Belgium, to investigate the scientific basis for Cd and zinc (Zn) uptake by plants as affected by organic molecules.
The uptake of Cd and Zn ions by plants from solution has been studied for several decades, with early work using solutions with relatively high solution metal concentrations, particularly for Cd (Haghiri, 1973; Jarvis et al., 1976; John, 1973). Presumably, high metal concentrations were used due to the absence of information regarding Cd concentrations in soil solutions, and/or the difficulty of measuring and maintaining constant activities of Cd in solution at environmentally-relevant levels (sub [iM level). Since these early experiments, much information is now available regarding the concentrations of both Cd and Zn in soil solutions (Hirsch and Banin, 1990; Holm et al., 1995; McLaughlin et al., 1997), with concentrations of Cd an Zn typically being in the nM and low \iM range, respectively. Design of experimental systems to investigate Cd uptake by plants at such low solution activities for Cd has either focussed on short term (<2 day) kinetic experiments where depletion of solution Cd activity is minimal (Cataldo et al., 1983), on the use of organic chelates to buffer ion activities in solution (see Parker et al., 1995 for a review), or on the use of chelating resins to buffer metal activities (Checkai et al., 1987b).
Chelator-buffering techniques to control metal activities in solution for plant growth studies rely on the assumptions that only the free metal ion in solution is taken up by plants, that the complexed metal pool is much larger then the amount of metal removed from solution by the plant, and that the chelator does not interfere with root ion-transport processes. Chelator-buffering techniques have been used to investigate critical solution activities for trace nutrient metals such as Fe (Bell et al. 1991), Zn (Welch et al. 1993: Yang et al. 1994) and Mn (Webb et al., 1993), and to investigate plant uptake of Cu (Taylor and Foy, 1985) and Cd (Smolders and McLaughlin, 1996a). Checkai et al. (1987b) used resin and chelator buffered systems simultaneously to demonstrate that Cd uptake by plants was unaffected by increasing concentrations of CdEDTA in solution, adding strength to the hypothesis that only the free metal is taken up from solution.
However, the hypothesis that uptake of metals from solution by roots is only controlled by the activity of the free metal in solution is being challenged. A number of workers have found that plant uptake of Fe (Bell et al., 1991; Romheld and Marschner, 1981) and Cu (Taylor and Foy, 1985; Checkai et al., 1987b) are not only related to free metal ion activities in solution. Similar findings in the marine toxicology literature have also raised questions about the free ion hypothesis (Campbell, 1995). If this is indeed the case, then critical activities for trace nutrients determined in chelator-buffered systems may be in error. We therefore examined the
96

hypothesis that charge/binding strength of metal complexes influence free metal availability for root uptake and translocation.
Materials and methods
Seeds of Lettuce ((Lactuca sativa L. Appia) were sown in vermiculite, moistened with tap water and allowed to germinate in the dark (25°C). Eight days after sowing (DAS), 12 uniform seedlings were transplanted to 9 liter culture vessels containing continuously aerated complete nutrient solutions. Solution composition was: Ca (3.55 mM); Mg (1.45 mM); Na (1.1 mM); K (1.2 mM); S04
2" (1.45 mM); NCV (8.1 mM); H2P04" (0.2 mM); Cl (10 fiM); H3BO3 (30 pM); Mn (10 yM); Cu (1 yM) and M0O42" (0.2 yM). Activities of Fe3+ in solution were buffered using FeHBED (Fe-N,N,-bis(2-hydroxybenzyl)-ethylenediamine-N,N'-diacetate, 25 JJM) because of its high selectivity for Fe3+ compared to Cd2+ and Zn2+ (Martell and Smith, 1974). It was prepared as a 8 mM stock solution according to Chaney (1988) from HBED (acid form) and a 10 % molar excess FeCl3 to ensure that virtually no free HBED was left in solution. pH of all solutions was adjusted to 6.10 ± 0.1 and maintained at this pH during plant growth using MES buffer (2 mM) to avoid pH effects on Cd uptake (Hatch et al., 1988). All metal species in solution were calculated using GEOCHEM-PC (Parker et al., 1995).
Treatments were addition of the following organic ligands to the solution to give a final concentration of 50 \iM for all ligands (except Tetren, 25 fiM) - nitrilotriacetate (NTA), ethylenediamine-N,N,N',N'-tetraacetate (EDTA), trans-1,2-cyclohexyl-diamine-N,N,N',N'-tetraacetate (CDTA), diethylenetriaminepentaacetate (DTPA), N-2-hydroxyethyl-ethylenediamine-N,N',N'-triacetate (HEDTA), ethylene-bis-(oxyethylenenitrilo)-tetraacetate (EGTA), hydroxyethyl-imino-diacetate (HEIDA), N,N-ethylene-diamine-diacetate (EDDA), 1,4,7,10,13-pentaazatridecane (Tetren), 8-hydroxyquinoline-5-sulfonate (Sulfoxine), ortho-phenanthroline (OP) and dithiodicarbamate (DDC).
As Zn is an essential micronutrient, and due to differential complexation of Zn by the different strength ligands, activities of Zn2+ in the ligand treatments were modified by addition of ZnS04 to give activities within the range 10"7 M to 10"9 M. The critical activity of Zn2+ for plant growth in chelator-buffered solutions has been reported to be below 10"9 M (Norvell and Welch, 1991; Yang et al. 1994).
A control treatment consisting of rates of Cd2+ added to the solution without any ligand was also included. Activities of Cd2+ activities in these solutions ranged from 10"66 to 10"9 6 M. In addition, as uptake of Cd is known to be dependent on plant Zn status (Abdel-Sabour et al., 1983), particularly where plants are Zn-deficient (Oliver et al., 1994), a series of Zn control treatments without ligands were formulated, where Cd2+ activity in solution was maintained constant at 10"83 M and Zn2+ activity was varied from 10"56 to 10"83 M. Concentrations of Cd and Zn in these solutions were maintained by radiolabelling with 109Cd and 65Zn, regular radioassay and replenishment as necessary.
All treatments were replicated three times. Dissociation constants for the ligands were obtained from Martell and Smith (1974) and were converted to zero ionic strength and 25°C where necessary.
Cadmium and Zn were added to the solutions to give a final range of activities of the free cadmium (Cd2+) and zinc (Zn2+) ions in solution ranging from 10"12 to 10"7 M and 10"99 to 10"7
M (Table 1), respectively. Concentrations of Cd and Zn in these solutions were maintained by radiolabelling with 109Cd and 65Zn, regular radioassay and replenishment as necessary.
97

Table 1. Metal activities maintained in solution for all treatments. Ligand Log(Cd ) Log(Zn ) Dominant species
Cd2+control 6.6-9.6 5.6 M2+
Zn2+control 8.3 5.6-8.3 M2+
NTA 7.7 7.8 ML" EDTA 10.0 9.3 ML2" CDTA 10.9 9.7 ML2' DTPA 11.5 9.6 ML3-
HEDTA 10.2 9.9 ML" EGTA 10.0 7.5 ML2' HEIDA 6.7 7.0 ML0
EDDA 6.8 7.9 ML0
Tetren 7.3 7.6 ML2+
Sulfoxine 6.8 7.5 ML+
OP 8.0 9.1 ML22+
DDC nd nd ML0
nd = not determined
During plant growth, activites of 109Cd and 65Zn were monitored at transplanting (8 DAS) and at 11, 14, 17, 19, 21, and 22 DAS by removing 5 ml solution and counting radioisotope activities by y-spectroscopy.
Plants were harvested at 23 DAS. Roots and shoots were separated. Shoots were rinsed in deionised water, while roots were washed by immersing for 30 min. in a solution of 5 mM CaCl2 and 1 mM LaCh to desorb extra-cellularly bound metals (Reid et al., 1996). Roots were then rinsed in deionised water. Roots and shoots were blotted dry, weighed and dried for 48 h at 70°C. Plant material was weighed, finely ground in a mortar and 109Cd and 65Zn concentrations determined in a subsample of the material by y-spectroscopy of the dried powder.
Results
Effects of ligands on root and shoot growth are shown in Figure 1. Plants in OP treatments died due to precipitation of iron and trace metals out of solution (data not shown) and those in EDDA treatments had significantly (P<0.05) reduced root and shoot growth. Plants grown in DDC treatments initially had retarded root growth, the solutions developed a brown precipitate which coated the roots, and Cd and Zn activities in solution were markedly reduced. Due to uncertainties in the speciation of metals in the DDC-buffered solutions, data for metal uptake from these treatments were not used. There were no significant (P=0.05) differences in root or shoot growth with the other ligands or with the Cd2+ control treatment (no ligand). Root growth in the EGTA solutions was very variable, but shoot growth was normal and similar to the other ligand treatments. As there were no differences in plant growth, treatment effects expressed either as plant metal concentrations or as plant metal uptake were not significantly different.
98

• Ligands
* Cd only, no ligand
EGTA NTA
HEDT/
EDTA
• CDTA
DTPA
Tetren Sulfoxine r 3.5 -£ • ^^«JHEIDA &
* ^ / "EDDA •3.0
np
l
• • ^H
• , ' • ? , 5 c ^ ££
•2.0
entr
a 1/
gD
" 1.5
cone
(n
mo
- i.o u o 0.5 &0
O
0.0 12 11 10 9 8 7
Log10 solution Cd2+ activity (nM)
Figure 1. Shoot (a) and root (b) dry weights in the control and ligand treatments. Bars represent standard deviation of mean values (n=3).
Plant Cd concentrations (roots+shoots) were linearly related (R2=0.99, P<0.001) to solution Cd2+ activities in the control (no ligand) treatment, with the slope of this log-log relationship being close to 1.0 (Figure 2).
DTPA •
HEDTA . EDTA
CDTA
Sulfoxine
EGTA NTA_ " _ _ - , H E I D A
Tetren EDDA
r
• Ligands
* Zn only — Ligands - best fit - - Zn only, no ligand
11.0 10.0 9.0 8.0 7.0 6.0
Log10 solution Zn2+ activity (nM)
T4.0
3.5 JS
3.0
2.5
2.0
1.5
1.0 2
0.5
0.0 5.0
«s O H
C • ?-H
tion
£ Q
•>->
a w <D Zst o o c o a o G e N
o 00 O J
Figure 2. Relationship between plant Cd concentration and the negative logarithm of solution Cd2+ activity in molar units (pCd2+) in the absence and presence of ligands. Standard deviations of mean values are within the area of the points on the graph. Fitted lines are y = 5.9 - 0.4x: R2 = 0.87, P<0.001 (ligands) and y= 9.22 - 0.92x: R2 = 0.99, P<0.001 (Cd only, no ligand).
99

In the Zn control treatments, plant Cd concentrations were relatively unaffected by varying solution Zn2+ activities from 10"83 to 10"65 M. Above 10"65 M Zn2+, Cd concentrations in plants were depressed (data not shown).
Ligands which formed weak uncharged complexes (HEfiOA), weak positively charged complexes (Tetren) or a combination of weak neutral and positively charged complexes (Sulfoxine) led to much greater Cd concentrations in plant roots and shoots than strong negatively charged ligands, given the same initial solution Cd concentration. This was due to reductions in the activity of the free Cd2+ ion (Figure 2). In the ligand treatments, plant Cd concentrations were also linearly related to the free metal ion activities in solution, but in contrast to the control treatment the slope of this relationship (0.39) was significantly lower than 1.0 (Figure 2). EGTA appeared to allow significantly greater Cd concentrations to accumulate in plants compared to EDTA, despite calculated solution Cd2+ activities being identical. Plants grown in Tetren-buffered solutions had similar Cd concentrations to those grown in HEIDA, despite solution Cd respectively.
2+ activities being 50 nM instead of 200 nM,
2+ In the absence of ligands, plant Zn concentrations were decreased as solution Zn activities decreased from 10"5 6 to 10"8 3 M, but the decline in Zn concentrations was not linearly related
.2+ to solution Zn activity with plant Zn concentrations falling slowly as solution Zn activities ,-7.3
approached 10" M, and falling more rapidly thereafter(Figure 3).
S-i
a o -4—> a S-i
• * ->
G <D O C o o *-> o p
o o
CO
a o U
< < < < H H H o Q Q W W U
< a w
< H Q W
< a. H Q
< Q Q
c U Q Q
x & 00
Ligand 2+ Figure 3. Relationship between plant Zn concentration and solution Zn activity
-2+x (negative logarithm in molar units - pZn ) in the absence and presence of ligands. Standard deviations of mean values are within the area of the points on the graph. Fitted line is 4.4 -0.19x: R2 = 0.75, P<0.001 (ligands) and the Zn only line (no ligand) is hand fitted.
.2+ Given the same Zn activity in solution, Zn concentrations in plants in the presence of ligands was significantly greater than in the absence of ligand (Figure 3). There appeared to be a
100

linear relationship between solution Zn2+ activity and plant Zn uptake across ligand types, but the slope of the relationship was small (0.19).
Distribution of Cd and Zn between shoots and roots was markedly affected by ligand type (Figure 4). In general, proportionately more metal was translocated to shoots in the presence of ligands compared to the Cd or Zn only treatments, except for EGTA and Sulfoxine treatments which had similar metal shootrroot ratios to control treatments.
>^ o c
• 1-H
o J"""1
4 - i
•a O H
3
u
EGTA •
• DTPA
HEDTA •
• 000- •
EDTA
CDTA
100 NTA •
• Tetren
10 J • HEIDA
1 - 1 1 1 • h
0.0 5.0 10.0 15.0 20.0
log K value for dominant ML complex 25.0
Figure 4. Effect of ligands on shoot:root ratios of metals in plants.
Discussion
The free ion hypothesis for uptake of metals by both plants and biota, has gained much support in both plant nutrition (Parker et al., 1995) and in ecotoxicological studies with aquatic organisms (Campbell, 1995). In experiments to determine the critical free ion activity in solution below which plants suffer micronutrient metal deficiencies, a benchmark assumption in these studies is that the activity of the free hydrated metal ion determines plant uptake of that metal (Bell et al., 1991; Webb et al., 1993; Welch et al., 1993: Yang et al., 1994). As metal uptake is principally governed by activity of the free metal ion, uptake is a negative function of metal-ligand binding constant at constant solution metal concentration. Hence plant Cd concentrations are lower in DTPA-buffered solutions than in NTA-buffered solutions, despite solution Cd concentrations being equal across treatments (Figure 2).
However, our results here suggest that across a range of chelator-buffered systems, there is no single relationship between metal ion activities in solution and metal uptake by plants, but that at any given activity, plant metal uptake will be dependent on the type of ligand in solution. Efficiency of free metal uptake, defined as the plant metal concentration (or uptake) divided by solution metal ion activity, was a positive function of the strength of the metal-ligand binding constant and charge (Figure 5).
101

(J,
o c <u
•1-H
o
I • ( - <
u
EGTA •
* DTPA
1000-HEDTA
• •
EDTA
• CDTA
100-NTA •
• Tetren
10 - • HEIDA
1 - 1 1 1 h
0.0 5.0 10.0 15.0 20.0
log K value for dominant ML complex 25.0
Figure 5. Relationship between Cd uptake efficiency, calculated as plant Cd concentration per unit solution Cd complex.
2+ activity, and binding constant of dominant metal rligand
Unfortunately, the distinction between effects of charge and binding strength of the metal ligand complex on plant uptake were difficult to separate, due to all the uncharged or positively-charged ligands (HEIDA, Tetren, Sulfoxine) forming weak ligands with Cd, and the highly-negatively charged ligands (EDTA, CDTA, DTPA) forming strong complexes with Cd. However, it is evident from Figure 5 that Tetren, which forms positively-charged Cd complexes, has a similar uptake efficiency to NTA, which forms negatively charged complexes, despite the ML binding constant being 3 orders of magnitude stronger. Similar results have been reported by Iwasaki and Takahashi (1989) for Cu uptake by ryegrass and clover in the presence of Trien, which is related to Tetren, and also forms positively-charged complexes with metal ions. Sinnaeve et al. (1983) also found Tetren increased metal uptake by plants.
Thus for Cd, which compared to Zn appears not to have uptake as strongly regulated (Figures 2 and 3), it can be postulated that for each ligand, or in the absence of a ligand, there is a unique relationship between plant Cd uptake and solution metal activity, which has a slope of 1.0, while at any given solution metal activity, plant uptake will be dependent on the ligand type and strength (Figure 6).
102
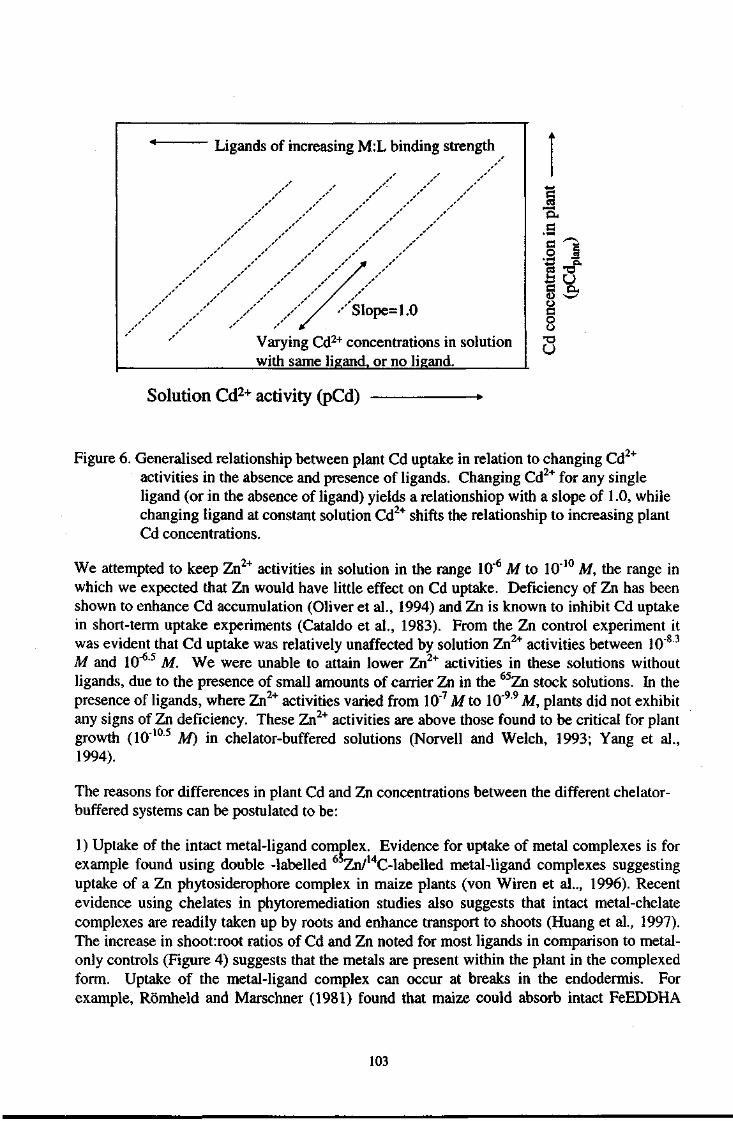
Ligands of increasing M:L binding strength
/Slope= 1.0
Varying Cd2+ concentrations in solution with same ligand, or no ligand.
Solution Cd2+ activity (pCd)
OH
5 i
o c o o
u
Figure 6. Generalised relationship between plant Cd uptake in relation to changing Cd 2+
2+ activities in the absence and presence of ligands. Changing Cd for any single ligand (or in the absence of ligand) yields a relationshiop with a slope of 1.0, while changing ligand at constant solution Cd2+ shifts the relationship to increasing plant Cd concentrations.
We attempted to keep Zn2+ activities in solution in the range 10"6 M to 10"10 M, the range in which we expected that Zn would have little effect on Cd uptake. Deficiency of Zn has been shown to enhance Cd accumulation (Oliver et al., 1994) and Zn is known to inhibit Cd uptake in short-term uptake experiments (Cataldo et al., 1983). From the Zn control experiment it was evident that Cd uptake was relatively unaffected by solution Zn2+ activities between 10"8 3
M and 10"65 M. We were unable to attain lower Zn2+ activities in these solutions without ligands, due to the presence of small amounts of carrier Zn in the 65Zn stock solutions. In the presence of ligands, where Zn2+ activities varied from 10"7 M to 10"" M, plants did not exhibit any signs of Zn deficiency. These Zn2+ activities are above those found to be critical for plant growth (10 1994).
10.5 M) in chelator-buffered solutions (Norvell and Welch, 1993; Yang et al.,
The reasons for differences in plant Cd and Zn concentrations between the different chelator-buffered systems can be postulated to be:
1) Uptake of the intact metal-ligand complex. Evidence for uptake of metal complexes is for example found using double -labelled 65Zn/14C-labelled metal-ligand complexes suggesting uptake of a Zn phytosiderophore complex in maize plants (von Wiren et al.., 1996). Recent evidence using chelates in phytoremediation studies also suggests that intact metal-chelate complexes are readily taken up by roots and enhance transport to shoots (Huang et al., 1997). The increase in shoot:root ratios of Cd and Zn noted for most ligands in comparison to metal-only controls (Figure 4) suggests that the metals are present within the plant in the complexed form. Uptake of the metal-ligand complex can occur at breaks in the endodermis. For example, Romheld and Marschner (1981) found that maize could absorb intact FeEDDHA
103

(Fe-ethylenediamine-di(o-hydroxyphenyl acetic acid)) at breaks in the endodermis where lateral roots budded;
2) Uptake of metal from solution is a diffusionally limited process, whereby the unstirred layer adjacent to the root, and the negatively charged apoplastic space provide a barrier to metal movement to carrier sites or channels where metals are membrane transported. Certainly, this hypothesis would explain the relationship between metal-ligand binding constant and charge and efficiency of metal uptake found in this study. Indeed, this was one of the reasons cited by Halvorson and Lindsay (1977) to explain a significantly lower critical Zn2+ activity in chelate buffered solution than in previous studies withunbuffered solution culture (Carrol and Loneragan, 1968).
Irrespective of the actual mechanisms, it is apparent that there is no single relationship between metal activities in solution and metal uptake by plants, in the presence of synthetic organic ligands. Similar conclusions were made recently with regard to complexation of Cd by chloride (Smolders and McLaughlin, 1996a,b) and sulfate (McLaughlin et al., 1997). Hence, critical solution activities determined for metal micronutrients (Bell et al., 1991; Webb et al., 1993; Welch et al., 1993: Yang et al., 1994) must be regarded to be ligand-specific, and as noted above are likely to be significantly lower than critical activities determined in chelator-free systems.
An interesting but untested hypothesis, is that complexation of metals by natural organic ligands in soils may also significantly affect plant metal uptake, by mechanisms similar to those postulated here for synthetic ligands. Cabrera et al. (1988) found that uptake and toxicity of high solution concentrations of Cd to barley was reduced by humic acid (HA), in line with reductions in Cd2+ activity due to HA addition, as measured by dialysis and ion-selective potentiometry. However, recalculation of the data of Cabrera et al. (1988) indicate that Cd uptake by the plants was actually enhanced by HA addition at constant Cd2+ activity.
A more concerning outcome from these studies is that plant uptake of metals in chelator-buffered systems may lead to erroneous conclusions regarding critical ion activities for nutrition or phytotoxicity. This may in part explain the large differences observed for critical solution Zn2+ activities to avoid plant Zn deficiency determined in flowing solution culture conditions (1CT7 M, Carrol and Loneragan, 1968), compared to those determined in chelator-buffered systems (10"10'5 M, Halvorson and Lindsay, 1977; Norvell and Welch, 1993; Yang et al., 1994). Furthemore, given that the intact metal-ligand complex may be taken up by the plant, we would recommend that ion competiton effects on metal uptake should not be studied in chelator-buffered systems. It would appear that manually-buffered or resin-buffered solution culture techniques (Checkai et al., 1987a; Smolders and McLaughlin, 1996b) may be more appropriate to study metal ion uptake by plants.
References
Abdel-Sabour M F, Mortvedt J J and Kelsoe J J 1988 Cadmium-zinc interactions in plants and extractable cadmium and zinc fractions in soil. Soil Sci. 145,424-431.
Bell P F, Chaney R L and Angle J S 1991 Free metal activity and total metal concentrations as indices of micronutrient availability to barley (Hordwwn VulgareQL.) 'Klages'). Plant Soil 130, 51-62.
104

Cabrera D, Young S D and Rowll D L 1988 The toxicity of cadmium to barley plants as affected by complex formation with humic acid. Plant Soil 105,195-204.
Cataldo D A, Garland T R and Wildung RE 1983 Cadmium uptake kinetics in intact soybean plants. Plant Physiol. 73, 844-848.
Campbell P G C 1995 Interactions between trace metals and aquatic organisms: A critique of the free ion activity model. In Metal Speciation and Bioavailability in Aquatic Systems Eds. A Tessier and D R Turner, pp 45-102. Wiley and Sons, New York.
Cataldo D A, Garland T R and Wildung R E 1983 Cadmium uptake kinetics in intact soybean plants. Plant Physiol. 73, 844-848.
Chaney R L 1988 Metal speciation and interactions among elements affect trace element transfer in agricultural and environmental food-chains. In Metal Speciation - Theory, Analysis and Application. Eds. J R Kramer and H E Allen, pp 219-60. Lewis Publishers, Chelsea, Michigan.
Checkai R T, Corey R B and Helmke P A 1987a Effects of ionic and complexed metal concentrations on plant uptake of cadmium and micronutrient metals from solution. Plant Soil 99, 335-345.
Checkai R T, Hendrickson L L, Corey R B and Helmke P A 1987b A method for controlling the activities of free metal, hydrogen, and phosphate ions in hydroponic solutions using ion exchange and chelating resins. Plant Soil 99, 321-334.
Haghiri F 1973 Cadmium uptake by plants. J. Environ. Qual. 2, 93-96.
Halvorson A D and Lindsay W L 1977 The critical Zn2+ concentration for corn and the malabsorption of chelated zinc. Soil Sci. Soc. Am. J. 41, 532-534.
Hatch D J, Jones L H P and Burau R G 1988 The effect of pH on the uptake of cadmium by four plant species grown in flowing soultion culture. Plant Soil 105, 121-126.
Hirsch D and Banin A 1990 Cadmium speciation in soil solutions. J. Environ. Qual. 19, 366-372.
Holm P E, Andersen S and Christensen T H 1995 Speciation of dissolved cadmium interpretation of dialysis, ion exchange and computer(Geochem) methods. Wat. Res. 29, 803-809.
Huang J W, Chen J, Berti W R and Cunningham S D 1997 Phytoremediation of lead-contaminated soils: Role of synthetic chelates in lead phytoextraction. Environ. Sci. Technol. 31,800-805.
Iwasaki K and Takahashi E 1989 Effects of charge characteristics of Cu-Chelates on the Cu uptake from the solution by Italian ryegrass and red clover. Soil Sci. Plant Nutr. 35, 145-150.
Jarvis S C, Jones L H P and Hopper M J 1976 Cadmium uptake from solution by plants and its transport from roots to shoots. Plant Soil 44, 179-191.
105

John M K 1973 Cadmium uptake by eight food crops as influenced by various soil levels of cadmium. Environ. Pollut. 4, 7-15.
Martell A E and Smith R M 1974 Critical Stability Constants. Volume 1, Amino acids. Plenum Press, New-York.
McLaughlin M J, the late Tiller K G and Smart M K 1997 Speciation of cadmium in soil solutions of saline/sodic soils and relationship with cadmium concentrations in potato tubers. Aust. J. Soil Res. 35,1-16.
Norvell W A and Welch R M 1993 Growth and nutrient uptake by barley (Hordeum vulgare L. cv. Herta): Studies using an N-(2- Hydroxyethyl)Ethylenedinitrilotriacetic Acid-buffered nutrient solution technique. I: Zinc ion requirements. Plant Physiol. 101, 619-625.
Oliver D P, Hannam R, Tiller K G, Wilhelm N S, Merry R H and Cozens G D 1994 The effects of zinc fertilization on cadmium concentration in wheat grain. J Environ. Qual. 23,705-711.
Parker D R, Chaney R L and Norvell W A 1995 Chemical equilibrium models: applications to plant nutrition. In Soil Chemical Equilibrium and Reaction Models. Eds. R H Loeppert, A P Schwab and S Goldberg, pp 163-196. Soil Sci. Soc. Amer. Spec. Publ. No. 42. ASA, SSSA, Madison, USA.
Reid R, Brookes J D, Tester M A and Smith F A 1996 The mechanism of zinc uptake in plants. Planta 198, 39-45.
Romheld V and Marschner H 1981 Effect of Fe stress on utilization of Fe chelates by efficient and inefficient plant species. J. Plant Nutr. 3, 1-4.
Sinnaeve J, Smeulders F and Cremers A 1983 In situ imobilization of heavy metals with Tetraethylenepentamine(Tetren) in natural soils and its effect on toxicity and plant growth. Plant Soil 70,49-57.
Smolders E and McLaughlin M J 1996a Effect of CI and Cd uptake by Swiss chard in nutrient solution. Plant Soil 179, 57-64.
Smolders E and McLaughlin M J 1996b Influence of chloride on Cd availability to Swiss chard: a resin buffered solution culture system. Soil Sci. Soc. Amer. J. 60, 1443-1447.
von Wiren N, Marschner H and Romheld Z 1996 Roots of iron-efficient maize also absorb phytosiderophore-chelated zinc. Plant Physiol. I l l , 1119-1125.
Webb M J, Norvell W A, Welch R M and Graham R D 1993 Using a chelate-buffered nutrient solution to establish the critical solution activity of Mn2+ required by barley (Hordeum vulgare L). Plant Soil 153, 195-205.
Welch R M and Norvell W A 1993 Growth and nutrient uptake by barley (Hordeum vulgare L. cv. Herta): Studies using an N-(2- Hydroxyethyl)Ethylenedinitrilotriacetic Acid-buffered nutrient solution technique. II: Role of zinc in the uptake and root leakage of mineral nutrients. Plant Physiol. 101, 627-631.
106

Yang X, Romheld V, Marscher H and Chaney R L 1994 Application of chelator-buffered nutrient solution tecnique in studies on zinc nutrition in rice plant {Qryza sativa L.). Plant Soil 163, 85-94.
107

APPENDIX 6 Reducing cadmium uptake by addition of ameliorants to soil - urban waste materials
Introduction
Cadmium (Cd) is a widely-dispersed pollutant in the environment, accumulating in many agricultural soils and posing a potential hazard to food quality and human health. Many factors affect availability of soil Cd to plants, including pH, soil salinity, soil organic matter content, soil texture, soil micronutrient status, etc. (Chaney and Hornick, 1978; McLaughlin et al., 1996). For both dryland and irrigated potato crops, soil salinity has recently been shown to have a much more significant influence on soil-plant transfer of Cd than was considered previously (Li et al., 1994; McLaughlin et al., 1994). Farmers therefore need management techniques to minimise Cd contamination of food crops grown with saline irrigation waters.
The effect of salinity in increasing plant uptake of Cd is predominantly due to the complexation of Cd by chloride (CI) in the soil solution. Chloro-Cd complexes are not only more mobile then free Cd2+ in the soil-root zone (Doner, 1978), but also may be taken up directly by plant roots (Smolders and McLaughlin, 1996). If high Cd concentrations in crops result from low soil pH, remediation can be performed by the application of liming materials (Chaney and Hornick, 1978), although results are not always predictable (Maier et al., 1997). However, where high crop Cd concentrations are the result of salinity, there are no simple techniques to reduce the CI content of soil or irrigation water. Techniques are therefore required to reduce the phytoavailability of soil Cd in these systems.
This paper presents the results from a study investigating the use of inexpensive industrial byproducts to reduce Cd phytoavailability in saline soils.
Materials and Methods
A glasshouse experiment was performed using potatoes (Solarium tuberosum cv. Atlantic) as the test crop. A total of thirteen (13) soil amendments were chosen on the basis that they were inexpensive materials with the potential to significantly reduce availability of Cd to plants, principally through increasing the sorption capacity of the soil for Cd under conditions of high salinity. The materials were a mixture of industrial by-product clay material (coal-washing clays - CW clays), water treatment residuals (WTRs), industrial clays (coarse (c) and fine (f) bentonites and zeolite) and natural mined clays. The WTRs were derived from both Fe and Al-based chemical flocculation processes for drinking water treatment, as well as one material incorporating activated carbon (Alum+C WTR). The soil used was an Alfisol with sandy texture, having a neutral pH, a low cation exchange capacity (CEC), and a Cd concentration typical of horticultural soils in Australia (McLaughlin et al. 1997).
Pots were filled with 15 kg soil and amendments at an application rate equivalent to 25 t ha"1. After 4 weeks incubation at -lOkPa moisture potential, basal nutrients were added and one seed potato tuber was planted to a depth of 2-3 cm. Nutrients were applied 2-3 times during the growth period and pots were watered according to plant demand with a solution containing 600 mg CI L"1 as NaCl.
108

Table 1. Chemical composition of soil and remediation materials used.
EC pHw Total C C.E.C Total Oxalate Cd Fe Al
dS/m % cmol+ kg'1 - mg kg"' i dS/m % cmol+ kg'1 - mg kg"'
Soil 0.6 6.3 1.7 7 0.075 600 1000
Water treatment biosolids (WTRs) IronWTR 1.8 7.3 5.7 30 0.044 20700 57300 Alum WTR 1 0.4 7.2 17.2 19 0.363 103800 16900 AlumWTR2 1.9 7.7 6.7 34 0.069 6800 7300 Alum+C WTR 0.4 7.1 20.0 18 0.358 104600 16900
Industrial and natural clays CW clay 0.2 9.6 19.9 7 0.119 800 3700 Bentonite coarse 3.2 5.3 0.1 78 0.005 1300 400 Bentonite fine 2.4 5.4 0.1 68 0.004 1300 400 Wirrega clay 0.9 9.5 3.2 18 0.016 1100 600 WF clay 1 0.3 9.2 0.3 20 0.007 1000 800 WF clay 2 0.2 8.4 0.1 142 0.004 900 400 Mundulla clay 0.4 9.3 1.0 18 0.006 1100 500 Zeolite 0.1 6.3 0.1 132 0.021 1400 200
Lime 0.3 8.6 ND 1 0.227 200 300
ND = not determined.
Plant material was harvested and elemental concentrations in plant shoots and tubers were determined as outlined by McLaughlin et al. (1994). Soil and amendment pH and electrical conductivity (EC) were determined in a water suspension of soil using a 1:5 soihsolution ratio (Rayment and Higginson, 1992). Total carbon (C) was determined using a Leco™ furnace. Cation exchange capacity was determined using NH4CI leaching procedure and iron (Fe) and aluminium (Al) were extracted using acidic ammonium oxalate (Rayment and Higginson, 1992).
Total and extractable metal concentrations in soils and amendments were determined using aqua regia with microwave heating, and diethylenetriaminepentaacetate (DTPA - Lindsay and Norvell, 1979). In addition, Cd sorption capacity of the amendments was assessed by shaking 4 g soil for 16 hours with 40 mL of either 0.05 M Ca(N03)2 or 0.05 M CaCl2 having graded concentrations of Cd to give final solution concentrations less than 250 nM. Solutions were filtered through a 0.22 um filter prior to analysis by flameless atomic absorption spectroscopy. Sorption data were converted to either linear (y = a + bx) or Freundlich (In y = a + bxln x) sorption equations with the solid:liquid distribution coefficient (K<j) being the slope term in these equations
Results
The materials had a wide range of capacities to retain Cd (Table 8).
109

Table 8. Values of the linear models applied to sorption data and AK<j values.
Soil/amendmenta Electrolyte Adjusted R2 Kj intercept AKd anion Lkg 1 nmol L"1 Lkg"
Soil CI 0.96 3 0.83 0.19 N0 3 0.96 16 -1.31
Iron WTR CI 1.00 430 -9.6 0.47 N0 3 1.00 920 -8.1
Alum WTR 1 CI 0.99 180 -1.42 2.25 N0 3 1.00 80 -1.87
Alum WTR 2 CI 0.94 210 -11.72 0.51 N0 3 0.97 410 -6.04
Alum+C WTR CI 1.00 88 -1.18 0.50 N0 3 1.00 175 -0.94
CW clay CI 0.98 12 2.28 0.41 N0 3 0.93 29 6.05
Bentonite coarse CI 0.99 7 0.32 0.64 N0 3 0.99 11 1.16
Bentonite fine CI 0.97 4 0.09 0.44 N0 3 0.97 9 1.86
Wirrega clay CI 0.98 460 -12.97 0.31 N0 3 0.99 1470 -3.18
WF clay 1 CI 0.98 80 0.39 0.39 N0 3 0.97 205 4.09
WF clay 2 CI 0.99 37 1.97 0.10 N0 3 0.98 360 -2.52
Mundulla clay CI 0.97 139 -0.06 0.42 N0 3 0.93 328 5.72
Zeolite CI 0.99 0.5 -0.06 0.25 N0 3 0.87 2 1.01
Lime CI 1.00 109 -0.95 0.29 N0 3 0.96 376 -7.91
aWTR = water treatment biosolid, CW = coal washing
All sorption relationships were highly linear and there was no benefit in a Freundlich transformation (Figure 4). By comparing K<j values determined in equivalent N03" and CI solutions (AKj), it was possible to gain not only an indication of the sorption capacity of the amendments for Cd, but also a measure of the ability of the materials to retain sorbed Cd against high solution CI", simulating irrigation with saline water.
Plant shoot growth was adversely affected by some of the WTRs, notably the Alum WTR 1 and Alum+C WTR treatments (Figure 5). Tuber yield was variable between replicates and treatments effects on tuber yield did not always correspond to effects noted in shoot growth. Cadmium concentrations in tubers and plant tops were also markedly reduced by all WTRs, particularly in the treatments most adversely affected in terms of dry matter yield - Alum WTR 1 and Alum+C WTR treatments. Some of the natural clay materials also markedly reduced tuber Cd concentrations with little or no effect on yield parameters (e.g. Wirrega clay).
110

^ 90 T W)
M 8 0 -o S 7 0 -=i c 6 0 -o * 5 0 -u. C 4 0 -o c o 3 0 -u
T3 20--u 4) 1 0 -x> 1-.
o 0 -< C/3 (
-10-1:
•
50 100 150 200
Solution Cd concentration (nmol L1)
250
Figure 4. Cadmium sorption relationships for Fe WTR (squares) and Al WTR 1 (circles) determined in a background electrolyte of either 0.05 M Ca(NOa)2 (solid symbols) or 0.05 M CaCl2 (open symbols). Coefficients for fitted lines are given in Table 2.
20 y ^ . 1 8 " \ 16 ^ 1 4
H 1 2
I 10 8 6 4 2 0
S - l
T3 •4—>
O O
X3 C/0
T600
Pi H
a o
<
B 1—H
+ s 3
4i <L> o - 4 - 1 «j C c 00 O e nt
o
irre
a> PQ PQ £
b £
o
1 c
o N
C O
U
Figure 5. Effect of remediation treatments on shoot and tuber yield.
I l l

~ 0.35 T
0.00 OJJ
s 3 3
+ a 3
i—< o cr a £
< < -5
c c 2 nt
o
0) <D P3 PQ
r-< CN
£ b £
ft
"3 c
B • H
N
s s • 3 Q
o U
Figure 6. Effect of remediation materials on potato tuber Cd concentrations.
Ability of the amendments to reduce tuber Cd concentrations was not correlated to any sorption measure, or to the increase in soil pH caused by some amendments (data not shown). There were strong positive relationships between Cd in tubers and Zn in both tubers and shoots (R2 = 0.78, P<0.001 and R2 = 0.90, P<0.001, respectively). Similarly, there were strong positive correlations between P in shoots or tubers and tuber Cd concentrations (R2 = 0.82, P<0.001 and R2 = 0.90, P<0.001, respectively). Reductions in plant Cd concentrations were not related to reductions in plant growth - Cd uptake (mg pot1) was also significantly affected by the treatments (data not shown). Significant reductions in shoot and tuber growth, and tuber Cd concentrations, in WTR treatments were associated with elevated concentrations of Cu in plant tissue, with up to a tenfold increase in shoot Cu concentrations observed (to 30 mg kg"1 dry weight). Analysis of the WTRs for Cu indicated Cu concentrations of up to 0.6% in some of these materials.
Discussion
The adverse effect on plant shoot growth and tuber yield of some of the remediation materials trialed appeared to be principally related to very high Cu concentrations in some of the WTRs. Copper is used as an algicide in many inland water impoundments in Australia, and the Cu added to the water bodies adsorbs strongly to particulate and mineral organic matter in suspension. Water purification processes flocculate these colloids using alum or iron salts, so that the resulting solid waste material precipitated out of solution may have high Cu concentrations. Despite the likelihood that Cu is strongly bound in the WTRs, it appears that there is sufficient phytoavailable Cu to significantly affect plant growth, even at moderate rates of WTR application to soil.
112

The significant reduction in tuber Cd concentrations and plant Cd uptake associated with Cu may be due to strong competition between Cd and Cu for uptake at the root membrane. There is some evidence in the literature that increasing Cu concentrations in solution reduce plant Cd uptake (Cataldo et al., 1983), but it is unclear if the Cu competition effect noted is merely a response to phytotoxicity. Investigation of the use of Cu-enriched WTRs at lower rates of application, or small application of inorganic Cu, to reduce plant Cd concentrations appears warranted.
The strong relationship between Cd and P concentrations in plants suggests that some of the effect of the remediation treatments was related to P nutrition of the plant. The interaction between P nutrition and Cd is well known (Williams and David, 1977), so that part of the effect of the amendments in reducing Cd may have been to reduce root proliferation through the soil, and hence access to soil Cd, due to reduced P availability. Concentrations of P in shoots and tubers were not at unusually low levels, given that plants were harvested at maturity (most nutrition criteria are for younger tissues). There was no strong relationship between P concentrations in tissues and dry weight, suggesting that P availability was not limiting shoot or tuber yield.
Despite using remediation materials that have high retention capacities for Cd in relation to the original soil, the materials appeared to have little effect based on their ability to sorb Cd. Kd values were up to 2 orders of magnitude greater than the original soil, and were in the upper range of values found in the literature for soils (Christensen, 1989). Part of the reason for this may be due to the low, but agronomically realistic, rates of application used in the experiment. The remediation materials constituted less that 1% by weight in the soil, so that effects on sorption may have been masked by other characteristics of the materials which affected Cd to a greater extent (e.g. Cu).
Conclusions
A number of inexpensive remediation materials were identified which have the potential to significantly reduce Cd uptake by plants. WTRs and some natural clay materials have potential in this regard, but the presence of phytotoxic concentrations of Cu in some WTRs may limit their use for Cd remediation. Further investigation of the Cu-Cd interaction in terms of plant Cd uptake is warranted.
References
Cataldo D. A., Garland T. R., and Wildung R. E. (1983). Cadmium uptake kinetics in intact soybean plants. Plant Physiol. 73, 844-8.
Chaney R. L., and Hornick S. B. (1978). Accumulation and effects of cadmium on crops. Cadmium 77: Proc 1st Int. Cd. Conf. San Francisco, Pp 125-140, Metal Bulletin Ltd, London .
Christensen T. H. (1984). Cadmium soil sorption at low concentrations: I. Effect of time, cadmium load, pH, and calcium. Water, Air, SoilPollut. 21, 105-14.
Doner H. E. (1978). Chloride as a factor in mobilities of Ni(II), Cu(II), and Cd(II) in soil. Soil Sci. Soc. Amer. J. 42, 882-5.
113

Li U.-M., Chaney R. L., and Schneiter A. A. (1994). Effect of soil chloride level on cadmium concentration in sunflower kernels. Plant Soil 167, 275-80.
Maier N. A., McLaughlin M. J., Heap M., Butt M., and Smart M. K. (1997). Effect of current season applications of calcific lime on pH, yield and cadmium concentration of potato (Solarium tuberosum L.) tubers. Nutr. Cycl. Agroecosys. 47, 1-12.
McLaughlin M. J., Tiller K. G., Beech T. A., and Smart M. K. (1994). Soil salinity causes elevated cadmium concentrations in field-grown potato tubers. J. Environ. Qual. 23, 1013-8.
McLaughlin M. J., Tiller K. G., Naidu R., and Stevens D. G. (1996). Review: The behaviour and environmental impact of contaminants in fertilizers. Aust. J. Soil Res. 34,1-54.
McLaughlin, M. J., Maier, N. A., Rayment, G. E., Sparrow, L. A., Berg, G., McKay, A., Milham, P., Merry R. H. and Smart, M. K. (1997). Cadmium in Australian potato tubers and soils. /. Environ. Qual. 26(6) (in press).
Smolders E., and McLaughlin M. J. (1996). Chloride increases cadmium uptake in Swiss chard in a resin-buffered nutrient solution. Soil Sci. Soc. Amer. J. 60, 1443-7.
Williams C. H., and David D. J. (1977). Some effects of the distribution of cadmium and phosphate in the root zone on the cadmium content of plants. Aust. J. Soil Res. 15, 59-68.
114

APPENDIX 7 Reducing cadmium uptake by addition of ameliorants to soil - industrial waste materials
Introduction
Cadmium (Cd) accumulation in agricultural soils is a concern in many countries. The rate of soil contamination is usually slow compared to industrial contamination (usually <30 g ha"1
yr"1) and cadmium concentrations in soil are usually not high varying from 0.1-1.0 mg kg"1 in agricultural soils not receiving sewage biosolid wastes, up to 3 mg kg"1 where sewage wastes are used. While these concentrations are not high by standards used to assess contaminated sites in urban areas, they are sufficiently high to cause concerns due to food chain contamination (McLaughlin et al, 1996; Jinadasa et al, 1997). Furthermore, due to the generally low land values in agricultural areas compared to urban and industrial land, remediation techniques must be low cost and integrated into crop production cycles. In Australia, soil salinisation has increased transfer of Cd through the food chain (McLaughlin et al, 1994) so farmers are seeking remediation techniques to minimise Cd accumulation in crops.
Many urban and industrial wastes must be disposed of to landfill, wasting the value inherent in many of these materials. For example, ferrous and alumina smelter by products have many characteristics which could improve agricultural soil productivity. Light-textured soils can have their nutrient retention capacity improved by addition of iron, manganese or aluminium oxides. These materials also have the ability to bind toxic heavy metals into forms unavailable for plants and microorganisms.
This study investigated low-cost Cd remediation options for saline soils using urban and industrial by-products, particularly those from the ferrous- and alumina-smelting industries.
Materials and methods
A glasshouse experiment was performed using potatoes {Solarium tuberosum L.) as the test crop. A total of thirteen (13) soil amendments were chosen on the basis that they were inexpensive materials with the potential to significantly reduce availability of Cd to plants, principally through increasing the sorption capacity of the soil for Cd under conditions of high salinity. The materials were a mixture of by-products slags, dusts and muds from the ferrous- and alumina-smelting industries, a natural clay (palygorskite), sewage biosolids and sand-washing clays (Table 1).
The soil used was an Alfisol with sandy texture, having a neutral pH, a low cation exchange capacity (CEC), and a Cd concentration typical of horticultural soils in Australia (McLaughlin et al, 1997).
The soil was air dried and 15 kg dry soil was sieved (<5 mm) into 300 mm diameter, free draining pots. Treatments were thoroughly mixed with the soil at rates equivalent to 5 and 25 t ha'1. The soil was wetted up to -lOkPa moisture potential and incubated for 4 weeks prior to planting. The soil was then removed from the pot and nitrogen (N, as ammonium nitrate), phosphorus (P, as superphosphate) and potassium (K, as potassium sulfate) were thoroughly mixed with the soil at rates equivalent to 100 kg N ha"1, 75 kg P ha"1 and 150 kg K ha"1. After basal fertilisation, approximately two thirds of the soil was replaced into the pot.
115

In each pot, one seed potato tuber (Solanum tubersosum cv. Atlantic) was planted to a depth of 2-3 cm, after which the pots were placed in a glasshouse. For each pot, the remaining soil was added when the plants were 20-25 cm tall to minimise the risk of tubers developing above the soil surface. Nitrogen and K were applied as side-dressings 2-3 times during the growth period to ensure these nutrients did not limit growth or yield responses. During growth, each plant was supported by a trellis and pots were watered according to plant demand.
Table 9. Chemical composition of soil and remediation materials used (BF=blast furnace, SWC=sand-washing clay).
EC pHw Total C Total P Oxalate Al Fe
dS/m % mgkg1 mg kg"1 mg kg"1
Soil 0.5 6.79 1.25 398 400 3300 Lime 0.21 8.84 nd 1236 nd nd Fe fine slag 1.2 11.9 7.5 2085 2800 92400 Fe dust 1 14.4 11.78 8.5 913 1200 180700 Fe dust 2 12.76 12.55 0.71 680 400 267500 Fe slag 8.75 12.65 0.38 5671 3700 71800 medium Fe slag rough 3.3 12.54 0.58 4779 5900 74300 BF Fe dust 3.34 5.77 0.93 549 500 160100 BF Fe flue 7.66 7 17.8 358 1900 85300 dust BF Fe slag 1 1.02 11.3 0.14 104 19000 1900 BF Fe slag 2 6.23 12.4 1.07 3690 3000 46500 Palygorskite 0.23 9.06 0.41 62 900 400
swc 0.74 8.52 0.24 164 1000 1500 Biosolids 7.89 7.2 22.3 18828 22300 8500 Al-red mud 4.95 11.62 1.04 481 7900 10500
nd = not determined.
After plant maturity and when haulms had senesced, the tubers were harvested and a soil sample was collected for chemical analysis. Plant tops were separated from roots, and shoot material was washed in deionised water prior to drying at 70°C and recording of dry weights. Tubers were also washed and weighed prior to chemical analysis.
Elemental concentrations in plant shoots and tubers were determined as outlined by McLaughlin etal. (1994).
Soil and amendment pH and electrical conductivity (EC) were determined in a water suspension of soil using a 1:5 soil solution ratio (Rayment and Higginson 1992). Total carbon (C) was determined using a Leco™ furnace. Cation exchange capacity was determined using NH4CI leaching procedure (Method , Rayment and Higginson 1992). Phosphorus (P) was extracted from soils using the method of Col well (1963) and concentrations of P in extracts were determined using the method of Murphy and Riley (1962). Iron (Fe) and aluminium (Al) were extracted from amendments using acidic ammonium oxalate to estimate the concentrations of amorphous oxide material (Tamm, 1943).
116

Total and extractable metal concentrations in soils and amendments were determined using the following methods:
1) Total metals - total Cd concentrations in soil were determined by boiling 2 g soil with 8 ml aqua regia (HN03:HC1, 3:1 ratio) at 110°C for 2 hours. The mixture was cooled, diluted to volume with 0.08 M HN03 and filtered through a 0.22 um filter prior to spectroscopic analysis by inductively-coupled plasma atomic emission spectroscopy (ICP-AES) or graphite furnace atomic absorption spectroscopy (GFAAS).
2) DTPA-extractable Cd, Cu and Zn - soils were extracted using DTPA (diethylenetriaminepentaacetate) according to the method of Lindsay and Norvell (1979).
Results and Discussion
The materials contained a range of heavy metals (Table 2).
Table 2. Concentrations of metals in the amendments.
M Fe Mn Cd Cu Ni Pb Zn~~ % % % mgkg"1
Soil 0.9 1.0 0.06 0.1 6 3.8 <9 21 Lime 0.1 0.3 0.04 0.2 10 3.3 <9 25 Fe fine slag 0.7 31.2 1.64 0.0 30 9.9 <9 69 Fe dust 1 0.2 44.8 3.32 32.8 70 23.9 635 10104 Fe dust 2 0.1 58.6 1.00 1.3 64 20.1 101 1959 Fe slag medium 1.0 21.7 4.03 0.2 9 2.7 <9 43 Fe slag rough 1.6 19.3 4.00 0.1 11 2.5 <9 22 BF Fe dust 0.1 59.6 0.16 0.1 55 24.3 105 2225 BF Fe flue dust 0.5 41.9 0.10 1.0 38 8.9 638 5548 BF Fe slag 1 5.1 0.5 0.34 0.0 3 <2.2 15 25 BF Fe slag 2 1.0 15.8 2.74 0.1 9 5.9 <9 67 Palygorskite 4.8 2.3 0.05 0.0 16 31.6 14 18
swc 9.3 3.2 0.01 0.0 16 21.4 37 30 Biosolids 4.3 1.7 0.02 9.8 1001 70.3 445 1816 Al-red mud 5.3 36.0 0.08 0.0 50 5.4 20 42
As expected, all the alumina and ferrous-smelting by products were very high in iron (Fe) with Fe concentrations up to 60% in the blast furnace dusts. Cadmium concentrations were low in all materials except Fe dust 1, which was a dust derived from air filtration units at a steel smelter, and in sewage biosolids. The biosolids were also very high in copper (Cu) compared to other materials (Table 2).
Plant growth was not significantly affected by the amendments (data not shown). Cadmium uptake was significantly reduced by some of the treatments, particularly Cu-enriched sewage biosolids, and alkaline (non-calcareous) clays (Figure 1).
117

era c 3
Plant Cd concentration (mg kg1)
2 era' 3"
a*
C& o
OS
3 3
a. 3 a 3
o 3
o a. o o 3 O
n 3 ! - • " 1
o 3 O
o GO 3" O O
2 era' 3* cr 8
a. B
CD CO.
3"
o o o
Control
Lime
Fe fine slag
Fe dust 1
Fe dust 2
Fe slag medium
Fe slag rough
BF Fe dust
BF Fe flue dust
BF Fe slag 1
Palygorskite
SWC
Biosolids
Al-red mud
BF Fe slag 2
© H - H-O j © LA © © © JL _L
o k> o o
I
to u> Ln ©
o o -1_ J
0 • H (/>
c 3" O" O (D O ^ f +
O o a
i 11 i i 11 i r- r* (0 0) a o H 0) c cr o (D o •^ « • *
O o a a

Cadmium concentrations in crops treated with Fe dust 1 was actually increased, probably due to the high Cd present in this material. While sewage biosolids had high Cd concentrations, Cd concentrations in crops treated with this material were actually decreased. This may have been due to increased retention of Cd by organic matter added in the biosolids, or could have been due to the high Cu present in this material. In recent experiments in our laboratory, Cu has been found to be antagonistic to Cd uptake by potatoes (Appendix 6).
Uptake of Cu, Mn, P and Zn into plant shoots and tubers was also significantly affected by the amendments (Table 3). Concentrations of DTPA-extractable Cd, Cu and Zn in soils are shown in Table 4. Plants growing on soils treated with sewage biosolids took up more Cu (and less Cd) than other plants (Table 3), in line with increased levels of DTPA-Cu and sodium bicarbonate-extractable P (Table 4).
Table 3. Concentrations of copper, manganese, phosphorus and zinc in potato shoots.
Tuber — Shoot — mg kg" — % mg — mg kg — % mg kg
kg1
Cu Mn P Zn Cu Mn P Zn
Control 6.6 7.6 0.41 26 5.5 70 0.36 51 Lime 5.9 8.1 0.34 22 5.1 43 0.23 22 Fe fine slag 5.1 8.0 0.32 21 3.8 55 0.19 20 Fe dust 1 9.4 14.8 0.35 33 6.3 186 0.24 103 Fe dust 2 6.6 7.0 0.36 27 4.8 29 0.24 44 Fe slag 7.2 10.5 0.37 16 5.7 72 0.27 16 medium Fe slag rough 5.8 9.6 0.33 13 4.9 75 0.25 15 BF Fe dust 6.5 8.8 0.39 30 5.0 81 0.26 83 BF Fe flue 9.4 9.4 0.42 36 5.9 95 0.29 126 dust BF Fe slag 1 6.3 7.4 0.36 25 5.1 31 0.27 38 BF Fe slag 2 5.2 8.1 0.34 14 4.9 57 0.23 17 Palygorskite 6.6 7.9 0.42 26 4.3 66 0.34 45 SWC 6.7 8.5 0.40 29 4.2 45 0.31 50 Biosolids 13.7 8.3 0.43 29 15.4 81 0.44 82 Al-red mud 7.0 8.1 0.36 25 5.3 28 0.23 33
LSD (P<0.05) 1.7 1.9 0.05 3 1.9 27 0.06 11
Concentrations of Cu in shoots were below levels found to be phytotoxic (Huett et ah, 1997). Manganese concentrations were high in plants treated with Fe dust 1 and the medium and coarse Fe slag materials, in line with the high total manganese concentrations in these materials (Table 2). All the smelter-derived materials significantly reduced uptake of P into plant shoots, probably due to increased retention of P by the oxides in these materials, and this was reflected to some extent in reduced concentrations of sodium bicarbonate-extractable P in soils at harvest. Biosolids enhanced P uptake and increased sodium bicarbonate-extractable P in soil. Growth was unaffected by these varying P
119

concentrations. Concentrations of Zn in shoots of plants treated with Fe dust 1, blast furnace dust (BF Fe dust) blast furnace flue dusts (BF Fe Flue dust) and biosolids were significantly increased over control values. Similar increases were noted in concentrations of DTPA-extractable Zn in these same treatments.
Table 4. Concentrations of DTPA-extractable Cd, Cu and Zn and NaHC03-extractable P (Bic-P) in soils at harvest.
pH DTPA Bic-P Cd Cu Zn
mg kg"1
Control 5.9 0.09 1.00 2.3 121 Lime 7.7 0.03 0.76 1.5 129 Fe fine slag 7.4 0.05 0.71 1.5 115 Fe dust 1 6.4 0.34 0.89 36.6 106 Fe dust 2 4.5 0.08 0.81 2.7 111 Fe slag medium 8.1 0.05 0.67 1.3 171 Fe slag rough 8.0 0.05 0.71 1.3 166 BF Fe dust 6.0 0.07 0.96 6.3 108 BF Fe flue dust 6.2 0.09 0.93 22.7 118 BF Fe slag 1 7.0 0.06 0.76 1.5 119 BF Fe slag 2 7.9 0.04 0.72 1.6 154 Palygorskite 5.8 0.08 0.90 2.0 111 SWC 5.9 0.08 0.96 1.9 111 Biosolids 6.2 0.15 4.51 12.7 153 Al-red mud 6.7 0.06 0.84 1.7 103
LSD (P.0.05) 1.1 0.01 0.10 0.51 8
Conclusions
Smelter wastes are possible low-cost ameliorants for reducing Cd concentrations in agricultural crops on saline soils. In association with other agronomic strategies to manage Cd transfer through the food chain (McLaughlin et al, 1996), re-use of these materials on soils presents a low cost disposal option for these industries. However, it appears the water-treatment residuals are more effective in reducing uptake of Cd by potatoes (Appendix 6) and therefore warrant further investigation under field conditions.
References
Colwell, J. D. (1963) The estimation of the phosphorus fertilizer requirements of wheat in southern New South Wales by soil analysis. Australian Journal of Experimental Agriculture and Animal Husbandry 3, 100-107.
Huett, D. O., Maier, N. A., Sparrow, L. A., and Piggot, P. J. (1997) Vegetables, in Reuter, D. J., and Robinson, J. B. (eds.) Plant Analysis: An Interpretation Manual CSIRO Publications, Melbourne, Australia, p. 385-464.
120

Jinadasa, K. B. P. N., Milham, P. J., Hawkins, C. A., Cornish, P. S., Williams, P. A., Kaldor, C. J., and Conroy, J. P. (1997) Survey of cadmium concentrations in vegetables and soils of Greater Sydney, Australia. Journal of Environmental Quality 26, 924-933.
Lindsay, W. L. and W. A. Norvell. (1969) Equilibrium relationships of Zn2+, Fe3+, Ca2+ and H* with EDTA and DTPA in soils. Soil Science Society of America Proceedings 33, 62-65.
McLaughlin, M. J., Tiller K. G., Beech T. A., and Smart, M. K. (1994) Soil salinity causes elevated cadmium concentrations in field-grown potato tubers. Journal of Environmental Quality 23, 1013-1018.
McLaughlin, M. J., Tiller, K. G., Naidu, R., and Stevens, D. G. (1996) Review: The behaviour and environmental impact of contaminants in fertilizers. Australian Journal of Soil Research 34, 1-54.
McLaughlin, M. J., Maier, N. A., Rayment, G. E., Sparrow, L. A. B. G., McKay, A., Milham, P., Merry R.H., & Smart, M. K. (1997) Cadmium in Australian potato tubers and soils. Journal of Environmental Quality 26,1644-1649.
Murphy, J., and Riley, J. P. (1962) A modified single solution method for the determination of phosphorus in natural waters. Analytica Chimica Acta 27, 31-6.
Rayment, G. E., and Higginson, F. R. (1992) Australian Laboratory Handbook of Soil and Water Chemical Methods, Inkata Press, Melbourne.
Tamm, O. (1932) Uber die Oxalatmetode in der chemische Bodenanalyse. Meddelanden fran Statens skogsforsoksanstalt Stockholm 27, 1-20.
121

APPENDIX 8 Reducing cadmium uptake by large additions of zinc to soil - glasshouse experimentation
Introduction
In earlier experiments under HRDC Project VG 006 "Effect of soil conditions and fertilizers on cadmium in vegetables - a national approach", field experiments had been carried out to determine the effect on tuber cadmium (Cd) concentrations of additions of zinc sulfate (ZnS04.7H20) to soils. In these experiments, Zn was added to soil by banding at planting (McLaughlin et al., 1995) with reductions found in tuber Cd concentrations of the order of 10-15%. Zinc is known to act antagonistically in relation to Cd uptake by plants (Abdel-Sabour et al., 1988; Honma and Hirata, 1978) and if Zn acts at the root surface to reduce Cd uptake, then banding of Zn fertilizer may be less efficient than broadcast and incorporated Zn. The aim of this experiment therefore, was to determine if additions of high rates of Zn, incorporated into the soil at planting, could significantly reduce Cd uptake by potatoes.
Materials and Methods
A glasshouse experiment was conducted at the SARDI Plant Research Centre during January - May 1996. The experimental design was factorial with 3 replications. Treatments were 4 Zn rates (0 - 250 kg ha"1 equivalent), 4 soils and 2 water qualities (mains water and water containing 1200 mg CI L"1). The cultivar grown was Pontiac.
The experimental procedure was as follows:
I. Four soils were used in the experiment - Mt Compass, Upper South East, Riverland and Victoria (Table 1). The soil was air dried and sieved to <5 mm before use. To characterise the soil, a sub-sample was collected for chemical and physical analysis. For each experiment 300 mm diameter, free draining pots and 15 kg of air dry soil were used.
n. The soil from each pot was spread on a plastic sheet to <10-15 mm in depth. Basal N, P, K fertilisers, supplying equivalent to 150 kg N ha"1 (as ammonium nitrate), 100 kg P ha"1 (as single superphosphate) and 150 kg K ha"1 (as potassium sulfate), were broadcast evenly over the soil and then thoroughly mixed into the soil. Zinc sulfate (ZnS04.7H20) was then broadcast evenly over the soil and then thoroughly mixed into the soil. Rates of application were 0, 50, 100 and 250 kg ha"1
equivalent. Approximately two thirds of the soil was replaced into the pot.
HI. Immediately prior to planting, a subsample of soil was collected from each pot for chemical and physical analysis (Table 1).
IV. Tuber seed pieces of the cv. Pontiac (one per pot) were planted on the 22nd January 1996 and covered with 2-3 cm of soil, after which the pots were placed in a glasshouse. To minimize the risk of tubers developing above the soil surface, the remaining soil was added to pots when the plants were 25-30 cm tall.
122

Table 1. Soil chemical and physical characterics.
Soil Mt.Compass Upper SE Riverland Victori;
ECa dS/m 0.02 0.23 0.02 0.08 pHw
a 5.2 5.9 7.0 5.6 pHca
b 4.4 5.4 6.3 5
cr mg kg"1 6 59 10 13 Total Cc % 0.4 2.4 0.4 3.4 Org.C. % 0.4 2.4 0.4 3.4
Exchangeable cations and cation < jxchange capacity (cmol+ kg"1) Ca 0.92 4.74 2.54 9.46 Mg 0.19 1.55 0.59 1.48 Na 0.10 0.52 0.14 0.16 K 0.05 0.50 0.22 1.29 Total 1.3 7.3 3.5 12.4 CECd 1.8
Particle size 6.5
: analysis 3.1 15.9
Clay % 2 7 4 26 Silt % 0 1 0 31 F. Sand % 21 78 36 26 C. Sand % 77 11 60 13
EDTA-Cde mg kg"1 <0.01 0.02 <0.01 0.13 EDTA-Zne mg kg"1 0.58 2.92 0.54 15.86
a 1:5 soihwater ratio. b 1:5 soil:0.01M CaCl2 ratio. c LECO combustion method (Rayment and Higginson, 1992). d 1M NH4CI, pH 7.0, pretreatment for soluble salts (Rayment and Higginson,
1992). e Clayton and Tiller method (1975).
The plants were watered as required, with mains water ("fresh") or with the equivalent volume of NaCl solution (33.8mM) every other watering ("saline"). Plants were sidedressed with potassium nitrate, magnesium sulfatre and calcium nitrate at 18, 31, 38, 51, 53 and 60 days after planting. The side-dressings were applied to ensure these nutrients did not limit growth or tuber yield. During growth, each plant was supported by a trellis.
Plants were harvested 107 days after planting. The plants were separated into tubers, stems and leaves. Tubers were brushed free of soil and washed in tap water and de-ionised water. Each plant part was rinsed in 0.1% Decon, deionised reverse osmosis water and blotted dry. Fresh and dry weights were determined prior to chemical analysis.
123

Chemical analysis of plant materials
Cadmium. Sub-samples (0.1 g) of the dried ground plant materials were digested with concentrated nitric acid until the digest mixture was clear. The digest solution was diluted to 10 ml using 0.016M nitric acid. All samples were digested in duplicate with blanks and internal reference materials in each batch. Cadmium concentrations in the digest solutions were determined using an atomic absorption spectrophotometer with graphite furnace atomisation and deuterium background correction. Orthophosphoric acid was used as a modifier.
Other elements. Concentrations of P, K, Ca, Mg, Na. S, B, Cu, Zn, Mn and Fe in the digest solutions were determined using Inductively-Coupled Plasma Atomic Emission Spectroscopy.
Results and Discussion
Tuber and plant shoot yield
There were significant differences between soils, Zn and water treatments in terms of tuber fresh weight and leaf+stem dry weight. For tuber fresh weight yield, there were significant interactions between soilxZn, Znxwater and soilxwater treatments. Two-way tables of treatment means are shown in Tables 2-4.
Table 2. Fresh weight of tubers (g pot"1) in relation to soil type and Zn treament.
Soil Rate of Zn addition (kg ha"1 equivalent) 0 50 100 250
Mt. Compass 748 639 444 140 Upper SE 722 548 679 172 Riverland 352 312 501 385 Victoria 1007 1013 818 779
LSD = 369
As can be seen in Table 2, high rates of Zn addition (250 kg ha"1 equivalent) significantly reduced tuber yields in the Mt. Compass and Upper SE soils, mainly due to the poor buffering capacity of these soils for Zn and the resultant high concentrations of Zn in the plants (Zn toxicity - see below). Saline irrigation water significantly reduced yields in the Upper Se and Riverland soils, but had no effect on the other soils (Table 3). The adverse effect of salinity was evident only at the lower rates of Zn addition (100 kg ha"1 equivalent and less) i.e. Zn toxicity was not exacerbated by saline irrigation water (Table 4).
Irrigation water salinity had the reverse effect on leaf+stem weights compared to tuber weights, with total stem weights in fresh treatments being 28.8 g pot"1, and in saline treatments was 32.2 g pot"1. Leaf+stem weights were generally unaffect by Zn treatments, except in the Mt. Compass soil where weights decreased from 26.8 g pot"1 in the control (0 Zn) to 5.1 g pot"1 at 250 kg Zn ha'1 equivalent.
124

Table 3. Fresh weight of tubers (g pot"1) in relation to soil type and water treament.
Soil Water treatment Saline Fresh
Mt. Compass 441 544 Upper SE 290 771 Riverland 179 595 Victoria 905 904
LSD = 185
Table 4. Fresh weight of tubers (g pot"1) in relation to Zn treatment and water treament.
Zn treatment Water treatment (kg ha"1 equiv.) Saline Fresh
0 546 868 50 416 840 100 496 725 250 357 380
LSD =185
Tuber cadmium and nutrient composition
Tuber Cd concentrations were increased by saline irrigation water treatments (Figure 1), and.the effect was consistent across soils, as found previously (McLaughlin et al., 1994). Tuber Cd concentrations were highest in the Upper SE soil and were similar to Cd concentrations found in tubers grown under field conditions in this soil type. The Riverland soil produced tubers with the lowest Cd concentrations, and again tuber Cd concentrations were in line with field experience on this soil type.
125

nil • Fresh
D Saline
Mt. Upper SE Riverland Victoria Compass
Soil type
Figure 1. Effect of irrigation water salinity on tuber Cd concentrations (FW = fresh weight).
Zn rate (kg ha-1 equiv.)
• 0 U50 • 100 • 250
Mt. Upper SE Riverland Victoria
Compass
Soil type
Figure 2. Effect of soil type and Zn treatments on tuber Cd concentrations (FW = fresh weight).
126

Tuber Cd concentrations were significantly decreased by addition of Zn, although the largest reductions in Cd concentration were accompanied by significant reductions in tuber yield on Mt. Compass and Upper SE soils, indicating Zn toxicity.
Zinc concentrations in leaves confirmed that Zn concentrations were toxic in these soils (Figure 3). Critical leaf Zn concentrations have not been developed for potatoes, but the upper value in the range for concentrations regarded as adequate is approximately 100 mg Zn kg"1 DW. In plants related to potatoes (tomatoes) where toxic values of Zn have been reported, critical values for toxicity have been reported as 250-500 mg Zn kg"1 DW (Huett et al., 1997). At the highest Zn rate, concentrations of Zn in leaves of plants growing on the Mt. Compass, Upper SE and Riverland soils easily exceeded these critical values. Plants growing on the Victorian soil had lowest Zn concentrations in leaves, likely due to the high clay content of this soil reducing Zn concentrations in soil solution. This soil also had high concentrations of EDTA-extractable Zn prior to any Zn additions. This may be the reason for the lack of any effect of Zn in reducing tuber Cd concentrations on this soil.
Conclusions
There is thus a potential danger in applying high rates of Zn to soil to attempt reductions in tuber Cd concentrations, and the rate of Zn addition must be chosen carefully to avoid phytotoxic symptoms appearing. Zinc on its own did not provide the large reductions in tuber Cd required, but Zn should certainly form part of a soil amendment program for Cd management.
1000 -| 900 -800 -700 -
Zn rate (kg ha-1 equiv.)
600 -
a o •a _
| £ g Q o _, 8 -* 500 a &0 N £ 400 *§ ^ 300 -J 200 -
100 0
• o • 50 • 100 • 250
Mt. Compass
Upper SE Riverland Victoria
Soil type Figure 3. Effect of soil type and Zn treatments on leaf Zn concentrations (DW
weight). = dry
127

References
Abdel-Sabour MF, Mortvedt JJ and Kelsoe JJ (1988) Cadmium-zinc interactions in plants and extractable cadmium and zinc fractions in soil. Soil Sci 145:424-431.
Clayton PM and Tiller KG (1975) A chemical method for the determination of heavy metal content of soils in environmental studies. CSIRO Australia Division of Soils Technical Paper No. 41.
Honma Y and Hirata H (1978) A noticeable increase in cadmium absorption by zinc deficient rice plants. Soil Sci. Plant Nutr. 24: 295-297.
Huett, D. O., Maier, N. A., Sparrow, L. A. and Piggott, T. J. (1997). Vegetables. Pp. 385-464, In 'Plant analysis: An interpretation manual', Eds. Reuter, D. J. and Robinson, J. B. CSIRO Publishing, Melbourne, Australia.
McLaughlin, M.J., Tiller, K.G., Beech, T.A. and Smart, M.K. 1994. Soil salinity causes elevated cadmium concentrations in field-grown potato tubers. J. Environ. Qual. 23(5): 1013-1018.
McLaughlin, M.J., Maier, N.A. Freeman, K., Tiller, K.G., Williams, C.M.J. and Smart, M.K. 1995. Effect of potassic and phosphatic fertilizer type, phosphatic fertilizer Cd content and additions of zinc on cadmium uptake by commercial potato crops. Fert. Res. 40: 63-70.
Rayment GE and Higginson FR (1992) Australian Laboratory Handbook of Soil and Water Chemical Methods. Melbourne: Inkata Press.
128
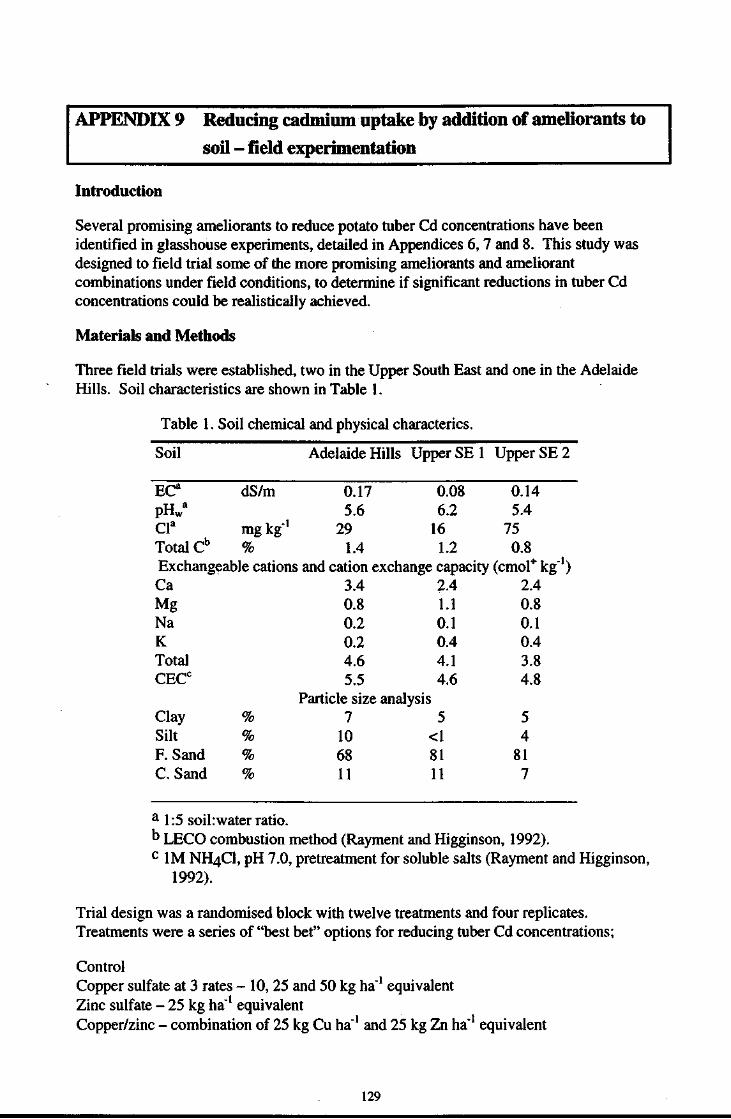
APPENDIX 9 Reducing cadmium uptake by addition of ameliorants to soil - field experimentation
Introduction
Several promising ameliorants to reduce potato tuber Cd concentrations have been identified in glasshouse experiments, detailed in Appendices 6,7 and 8. This study was designed to field trial some of the more promising ameliorants and ameliorant combinations under field conditions, to determine if significant reductions in tuber Cd concentrations could be realistically achieved.
Materials and Methods
Three field trials were established, two in the Upper South East and one in the Adelaide Hills. Soil characteristics are shown in Table 1.
Table 1. Soil chemical and physical characterics.
Soil Adelaide Hills Upper SE 1 Upper SE 2
ECa dS/m 0.17 0.08 0.14 pHw
a 5.6 6.2 5.4 Cla mg kg"1 29 16 75 Total Cb % 1.4 1.2 0.8 Exchangeable cations and cation exchange capacity (cmol+ kg"1) Ca 3.4 2.4 2.4 Mg 0.8 1.1 0.8 Na 0.2 0.1 0.1 K 0.2 0.4 0.4 Total 4.6 4.1 3.8 CECC 5.5 4.6 4.8
Particle size analysis Clay % 7 5 5 Silt % 10 <1 4 F. Sand % 68 81 81 C. Sand % 11 11 7
a 1:5 soihwater ratio. D LECO combustion method (Rayment and Higginson, 1992). c 1M NH4CI, pH 7.0, pretreatment for soluble salts (Rayment and Higginson,
1992).
Trial design was a randomised block with twelve treatments and four replicates. Treatments were a series of "best bet" options for reducing tuber Cd concentrations;
Control Copper sulfate at 3 rates - 10, 25 and 50 kg ha"1 equivalent Zinc sulfate - 25 kg ha"1 equivalent Copper/zinc - combination of 25 kg Cu ha"1 and 25 kg Zn ha"1 equivalent
129

Lime - 15 t ha"1 equivalent Natural clay - 25 t ha"1 equivalent Ferrous smelter dust (FSD) - 25 t ha"1 equivalent Magnesite (MgCOs) -151 ha"1 equivalent Magnesite+Zn - as above plus 25 kg ha"1 equivalent Water treatment residuals (WTR) + Zn - 251 ha"1 equivalent and 25 kg Zn ha"1 equivalent
Magnesite was introduced as two of the treatments with the hypothesis being that the absence of any effect of liming in past trials (Maier et al., 1997) was due to effects of Ca in the liming materials. Magnesite is a low cost liming material which is low in Ca, and we hypothesised that this material could be a useful ameliorant.
Plot dimensions were 4 m by 4 m with 1 m buffer strips between plots. Amendments were spead by hand and rotary hoed to 15cm to thoroughly incorporate the materials in the soil. The plots were permanently marked by placing a Scothmark™ Ball Marker (which contains an electronic transponder) at 100 cm depth in the corner of the plots. This depth was assessed as being sufficient to prevent disturbance of the transponder by cultivation practices. Further details of experiments are given in Table 2.
Table 2. Experimental details.
Site Date amendments incorporated
Planting date
Leaf sampling
date
Harvest date
Variety
Adelaide Hills Upper SE 1 Upper SE 2
5/11/97 13/11/97 3/12/97
20/11/97 4/12/97 20/12/97
19/1/98 29/1/98 19/2/98
23/2/98 25/3/98 22/4/98
Atlantic Kennebec Crystal
Trial sites were planted by the grower and crop and irrigation water management were identical to the commercial crops. Approximately 60 days after planting, leaf samples were taken from all plots by sampling the 5th leaf (from the apex) of 20 plants from each plot. The whole leaf was used for analysis.
At crop maturity sampling points were located at each site using a EMS II Marker Locator™ tuned to the frequency of the buried transponder. Potato crops were sampled by hand digging tubers from an area 2 m by 3 rows. Ten tubers in the size range 80-450 g were collected, with any severely diseased or damaged tubers discarded. Tubers were brushed free of soil and transported to the laboratory for analysis.
The tubers were rinsed free of soil in tap water, then gently scrubbed in reverse osmosis water using a nylon brush to remove all adhereing soil. Tubers were then rinsed a second time in clean tap water and finally in Cd-free distilled water. Tuber blemishes and eyes were removed and a 1 cm thick slice from the stem end to the bud end was taken from each tuber using a stainless steel knife. Tuber skin was carefully removed from each tuber slice, ensuring as little flesh as possible was removed with the skin. The slices were again rinsed in distilled water, blotted dry and diced into 1 cm cubes on a polypropylene chopping board. The tuber material was weighed, dried at 70°C for 48 h and reweighed. Dried tuber material was ground(<500u.m) using a stainless steel mill.
130

A subsample of the ground dried material (0.5 g) was digested by boiling under convection heating with 5 mL concentrated HNO3 acid and Cd concentration in the solution was determined by GFAAS (McLaughlin et cd. 1997). Analysis of reference NIES (medium Cd) rice flour by the above method gave a Cd concentration of 0.323 ± 0.036 mg kg"1, compared to the certified value of 0.32 ± 0.02 mg kg"1. All tuber Cd concentrations are expressed on a fresh weight basis (FW). Concentrations of B, Ca, Cu, Fe, K, Mg, Mn, S and Zn in the digest solutions were determined using Inductively-Coupled Plasma Atomic Emission Spectroscopy and are expressed on a dry-weight basis (DW).
Results and Discussion
Tuber yields were significantly different (P<0.001) between sites, with Upper SE 1 having significantly lower tuber yields (21.41 ha"1 equivalent) compared to the other two sites (33.4 and 32.81 ha"1 equivalent). Soil amendments had no significant effect on tuber yields (P>0.05), nor was there any significant effect on tuber size distribution.
Both site and amendment treatments significantly affected tuber Cd concentrations, with no interaction between these terms (log transformed data). Site and treatment mean data are therefore presented below by averaging across treatments (for site means) and across sites (for treatment averages - see Figure 1). Tuber Cd values were significantly different between the sites, with the Adelaide Hills site having a mean tuber Cd (across all treatments) of 0.040 mg kg"1 FW, and the two sites in the Upper South East having mean tuber Cd values of 0.117 and 0.131 mg kg"1 FW. Many of the amendments reduced Cd concentrations compared to control values, while tuber Cd concentrations tended to be higher after liming, confirming previous findings (Maier et al., 1997).
o
c O es o o
-a U
VH 0)
£>
H
0.12
0.10
0.08
0.06 -I
0.04
0.02
0.00
be ab
ab
§ 2
u u
o
u
fl +
P4 <D
+ -t-S
Amendment type
Figure 1. Effect of soil amendments on tuber Cd concentrations at 3 sites in South Australia. Means are averaged across sites and those columns with the same letter above are not significantly different (P<0.05).
131

Disappointingly, while reductions in tuber Cd concentration due to soil amelioration were statistically significant, the magnitude of the changes were not large enough to prove agronomically useful. For example, at Upper SE 2, tuber Cd concentrations were decreased from 0.140 mg kg"1 FW in control plots to 0.114 in Cu/Zn-treated plots, not enough to produce tubers meeting the MPC.
Similarly, the WTR material, which had proved successful in glasshouse trials in reducing tuber concentrations (by up to 80%), performed poorly under field conditions.
Treatments incorporating Cu also increased Cu concentrations in tubers (P<0.001), from around 3-6 mg kg"1 DW in control plots to 6-10 mg kg"1 DW in plots receiving 25 kg ha"1
equivalent or higher (Table 3). This increase is not considered to be of concern as Cu levels are well within those regarded normal.
Table 3. Concentrations of Cu in tubers (mg kg"1 DW).
Treatment Adelaide Upper SE 1 Upper SE 2 Hills
Control 4.4 5.9 3.7 Cu (10) 5.9 7.9 5.0 Cu (25) 6.1 8.0 5.5 Cu (50) 5.8 9.9 5.8 Zn 4.9 5.1 4.2 Cu/Zn 6.4 9.1 5.2 WTR 5.5 6.9 4.5 Lime 4.5 4.4 3.9 Mag.+Zn 8.5 4.7 4.1 FSD 4.5 5.5 3.9 Nat. Clay 4.9 6.6 5.0
LSD (P<0.05) 2.0
Similarly, treatments incorporating Zn increased tuber Zn concentrations from 16-27 mg kg"1 DW in control plots to 22-44 mg kg"1 DW in plots receiving 25 kg Zn ha"1 equivalent or higher (Table 4). Again, these increases are not considered problematic.
Conclusions
From the filed validation trials, it would appear that several treatments (Cu, Zn, FSD and natural clay) have the potential to reduce tuber Cd concentrations under commercial conditions. Reductions will only be of the order of 10-15%, insufficient in some saline areas to produce tubers meeting the MPC, but another management tool to assist growers to reduce Cd accumulation in tubers.
132

Table 4. Concentrations of Zn in tubers (mg kg"1 DW).
Treatment Adelaide Hills
Upper SE 1 Upper SE 2
Control 16.3 27.6 26.5 Cu (10) 18.5 29.2 25.4 Cu (25) 16.7 35.6 24.6 Cu (50) 16.8 29.7 25.7 Zn 22.5 43.9 30.3 Cu/Zn 28.8 36.8 28.0 WTR 19.6 33.2 30.1 Lime 15.4 26.7 25.1 Mag.+Zn 17.7 28.3 28.0 FSD 18.1 36.8 26.9 Nat. Clay 25.1 36.8 31.8
LSD (P<0.05) 5.6 —
References
Maier, N.A., McLaughlin, M.J., Heap, M., Butt, M., Smart, M.K. and Williams C.M.J. 1997. Effect of current season applications of calcific lime on pH, yield and cadmium concentration of potato (Solanum tuberosum L.) tubers. Nutr. Cycl. Agroecosys. 47: 1-12.
McLaughlin, M.J., Maier, N.A., Rayment, G.E., Sparrow, L.A., Berg, G., McKay, A., Milham, P., Merry R.H. and Smart, M.K. 1997. Cadmium in Australian potato tubers and soils. J. Environ. Qual. 26: 1644-1649.
Rayment, G. E., and Higginson, F. R. (1992). 'Australian Laboratory Handbook of Soil and Water Chemical Methods.' (Inkata Press: Melbourne.)
133
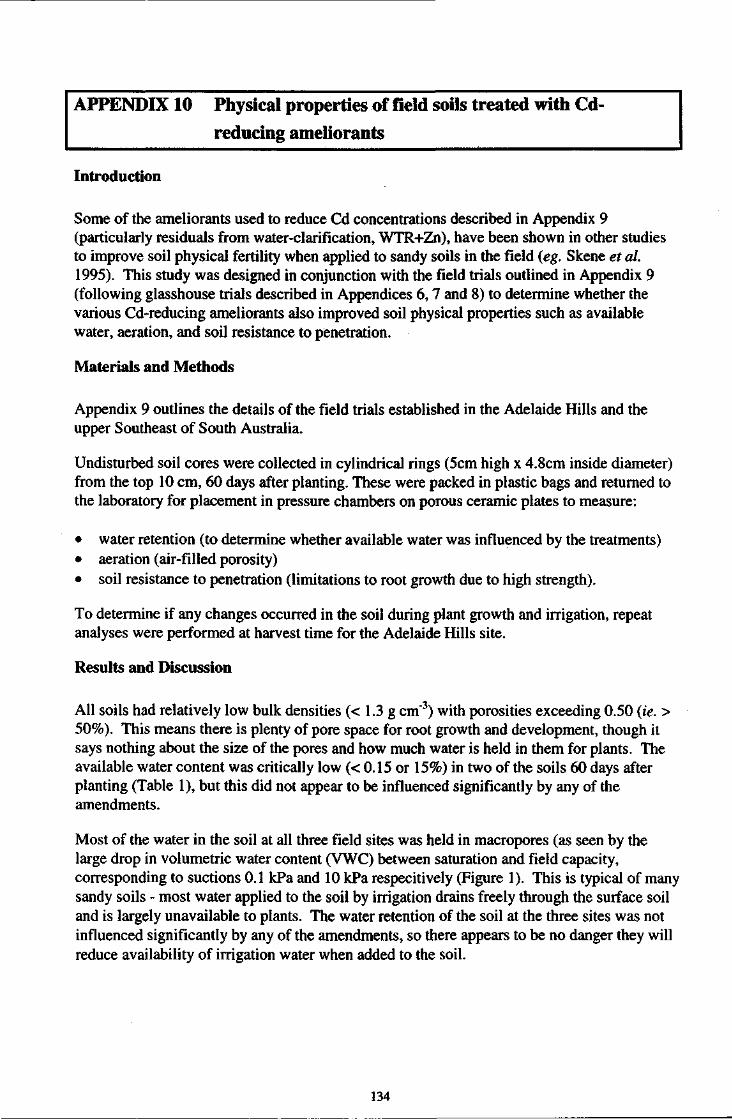
APPENDIX 10 Physical properties of field soils treated with Cd-reducing ameliorants
Introduction
Some of the ameliorants used to reduce Cd concentrations described in Appendix 9 (particularly residuals from water-clarification, WTR+Zn), have been shown in other studies to improve soil physical fertility when applied to sandy soils in the field (eg. Skene et cd. 1995). This study was designed in conjunction with the field trials outlined in Appendix 9 (following glasshouse trials described in Appendices 6,7 and 8) to determine whether the various Cd-reducing ameliorants also improved soil physical properties such as available water, aeration, and soil resistance to penetration.
Materials and Methods
Appendix 9 outlines the details of the field trials established in the Adelaide Hills and the upper Southeast of South Australia.
Undisturbed soil cores were collected in cylindrical rings (5cm high x 4.8cm inside diameter) from the top 10 cm, 60 days after planting. These were packed in plastic bags and returned to the laboratory for placement in pressure chambers on porous ceramic plates to measure:
• water retention (to determine whether available water was influenced by the treatments) • aeration (air-filled porosity) • soil resistance to penetration (limitations to root growth due to high strength).
To determine if any changes occurred in the soil during plant growth and irrigation, repeat analyses were performed at harvest time for the Adelaide Hills site.
Results and Discussion
All soils had relatively low bulk densities (< 1.3 g cm"3) with porosities exceeding 0.50 (ie. > 50%). This means there is plenty of pore space for root growth and development, though it says nothing about the size of the pores and how much water is held in them for plants. The available water content was critically low (< 0.15 or 15%) in two of the soils 60 days after planting (Table 1), but this did not appear to be influenced significantly by any of the amendments.
Most of the water in the soil at all three field sites was held in macropores (as seen by the large drop in volumetric water content (VWC) between saturation and field capacity, corresponding to suctions 0.1 kPa and 10 kPa respecitively (Figure 1). This is typical of many sandy soils - most water applied to the soil by irrigation drains freely through the surface soil and is largely unavailable to plants. The water retention of the soil at the three sites was not influenced significantly by any of the amendments, so there appears to be no danger they will reduce availability of irrigation water when added to the soil.
134

-3\ Table 1. Bulk density (g cm") and plant available water
Adel. Hills Adel. Hills Upper SE 1 Upper SE 2 60d Hvst 60d 60d
Mean Bulk 1.18±0.014 1.19±0.043 1.3010.018 1.1710.015 Density Field Plant Available Water (VWCiokPa-isookPa) Treatments: Control 0.107 0.177 0.078 0.159 WTR 0.123 0.175 0.069 0.144 Mag+Zn 0.085 0.159 0.079 0.177 FSD 0.074 0.173 0.080 0.175 Nat.clay+Zn 0.066 0.179 0.069 0.173
Mean Available 0.091±0.023 0.17210.008 0.07510.005 0.16510.014 Water
Soil aeration between field capacity and wilting point at all three sites exceeded the minimum value of 0.10 (ie. 10% air-filled pores) required for plant growth (Figure 2). In fact, all soils and all treatments had air-filled porosities > 0.20, which means so long as subsoil drainage is sufficient (so the surface soil reaches field capacity within 48 h after irrigation), no root limitations exist due to anaerobic conditions. The amendments seemed to have no significant impact (positive or negative) on aeration.
Despite the low bulk densities (ie. high porosities) and good aeration status (largely due to the sandy texture) soil strength appeared to reach limiting-values (1000 kPa) well within the water content range for irrigation at two of the three sites. This was particularly the case with the soil in the Adelaide Hills at harvest time (Figure 3). Variability in the measurements of soil resistance was large, so that treatment effects were not significant - nevertheless, it can safely be said that none of the amendments caused any significant increase in soil resistance to root growth across the water content range of practical interest in this context.
From analysis of the Adelaide Hills site at 60 days after planting and at harvest, there were no effects of measurement time on any of the above parameters.
Conclusions
Laboratory measurements on soil samples taken from the three field sites where Cd-reducing amendments were trialed indicate that soil physical properties were not altered significantly by any of the amendments at the rates applied (ie. < 50 t/ha). This indicates that where positive reductions in Cd-uptake can be achieved by an amendment, its application will not cause significant problems with compaction, strength, aeration and available water. On the contrary, if application rates greater than those trialed here were to be used, it is likely that improvements to physical properties would be experienced, particularly in relation to water-holding capacity. It is not possible from this work to suggest application rates that might improve physical properties, but the important issue is that within the boundaries of the likely application rates, these properties will not be impacted upon adversely.
135
References
Ward, P.R. and Oades, J.M. 1993. Effect of clay mineralogy and exchangeable cations on water-repellency in clay-amended sandy soils. Australian Journal of Soil Research, 31, 351-64.
Skene, T.M., Oades, J.M. and Kilmore, G. 1995. Water treatment sludge: a potential plant growth medium. Soil Use & Management, 11, 29-33.
136
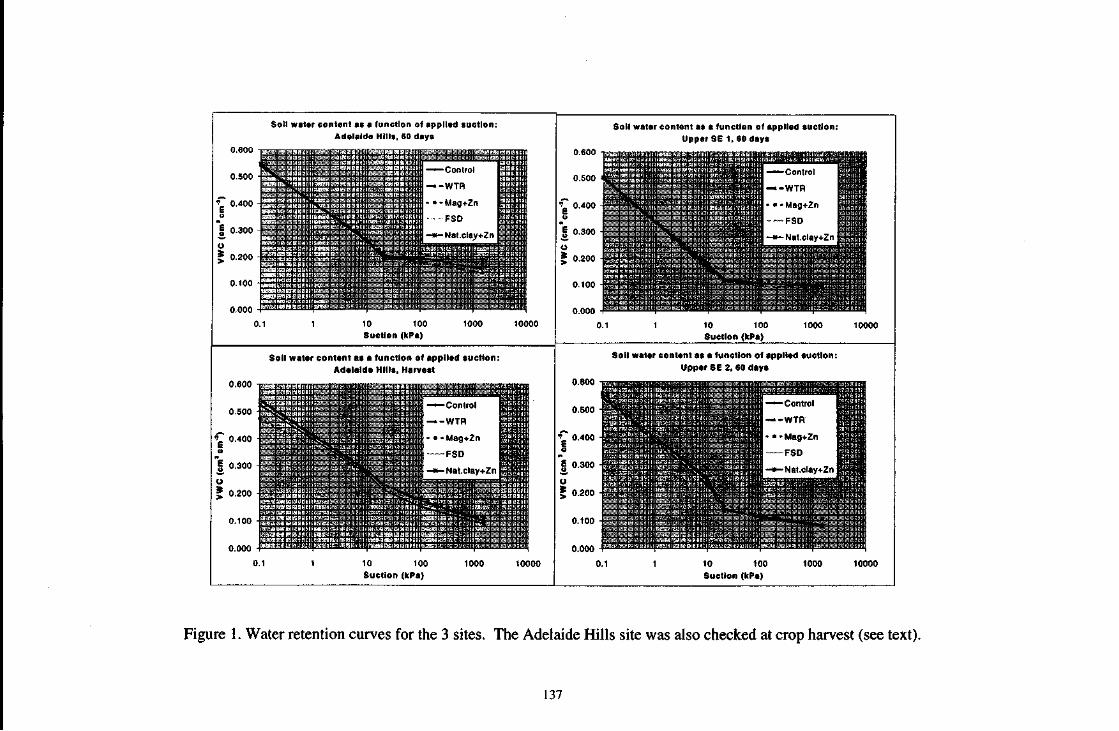
Soil water content as a function of applied suction: Adelaide Hills, 60 days
0.000
10 100 Suction (kPa)
1000
Soil water content as a function of applied suction: Adelaide Hills, Harvest
0.600
0.500
0.400
0.300
0.200
0.100
10 100 Suction (kPa)
10000
Soil water content as a fun Upper SE 1
0.1 10 Suctio
Soil water content as a func Upper SE 2,
0.600 T 1 rr MNT 1 T ill 1 .11
.» H J l * . 1 ^ * 3 > 1 1 •i •i
1
t - j - j [ - j - j
Mill . .. ,. ttlll
tin. 1 0.000 -1 ' LU LiUj—1 iijh
0.1 10 Suctio
Figure 1. Water retention curves for the 3 sites. The Adelaide Hills site was also chec
137

Aeration as a function of water content: Adelaide Hills, 60 d
g 0.45
I 040
£ 0.35
S 0-30
v 0.25
f 0.20 0.15
- I I I ' • — I
—"—Control
— WTR
- • - Mag+Zn
FSD
*" ^ter-— WTR
- • - Mag+Zn
FSD
* ^ -— WTR
- • - Mag+Zn
FSD *%*
— WTR
- • - Mag+Zn
FSD
Nat clay+Zn
1 ; , _ ' I
0.00 0.10 0.15 0.20
VWC (cm'cm 4 )
0.25 0.30
Aeration as a function of wat
„ 0.50
E 0.45
"E 0.40
£ 0.35
| 0.30
•o 0.25
2 0.20 <
0.15
—"—Control
— WTR
• • Mag+Zn
• FSD
—"—Control
— WTR
• • Mag+Zn
• FSD
—"—Control
— WTR
• • Mag+Zn
• FSD
—"—Control
— WTR
• • Mag+Zn
• FSD
—"—Control
— WTR
• • Mag+Zn
• FSD
— Nat clay+Zn
0.00 0.05 0
VWC (
Aeration as a function of water content: Adelaide Hills: Harvest
Aeration as a function of wat
£ 0.50 -i
0.50
0.45
0.40
0.35
0.30
0.25
0.20
£ 0.35 —
0.15
^*nt&_* —•— Control
— - WTR
• • • - Mag+Zn
- - FSD
^*nt&_* —•— Control
— - WTR
• • • - Mag+Zn
- - FSD
—•— Control
— - WTR
• • • - Mag+Zn
- - FSD
—•— Control
— - WTR
• • • - Mag+Zn
- - FSD
—•— Control
— - WTR
• • • - Mag+Zn
- - FSD
• Nat clay+Zn
0.00 0.05 0.10 0.15 0.20
VWC (cm'cm 3 )
0.25 0.00 0.10 0
VWC (
Figure 2. Aeration status curves for the 3 sites. The Adelaide Hills site was also chec
138

Soil Resistance to Penetration as a Function of Water Content: Adelaide Hills, 60 days
2500 - 1 ' "
ance
n c
> c
11 ft I ,00° - — - WTR
- • - Mag+Zn >J •-.._ 1
o •
— FSD
-Na t clay+Zn
1 1-=5^£4*
0.00 0.05 0.10 0.15 0.20 0.25
VWC (cm'cm"*)
0.30
Soil Resistance to Penetration as a Function of Water Content: Adelaide Hills, Harvest
2500
2000
5 a 1500 a a. 9 J£ a — 1000
500
V S |
>£• 1
—•—Control
. - WTR
FSD
1<5S « . X ^
—•—Control
. - WTR
FSD w » K
" m
- - • - M - - N2
ig+^n
t clay+Zn
^•• ip-Ji i
0.00 0.05 0.10 0.15 0.20
VWC (cm'cm')
0.25 0.30
Soil Resistance to Penetratio Content: Upper S
0.00 0.05 0.10
VWC
Soil Resistance to Penetratio Content: Upper S
tan
cc
n c
3 C
1 £ " ^ ! * B a I 500 " ^ ! * B a
0 -
0.00 0.05 0.10
VWC
Figure 3. Soil resistance curves for the 3 sites. The Adelaide Hills site was also check
139

APPENDIX 11 Grower brochures 1 - Managing cadmium in potatoes
for quality produce
140

Managing cadmium
in potatoes for
quality produce
HRDC
4 CSIRO
l i b FL. .
Consumer demand for quality products is increasing.
Concern about the presence of chemical impurities has resulted
in monitoring and research into food quality in Australia.
Cadmium has been indentified as being of potential concern.
Compiled by Cooperative Research Centre for Soil & Land Management and CSIRO Division of Soils ISBN1 876162 12 0 - 6/96CRCSLM

Grower checks if tuber cadmium levels are high
START
t Reduced risk
of cadmium problem
If irrigation is used, does the water have a
chloride level greater than 450 mg/l or total
dissolved salts greater than 750 mg/l
1 Yes
Yes
•
Is soil pH in water greater than 8.0 or in
calcium chloride greater than 7.3
Change site or water source
if possible
No
Do you intend growing Toolangi i Yes Delight, Kennebec, Crystal, or Nadine
i No
Is the soil pH in water less than 5.5 or in calcium chloride
less than 4.8
hange variety if possible
• No
Is the soil likely to be low in available zinc
eg EDTA zinc less than 6 mg/kg
T No
Try to choose a less acid soil for the crop
or begin a liming program
Add Zn enriched fertiliser at planting
Has the soil been tested and found to have adequate phosphorus levels
(consult your local agronomist)
Yes Reduce phosphorus
fertiliser rates
No
Reduced risk of cadmium
problem

M a n a g e m e n t p r a c t i c e s t o m i n i m i s e c a d m i u m leve ls
Selection of nitrogen and
potassium fertilisers to
minimise cadmium uptake
Glasshouse and field experiments have shown
that changing nitrogen fertiliser has little
impact on tuber cadmium concentrations.
Changing from potassium chloride to
potassium sulphate has decreased tuber
cadmium by up to 30% in areas where
chloride in soil and irrigation water is low.
However potassium sulphate costs more.
Addition of zinc
Banding 50-100 kg zinc/ha as zinc sulphate at
planting has significantly reduced tuber cadmium
concentrations at some trial sites. These rates are
more than is usually applied to treat zinc deficiency in
potatoes.
Zinc broadcast and incorporated into the soil is
suggested as a trial where the concentration of EDTA
zinc in the soil is less than 6mg/kg. Rates of 30-100
kg zinc sulphate/ha could be used (consult your
agronomist).
PROBLEM
Cadmium accumulating cultivar
High cadmium fertiliser
High chloride in irrigation
water
Low organic matter
Zinc deficiency
Sandy, highly acidic soil
Low zinc
High Zinc
Site 1 Site 2 Site 3 Site 4 Site 5
Effect of zinc on tuber cadmium
Zinc deficiency has not been widely observed in
Australia, so it is unlikely that the zinc will increase
potato yields. Any effect of zinc on tuber cadmium
should last several years.
Cadmium content of the zinc fertiliser should be
checked before using, as the cadmium content of trace
element products is normally higher than standard
NPK fertilisers.
SOLUTION
Cadmium excluding cultivar Low cadmium fertiliser
Low chloride irrigation
Crop residues
Less acid soil
High clay soil
High organic matter
Managing cadmium effectively means implementing a range of practices as a total system. In paddocks where tuber cadmium concentrations are already high, the impact may be small in the short term, but sound management will be essential to assist control of long term cadmium levels.

What is cadmium?
Cadmium is a widespread naturally occurring element, present in soils, rocks, waters, plants and animals. It occurs naturally with deposits of lead and zinc, but unlike zinc is not essential to life. Cadmium can accumulate in humans, and high levels can affect human health.
Why is cadmium a problem?
• There is a smaller safety margin in foods, between
levels of cadmium and regulatory health limits,
compared to other heavy metals such as lead and
mercury.
• Cadmium is concentrated in particular parts of
plants. Leaves contain the most, followed by
storage roots and tubers, seeds or grain and fleshy
fruits.
• Human intake of cadmium is through food
consumption, smoking and occupational exposure.
Greater use of rock phosphate from the United States, Africa and the Middle East has reduced cadmium inputs to soils.
Cadmium levels in Australian
food and exports
• Dietary intake of cadmium in Australia is low by
world standards and our food exports have a "clean"
reputation worldwide. To maintain this quality
advantage we need to minimise any potential
cadmium accumulation in food products.
Sources of cadmium
• Natural levels in soil range from less than 0.1 mg/
kg to 0.5 mg/kg, or about 0.1 to 0.7 kg cadmium/
hectare in the top 10 centimetres of soil.
• Rain and irrigation water generally have very low
cadmium concentrations. Sewage sludges may
contain cadmium as an impurity.
• Cadmium in the atmosphere may be high in the
vicinity of industrial activities such as smelting, but
in most agricultural regions the amounts added to
the soil from the atmosphere are minimal.
• Phosphatic fertilisers can
contain high levels of
cadmium depending upon the
source of rock phosphate.
Trace element fertilisers and
phosphogypsum also may
contain high levels. Nitrogen
and potassium fertilisers
normally have a very low
cadmium content.
The Fertiliser Industry
Federation of Australia (FIFA)
has agreed to progressively
reduce the levels of cadmium
in phosphate fertilisers by making greater use of rock
phosphate with low cadmium content.
The fertiliser industry has adopted a voluntary limit
of 250 mg cadmium per kg of phosphorus in
horticultural fertilisers, which are generally applied
at higher rates than fertilisers for pastures or other
crops.

ATMOSPHERE
How is cadmium taken
up by plants ?
• Plants absorb most of their cadmium
from soil through their roots.
• Cadmium in soil readily attaches to
clay particles and organic matter,
making it less available for uptake by
plants. Sandy soils with low clay
content and organic matter are likely
to result in a higher uptake.
• The availability of cadmium to plants
decreases as soil pH increases, or as
soils become more alkaline.
• Zinc and cadmium uptake by plants occurs in a
similar way, and it appears that if soil zinc levels
are low then more cadmium will be taken up.
• Cadmium in soil tends to remain in the surface
layers where it is available to plants. It can be
removed by erosion or by leaching from very light
sandy acid soils.
SOURCES OF CADMIUM UPTAKE IN POTATOES
IRRIGATION WATER PHOSPHATIC
FERTILIZER
NATURAL SOIL CADMIUM
A regular testing program of the harvested crop is recommended.
• Higher concentrations of chloride in the soil appear
to mobilise cadmium and increase uptake by plants.
This could occur from irrigation with saline water,
in areas subject to dryland salinisation, or from the
intensive use of chloride based fertilisers.
• Uptake varies considerably between different plant
species and between varieties or cultivars.
• Cadmium present in farm produce can also be as a
result of soil or dust contamination either in the field
or during processing, as well as by direct uptake
from the soil.
How do you know you have a
cadmium problem ?
In most cases you can not tell visually if a plant has
high cadmium. The concentration of cadmium needs
to be measured. Plant symptoms would only be
evident in grossly contaminated soils in industrial or
urban areas and not in agricultural soils.
A regular plant testing program is recommended for
growers. Tuber samples of the harvested crop should
be forwarded to accredited laboratories as cadmium
analysis is a specialised service.
The Australia New Zealand National Food Authority
currently has set a limit for potatoes in the domestic
market of 0.05 mg/kg cadmium on a fresh weight
basis. This is lower than many other countries who
have initiated similar limits, and is currently under
review.
There are no critical levels for cadmium in
agricultural soils.

M a n a g e m e n t p r a c t i c e s t o m i n i m i s e c a d m i u m leve ls
Use of phosphatic fertilisers with low cadmium content It is recommended that low cadmium fertilisers are
used. The impact of this on reducing tuber cadmium
levels at sites with a long phosphate fertiliser history
is only likely to occur over the medium to long term.
Your supplier will be able to advise you on the
cadmium content of fertilisers. Look for products of
less than 250 mg cadmium per kg of phosphorus.
Such products are commercially available. Where
repeated high applications of phosphorus (that is
greater than 100kg per crop) are anticipated,
fertilisers of less than 150mg cadmium per kg of
phosphorus are desirable.
Where a paddock has adequate soil phosphorus
levels for potatoes (for critical levels consult your
local agronomist) phosphorus rates can be reduced
as yield response will be limited, and further
cadmium will be added through the fertiliser
application.
Maintain or increase soil organic matter
There is good evidence that organic matter helps to
reduce cadmium availability to plants.
Soil organic matter is generally built up by:
• the retention of crop residues after harvest
• use of green manure crops
• pasture phases in crop rotations
• significantly reducing the number of crop
cultivations
The build-up or breakdown of soil organic matter is
a slow process and significant changes only occur in
the medium to long term, unless organic matter is
introduced from external sources such as manures.
Avoid use of irrigation water with high chloride levels Field experiments have shown that increased chloride
content in the topsoil will increase tuber cadmium
levels.
A major source of chloride is likely to be saline
irrigation water. Experiments have confirmed
increases in tuber cadmium levels with increasing
chloride in irrigation water. This effect is less in a
highly alkaline soil, that is pH (water) is greater than
8.0 or pH (calcium chloride) is greater than 7.3.
High soil chloride may also occur in areas subject to
increasing dryland salinisation, due to rising
groundwater levels. No research has been carried out
to confirm this, but as a precautionary measure it is
recommended that potatoes are not grown in these
areas.
Irrigation waters with greater than 450 mg/litre
chloride, or total dissolved salts greater than 750 mg/
litre (equivalent to an electrical conductivity of about
1.2dS/m) have a high risk of producing tubers with
high cadmium concentrations.
Irrigation water chloride
Tuber cadmium versus chloride concentration in irrigation water at 150 trial sites in southern Australia

Management practices to minimise cadmiunn levels
Varietal selection Data collected from CSIRO and state department
trials have suggested the following variety ratings
for susceptibility to cadmium uptake.
High
Toolangi Delight, Kennebec, Crystal, Nadine
Medium
Wilcrisp, Sebago, Nooksack, Winlock, Tarago,
Pontiac, Atlantic, Desiree, Delaware
Low
Wilwash, Russet Burbank, Lemhi Russet
Low or medium rated varieties are recommended
where the likelihood of cadmium uptake is high.
Correction of soil pH.
In highly acid soils (pH in water of less than 5.5, or
pH in calcium chloride less than 4.8) a liming
program should be initiated to increase soil pH.
Aim to maintain soil pH (water) between 6.2 and
6.7, or pH (calcium chloride) between 5.5 and 6.0.
Avoid overtiming which can induce problems of
micro-nutrient deficiency and the disease common
scab.
Field studies have shown that lime has had little or
no effect on tuber cadmium concentrations in the
year of application. However, reductions have
occurred 2-3 years later.
Potatoes are tolerant of low pH values and so yield
increases by liming are unlikely, but responses in
crops and pasture during other phases of the rotation
are possible.
Field experiments with gypsum were ineffective in
reducing tuber cadmium levels and resulted in some
small increases. Gypsum has little or no effect on soil
pH, ie it is not a liming agent, but is used to reduce
the effects of high sodicity in soil, such as hard
setting surface crusts or waterlogging. Naturally
occurring (mined) gypsum should be considered in
place of phosphogypsum for the treatment of sodic
soils to be used for potato production, particularly if
cadmium uptake is already high. Phosphogypsum is
a by-product from the manufacture of phosphatic
fertilisers.
Select varieties with low or medium susceptibility to cadmium uptake
A liming program is needed in highly acid soils
^ j L
Year 1 (lime applied)
Year 2 Year 3
An example of tuber cadmium levels in response to liming an acid sandy loam soil

Contacts for further information
General enquiries Dr Mike McLaughlin CSIRO Division of Soils/ CRC for Soil and Land Management Phone: 08 8303 8433 Fax: 08 8303 8565 Email: [email protected]
CSIRO A U S T R A L I A
Western Australia Mr Allan McKay Agriculture WA Phone: 09 368 3820 Fax: 09 367 2625
South Australia Mr Norbert Maier South Australian Research & Development Institute Phone: 08 8303 9423 Fax: 08 8303 9424
Victoria Mr Andrew Henderson Agriculture Victoria Phone: 03 9210 9222 Fax: 03 9800 3521
Tasmania Dr Leigh Sparrow Department of Primary Industry & Fisheries, Tasmania Phone: 003 6336 5379
Fax: 003 6344 4961
New South Wales Mr Col Bower NSW Agriculture Phone: 063 913 100 Fax: 063 913 605
Queensland Mr George Rayment Queensland Department of Primary Industries Phone: 07 3896 9487 Fax: 07 3896 9623
Acknowledgments J. Bourne Land Management Consultant, Cooperative Research Centre for Soil & Land Management
M. Grope, Design, Cooperative Research Centre for Soil & Land Management
Agriculture WESTERN AUSTRAUA
S A R D I
© SOUTH AUSTRALIAN
RESEARCH AND DEVELOPMENT
INSTITUTE
Vgk AGRICULTURE | ^ j V I C T O R I A
Department of Primary Industry and Fisheries
T A S M A N I A
•MfA i NSW Agriculture
N A T U R A L RESOURCES
Queensland
Australian Potato Industry Council F I F A I rt carp oral ad in Hew Sottlh Walit
APPENDIX 12 Grower brochures 2 - Cadmium in potatoes - managing the risk from saline irrigation water
141

Cadmium in potatoes
Consumer demand for quality produce is increasing.
Potato tubers exceeding the Maximum Permitted Concentration (MPC) for cadmium set by the Australia New Zealand Food Authority (ANZFA) cannot be used in the domestic market and cause problems in international trading.
Predicting the risk of producing potato crops above the MPC is an important part of managing cadmium in your cropping system.
This leaflet considers the relationship between cadmium concentration of potato tubers and quality of irrigation water.

The problem
In 1997 ANZFA revised limits for cadmium (a toxic heavy metal) in potatoes and other vegetables. The MPC is 0.1 mg cadmium/kg fresh weight, for root, tuber and leafy vegetables. The marketing of these vegetables in Australia with cadmium concentrations above this MPC is not permitted.
Elevated levels of chloride in water increases the solubility of cadmium and other elements present in soil, which increases their uptake by plants. In Australia, salinity in surface and ground-water is due mainly to chloride.
Research has confirmed increases in potato tuber cadmium levels with increasing chloride concentrations in irrigation water. The risk is higher in soils already high in cadmium, usually the result of past heavy applications of phosphate fertiliser containing high levels of cadmium as an impurity.
Cultural practices can help to reduce the risk of high cadmium concentration occuring in potato tubers. See the brochure 'Managing cadmium in potatoes for quality produce.'
Research results The probability of cadmium exceeding the MPC of 0.1 mg/kg has been estimated from measurements of salinity of irrigation water at 130 irrigated potato sites in five states. See Figure 1.
Figure 1 shows that the probability of cadmium concentrations in tubers reaching the MPC is low when using irrigation water with a conductivity less than 2.0 dS/m. The probability then rapidly increases to above 50% as the salinity of the irrigation water increases above 3.0 dS/m.
Growers are advised to use water wi th a conductivity of
less than 2.0 dS/m.
Research also indicated that the probability of cadmium levels of tubers reaching the MPC was increased if the soil contained more than 15 ug/kg cadmium extracted in 0.01 M calcium chloride. Soil cadmium levels are likely to be high in paddocks with a history of heavy applications of phosphate fertiliser containing high levels of cadmium as an impurity.
If possible, avoid growing potatoes on these soils.
o 100 Q. 2 ^k
1 90 ^^H
o> .S 80 TJ a <D
8 70 ^ H g U ' : . J^H o c .2 60 ^^H
«=• ^ H
ince
ntr
perc
en
50 fl O ~" 40 ^^t •o - j * O % 30 n o 20 "o >*
bill
10
JS •yfe*?"''1" o a
0.5 1.0 1.5 2.0 2.5 3.0 3.5 4.0
Electrical conductivity of irrigation water (dS/m)
Figure 1. Probabilities of tuber cadmium levels at the MPC with varying levels of salinity of irrigation water
If i rr igat ion water salinity is above 2.0 dS/m Chose an alternative irrigation water source with lower salinity.
Select varieties with low or medium susceptibility to cadmium uptake including; Wilwash, Russet Burbank, Lemhi Russet, Ranger Russet, Winlock, Tarago, Pontiac, Atlantic, Desiree and Delaware.
Use sulphate of potash rather than muriate of potash to supply potassium.
Confirm possible problems in high risk situations with in-crop tuber testing. Test tubers early in the season as research has shown that, when water conductivity remains constant through the season, this gives a good indication of a potential problems.

Testing of irrigation water Conductivity meters
Preplant
To minimise the risk of producing tubers with high levels of cadmium, measure the salinity of irrigation water. Where the water is high in salinity and there are no alternative sources, potatoes should not be grown.
Post planting
Water quality can change markedly during the irrigation season, with salinity often increasing late in the season. Monitoring the salinity level of irrigation water periodically during the season should be undertaken to determine the risk of higher levels of cadmium being taken up by tubers during part of the growing season.
Testing
Water samples can be sent to a laboratory, but cheap hand-held conductivity meters are now available to test your own samples in the field (see conductivity meters).
Sampling the irr igat ion water
5^ If ground water or dam water is used, ensure that the irrigation pump is run for sufficient time to obtain a sample representative of the water in the aquifer or dam.
^ Using a clean plastic or glass 500 ml container, rinse it with the water to be tested prior to taking the sample.
> . Fill the container with a sample of 500 ml of irrigation water.
Testing the irr igat ion water with a field meter
^ Calibrate the small hand-held conductivity meter according to the manufacturers instructions. Wash the electrodes with rainwater or distilled water before and after each measurement.
5^ Measure the electrical conductivity (EC) of the water, in deciSiemens per metre (dS/m). Note: 1 dS/m=100mS/m
If you cannot access a field meter, consider purchasing one for approximately $100.
•Meters are electronic and require calibration. They need to be operated and stored with care (eg not in extremes of temperature).
Seek the advice of a reputable supplier of scientific equipment who will advise which meter best suits your requirements.
Figure 2. Measuring electrical conductivity with a hand-held meter.
Suppliers of conductivity meters include;
Crown Scientific Pty Ltd
NSW : Toll Free: 008 449 115 Tel: 02 9602 7677 Vic : Toll Free: 008 134 175 Tel: 03 9764 4722 Qld : Toll Free: 008 773 442 Tel: 07 3252 1066 SA: Tel: 08 8347 3310 WA: Tel: 08 9352 7000 Tas : Tel: 03 6229 7437
Selby Biolab
Tel: 13 2991 Free Fax: 1800 067 639 Melbourne, Sydney, Brisbane, Perth, Adelaide, Darwin, Hobart, Newcastle, Townsville.
The Cooperative Research Centre for Soil and Land Management does not warrant or recommend any particular manufacturer supplier or model of meter.

Tuber sampling >. For each soil type, potato variety or management
unit, take a representative sample of at least 25 small tubers about 50-70 days after planting.
^ Sample the crop in at least five locations in the field, digging up about 2 metres of row in each location.
^ Take at least 5 tubers (any size) from each of the five locations and bulk the tubers together. Ensure no damaged or diseased tubers are included in the sample.
> . Brush off soil and store the tubers in a clean paper bag in a cool place. Send the sample to a laboratory within 3 days for analysis of cadmium concentration. Your state contact can provide details of a reputable laboratory.
Sampling of plant tops to estimate cadmium concentrations in tubers is not recommended, as levels vary with different stages of crop growth.
Acknowledgments
This brochure is based on research supervised by Dr Mike McLaughlin, Cooperative Research Centre for Soil & Land Management (CRCSLM) Adelaide, in collaboration with Norbert Maier from the South Australian Research and Development Institute, and representatives from state agencies in Western Australia, Tasmania, New South Wales and Victoria.
The brochure has been prepared by John Bourne and Mark Seeliger, CRCSLM, design and layout by Mary-Anne Fiebig, CRCSLM. Helpful comment was given by Leigh Walters, Manager, Australian Potato Industry, Technology Transfer Project.
Funding for printing has been provided by the Horticultural Research and Development Corporation.
ISBN: 1 876162 49 X CRCSLM/CTT01/99
© Cooperative Research Centre for Soil & Land Management, established under the Australian Government's Cooperative Research Centres Program, is an unincorporated joint venture, the participants being the CSIRO, The University of Adelaide, the South Australian Minister for Primary Industries, Natural Resources and Regional Development and the State of Victoria (Department of Natural Resources & Environment: Agriculture Victoria), which hold the publication copyright as tenants in common.
Further information: Managing cadmium in potatoes for quality produce. CRC for Soil & Land Management, Adelaide. CRCSLM/6/96, available from your state contact.
Contacts: Dr Mike McLaughlin, CRC Soil and Land Management.
Tel: 08 8303 8433 Fax: 08 8303 8565.
Mr Norbert Maier, South Australian Research and Development
Research Institute, Primary Industries and Resources SA.
Tel: 08 8303 9423 Fax: 08 8303 9424.
Mr Allan McKay, Agriculture WA.
Tel: 08 9368 3820 Fax: 08 9367 2625.
Mr Andrew Henderson, Agriculture Victoria.
Tel: 03 9210 9222 Fax: 03 9800 3521.
Dr Leigh Sparrow, Tasmanian Institute ot Agricultural Research.
Tel: 03 6336 5379 Fax: 03 6336 5395.
Mr Stephen Wade, NSW Agriculture. Tel: 03 5883 1644.
Mr George Rayment, Queensland Department of Natural
Resources. Tel: 07 3896 9487 Fax: 07 3896 9623.
Cooperative Research Centre for Soil & Land Management Postal address: PMB 2, Glen Osmond, SA 5064 Telephone: 61 8 8303 8670, Facsimile: 61 8 8303 8699 Email: [email protected] WWW: http://www-crcslm.waite.adelaide.edu.au