Embed Size (px)
Citation preview

STRUCTURAL CONCRETE SOFTWARE
ADAPT-PT 2010
Program Verification and Examples
v0310_0-2
Copyright 2010
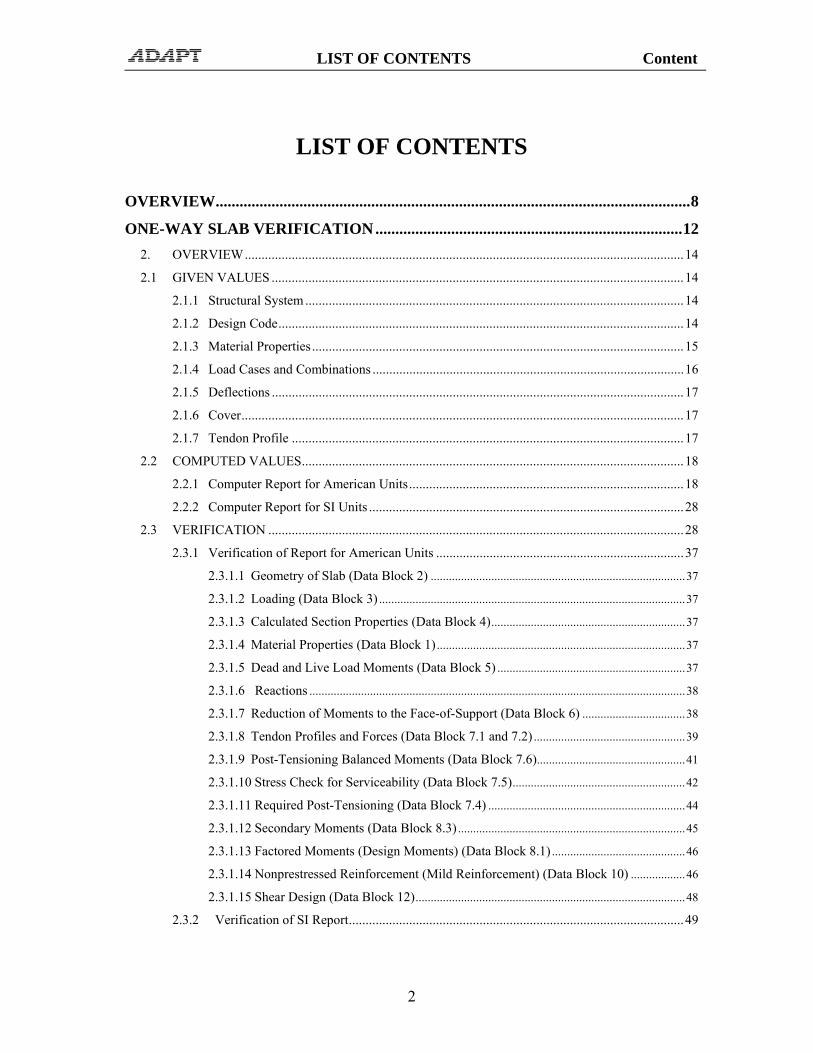
LIST OF CONTENTS Content
2
LIST OF CONTENTS
OVERVIEW ....................................................................................................................... 8
ONE-WAY SLAB VERIFICATION ............................................................................. 12 2. OVERVIEW ................................................................................................................................... 14
2.1 GIVEN VALUES ........................................................................................................................... 14
2.1.1 Structural System ................................................................................................................. 14
2.1.2 Design Code ......................................................................................................................... 14
2.1.3 Material Properties ............................................................................................................... 15
2.1.4 Load Cases and Combinations ............................................................................................. 16
2.1.5 Deflections ........................................................................................................................... 17
2.1.6 Cover .................................................................................................................................... 17
2.1.7 Tendon Profile ..................................................................................................................... 17
2.2 COMPUTED VALUES .................................................................................................................. 18
2.2.1 Computer Report for American Units .................................................................................. 18
2.2.2 Computer Report for SI Units .............................................................................................. 28
2.3 VERIFICATION ............................................................................................................................ 28
2.3.1 Verification of Report for American Units .......................................................................... 37
2.3.1.1 Geometry of Slab (Data Block 2) .................................................................................... 37
2.3.1.2 Loading (Data Block 3) ..................................................................................................... 37
2.3.1.3 Calculated Section Properties (Data Block 4) ................................................................ 37
2.3.1.4 Material Properties (Data Block 1) .................................................................................. 37
2.3.1.5 Dead and Live Load Moments (Data Block 5) .............................................................. 37
2.3.1.6 Reactions ............................................................................................................................ 38
2.3.1.7 Reduction of Moments to the Face-of-Support (Data Block 6) .................................. 38
2.3.1.8 Tendon Profiles and Forces (Data Block 7.1 and 7.2) .................................................. 39
2.3.1.9 Post-Tensioning Balanced Moments (Data Block 7.6)................................................. 41
2.3.1.10 Stress Check for Serviceability (Data Block 7.5) ......................................................... 42
2.3.1.11 Required Post-Tensioning (Data Block 7.4) ................................................................. 44
2.3.1.12 Secondary Moments (Data Block 8.3) ........................................................................... 45
2.3.1.13 Factored Moments (Design Moments) (Data Block 8.1) ............................................ 46
2.3.1.14 Nonprestressed Reinforcement (Mild Reinforcement) (Data Block 10) .................. 46
2.3.1.15 Shear Design (Data Block 12) ......................................................................................... 48
2.3.2 Verification of SI Report .................................................................................................... 49
LIST OF CONTENTS Content
3
TWO-WAY SLAB VERIFICATION ............................................................................ 51 3. OVERVIEW ................................................................................................................................... 53 3.1 GIVEN VALUES ........................................................................................................................... 53
3.1.1 Structural System ................................................................................................................. 54
3.1.2 Design Code ......................................................................................................................... 54
3.1.3 Material Properties ............................................................................................................... 54
3.1.4 Load Cases and Combinations ............................................................................................. 55
3.1.5 Deflections ........................................................................................................................... 56
3.1.6 Cover .................................................................................................................................... 56
3.1.7 Tendon Profile ..................................................................................................................... 56
3.2 COMPUTED VALUES .................................................................................................................. 57
3.2.1 ADAPT-PT Report In American System Of Units .............................................................. 58
3.2.2 ADAPT-PT Report in SI System of Units ........................................................................... 69
3.3 VERIFICATION ............................................................................................................................ 77
3.3.1 Verification of Report for American Units .......................................................................... 77
3.3.1.1 Geometry of Slab (Data Block 2) ................................................................................... 77
3.3.1.2 Loading (Data Block 3.1) ................................................................................................. 77
3.3.1.3 Calculated Section Properties (Data Block 4) ............................................................... 77
3.3.1.4 Material Properties (Data Block 1) ................................................................................. 77
3.3.1.5 Tendon Profile, Force and Balanced Loading (Data Block 7) ................................... 77
3.3.1.6 Structural System Line (Centerline) Moments ............................................................. 77
3.3.1.7 Column Stiffness Kc (Reference Numbers F3, F4, See Table 3.2.1-1) .................... 78
3.3.1.8 Dead and Live Load Moments (Data Block 5) ............................................................. 79
3.3.1.9 Reduction of Moments to the Face-of-Support ............................................................. 80
3.3.1.10 Stresses (Data Block 7.5) ................................................................................................ 81
3.3.1.11 Secondary Moments (Data Block 8.3) .......................................................................... 82
3.3.1.12 Factored Moments (Design Moments) (Data Block 8.1) ........................................... 85
3.3.1.13 Nonprestressed (Mild) Reinforcement (Data Block 10) ............................................. 85
3.3.1.14 Punching Shear Capacity (Data Block 13) ................................................................... 88
3.3.1.15 Deflections (Data Block 14) ........................................................................................... 91
3.3.2 Verification of SI Report ...................................................................................................... 93
CAST-IN-PLACE T-BEAM VERIFICATION ............................................................ 96 4. OVERVIEW ................................................................................................................................... 98 4.1 GIVEN VALUES ........................................................................................................................... 98
4.1.1 Structural System ................................................................................................................. 99
4.1.2 Design Code ......................................................................................................................... 99

LIST OF CONTENTS Content
4
4.1.3 Material Properties ............................................................................................................... 99
4.1.4 Load Cases and Combinations ........................................................................................... 100
4.1.5 Deflections ......................................................................................................................... 101
4.1.6 Cover .................................................................................................................................. 101
4.1.7 Tendon Profile ................................................................................................................... 101
4.2 COMPUTED VALUES ................................................................................................................ 102
4.2.1 Computer Report for American Units ................................................................................ 102
4.2.2 Computer Report for SI Units ............................................................................................ 110
4.3 VERIFICATION .......................................................................................................................... 117
4.3.1 Verification of Report for American Units ........................................................................ 117
4.3.1.1 Geometry of Beam (Data Block 2) .............................................................................. 117
4.3.1.2 Loading (Data Block 3) ................................................................................................. 117
4.3.1.3 Calculated Section Properties (Data Block 4) ............................................................ 117
4.3.1.4 Material Properties (Data Block 1) .............................................................................. 118
4.3.1.5 Centerline Moments (Data Block 5) ............................................................................ 118
4.3.1.6 Tendon Profile and Forces (Data Block 7) ................................................................. 118
4.3.1.7 Required Post-Tensioning Forces (Data Block 7.4) .................................................. 120
4.3.1.8 Service Stresses (Data Block 7.5) ................................................................................ 121
4.3.1.9 Secondary Moments (Data Block 8.3) ........................................................................ 122
4.3.1.10 Factored Moments and Reactions (Data Block 8.1) .................................................. 123
4.3.1.11 Nonprestressed (Mild) Reinforcement (Data Block 10) ........................................... 123
4.3.1.12 Shear Design (Data Block 12) ...................................................................................... 125
4.3.2 Verification of SI Report .................................................................................................... 127
SPECIFIC VERIFICATION ........................................................................................ 129 5.1 FIXED END MOMENTS OF NON-PRISMATIC SPANS ......................................................... 131
5.1.1 Fixed End Moments ........................................................................................................... 133
5.1.2 Variations in Moment of Inertia ......................................................................................... 133
5.1.3 Stiffness Coefficients and Carry Over Factors ................................................................... 135
5.2 REDUCTION OF MOMENTS TO FACE-OF-SUPPORT .......................................................... 136
5.2.1 Secondary Moments ........................................................................................................... 138
5.3 BALANCED LOADING ............................................................................................................. 139
5.3.1 Generation of Balanced Loading ....................................................................................... 139
5.3.2 Average Balanced Loading ................................................................................................ 142
5.4 REQUIRED POST-TENSIONING FORCE ................................................................................ 142
5.4.1 Based on Stress Criteria ..................................................................................................... 143
5.4.2 Providing an Average Minimum Compression .................................................................. 143
5.4.3 Required Force Based on Tendon Spacing ........................................................................ 144

LIST OF CONTENTS Content
5
5.5 SERVICE STRESSES .................................................................................................................. 144
5.6 SECONDARY MOMENTS ......................................................................................................... 147
5.7 FACTORED MOMENTS AND DESIGN MOMENTS .............................................................. 150
5.8 MILD REINFORCEMENT .......................................................................................................... 151
5.8.1 Reinforcement Required for Strength ................................................................................ 151
5.8.1.1 ACI Strength Requirements .......................................................................................... 151
5.8.1.2 UBC’s Strength Requirement ....................................................................................... 154
5.8.2 Code Specified Minimum Reinforcement .......................................................................... 155
5.8.2.1 One-way system .............................................................................................................. 155
5.8.2.2 Two-Way System ........................................................................................................... 156
5.9 BEAM SHEAR ............................................................................................................................. 158
5.10 PUNCHING SHEAR .................................................................................................................... 185
5.10.1 Overview ............................................................................................................................ 185
5.10.1.1 Material Properties ......................................................................................................... 187
5.10.2 Relationships ...................................................................................................................... 188
5.10.2.1 Interior Column (Fig. 5.10.2-1) .................................................................................... 189
5.10.2.2 End Column (Refer Fig. 5.10.2-2) ............................................................................... 190
5.10.2.3 Edge Column (Refer Fig. 5.10.2-3) ............................................................................. 191
5.10.2.4 Corner Column (Refer Fig. 5.10.2-5) .......................................................................... 192
5.10.2.5 Support with Drop Cap (Refer Fig. 5.10.2-7) ............................................................ 193
5.10.3 Punching Shear Stress Calculations ................................................................................... 194
5.10.3.1 Support #1 – Corner Column (Refer Fig. 5.10.2-5) .................................................. 194
5.10.3.2 Support #2 – Edge Column (Refer Fig. 5.10.2-3)...................................................... 197
5.10.3.3 Support #3 – Edge Column (Refer Fig. 5.10.2-4)...................................................... 199
5.10.3.4 Support #4 – Interior Column (Refer Fig. 5.10.2-1) ................................................. 201
5.10.3.5 Support #5 – Interior Column with Drop Cap (Refer Fig. 5.10.2-7) ...................... 207
5.10.3.6 Support #6 – End Column (Refer Fig. 5.10.2-2) ....................................................... 211
5.10.4 Computed Values ............................................................................................................... 214
5.10.4.1 Computer Report for American Units ......................................................................... 214
5.10.4.2 Computer Report for SI Units ....................................................................................... 222
5.11 INITIAL STRESS ANALYSIS .................................................................................................... 228
5.11.1 Computer Report ................................................................................................................ 229
5.11.2 Verification ........................................................................................................................ 235
5.12 DEFLECTION .............................................................................................................................. 237
5.12.1 Background ........................................................................................................................ 237
5.12.2 Deflection Computation ..................................................................................................... 237
5.12.2.1 Deflection due to Selfweight ........................................................................................ 242

LIST OF CONTENTS Content
6
5.12.2.2 Deflection due to Live Loading .................................................................................... 243
5.12.2.3 Dead Load, Post-Tensioning and Creep/Shrinkage ................................................... 247
5.12.2.4 Dead Load, Post-Tensioning, Live Load and Creep/Shrinkage .............................. 247
5.12.3 Computation of Equivalent Moment of Inertia, Ie ............................................................. 247
5.13 ONE-WAY SHEAR VERIFICATION FOR BRITISH VERSION ............................................. 250
5.13.1 Beam Example (MNL5-3B) ............................................................................................... 257
APPENDIX ..................................................................................................................... 275

7

8
Chapter 1
OVERVIEW

9
OVERVIEW Chapter 1
10
This manual supplements the two primary manuals of the program, namely:
• Volume I – User Manual • Volume II – Scope and Theory
The focus of this volume is two-fold. First it provides a detailed verification of practically all aspects of the program computations and code checks. Second, by way of detailed longhand calculations, it shows you the way to independently perform design calculations for post-tensioned building structures. The material presented in this volume covers the design of one-way slabs, column-supported two-way slabs, and flanged beams. The volume concludes with a series of specific verifications, such as balanced loading and hyperstatic (secondary) moments. Beyond its specific application as a supplement to ADAPT-PT 2010 computer program, this volume serves as a suitable educational material for those interested in the design of post-tensioned building structures.

11

12
Chapter 2
ONE-WAY SLAB VERIFICATION

13

ONE-WAY SLAB VERIFICATION Chapter 2
14
2 OVERVIEW The slab selected represents the deck of a one-way slab and beam construction, typical of parking structures. The design values obtained using ADAPT-PT is verified through longhand calculations.
2.1 GIVEN VALUES
The cross-sectional geometry of the slab and the supporting beams are given in Fig. 2.1-1. Other design parameters and particulars of the structure are specified in the following.
FIGURE 2.1-1 2.1.1 Structural System
The structural system is one-way slab construction supported on transverse beams.
2.1.2 Design Code
The design is based on ACI 318-08.

ONE-WAY SLAB VERIFICATION Chapter 2
15
2.1.3 Material Properties
(i) Concrete
Compressive cylinder strength, f’c = 4000 psi (27.58 MPa) Weight = 150 pcf (2403 kg/m3) Modulus of elasticity = 3605 ksi (24856 MPa) Age of concrete at stressing = 3 days Compressive strength at stressing, f’ci = 3000 psi (20.68 MPa)
(ii) Post-Tensioning
Material: Low relaxation, seven wire strand Strand diameter = ½ in (13 mm) Strand area = 0.153 in2 (99 mm2) Modulus of elasticity = 28000 ksi (193054 MPa) Ultimate strength of strand, fpu = 270 ksi (1861.60MPa) Average effective stress (fse) = 175 ksi (1206.59 MPa) System: System unbonded Stressing: Ratio of jacking stress to strand’s ultimate strength
= 0.8
Anchor set = 0.25 in (6.35 mm) Coefficient of angular friction, μ = 0.07 /radian Coefficient of wobble friction, K = 0.0014 rad/ft (0.0046 rad/m) Stress on day 3 Minimum concrete cylinder strength at stressing
= 3000 psi (20.68 MPa)
(iii) Nonprestressed Reinforcement
Yield stress fy = 60 ksi (413.69 MPa) Modulus of elasticity = 29000 ksi (199,949 MPa)
(iv) Design Loading
Dead load Self weight = based on volume Allowance for curbs, lighting, drainage, = 5 psf (0.24 kN/m2)

ONE-WAY SLAB VERIFICATION Chapter 2
16
etc. Total = 5 psf+ sef weight Live load = 50 psf (2.39 kN/m2) (Live load is conservatively not reduced.)
2.1.4 Load Cases and Combinations
(i) Strength Load Combinations
The strength requirement for each member is established using the following factored load combinations:
Primary load combination 1.2*DL + 1.6*LL + 1*HYP Other load combination 1.4*DL + 1*HYP
Where “HYP” is the secondary (hyperstatic) moments, shears and reactions due to post-tensioning.
(ii) Serviceability Load Combinations
Final stresses: The design is selected to be carried out according to the “Transitional” (T) state of stress of the code. That is to say, the maximum hypothetical tensile stresses will be allowed to exceed 6 √f’c but be retained less than 12 √f’c A hypothetical tensile stress equal to 9 * √f’c is set as design target.
Tensile stress (top and bottom) = 9√f’c = 569.21 psi (3.92 MPa) Compressive stress
For sustained load condition = 0.45f’c = 1800 psi (12.41 MPa) For total load condition = 0.60 * f’c = 2400 psi (16.55 MPa)
Load combinations for serviceability check:
Total load condition 1*DL + 1*LL + 1*PT Sustained load condition 1*DL + 0.3*LL + 1*PT
The factors for neither of the above load combinations are spelled out in the code. There selection is based on common practice.
ONE-WAY SLAB VERIFICATION Chapter 2
17
Initial stresses (transfer):
Maximum tension = 3 √f’ci Maximum compression = 0.60 * f’ci
Load combinations for stress check at transfer of prestressing:
U = 1.00 DL + 1.15* PT
2.1.5 Deflections
Having maintained the hypothetical tensile stresses within the limits stated in the preceding, the deflections would be calculated assuming gross cross-sectional properties. Long-term deflections are estimated using a creep coefficient of 2. For the floor slabs the maximum deflections are maintained below the following value with the understanding that the floor structure is not attached to nonstructural elements likely to be damaged by large deflections of the floor: Slabs:
Live load deflection ≤ span/360
2.1.6 Cover
(i) Nonprestressed Reinforcement
Cover to top bars = 1 in (25 mm) Cover to bottom bars = 1 in (25 mm)
(ii) Prestressed Reinforcement
Top cover = 0.75 in (19 mm) for all spans Bottom cover
Interior spans = 0.75 in (19 mm) Exterior spans = 1.50 in (38 mm)
2.1.7 Tendon Profile
In this example, the tendon profile selected is simple parabola. In the first and last spans, the profile is not symmetrical. As a result, the low point of the tendon will not be at midspan.

ONE-WAY SLAB VERIFICATION Chapter 2
18
Interior spans = simple parabola with low point at center Exterior spans = simple parabola with low point at 0.366*L from the left support for first span and 0.634*L for last span from the left support
2.2 COMPUTED VALUES
The computed values are obtained from ADAPT-PT version 2010. The relevant parts of the tabular report are summarized below. Since the structure is symmetrical, only the part of the report that refers to the first half of the structure is reproduced below.
2.2.1 Computer Report for American Units
SIX SPAN ONE WAY SLAB
Monday, March 29, 2010
ONE-WAY SLAB VERIFICATION Chapter 2
19
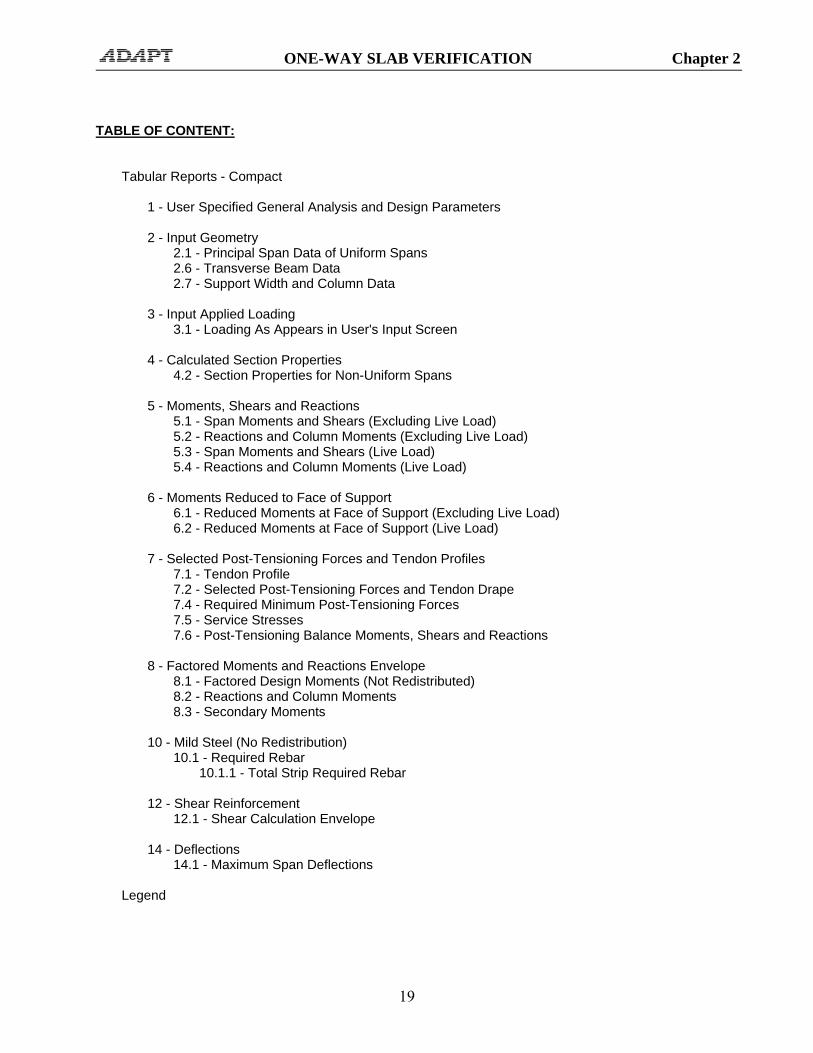
TABLE OF CONTENT: Tabular Reports - Compact 1 - User Specified General Analysis and Design Parameters 2 - Input Geometry 2.1 - Principal Span Data of Uniform Spans 2.6 - Transverse Beam Data 2.7 - Support Width and Column Data 3 - Input Applied Loading 3.1 - Loading As Appears in User's Input Screen 4 - Calculated Section Properties 4.2 - Section Properties for Non-Uniform Spans 5 - Moments, Shears and Reactions 5.1 - Span Moments and Shears (Excluding Live Load) 5.2 - Reactions and Column Moments (Excluding Live Load) 5.3 - Span Moments and Shears (Live Load) 5.4 - Reactions and Column Moments (Live Load) 6 - Moments Reduced to Face of Support 6.1 - Reduced Moments at Face of Support (Excluding Live Load) 6.2 - Reduced Moments at Face of Support (Live Load) 7 - Selected Post-Tensioning Forces and Tendon Profiles 7.1 - Tendon Profile 7.2 - Selected Post-Tensioning Forces and Tendon Drape 7.4 - Required Minimum Post-Tensioning Forces 7.5 - Service Stresses 7.6 - Post-Tensioning Balance Moments, Shears and Reactions 8 - Factored Moments and Reactions Envelope 8.1 - Factored Design Moments (Not Redistributed) 8.2 - Reactions and Column Moments 8.3 - Secondary Moments 10 - Mild Steel (No Redistribution) 10.1 - Required Rebar 10.1.1 - Total Strip Required Rebar 12 - Shear Reinforcement 12.1 - Shear Calculation Envelope 14 - Deflections 14.1 - Maximum Span Deflections Legend

ONE-WAY SLAB VERIFICATION Chapter 2
20
1 - USER SPECIFIED GENERAL ANALYSIS AND DESIGN PARAMETERS
Parameter Value Parameter Value Concrete Post-tensioning
F'c for BEAMS/SLABS 4000.00 psi SYSTEM UNBONDED Ec for BEAMS/SLABS 3605.00 ksi Fpu 270.00 ksi
CREEP factor 2.00 Fse 175.00 ksi CONCRETE WEIGHT NORMAL Strand area 0.153 in 2
UNIT WEIGHT 150.00 pcf Min CGS from TOP 1.00 in Tension stress limits / (f'c)1/2 Min CGS from BOT for interior spans 1.00 in
At Top 9.000 Min CGS from BOT for exterior spans 1.75 in At Bottom 9.000 Min average precompression 125.00 psi
Compression stress limits / f'c Max spacing / slab depth 8.00 At all locations 0.450 Analysis and design options Reinforcement Structural system ONE-WAY Fy (Main bars) 60.00 ksi Moment of Inertia over support is NOT INCREASED
Fy (Shear reinforcement) 60.00 ksi Moments reduced to face of support YES Minimum Cover at TOP 1.00 in Moment Redistribution NO
Minimum Cover at BOTTOM 1.00 in DESIGN CODE SELECTED American-ACI318 (2008)/IBC 2009
2 - INPUT GEOMETRY 2.1 Principal Span Data of Uniform Spans Span Form Length Width Depth TF Width TF
Thick. BF/MF Width
BF/MF Thick.
Rh Right Mult.
Left Mult.
ft in in in in in in in 1 1 18.00 12.00 5.00 5.00 0.50 0.50 2 1 18.00 12.00 5.00 5.00 0.50 0.50 3 1 18.00 12.00 5.00 5.00 0.50 0.50 4 1 18.00 12.00 5.00 5.00 0.50 0.50 5 1 18.00 12.00 5.00 5.00 0.50 0.50 6 1 18.00 12.00 5.00 5.00 0.50 0.50
2.6 Transverse Beam Data Joint Depth Width
Before Width After
in in in 1 34.00 0.00 7.00 2 34.00 7.00 7.00 3 34.00 7.00 7.00 4 34.00 7.00 7.00 5 34.00 7.00 7.00 6 34.00 7.00 7.00 7 34.00 7.00 0.00
2.7 Support Width and Column Data Joint Support
Width Length
LC B(DIA.)
LC D LC % LC CBC LC Length
UC B(DIA.)
UC D UC % UC CBC UC
in ft in in ft in in 1 14.0 0.0 0.0 0.0 100 (1) 2 14.0 0.0 0.0 0.0 100 (1) 3 14.0 0.0 0.0 0.0 100 (1) 4 14.0 0.0 0.0 0.0 100 (1) 5 14.0 0.0 0.0 0.0 100 (1) 6 14.0 0.0 0.0 0.0 100 (1)

ONE-WAY SLAB VERIFICATION Chapter 2
21
7 14.0 0.0 0.0 0.0 100 (1) 3 - INPUT APPLIED LOADING 3.1 Loading As Appears in User's Input Screen
Span Class Type W P1 P2 A B C F M k/ft2 k/ft k/ft ft ft ft k k-ft
1 LL U 0.050 1 SDL U 0.005 2 LL U 0.050 2 SDL U 0.005 3 LL U 0.050 3 SDL U 0.005 4 LL U 0.050 4 SDL U 0.005 5 LL U 0.050 5 SDL U 0.005 6 LL U 0.050 6 SDL U 0.005
NOTE: SELFWEIGHT INCLUSION REQUIRED (SW= SELF WEIGHT Computed from geometry input and treated as dead loading. Unit selfweight W = 150.0 pcf NOTE: LIVE LOADING is SKIPPED with a skip factor of 1.00 4 - CALCULATED SECTION PROPERTIES 4.2 Section Properties for Non-Uniform Spans
Span Segment
Area I Yb Yt
in2 in4 in in 1 1 408.00 0.39E+05 17.00 17.00 1 2 60.00 0.13E+03 2.50 2.50 1 3 408.00 0.39E+05 17.00 17.00 2 1 408.00 0.39E+05 17.00 17.00 2 2 60.00 0.13E+03 2.50 2.50 2 3 408.00 0.39E+05 17.00 17.00 3 1 408.00 0.39E+05 17.00 17.00 3 2 60.00 0.13E+03 2.50 2.50 3 3 408.00 0.39E+05 17.00 17.00
5 - MOMENTS, SHEARS AND REACTIONS 5.1 Span Moments and Shears (Excluding Live Load)
Span Load Case Moment Left
Moment Midspan
Moment Right
Shear Left
Shear Right
k-ft k-ft k-ft k k 1 SW 0.00 1.38 -2.42 -0.64 0.91 2 SW -2.42 0.54 -1.68 -0.82 0.73 3 SW -1.68 0.77 -1.96 -0.76 0.79 4 SW -1.96 0.77 -1.68 -0.79 0.76 1 SDL 0.00 0.11 -0.19 -0.03 0.06 2 SDL -0.19 0.04 -0.13 -0.05 0.04 3 SDL -0.13 0.06 -0.15 -0.04 0.05 4 SDL -0.15 0.06 -0.13 -0.05 0.04

ONE-WAY SLAB VERIFICATION Chapter 2
22
5.2 Reactions and Column Moments (Excluding Live Load) Joint Load Case Reaction Moment
Lower Column Moment
Upper Column k k-ft k-ft
1 SW 0.64 0.00 0.00 2 SW 1.72 0.00 0.00 3 SW 1.49 0.00 0.00 4 SW 1.58 0.00 0.00 1 SDL 0.03 0.00 0.00 2 SDL 0.10 0.00 0.00 3 SDL 0.09 0.00 0.00 4 SDL 0.09 0.00 0.00
5.3 Span Moments and Shears (Live Load)
Span Moment Left Max
Moment Left Min
Moment Midspan
Max
Moment Midspan Min
Moment Right Max
Moment Right Min
Shear Left
Shear Right
k-ft k-ft k-ft k-ft k-ft k-ft k k 1 0.00 0.00 1.56 -0.47 -2.11 -0.58 -0.40 0.57 2 -2.11 -0.58 1.23 -0.79 -1.94 -0.25 -0.55 0.53 3 -1.94 -0.25 1.32 -0.70 -2.09 -0.47 -0.53 0.55 4 -2.09 -0.47 1.32 -0.70 -1.94 -0.25 -0.55 0.53
5.4 Reactions and Column Moments (Live Load)
Joint Reaction Max
Reaction Min
Moment Lower
Column Max
Moment Lower
Column Min
Moment Upper
Column Max
Moment Upper
Column Min k k k-ft k-ft k-ft k-ft
1 0.40 -0.05 0.00 0.00 0.00 0.00 2 1.11 0.41 0.00 0.00 0.00 0.00 3 1.06 0.30 0.00 0.00 0.00 0.00 4 1.10 0.37 0.00 0.00 0.00 0.00
6 - MOMENTS REDUCED TO FACE OF SUPPORT 6.1 Reduced Moments at Face of Support (Excluding Live Load)
Span Load Case
Moment Left
Moment Midspan
Moment Right
k-ft k-ft k-ft 1 SW 0.30 1.38 -1.96 2 SW -2.02 0.54 -1.32 3 SW -1.31 0.77 -1.57 4 SW -1.57 0.77 -1.31 1 SDL 0.02 0.11 -0.16 2 SDL -0.16 0.04 -0.11 3 SDL -0.11 0.06 -0.13 4 SDL -0.13 0.06 -0.11
6.2 Reduced Moments at Face of Support (Live Load)
Span Moment Left Max
Moment Left Min
Moment Midspan
Max
Moment Midspan Min
Moment Right Max
Moment Right Min
k-ft k-ft k-ft k-ft k-ft k-ft 1 -0.03 0.22 1.56 -0.47 -1.79 -0.56 2 -1.80 -0.37 1.23 -0.79 -1.64 -0.21 3 -1.64 -0.06 1.32 -0.70 -1.77 -0.26 4 -1.77 -0.26 1.32 -0.70 -1.64 -0.06

ONE-WAY SLAB VERIFICATION Chapter 2
23
7 - SELECTED POST-TENSIONING FORCES AND TENDON PROFILES 7.1 Tendon Profile Tendon A
Span Type X1/L X2/L X3/L A/L 1 1 0.000 0.366 0.000 --- 2 1 0.000 0.500 0.000 --- 3 1 0.000 0.500 0.000 --- 4 1 0.000 0.500 0.000 --- 5 1 0.000 0.500 0.000 --- 6 1 0.000 0.634 0.000 ---
7.2 Selected Post-Tensioning Forces and Tendon Drape Tendon A
Span Force CGS Left CGS C1 CGS C2 CGS Right P/A Wbal WBal (%DL) k in in in in psi k/-
1 15.000 2.50 --- 1.75 4.00 250.00 0.043 47 2 7.500 4.00 --- 1.00 4.00 125.00 0.046 51 3 7.500 4.00 --- 1.00 4.00 125.00 0.046 51 4 7.500 4.00 --- 1.00 4.00 125.00 0.046 51 5 7.500 4.00 --- 1.00 4.00 125.00 0.046 51 6 15.000 4.00 --- 1.75 2.50 250.00 0.043 47
All Tendons
Span Force Total P/A Total WBal (%DL)
k psi 1 15 250 47 2 7.5 125 51 3 7.5 125 51 4 7.5 125 51 5 7.5 125 51 6 15 250 47
Approximate weight of strand: 56.2 LB 7.4 Required Minimum Post-Tensioning Forces Based on Stress Conditions Based on Minimum P/A
Type Left Center Right Left Center Right k k k k k k
1 0.00 5.13 9.67 7.50 7.50 7.50 2 9.97 0.00 3.15 7.50 7.50 7.50 3 3.04 0.00 5.72 7.50 7.50 7.50 4 5.72 0.00 3.04 7.50 7.50 7.50
7.5 Service Stresses (tension shown positive) Envelope of Service 1
Span Left Top
Max-T
Left Top
Max-C
Left Bot
Max-T
Left Bot
Max-C
Center Top
Max-T
Center Top
Max-C
Center Bot
Max-T
Center Bot
Max-C
Right Top
Max-T
Right Top
Max-C
Right Bot
Max-T
Right Bot
Max-C psi psi psi psi psi psi psi psi psi psi psi psi
1 ----- -302.88 ----- -215.41 ----- -494.16 ----- -151.64 65.02 -23.46 ----- -565.022 71.47 -31.74 ----- -571.47 ----- -153.28 ----- -242.53 63.84 -39.35 ----- -313.843 56.02 -57.37 ----- -306.02 ----- -275.12 25.12 -120.68 189.92 ----- ----- -439.924 189.84 ----- ----- -439.84 ----- -275.12 25.12 -120.68 56.10 -57.28 ----- -306.10
Envelope of Service 2
Span Left Left Left Left Center Center Center Center Right Right Right Right

ONE-WAY SLAB VERIFICATION Chapter 2
24
Top Max-T
Top Max-C
Bot Max-T
Bot Max-C
Top Max-T
Top Max-C
Bot Max-T
Bot Max-C
Top Max-T
Top Max-C
Bot Max-T
Bot Max-C
psi psi psi psi psi psi psi psi psi psi psi psi 1 ----- -340.47 ----- -220.50 ----- -755.85 255.85 -230.16 366.02 ----- ----- -866.022 374.71 ----- ----- -874.71 125.54 -360.47 110.47 -375.54 339.08 -4.90 ----- -589.083 330.70 -47.25 ----- -580.70 ----- -497.25 247.25 -238.75 487.56 ----- ----- -737.564 487.48 ----- ----- -737.48 ----- -497.25 247.25 -238.75 330.78 -47.17 ----- -580.78
7.6 Post-Tensioning Balance Moments, Shears and Reactions Span Moments and Shears
Span Moment Left Moment Center Moment Right Shear Left Shear Right k-ft k-ft k-ft k k
1 -0.17 -0.94 1.34 0.01 0.01 2 1.38 -0.84 1.13 -0.04 -0.04 3 1.15 -0.61 0.91 0.01 0.01 4 0.91 -0.61 1.15 -0.01 -0.01
Reactions and Column Moments
Joint Reaction Moment Lower
Column
Moment Upper
Column k k-ft k-ft
1 -0.015 0.000 0.000 2 0.054 0.000 0.000 3 -0.054 0.000 0.000 4 0.028 0.000 0.000
Note: Moments are reported at face of support 8 - FACTORED MOMENTS AND REACTIONS ENVELOPE 8.1 Factored Design Moments (Not Redistributed)
Span Left Max
Left Min
Middle Max
Middle Min
Right Max
Right Min
k-ft k-ft k-ft k-ft k-ft k-ft 1 0.33 0.73 4.15 0.91 -5.66 -3.22 2 -5.74 -3.28 2.78 -0.46 -3.90 -1.57 3 -3.87 -1.35 3.45 0.21 -4.66 -2.16 4 -4.66 -2.16 3.45 0.21 -3.87 -1.35
8.2 Reactions and Column Moments
Joint Reaction Max
Reaction Min
Moment Lower
Column Max
Moment Lower
Column Min
Moment Upper
Column Max
Moment Upper
Column Min k k k-ft k-ft k-ft k-ft
1 1.43 0.71 0.00 0.00 0.00 0.00 2 4.03 2.61 0.00 0.00 0.00 0.00 3 3.53 2.15 0.00 0.00 0.00 0.00 4 3.80 2.37 0.00 0.00 0.00 0.00
8.3 Secondary Moments
Span Left Midspan Right k-ft k-ft k-ft
1 -0.01 -0.13 -0.25 2 -0.24 0.10 0.43 3 0.45 0.33 0.21 4 0.21 0.33 0.45
Note: Moments are reported at face of support

ONE-WAY SLAB VERIFICATION Chapter 2
25
10 - MILD STEEL - NO REDISTRIBUTION 10.1 Required Rebar 10.1.1 Total Strip Required Rebar
Span Location From To As Required Ultimate Minimum ft ft in2 in2 in2
1 TOP 0.00 2.70 0.12 0.00 0.12 1 TOP 15.30 18.00 0.12 0.09 0.12 2 TOP 0.00 2.70 0.12 0.11 0.12 2 TOP 4.50 8.10 0.05 0.05 0.00 2 TOP 15.30 18.00 0.12 0.11 0.12 3 TOP 0.00 2.70 0.12 0.11 0.12 3 TOP 15.30 18.00 0.16 0.16 0.12 4 TOP 0.00 2.70 0.16 0.16 0.12 4 TOP 15.30 18.00 0.12 0.11 0.12 1 BOT 4.50 11.70 0.12 0.05 0.12 2 BOT 6.30 11.70 0.12 0.03 0.12 3 BOT 4.50 12.60 0.12 0.07 0.12 4 BOT 5.40 13.50 0.12 0.07 0.12
12 - SHEAR REINFORCEMENT 12.1 Shear Calculation Envelope SPAN 1
X/L X d Vu Mu Ratio Req. Spacing ft in k kft in2 in
0.03 0.58 4.00 -1.09 0.74 0.12 0.00 0.00 0.05 0.90 4.00 -1.03 1.08 0.15 0.00 0.00 0.10 1.80 4.00 -0.91 1.95 0.20 0.00 0.00 0.15 2.70 4.00 -0.74 2.69 0.16 0.00 0.00 0.20 3.60 4.00 -0.61 3.30 0.13 0.00 0.00 0.25 4.50 4.00 -0.45 3.78 0.10 0.00 0.00 0.30 5.40 4.00 -0.32 4.13 0.07 0.00 0.00 0.35 6.30 4.00 -0.15 4.34 0.03 0.00 0.00 0.40 7.20 4.00 0.11 4.42 0.03 0.00 0.00 0.45 8.10 4.00 0.23 4.38 0.05 0.00 0.00 0.50 9.00 4.00 0.37 4.19 0.08 0.00 0.00 0.55 9.90 4.00 0.51 3.88 0.11 0.00 0.00 0.60 10.80 4.00 0.67 3.44 0.15 0.00 0.00 0.65 11.70 4.00 0.79 2.86 0.17 0.00 0.00 0.70 12.60 4.00 0.96 2.15 0.21 0.00 0.00 0.75 13.50 4.00 1.09 1.31 0.20 0.00 0.00 0.80 14.40 4.00 0.62 -1.75 0.14 0.00 0.00 0.85 15.30 4.00 0.69 -2.43 0.15 0.00 0.00 0.90 16.20 4.00 1.53 -1.99 0.23 0.00 0.00 0.95 17.10 4.00 1.67 -3.36 0.32 0.00 0.00 0.97 17.42 4.00 1.73 -3.73 0.34 0.00 0.00
SPAN 2
X/L X d Vu Mu Ratio Req. Spacing ft in k kft in2 in
0.03 0.58 4.00 -1.60 -3.48 0.33 0.00 0.00 0.05 0.90 4.00 -1.55 -3.06 0.31 0.00 0.00 0.10 1.80 4.00 -1.41 -1.97 0.24 0.00 0.00

ONE-WAY SLAB VERIFICATION Chapter 2
26
0.15 2.70 4.00 -1.25 -1.00 0.16 0.00 0.00 0.20 3.60 4.00 -0.61 -1.02 0.13 0.00 0.00 0.25 4.50 4.00 -0.46 -1.83 0.10 0.00 0.00 0.30 5.40 4.00 -0.84 1.32 0.14 0.00 0.00 0.35 6.30 4.00 -0.68 1.89 0.15 0.00 0.00 0.40 7.20 4.00 -0.54 2.33 0.12 0.00 0.00 0.45 8.10 4.00 -0.40 2.63 0.09 0.00 0.00 0.50 9.00 4.00 -0.25 2.80 0.05 0.00 0.00 0.55 9.90 4.00 0.18 2.85 0.04 0.00 0.00 0.60 10.80 4.00 0.33 2.76 0.07 0.00 0.00 0.65 11.70 4.00 0.46 2.53 0.10 0.00 0.00 0.70 12.60 4.00 0.60 2.18 0.13 0.00 0.00 0.75 13.50 4.00 0.75 1.70 0.17 0.00 0.00 0.80 14.40 4.00 0.90 1.08 0.14 0.00 0.00 0.85 15.30 4.00 1.04 0.38 0.09 0.00 0.00 0.90 16.20 4.00 1.19 -0.38 0.10 0.00 0.00 0.95 17.10 4.00 1.34 -1.28 0.15 0.00 0.00 0.97 17.42 4.00 1.38 -1.63 0.18 0.00 0.00
SPAN 3
X/L X d Vu Mu Ratio Req. Spacing ft in k kft in2 in
0.03 0.58 4.00 -1.46 -1.36 0.15 0.00 0.00 0.05 0.90 4.00 -0.73 -1.31 0.14 0.00 0.00 0.10 1.80 4.00 -0.53 -2.24 0.12 0.00 0.00 0.15 2.70 4.00 -1.12 0.75 0.12 0.00 0.00 0.20 3.60 4.00 -0.97 1.43 0.18 0.00 0.00 0.25 4.50 4.00 -0.83 2.04 0.18 0.00 0.00 0.30 5.40 4.00 -0.68 2.59 0.15 0.00 0.00 0.35 6.30 4.00 -0.53 3.01 0.12 0.00 0.00 0.40 7.20 4.00 -0.39 3.30 0.09 0.00 0.00 0.45 8.10 4.00 -0.25 3.46 0.05 0.00 0.00 0.50 9.00 4.00 0.19 3.48 0.04 0.00 0.00 0.55 9.90 4.00 0.35 3.38 0.08 0.00 0.00 0.60 10.80 4.00 0.48 3.14 0.11 0.00 0.00 0.65 11.70 4.00 0.62 2.77 0.14 0.00 0.00 0.70 12.60 4.00 0.77 2.27 0.17 0.00 0.00 0.75 13.50 4.00 0.92 1.64 0.18 0.00 0.00 0.80 14.40 4.00 1.06 0.87 0.12 0.00 0.00 0.85 15.30 4.00 0.54 -1.75 0.12 0.00 0.00 0.90 16.20 4.00 0.72 -1.23 0.15 0.00 0.00 0.95 17.10 4.00 1.50 -1.87 0.21 0.00 0.00 0.97 17.42 4.00 1.55 -2.27 0.24 0.00 0.00
Note: "Vu" is related to the load combination which produces the maximum "Ratio" Note: Sections with **** have exceeded the maximum allowable shear stress. 14 - DEFLECTIONS 14.1 Maximum Span Deflections
Span SW SW+PT SW+PT+SDL
SW+PT+SDL+Creep
LL X Total
in in in in in in in 1 0.15 0.06 0.07 0.20(1070) 0.12(1806) 0.00(*****) 0.32(672) 2 0.02 -0.06 -0.06 -0.17(1264) 0.02(12525) 0.00(*****) -0.16(1311) 3 0.06 0.01 0.02 0.05(4564) 0.04(4835) 0.00(*****) 0.09(2380) 4 0.06 0.01 0.02 0.05(4565) 0.04(4835) 0.00(*****) 0.09(2380)

ONE-WAY SLAB VERIFICATION Chapter 2
27
Legend (2.1): Span C = Cantilever Form 1 = Rectangular, 2 = T or Inverted L, 3 = I, 4 = Extended T or L section Rh Elevation of top surface TF Top flange MF Middle flange BF Bottom flange Legend (2.7): The Column Boundary Condition (CBC): Fixed at both 1 Hinged at near end, fixed at far end 2 Fixed at near end, hinged at far end 3 Fixed at near end, roller with rotational fixity at far end 4 LC Lower Column UC Upper Column Legend (3.1): Class: SW: Selfweight, LL: Live Load, SDL: Superimposed Dead Load, X: Other Loading Type: U: Uniform, P: Partial Uniform, L: Line Load, M: Applied Moment C: Concentrated Load, R: Triangle, V: Variable, T: Trapezoidal Legend (4.1, 4.2): Yb: distance from centroid to bottom fiber Yt: distance from centroid to top fiber I: gross moment of inertia Legend (7.1): Type 1 = reversed parabola 2 = simple parabola with straight portion over support 3 = harped tendon 4 = straight tendon 5 = extended reversed parabola Legend (7.2): CGS C1: CGS of left middle point of tendon for type 5 profile CGS C2: CGS of right middle point of tendon for type 5 profile or middle point of other types Legend (10.1, 11.1): From: Beginning of rebar measured from left support of the span To: End of rebar measured from left support of the span As Required: Envelope of minimum and ultimate rebar Ultimate: Required rebar for ultimate load combinations Minimum: Required minimum rebar Legend (12): d: Effective depth of section for shear rebar calculation Vu: Ultimate shear Ratio: ratio of ultimate to allowable shear stress Req.: Required shear reinforcement per unit length Spacing: Spacing between shear rebar

ONE-WAY SLAB VERIFICATION Chapter 2
28
2.2.2 Computer Report for SI Units
SIX SPAN ONE WAY SLAB
Tuesday, March 30, 2010

ONE-WAY SLAB VERIFICATION Chapter 2
29
TABLE OF CONTENT: Tabular Reports - Compact 1 - User Specified General Analysis and Design Parameters 2 - Input Geometry 2.1 - Principal Span Data of Uniform Spans 2.6 - Transverse Beam Data 2.7 - Support Width and Column Data 3 - Input Applied Loading 3.1 - Loading As Appears in User's Input Screen 4 - Calculated Section Properties 4.2 - Section Properties for Non-Uniform Spans 5 - Moments, Shears and Reactions 5.1 - Span Moments and Shears (Excluding Live Load) 5.2 - Reactions and Column Moments (Excluding Live Load) 5.3 - Span Moments and Shears (Live Load) 5.4 - Reactions and Column Moments (Live Load) 6 - Moments Reduced to Face of Support 6.1 - Reduced Moments at Face of Support (Excluding Live Load) 6.2 - Reduced Moments at Face of Support (Live Load) 7 - Selected Post-Tensioning Forces and Tendon Profiles 7.1 - Tendon Profile 7.2 - Selected Post-Tensioning Forces and Tendon Drape 7.4 - Required Minimum Post-Tensioning Forces 7.5 - Service Stresses 7.6 - Post-Tensioning Balance Moments, Shears and Reactions 8 - Factored Moments and Reactions Envelope 8.1 - Factored Design Moments (Not Redistributed) 8.2 - Reactions and Column Moments 8.3 - Secondary Moments 10 - Mild Steel (No Redistribution) 10.1 - Required Rebar 10.1.1 - Total Strip Required Rebar 12 - Shear Reinforcement 12.1 - Shear Calculation Envelope 14 - Deflections 14.1 - Maximum Span Deflections

ONE-WAY SLAB VERIFICATION Chapter 2
30
1 - USER SPECIFIED GENERAL ANALYSIS AND DESIGN PARAMETERS
Parameter Value Parameter Value Concrete Post-tensioning
F'c for BEAMS/SLABS 28.00 N/mm 2 SYSTEM UNBONDED Ec for BEAMS/SLABS 24870.00 N/mm 2 Fpu 1862.00 N/mm 2
CREEP factor 2.00 Fse 1206.60 N/mm 2 CONCRETE WEIGHT NORMAL Strand area 98.709 mm 2
UNIT WEIGHT 2403.00 Kg/m 3 Min CGS from TOP 25.40 mm Tension stress limits / (f'c)1/2 Min CGS from BOT for interior spans 25.40 mm
At Top 0.750 Min CGS from BOT for exterior spans 44.45 mm At Bottom 0.750 Min average precompression 0.86 N/mm 2
Compression stress limits / f'c Max spacing / slab depth 8.00 At all locations 0.450 Analysis and design options Reinforcement Structural system ONE-WAY Fy (Main bars) 413.69 N/mm 2 Moment of Inertia over support is NOT INCREASED
Fy (Shear reinforcement) 413.69 N/mm 2 Moments reduced to face of support YES Minimum Cover at TOP 25.40 mm Moment Redistribution NO
Minimum Cover at BOTTOM 25.40 mm DESIGN CODE SELECTED American-ACI318 (2008)/IBC 2009
2 - INPUT GEOMETRY 2.1 Principal Span Data of Uniform Spans Span Form Length Width Depth TF Width TF
Thick. BF/MF Width
BF/MF Thick.
Rh Right Mult.
Left Mult.
m mm mm mm mm mm mm mm 1 1 5.49 305 127 127 0.50 0.50 2 1 5.49 305 127 127 0.50 0.50 3 1 5.49 305 127 127 0.50 0.50 4 1 5.49 305 127 127 0.50 0.50 5 1 5.49 305 127 127 0.50 0.50 6 1 5.49 305 127 127 0.50 0.50
2.6 Transverse Beam Data Joint Depth Width
Before Width After
mm mm mm 1 864 0 178 2 864 178 178 3 864 178 178 4 864 178 178 5 864 178 178 6 864 178 178 7 864 178 0
2.7 Support Width and Column Data Joint Support
Width Length
LC B(DIA.)
LC D LC % LC CBC LC Length
UC B(DIA.)
UC D UC % UC CBC UC
mm m mm mm m mm mm 1 356.0 0.0 0.0 0.0 100 (1) 2 356.0 0.0 0.0 0.0 100 (1) 3 356.0 0.0 0.0 0.0 100 (1) 4 356.0 0.0 0.0 0.0 100 (1) 5 356.0 0.0 0.0 0.0 100 (1) 6 356.0 0.0 0.0 0.0 100 (1)

ONE-WAY SLAB VERIFICATION Chapter 2
31
7 356.0 0.0 0.0 0.0 100 (1) 3 - INPUT APPLIED LOADING 3.1 Loading As Appears in User's Input Screen
Span Class Type W P1 P2 A B C F M kN/m2 kN/m kN/m m m m kN kN-m
1 LL U 2.394 1 SDL U 0.239 2 LL U 2.394 2 SDL U 0.239 3 LL U 2.394 3 SDL U 0.239 4 LL U 2.394 4 SDL U 0.239 5 LL U 2.394 5 SDL U 0.239 6 LL U 2.394 6 SDL U 0.239
NOTE: SELFWEIGHT INCLUSION REQUIRED (SW= SELF WEIGHT Computed from geometry input and treated as dead loading. Unit selfweight W = 2403.0 Kg/m^3 NOTE: LIVE LOADING is SKIPPED with a skip factor of 1.00 4 - CALCULATED SECTION PROPERTIES 4.2 Section Properties for Non-Uniform Spans
Span Segment
Area I Yb Yt
mm2 mm4 mm mm 1 1 263520.00 0.16E+11 432.00 432.00 1 2 38735.00 0.52E+08 63.50 63.50 1 3 263520.00 0.16E+11 432.00 432.00 2 1 263520.00 0.16E+11 432.00 432.00 2 2 38735.00 0.52E+08 63.50 63.50 2 3 263520.00 0.16E+11 432.00 432.00 3 1 263520.00 0.16E+11 432.00 432.00 3 2 38735.00 0.52E+08 63.50 63.50 3 3 263520.00 0.16E+11 432.00 432.00
5 - MOMENTS, SHEARS AND REACTIONS 5.1 Span Moments and Shears (Excluding Live Load)
Span Load Case Moment Left
Moment Midspan
Moment Right
Shear Left
Shear Right
kN-m kN-m kN-m kN kN 1 SW 0.00 1.88 -3.28 -2.85 4.05 2 SW -3.28 0.74 -2.28 -3.63 3.26 3 SW -2.28 1.05 -2.66 -3.38 3.52 4 SW -2.66 1.05 -2.28 -3.52 3.38 1 SDL 0.00 0.15 -0.25 -0.15 0.25 2 SDL -0.25 0.06 -0.18 -0.21 0.19 3 SDL -0.18 0.08 -0.20 -0.19 0.21 4 SDL -0.20 0.08 -0.18 -0.21 0.19
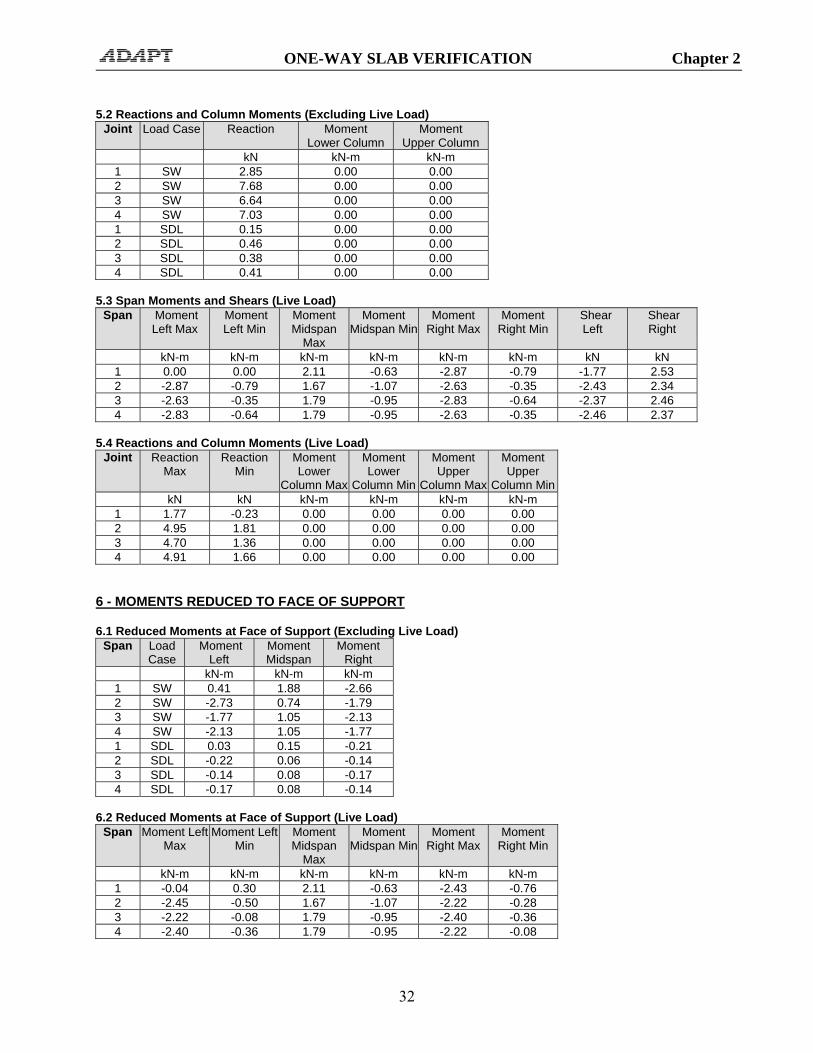
ONE-WAY SLAB VERIFICATION Chapter 2
32
5.2 Reactions and Column Moments (Excluding Live Load) Joint Load Case Reaction Moment
Lower Column Moment
Upper Column kN kN-m kN-m
1 SW 2.85 0.00 0.00 2 SW 7.68 0.00 0.00 3 SW 6.64 0.00 0.00 4 SW 7.03 0.00 0.00 1 SDL 0.15 0.00 0.00 2 SDL 0.46 0.00 0.00 3 SDL 0.38 0.00 0.00 4 SDL 0.41 0.00 0.00
5.3 Span Moments and Shears (Live Load)
Span Moment Left Max
Moment Left Min
Moment Midspan
Max
Moment Midspan Min
Moment Right Max
Moment Right Min
Shear Left
Shear Right
kN-m kN-m kN-m kN-m kN-m kN-m kN kN 1 0.00 0.00 2.11 -0.63 -2.87 -0.79 -1.77 2.53 2 -2.87 -0.79 1.67 -1.07 -2.63 -0.35 -2.43 2.34 3 -2.63 -0.35 1.79 -0.95 -2.83 -0.64 -2.37 2.46 4 -2.83 -0.64 1.79 -0.95 -2.63 -0.35 -2.46 2.37
5.4 Reactions and Column Moments (Live Load)
Joint Reaction Max
Reaction Min
Moment Lower
Column Max
Moment Lower
Column Min
Moment Upper
Column Max
Moment Upper
Column Min kN kN kN-m kN-m kN-m kN-m
1 1.77 -0.23 0.00 0.00 0.00 0.00 2 4.95 1.81 0.00 0.00 0.00 0.00 3 4.70 1.36 0.00 0.00 0.00 0.00 4 4.91 1.66 0.00 0.00 0.00 0.00
6 - MOMENTS REDUCED TO FACE OF SUPPORT 6.1 Reduced Moments at Face of Support (Excluding Live Load)
Span Load Case
Moment Left
Moment Midspan
Moment Right
kN-m kN-m kN-m 1 SW 0.41 1.88 -2.66 2 SW -2.73 0.74 -1.79 3 SW -1.77 1.05 -2.13 4 SW -2.13 1.05 -1.77 1 SDL 0.03 0.15 -0.21 2 SDL -0.22 0.06 -0.14 3 SDL -0.14 0.08 -0.17 4 SDL -0.17 0.08 -0.14
6.2 Reduced Moments at Face of Support (Live Load)
Span Moment Left Max
Moment Left Min
Moment Midspan
Max
Moment Midspan Min
Moment Right Max
Moment Right Min
kN-m kN-m kN-m kN-m kN-m kN-m 1 -0.04 0.30 2.11 -0.63 -2.43 -0.76 2 -2.45 -0.50 1.67 -1.07 -2.22 -0.28 3 -2.22 -0.08 1.79 -0.95 -2.40 -0.36 4 -2.40 -0.36 1.79 -0.95 -2.22 -0.08

ONE-WAY SLAB VERIFICATION Chapter 2
33
7 - SELECTED POST-TENSIONING FORCES AND TENDON PROFILES 7.1 Tendon Profile Tendon A
Span Type X1/L X2/L X3/L A/L 1 1 0.000 0.366 0.000 --- 2 1 0.000 0.500 0.000 --- 3 1 0.000 0.500 0.000 --- 4 1 0.000 0.500 0.000 --- 5 1 0.000 0.500 0.000 --- 6 1 0.000 0.634 0.000 ---
7.2 Selected Post-Tensioning Forces and Tendon Drape Tendon A
Span Force CGS Left CGS C1 CGS C2 CGS Right P/A Wbal WBal (%DL) kN mm mm mm mm MPa kN/-
1 66.730 64.00 --- 44.00 102.00 1.72 0.648 49 2 33.360 102.00 --- 25.00 102.00 0.86 0.683 51 3 33.360 102.00 --- 25.00 102.00 0.86 0.683 51 4 33.360 102.00 --- 25.00 102.00 0.86 0.683 51 5 33.360 102.00 --- 25.00 102.00 0.86 0.683 51 6 66.730 102.00 --- 44.00 64.00 1.72 0.648 49
All Tendons
Span Force Total P/A Total WBal (%DL)
kN MPa 1 66.73 1.72 49 2 33.36 0.86 51 3 33.36 0.86 51 4 33.36 0.86 51 5 33.36 0.86 51 6 66.73 1.72 49
Approximate weight of strand: 25.5 Kg 7.4 Required Minimum Post-Tensioning Forces Based on Stress Conditions Based on Minimum P/A
Type Left Center Right Left Center Right kN kN kN kN kN kN
1 0.00 21.76 41.87 33.31 33.31 33.31 2 43.18 0.00 13.41 33.31 33.31 33.31 3 12.90 0.00 24.63 33.31 33.31 33.31 4 24.63 0.00 12.90 33.31 33.31 33.31
7.5 Service Stresses (tension shown positive) Envelope of Service 1
Span Left Top
Max-T
Left Top
Max-C
Left Bot
Max-T
Left Bot
Max-C
Center Top
Max-T
Center Top
Max-C
Center Bot
Max-T
Center Bot
Max-C
Right Top
Max-T
Right Top
Max-C
Right Bot
Max-T
Right Bot
Max-C MPa MPa MPa MPa MPa MPa MPa MPa MPa MPa MPa MPa
1 ----- -2.12 ----- -1.46 ----- -3.38 ----- -1.07 0.41 -0.20 ----- -3.86 2 0.45 -0.26 ----- -3.90 ----- -1.05 ----- -1.68 0.42 -0.29 ----- -2.15 3 0.37 -0.41 ----- -2.09 ----- -1.89 0.17 -0.84 1.29 ----- ----- -3.01 4 1.29 ----- ----- -3.01 ----- -1.89 0.17 -0.84 0.37 -0.41 ----- -2.09
Envelope of Service 2
Span Left Left Left Left Center Center Center Center Right Right Right Right

ONE-WAY SLAB VERIFICATION Chapter 2
34
Top Max-T
Top Max-C
Bot Max-T
Bot Max-C
Top Max-T
Top Max-C
Bot Max-T
Bot Max-C
Top Max-T
Top Max-C
Bot Max-T
Bot Max-C
MPa MPa MPa MPa MPa MPa MPa MPa MPa MPa MPa MPa 1 ----- -2.38 ----- -1.49 ----- -5.18 1.74 -1.61 2.49 ----- ----- -5.93 2 2.54 ----- ----- -5.99 0.87 -2.48 0.76 -2.59 2.32 -0.05 ----- -4.04 3 2.26 -0.34 ----- -3.99 ----- -3.42 1.70 -1.65 3.34 ----- ----- -5.06 4 3.34 ----- ----- -5.06 ----- -3.42 1.70 -1.65 2.26 -0.34 ----- -3.99
7.6 Post-Tensioning Balance Moments, Shears and Reactions Span Moments and Shears
Span Moment Left Moment Center Moment Right Shear Left Shear Right kN-m kN-m kN-m kN kN
1 -0.20 -1.30 1.85 0.06 0.06 2 1.90 -1.14 1.55 -0.18 -0.18 3 1.57 -0.83 1.26 0.06 0.06 4 1.26 -0.83 1.57 -0.06 -0.06
Reactions and Column Moments
Joint Reaction Moment Lower
Column
Moment Upper
Column kN kN-m kN-m
1 -0.063 0.000 0.000 2 0.239 0.000 0.000 3 -0.238 0.000 0.000 4 0.123 0.000 0.000
Note: Moments are reported at face of support 8 - FACTORED MOMENTS AND REACTIONS ENVELOPE 8.1 Factored Design Moments (Not Redistributed)
Span Left Max
Left Min
Middle Max
Middle Min
Right Max
Right Min
kN-m kN-m kN-m kN-m kN-m kN-m 1 0.45 1.00 5.64 1.24 -7.67 -4.35 2 -7.77 -4.44 3.77 -0.62 -5.29 -2.12 3 -5.24 -1.82 4.69 0.29 -6.31 -2.92 4 -6.31 -2.92 4.69 0.29 -5.24 -1.82
8.2 Reactions and Column Moments
Joint Reaction Max
Reaction Min
Moment Lower
Column Max
Moment Lower
Column Min
Moment Upper
Column Max
Moment Upper
Column Min kN kN kN-m kN-m kN-m kN-m
1 6.38 3.17 0.00 0.00 0.00 0.00 2 17.93 11.63 0.00 0.00 0.00 0.00 3 15.72 9.60 0.00 0.00 0.00 0.00 4 16.91 10.55 0.00 0.00 0.00 0.00
8.3 Secondary Moments
Span Left Midspan Right kN-m kN-m kN-m
1 -0.01 -0.17 -0.33 2 -0.31 0.14 0.59 3 0.61 0.45 0.30 4 0.30 0.45 0.61
Note: Moments are reported at face of support

ONE-WAY SLAB VERIFICATION Chapter 2
35
10 - MILD STEEL - NO REDISTRIBUTION 10.1 Required Rebar 10.1.1 Total Strip Required Rebar
Span Location From To As Required Ultimate Minimum m m mm2 mm2 mm2
1 TOP 0.00 0.82 77.47 0.00 77.47 1 TOP 4.66 5.49 77.47 58.21 77.47 2 TOP 0.00 2.19 77.47 67.81 77.47 2 TOP 4.66 5.49 77.47 70.72 77.47 3 TOP 0.00 0.82 77.47 66.96 77.47 3 TOP 4.66 5.49 103.00 103.00 77.47 4 TOP 0.00 0.82 103.00 103.00 77.47 4 TOP 4.66 5.49 77.47 66.96 77.47 1 BOT 1.37 3.57 77.47 30.11 77.47 2 BOT 1.92 3.57 77.47 19.51 77.47 3 BOT 1.65 3.84 77.47 46.65 77.47 4 BOT 1.65 3.84 77.47 46.65 77.47
12 - SHEAR REINFORCEMENT 12.1 Shear Calculation Envelope SPAN 1
X/L X d Vu Mu Ratio Req. Spacing m mm kN kNm mm2 mm
0.03 0.18 101.60 -4.83 1.01 0.12 0.00 0.00 0.05 0.27 101.60 -4.60 1.47 0.15 0.00 0.00 0.10 0.55 101.60 -3.96 2.65 0.19 0.00 0.00 0.15 0.82 101.60 -3.30 3.66 0.16 0.00 0.00 0.20 1.10 101.60 -2.66 4.48 0.13 0.00 0.00 0.25 1.37 101.60 -2.01 5.13 0.10 0.00 0.00 0.30 1.65 101.60 -1.37 5.60 0.07 0.00 0.00 0.35 1.92 101.60 -0.72 5.89 0.04 0.00 0.00 0.40 2.19 101.60 0.56 6.01 0.03 0.00 0.00 0.45 2.47 101.60 1.03 5.94 0.05 0.00 0.00 0.50 2.74 101.60 1.67 5.70 0.08 0.00 0.00 0.55 3.02 101.60 2.32 5.27 0.11 0.00 0.00 0.60 3.29 101.60 2.96 4.67 0.14 0.00 0.00 0.65 3.57 101.60 3.60 3.89 0.18 0.00 0.00 0.70 3.84 101.60 4.25 2.93 0.21 0.00 0.00 0.75 4.12 101.60 4.89 1.79 0.20 0.00 0.00 0.80 4.39 101.60 2.78 -2.37 0.14 0.00 0.00 0.85 4.66 101.60 3.11 -3.29 0.15 0.00 0.00 0.90 4.94 101.60 6.84 -2.69 0.23 0.00 0.00 0.95 5.21 101.60 7.48 -4.55 0.32 0.00 0.00 0.97 5.31 101.60 7.70 -5.05 0.34 0.00 0.00
SPAN 2
X/L X d Vu Mu Ratio Req. Spacing m mm kN kNm mm2 mm
0.03 0.18 101.60 -7.13 -4.71 0.33 0.00 0.00 0.05 0.27 101.60 -6.90 -4.14 0.31 0.00 0.00 0.10 0.55 101.60 -6.26 -2.66 0.24 0.00 0.00 0.15 0.82 101.60 -5.62 -1.35 0.16 0.00 0.00 0.20 1.10 101.60 -2.73 -1.37 0.13 0.00 0.00

ONE-WAY SLAB VERIFICATION Chapter 2
36
0.25 1.37 101.60 -2.04 -2.48 0.10 0.00 0.00 0.30 1.65 101.60 -3.66 1.80 0.14 0.00 0.00 0.35 1.92 101.60 -3.01 2.57 0.15 0.00 0.00 0.40 2.19 101.60 -2.37 3.16 0.12 0.00 0.00 0.45 2.47 101.60 -1.72 3.58 0.08 0.00 0.00 0.50 2.74 102.00 -1.08 3.81 0.05 0.00 0.00 0.55 3.02 101.60 0.78 3.87 0.04 0.00 0.00 0.60 3.29 101.60 1.42 3.75 0.07 0.00 0.00 0.65 3.57 101.60 2.07 3.44 0.10 0.00 0.00 0.70 3.84 101.60 2.71 2.96 0.13 0.00 0.00 0.75 4.12 101.60 3.36 2.31 0.16 0.00 0.00 0.80 4.39 101.60 4.00 1.47 0.14 0.00 0.00 0.85 4.66 101.60 4.64 0.52 0.09 0.00 0.00 0.90 4.94 101.60 5.29 -0.52 0.10 0.00 0.00 0.95 5.21 101.60 5.93 -1.73 0.15 0.00 0.00 0.97 5.31 101.60 6.15 -2.20 0.18 0.00 0.00
SPAN 3
X/L X d Vu Mu Ratio Req. Spacing m mm kN kNm mm2 mm
0.03 0.18 101.60 -6.46 -1.84 0.15 0.00 0.00 0.05 0.27 101.60 -3.24 -1.77 0.13 0.00 0.00 0.10 0.55 101.60 -2.39 -3.04 0.12 0.00 0.00 0.15 0.82 101.60 -4.93 1.03 0.12 0.00 0.00 0.20 1.10 101.60 -4.28 1.95 0.18 0.00 0.00 0.25 1.37 101.60 -3.64 2.77 0.18 0.00 0.00 0.30 1.65 101.60 -3.00 3.52 0.15 0.00 0.00 0.35 1.92 101.60 -2.35 4.09 0.12 0.00 0.00 0.40 2.19 101.60 -1.71 4.48 0.08 0.00 0.00 0.45 2.47 101.60 -1.06 4.70 0.05 0.00 0.00 0.50 2.74 102.00 0.88 4.73 0.04 0.00 0.00 0.55 3.02 101.60 1.52 4.59 0.07 0.00 0.00 0.60 3.29 101.60 2.16 4.27 0.11 0.00 0.00 0.65 3.57 101.60 2.81 3.77 0.14 0.00 0.00 0.70 3.84 101.60 3.45 3.09 0.17 0.00 0.00 0.75 4.12 101.60 4.10 2.23 0.18 0.00 0.00 0.80 4.39 101.60 4.74 1.19 0.12 0.00 0.00 0.85 4.66 101.60 2.42 -2.37 0.12 0.00 0.00 0.90 4.94 101.60 3.20 -1.66 0.14 0.00 0.00 0.95 5.21 101.60 6.69 -2.53 0.21 0.00 0.00 0.97 5.31 101.60 6.91 -3.07 0.23 0.00 0.00
Note: "Vu" is related to the load combination which produces the maximum "Ratio" Note: Sections with **** have exceeded the maximum allowable shear stress. 14 - DEFLECTIONS 14.1 Maximum Span Deflections
Span SW SW+PT SW+PT+SDL
SW+PT+SDL+Creep
LL X Total
mm mm mm mm mm mm mm 1 3.9 1.4 1.7 5.0(1097) 3.0(1808) 0.0(*****) 8.0(683) 2 0.6 -1.5 -1.4 -4.3(1266) 0.4(12535) 0.0(*****) -4.2(1315) 3 1.4 0.3 0.4 1.2(4650) 1.1(4840) 0.0(*****) 2.3(2405) 4 1.4 0.3 0.4 1.2(4655) 1.1(4840) 0.0(*****) 2.3(2407)

ONE-WAY SLAB VERIFICATION Chapter 2
37
2.3 VERIFICATION
2.3.1 Verification of Report for American Units
The ADAPT-PT report is presented in numbered data blocks. Each data block data area provided in table. For example, looking at the report, it is observed that data block 2.1 third column is the span lengths. In notation form, this is referred to as (B2.1, C3).
2.3.1.1 Geometry of Slab (Data Block 2)
Data block 2.1, 2.6 and 2.7 identify the geometry of the slab, transverse beam and column supports.
2.3.1.2 Loading (Data Block 3)
Data block 3.1 lists the details of the loading read from input by the program.
2.3.1.3 Calculated Section Properties (Data Block 4)
Data block 4 reflects the calculated section properties of all the spans.
Section properties at mid span:
Area, A = 5* 12 = 60 in2 (38.71e3 mm2) (ADAPT-PT 60,
B4.2, C3) Moment of inertia, I = (b * h3)/ 12 = (12 * 53)/12 = 125 in4 (52.03e6 mm4) (ADAPT-PT
0.13e3,B4.2, C4) Distance from bottom fiber to centroid, Yb
= h/2 = 2.5 in (64 mm) (ADAPT-PT 2.5, B4.2, C5)
Distance from top fiber to centroid, Yt
= h/2 = 2.5 in (64 mm) (ADAPT-PT 2.5,B4.2, C6)
2.3.1.4 Material Properties (Data Block 1)
Concrete, post tensioning strand and mild reinforcement material properties are given in data block 1.
2.3.1.5 Dead and Live Load Moments (Data Block 5)
Data block 5 lists the centerline elastic moments and reactions due to dead load and live load. Centerline moments for the first and second spans are listed in Table 2.3-1.

ONE-WAY SLAB VERIFICATION Chapter 2
38
TABLE 2.3-1 DEAD AND LIVE LOAD MOMENTS
Span Left Midspan Right Reference Number
First span Self weight, k-ft (kNm)
0 (0)
1.38 (1.87)
-2.42 (-3.28)
B5.1, C3-5
Dead load, k-ft (kNm)
0 (0)
0.11 (0.15)
-0.19 (-0.26)
B5.1, C3-5
Live load, k-ft (kNm)
0 (0)
1.56 (2.12)
-2.11 (-2.86)
B5.3, C2-7
Second span Self weight, k-ft (kNm)
-2.42 (-3.28)
0.54 (0.73)
-1.68 (-2.28)
B5.1, C3-5
Dead load, k-ft (kNm)
-0.19 (-0.26)
0.04 (0.05)
-0.13 (-0.18)
B5.1, C2-4
Live load, k-ft (kNm)
-2.11 (-2.86)
1.23 (1.67)
-1.94 (-2.63)
B5.3, C2-7
2.3.1.6 Reactions
ADAPT-PT calculates the reactions from the evaluated support moments and span loading. ADAPT-PT’s results are shown in data block 5.1, columns 6 and 7 (B5.1, C6-7) for DL and data block 5.3, columns 8 and 9(B 5.3, C8-9) for LL. The sum of the shears is tabulated as support reactions in data block 5.2, column 3 (B 5.2, C3) and data block 5.4 columns 2 and 3 for DL and LL respectively. The reactions due to dead load sum up to 9.81k. The sum of the reactions can be verified by adding up the total dead load on the structure as follows:
Number of spans = 6 Length of each span = 18 ft (5.49 m) Width of transverse beam
= 14 in = 1.17 ft (0.36 m)
(B 2.6, C2-3)
Load intensity on transverse beam
=0.425 + 0.005 = 0.43k/ft (6.28 kN/m)
Load intensity on slab = 0.063 + 0.005 = 0.068 k/ft (0.99 kN/m)
Total Loading = (1.17 *0 .43 +(18 –1.17) *0.068) * 6 = 9.88 k (43.95 kN)
(ADAPT-PT 9.81, OK)
2.3.1.7 Reduction of Moments to the Face-of-Support (Data Block 6)
ADAPT-PT calculates the face-of-support moments from the equations of statics.

ONE-WAY SLAB VERIFICATION Chapter 2
39
For verification consider the reduction of self weight moment at first interior support for span one: Reduced moment = M + Wa2/8 -Va/2
M = centerline moment =-2.42 k-ft (-3.28 kN-m) (B5, C5) V = centerline shear = 0.91 k (4.05 kN) (B5, C6) W = applied load = 0.425 k/ft (6.20 kN/m) a = support width = 14 in = 1.17 ft (0.36 m) (B2.6, C3-4) Reduced moment
= -2.42 - 0.425*1.172/8 + 0.91 * 1.17/2
= -1.96 k-ft (-2.66 kNm) (ADAPT-PT -1.96, B6.1, C5)
2.3.1.8 Tendon Profiles and Forces (Data Block 7.1 and 7.2)
Data block 7.1 and 7.2 report the tendon profiles and forces. Here reversed parabola (type 1) is selected as tendon shape. In an actual case the user has the option to select the profile from the library of ADAPT-PT tendon profiles. Data block 7.1 is the description of reversed parabola. In data block 7.1 the zeros under column 3 and 5 indicate that the parabola used for the central part of the span extends to the support centerlines. In this case, column 6 has no significance. In building construction, the low points of the tendon shapes are generally placed at midspan. But in this example, for first and last spans, the low points are selected such as to provide a uniform upward force over the entire span. Due to the different tendon heights at the left and right supports, the low-points will not fall at midspan. The distance of low-point of the first span from the left support is calculated as follows:( Refer to Fig. 2.3-1).
a = 2.5 – 1.75 = 0.75 in.(19 mm) b = 4- 1.75 = 2.25 in. (57 mm) L = 18 ft (5.49 m) c = 18 * { [√(0.75/ 2.25)]/[1+ √(0.75/ 2.25)] } = 6.59 ft (2.01 m) X2/L = 6.59 /18 = 0.366 (ADAPT-PT B 7.1, C 4)
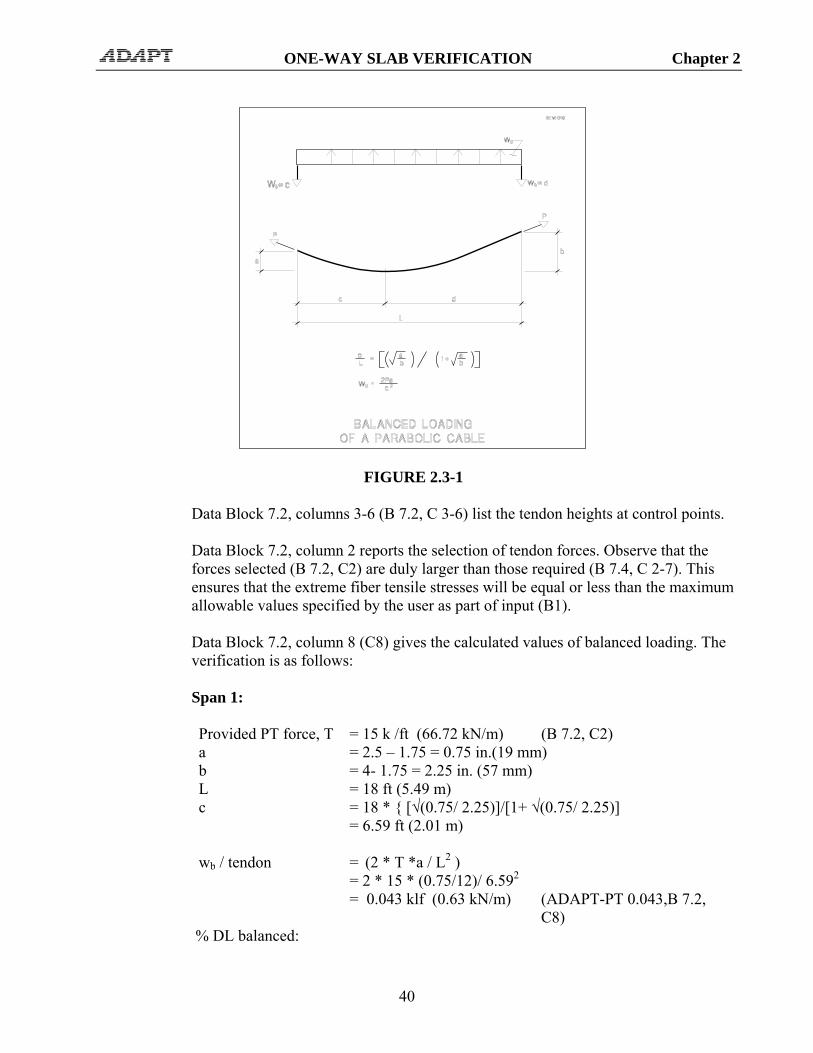
ONE-WAY SLAB VERIFICATION Chapter 2
40
FIGURE 2.3-1
Data Block 7.2, columns 3-6 (B 7.2, C 3-6) list the tendon heights at control points. Data Block 7.2, column 2 reports the selection of tendon forces. Observe that the forces selected (B 7.2, C2) are duly larger than those required (B 7.4, C 2-7). This ensures that the extreme fiber tensile stresses will be equal or less than the maximum allowable values specified by the user as part of input (B1). Data Block 7.2, column 8 (C8) gives the calculated values of balanced loading. The verification is as follows:
Span 1:
Provided PT force, T = 15 k /ft (66.72 kN/m) (B 7.2, C2) a = 2.5 – 1.75 = 0.75 in.(19 mm) b = 4- 1.75 = 2.25 in. (57 mm) L = 18 ft (5.49 m) c = 18 * { [√(0.75/ 2.25)]/[1+ √(0.75/ 2.25)] = 6.59 ft (2.01 m) wb / tendon = (2 * T *a / L2 ) = 2 * 15 * (0.75/12)/ 6.592 = 0.043 klf (0.63 kN/m) (ADAPT-PT 0.043,B 7.2,
C8) % DL balanced:
ONE-WAY SLAB VERIFICATION Chapter 2
41
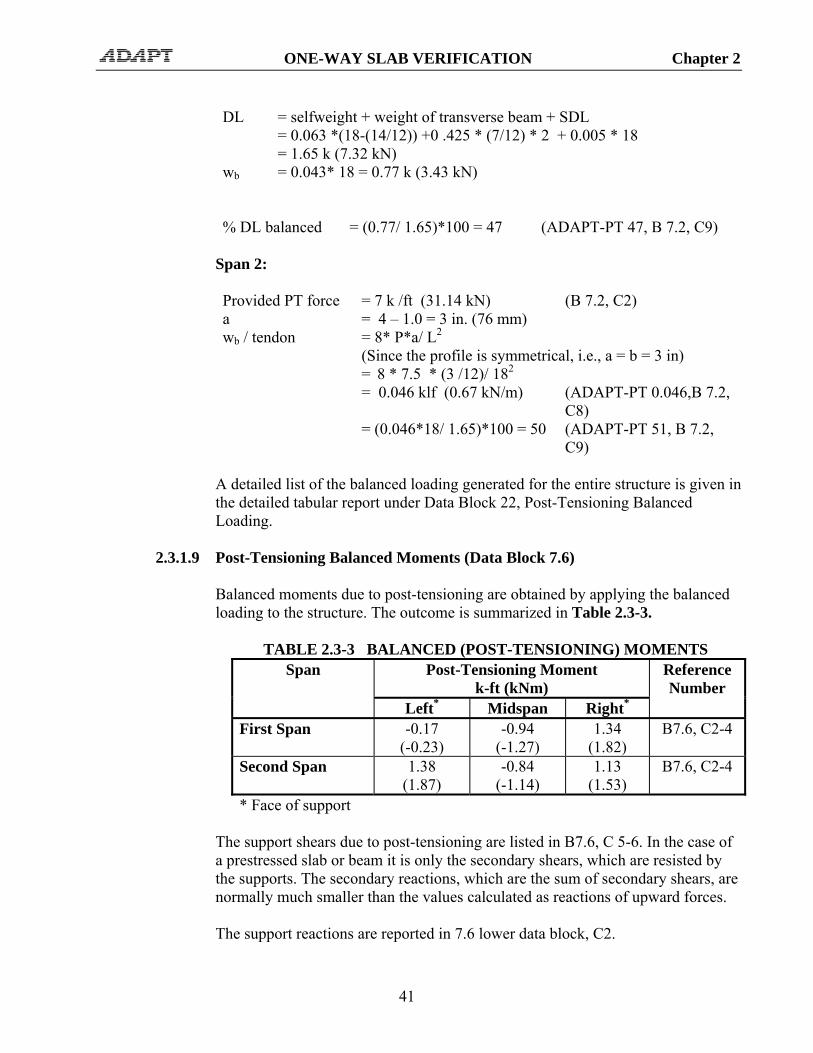
DL = selfweight + weight of transverse beam + SDL = 0.063 *(18-(14/12)) +0 .425 * (7/12) * 2 + 0.005 * 18 = 1.65 k (7.32 kN) wb = 0.043* 18 = 0.77 k (3.43 kN) % DL balanced = (0.77/ 1.65)*100 = 47 (ADAPT-PT 47, B 7.2, C9)
Span 2:
Provided PT force = 7 k /ft (31.14 kN) (B 7.2, C2) a = 4 – 1.0 = 3 in. (76 mm) wb / tendon = 8* P*a/ L2 (Since the profile is symmetrical, i.e., a = b = 3 in) = 8 * 7.5 * (3 /12)/ 182 = 0.046 klf (0.67 kN/m) (ADAPT-PT 0.046,B 7.2,
C8) = (0.046*18/ 1.65)*100 = 50 (ADAPT-PT 51, B 7.2,
C9) A detailed list of the balanced loading generated for the entire structure is given in the detailed tabular report under Data Block 22, Post-Tensioning Balanced Loading.
2.3.1.9 Post-Tensioning Balanced Moments (Data Block 7.6)
Balanced moments due to post-tensioning are obtained by applying the balanced loading to the structure. The outcome is summarized in Table 2.3-3.
TABLE 2.3-3 BALANCED (POST-TENSIONING) MOMENTS
Span Post-Tensioning Moment k-ft (kNm)
Reference Number
Left* Midspan Right*
First Span -0.17 (-0.23)
-0.94 (-1.27)
1.34 (1.82)
B7.6, C2-4
Second Span 1.38 (1.87)
-0.84 (-1.14)
1.13 (1.53)
B7.6, C2-4
* Face of support
The support shears due to post-tensioning are listed in B7.6, C 5-6. In the case of a prestressed slab or beam it is only the secondary shears, which are resisted by the supports. The secondary reactions, which are the sum of secondary shears, are normally much smaller than the values calculated as reactions of upward forces.
The support reactions are reported in 7.6 lower data block, C2.

ONE-WAY SLAB VERIFICATION Chapter 2
42
Forces created by prestressing at the supports of a member are, by definition, the secondary reactions. The secondary reactions must be in self-equilibrium. The sum of reactions due to post-tensioning given by ADAPT-PT is zero (B 7.6, C2). Refer to Fig. 2.3-2 for details of Reactions.
FIGURE 2.3-2
2.3.1.10 Stress Check for Serviceability (Data Block 7.5)
Data block 7.5 lists the service stresses at top and bottom for supports and mid span. ADAPT- PT’s calculation is as follows: Data block 7.5 lists the service stresses at top and bottom for supports and mid span. This has two data blocks with service stresses, Envelope of Service 1 and Envelope of Service 2. Envelope of Service 1 is the envelope of service stresses from the Sustained Load Combinations. Similarly Envelope of Service 2 is the envelope of service stresses from the Total Load combinations. This section provides the calculation for Envelope of Service 2.

ONE-WAY SLAB VERIFICATION Chapter 2
43
Consider the Midspan of Span 1: Stresses: σ = (MD+ML+MPT)/S + (P/A) S = I/Yc Where MD, ML, MPT are the moments across the entire tributary of the design strip. S is the section modulus; A is the area; I is the moment of inertia of the section; and Yc is the distance of the centroid of the section to farthest tension fiber of the section.
Stress limits:
Top Tension = 9*√4000 = 569 psi (3.92 MPa) (B1) Bottom Tension = 9*√4000 = 569 psi (3.92 MPa) Compression (for service)
= 0.45 * 4000 = -1800 psi ( -12.41 MPa)
A = 60 in2 (38.71e3 mm2) (B4.2, C3) I = 125 in4 (52.03e6 mm4) (B4.2, C4) Yb = 2.5 in (64 mm) (B4.2, C5) Yt = 2.5 in (64 mm) (B4.2, C6) Sbottom =Stop = 125/ 2.5 =50 in3 (8.19e5 in3) P = 15 k/- (66.72 kN/m) (B7.2, C2) MD = 1.49 k-ft (2.02 kNm) (B6.1, C4) ML = 1.56 k-ft (2.12 kNm) (B6.2, C4) MPT = -0.94 k-ft (-1.27 kNm) (B7.6, C3) MD+ML+MPT = 1.49 + 1.56 –0.94 = 2.11 k-ft (2.86 kNm) P/A = -15*1000/ 60 = -250 psi (-1.72 MPa)
Top fiber:
σ = (-2.11*12000)/50- (250) = -756.40 psi (-5.22 MPa)
< -1800 psi (-12.41 MPa) (ADAPT-PT -755.85, B7.5)

ONE-WAY SLAB VERIFICATION Chapter 2
44
Bottom fiber:
σ = (2.11*12000)/50- (250) = 256.40 psi (1.77 MPa)
< 569 psi (3.92 MPa) (ADAPT-PT 255.85, B7.5)
Calculations for all other points are carried out in the same way and printed in ADAPT-PT, Block 7.5. Stress calculations at 1/20th points are printed in a file called STRESS. DAT. This file is stored in the subdirectory, where the data is executed. Also in the data block 27 of the detailed tabular report.
2.3.1.11 Required Post-Tensioning (Data Block 7.4)
Consider the required post-tensioning at the right support of span one; given by ADAPT-PT as 9.68 kips (B 7.4, C 4). The verification is carried out by demonstrating that the “required minimum post-tensioning force” suggested by ADAPT-PT, if used, leads to the maximum allowable tensile stress specified by the user. In this example the maximum allowable stress in tension is: 9√f’c. Stress due to dead and live moments:
M = -(1.96+0.16+1.79)
= -3.91 k-ft (-5.30 kNm) (ADAPT-PT B6.1-6.2)
M/S = 3.91 *12000/ 50 = 938.40 psi (6.47 MPa)
Stress due to balanced moment is obtained by prorating the moment due to the selected force (15 k) by the force suggested by ADAPT-PT (9.67 k). M/S = (9.68/15)*1.34 *12000/ 50 = 207.54 psi (1.43 MPa) Stress due to direct compression:
P/A = 9.67 * 1000/ 60 = 161.17 psi (1.11MPa) Total tensile stress: 938.40 – 207.54 – 161.17 = 569.69 psi (3.93MPa) Allowable stress: 9√f’c = 9 *√4000 = 569.21 psi (3.92 MPa) (OK) It is shown that the calculated required post-tensioning corresponds to the maximum permissible tensile stress as specified by the user in data block 1.

ONE-WAY SLAB VERIFICATION Chapter 2
45
2.3.1.12 Secondary Moments (Data Block 8.3)
The secondary moments for the first two spans from the data block 8.3 are summarized in the Table 2.3-4. The moments are reduced to the face-of support. To obtain the centerline moments, you have to select “No” for reduce to face-of- support option in the “Design Settings” input screen.
TABLE 2.3-4 HYPERSTATIC (SECONDARY MOMENTS) OF SPANS 1 AND 2
Span Secondary Moment, k-ft (kNm) Reference
Number Left Midspan Right First Span -0.01
(-0.01) -0.13
(-0.18) -0.25
(-0.34) B8.3, C2-4
Second Span -0.24 (-0.33)
0.10 (0.14)
0.43 (0.58)
B8.3, C2-4
Secondary moments are computed by ADAPT-PT using the direct definition of secondary actions. Secondary moments are moments induced in the structure as a consequence of restraining effects of its supports to free displacement of the structure due to prestressing. The restraining effects appear as support reactions caused by post-tensioning. Hence, secondary moments may be calculated as moments in the structural member due to post-tensioning reactions. ADAPT-PT calculates the post-tensioning reactions and lists them in data block 7.6 under reactions and column moments. The post-tensioning reactions are shown in Fig. 2.3-2. A secondary moment diagram constructed from these reactions is also shown in Fig. 2.3-2. The centerline secondary moments at supports are:
Support 2 = -0.015 * 18 = -0.27 k-ft (0.37 kNm) (ADAPT-PT 0.25,
MSECSF.DAT) Support 3 = -0.015* 36 +0.054* 18
= 0.43 k-ft (0.58 kNm) (ADAPT-PT 0.45, MSECSF.DAT)
Support 4 = -0.015 * 54+ 0.054 * 36 -0.054 *18 = 0.17 k-ft (0.23kNm)
(ADAPT-PT 0.21, MSECSF.DAT)
Note that the secondary moments given in ADAPT-PT are reduced to the face-of-support if dead and live moments are also reduced. You can refer the file MSECSF.DAT that is generated and stored in the subdirectory, where you executed your data for a detailed list of centerline secondary moments and shears.
Secondary moments are also given by the following relationship. This relationship, however, is not used in ADAPT-PT and is not recommended, since it does not include an equilibrium check to detect errors in computation.

ONE-WAY SLAB VERIFICATION Chapter 2
46
Msec = Mbal - F*e
The following is the verification of ADAPT-PT's values for the first span midspan using the above algorithm:
Mbal = -0.94 k-ft (B 7.6, C3) F = 15 k e = (5/2)-1.85 =0.65 in. Msec = -0.94 – 15*-0.65/12 = -0.13 k-ft (-0.17 kNm)
From the Fig. 2.3-2 Msec at first in-span = (0+0.26)/2 = -0.13 k-ft (ADAPT-PT -0.13 k-ft).
2.3.1.13 Factored Moments (Design Moments) (Data Block 8.1)
Consider the verification of the moment at left of second support:
1.2 Md = 1.2 * -2.12 = -2.544 k-ft (-3.45 kNm) 1.6 Ml = 1.6 * -1.79 = -2.864 k-ft (3.88 kNm) 1.0 Msec = 1.0 * -0.25 = -0.25 k-ft (-0.34 kNm) Mu = 1.2 Md + 1.6 Ml + 1.0 Msec
= -5.658 k-ft (-7.68 kNm) (ADAPT-PT –5.66, B8.1, C6)
2.3.1.14 Nonprestressed Reinforcement (Mild Reinforcement) (Data Block 10)
ADAPT-PT computes the mild reinforcement required for each criterion and selects the largest. Consider the mid span of first span for verification: (i) Minimum Steel
Per ACI 318-05, Section 18.9.2, the minimum bonded reinforcement is: As = 0.004*A tens Where A tens is the area of the section between the tension fiber and the section centroid. The minimum rebar is required for members reinforced with unbonded tendons. The added rebar is to reduce the in-service crack width and enhance the ductility of the member in ultimate strength condition. Per foot of slab width,

ONE-WAY SLAB VERIFICATION Chapter 2
47
As = 0.004* 2.5*12 = 0.12 in2(77.42 mm2) (ADAPT-PT 0.12, B10.1.1, C5)
(ii) Ultimate Strength Requirement
Design moments:
The design moments are obtained from two load combinations:
Mu1 = 1.2 *MD+1.6* ML+1.0*MHyp Mu1 = 1.4 *MD+1.0*MHyp The second combination governs when the values from dead load are eight times or more of those of live loading. This is a rare condition.
Mu1 = 1.2 *1.49+1.6* 1.56 + 1.0*-0.13 = 4.15 k-ft (5.63 kNm) (ADAPT-PT
4.15, B8.1, C4) b (width) = 12 in. (305 mm) h (height) = 5 in. (127 mm) Rebar Cover = 1.00 in. (25 mm) (B1) Bottom bar dia.
= 0.75 in. (19 mm) (#6 bar)
dr = dt = 5 - (1.00 + 0.75/2) = 3.63 in. (83 mm)
PT = 15 k (66.72 kN) (B7.2, C2) dp = 5-1.85 =3.15 in (80 mm) (PTCGS.DAT) fse = 175 ksi (1206.59 MPa) (B1) Span = 18 ft (5.49 m) Rebar area = 0.05 in2 (33 mm2) (B 10.1.1, C6,
& B 29, C4) fy = 60 ksi (413.69 MPa) (B1)
Calculate design stress in tendon (fps): Span to depth ratio = 18*12/5 = 43.2 > 35 Hence, use ACI Equation (18-5): fps = fse + 10000 + (f'c/300*ρp)
where,
f'c = 4000 psi (27.59 MPa) (B1) ρp = ratio of prestressed reinforcement

ONE-WAY SLAB VERIFICATION Chapter 2
48
= Aps/b*dp Aps = 15/175 = 0.086 in.2 (55 mm2) ρp = 0.086/(12*3.15) = 0.0023 fps = 175000 + 10000 + (4000/300*0.0023) = 190797 psi (1315.51 MPa) fps = 190.797 < (175 + 30) = 205 ksi (OK) Tension (T)
= PT + rebar
= 0.086*190.797 + 0.045*60 = 16.41 + 2.7 = 19.11 k (85 kN) a = Depth of compression zone = T/0.85*b*f’c) = 19.11/(0.85*12*4) = 0.47 in. (12 mm) c = a/0.85 = 0.55 in. (14 mm) c/dt = 0.55/3.25 = 0.17 < 0.375, hence φ = 0.9 φMn = 0.9*[16.41(3.15- 0.47/2) + 2.7*(3.63 -
0.47/2)]/12
= 4.27 k-ft (5.80 kNm) (ADAPT-PT 4.15, B8.1, C4 OK)
Therefore, reinforcement required for the ultimate strength is less than the minimum required steel (B10.1.1, C7). No supplemental rebar is required. Provide minimum steel (B10.1.1, C5).
2.3.1.15 Shear Design (Data Block 12)
Check one-way shear: Distribution of design shear is summarized in the following Table 2.3-5. The design shear (Vu) is computed from the results of the standard frame analysis or performed for the loading condition D, L and PT. For this example design shear is calculated from ADAPT-PT B5 & B7.6. Vu = 1.2* VD + 1.6* VL + 1.0 * VHyp
TABLE 2.3-5 DESIGN SHEAR AT SUPPORTS Design Shear (Vu)
Span 1 2 3 4 5 6 Left
k (kN) -1.43
(-6.36) -1.96
(-8.72) -1.80
(-8.00) -1.90
(-8.45) -1.73
(-7.70) -2.09
(-9.30) Right k (kN)
2.09 (9.30)
1.73 (7.70)
1.90 (8.45)
1.80 (8.00)
1.96 (8.72)
1.43 (6.36)
ONE-WAY SLAB VERIFICATION Chapter 2
49
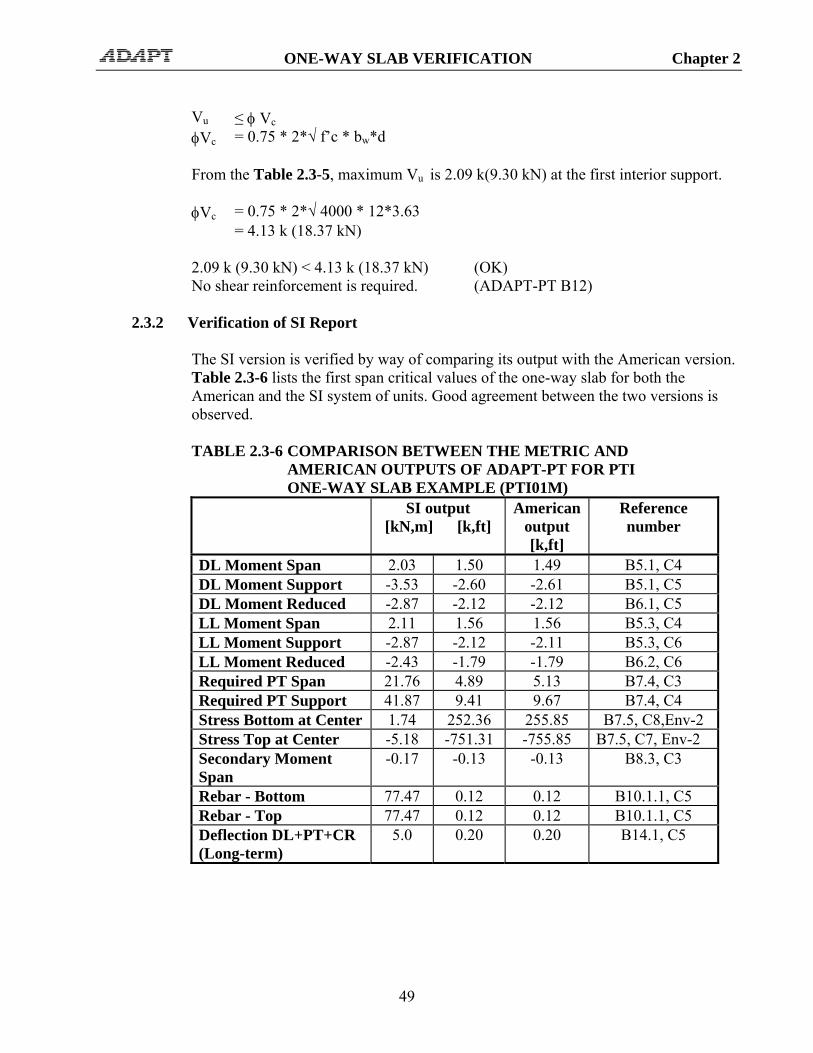
Vu ≤ φ Vc φVc = 0.75 * 2*√ f’c * bw*d
From the Table 2.3-5, maximum Vu is 2.09 k(9.30 kN) at the first interior support. φVc = 0.75 * 2*√ 4000 * 12*3.63 = 4.13 k (18.37 kN) 2.09 k (9.30 kN) < 4.13 k (18.37 kN) (OK) No shear reinforcement is required. (ADAPT-PT B12)
2.3.2 Verification of SI Report
The SI version is verified by way of comparing its output with the American version. Table 2.3-6 lists the first span critical values of the one-way slab for both the American and the SI system of units. Good agreement between the two versions is observed. TABLE 2.3-6 COMPARISON BETWEEN THE METRIC AND
AMERICAN OUTPUTS OF ADAPT-PT FOR PTI ONE-WAY SLAB EXAMPLE (PTI01M)
SI output [kN,m] [k,ft]
American output [k,ft]
Reference number
DL Moment Span 2.03 1.50 1.49 B5.1, C4 DL Moment Support -3.53 -2.60 -2.61 B5.1, C5 DL Moment Reduced -2.87 -2.12 -2.12 B6.1, C5 LL Moment Span 2.11 1.56 1.56 B5.3, C4 LL Moment Support -2.87 -2.12 -2.11 B5.3, C6 LL Moment Reduced -2.43 -1.79 -1.79 B6.2, C6 Required PT Span 21.76 4.89 5.13 B7.4, C3 Required PT Support 41.87 9.41 9.67 B7.4, C4 Stress Bottom at Center 1.74 252.36 255.85 B7.5, C8,Env-2 Stress Top at Center -5.18 -751.31 -755.85 B7.5, C7, Env-2 Secondary Moment Span
-0.17 -0.13 -0.13 B8.3, C3
Rebar - Bottom 77.47 0.12 0.12 B10.1.1, C5 Rebar - Top 77.47 0.12 0.12 B10.1.1, C5 Deflection DL+PT+CR (Long-term)
5.0 0.20 0.20 B14.1, C5

50

51
Chapter 3
TWO-WAY SLAB VERIFICATION

52

TWO-WAY FLAT SLAB VERIFICATION Chapter 3
53
3. OVERVIEW
The column-supported slab selected has the same geometry, material property and loading as the design example in the PTI’s publication “ Design Of Post-Tensioned Slabs With Unbonded Tendons”[3rd edition, 2004]. The following defines the entire parameters of the structural floor system, necessary to analyze and design the entire floor structure. However, as in the PTI example the design provided in the following considers a typical design strip in the transverse direction.
3.1 GIVEN VALUES
Loading and other details are given in the following pages.
FIGURE 3.1-1

TWO-WAY FLAT SLAB VERIFICATION Chapter 3
54
3.1.1 Structural System
The structural system consists of three-span two-way slab.
3.1.2 Design Code
The design is based on ACI 318-08.
3.1.3 Material Properties
(i) Concrete
Compressive cylinder strength, f’c = 4000 psi (27.58 MPa) Weight = 150 pcf (2403 kg/m3) Modulus of elasticity = 3605 ksi (24856 MPa) Age of concrete at stressing = 3 days
(ii) Post-Tensioning
Material: Low relaxation, seven wire strand Strand diameter = ½ in (13 mm) Strand area = 0.153 in2 (99 mm2) Modulus of elasticity = 28000 ksi (193054 MPa) Ultimate strength of strand, fpu = 270 ksi (1861.60MPa) Average effective stress (fse) = 175 ksi (1206.59 MPa) System: System unbonded Stressing: Ratio of jacking stress to strand’s ultimate strength
= 0.8
Anchor set = 0.25 in (6.35 mm) Coefficient of angular friction, μ = 0.07 /radian Coefficient of wobble friction, K = 0.0014 rad/ft (0.0046 rad/m) Stress on day 3 Minimum concrete cylinder strength at stressing f’ci
= 3000 psi (20.68 MPa)
(iii) Nonprestressed Reinforcement

TWO-WAY FLAT SLAB VERIFICATION Chapter 3
55
Yield stress fy = 60 ksi (413.69 MPa) Modulus of elasticity = 29000 ksi (199,949 MPa)
(iv) Design Loading
Dead load = 0.096 k/ft (1.40 kN/m) Live load = 0.034 k/ft (0.50 kN/m) (Live load is conservatively not reduced.)
3.1.4 Load Cases and Combinations
(i) Strength Load Combinations
The strength requirement for each member is established using the following factored load combinations:
Primary load combination 1.2*DL + 1.6*LL + 1*HYP Other load combination 1.4*DL + 1*HYP
Where “HYP” is the secondary (hyperstatic) moments, shears and reactions due to post-tensioning.
(ii) Serviceability Load Combinations
Final stresses: The design is selected to be carried out according to the “Uncracked” (U) state of stress of the code. That is to say, the maximum hypothetical tensile stresses shall not exceed 6 √f’c but be retained less than 12 √f’c A hypothetical tensile stress equal to 9 * √f’c is set as design target.
Tensile stress (top and bottom) = 6 * √f’c = 379.47 psi (2.62 MPa) Compressive stress
For sustained load condition = 0.45 * f’c = 1800 psi (12.41 MPa) For total load condition = 0.60 * f’c = 2400 psi (16.55 MPa)
Load combinations for serviceability check:
Total load condition 1*DL + 1*LL + 1*PT Sustained load condition

TWO-WAY FLAT SLAB VERIFICATION Chapter 3
56
1*DL + 0.3*LL + 1*PT
The factors for neither of the above load combinations are spelled out in the code. Their selection is based on common practice.
Initial stresses (transfer):
Maximum tension = 3 √f’ci Maximum compression = 0.60 * f’ci
Load combinations for stress check at transfer of prestressing:
U = 1.00 DL + 1.15* PT
3.1.5 Deflections
Having maintained the hypothetical tensile stresses within the limits stated in the preceding, the deflections would be calculated assuming gross cross-sectional properties. Long-term deflections are estimated using a creep coefficient of 2. For the floor slabs the maximum deflections are maintained below the following value with the understanding that the floor structure is not attached to nonstructural elements likely to be damaged by large deflections of the floor: Slabs: Live load deflection ≤ span/360
3.1.6 Cover
(i) Nonprestressed Reinforcement
Cover to top bars = 1 in (25 mm) Cover to bottom bars = 1 in (25 mm)
(ii) Prestressed Reinforcement
Top cover = 1.25 in (32 mm) for all spans Bottom cover
Interior spans = 1.25 in (32 mm) Exterior spans = 1.75 in (44 mm)
3.1.7 Tendon Profile
Interior spans = reversed parabola with low point at center

TWO-WAY FLAT SLAB VERIFICATION Chapter 3
57
Exterior spans = reversed parabola with low point at 0.490*L from the left support for first span and 0.510*L for last span from the left support
FIGURE 3.1-2 3.2 COMPUTED VALUES
The computed values are obtained from ADAPT-PT version 2010. The relevant parts of the tabular report are summarized below.

TWO-WAY FLAT SLAB VERIFICATION Chapter 3
58
3.2.1 ADAPT-PT Report In American System Of Units
TWO-WAY FLAT SLAB VERIFICATION
Tuesday, March 30, 2010
TWO-WAY FLAT SLAB VERIFICATION Chapter 3
59
TABLE OF CONTENT: Tabular Reports - Compact 1 - User Specified General Analysis and Design Parameters 2 - Input Geometry 2.1 - Principal Span Data of Uniform Spans 2.7 - Support Width and Column Data 3 - Input Applied Loading 3.1 - Loading As Appears in User's Input Screen 4 - Calculated Section Properties 4.1 - Section Properties of Uniform Spans and Cantilevers 5 - Moments, Shears and Reactions 5.1 - Span Moments and Shears (Excluding Live Load) 5.2 - Reactions and Column Moments (Excluding Live Load) 5.3 - Span Moments and Shears (Live Load) 5.4 - Reactions and Column Moments (Live Load) 6 - Moments Reduced to Face of Support 6.1 - Reduced Moments at Face of Support (Excluding Live Load) 6.2 - Reduced Moments at Face of Support (Live Load) 7 - Selected Post-Tensioning Forces and Tendon Profiles 7.1 - Tendon Profile 7.2 - Selected Post-Tensioning Forces and Tendon Drape 7.4 - Required Minimum Post-Tensioning Forces 7.5 - Service Stresses 7.6 - Post-Tensioning Balance Moments, Shears and Reactions 8 - Factored Moments and Reactions Envelope 8.1 - Factored Design Moments (Not Redistributed) 8.2 - Reactions and Column Moments 8.3 - Secondary Moments 10 - Mild Steel (No Redistribution) 10.1 - Required Rebar 10.1.1 - Total Strip Required Rebar 10.2 - Provided Rebar 10.2.1 - Total Strip Provided Rebar 10.2.2 - Total Strip Steel Disposition 13 - Punching Shear Reinforcement 13.1 - Critical Section Geometry 13.2 - Critical Section Stresses 13.3 - Punching Shear Reinforcement 14 - Deflections 14.1 - Maximum Span Deflections Tabular Reports - Detailed
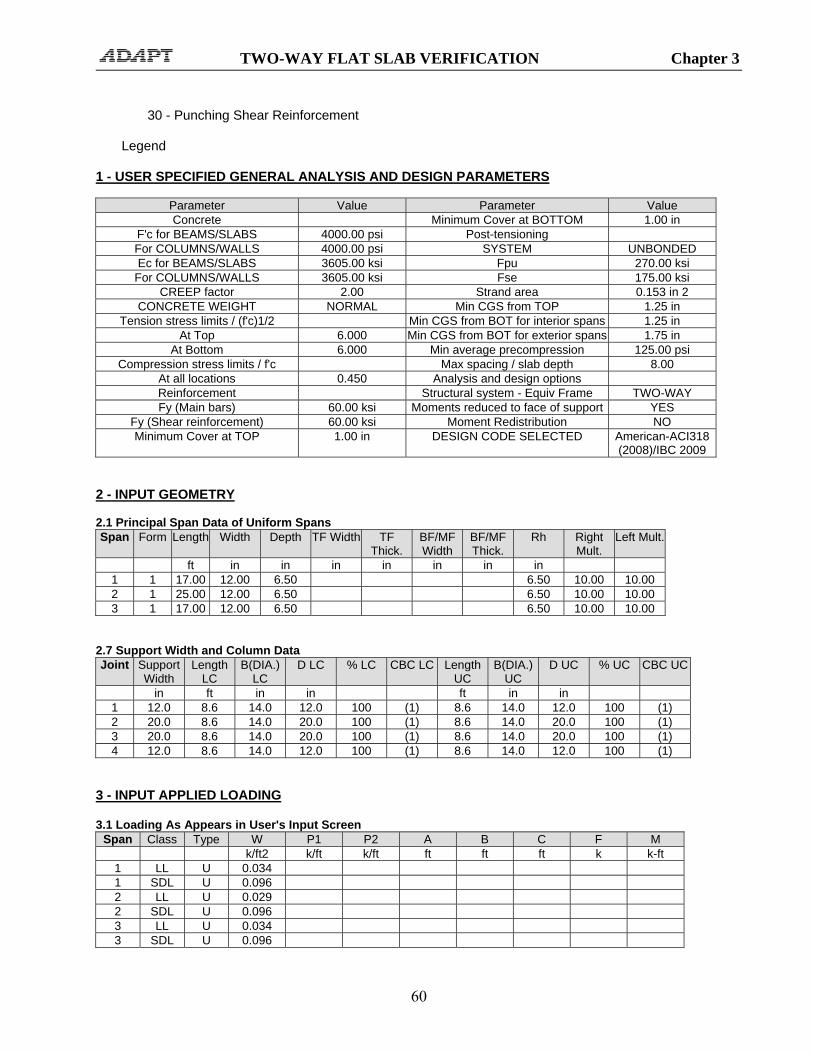
TWO-WAY FLAT SLAB VERIFICATION Chapter 3
60
30 - Punching Shear Reinforcement Legend 1 - USER SPECIFIED GENERAL ANALYSIS AND DESIGN PARAMETERS
Parameter Value Parameter Value Concrete Minimum Cover at BOTTOM 1.00 in
F'c for BEAMS/SLABS 4000.00 psi Post-tensioning For COLUMNS/WALLS 4000.00 psi SYSTEM UNBONDED Ec for BEAMS/SLABS 3605.00 ksi Fpu 270.00 ksi
For COLUMNS/WALLS 3605.00 ksi Fse 175.00 ksi CREEP factor 2.00 Strand area 0.153 in 2
CONCRETE WEIGHT NORMAL Min CGS from TOP 1.25 in Tension stress limits / (f'c)1/2 Min CGS from BOT for interior spans 1.25 in
At Top 6.000 Min CGS from BOT for exterior spans 1.75 in At Bottom 6.000 Min average precompression 125.00 psi
Compression stress limits / f'c Max spacing / slab depth 8.00 At all locations 0.450 Analysis and design options Reinforcement Structural system - Equiv Frame TWO-WAY Fy (Main bars) 60.00 ksi Moments reduced to face of support YES
Fy (Shear reinforcement) 60.00 ksi Moment Redistribution NO Minimum Cover at TOP 1.00 in DESIGN CODE SELECTED American-ACI318
(2008)/IBC 2009 2 - INPUT GEOMETRY 2.1 Principal Span Data of Uniform Spans Span Form Length Width Depth TF Width TF
Thick. BF/MF Width
BF/MF Thick.
Rh Right Mult.
Left Mult.
ft in in in in in in in 1 1 17.00 12.00 6.50 6.50 10.00 10.00 2 1 25.00 12.00 6.50 6.50 10.00 10.00 3 1 17.00 12.00 6.50 6.50 10.00 10.00
2.7 Support Width and Column Data Joint Support
Width Length
LC B(DIA.)
LC D LC % LC CBC LC Length
UC B(DIA.)
UC D UC % UC CBC UC
in ft in in ft in in 1 12.0 8.6 14.0 12.0 100 (1) 8.6 14.0 12.0 100 (1) 2 20.0 8.6 14.0 20.0 100 (1) 8.6 14.0 20.0 100 (1) 3 20.0 8.6 14.0 20.0 100 (1) 8.6 14.0 20.0 100 (1) 4 12.0 8.6 14.0 12.0 100 (1) 8.6 14.0 12.0 100 (1)
3 - INPUT APPLIED LOADING 3.1 Loading As Appears in User's Input Screen
Span Class Type W P1 P2 A B C F M k/ft2 k/ft k/ft ft ft ft k k-ft
1 LL U 0.034 1 SDL U 0.096 2 LL U 0.029 2 SDL U 0.096 3 LL U 0.034 3 SDL U 0.096

TWO-WAY FLAT SLAB VERIFICATION Chapter 3
61
NOTE: LIVE LOADING is SKIPPED with a skip factor of 1.00 4 - CALCULATED SECTION PROPERTIES 4.1 Section Properties of Uniform Spans and Cantilevers
Span Area I Yb Yt in2 in4 in in
1 1560.00 0.55E+04 3.25 3.25 2 1560.00 0.55E+04 3.25 3.25 3 1560.00 0.55E+04 3.25 3.25
5 - MOMENTS, SHEARS AND REACTIONS 5.1 Span Moments and Shears (Excluding Live Load)
Span Load Case Moment Left
Moment Midspan
Moment Right
Shear Left
Shear Right
k-ft k-ft k-ft k k 1 SW 0.00 0.00 0.00 0.00 0.00 2 SW 0.00 0.00 0.00 0.00 0.00 3 SW 0.00 0.00 0.00 0.00 0.00 1 SDL -11.33 25.46 -76.47 -12.49 20.15 2 SDL -94.13 55.87 -94.13 -24.00 24.00 3 SDL -76.47 25.46 -11.33 -20.15 12.49 1 XL 0.00 0.00 0.00 0.00 0.00 2 XL 0.00 0.00 0.00 0.00 0.00 3 XL 0.00 0.00 0.00 0.00 0.00
5.2 Reactions and Column Moments (Excluding Live Load)
Joint Load Case Reaction Moment Lower Column
Moment Upper Column
k k-ft k-ft 1 SW 0.00 0.00 0.00 2 SW 0.00 0.00 0.00 3 SW 0.00 0.00 0.00 4 SW 0.00 0.00 0.00 1 SDL 12.49 -5.82 -5.50 2 SDL 44.15 -9.08 -8.58 3 SDL 44.15 9.08 8.58 4 SDL 12.49 5.82 5.50 1 XL 0.00 0.00 0.00 2 XL 0.00 0.00 0.00 3 XL 0.00 0.00 0.00 4 XL 0.00 0.00 0.00
5.3 Span Moments and Shears (Live Load)
Span Moment Left Max
Moment Left Min
Moment Midspan
Max
Moment Midspan Min
Moment Right Max
Moment Right Min
Shear Left
Shear Right
k-ft k-ft k-ft k-ft k-ft k-ft k k 1 -6.43 2.06 14.45 -4.63 -26.11 -10.35 -5.35 7.07 2 -31.14 -3.42 19.79 -3.42 -31.14 -3.42 -7.56 7.56 3 -26.11 -10.35 14.45 -4.63 -6.43 2.06 -7.07 5.35
5.4 Reactions and Column Moments (Live Load)
Joint Reaction Max
Reaction Min
Moment Lower
Moment Lower
Moment Upper
Moment Upper

TWO-WAY FLAT SLAB VERIFICATION Chapter 3
62
Column Max Column Min Column Max Column Min k k k-ft k-ft k-ft k-ft
1 5.35 -0.79 1.06 -3.31 1.00 -3.13 2 14.63 6.21 5.34 -7.29 5.04 -6.89 3 14.63 6.21 7.29 -5.34 6.89 -5.04 4 5.35 -0.79 3.31 -1.06 3.13 -1.00
6 - MOMENTS REDUCED TO FACE OF SUPPORT 6.1 Reduced Moments at Face of Support (Excluding Live Load)
Span Load Case
Moment Left
Moment Midspan
Moment Right
k-ft k-ft k-ft 1 SW 0.00 0.00 0.00 2 SW 0.00 0.00 0.00 3 SW 0.00 0.00 0.00 1 SDL -5.32 25.46 -60.34 2 SDL -74.79 55.88 -74.79 3 SDL -60.34 25.46 -5.32 1 XL 0.00 0.00 0.00 2 XL 0.00 0.00 0.00 3 XL 0.00 0.00 0.00
6.2 Reduced Moments at Face of Support (Live Load)
Span Moment Left Max
Moment Left Min
Moment Midspan
Max
Moment Midspan Min
Moment Right Max
Moment Right Min
k-ft k-ft k-ft k-ft k-ft k-ft 1 -3.84 1.67 14.45 -4.63 -20.45 -8.86 2 -25.04 -3.42 19.79 -3.42 -25.04 -3.42 3 -20.45 -8.86 14.45 -4.63 -3.84 1.67
7 - SELECTED POST-TENSIONING FORCES AND TENDON PROFILES 7.1 Tendon Profile Tendon A
Span Type X1/L X2/L X3/L A/L 1 1 0.000 0.490 0.000 --- 2 1 0.000 0.500 0.000 --- 3 1 0.000 0.510 0.000 ---
7.2 Selected Post-Tensioning Forces and Tendon Drape Tendon A
Span Force CGS Left CGS C1 CGS C2 CGS Right P/A Wbal WBal (%DL) k in in in in psi k/-
1 201.200 3.25 --- 1.75 5.25 128.97 1.152 60 2 201.500 5.25 --- 1.25 5.25 129.17 0.860 45 3 201.200 5.25 --- 1.75 3.25 128.97 1.152 60
All Tendons
Span Force Total P/A Total WBal (%DL)
k psi 1 201.2 128.97 60 2 201.5 129.17 45 3 201.2 128.97 60
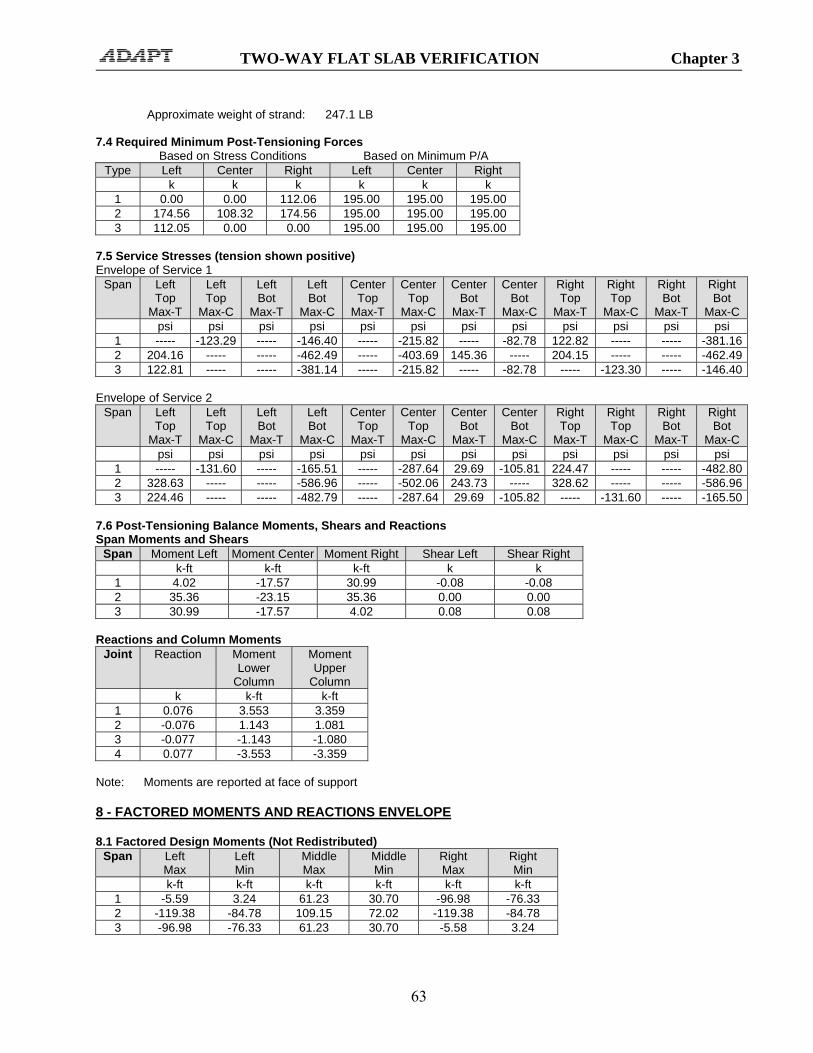
TWO-WAY FLAT SLAB VERIFICATION Chapter 3
63
Approximate weight of strand: 247.1 LB 7.4 Required Minimum Post-Tensioning Forces Based on Stress Conditions Based on Minimum P/A
Type Left Center Right Left Center Right k k k k k k
1 0.00 0.00 112.06 195.00 195.00 195.00 2 174.56 108.32 174.56 195.00 195.00 195.00 3 112.05 0.00 0.00 195.00 195.00 195.00
7.5 Service Stresses (tension shown positive) Envelope of Service 1
Span Left Top
Max-T
Left Top
Max-C
Left Bot
Max-T
Left Bot
Max-C
Center Top
Max-T
Center Top
Max-C
Center Bot
Max-T
Center Bot
Max-C
Right Top
Max-T
Right Top
Max-C
Right Bot
Max-T
Right Bot
Max-C psi psi psi psi psi psi psi psi psi psi psi psi
1 ----- -123.29 ----- -146.40 ----- -215.82 ----- -82.78 122.82 ----- ----- -381.162 204.16 ----- ----- -462.49 ----- -403.69 145.36 ----- 204.15 ----- ----- -462.493 122.81 ----- ----- -381.14 ----- -215.82 ----- -82.78 ----- -123.30 ----- -146.40
Envelope of Service 2
Span Left Top
Max-T
Left Top
Max-C
Left Bot
Max-T
Left Bot
Max-C
Center Top
Max-T
Center Top
Max-C
Center Bot
Max-T
Center Bot
Max-C
Right Top
Max-T
Right Top
Max-C
Right Bot
Max-T
Right Bot
Max-C psi psi psi psi psi psi psi psi psi psi psi psi
1 ----- -131.60 ----- -165.51 ----- -287.64 29.69 -105.81 224.47 ----- ----- -482.802 328.63 ----- ----- -586.96 ----- -502.06 243.73 ----- 328.62 ----- ----- -586.963 224.46 ----- ----- -482.79 ----- -287.64 29.69 -105.82 ----- -131.60 ----- -165.50
7.6 Post-Tensioning Balance Moments, Shears and Reactions Span Moments and Shears
Span Moment Left Moment Center Moment Right Shear Left Shear Right k-ft k-ft k-ft k k
1 4.02 -17.57 30.99 -0.08 -0.08 2 35.36 -23.15 35.36 0.00 0.00 3 30.99 -17.57 4.02 0.08 0.08
Reactions and Column Moments
Joint Reaction Moment Lower
Column
Moment Upper
Column k k-ft k-ft
1 0.076 3.553 3.359 2 -0.076 1.143 1.081 3 -0.077 -1.143 -1.080 4 0.077 -3.553 -3.359
Note: Moments are reported at face of support 8 - FACTORED MOMENTS AND REACTIONS ENVELOPE 8.1 Factored Design Moments (Not Redistributed)
Span Left Max
Left Min
Middle Max
Middle Min
Right Max
Right Min
k-ft k-ft k-ft k-ft k-ft k-ft 1 -5.59 3.24 61.23 30.70 -96.98 -76.33 2 -119.38 -84.78 109.15 72.02 -119.38 -84.78 3 -96.98 -76.33 61.23 30.70 -5.58 3.24

TWO-WAY FLAT SLAB VERIFICATION Chapter 3
64
8.2 Reactions and Column Moments Joint Reaction
Max Reaction
Min Moment Lower
Column Max
Moment Lower
Column Min
Moment Upper
Column Max
Moment Upper
Column Min k k k-ft k-ft k-ft k-ft
1 23.62 13.80 -1.74 -8.73 -1.64 -8.25 2 76.31 61.73 -1.21 -21.42 -1.15 -20.25 3 76.31 61.73 21.42 1.21 20.25 1.15 4 23.62 13.80 8.72 1.74 8.25 1.64
8.3 Secondary Moments
Span Left Midspan Right k-ft k-ft k-ft
1 6.95 7.56 8.15 2 10.43 10.43 10.43 3 8.15 7.56 6.95
Note: Moments are reported at face of support 10 - MILD STEEL - NO REDISTRIBUTION 10.1 Required Rebar 10.1.1 Total Strip Required Rebar
Span Location From To As Required Ultimate Minimum ft ft in2 in2 in2
1 TOP 0.00 2.55 1.17 0.00 1.17 1 TOP 14.45 17.00 1.23 0.58 1.23 2 TOP 0.00 3.75 1.95 1.95 1.23 2 TOP 21.25 25.00 1.95 1.95 1.23 3 TOP 0.00 2.55 1.23 0.58 1.23 3 TOP 14.45 17.00 1.17 0.00 1.17 2 BOT 8.75 16.25 2.07 1.16 2.07
10.2 Provided Rebar 10.2.1 Total Strip Provided Rebar
Span ID Location From Quantity Size Length Area ft ft in2
1 1 TOP 0.00 4 5 3.50 1.24 1 2 TOP 13.60 4 5 8.50 1.24 2 3 TOP 20.00 4 5 8.50 1.24 3 4 TOP 13.60 4 5 3.50 1.24 1 5 TOP 16.00 3 5 4.50 0.93 2 6 TOP 21.50 3 5 4.50 0.93 2 7 BOT 6.50 4 5 12.00 1.24 2 8 BOT 7.75 3 5 9.50 0.93
10.2.2 Total Strip Steel Disposition
Span ID Location From Quantity Size Length ft ft
1 1 TOP 0.00 4 5 3.50 1 2 TOP 13.60 4 5 3.40 1 5 TOP 16.00 3 5 1.00 2 2 TOP 0.00 4 5 5.10 2 3 TOP 20.00 4 5 5.00 2 5 TOP 0.00 3 5 3.50

TWO-WAY FLAT SLAB VERIFICATION Chapter 3
65
2 6 TOP 21.50 3 5 3.50 3 3 TOP 0.00 4 5 3.50 3 4 TOP 13.60 4 5 3.50 3 6 TOP 0.00 3 5 1.00 2 7 BOT 6.50 4 5 12.00 2 8 BOT 7.75 3 5 9.50
13 - PUNCHING SHEAR REINFORCEMENT 13.1 Critical Section Geometry Column Layer Cond. a d b1 b2
in in in in 1 1 2 2.44 4.88 14.44 18.88 2 1 1 2.44 4.88 24.88 18.88 3 1 1 2.44 4.88 24.88 18.88 4 1 2 2.44 4.88 14.44 18.88
13.2 Critical Section Stresses Label Layer Cond. Factored
shear Factored moment
Stress due to shear
Stress due to moment
Total stress Allowable stress
Stress ratio
k k-ft ksi ksi ksi ksi 1 1 2 -23.62 +16.98 0.10 0.031 0.132 0.190 0.697 2 1 1 -76.31 +27.02 0.18 0.042 0.221 0.195 1.133 3 1 1 -76.31 -27.02 0.18 0.042 0.221 0.195 1.133 4 1 2 -23.62 -16.98 0.10 0.031 0.132 0.190 0.697
13.3 Punching Shear Reinforcement Reinforcement option: Stirrups Bar Size: 5
Col. Dist N_Legs Dist N_Legs Dist N_Legs Dist N_Legs Dist N_Legs in in in in in
1 2 2.4 9 4.9 11 7.3 13 9.8 15 12.2 17 3 2.4 9 4.9 11 7.3 13 9.8 15 12.2 17 4
Dist. = Distance measured from the face of support Note: Columns with --- have not been checked for punching shear. Note: Columns with *** have exceeded the maximum allowable shear stress. 14 - DEFLECTIONS 14.1 Maximum Span Deflections
Span SW SW+PT SW+PT+SDL
SW+PT+SDL+Creep
LL X Total
in in in in in in in 1 0.00 -0.03 0.01 0.04(4581) 0.02(10853) 0.00(*****) 0.06(3250) 2 0.00 -0.08 0.13 0.38(780) 0.06(5078) 0.00(*****) 0.44(676) 3 0.00 -0.03 0.01 0.04(4581) 0.02(10853) 0.00(*****) 0.06(3250)
30 - PUNCHING SHEAR REINFORCEMENT Reinforcement option: Stirrup Bar Size: 5 Column - 1 Layer Cond. a d b1 b2 Vu Mu Stress Allow. Ratio As NLegs Dist.

TWO-WAY FLAT SLAB VERIFICATION Chapter 3
66
in in in in k k-ft ksi ksi in2 in 1 2 2.44 4.88 14.44 18.88 -23.62 16.98 0.132 0.190 0.70 0.00 0 0.00
Dist. = Distance between the legs Column - 2 Layer Cond. a d b1 b2 Vu Mu Stress Allow. Ratio As NLegs Dist.
in in in in k k-ft ksi ksi in2 in 1 1 2.44 4.88 24.88 18.88 -76.31 27.02 0.221 0.195 1.13 0.60 9 9.75 2 1 4.88 4.88 29.75 23.75 -76.31 27.02 0.174 0.187 0.93 0.46 11 9.75 3 1 7.31 4.88 34.63 28.63 -76.31 27.02 0.144 0.173 0.83 0.34 13 9.75 4 1 9.75 4.88 39.50 33.50 -76.31 27.02 0.122 0.164 0.75 0.22 15 9.75 5 1 12.19 4.88 44.37 38.38 -76.31 27.02 0.106 0.156 0.68 0.10 17 9.75 6 1 14.63 4.88 49.25 43.25 -76.31 27.02 0.094 0.150 0.63 0.00 0 0.00
Dist. = Distance between the legs Column - 3 Layer Cond. a d b1 b2 Vu Mu Stress Allow. Ratio As NLegs Dist.
in in in in k k-ft ksi ksi in2 in 1 1 2.44 4.88 24.88 18.88 -76.31 -27.02 0.221 0.195 1.13 0.60 9 9.75 2 1 4.88 4.88 29.75 23.75 -76.31 -27.02 0.174 0.187 0.93 0.46 11 9.75 3 1 7.31 4.88 34.63 28.63 -76.31 -27.02 0.144 0.173 0.83 0.34 13 9.75 4 1 9.75 4.88 39.50 33.50 -76.31 -27.02 0.122 0.164 0.75 0.22 15 9.75 5 1 12.19 4.88 44.37 38.38 -76.31 -27.02 0.106 0.156 0.68 0.10 17 9.75 6 1 14.63 4.88 49.25 43.25 -76.31 -27.02 0.094 0.150 0.63 0.00 0 0.00
Dist. = Distance between the legs Column - 4 Layer Cond. a d b1 b2 Vu Mu Stress Allow. Ratio As NLegs Dist.
in in in in k k-ft ksi ksi in2 in 1 2 2.44 4.88 14.44 18.88 -23.62 -16.98 0.132 0.190 0.70 0.00 0 0.00
Dist. = Distance between the legs Note: Columns with --- have not been checked for punching shear. Note: Columns with *** have exceeded the maximum allowable shear stress. Note: For the layers with As = 0.00, more reinforcement is provided to satisfy provision 13.3.7.4 of canadian-04 design code. Legend (2.1): Span C = Cantilever Form 1 = Rectangular, 2 = T or Inverted L, 3 = I, 4 = Extended T or L section Rh Elevation of top surface TF Top flange MF Middle flange BF Bottom flange Legend (2.7): The Column Boundary Condition (CBC): Fixed at both 1 Hinged at near end, fixed at far end 2 Fixed at near end, hinged at far end 3 Fixed at near end, roller with rotational fixity at far end 4 LC Lower Column UC Upper Column Legend (3.1): Class: SW: Selfweight, LL: Live Load, SDL: Superimposed Dead Load, X: Other Loading
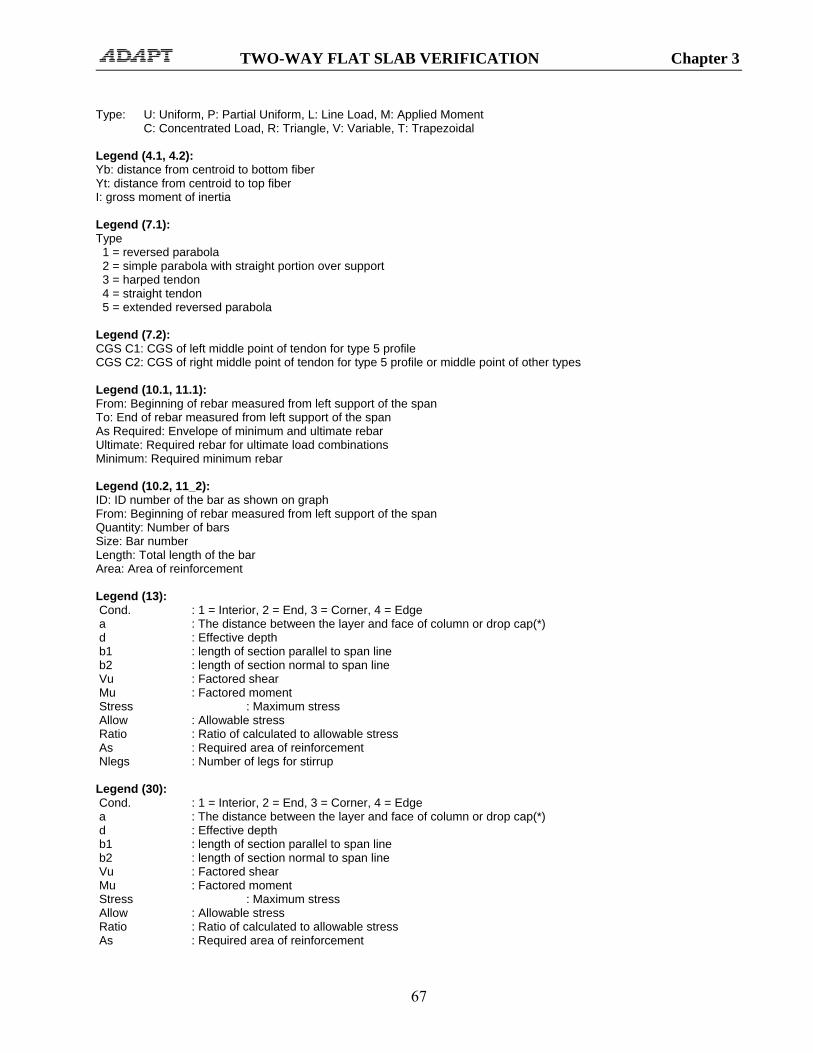
TWO-WAY FLAT SLAB VERIFICATION Chapter 3
67
Type: U: Uniform, P: Partial Uniform, L: Line Load, M: Applied Moment C: Concentrated Load, R: Triangle, V: Variable, T: Trapezoidal Legend (4.1, 4.2): Yb: distance from centroid to bottom fiber Yt: distance from centroid to top fiber I: gross moment of inertia Legend (7.1): Type 1 = reversed parabola 2 = simple parabola with straight portion over support 3 = harped tendon 4 = straight tendon 5 = extended reversed parabola Legend (7.2): CGS C1: CGS of left middle point of tendon for type 5 profile CGS C2: CGS of right middle point of tendon for type 5 profile or middle point of other types Legend (10.1, 11.1): From: Beginning of rebar measured from left support of the span To: End of rebar measured from left support of the span As Required: Envelope of minimum and ultimate rebar Ultimate: Required rebar for ultimate load combinations Minimum: Required minimum rebar Legend (10.2, 11_2): ID: ID number of the bar as shown on graph From: Beginning of rebar measured from left support of the span Quantity: Number of bars Size: Bar number Length: Total length of the bar Area: Area of reinforcement Legend (13): Cond. : 1 = Interior, 2 = End, 3 = Corner, 4 = Edge a : The distance between the layer and face of column or drop cap(*) d : Effective depth b1 : length of section parallel to span line b2 : length of section normal to span line Vu : Factored shear Mu : Factored moment Stress : Maximum stress Allow : Allowable stress Ratio : Ratio of calculated to allowable stress As : Required area of reinforcement Nlegs : Number of legs for stirrup Legend (30): Cond. : 1 = Interior, 2 = End, 3 = Corner, 4 = Edge a : The distance between the layer and face of column or drop cap(*) d : Effective depth b1 : length of section parallel to span line b2 : length of section normal to span line Vu : Factored shear Mu : Factored moment Stress : Maximum stress Allow : Allowable stress Ratio : Ratio of calculated to allowable stress As : Required area of reinforcement

TWO-WAY FLAT SLAB VERIFICATION Chapter 3
68
Nlegs : Number of legs for stirrup
EQUIVALENT FRAME CONSTANTS DATA BLOCK 290
888 290
Kc Lower Column
Kc Upper Column
Kt Kec S
.82852E+02 .78322E+02 .64997E+02 .46318E+02 .10701E+01
.38357E+03 .36260E+03 .13077E+03 .11127E+03 .57367E+00
.38357E+03 .36260E+03 .13077E+03 .11127E+03 .57367E+00
.82852E+02 .78322E+02 .64997E+02 .46318E+02 .10701E+01
STIFFNESS COEFFICIENTS DATA BLOCK 310
888 310
Span K11 K12 K21 K22 1 .10770E+03 .53848E+02 .53848E+02 .10770E+03 2 .73233E+02 .36617E+02 .36617E+02 .73233E+02 3 .10770E+03 .53848E+02 .53848E+02 .10770E+03
TABLE 3.2.1-1 EXCERPT FROM FILE CS.DAT
FOR TWO-WAY APARTMENT EXAMPLE PTI-2WAY
F3 F4 F6 F8
F10 F11

TWO-WAY FLAT SLAB VERIFICATION Chapter 3
69
3.2.2 ADAPT-PT Report in SI System of Units
TWO-WAY FLAT SLAB VERIFICATION
Tuesday, March 30, 2010

TWO-WAY FLAT SLAB VERIFICATION Chapter 3
70
TABLE OF CONTENT: Tabular Reports - Compact 1 - User Specified General Analysis and Design Parameters 2 - Input Geometry 2.1 - Principal Span Data of Uniform Spans 2.7 - Support Width and Column Data 3 - Input Applied Loading 3.1 - Loading As Appears in User's Input Screen 4 - Calculated Section Properties 4.1 - Section Properties of Uniform Spans and Cantilevers 5 - Moments, Shears and Reactions 5.1 - Span Moments and Shears (Excluding Live Load) 5.2 - Reactions and Column Moments (Excluding Live Load) 5.3 - Span Moments and Shears (Live Load) 5.4 - Reactions and Column Moments (Live Load) 6 - Moments Reduced to Face of Support 6.1 - Reduced Moments at Face of Support (Excluding Live Load) 6.2 - Reduced Moments at Face of Support (Live Load) 7 - Selected Post-Tensioning Forces and Tendon Profiles 7.1 - Tendon Profile 7.2 - Selected Post-Tensioning Forces and Tendon Drape 7.4 - Required Minimum Post-Tensioning Forces 7.5 - Service Stresses 7.6 - Post-Tensioning Balance Moments, Shears and Reactions 8 - Factored Moments and Reactions Envelope 8.1 - Factored Design Moments (Not Redistributed) 8.2 - Reactions and Column Moments 8.3 - Secondary Moments 10 - Mild Steel (No Redistribution) 10.1 - Required Rebar 10.1.1 - Total Strip Required Rebar 13 - Punching Shear Reinforcement 13.1 - Critical Section Geometry 13.2 - Critical Section Stresses 13.3 - Punching Shear Reinforcement 14 - Deflections 14.1 - Maximum Span Deflections Tabular Reports - Detailed 30 - Punching Shear Reinforcement

TWO-WAY FLAT SLAB VERIFICATION Chapter 3
71
1 - USER SPECIFIED GENERAL ANALYSIS AND DESIGN PARAMETERS
Parameter Value Parameter Value Concrete Minimum Cover at BOTTOM 25.40 mm
F'c for BEAMS/SLABS 28.00 N/mm 2 Post-tensioning For COLUMNS/WALLS 28.00 N/mm 2 SYSTEM UNBONDED Ec for BEAMS/SLABS 24870.00 N/mm 2 Fpu 1862.00 N/mm 2
For COLUMNS/WALLS 24870.00 N/mm 2 Fse 1206.60 N/mm 2 CREEP factor 2.00 Strand area 98.709 mm 2
CONCRETE WEIGHT NORMAL Min CGS from TOP 31.75 mm Tension stress limits / (f'c)1/2 Min CGS from BOT for interior spans 31.75 mm
At Top 0.498 Min CGS from BOT for exterior spans 44.45 mm At Bottom 0.498 Min average precompression 0.86 N/mm 2
Compression stress limits / f'c Max spacing / slab depth 8.00 At all locations 0.450 Analysis and design options Reinforcement Structural system - Equiv Frame TWO-WAY Fy (Main bars) 413.69 N/mm 2 Moments reduced to face of support YES
Fy (Shear reinforcement) 414.00 N/mm 2 Moment Redistribution NO Minimum Cover at TOP 25.40 mm DESIGN CODE SELECTED American-ACI318
(2008)/IBC 2009 2 - INPUT GEOMETRY 2.1 Principal Span Data of Uniform Spans Span Form Length Width Depth TF Width TF
Thick. BF/MF Width
BF/MF Thick.
Rh Right Mult.
Left Mult.
m mm mm mm mm mm mm mm 1 1 5.18 304 165 165 10.00 10.00 2 1 7.62 304 165 165 10.00 10.00 3 1 5.18 304 165 165 10.00 10.00
2.7 Support Width and Column Data Joint Support
Width Length
LC B(DIA.)
LC D LC % LC CBC LC Length
UC B(DIA.)
UC D UC % UC CBC UC
mm m mm mm m mm mm 1 304.0 2.6 355.0 304.0 100 (1) 2.6 355.0 304.0 100 (1) 2 508.0 2.6 355.0 508.0 100 (1) 2.6 355.0 508.0 100 (1) 3 508.0 2.6 355.0 508.0 100 (1) 2.6 355.0 508.0 100 (1) 4 304.0 2.6 355.0 304.0 100 (1) 2.6 355.0 304.0 100 (1)
3 - INPUT APPLIED LOADING 3.1 Loading As Appears in User's Input Screen
Span Class Type W P1 P2 A B C F M kN/m2 kN/m kN/m m m m kN kN-m
1 LL U 1.628 1 SDL U 4.596 2 LL U 1.389 2 SDL U 4.596 3 LL U 1.628 3 SDL U 4.596
NOTE: LIVE LOADING is SKIPPED with a skip factor of 1.00

TWO-WAY FLAT SLAB VERIFICATION Chapter 3
72
4 - CALCULATED SECTION PROPERTIES 4.1 Section Properties of Uniform Spans and Cantilevers
Span Area I Yb Yt mm2 mm4 mm mm
1 1003200.00 0.23E+10 82.50 82.50 2 1003200.00 0.23E+10 82.50 82.50 3 1003200.00 0.23E+10 82.50 82.50
5 - MOMENTS, SHEARS AND REACTIONS 5.1 Span Moments and Shears (Excluding Live Load)
Span Load Case Moment Left
Moment Midspan
Moment Right
Shear Left
Shear Right
kN-m kN-m kN-m kN kN 1 SW 0.00 0.00 0.00 0.00 0.00 2 SW 0.00 0.00 0.00 0.00 0.00 3 SW 0.00 0.00 0.00 0.00 0.00 1 SDL -15.33 34.45 -103.36 -55.41 89.39 2 SDL -127.29 75.53 -127.29 -106.47 106.46 3 SDL -103.36 34.46 -15.33 -89.39 55.41
5.2 Reactions and Column Moments (Excluding Live Load)
Joint Load Case Reaction Moment Lower Column
Moment Upper Column
kN kN-m kN-m 1 SW 0.00 0.00 0.00 2 SW 0.00 0.00 0.00 3 SW 0.00 0.00 0.00 4 SW 0.00 0.00 0.00 1 SDL 55.41 -7.88 -7.45 2 SDL 195.86 -12.30 -11.63 3 SDL 195.85 12.30 11.63 4 SDL 55.41 7.88 7.45
5.3 Span Moments and Shears (Live Load)
Span Moment Left Max
Moment Left Min
Moment Midspan
Max
Moment Midspan Min
Moment Right Max
Moment Right Min
Shear Left
Shear Right
kN-m kN-m kN-m kN-m kN-m kN-m kN kN 1 -8.69 2.79 19.53 -6.25 -35.30 -13.97 -23.72 31.36 2 -42.13 -4.61 26.76 -4.61 -42.12 -4.61 -33.56 33.56 3 -35.30 -13.97 19.53 -6.25 -8.69 2.79 -31.36 23.72
5.4 Reactions and Column Moments (Live Load)
Joint Reaction Max
Reaction Min
Moment Lower
Column Max
Moment Lower
Column Min
Moment Upper
Column Max
Moment Upper
Column Min kN kN kN-m kN-m kN-m kN-m
1 23.72 -3.49 1.43 -4.47 1.35 -4.23 2 64.93 27.58 7.24 -9.89 6.84 -9.35 3 64.93 27.58 9.89 -7.24 9.35 -6.84 4 23.72 -3.49 4.47 -1.43 4.23 -1.35
6 - MOMENTS REDUCED TO FACE OF SUPPORT

TWO-WAY FLAT SLAB VERIFICATION Chapter 3
73
6.1 Reduced Moments at Face of Support (Excluding Live Load) Span Load
Case Moment
Left Moment Midspan
Moment Right
kN-m kN-m kN-m 1 SW 0.00 0.00 0.00 2 SW 0.00 0.00 0.00 3 SW 0.00 0.00 0.00 1 SDL -7.23 34.45 -81.56 2 SDL -101.20 75.53 -101.10 3 SDL -81.55 34.46 -7.23
6.2 Reduced Moments at Face of Support (Live Load)
Span Moment Left Max
Moment Left Min
Moment Midspan
Max
Moment Midspan Min
Moment Right Max
Moment Right Min
kN-m kN-m kN-m kN-m kN-m kN-m 1 -5.20 2.26 19.53 -6.25 -27.65 -12.00 2 -33.87 -4.61 26.76 -4.61 -33.87 -4.61 3 -27.65 -12.00 19.53 -6.25 -5.20 2.26
7 - SELECTED POST-TENSIONING FORCES AND TENDON PROFILES 7.1 Tendon Profile Tendon A
Span Type X1/L X2/L X3/L A/L 1 1 0.000 0.490 0.000 --- 2 1 0.000 0.500 0.000 --- 3 1 0.000 0.510 0.000 ---
7.2 Selected Post-Tensioning Forces and Tendon Drape Tendon A
Span Force CGS Left CGS C1 CGS C2 CGS Right P/A Wbal WBal (%DL) kN mm mm mm mm MPa kN/-
1 894.980 82.50 --- 44.45 133.25 0.89 16.782 60 2 896.310 133.25 --- 31.75 133.25 0.89 12.534 45 3 894.980 133.25 --- 44.45 82.50 0.89 16.782 60
All Tendons
Span Force Total P/A Total WBal (%DL)
kN MPa 1 894.98 0.89 60 2 896.31 0.89 45 3 894.98 0.89 60
Approximate weight of strand: 112.2 Kg 7.4 Required Minimum Post-Tensioning Forces Based on Stress Conditions Based on Minimum P/A
Type Left Center Right Left Center Right kN kN kN kN kN kN
1 0.00 0.00 491.25 862.75 862.75 862.75 2 770.58 473.59 769.38 862.75 862.75 862.75 3 491.12 0.00 0.00 862.75 862.75 862.75
7.5 Service Stresses (tension shown positive) Envelope of Service 1
Span Left Left Left Left Center Center Center Center Right Right Right Right

TWO-WAY FLAT SLAB VERIFICATION Chapter 3
74
Top Max-T
Top Max-C
Bot Max-T
Bot Max-C
Top Max-T
Top Max-C
Bot Max-T
Bot Max-C
Top Max-T
Top Max-C
Bot Max-T
Bot Max-C
MPa MPa MPa MPa MPa MPa MPa MPa MPa MPa MPa MPa 1 ----- -0.85 ----- -1.01 ----- -1.49 ----- -0.57 0.84 ----- ----- -2.63 2 1.41 ----- ----- -3.19 ----- -2.79 1.00 ----- 1.40 ----- ----- -3.19 3 0.84 ----- ----- -2.63 ----- -1.49 ----- -0.57 ----- -0.85 ----- -1.01
Envelope of Service 2
Span Left Top
Max-T
Left Top
Max-C
Left Bot
Max-T
Left Bot
Max-C
Center Top
Max-T
Center Top
Max-C
Center Bot
Max-T
Center Bot
Max-C
Right Top
Max-T
Right Top
Max-C
Right Bot
Max-T
Right Bot
Max-C MPa MPa MPa MPa MPa MPa MPa MPa MPa MPa MPa MPa
1 ----- -0.91 ----- -1.14 ----- -1.99 0.20 -0.73 1.54 ----- ----- -3.33 2 2.27 ----- ----- -4.05 ----- -3.46 1.68 ----- 2.26 ----- ----- -4.05 3 1.54 ----- ----- -3.33 ----- -1.99 0.20 -0.73 ----- -0.91 ----- -1.14
7.6 Post-Tensioning Balance Moments, Shears and Reactions Span Moments and Shears
Span Moment Left Moment Center Moment Right Shear Left Shear Right kN-m kN-m kN-m kN kN
1 5.46 -23.79 41.97 -0.34 -0.34 2 47.90 -31.35 47.89 0.00 0.00 3 41.96 -23.79 5.46 0.34 0.34
Reactions and Column Moments
Joint Reaction Moment Lower
Column
Moment Upper
Column kN kN-m kN-m
1 0.338 4.811 4.548 2 -0.338 1.555 1.470 3 -0.337 -1.554 -1.469 4 0.338 -4.812 -4.549
Note: Moments are reported at face of support 8 - FACTORED MOMENTS AND REACTIONS ENVELOPE 8.1 Factored Design Moments (Not Redistributed)
Span Left Max
Left Min
Middle Max
Middle Min
Right Max
Right Min
kN-m kN-m kN-m kN-m kN-m kN-m 1 -7.59 4.35 82.82 41.57 -131.09 -103.16 2 -161.50 -114.69 147.58 97.39 -161.38 -114.57 3 -131.08 -103.15 82.84 41.59 -7.59 4.35
8.2 Reactions and Column Moments
Joint Reaction Max
Reaction Min
Moment Lower
Column Max
Moment Lower
Column Min
Moment Upper
Column Max
Moment Upper
Column Min kN kN kN-m kN-m kN-m kN-m
1 104.78 61.25 -2.35 -11.79 -2.22 -11.15 2 338.63 273.92 -1.62 -29.04 -1.54 -27.45 3 338.63 273.92 29.03 1.63 27.45 1.54 4 104.78 61.25 11.79 2.35 11.15 2.22
8.3 Secondary Moments
Span Left Midspan Right kN-m kN-m kN-m

TWO-WAY FLAT SLAB VERIFICATION Chapter 3
75
1 9.41 10.23 11.02 2 14.13 14.13 14.13 3 11.02 10.24 9.41
Note: Moments are reported at face of support 10 - MILD STEEL - NO REDISTRIBUTION 10.1 Required Rebar 10.1.1 Total Strip Required Rebar
Span Location From To As Required Ultimate Minimum m m mm2 mm2 mm2
1 TOP 0.00 0.78 752.40 0.00 752.40 1 TOP 4.41 5.18 792.10 332.40 792.10 2 TOP 0.00 1.14 1250.00 1250.00 792.10 2 TOP 6.48 7.62 1250.00 1250.00 792.10 3 TOP 0.00 0.78 792.10 332.40 792.10 3 TOP 4.41 5.18 752.40 0.00 752.40 2 BOT 2.67 4.95 1328.00 763.20 1328.00
13 - PUNCHING SHEAR REINFORCEMENT 13.1 Critical Section Geometry Column Layer Cond. a d b1 b2
mm mm mm mm 1 1 2 61.80 123.60 365.80 478.60 2 1 1 61.80 123.60 631.60 478.60 3 1 1 61.80 123.60 631.60 478.60 4 1 2 61.80 123.60 365.80 478.60
13.2 Critical Section Stresses Label Layer Cond. Factored
shear Factored moment
Stress due to shear
Stress due to moment
Total stress Allowable stress
Stress ratio
kN kN-m MPa MPa MPa MPa 1 1 2 -104.78 +22.95 0.70 0.213 0.913 1.318 0.693 2 1 1 -338.58 +36.57 1.23 0.291 1.525 1.354 1.126 3 1 1 -338.56 -36.58 1.23 0.291 1.525 1.354 1.127 4 1 2 -104.79 -22.95 0.70 0.213 0.913 1.318 0.693
13.3 Punching Shear Reinforcement Reinforcement option: Stirrups Bar Size: 16
Col. Dist N_Legs Dist N_Legs Dist N_Legs Dist N_Legs Dist N_Legs mm mm mm mm mm
1 2 61.8 9 123.6 11 185.4 13 247.2 15 309.0 17 3 61.8 9 123.6 11 185.4 13 247.2 15 309.0 17 4
Dist. = Distance measured from the face of support Note: Columns with --- have not been checked for punching shear. Note: Columns with *** have exceeded the maximum allowable shear stress. 14 - DEFLECTIONS 14.1 Maximum Span Deflections

TWO-WAY FLAT SLAB VERIFICATION Chapter 3
76
Span SW SW+PT SW+PT+SDL
SW+PT+SDL+Creep
LL X Total
mm mm mm mm mm mm mm 1 0.0 -0.8 0.4 1.1(4575) 0.5(10834) 0.0(*****) 1.6(3246) 2 0.0 -2.1 3.3 9.8(781) 1.5(5068) 0.0(*****) 11.3(677) 3 0.0 -0.8 0.4 1.1(4574) 0.5(10835) 0.0(*****) 1.6(3246)
30 - PUNCHING SHEAR REINFORCEMENT Reinforcement option: Stirrup Bar Size: 16 Column - 1 Layer Cond. a d b1 b2 Vu Mu Stress Allow. Ratio As NLegs Dist.
mm mm mm mm kN kN-m MPa MPa mm2 mm 1 2 61.80 123.60 365.80 478.60 -104.78 22.95 0.913 1.318 0.69 0.00 0 0.00
Dist. = Distance between the legs Column - 2 Layer Cond. a d b1 b2 Vu Mu Stress Allow. Ratio As NLegs Dist.
mm mm mm mm kN kN-m MPa MPa mm2 mm 1 1 61.80 123.60 631.60 478.60 -338.58 36.57 1.525 1.354 1.13 382.90 9 247.202 1 123.60 123.60 755.20 602.20 -338.58 36.57 1.204 1.295 0.93 294.40 11 247.203 1 185.40 123.60 878.80 725.80 -338.58 36.57 0.993 1.203 0.83 213.20 13 247.204 1 247.20 123.60 1002.40 849.40 -338.58 36.57 0.844 1.135 0.74 136.50 15 247.205 1 309.00 123.60 1126.00 973.00 -338.58 36.57 0.734 1.083 0.68 62.54 17 247.206 1 370.80 123.60 1249.60 1096.60 -338.58 36.57 0.649 1.042 0.62 0.00 0 0.00
Dist. = Distance between the legs Column - 3 Layer Cond. a d b1 b2 Vu Mu Stress Allow. Ratio As NLegs Dist.
mm mm mm mm kN kN-m MPa MPa mm2 mm 1 1 61.80 123.60 631.60 478.60 -338.56 -36.58 1.525 1.354 1.13 382.90 9 247.202 1 123.60 123.60 755.20 602.20 -338.56 -36.58 1.204 1.295 0.93 294.40 11 247.203 1 185.40 123.60 878.80 725.80 -338.56 -36.58 0.993 1.203 0.83 213.20 13 247.204 1 247.20 123.60 1002.40 849.40 -338.56 -36.58 0.844 1.135 0.74 136.50 15 247.205 1 309.00 123.60 1126.00 973.00 -338.56 -36.58 0.734 1.083 0.68 62.54 17 247.206 1 370.80 123.60 1249.60 1096.60 -338.56 -36.58 0.649 1.042 0.62 0.00 0 0.00
Dist. = Distance between the legs Column - 4 Layer Cond. a d b1 b2 Vu Mu Stress Allow. Ratio As NLegs Dist.
mm mm mm mm kN kN-m MPa MPa mm2 mm 1 2 61.80 123.60 365.80 478.60 -104.79 -22.95 0.913 1.318 0.69 0.00 0 0.00
Dist. = Distance between the legs Note: Columns with --- have not been checked for punching shear. Note: Columns with *** have exceeded the maximum allowable shear stress. Note: For the layers with As = 0.00, more reinforcement is provided to satisfy provision 13.3.7.4 of canadian-04 design code.

TWO-WAY FLAT SLAB VERIFICATION Chapter 3
77
3.3 VERIFICATION
3.3.1 Verification of Report for American Units
The ADAPT-PT report is presented in numbered data blocks. Each data block data are provided in table. For example, looking at the report, it is observed that data block 2.1 third column is the length of the span. In notation form, this is referred to as (B2.1, C3).
3.3.1.1 Geometry of Slab (Data Block 2)
Data block 2.1, 2.3 and 2.7 identify the geometry of the slab, transverse beam and column supports.
3.3.1.2 Loading (Data Block 3.1)
Data block 3.1 lists the loading details.
3.3.1.3 Calculated Section Properties (Data Block 4)
Data block 4 reflects the calculated section properties of all the spans.
Section properties at mid span:
Area, A = 6.5* 20* 12
= 1560 in2 (10.06e5 mm2) (ADAPT 1560, B4.1, C2)
Moment of inertia, I = (b * h3)/ 12 = (240 * 6.53)/12 = 0.55E+04in4 (22.86e8 mm4)
(ADAPT 0.55E+04,B4.1, C3) Distance from bottom fiber to centroid, Yb = 3.25 in (83 mm) (ADAPT 3.25, B4.1, C4) Distance from top fiber to centroid, Yt = 3.25 in (83 mm) (ADAPT 3.25,B4.1, C5)
3.3.1.4 Material Properties (Data Block 1)
Concrete, post-tensioning strand and mild reinforcement material properties are given in data block 1.
3.3.1.5 Tendon Profile, Force and Balanced Loading (Data Block 7)
The tendon geometry and forces are summarized in data blocks 7.1 and 7.2 in ADAPT-PT report.
3.3.1.6 Structural System Line (Centerline) Moments

TWO-WAY FLAT SLAB VERIFICATION Chapter 3
78
ADAPT-PT has the option to use the Equivalent Frame Method, as described in ACI-318 Chapter 13, and used in this example. The centerline moments are determined using modified column stiffness. This accounts for the biaxial response of the slab that is not explicitly represented in the strip model.
3.3.1.7 Column Stiffness Kc (Reference Numbers F3, F4, See Table 3.2.1-1)
Consider the columns at second support: Dimensions = 14 x 20 Ico = 14*203/12 = 9333 in4 (3.88e9 mm4) Length = 103 in (2616 mm) For upper column:
L = floor to floor distance Kc = (4EIco/L) = 4*1*9333/103 = 362.5 (F4, Table 3.2.1-1) For lower column:
L' = clear height = 103 – (6.5/2) = 99.75 in. (2534 mm) I = Ico*[L*(1 + 3*(L/L'))/4*L'] = 9333*[103*(1 + 3*(103/99.75))/4*99.75] = 9873 in4 (4.11e9 mm4) Kc = 4EI/L’ = 4*1*9873/103 = 384 (F3, Table 3.2.1-1) Torsional stiffness Kt:
C = (1 - 0.63*x/y)*(x3*y/3) = (1 - 0.63*6.5/20)*(6.53*20/3) = 1456 L2 = tributary of frame = 20*12 = 240 in. (6096 mm) c2 = 14 in., or 1.17 ft (0.36 m) each side Kt
= (9*C*E)/[L2*(1 - c2/L2)3]
= (9*1456*1)/[240*(1 - 1.17/20)3] = 65.42 Total Kt = 2 * 65.42 = 131 (F6, Table 3.2.1-1) Equivalent column stiffness:

TWO-WAY FLAT SLAB VERIFICATION Chapter 3
79
1/Kec = (1/Kt + 1/Kc) Kec = 1/[1/131+ 1/(384+ 363)] = 111 (F8, Table 3.2.1-1)
ADAPT Reference Number
Second column: Lower column stiffness Kc 384 F3* Upper column stiffness Kc 363 F4 Torsional stiffness Kt 131 F6 Equivalent column stiffness Kec 111 F8 Interior slab: Slab stiffness Ks 73 F10 Carry over 0.50 F11/F10
* Reference numbers preceded by "F" refer to report from ADAPT-PT's data files which are generated with the solution. Consider the interior slab: ADAPT employs the formulation given in ACI-318 (commentary 13.7.3) to arrive at the stiffness and carry over factors. Refer to ADAPT manual chapter on theory for additional details. The stiffness coefficients for the three spans are marked as K11 through K22 in Table 3.2.1-1. For the second span the carry over factor is: Carry over = 36.62/73.23 = 0.50 (F11/F10, Table 3.2.1-1)
3.3.1.8 Dead and Live Load Moments (Data Block 5)
Data block 5 list the centerline elastic moments and reactions due to dead load and live load. Centerline moments for the interior span are listed in the following table:
Span Left Midspan Right Reference Number
Second Span Dead load k-ft (kNm)
-94.13 (-127.62)
55.87 (75.75)
-94.13 (-127.62)
B5.1, C3-5
Live load k-ft (kNm)
-31.14 (-42.22)
19.79 (26.83)
-31.14 (-42.22)
B5.3, C2-7
Post tensioning k-ft (kNm)
44.02 (59.68)
-23.15 (-31.39)
44.02 (59.68)

TWO-WAY FLAT SLAB VERIFICATION Chapter 3
80
* The value of post-tensioning is read from a data file in ADAPT-PT computer run (PTBMSF.DAT) which is not reproduced here.
3.3.1.9 Reduction of Moments to the Face-of-Support
ADAPT-PT calculates the face-of-support moments from the equations of statics.
For the purposes of clarification and verification of results consider the dead load moment at right of the second support:
Centerline moment/bay
= -94.13 k-ft (-127.62 kNm) (B5, C3)
Shear V = 24.00 k (106.76 kN) (B5, C5) Support width c = 20/12 = 1.67 ft (B2.2, C2) Loading w = 0.096 k/ft2 (4.60 kN/m2) (B3.1, C4)
Moment at face-of-support:
M = -94.13 + 24*1.67/2 - 0.5*(0.096*20)*(1.67/2) = -74.89 k-ft (-101.54 kNm) (B6.1, C3 M = -74.79
OK) Moments at the face-of-support and at midspan for the interior span are listed in the following table for comparison. ADAPT Reference
Number Right face of second support
Dead and live moments, k-ft (kNm)
-(74.79+25.04)/20 = -4.99 (-6.77) (B 6.1,6.2,C2)
Post tensioning moment 35.36/20 = 1.77 (2.40) (B 7.6, C2) Net moments -3.22 (-4.37)
Midspan moment Dead and live moments (55.88+19.79)/20 = 3.78 (5.12) (B 6.1,6.2, C4) Post-tensioning moment -23.15/20 = -1.16 (-1.57) (B7.6, C3) Net moments 2.62 (3.55) Sum of + and - moments 5.84 (7.92) Regarding the sum of positive and negative moments for the interior span (ADAPT 5.84 k-ft) observe that these should be equal to the static moment of

TWO-WAY FLAT SLAB VERIFICATION Chapter 3
81
the clear span (Mo). This is reiterated in ACI-318 (13.6.2), where the sum of moments is expressed by Equation 13-3 reproduced below:
Mo = Wu * L2* Ln
2/8
where,
Wu = 0.096 +0.029 –0.860/20 = 0.082 k/ft2 (3.93 kN/m2) L2 = 1 ft (as moments computed are per foot) Ln = 25 - 20/12 = 23.33 ft (7.11 m)
hence,
Mo = 0.082*1*23.332/8 = 5.58 k-ft/ft (7.57 kNm/m) (ADAPT 5.84 OK)
3.3.1.10 Stresses (Data Block 7.5)
Data block 7.5 lists the service stresses at top and bottom for supports and mid span. The post-tensioning is determined, such as to keep the stresses below allowable values. Total Load Combination: Stress Limits for allowable values Top Tension = 6*√4000 = 380 psi (2.62 MPa) (ADAPT B1) Bottom Tension = 6*√4000 = 380 psi (2.62 MPa) Compression (for service)
= 0.45 * 4000 = -1800 psi (-12.41 MPa)
Consider the right face of second support:
Stresses:
σ = (MD+ML+MPT)/S + (P/A) S = I/Yc Where MD,ML,MPT are the moments across the entire tributary of the design strip. S is the section modulus; A is the area; I is the moment of inertia of the section; and Yc is the distance of the centroid of the section to farthest tension fiber of the section.
A = 1560 in2 (1.01e6 mm2) (ADAPT B4.1, C2) I = 0.55E+04 in4 (2.29e9 mm4) (ADAPT B4.1, C3) Yb = 3.25 in (83 mm) (ADAPT B4.1, C4)

TWO-WAY FLAT SLAB VERIFICATION Chapter 3
82
Yt = 3.25 in (83 mm) (ADAPT B4.1, C5)
Sbottom = Stop = (0.55E+04)/ 3.25 =1690.15 in3 (2.77e7 mm2) P = 201.5 k/- (896.31kN) (ADAPT B7.2, C2) MD = -74.79 k-ft (-101.40 kNm) (ADAPT B6.1, C3) ML = -25.04 k-ft (-33.95 kNm) (ADAPT B6.2, C2) MPT = 35.36 k-ft (47.94 kNm) (ADAPT B7.6, C2)
MD+ML+MPT = -74.79 + -25.04 + 35.36 = -64.47 k-ft (-87.41 kN) P/A = -201.5*1000/ 1560 = -129.17 psi (-0.89 MPa)
Top fiber: σ = (64.47*12000)/1690.15- (129.17) = 328.56 psi (2.27 MPa) < 380 psi (2.62MPa) (ADAPT 328.63, B7.5-Envelope of
Service 2, C2, OK)
Bottom fiber:
σ = (-64.47*12000)/1690.15- (129.17) = -586.90 psi (-4.05 MPa) <-1800 psi (-12.41 MPa) (ADAPT –586.96, B7.5-Envelope of Service 2, C5, OK)
Calculations for all other points are carried out in the same way and printed in ADAPT-PT Block 7.5. Stresses for sustained load combinations are reported in the table under “Envelope of Service 1” of the Block 7.5. Stress calculations at 1/20th points are reported in STRESSES. DAT file in the subdirectory, where data was executed.
3.3.1.11 Secondary Moments (Data Block 8.3)
There are two ways for calculating the secondary moments. ADAPT-PT uses the direct method derived from the definition of secondary actions. The subject matter slab together with the secondary actions computed at the supports is shown in Fig. 3.3-1. The secondary actions, which represent the reactions at supports due to post-tensioning, are taken from data block 7.6 of ADAPT-PT output. The secondary moments in the slab are moments induced by the secondary actions at the supports.
The secondary shears and moments at the supports must be in self-equilibrium since the applied loading, namely the post-tensioning forces, form a self-equilibrating system.

TWO-WAY FLAT SLAB VERIFICATION Chapter 3
83
Sum of secondary reactions:
0.076 - 0.076 - 0.077 + 0.077 = 0 k
(zero, OK)
FIGURE 3.3-1
Check the validity of the solution for static equilibrium:
ΣVertical Forces = 0.076 – 0.076 - 0.077+0.077 = 0 OK
ΣMoments about Support #1
= 3.553+ 3.359 + 1.143 + 1.081 – 1.143 –1.080 – 3.553 – 3.359 +0.076*17 +0.077* 42-0.077*59
= -0.016 k-ft (approx. = 0, OK)
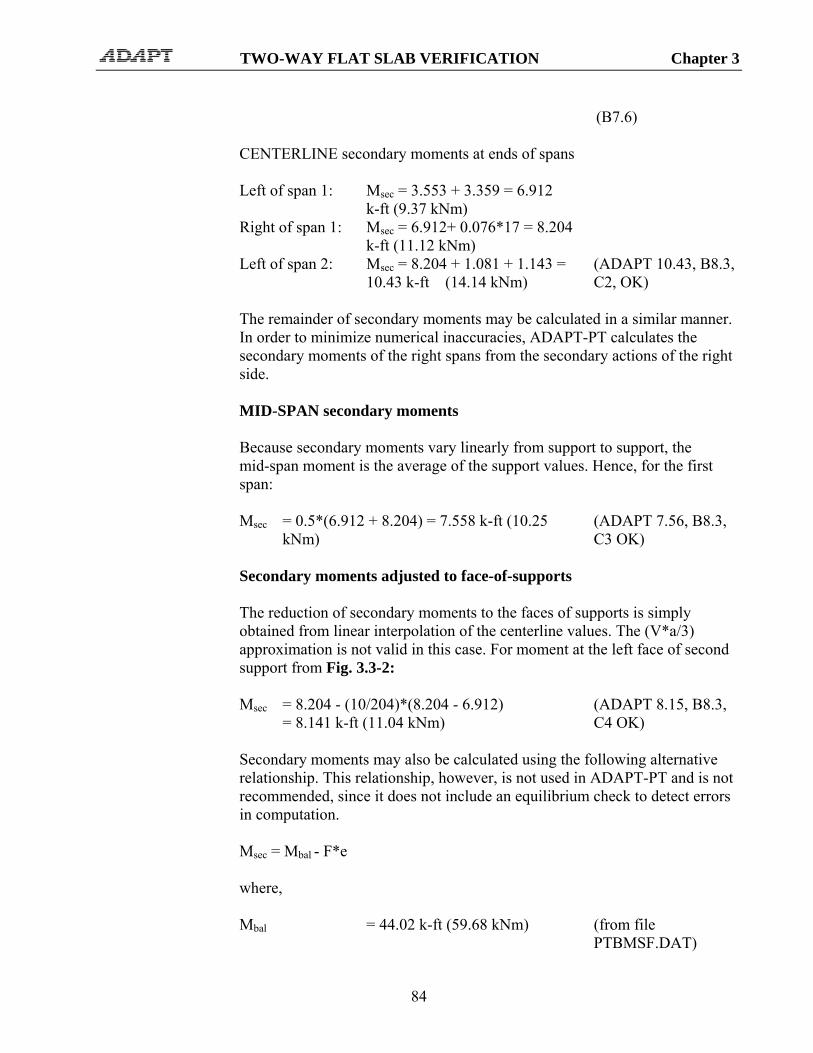
TWO-WAY FLAT SLAB VERIFICATION Chapter 3
84
(B7.6)
CENTERLINE secondary moments at ends of spans Left of span 1: Msec = 3.553 + 3.359 = 6.912
k-ft (9.37 kNm)
Right of span 1: Msec = 6.912+ 0.076*17 = 8.204 k-ft (11.12 kNm)
Left of span 2: Msec = 8.204 + 1.081 + 1.143 = 10.43 k-ft (14.14 kNm)
(ADAPT 10.43, B8.3, C2, OK)
The remainder of secondary moments may be calculated in a similar manner. In order to minimize numerical inaccuracies, ADAPT-PT calculates the secondary moments of the right spans from the secondary actions of the right side. MID-SPAN secondary moments Because secondary moments vary linearly from support to support, the mid-span moment is the average of the support values. Hence, for the first span:
Msec = 0.5*(6.912 + 8.204) = 7.558 k-ft (10.25
kNm) (ADAPT 7.56, B8.3, C3 OK)
Secondary moments adjusted to face-of-supports The reduction of secondary moments to the faces of supports is simply obtained from linear interpolation of the centerline values. The (V*a/3) approximation is not valid in this case. For moment at the left face of second support from Fig. 3.3-2:
Msec = 8.204 - (10/204)*(8.204 - 6.912)
= 8.141 k-ft (11.04 kNm) (ADAPT 8.15, B8.3, C4 OK)
Secondary moments may also be calculated using the following alternative relationship. This relationship, however, is not used in ADAPT-PT and is not recommended, since it does not include an equilibrium check to detect errors in computation. Msec = Mbal - F*e where, Mbal = 44.02 k-ft (59.68 kNm) (from file
PTBMSF.DAT)
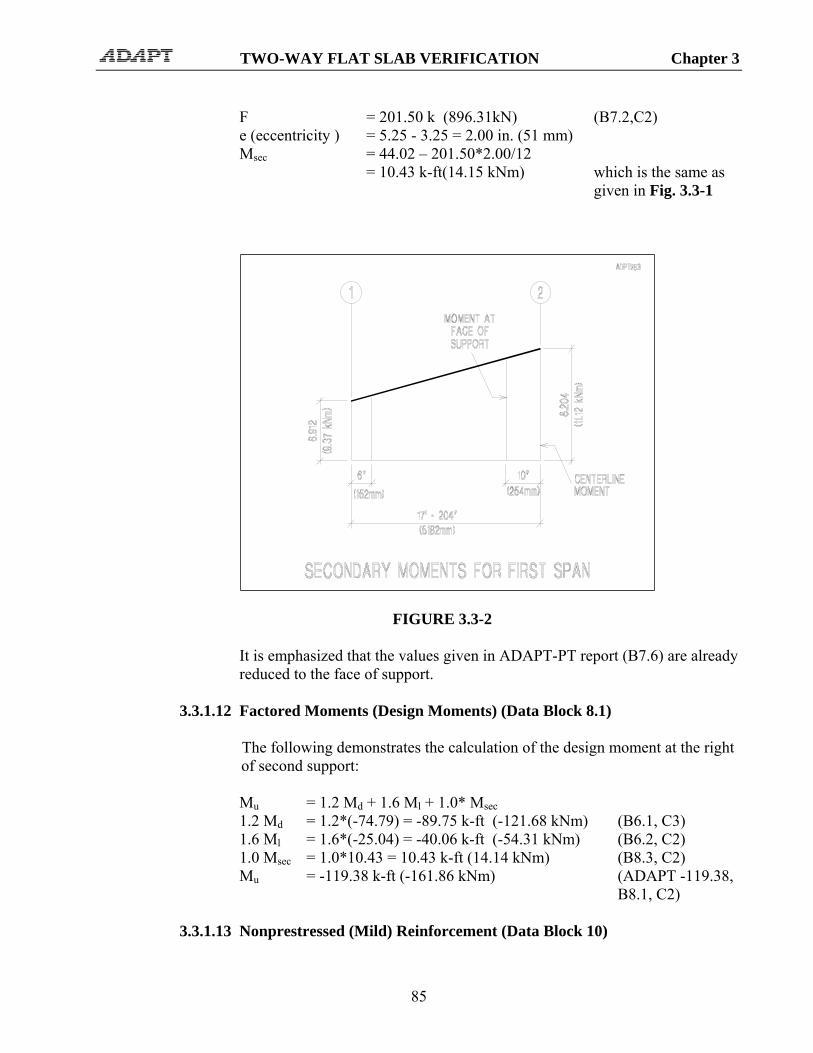
TWO-WAY FLAT SLAB VERIFICATION Chapter 3
85
F = 201.50 k (896.31kN) (B7.2,C2) e (eccentricity ) = 5.25 - 3.25 = 2.00 in. (51 mm) Msec = 44.02 – 201.50*2.00/12 = 10.43 k-ft(14.15 kNm)
which is the same as given in Fig. 3.3-1
FIGURE 3.3-2
It is emphasized that the values given in ADAPT-PT report (B7.6) are already reduced to the face of support.
3.3.1.12 Factored Moments (Design Moments) (Data Block 8.1)
The following demonstrates the calculation of the design moment at the right of second support: Mu = 1.2 Md + 1.6 Ml + 1.0* Msec 1.2 Md = 1.2*(-74.79) = -89.75 k-ft (-121.68 kNm) (B6.1, C3) 1.6 Ml = 1.6*(-25.04) = -40.06 k-ft (-54.31 kNm) (B6.2, C2) 1.0 Msec = 1.0*10.43 = 10.43 k-ft (14.14 kNm) (B8.3, C2) Mu = -119.38 k-ft (-161.86 kNm) (ADAPT -119.38,
B8.1, C2)
3.3.1.13 Nonprestressed (Mild) Reinforcement (Data Block 10)

TWO-WAY FLAT SLAB VERIFICATION Chapter 3
86
In this section the mild reinforcement calculations of ADAPT-PT are verified for selected points along the slab for the condition of no redistribution. The following aspects of the nonprestressed reinforcement calculations are verified:
• Minimum rebar over the supports • Rebar to meet the ultimate strength requirements • Reinforcement for tensile block
In the following calculations data describing the tendon profile was read off from the data block 21, Tendon Heights, detailed report. It is also available from ADAPT-PT data file called PTCGS.DAT. The file contains a detailed description of the tendon shape at various points along the span.
(i) Minimum Rebar at Supports
Consider the right face of second support. The minimum rebar is determined from the following expression:
Amin = 0.00075*h*L where, h = slab thickness (6.5 in.) L = length of slab in direction of rebar = 0.5(17 + 25)*12 = 252 in. (6401 mm) (For second column) = length of the in the transverse direction
= 20*12 = 240 in (6096 mm)
L = 252 in (6401 mm) hence, Amin = 0.00075*6.5*252 = 1.23 in.2 (792 mm2) (ADAPT 1.23, B10.1.1, C7 OK)
(ii) Ultimate Strength Requirement
Consider the right face of second support: Mu = -119.38 k-ft (-161.86 kNm) (B8.1,C2) b (width) = 20*12 = 240 in. (6096 mm) h (height) = 6.5 in. (165 mm) Cover at top = 1.00 in. (25 mm) (B1) Top bar dia. = 0.625 in. (16 mm) (#5 bar)

TWO-WAY FLAT SLAB VERIFICATION Chapter 3
87
dr = dt = 6.5 - (1.00 + 0.625/2) = 5.19 in. (132 mm)
(B9.3,C1)
PT = 201.50 k (896.31kN) (B9.3,C1) dp = 4.75 in. (121 mm) (PTCGS.DAT) fse = 175 ksi (1206.59 MPa) (B1, PTI 34) Span = 25 ft (7.62 m) Rebar area = 1.95 in2(1258 mm2) (B10.1.1,C6) fy = 60 ksi (413.69 MPa) (B1) Calculate design stress in tendon (fps): Span-to-depth ratio = 25*12/6.5 = 46.1 > 35 hence, use ACI Equation (18-5): fps = fse + 10000 + (f'c/300*ρp) where,
f'c = 4000 psi (27.58 MPa) (B1) ρp = ratio of prestressed reinforcement = Aps/b*dp Aps = 201.50/175 = 1.15 in2 (742 mm2) ρp = 1.15/(240*4.75) = 0.00101 fps = 175000 + 10000 +
(4000/300*0.00101)
= 198201 psi (1366.56 MPa) fps = 198201 < (175 + 30) = 205 ksi
(1413.43 MPa) (OK)
Tension (T) = PT + rebar = 1.15*198 + 1.95*60 = 227.93 + 117.0 = 344.93 k (1534.32 kN) a = Depth of compression zone = T/0.85*b*f’c) = 344.93 /(0.85*240*4) = 0.42 in. (11
mm)
c = 0.42/0.85 = 0.49 in. (13 mm) c/dt = 0.49/5.19 = 0.09 < 0.375, hence φ =
0.90
φMu = 0.9*[227.93 (4.75 - 0.42/2) + 117.0*(5.19 - 0. 42/2)]/12
= 121.31 k-ft (164.47 kNm) (B8.1,C2 OK)

TWO-WAY FLAT SLAB VERIFICATION Chapter 3
88
(iii)Tensile Block Reinforcement By requirements of ACI 318-83 Section 18.9, when the tensile stress in the span exceeds 2*(f'c)1/2, the entire tensile force must be resisted by mild reinforcing at a stress of fy/2. Consider mid-point of interior span: Tensile stress = 243.73 psi (1.68 MPa) (B7.5, Env of
Service-2 , C8) 2*(f'C)1/2 = 126 psi, hence rebar required Compression stress depth
= -502.06 psi (-3.46 MPa)
of tensile zone = 6.5*[243.73/(243.73 + 502.06)] = 2.12 in. (54 mm) Tension Nc = 0.244*2.12*240/2 = 62.07 k (276.10 kN) for the
tributary
As = 62.07/(0.5*60) = 2.07 in2 (1335 mm2) (ADAPT 2.07;
B 10.1.1; C7)
3.3.1.14 Punching Shear Capacity (Data Block 13) The punching shear calculations for the second column are verified. Note that the total shear and moments listed in data block 13.2 of ADAPT-PT output for shear check are factored as follows:
1.2D + 1.6L + Secondary effects
Additional details for the calculations of punching shear parameters are given in Section 5.9.
Vu = 76.31 kips (339.44 kN) (B13.2, C4) Mu = 27.02 kip-ft (36.63 kNm) (B13.2, C5)
Section Properties: c1 = 20 in (508 mm) c2 = 14 in (356 mm) h = 6.5 in (165 mm) Dia .of bar = 0.625 in (#5 bar) (16mm) Cover = 1.0 in (25 mm) dr = 6.5- 1.0- 0.625 =4.88 in (124 mm)
(B13.1, C5)

TWO-WAY FLAT SLAB VERIFICATION Chapter 3
89
c1+ d = 20 + 4.88= 24.88 in (632 mm) (B13.1, C6) c2 +d = 14 + 4.88= 18.88 in (480 mm) (B13.1, C7) Ac = 2d(c1 + c2 + 2d))= 2*4.88 * (20+ 14+ 2*4.88) = 427.10 in2 (2.76e5 mm2) Jc = (c1+ d)*d3/6+ (c1 + d) 3*d/6 +d* (c2 + d)*(c1+ d) 2 /2 = 24.88*4.883/6 +24.883*4.88/6+4.88*18.88* 24.88 2 /2 = 41524 in4 (1.73e10 mm4) γ V = 1- {1/[1+ (2/3) * ((c1 +d) / (c2 +d)) ½]} = 1- {1/[1+ (2/3) * (24.88 / 18.88) ½]} = 0.433
Stress due to direct shear:
Vu / Ac = 76.31 / 427.10 = 0.179 ksi (1.23 MPa) (ADAPT 0.18, B13.2, C6
OK)
Stress due to bending:
M stress = (γ V * Mu * (c1+ d))/ (2* Jc) = (0.433 * 27.02 * 12 * 24.88)/
2*41524
= 0.042 ksi (0.29 MPa) (ADAPT 0.042, B13.2, C7, OK)
Total Stress
= Stress due to shear + stress due to bending
= 0.179 + 0.042 = 0.221 ksi (1.52 MPa) (ADAPT 0.221,
B13.2, C8, OK)
Allowable stress (from ACI-318 equation 11.36):
φ vc = φ *[( βp* √ f ‘c + 0.3 * fpc ) + Vp]
where,
φ = 0.75 βp is the smaller of 3.5 or (( αs* d/ b0 )+
1.5)
αs = 40 for interior column b0 = Perimeter of the critical section = 2 * (24.88 + 18.88) = 87.52 in (2223
mm)
d = 4.88 in (124 mm) βp = (( αs* d/ b0 )+ 1.5) = (( 40* 4.88 /
87.52 )+ 1.5)

TWO-WAY FLAT SLAB VERIFICATION Chapter 3
90
= 3.73 >3.50, ∴use 3.50 fpc = P/A = 129.17 psi (0.89 MPa) (B7.2, C7 ) φ vc = 0.75 *( 3.5* √ 4000 + 0.3 *129.17 ) = 195.08 psi (1.35 MPa) ∴Allowable Stress = 0.195 ksi (1.35 MPa) (ADAPT 0.195,
B13.2, C9, OK)
Note that in the evaluation of allowable stresses, the term corresponding to the vertical component of tendon force (Vp) is conservatively disregarded.
Stress ratio: Stress Ratio = Actual/Allowable = 0.221/0.195 = 1.13 (ADAPT 1.13, B13.2, C10,
OK) ∴ Punching shear stress exceeds the allowable stress. Provide shear reinforcement. Check Maximum Shear stress: φ vn ≤ φ8*√f’c φ6*√f’c = 0.75*8*√4000/1000 = 0.285 ksi > 0.221 ksi OK Shear Reinforcement Design:
u c 0
y
(v v )b sAv f sin− ϕ
=ϕ α
c cv 2 f 'φ = φ = 0.75* 2√ 4000 /1000 = 0.095 ksi
v(0.221 0.095)87.52 4.88 / 2A
0.75 60− ×
=×
= 0.60 in2
(ADAPT 0.60, B30-Column 2, C12, OK)
Assume #5 stirrups, area of 1leg = 0.31 in2 Number of legs, Nlegs = 0.60 / 0.31 = 2 Distance between the legs = b0 / Nlegs
= 87.52/2 = 43.76 in > smax =2d = 9.76 in ∴ Distance between the legs = 9.76 in ≈ 9.75 in (ADAPT 9.75, B30-Column 2, C14, OK)

TWO-WAY FLAT SLAB VERIFICATION Chapter 3
91
∴Number of legs, Nlegs = 87.52 / 9.75 = 8.98 ≈ 9
(ADAPT 9, B30-Column 2, C13, OK) Since the stress exceeded at this location check the next critical location at d from the face of support.
3.3.1.15 Deflections (Data Block 14)
Herein the mid-span deflection of the central span is verified. Detailed deflection calculation is given in chapter 5-specific Verification of this volume. Fig. 3.3-3 shows the bending moment diagram of the central span due to dead loading per foot of tributary. The values are from B5.1, C3-5. For example, the support moment is 94.13/20 = 4.71 k-ft. The static moment from ADAPT-PT is (94.13+55.87)/20 = 7.5 k-ft. Check:
Static moment = wL2/8 = 0.096*252/8 = 7.5 k-ft
(10.17 kNm) (OK)
Moment of inertia = 5500/20 = 275 in4 (1.14e8 mm4) (B4, C3) Concrete’s modulus of elasticity
= 3605 ksi (24856 MPa) (B1)
Using the Moment-Area method of deflection calculation, the deflection at mid-span is given as the moment of the bending moment diagram between mid-span and the support taken about the support line and divided by E*I. Refer to the lower part of Fig. 3.3-3, where the applicable bending moment diagrams are shown separately for clarity.
Dead load deflection
= [-4.71*12*150*75 + 7.5*12*(150*2/3) * (150*5/8)]/(275*3605)
= 0.21 in. (5 mm) (ADAPT 0.21, B14,C3&4 OK)
By proration, the live load and post-tensioning deflections can be verified as follows:
Live load deflection = (0.029/0.096)*0.21 = 0.06 in. (2 mm) (ADAPT 0.06, B14,C6)
Deflection due to dead load plus post-tensioning
Net loading = 0.096 – (0.860/20) = 0.053 k/ft2 (B7.2,C8) = (0.053/0.096)*0.21

TWO-WAY FLAT SLAB VERIFICATION Chapter 3
92
= 0.12 in. (3 mm) (ADAPT 0.13, B14,C4) Note that the deflection due to post-tensioning is approximated in the verification. The distribution of balanced loading is not uniform and the proration employed in the verification on the basis of uniform distribution is not strictly accurate. Creep factor = 2 Long-term deflection
= [0.13*(1 + 2)+0.06]
= 0.45 in. (11 mm) (ADAPT 0.44, B14, C8) Span/long-term deflection
= (25*12/0.45) = 667 (B14,C8)
The slight differences between the hand calculated and ADAPT-PT computed ratios lies in the round off error in printed values of deflections.

TWO-WAY FLAT SLAB VERIFICATION Chapter 3
93
FIGURE 3.3-3
3.3.2 Verification of SI Report
The SI version is verified by way of comparing its output with the American version. Table 3.3-1 lists the critical values of the two-way slab for both the American and the SI system of units. Good agreement between the two versions is observed.

TWO-WAY FLAT SLAB VERIFICATION Chapter 3
94
TABLE 3.3-1 COMPARISON BETWEEN THE METRIC AND AMERICAN OUTPUTS OF ADAPT FOR PTI TWO-WAY SLAB EXAMPLE (PTI02M)
SI output
[kN,m] [k,ft] American
output [k,ft]
Reference number
DL Moment Span 34.45 25.41 25.46 B5.1, C4 DL Moment Support -103.36 -76.23 -76.47 B5.1, C5 DL Moment Reduced -81.56 -60.16 -60.34 B6.1, C5 LL Moment Span 19.53 14.40 14.45 B5.3, C4 LL Moment Support -35.30 -26.04 -26.11 B5.3, C6 LL Moment Reduced -27.65 -20.39 -20.45 B6.2, C6 Required PT Span 473.59 106.47 108.32 B7.4, C3 Required PT Support 769.38 172.96 174.56 B7.4, C4 Stress Bottom at Center 1.68 243.67 243.73 B7.5-2, C8 Stress Top at Center -3.46 -501.84 -502.06 B7.5-2, C7 Secondary Moments 10.23 7.55 7.56 B8.3, C3 Rebar - Bottom 1328 2.06 2.07 B10.1.1, C5 Rebar - Top 1250 1.94 1.95 B10.1.1, C5 Deflection LL 1.5 0.06 0.06 B14, C6 Punching Shear ratio 1.13 1.13 1.13 B13.2, C10

95
96
Chapter 4
CAST-IN-PLACE T-BEAM VERIFICATION

97
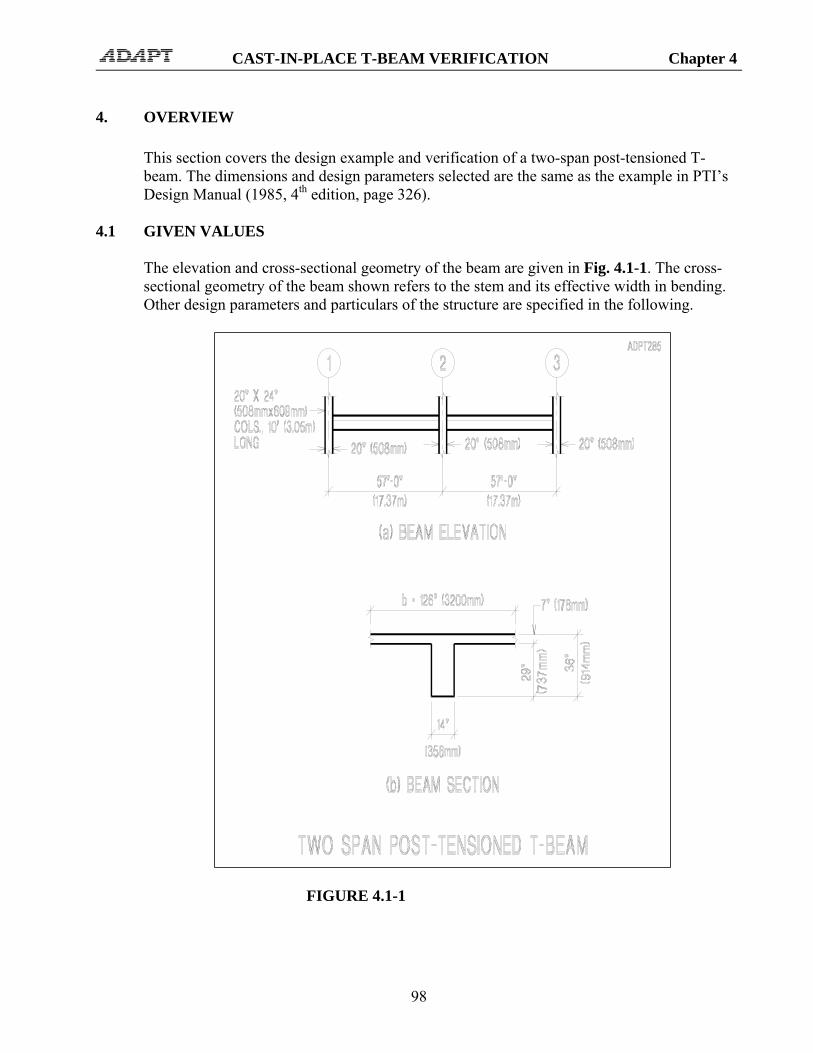
CAST-IN-PLACE T-BEAM VERIFICATION Chapter 4
98
4. OVERVIEW
This section covers the design example and verification of a two-span post-tensioned T-beam. The dimensions and design parameters selected are the same as the example in PTI’s Design Manual (1985, 4th edition, page 326).
4.1 GIVEN VALUES
The elevation and cross-sectional geometry of the beam are given in Fig. 4.1-1. The cross-sectional geometry of the beam shown refers to the stem and its effective width in bending. Other design parameters and particulars of the structure are specified in the following.
FIGURE 4.1-1

CAST-IN-PLACE T-BEAM VERIFICATION Chapter 4
99
4.1.1 Structural System
The structural system consists of Two-span cast-in-place T-Beam supported by columns.
4.1.2 Design Code
The design is based on ACI 318-05.
4.1.3 Material Properties
(i) Concrete
Compressive cylinder strength, f’c = 5000 psi (34 MPa) Weight = 150 pcf (2403 kg/m3) Modulus of elasticity = 4030 ksi (20.68 MPa) Compressive cylinder strength at stressing, f’c
= 3000 psi (20.68 MPa)
(ii) Post-Tensioning
Material: Low relaxation, seven wire strand Strand diameter = ½ in Strand area = 0.153 in2 (99 mm2) Modulus of elasticity = 28000 ksi (193054 MPa) Ultimate strength of strand, fpu = 270 ksi (1862 MPa) Average effective stress (fse) = 175 ksi (1206 MPa) System: System unbonded Stressing: Ratio of jacking stress to strand’s ultimate strength
= 0.8
Anchor set = 0.25 in (6.35 mm) Coefficient of angular friction, μ = 0.07 /radian Coefficient of wobble friction, K = 0.0014 rad/ft (0.0046 rad/m) Stress on day 3 Minimum concrete cylinder strength at stressing
= 1832 psi (12.63 MPa)

CAST-IN-PLACE T-BEAM VERIFICATION Chapter 4
100
(iii) Nonprestressed Reinforcement
Yield stress fy = 60 ksi (413.69 MPa) Modulus of elasticity = 29000 ksi (199,949 MPa)
(iv) Design Loading
Dead load = 2.777 k/ft (40.53 kN/m) Live load = 0.807 k/ft (11.78 kN/m)
4.1.4 Load Cases and Combinations
(i) Strength Load Combinations
The strength requirement for each member is established using the following factored load combinations: Primary load combination 1.2*DL + 1.6*LL + 1*HYP
Other load combination 1.4*DL + 1*HYP Where “HYP” is the secondary (hyperstatic) moments, shears and reactions due to post-tensioning.
(ii) Serviceability Load Combinations
Final stresses: The design is selected to be carried out according to the “Transitional” (T) state of stress of the code. That is to say, the maximum hypothetical tensile stresses will be allowed to exceed 6 √f’c but be retained less than 12 √f’c A hypothetical tensile stress equal to 9 * √f’c is set as design target.
Tensile stress (top and bottom) = 9√f’c = 569.21 psi (3.92 MPa) Compressive stress
For sustained load condition = 0.45f’c = 1800 psi (12.41 MPa) For total load condition = 0.60 * f’c = 2400 psi (16.55 MPa)
Load combinations for serviceability check:
Total load condition 1*DL + 1*LL + 1*PT
CAST-IN-PLACE T-BEAM VERIFICATION Chapter 4
101
Sustained load condition 1*DL + 0.3*LL + 1*PT
The factors for neither of the above load combinations are spelled out in the code. Their selection is based on common practice.
Initial stresses (transfer):
Maximum tension = 3 √f’ci Maximum compression = 0.60 * f’ci
Where f’ci = 0.75f’c is the concrete cylinder strength at time of stressing. Load Combinations for Stress Check at transfer of prestressing: U = 1.00 DL + 1.15* PT
4.1.5 Deflections
Having maintained the hypothetical tensile stresses within the limits stated in the preceding, the deflections would be calculated assuming gross cross-sectional properties. Long-term deflections are estimated using a creep coefficient of 2. For the floor slabs the maximum deflections are maintained below the following value with the understanding that the floor structure is not attached to nonstructural elements likely to be damaged by large deflections of the floor: Slabs:
Live load deflection ≤ span/360
4.1.6 Cover
(i) Nonprestressed Reinforcement
Cover to top bars = 2 in (51 mm) Cover to bottom bars = 2 in (51 mm)
(ii) Prestressed Reinforcement
Top cover = 4 in all spans (102 mm) Bottom cover
Interior spans = 3 in (76 mm) Exterior spans = 3 in (76 mm)
4.1.7 Tendon Profile

CAST-IN-PLACE T-BEAM VERIFICATION Chapter 4
102
Reversed parabola with low point at center for both spans. Inflection points at 0.083L from central support.
4.2 COMPUTED VALUES
The computed values are obtained from ADAPT-PT version 2010. The relevant parts of the tabular report are summarized below.
4.2.1 Computer Report for American Units
Cast-in-Place T-Beam
Tuesday, March 30, 2010

CAST-IN-PLACE T-BEAM VERIFICATION Chapter 4
103
TABLE OF CONTENT: Tabular Reports - Compact 1 - User Specified General Analysis and Design Parameters 2 - Input Geometry 2.1 - Principal Span Data of Uniform Spans 2.7 - Support Width and Column Data 3 - Input Applied Loading 3.1 - Loading As Appears in User's Input Screen 4 - Calculated Section Properties 4.1 - Section Properties of Uniform Spans and Cantilevers 5 - Moments, Shears and Reactions 5.1 - Span Moments and Shears (Excluding Live Load) 5.2 - Reactions and Column Moments (Excluding Live Load) 5.3 - Span Moments and Shears (Live Load) 5.4 - Reactions and Column Moments (Live Load) 6 - Moments Reduced to Face of Support 6.1 - Reduced Moments at Face of Support (Excluding Live Load) 6.2 - Reduced Moments at Face of Support (Live Load) 7 - Selected Post-Tensioning Forces and Tendon Profiles 7.1 - Tendon Profile 7.2 - Selected Post-Tensioning Forces and Tendon Drape 7.4 - Required Minimum Post-Tensioning Forces 7.5 - Service Stresses 7.6 - Post-Tensioning Balance Moments, Shears and Reactions 8 - Factored Moments and Reactions Envelope 8.1 - Factored Design Moments (Not Redistributed) 8.2 - Reactions and Column Moments 8.3 - Secondary Moments 10 - Mild Steel (No Redistribution) 10.1 - Required Rebar 10.1.1 - Total Strip Required Rebar 12 - Shear Reinforcement 12.1 - Shear Calculation Envelope 14 - Deflections 14.1 - Maximum Span Deflections Legend
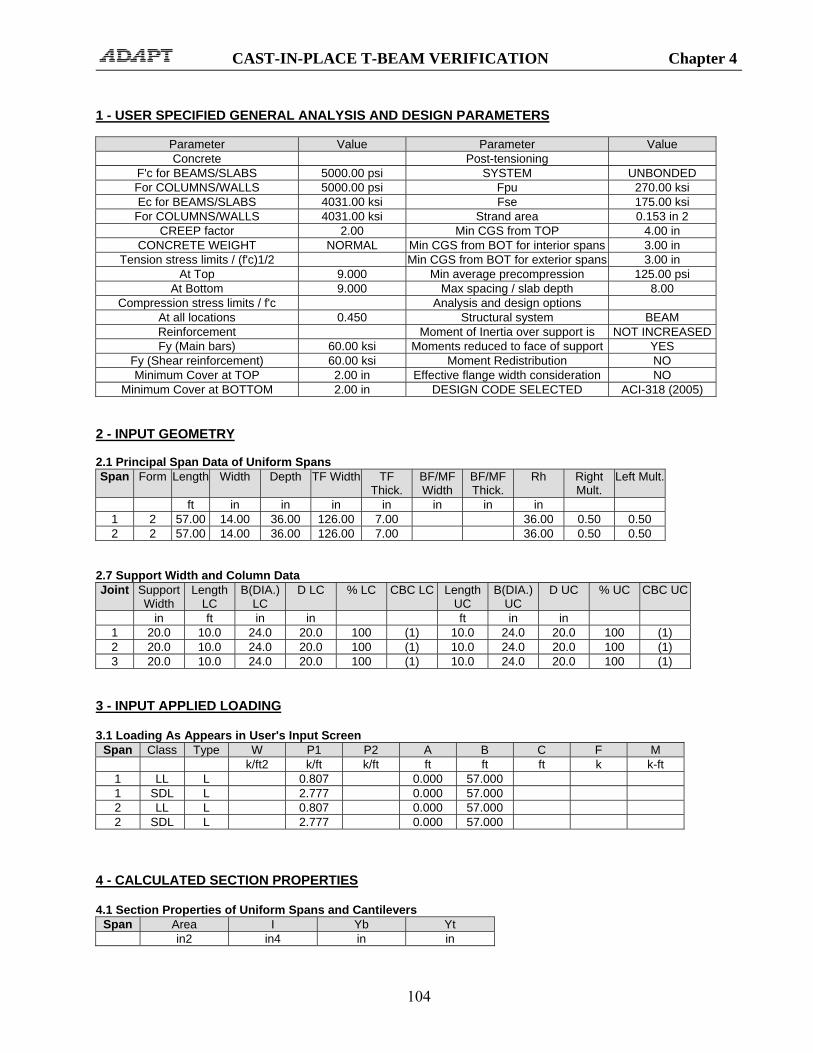
CAST-IN-PLACE T-BEAM VERIFICATION Chapter 4
104
1 - USER SPECIFIED GENERAL ANALYSIS AND DESIGN PARAMETERS
Parameter Value Parameter Value Concrete Post-tensioning
F'c for BEAMS/SLABS 5000.00 psi SYSTEM UNBONDED For COLUMNS/WALLS 5000.00 psi Fpu 270.00 ksi Ec for BEAMS/SLABS 4031.00 ksi Fse 175.00 ksi
For COLUMNS/WALLS 4031.00 ksi Strand area 0.153 in 2 CREEP factor 2.00 Min CGS from TOP 4.00 in
CONCRETE WEIGHT NORMAL Min CGS from BOT for interior spans 3.00 in Tension stress limits / (f'c)1/2 Min CGS from BOT for exterior spans 3.00 in
At Top 9.000 Min average precompression 125.00 psi At Bottom 9.000 Max spacing / slab depth 8.00
Compression stress limits / f'c Analysis and design options At all locations 0.450 Structural system BEAM Reinforcement Moment of Inertia over support is NOT INCREASEDFy (Main bars) 60.00 ksi Moments reduced to face of support YES
Fy (Shear reinforcement) 60.00 ksi Moment Redistribution NO Minimum Cover at TOP 2.00 in Effective flange width consideration NO
Minimum Cover at BOTTOM 2.00 in DESIGN CODE SELECTED ACI-318 (2005) 2 - INPUT GEOMETRY 2.1 Principal Span Data of Uniform Spans Span Form Length Width Depth TF Width TF
Thick. BF/MF Width
BF/MF Thick.
Rh Right Mult.
Left Mult.
ft in in in in in in in 1 2 57.00 14.00 36.00 126.00 7.00 36.00 0.50 0.50 2 2 57.00 14.00 36.00 126.00 7.00 36.00 0.50 0.50
2.7 Support Width and Column Data Joint Support
Width Length
LC B(DIA.)
LC D LC % LC CBC LC Length
UC B(DIA.)
UC D UC % UC CBC UC
in ft in in ft in in 1 20.0 10.0 24.0 20.0 100 (1) 10.0 24.0 20.0 100 (1) 2 20.0 10.0 24.0 20.0 100 (1) 10.0 24.0 20.0 100 (1) 3 20.0 10.0 24.0 20.0 100 (1) 10.0 24.0 20.0 100 (1)
3 - INPUT APPLIED LOADING 3.1 Loading As Appears in User's Input Screen
Span Class Type W P1 P2 A B C F M k/ft2 k/ft k/ft ft ft ft k k-ft
1 LL L 0.807 0.000 57.000 1 SDL L 2.777 0.000 57.000 2 LL L 0.807 0.000 57.000 2 SDL L 2.777 0.000 57.000
4 - CALCULATED SECTION PROPERTIES 4.1 Section Properties of Uniform Spans and Cantilevers
Span Area I Yb Yt in2 in4 in in

CAST-IN-PLACE T-BEAM VERIFICATION Chapter 4
105
1 1288.00 0.12E+06 26.83 9.17 2 1288.00 0.12E+06 26.83 9.17
5 - MOMENTS, SHEARS AND REACTIONS 5.1 Span Moments and Shears (Excluding Live Load)
Span Load Case Moment Left
Moment Midspan
Moment Right
Shear Left
Shear Right
k-ft k-ft k-ft k k 1 SW 0.00 0.00 0.00 0.00 0.00 2 SW 0.00 0.00 0.00 0.00 0.00 1 SDL -450.06 451.72 -902.11 -71.21 87.08 2 SDL -902.11 451.72 -450.07 -87.08 71.21
5.2 Reactions and Column Moments (Excluding Live Load)
Joint Load Case Reaction Moment Lower Column
Moment Upper Column
k k-ft k-ft 1 SW 0.00 0.00 0.00 2 SW 0.00 0.00 0.00 3 SW 0.00 0.00 0.00 1 SDL 71.21 -225.03 -225.03 2 SDL 174.15 0.00 0.00 3 SDL 71.21 225.03 225.03
5.3 Span Moments and Shears (Live Load)
Span Moment Left Max
Moment Left Min
Moment Midspan
Max
Moment Midspan Min
Moment Right Max
Moment Right Min
Shear Left
Shear Right
k-ft k-ft k-ft k-ft k-ft k-ft k k 1 -130.79 -130.79 131.27 131.27 -262.15 -262.15 -20.69 25.30 2 -262.15 -262.15 131.27 131.27 -130.79 -130.79 -25.30 20.69
5.4 Reactions and Column Moments (Live Load)
Joint Reaction Max
Reaction Min
Moment Lower
Column Max
Moment Lower
Column Min
Moment Upper
Column Max
Moment Upper
Column Min k k k-ft k-ft k-ft k-ft
1 20.69 20.69 -65.39 -65.39 -65.39 -65.39 2 50.61 50.61 0.00 0.00 0.00 0.00 3 20.69 20.69 65.39 65.39 65.39 65.39
6 - MOMENTS REDUCED TO FACE OF SUPPORT 6.1 Reduced Moments at Face of Support (Excluding Live Load)
Span Load Case
Moment Left
Moment Midspan
Moment Right
k-ft k-ft k-ft 1 SW 0.00 0.00 0.00 2 SW 0.00 0.00 0.00 1 SDL -391.67 451.75 -830.50 2 SDL -830.50 451.75 -391.67
6.2 Reduced Moments at Face of Support (Live Load)
Span Moment Left Max
Moment Left Min
Moment Midspan
Max
Moment Midspan Min
Moment Right Max
Moment Right Min

CAST-IN-PLACE T-BEAM VERIFICATION Chapter 4
106
k-ft k-ft k-ft k-ft k-ft k-ft 1 -113.83 -113.83 131.25 131.25 -241.33 -241.33 2 -241.33 -241.33 131.25 131.25 -113.83 -113.83
7 - SELECTED POST-TENSIONING FORCES AND TENDON PROFILES 7.1 Tendon Profile Tendon A
Span Type X1/L X2/L X3/L A/L 1 1 0.000 0.500 0.083 --- 2 1 0.083 0.500 0.000 ---
7.2 Selected Post-Tensioning Forces and Tendon Drape Tendon A
Span Force CGS Left CGS C1 CGS C2 CGS Right P/A Wbal WBal (%DL) k in in in in psi k/-
1 338.500 26.83 --- 3.00 32.00 262.81 1.835 66 2 338.500 32.00 --- 3.00 26.83 262.81 1.835 66
All Tendons
Span Force Total P/A Total WBal (%DL)
k psi 1 338.5 262.81 66 2 338.5 262.81 66
Approximate weight of strand: 749.4 LB 7.4 Required Minimum Post-Tensioning Forces Based on Stress Conditions Based on Minimum P/A
Type Left Center Right Left Center Right k k k k k k
1 0.00 274.47 148.88 161.00 161.00 161.00 2 148.91 274.44 0.00 161.00 161.00 161.00
7.5 Service Stresses (tension shown positive) Envelope of Service 1
Span Left Top Left Bottom Center Top Center Bottom
Right Top Right Bottom
psi psi psi psi psi psi 1 -117.17 -688.70 -415.67 184.18 64.16 -1218.94 2 64.34 -1219.45 -415.63 184.07 -117.15 -688.74
Envelope of Service 2
Span Left Top Left Bottom Center Top Center Bottom
Right Top Right Bottom
psi psi psi psi psi psi 1 -45.34 -898.73 -498.50 426.38 216.43 -1664.21 2 216.61 -1664.73 -498.46 426.27 -45.33 -898.77
7.6 Post-Tensioning Balance Moments, Shears and Reactions Span Moments and Shears
Span Moment Left Moment Center Moment Right Shear Left Shear Right k-ft k-ft k-ft k k
1 264.25 -321.50 540.17 -1.73 -1.73 2 539.92 -321.58 264.25 1.72 1.72
Reactions and Column Moments

CAST-IN-PLACE T-BEAM VERIFICATION Chapter 4
107
Joint Reaction Moment Lower
Column
Moment Upper
Column k k-ft k-ft
1 1.729 150.667 150.667 2 -3.453 -0.100 -0.100 3 1.724 -150.667 -150.667
Note: Moments are reported at face of support 8 - FACTORED MOMENTS AND REACTIONS ENVELOPE 8.1 Factored Design Moments (Not Redistributed)
Span Left Max
Left Min
Middle Max
Middle Min
Right Max
Right Min
k-ft k-ft k-ft k-ft k-ft k-ft 1 -349.38 -245.58 1102.68 983.03 -984.40 -764.37 2 -984.57 -764.53 1102.60 982.95 -349.38 -245.58
8.2 Reactions and Column Moments
Joint Reaction Max
Reaction Min
Moment Lower
Column Max
Moment Lower
Column Min
Moment Upper
Column Max
Moment Upper
Column Min k k k-ft k-ft k-ft k-ft
1 120.29 101.42 -164.33 -223.96 -164.33 -223.96 2 286.56 240.43 -0.10 -0.10 -0.10 -0.10 3 120.28 101.42 223.96 164.33 223.96 164.33
8.3 Secondary Moments
Span Left Midspan Right k-ft k-ft k-ft
1 302.75 350.58 398.33 2 398.17 350.50 302.75
Note: Moments are reported at face of support 10 - MILD STEEL - NO REDISTRIBUTION 10.1 Required Rebar 10.1.1 Total Strip Required Rebar
Span Location From To As Required Ultimate Minimum ft ft in2 in2 in2
1 TOP 0.00 8.55 3.65 0.00 3.65 1 TOP 48.46 56.99 3.65 1.55 3.65 2 TOP 0.00 8.55 3.65 1.55 3.65 2 TOP 48.46 56.99 3.65 0.00 3.65 1 BOT 19.95 37.04 1.50 0.19 1.50 2 BOT 19.95 37.04 1.50 0.19 1.50
12 - SHEAR REINFORCEMENT 12.1 Shear Calculation Envelope SPAN 1
X/L X d Vu Mu Ratio Req. Spacing ft in k kft in2 in
0.01 0.83 28.80 -116.45 -352.90 1.09 0.09 23.62 0.05 2.85 28.80 -107.13 -125.14 1.00 0.07 23.62

CAST-IN-PLACE T-BEAM VERIFICATION Chapter 4
108
0.10 5.70 28.80 -93.93 164.19 0.88 0.07 23.62 0.15 8.55 28.80 -80.78 415.65 0.94 0.07 23.62 0.20 11.40 28.80 -67.58 629.08 1.14 0.08 23.62 0.25 14.25 28.80 -54.41 804.72 1.21 0.09 23.62 0.30 17.10 29.19 -41.25 942.78 0.95 0.06 23.62 0.35 19.95 30.85 -28.06 1042.44 0.61 0.06 23.62 0.40 22.80 32.05 -14.89 1103.72 0.31 0.00 0.00 0.45 25.65 32.76 -1.71 1128.08 0.04 0.00 0.00 0.50 28.50 33.00 11.47 1114.06 0.23 0.00 0.00 0.55 31.35 32.65 24.64 1061.64 0.51 0.06 23.62 0.60 34.19 31.61 37.83 971.57 0.81 0.06 23.62 0.65 37.04 29.87 50.99 843.85 1.10 0.06 23.62 0.70 39.90 28.80 64.18 678.18 1.09 0.07 23.62 0.75 42.75 28.80 77.34 474.42 0.93 0.07 23.62 0.80 45.60 28.80 90.53 232.70 0.85 0.07 23.62 0.85 48.46 28.80 103.71 -46.87 0.97 0.07 23.62 0.90 51.31 28.80 116.90 -364.26 1.09 0.09 23.62 0.95 54.13 30.25 130.07 -719.74 1.16 0.16 23.62 0.99 56.17 31.49 139.38 -994.46 1.40 0.34 21.66
SPAN 2
X/L X d Vu Mu Ratio Req. Spacing ft in k kft in2 in
0.01 0.83 31.49 -139.40 -994.46 1.41 0.34 21.65 0.05 2.85 30.25 -130.07 -719.97 1.16 0.16 23.62 0.10 5.70 28.80 -116.90 -364.49 1.09 0.09 23.62 0.15 8.55 28.80 -103.71 -46.96 0.97 0.07 23.62 0.20 11.40 28.80 -90.55 232.63 0.85 0.07 23.62 0.25 14.25 28.80 -77.36 474.19 0.93 0.07 23.62 0.30 17.10 28.80 -64.18 677.96 1.09 0.07 23.62 0.35 19.95 29.87 -51.01 843.85 1.10 0.06 23.62 0.40 22.80 31.61 -37.83 971.57 0.81 0.06 23.62 0.45 25.65 32.65 -24.66 1061.64 0.51 0.06 23.62 0.50 28.50 33.00 -11.48 1113.32 0.23 0.00 0.00 0.55 31.35 32.76 1.70 1127.35 0.03 0.00 0.00 0.60 34.19 32.05 14.88 1103.72 0.31 0.00 0.00 0.65 37.04 30.85 28.06 1041.71 0.61 0.06 23.62 0.70 39.90 29.19 41.22 942.04 0.95 0.06 23.62 0.75 42.75 28.80 54.41 804.72 1.21 0.09 23.62 0.80 45.60 28.80 67.58 629.08 1.14 0.08 23.62 0.85 48.46 28.80 80.76 415.65 0.94 0.07 23.62 0.90 51.31 28.80 93.93 164.19 0.88 0.07 23.62 0.95 54.13 28.80 107.11 -125.14 1.00 0.07 23.62 0.99 56.17 28.80 116.43 -352.90 1.09 0.09 23.62
Note: "Vu" is related to the load combination which produces the maximum "Ratio" Note: Sections with **** have exceeded the maximum allowable shear stress. 14 - DEFLECTIONS 14.1 Maximum Span Deflections
Span SW SW+PT SW+PT+SDL
SW+PT+SDL+Creep
LL X Total
in in in in in in in 1 0.00 -0.25 0.12 0.35(1975) 0.11(6233) 0.00(*****) 0.46(1499) 2 0.00 -0.25 0.12 0.35(1976) 0.11(6235) 0.00(*****) 0.46(1500)

CAST-IN-PLACE T-BEAM VERIFICATION Chapter 4
109
Legend (2.1): Span C = Cantilever Form 1 = Rectangular, 2 = T or Inverted L, 3 = I, 4 = Extended T or L section Rh Elevation of top surface TF Top flange MF Middle flange BF Bottom flange Legend (2.7): The Column Boundary Condition (CBC): Fixed at both 1 Hinged at near end, fixed at far end 2 Fixed at near end, hinged at far end 3 Fixed at near end, roller with rotational fixity at far end 4 LC Lower Column UC Upper Column Legend (3.1): Class: SW: Selfweight, LL: Live Load, SDL: Superimposed Dead Load, X: Other Loading Type: U: Uniform, P: Partial Uniform, L: Line Load, M: Applied Moment C: Concentrated Load, R: Triangle, V: Variable, T: Trapezoidal Legend (4.1, 4.2): Yb: distance from centroid to bottom fiber Yt: distance from centroid to top fiber I: gross moment of inertia Legend (7.1): Type 1 = reversed parabola 2 = simple parabola with straight portion over support 3 = harped tendon 4 = straight tendon 5 = extended reversed parabola Legend (7.2): CGS C1: CGS of left middle point of tendon for type 5 profile CGS C2: CGS of right middle point of tendon for type 5 profile or middle point of other types Legend (10.1, 11.1): From: Beginning of rebar measured from left support of the span To: End of rebar measured from left support of the span As Required: Envelope of minimum and ultimate rebar Ultimate: Required rebar for ultimate load combinations Minimum: Required minimum rebar Legend (12): d: Effective depth of section for shear rebar calculation Vu: Ultimate shear Ratio: ratio of ultimate to allowable shear stress Req.: Required shear reinforcement per unit length Spacing: Spacing between shear rebar
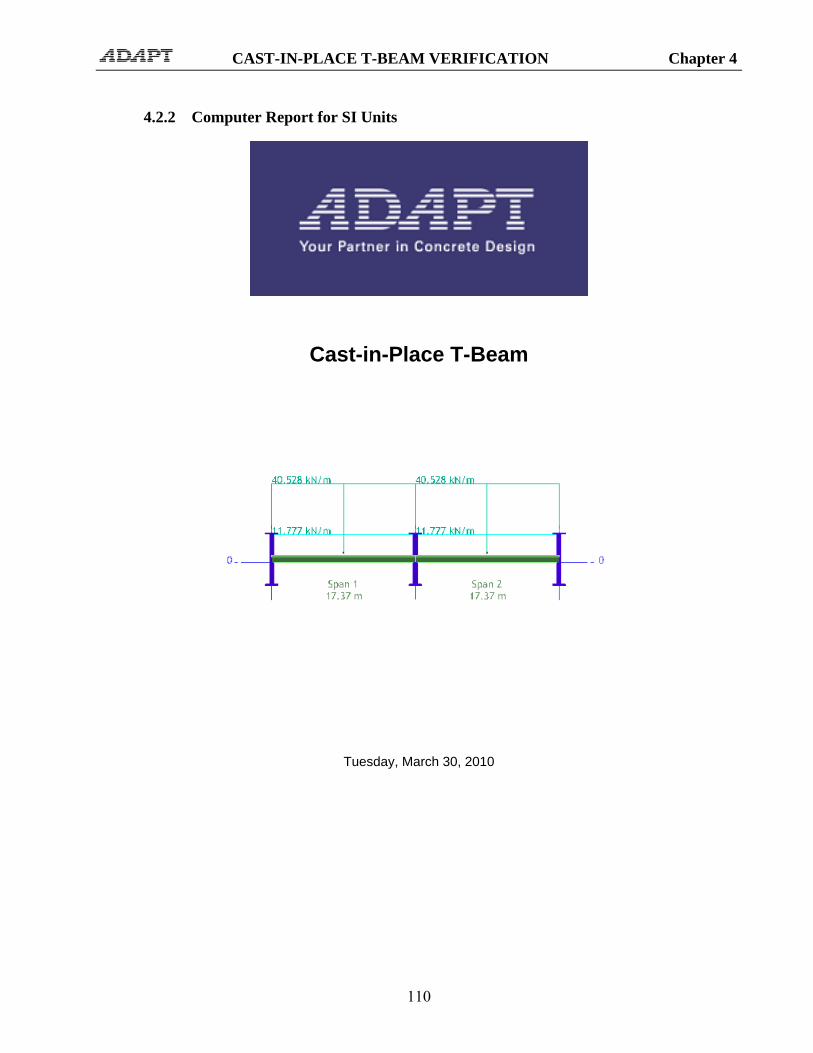
CAST-IN-PLACE T-BEAM VERIFICATION Chapter 4
110
4.2.2 Computer Report for SI Units
Cast-in-Place T-Beam
Tuesday, March 30, 2010

CAST-IN-PLACE T-BEAM VERIFICATION Chapter 4
111
TABLE OF CONTENT: Tabular Reports - Compact 1 - User Specified General Analysis and Design Parameters 2 - Input Geometry 2.1 - Principal Span Data of Uniform Spans 2.7 - Support Width and Column Data 3 - Input Applied Loading 3.1 - Loading As Appears in User's Input Screen 4 - Calculated Section Properties 4.1 - Section Properties of Uniform Spans and Cantilevers 5 - Moments, Shears and Reactions 5.1 - Span Moments and Shears (Excluding Live Load) 5.2 - Reactions and Column Moments (Excluding Live Load) 5.3 - Span Moments and Shears (Live Load) 5.4 - Reactions and Column Moments (Live Load) 6 - Moments Reduced to Face of Support 6.1 - Reduced Moments at Face of Support (Excluding Live Load) 6.2 - Reduced Moments at Face of Support (Live Load) 7 - Selected Post-Tensioning Forces and Tendon Profiles 7.1 - Tendon Profile 7.2 - Selected Post-Tensioning Forces and Tendon Drape 7.4 - Required Minimum Post-Tensioning Forces 7.5 - Service Stresses 7.6 - Post-Tensioning Balance Moments, Shears and Reactions 8 - Factored Moments and Reactions Envelope 8.1 - Factored Design Moments (Not Redistributed) 8.2 - Reactions and Column Moments 8.3 - Secondary Moments 10 - Mild Steel (No Redistribution) 10.1 - Required Rebar 10.1.1 - Total Strip Required Rebar 12 - Shear Reinforcement 12.1 - Shear Calculation Envelope 14 - Deflections 14.1 - Maximum Span Deflections

CAST-IN-PLACE T-BEAM VERIFICATION Chapter 4
112
1 - USER SPECIFIED GENERAL ANALYSIS AND DESIGN PARAMETERS
Parameter Value Parameter Value Concrete Post-tensioning
F'c for BEAMS/SLABS 34.00 N/mm 2 SYSTEM UNBONDED For COLUMNS/WALLS 34.00 N/mm 2 Fpu 1862.00 N/mm 2 Ec for BEAMS/SLABS 27405.00 N/mm 2 Fse 1206.00 N/mm 2
For COLUMNS/WALLS 27405.00 N/mm 2 Strand area 99.000 mm 2 CREEP factor 2.00 Min CGS from TOP 102.00 mm
CONCRETE WEIGHT NORMAL Min CGS from BOT for interior spans 76.00 mm Tension stress limits / (f'c)1/2 Min CGS from BOT for exterior spans 76.00 mm
At Top 0.750 Min average precompression 0.86 N/mm 2 At Bottom 0.750 Max spacing / slab depth 8.00
Compression stress limits / f'c Analysis and design options At all locations 0.450 Structural system BEAM Reinforcement Moment of Inertia over support is NOT INCREASEDFy (Main bars) 413.69 N/mm 2 Moments reduced to face of support YES
Fy (Shear reinforcement) 413.69 N/mm 2 Moment Redistribution NO Minimum Cover at TOP 51.00 mm Effective flange width consideration NO
Minimum Cover at BOTTOM 51.00 mm DESIGN CODE SELECTED ACI-318 (2005) 2 - INPUT GEOMETRY 2.1 Principal Span Data of Uniform Spans Span Form Length Width Depth TF Width TF
Thick. BF/MF Width
BF/MF Thick.
Rh Right Mult.
Left Mult.
m mm mm mm mm mm mm mm 1 2 17.37 355 914 3200 177 914 0.50 0.50 2 2 17.37 355 914 3200 177 914 0.50 0.50
2.7 Support Width and Column Data Joint Support
Width Length
LC B(DIA.)
LC D LC % LC CBC LC Length
UC B(DIA.)
UC D UC % UC CBC UC
mm m mm mm m mm mm 1 508.0 3.0 609.0 508.0 100 (1) 3.0 609.0 508.0 100 (1) 2 508.0 3.0 609.0 508.0 100 (1) 3.0 609.0 508.0 100 (1) 3 508.0 3.0 609.0 508.0 100 (1) 3.0 609.0 508.0 100 (1)
3 - INPUT APPLIED LOADING 3.1 Loading As Appears in User's Input Screen
Span Class Type W P1 P2 A B C F M kN/m2 kN/m kN/m m m m kN kN-m
1 LL L 11.777 0.000 17.374 1 SDL L 40.528 0.000 17.374 2 LL L 11.777 0.000 17.374 2 SDL L 40.528 0.000 17.374
4 - CALCULATED SECTION PROPERTIES 4.1 Section Properties of Uniform Spans and Cantilevers
Span Area I Yb Yt mm2 mm4 mm mm
1 828035.00 0.51E+11 681.10 232.90 2 828035.00 0.51E+11 681.10 232.90
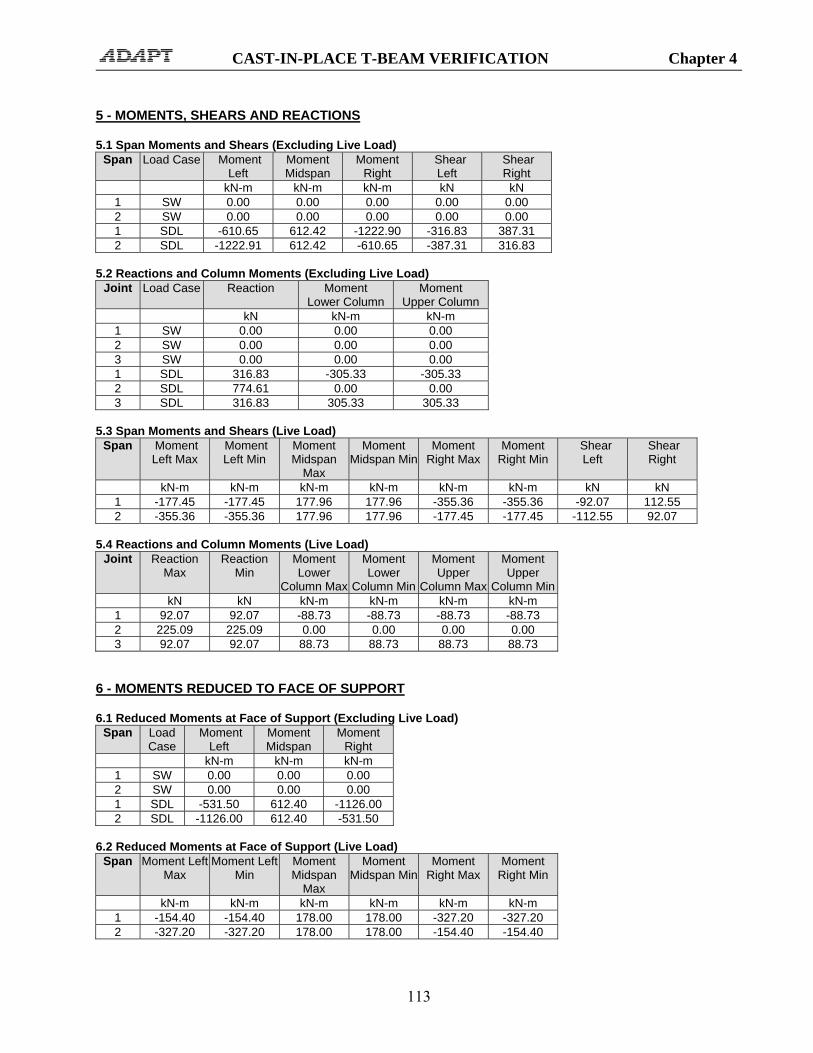
CAST-IN-PLACE T-BEAM VERIFICATION Chapter 4
113
5 - MOMENTS, SHEARS AND REACTIONS 5.1 Span Moments and Shears (Excluding Live Load)
Span Load Case Moment Left
Moment Midspan
Moment Right
Shear Left
Shear Right
kN-m kN-m kN-m kN kN 1 SW 0.00 0.00 0.00 0.00 0.00 2 SW 0.00 0.00 0.00 0.00 0.00 1 SDL -610.65 612.42 -1222.90 -316.83 387.31 2 SDL -1222.91 612.42 -610.65 -387.31 316.83
5.2 Reactions and Column Moments (Excluding Live Load)
Joint Load Case Reaction Moment Lower Column
Moment Upper Column
kN kN-m kN-m 1 SW 0.00 0.00 0.00 2 SW 0.00 0.00 0.00 3 SW 0.00 0.00 0.00 1 SDL 316.83 -305.33 -305.33 2 SDL 774.61 0.00 0.00 3 SDL 316.83 305.33 305.33
5.3 Span Moments and Shears (Live Load)
Span Moment Left Max
Moment Left Min
Moment Midspan
Max
Moment Midspan Min
Moment Right Max
Moment Right Min
Shear Left
Shear Right
kN-m kN-m kN-m kN-m kN-m kN-m kN kN 1 -177.45 -177.45 177.96 177.96 -355.36 -355.36 -92.07 112.55 2 -355.36 -355.36 177.96 177.96 -177.45 -177.45 -112.55 92.07
5.4 Reactions and Column Moments (Live Load)
Joint Reaction Max
Reaction Min
Moment Lower
Column Max
Moment Lower
Column Min
Moment Upper
Column Max
Moment Upper
Column Min kN kN kN-m kN-m kN-m kN-m
1 92.07 92.07 -88.73 -88.73 -88.73 -88.73 2 225.09 225.09 0.00 0.00 0.00 0.00 3 92.07 92.07 88.73 88.73 88.73 88.73
6 - MOMENTS REDUCED TO FACE OF SUPPORT 6.1 Reduced Moments at Face of Support (Excluding Live Load)
Span Load Case
Moment Left
Moment Midspan
Moment Right
kN-m kN-m kN-m 1 SW 0.00 0.00 0.00 2 SW 0.00 0.00 0.00 1 SDL -531.50 612.40 -1126.00 2 SDL -1126.00 612.40 -531.50
6.2 Reduced Moments at Face of Support (Live Load)
Span Moment Left Max
Moment Left Min
Moment Midspan
Max
Moment Midspan Min
Moment Right Max
Moment Right Min
kN-m kN-m kN-m kN-m kN-m kN-m 1 -154.40 -154.40 178.00 178.00 -327.20 -327.20 2 -327.20 -327.20 178.00 178.00 -154.40 -154.40

CAST-IN-PLACE T-BEAM VERIFICATION Chapter 4
114
7 - SELECTED POST-TENSIONING FORCES AND TENDON PROFILES 7.1 Tendon Profile Tendon A
Span Type X1/L X2/L X3/L A/L 1 1 0.000 0.500 0.083 --- 2 1 0.083 0.500 0.000 ---
7.2 Selected Post-Tensioning Forces and Tendon Drape Tendon A
Span Force CGS Left CGS C1 CGS C2 CGS Right P/A Wbal WBal (%DL) kN mm mm mm mm MPa kN/-
1 1505.700 681.00 --- 76.00 812.00 1.82 26.756 66 2 1505.700 812.00 --- 76.00 681.00 1.82 26.756 66
All Tendons
Span Force Total P/A Total WBal (%DL)
kN MPa 1 1505.7 1.82 66 2 1505.7 1.82 66
Approximate weight of strand: 340.6 Kg 7.4 Required Minimum Post-Tensioning Forces Based on Stress Conditions Based on Minimum P/A
Type Left Center Right Left Center Right kN kN kN kN kN kN
1 0.00 1225.68 669.49 712.11 712.11 712.11 2 669.56 1225.71 0.00 712.11 712.11 712.11
7.5 Service Stresses (tension shown positive) Envelope of Service 1
Span Left Top Left Bottom Center Top Center Bottom
Right Top Right Bottom
MPa MPa MPa MPa MPa MPa 1 -0.81 -4.77 -2.88 1.27 0.44 -8.44 2 0.45 -8.44 -2.88 1.27 -0.81 -4.77
Envelope of Service 2
Span Left Top Left Bottom Center Top Center Bottom
Right Top Right Bottom
MPa MPa MPa MPa MPa MPa 1 -0.31 -6.22 -3.45 2.95 1.50 -11.51 2 1.50 -11.52 -3.45 2.95 -0.31 -6.22
7.6 Post-Tensioning Balance Moments, Shears and Reactions Span Moments and Shears
Span Moment Left Moment Center Moment Right Shear Left Shear Right kN-m kN-m kN-m kN kN
1 358.20 -435.70 731.50 -7.67 -7.67 2 731.40 -435.70 358.20 7.66 7.66
Reactions and Column Moments
Joint Reaction Moment Lower
Column
Moment Upper
Column kN kN-m kN-m
1 7.671 204.400 204.400

CAST-IN-PLACE T-BEAM VERIFICATION Chapter 4
115
2 -15.330 -0.054 -0.054 3 7.657 -204.400 -204.400
Note: Moments are reported at face of support 8 - FACTORED MOMENTS AND REACTIONS ENVELOPE 8.1 Factored Design Moments (Not Redistributed)
Span Left Max
Left Min
Middle Max
Middle Min
Right Max
Right Min
kN-m kN-m kN-m kN-m kN-m kN-m 1 -474.14 -333.40 1495.08 1332.76 -1334.72 -1036.40 2 -1334.82 -1036.50 1494.98 1332.66 -474.14 -333.40
8.2 Reactions and Column Moments
Joint Reaction Max
Reaction Min
Moment Lower
Column Max
Moment Lower
Column Min
Moment Upper
Column Max
Moment Upper
Column Min kN kN kN-m kN-m kN-m kN-m
1 535.14 451.19 -223.02 -303.93 -223.02 -303.93 2 1274.35 1069.11 -0.06 -0.06 -0.06 -0.06 3 535.13 451.18 303.93 223.02 303.93 223.02
8.3 Secondary Moments
Span Left Midspan Right kN-m kN-m kN-m
1 410.70 475.40 540.00 2 539.90 475.30 410.70
Note: Moments are reported at face of support 10 - MILD STEEL - NO REDISTRIBUTION 10.1 Required Rebar 10.1.1 Total Strip Required Rebar
Span Location From To As Required Ultimate Minimum m m mm2 mm2 mm2
1 TOP 0.00 2.61 2336.00 0.00 2336.00 1 TOP 14.77 17.37 2336.00 1050.00 2336.00 2 TOP 0.00 2.61 2336.00 1050.00 2336.00 2 TOP 14.77 17.37 2336.00 0.00 2336.00 1 BOT 0.00 0.87 1253.00 0.00 1253.00 1 BOT 6.08 11.29 966.60 152.50 966.60 1 BOT 14.77 17.37 4391.00 0.00 4391.00 2 BOT 0.00 2.61 4391.00 0.00 4391.00 2 BOT 6.08 11.29 966.60 152.50 966.60 2 BOT 16.51 17.37 1253.00 0.00 1253.00
12 - SHEAR REINFORCEMENT 12.1 Shear Calculation Envelope SPAN 1
X/L X d Vu Mu Ratio Req. Spacing m mm kN kNm mm2 mm
0.01 0.25 731.20 -518.00 -478.80 1.10 206.70 600.00 0.05 0.87 731.20 -476.50 -170.10 1.01 137.90 600.00

CAST-IN-PLACE T-BEAM VERIFICATION Chapter 4
116
0.10 1.74 731.20 -417.90 222.20 0.89 137.90 600.00 0.15 2.61 731.20 -359.30 563.20 0.94 137.90 600.00 0.20 3.48 731.20 -300.70 852.70 1.15 170.60 600.00 0.25 4.34 731.20 -242.10 1091.00 1.21 186.70 600.00 0.30 5.21 741.20 -183.50 1277.00 0.96 136.90 600.00 0.35 6.08 783.50 -124.80 1413.00 0.62 133.20 600.00 0.40 6.95 813.80 -66.22 1497.00 0.32 0.00 0.00 0.45 7.82 831.90 -7.62 1529.00 0.04 0.00 0.00 0.50 8.69 838.00 51.01 1510.00 0.24 0.00 0.00 0.55 9.56 829.20 109.60 1439.00 0.51 129.50 600.00 0.60 10.42 802.70 168.20 1318.00 0.81 131.60 600.00 0.65 11.29 758.60 226.90 1144.00 1.11 135.40 600.00 0.70 12.16 731.20 285.50 919.50 1.10 137.90 600.00 0.75 13.03 731.20 344.10 643.40 0.94 137.90 600.00 0.80 13.90 731.20 402.70 315.70 0.85 137.90 600.00 0.85 14.77 731.20 461.30 -63.43 0.98 137.90 600.00 0.90 15.64 731.20 520.00 -493.90 1.10 215.30 600.00 0.95 16.51 767.70 578.60 -975.60 1.17 352.60 600.00 0.99 17.12 799.00 620.10 -1348.00 1.41 729.90 550.90
SPAN 2
X/L X d Vu Mu Ratio Req. Spacing m mm kN kNm mm2 mm
0.01 0.25 799.00 -620.10 -1348.00 1.41 730.10 550.80 0.05 0.87 767.70 -578.60 -975.80 1.17 352.60 600.00 0.10 1.74 731.20 -520.00 -494.00 1.10 215.30 600.00 0.15 2.61 731.20 -461.30 -63.53 0.98 137.90 600.00 0.20 3.48 731.20 -402.70 315.60 0.85 137.90 600.00 0.25 4.34 731.20 -344.10 643.30 0.94 137.90 600.00 0.30 5.21 731.20 -285.50 919.40 1.10 137.90 600.00 0.35 6.08 758.60 -226.90 1144.00 1.11 135.40 600.00 0.40 6.95 802.70 -168.20 1317.00 0.81 131.60 600.00 0.45 7.82 829.20 -109.60 1439.00 0.51 129.50 600.00 0.50 8.69 838.00 -51.01 1510.00 0.24 0.00 0.00 0.55 9.56 832.00 7.62 1529.00 0.04 0.00 0.00 0.60 10.42 813.80 66.22 1497.00 0.32 0.00 0.00 0.65 11.29 783.50 124.80 1413.00 0.62 133.20 600.00 0.70 12.16 741.20 183.50 1277.00 0.96 136.90 600.00 0.75 13.03 731.20 242.10 1091.00 1.21 186.70 600.00 0.80 13.90 731.20 300.70 852.80 1.15 170.50 600.00 0.85 14.77 731.20 359.30 563.30 0.94 137.90 600.00 0.90 15.64 731.20 417.90 222.20 0.89 137.90 600.00 0.95 16.51 731.20 476.50 -170.10 1.01 137.90 600.00 0.99 17.12 731.20 518.00 -478.80 1.10 206.70 600.00
Note: "Vu" is related to the load combination which produces the maximum "Ratio" Note: Sections with **** have exceeded the maximum allowable shear stress. 14 - DEFLECTIONS 14.1 Maximum Span Deflections
Span SW SW+PT SW+PT+SDL
SW+PT+SDL+Creep
LL X Total
mm mm mm mm mm mm mm 1 0.0 -6.6 3.0 8.9(1941) 2.8(6131) 0.0(*****) 11.8(1474) 2 0.0 -6.6 3.0 8.9(1941) 2.8(6132) 0.0(*****) 11.8(1474)

CAST-IN-PLACE T-BEAM VERIFICATION Chapter 4
117
4.3 VERIFICATION
4.3.1 Verification of Report for American Units
The ADAPT-PT report is presented in numbered data blocks. Each data block data area provided in table. For example, looking at the report, it is observed that data block 2.7 third column is the lower column lengths. In notation form, this is referred to as (B2.1, C3). For this example ADAPT-PT concludes with the effective force that is required to meet the specified stress and strength requirements. The force determined by ADAPT-PT should be furnished with due considerations to friction, elongation and long-term stress losses. The furnished force should be such as to envelop the required force distribution determined by ADAPT-PT. The variable force option of ADAPT-PT, in which the change of tendon stress along its length is accounted for, is more appropriate for this verification.
4.3.1.1 Geometry of Beam (Data Block 2)
Data block 2.1 and 2.7 identify the geometry of the beam and column supports.
4.3.1.2 Loading (Data Block 3)
Data block 3.1 and 3.2 identify the loading details.
4.3.1.3 Calculated Section Properties (Data Block 4)
Data block 4 reflects the calculated section properties of all the spans.
Area, A = 14*29+ 126*7 = 1288 in2
(8.31e5 mm2) (ADAPT 1288, B4.1, C2)
Moment of inertia, I = [14 * 293/12 + 14*29*(26.83-14.5) 2] + [126 * 73/12 + 126*7*(9.17- 3.5) 2]
= 1221e2 in4 (5.08e10 in4) (ADAPT 0.12E6,B4.1, C3)
Distance from bottom fiber to centroid, Yb
= 26.83 in (681 mm) (ADAPT B4.1, C4)
Distance from top fiber to centroid, Yt
= 9.17 in (233 mm) (ADAPT B4.1, C5)

CAST-IN-PLACE T-BEAM VERIFICATION Chapter 4
118
4.3.1.4 Material Properties (Data Block 1)
Concrete, post-tensioning strand and mild reinforcement material properties are given in data block 1.
4.3.1.5 Centerline Moments (Data Block 5)
Dead and live moments for support centerlines and in-span values are listed in ADAPT-PT data blocks 5.1 through 5.4. They are reproduced in the following table for dead loading:
TABLE 4.3.1-1 CENTERLINE AND IN-SPAN DEAD
LOAD MOMENTS (k-ft) Kip-ft
(kNm) Reference Number
Exterior column -450.06 (-610.19)
B 5.1, C3
First in-span 451.72 (612.44)
B 5.1, C4
Interior column -902.12 (-1223.09)
B 5.1, C5
4.3.1.6 Tendon Profile and Forces (Data Block 7)
Tendon shape and selected forces used by ADAPT-PT are given in data blocks 7.1 and 7.2. Here selected the reversed parabola as tendon shape. Data block 7.1 is the description of reversed parabola. In data block 7.1 of ADAPT-PT, column 3 and 5 indicate the inflection point distance from the central column in relation to the total length i.e., X1/L and X3/L. The parabolic profiles are selected so as to have their low points at mid-spans Data Block 7.2, columns 3-6 (B 7.2, C 3-6) describe the tendon heights at critical points. Data Block 7.2, column2 indicate the selection of tendon forces. In ADAPT-PT printout note that the forces selected (B 7.2, C2) are duly larger than those required (B 7.4, C 2-7). This ensures that the extreme fiber tensile stresses will be equal or less than the maximum allowable values specified by the user as part of input (B1). Data Block 7.2, column 8 (C8) gives the calculated values of balanced loading. The ADAPT-PT solution is as follows:

CAST-IN-PLACE T-BEAM VERIFICATION Chapter 4
119
Span 1
FIGURE 4.3.1-1
Calculation of wb1:
Provided PT force, T = 338.5 k (1505.72 kN) (B 7.2, C2) a = 26.83 – 3= 23.83 in c1 = 28.5 ft (8.69 m) wb1 / tendon = (2 * T *a / c1 2 ) = 2 * 338.5 * (23.83/12)/ 28.5 2 = 1.655 klf (24.15 kN/m) (ADAPT
1.655, WBAL.DAT)
Calculation of wb2:
Provided PT force, T = 338.5 k (1505.72 kN) (B 7.2, C2) Total drape for right of span a
= 32-3 = 29 in (737 mm)
CAST-IN-PLACE T-BEAM VERIFICATION Chapter 4
120
= (23.77/28.5)*29 = 24.19 in (614 mm)
c2 = 23.77 ft(7.25 m) wb2 / tendon = (2 * T *a / c2 2 ) = 2 * 338.5 * (24.19/12)/
23.77 2
= 2.415 klf (35.24 kN/m) (ADAPT 2.415,WBAL.DAT)
Calculation of wb:
wb = (wb1 * c1+ wb1 * c1) / L = (1.655 *28.5 +2.415
*23.77)/57
= 1.835 k/ft (26.78 kN/m) (ADAPT 1.835, B7.2, C8)
% DL balanced Dead load = 2.777 k/ft (40.53 kN/m) (B3.1, C5) Balanced Load = 1.835 k/ft (26.81 kN/m) (B7.2, C8) % DL balanced = 1.835/ 2.777 = 0.66 *100 =66 (ADAPT 66, B
7.2, C9)
4.3.1.7 Required Post-Tensioning Forces (Data Block 7.4)
Consider the required post-tensioning at the right support of span one; given by ADAPT-PT as 149.02 kips (B 9.5, C 4). The verification is carried out by demonstrating that the “required minimum post-tensioning force” suggested by ADAPT-PT, if used, leads to a tensile stress specified by the user as the maximum allowable. In this example the maximum allowable stress in tension is: 9√f’c. Stress due to dead and live moments:
M = 1071.83 k-ft M/S = 1071.83 * 12000*9.17/ 122100 = 965.96
psi (6.66 MPa)
Stress due to balanced moment is obtained by prorating the moment due to the selected force (338.5 kip) by the force suggested by ADAPT-PT (148.88 k). M/S = (148.88/338.5)*540.17* 12000*9.17/ 122100 = 214.11 psi (1.48 MPa)

CAST-IN-PLACE T-BEAM VERIFICATION Chapter 4
121
Stress due to direct compression: P/A = 148.88 * 1000/ 1288 = 115.59 psi (0.80 Mpa) Total tensile stress = 965.96 – 214.11 – 115.59 = 636.26 psi (4.39MPa) Allowable stress: 9√f’c = 9 *√5000 = 636.40 psi (4.39 MPa) (OK) It is shown that the calculated required post-tensioning corresponds to the maximum permissible tensile stress as specified by the user in data block 1.
4.3.1.8 Service Stresses (Data Block 7.5)
Data block 7.5 lists the service stresses at top and bottom for supports and mid span. This has two data blocks with service stresses, Envelope of Service 1 and Envelope of Service 2. Envelope of Service 1 is the envelope of service stresses from the Sustained Load Combinations. Similarly Envelope of Service 2 is the envelope of service stresses from the Total Load combinations. This section provides the calculation for Envelope of Service 2. Consider the right face of second support Stresses: σ = (MD+ML+MPT)/S + (P/A) S = I/Yc Where MD, ML, MPT are the moments across the entire tributary of the design strip. S is the section modulus; A is the area; I is the moment of inertia of the section; and Yc is the distance of the centroid of the section to farthest tension fiber of the section. Stress limits:
Top tension = 9*√4000 = 636 psi (4.39 MPa) (B1) Bottom tension = 9*√4000 = 636 psi (4.39 MPa) Compression (for service)
= 0.45 * 4000 = -1800 psi (12.41 MPa)
A = 1288 in2 (8.31e5 mm2) (B4.1, C2) I = 122100 in4 (5.08e10 in4) (B4.1, C3) Yb = 26.83 in (681 mm) (B4.1, C4) Yt = 9.17 in (233 mm) (B4.1, C5)

CAST-IN-PLACE T-BEAM VERIFICATION Chapter 4
122
Sbottom = 122100/ 26.83 = 4551 in3 (74.58e6 mm3) Stop = 122100/ 9.17 = 13315 in3 (21.82e7 mm3) P = 338.5 k (1505.72 kN) (B7.2, C2) MD = -830.50 k-ft (-1126 kNm) (B6.1, C3) ML = -241.33 k-ft (-327.20 kNm) (B6.2, C2) MPT = 539.92 k-ft (731.90 kNm) (B7.6, C2) MD+ML+MPT = -830.50 + -241.33 +539.92 = -531.91 k-ft (-721.16 kNm) P/A = -338.5*1000/ 1288 = -262.81 psi (-1.81 MPa) (ADAPT
262.81, B7.2, C7)
Top fiber:
σ = (531.91*12000)/13315- 262.81 = 216.57 psi (1.49 MPa) < 636 psi (4.39 MPa) (ADAPT 216.61,
B7.5, C2) Bottom fiber:
σ = (-531.91*12000)/4551- 262.81 = -1665.34 psi (-11.48 MPa) < -1800 psi (ADAPT -1664.73,
B7.5, C3)
4.3.1.9 Secondary Moments (Data Block 8.3)
The method used by ADAPT-PT for the calculation of secondary moments is described in Sections 2.3.1 and 5.6. The values from data block 8.3 are given in the following table. TABLE 4.3.1-2 HYPERSTATIC (SECONDARY
MOMENTS) OF SPAN1 k-ft
(kN-m) Reference Number
FIRST SPAN At left 302.75
(410.47) B8.3, C2
At center 350.58 (475.32)
B8.3, C3

CAST-IN-PLACE T-BEAM VERIFICATION Chapter 4
123
At right 398.33 (540.06)
B8.3, C4
Following the procedure outlined in Section 1 for the one-way slab and using the secondary reactions printed out in data block 7.6 of ADAPT-PT, it is verified that the ADAPT-PT secondary moments are the correct values.
4.3.1.10 Factored Moments and Reactions (Data Block 8.1)
This section provides the factored moments from the ADAPT-PT solutions. Consider the verification of the moment at left of second support:
1.2 Md = 1.2 * -830.50 = -996.60 k-ft (-1351.19 kNm) 1.6 Ml = 1.6 * -241.33 = -386.13 k-ft (-523.52 kNm) 1.0 Msec = 1.0 * 398.33 = 398.33 k-ft (540.06 kNm) Mu = 1.2 Md + 1.6 Ml + 1.0 Msec =
-984.40 k-ft (-1334.65 kNm) (ADAPT –984.40, B8.1, C6)
TABLE 4.3.1-3 FACTORED MOMENTS (k-ft)
k-ft (kN-m)
Reference Number
First span At left -349.38
(-473.69) B8.1, C2
At center 1102.68 (1495.01)
B8.1, C4
At right -983.03 (-1332.79)
B8.1, C6
4.3.1.11 Nonprestressed (Mild) Reinforcement (Data Block 10)
For the particular problem under consideration, the mild reinforcement required to supplement the post-tensioning is based either on the code requirements of minimum mild reinforcement, or the ultimate strength. At critical locations of the beam, ADAPT-PT calculates the required steel for each of the governing criteria and also the minimum required. The computed values are tabulated and the largest is used in preparing the list of suggested rebar. For a detailed review of the rebar calculation and verification refer to Section 5.8.

CAST-IN-PLACE T-BEAM VERIFICATION Chapter 4
124
(i) Minimum Reinforcement
The minimum bonded reinforcement is As = 0.004*A, where A is the area of part of cross section between flexural tension face and center of gravity of gross section in mm2.
For mid-span:
Yb = Depth of neutral axis = 26.83 in (681 mm) (B4.1, C4) b = Width of section = 14 in (356mm) (B2.1, C4) As = 0.004*26.83*14 = 1.5 in2 (968 mm2) (ADAPT 1.5,
B10.1.1, C7)
(ii) Ultimate Strength Requirement
At mid-span:
Mu = 1102.68 k-ft (1495.01 kN-m) (B8.1, C4) P = 338.5 k (1505.72 kN) (B7.2, C2) fse = 175 ksi (1206 MPa), final average stress (B1) Aps = area of PT tendon = 338.5/175 = 1.93 in2
Span/depth ratio = 57*12/36 = 19 < 35 Hence, use ACI Equation (18-4).
b = 126 in (3200 mm) (B2.1,C6) dp = 36-3 = 33 in (838 mm) ρp for PT = Aps/b*dp = 1.93/(126*33)
= 4.642*10-4
f'c = 5000 psi (34 MPa) (B1) fps = fse + 10000 + f'c/(100*ρp) (ACI Equation
18-4) fps = 175 + 10 + 5/(100*4.642*10-4) = 292.71 ksi (2018.19 MPa)>
{175+60= 235ksi}
So use fps=235 ksi (1620.28 MPa)

CAST-IN-PLACE T-BEAM VERIFICATION Chapter 4
125
Area of the required rebar from the output of ADAPT-PT is 0.19 in2
(B10.1.1, C7). The computations proceed by verifying that the calculated area is correct. Therefore, assume As = 0.19 in
2.
PT tension Tp = 1.93*235 = 453.55 k (2017.48 kN) Rebar tension Ts = 0.19*60 = 11.4 k (26.69 kN) Total tension Tu = 464.95 k (2044.17 kN) a = Depth of compression zone = Tu/(0.85*b*f'c) = [464.95 /(0.85*126*5)] = 0.87 in (22 mm) dr = 36-2-0.75/2 = 33.63 in (for #6 bar used) φ*Mn = φ*[Tp*(dp - a/2) + Ts*(dr - a/2)] φ*Mn = 0.9*[453.55(33 – (0.87/2)) + 11.4*(33.63-
(0.87/2)]/12 = 1136.12 k-ft
(1540.35 kN-m) (ADAPT 1102.60 k-ft, B8.1,C4)
4.3.1.12 Shear Design (Data Block 12) For the particular beam under consideration the magnitude of the induced shear stresses are low, to the extent that the design is governed by the maximum stirrup spacing of 24-inches. For detailed verification of beam shear design refer to Section 5-9. The stirrup area and spacing are verified at X = 54.13 ft of the span 1: dp d
= 30.25 in (768mm) = 36-2-0.75/2 = 33.63 in(854 mm)
(PTCGS.DAT) (B12, C3)
Vu = 130.07 kip (B12, C4) Mu = 719.74 k-ft (B12, C5) Vu *dp/Mu = 130.07 *30.25/(719.74*12) = 0.460< 1 vc1 = 0.6*(5000)1/2 + 700*0.46
= 364.43 psi (2.51 MPa)
{2*(f'c)1/2 = 141} < {vc1 = 364.43} <
{5*(f'c)1/2 = 353.55}
Hence, maximum permissible value of 5*(f'c) 1/2 governs.

CAST-IN-PLACE T-BEAM VERIFICATION Chapter 4
126
vu = Vu/(b*dp) = 130.07*1000/(14*30.25) = 307.13 psi (1.90 MPa)
Stress ratio, vu/φvc
= 307.13/0.75*353.55 = 1.16 (ADAPT 1.16, B12, C6)
For vu >φ vc , shear reinforcement is required.
Av = (s* b w *(vu-φvc)/ φ f y = 12* 14*(307.13- 0.75*353.55) / (0.75 *
60000)
= 0.16 in2 / ft (101 mm2/m)
Avmin = 0.75*√f’c*bw*s/fy > 50bw*s/fy = 0.75*√5000*14*12/60000 = 0.15 in2 / ft > 0.14 in2 / ft Avmin = (Aps*fpu*s)/(80*fy*d)*√(d/bw) = (1.93*270*12)/(80*60*30.25)*√(30.25/14)
= 0.03 in2 / ft
So, A = 0.16 in2 / ft (101 mm2/m)
Select #5 with two legs:
2 * 0.31 =0.62 in2 (400 mm2) hence, Spacing = 0.62*12/ 0.16 = 46.5 in (1181 mm)
Maximum spacing
= min (24 in or 0.75*h ) = min(24in , 27 in)
so,
s = 24 in. (610 mm) (ADAPT 23.62in, B12, C8)
(ADAPT 0.16 in2, B12, C7)

CAST-IN-PLACE T-BEAM VERIFICATION Chapter 4
127
4.3.2 Verification of SI Report
The metric version is verified by way of comparing its output with the American version. Table 4.3.2-1 lists the critical values of the PTI T-beam for both the American and the metric version. Good agreement between the two versions is observed.
TABLE 4.3.2-1 COMPARISON BETWEEN THE METRIC AND
AMERICAN OUTPUTS OF ADAPT-PT FOR PTI T-BEAM EXAMPLE (PTI03M)
Metric output [kN,m] [kip,ft]
US output [kip,ft]
Reference number
DL Moment Span 612.42 451.70 451.72 B5.1, C4 DL Moment Support -1222.90 -901.96 -902.11 B5.1, C5 LL Moment Span 177.96 131.26 131.27 B5.3, C4 LL Moment Support -355.36 -262.10 -262.15 B5.3, C6 Required PT Span 1225.68 275.55 274.47 B7.4, C3 Required PT Support 669.49 150.51 148.88 B7.4, C4 Stress Bottom at Center 2.95 427.86 426.38 B7.5, C5 Stress Top at Center -3.45 -500.39 -498.50 B7.5, C4 Secondary Moments 475.40 350.64 350.58 B8.3, C3 Rebar Bottom 966.60 1.50 1.50 B10.1.1, C5 Rebar Top 2336 3.62 3.65 B10.1.1, C2 Deflection DL+PT+CR 8.9 0.35 0.35 B14.1, C5

128

129
Chapter 5
SPECIFIC VERIFICATION

130

SPECIFIC VERIFICATION Chapter 5
131
5.1 FIXED END MOMENTS OF NON-PRISMATIC SPANS
When sections vary along the length of a span, ADAPT-PT computes the fixed end moments due to the applied loading with due consideration to the change in moment of inertia along the span length. This section:
• Demonstrates the correct calculation of the fixed end moments • Provides additional information on the locations and magnitudes of moments of
inertia along the span • Describes the stiffness matrices used for each of the spans
Data on variations in moment of inertia and stiffness matrices are reported in the file (CS.DAT) that is generated in the subdirectory, where data is executed. The verification is carried out for the numerical example given in the Post Tensioning Institute's booklet on Design of Post-Tensioned Slabs, Section 7.3, Two-Way Slab with Drop Panels. The plan and typical elevations of the seven span slab example with drop panels are shown in Figs 5.1-1 through 5.1-3.
FIGURE 5.1-1

SPECIFIC VERIFICATION Chapter 5
132
FIGURE 5.1-2
FIGURE 5.1-3

SPECIFIC VERIFICATION Chapter 5
133
5.1.1 Fixed End Moments
For the specified live load of 0.10 k/ft2 the calculated fixed end moments given by ADAPT-PT are: TABLE 5.1-1 LIVE LOADING FIXED END
MOMENTS (units in k-in.) Span FEM-start FEM-end
1 1600.657 -3366.100 2 5815.288 -5815.274 3 5815.288 -5815.274 4 5815.288 -5815.274 5 5815.288 -5815.274 6 5815.288 -5815.274 7 3366.650 -1600.656
L = 36 ft span length w = 0.1 k/ft2. load intensity FEM = Fixed End Moment (center line values) w*L2 = 0.1*36*362 = 4665.6 k-ft interior span FEM/(w*L2) = 5815.10/(4665.6*12) = 0.1039 interior span
FEM/(w*L2) = 1597.60/(2073.6*12) = 0.0642 exterior span at A
FEM/(w*L2) = 3368.76/(2073.6*12) = 0.1355 exterior span at B The comparisons of the fixed-end moment coefficients obtained from ADAPT-PT with other sources are given in Table 5.1-2.
TABLE 5.1-2 COMPARISONS OF FEM COEFFICIENTS FEM/(w*L2) PTI ADAPT SAP-IV Interior span 0.101 0.103 0.101 Exterior span - at A 0.061 0.064 0.064 at B 0.137 0.136 0.135
5.1.2 Variations in Moment of Inertia
A span with changes in cross section along its length is treated as a non-prismatic member. Fig. 5.1-4 illustrates the general non-prismatic member geometry assumed for a typical span. The second moment of area of each section and the distance of a section from the support are reported in the file CS.DAT. For the above example, the values calculated are listed in Table 5.1-3.

SPECIFIC VERIFICATION Chapter 5
134
FIGURE 5.1-4
TABLE 5.1-3 VARIATION OF MOMENT OF INERTIA ALONG THE SPAN I1 I2 I3 I4 I5 I6 I7
.4608E+06 .1843E+05 .1843E+05 .1843E+05 .1128E+06 .1128E+06 .1247E+06
.1247E+06 .1128E+06 .1128E+06 .1843E+05 .1128E+06 .1128E+06 .1247E+06
.1247E+06 .1128E+06 .1128E+06 .1843E+05 .1128E+06 .1128E+06 .1247E+06
.1247E+06 .1128E+06 .1128E+06 .1843E+05 .1128E+06 .1128E+06 .1247E+06
.1247E+06 .1128E+06 .1128E+06 .1843E+05 .1128E+06 .1128E+06 .1247E+06
.1247E+06 .1128E+06 .1128E+06 .1843E+05 .1128E+06 .1128E+06 .1247E+06
.1247E+06 .1128E+06 .1128E+06 .1843E+05 .1843E+05 .1843E+05 .4608E+06
X2 X3 X4 X5 X6 X7 X8 .4000E+01 .4000E+01 .4000E+01 .2160E+03 .2774E+03 .2774E+03 .2880E+03 .1063E+02 .1063E+02 .7200E+02 .3600E+03 .4214E+03 .4214E+03 .4320E+03 .1063E+02 .1063E+02 .7200E+02 .3600E+03 .4214E+03 .4214E+03 .4320E+03 .1063E+02 .1063E+02 .7200E+02 .3600E+03 .4214E+03 .4214E+03 .4320E+03 .1063E+02 .1063E+02 .7200E+02 .3600E+03 .4214E+03 .4214E+03 .4320E+03 .1063E+02 .1063E+02 .7200E+02 .3600E+03 .4214E+03 .4214E+03 .4320E+03 .1063E+02 .1063E+02 .7200E+02 .2840E+03 .2840E+03 .2840E+03 .2880E+03 Notes: Units are in inches, each line refers to one of the spans
Data extracted from data block (888 245) of file CS.DAT
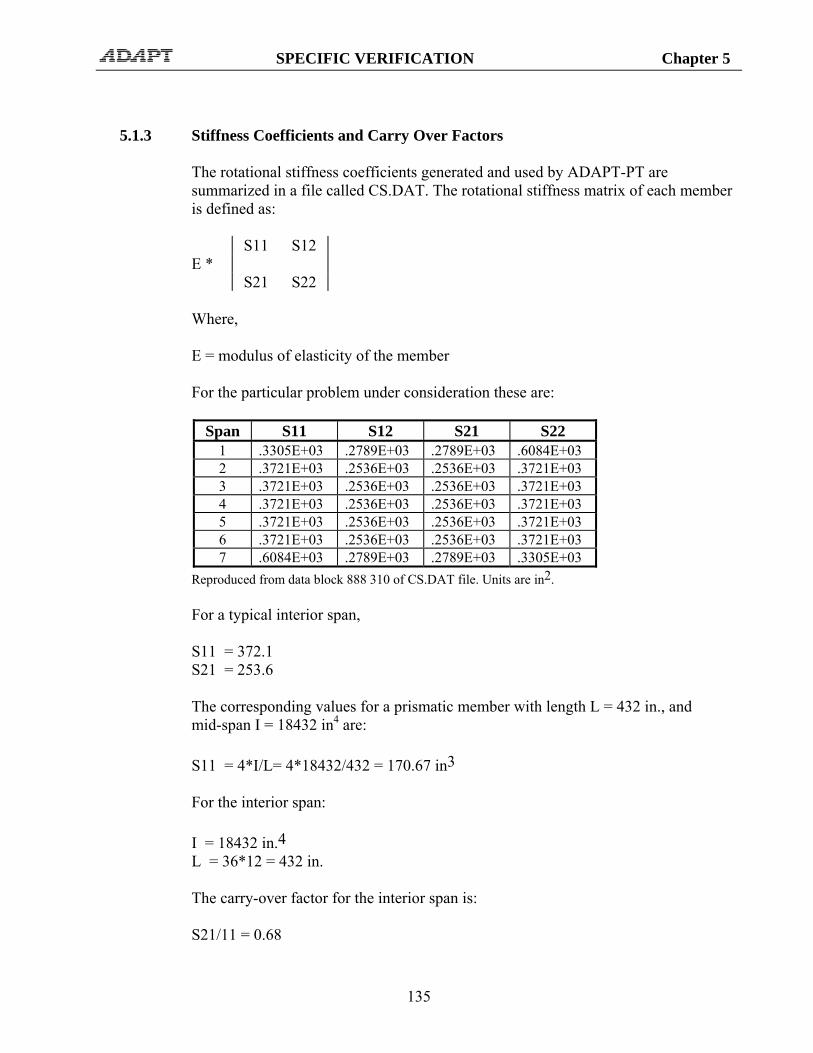
SPECIFIC VERIFICATION Chapter 5
135
5.1.3 Stiffness Coefficients and Carry Over Factors
The rotational stiffness coefficients generated and used by ADAPT-PT are summarized in a file called CS.DAT. The rotational stiffness matrix of each member is defined as: S11 S12 E * S21 S22 Where, E = modulus of elasticity of the member For the particular problem under consideration these are:
Span S11 S12 S21 S22 1 .3305E+03 .2789E+03 .2789E+03 .6084E+03 2 .3721E+03 .2536E+03 .2536E+03 .3721E+03 3 .3721E+03 .2536E+03 .2536E+03 .3721E+03 4 .3721E+03 .2536E+03 .2536E+03 .3721E+03 5 .3721E+03 .2536E+03 .2536E+03 .3721E+03 6 .3721E+03 .2536E+03 .2536E+03 .3721E+03 7 .6084E+03 .2789E+03 .2789E+03 .3305E+03
Reproduced from data block 888 310 of CS.DAT file. Units are in2. For a typical interior span, S11 = 372.1 S21 = 253.6 The corresponding values for a prismatic member with length L = 432 in., and mid-span I = 18432 in4 are: S11 = 4*I/L= 4*18432/432 = 170.67 in3 For the interior span: I = 18432 in.4 L = 36*12 = 432 in. The carry-over factor for the interior span is: S21/11 = 0.68

SPECIFIC VERIFICATION Chapter 5
136
The following table is a summary of carry-over factors from the three sources:
Carry-Over factor PTI ADAPT SAP-IV Interior span 0.68 0.68 0.68 Exterior span - at A 0.84 0.84 0.84 at B 0.44 0.46 0.46
Note: The coefficient for a prismatic member is 0.5.
5.2 REDUCTION OF MOMENTS TO FACE-OF-SUPPORT Moments computed from the matrix formulation refer to the structural system line (centerline of support). Spans, however, are commonly checked at the face-of-support. Thus centerline moments computed are adjusted to the face-of-support for design. The face-of-support moment is calculated strictly from the statics of each span. For a cantilever example, consider the right end of the two-way slab example given at the end of section 5.9 of this volume and identified as (MNL5-2M). The calculation for moment at face-of-support for dead loading is given below. The dimensions and loading are illustrated in Fig 5.2-1(a). Centerline moment: M = 13.5*5.50*0.92/2 = 30.07 kNm (ADAPT 30.07,B5.1, C3 OK) Note that the tributary of the cantilever is 5.50 m. Moment at face-of-support: M = 13.5*5.50* (0.9 - 0.2/2)2/2 = 23.76 kNm (ADAPT 23.76, B6.1, C3 OK) For a span condition, consider the first span of the same example. The pertinent parameters for the first span are extracted from the solution and entered on Fig. 5.2-1(b). At left of span: Mreduced = 143.83*0.2/2 - 13.5*5.5*[(0.2/2)2/2] = 14.01 kNm (ADAPT 14.01,B6.1, C3) At right of span: Mreduced = -400.42 + 283.11*0.225 - 13.5*5.50*0.2252/2 = -338.60 kNm (ADAPT 338.60,B6.1, C5)

SPECIFIC VERIFICATION Chapter 5
137
At center: Solution already includes added support stiffness adjustment.
FIGURE 5.2-1

SPECIFIC VERIFICATION Chapter 5
138
TABLE 5.2-1 ADJUSTMENT OF MOMENTS FOR A TWO-WAY SYSTEM (kNm)*
ADAPT Hand Calculation
Reference Number
First span Left 14.01 14.01 B6.1, C3 Right -338.60 -338.60 B6.1, C5
*ADAPT-PT solution from case MNL5-2M ,section 5.9 of this chapter. 5.2.1 Secondary Moments
Secondary moments vary linearly from support to support. The magnitude at the face of support is determined from linear interpolation of centerline moments. Consider the secondary moments of the first span of the two-way system (MNL5-2M) given at the end of Section 5.9 of this chapter. Centerline secondary moments are listed in MSECSF.DAT file. See also Fig. 5.2-1. Msec at left of second support = -5.75*8.90 = -51.175 kNm (ADAPT 51.175,
MSECSF.DAT) At left of span: Mreduced = 51.175*(0.2/2)/5.75 = 0.89 kNm At right of span: Mreduced = 51.175/5.75*(5.75 - 0.45/2) = 49.17 kNm At center: Solution already includes added support stiffness adjustment. TABLE 5.2-2 ADJUSTMENT OF SECONDARY
MOMENTS (kNm)* ADAPT Hand
Calculation Reference Number
First span Left 0.89 0.89 B8.3,C2 Right 49.17 49.17 B8.3,C4
*ADAPT-PT solution from case MNL5-2M

SPECIFIC VERIFICATION Chapter 5
139
5.3 BALANCED LOADING This section demonstrates:
• The correct generation of balanced loading by ADAPT-PT • The method and correct implementations of the average upward force (Wbal)
reported by the program 5.3.1 Generation of Balanced Loading
For each span the balanced loading is calculated from the geometry of the tendon and its force. Fig. 5.3-1 illustrates the balanced loading for a reversed parabolic tendon. Observe that the loading consists of four partially distributed parts W1 through W4. Other profiles may involve concentrated loadings as it is described in Chapter 3, Analysis and Design Background, Volume II of the manual. During the execution of the program, the force in a given span, as well as the tendon geometry may change from one iteration cycle to the next. Consequently, the values of the balanced loading forces will change between successive iterations. At the conclusion of the computations, ADAPT-PT records the final set of the balanced loading used in a text file (WBAL.DAT). Also it is provided in the detailed report under block 22. In addition to the detailed set of balanced loading used in the computations, a representative value is also calculated for each span. This representative value is listed in the summary report. Its calculation and significance is discussed later in Section(B). It is emphasized that in addition to the forces W1 through W4 shown in the Fig. 5.3-1 from one tendon, a span may be subjected to balanced loads from other tendons. These may be due to added tendons that are anchored in the span or due to a shift in the neutral axis of the beam/slab at the supports or along the span length. Consider the fourth span of the one-way slab example from Chapter 3, Volume 2 of ADAPT-PT manual. This example is identified by the code name (MNL5-1c). Excerpt from the ADAPT-PT printout is attached with this section. The tendon profile used is a reversed parabola as shown in Fig. 5.3-1 and indicated in (B7.1, C2). The parameters of this tendon are extracted from the report of ADAPT-PT, data blocks 7.1 and 7.2.

SPECIFIC VERIFICATION Chapter 5
140
FIGURE 5.3-1
Force in tendon: F = 500.00 kN (B7.2,C2) Span: L = 9.00 m (B2.1,C3) Horizontal distances: X1 = 0.1*9.00 = 0.90 m (0.1 from B7.1, C2) X3 = 0.1*9.00 = 0.90 m Vertical distances: Y1 = 169 mm (B7.2, C3) Y2 = 100 mm (B7.2, C6) Y3 = 31 mm (B7.2, C5) The balanced loads W1 through W4 generated by ADAPT-PT are reproduced in the following from the balanced loading file: W1 Total drape for left of span = 169 - 31 = 138 mm Drape over length X1: a = (0.9/4.5)*138 = 27.6 mm W1 = 2*F*a/X12
= 2*500*0.0276/0.92
= 34.074 kN/m (ADAPT 34.074 kN/m,
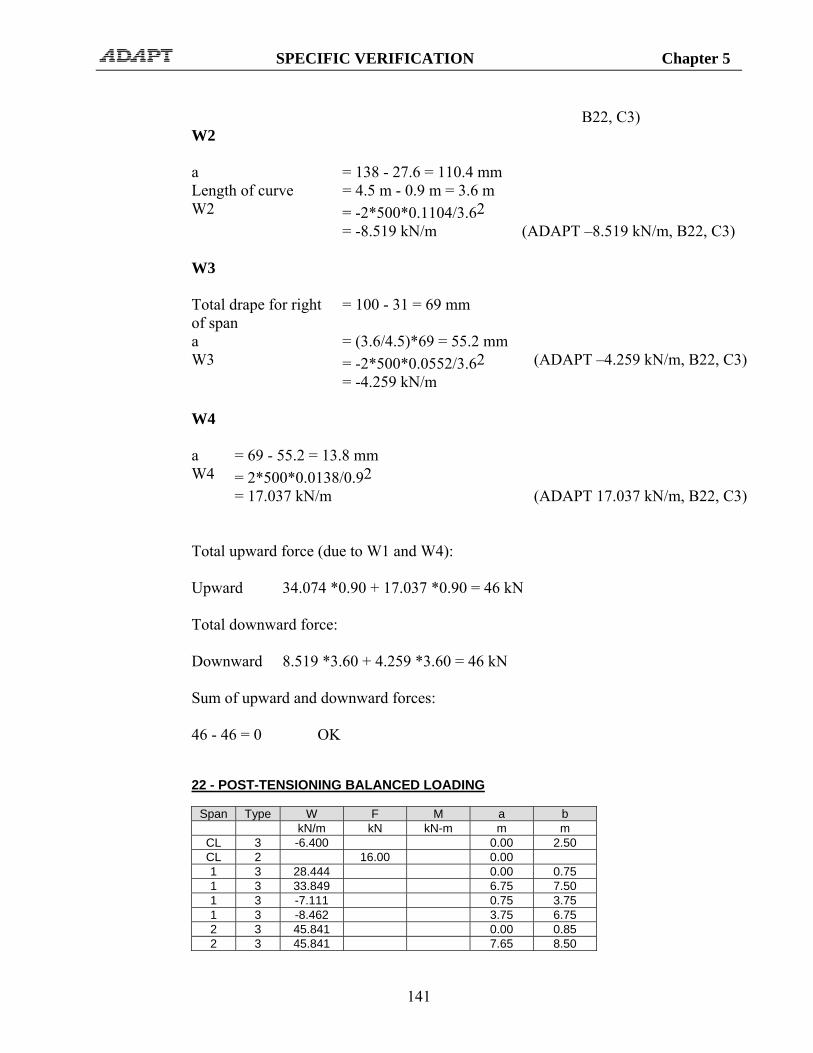
SPECIFIC VERIFICATION Chapter 5
141
B22, C3) W2 a = 138 - 27.6 = 110.4 mm Length of curve = 4.5 m - 0.9 m = 3.6 m W2 = -2*500*0.1104/3.62 = -8.519 kN/m (ADAPT –8.519 kN/m, B22, C3) W3 Total drape for right of span
= 100 - 31 = 69 mm
a = (3.6/4.5)*69 = 55.2 mm W3 = -2*500*0.0552/3.62 (ADAPT –4.259 kN/m, B22, C3) = -4.259 kN/m W4 a = 69 - 55.2 = 13.8 mm W4 = 2*500*0.0138/0.92 = 17.037 kN/m (ADAPT 17.037 kN/m, B22, C3) Total upward force (due to W1 and W4): Upward 34.074 *0.90 + 17.037 *0.90 = 46 kN Total downward force: Downward 8.519 *3.60 + 4.259 *3.60 = 46 kN Sum of upward and downward forces: 46 - 46 = 0 OK
22 - POST-TENSIONING BALANCED LOADING
Span Type W F M a b kN/m kN kN-m m m
CL 3 -6.400 0.00 2.50 CL 2 16.00 0.00 1 3 28.444 0.00 0.75 1 3 33.849 6.75 7.50 1 3 -7.111 0.75 3.75 1 3 -8.462 3.75 6.75 2 3 45.841 0.00 0.85 2 3 45.841 7.65 8.50

SPECIFIC VERIFICATION Chapter 5
142
2 3 -11.460 0.85 4.25 2 3 -11.460 4.25 7.65 3 3 32.941 0.00 0.85 3 3 32.941 7.65 8.50 3 3 -8.235 0.85 4.25 3 3 -8.235 4.25 7.65 4 3 34.074 0.00 0.90 4 3 17.037 8.10 9.00 4 3 -8.519 0.90 4.50 4 3 -4.259 4.50 8.10 1 3 12.267 6.00 7.50 1 2 -18.40 6.00 3 3 4.775 0.00 1.70 3 2 -8.12 1.70
5.3.2 Average Balanced Loading For a precise definition of the loads from post-tensioning, the table of balanced loading generated by ADAPT-PT and described in the preceding should be consulted. For a quick estimate of the magnitude of the balanced loading, the concept of the AVERAGE BALANCED LOADING can be used. This is defined as the sum of all upward forces from post-tensioning divided by span length. The average balanced loading is reported under balanced loading "Wbal" in data block 7.2, column 8. It is emphasized that the average balanced loading is not used in ADAPT-PT’s computations. Its value is listed to provide a basis for approximate comparison. Consider the example treated in the previous Section A. The total upward force is 46.00 kN. For the span length of 9.00 m, the average balanced loading is given by: Wbal = 46.00/9.00 = 5.111 kN/m (ADAPT 5.111, B7.2, C8 OK)
5.4 REQUIRED POST-TENSIONING FORCE In addition to a detailed report, ADAPT-PT lists the post-tensioning force required at the critical locations in each span. The “post-tensioning force required” is defined as the minimum force necessary to meet the design criteria stated in the input data. These are:
• Limiting the maximum tensile stresses to a user pre-defined value • Providing a minimum average pre-compression • Limiting the percentage of dead load balanced to a pre-defined range • Limiting the maximum spacing between tendons to a pre-defined multiple of
member thickness
The following verifies the implementation of these criteria for the fourth span of the one-way slab example (MNL5-1C) given at the end of section 5.9 of this manual.

SPECIFIC VERIFICATION Chapter 5
143
5.4.1 Based on Stress Criteria
The required post-tensioning computed by ADAPT-PT for the fourth span of the one-way example is 416.63 kN at in-span (B7.4, C3). This force is determined, such as to limit the maximum tensile stress under service condition to 0.5*(f'c)1/2 (Data Block 1). The verification is carried out by assuming a force of 416.63 kN, and demonstrating that the resulting tensile stress is 0.50*(f'c)1/2. Tensile stress limit = 0.5*(28)1/2 = 2.646 N/mm2 Post-tensioning = 416.63 kN Cross sectional area A = 200.0*103 mm2 (B4.1, C2) Section modulus S = 6.67*106 mm3 (B4.1, C3 & C4) Combined dead and live moments M
= 57.47 kNm (B6.1 &6.2, C4)
Post-tensioning force F = 500 kN (B7.2, C2) The applicable post-tensioning moment Mb is determined by prorating the post-tensioning moment (–31.14 kNm (B7.6, C3)) for a force of 500 kN to the reported value of 416.63 kN. Mb = -(416.63 /500)* 31.14 = -25.95 kNm During the execution of the program the tendon heights and the forces of a span is likely to change with respect to other spans. Consequently, the required force calculated in one iteration cycle of the computation may be different from the force computed in the subsequent cycle. However, for the completed and reported output, as is the case in this verification, the proration is valid Stress = Average Compression + Bending Stresses Stress = -416.63*103/2.00*105 +
[(57.47 - 25.95)*106]/6.67*106
= 2.645 N/mm2 (compare to 2.646 N/mm2, OK)
5.4.2 Providing an Average Minimum Compression
For the same example as in (A), the minimum compression specified by the user is 0.85 N/mm2 (B1). Hence, Force required = Area * Average Compression = 0.85*2.00*105 = 170 kN (ADAPT 170,B7.4, C6 OK)

SPECIFIC VERIFICATION Chapter 5
144
5.4.3 Required Force Based on Tendon Spacing The maximum tendon spacing specified is eight times the slab thickness (see data block 1). If each tendon consists of a minimum of one strand, the force required is Force per Tendon = Area * Effective Stress Area of strand = 99 mm2 (B1)
The effective stress is given as data input equal to 1200 N/mm2 (B1). Force per tendon = 99.0*1200 = 118.8 kN Spacing = 8*200 = 1.60 m (slab thickness = 200 mm) Force per meter = 118.8/1.6 = 74.25 kN/m
5.5 SERVICE STRESSES Service stresses are due to dead load, live load and post-tensioning forces. For stress check, these are combined with a code or user defined factors. The factors selected for the combination are reported by the program in the Project Design Parameters and Load Combination of the concise report. In the following the stresses at in-span and face-of-support of the two-way slab example (MNL5-2M) given at the end of section 5.9 of this manual are verified. Fig. 5.5-1(a) shows the central span of the example under consideration. In addition to the face-of-support, ADAPT-PT calculates the stresses at 20 interval points along each span. At each interval point dead, live and post-tensioning moments are combined, and the sum is applied to the entire cross-section of tributary. In the case of the face-of-support, the default of the program is the actual face of column or the wall support. However, you have the option to override the program’s default and specify a new distance. In either case, the selection is reported by ADAPT-PT in (B2.7,C2). In the current example, the reported 450 mm support width means that the stress is checked at a distance of 450/2 = 225 mm from the support centerline (see figure). The largest value computed for the intervals in the support region is selected and reported by the program in data block 7.5. It is emphasized that at each stress check location the actual cross section for the entire tributary (Fig. 5.5-1(b) and Fig. 5.5-1(c)) together with the applicable post-tensioning forces are considered. A tendon terminated in a span, as is indicated in the figure, is assumed to have continued and anchored beyond the next support at a distance of (span/5). Hence, the 1650 kN of post-tensioning specified for the third span of the example is taken as active when checking stresses at the right support of the second span. For the in-span and left support only 1238 kN are considered.
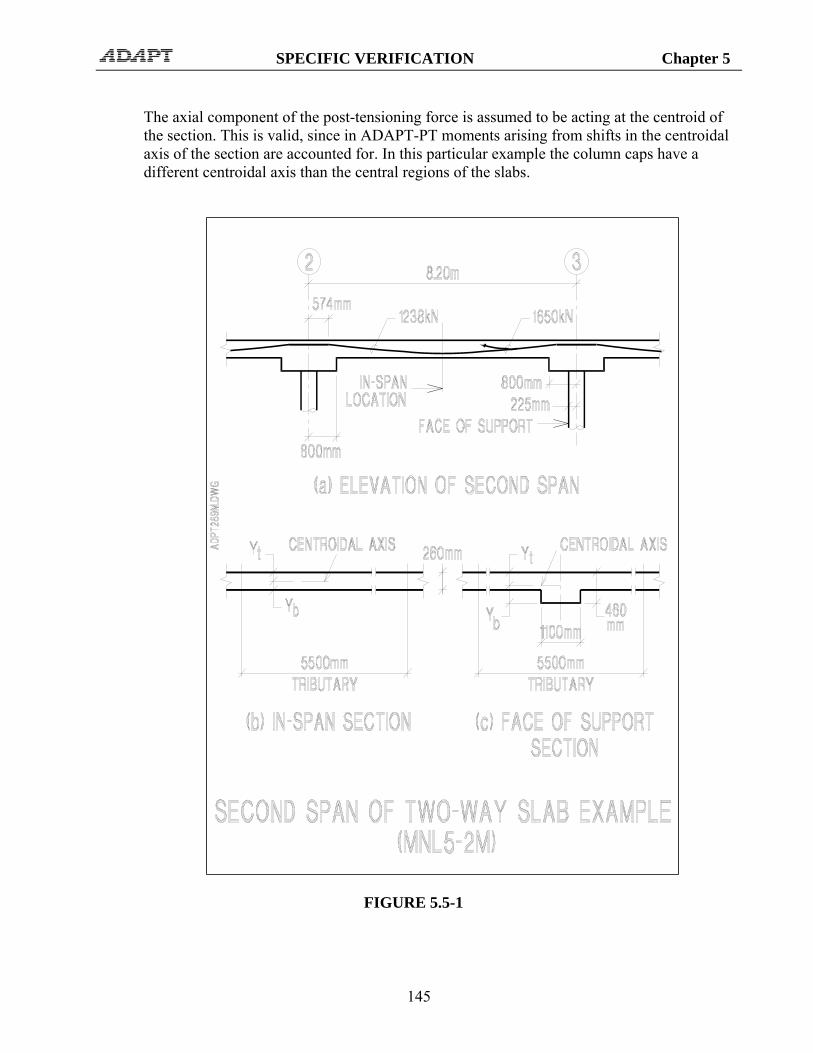
SPECIFIC VERIFICATION Chapter 5
145
The axial component of the post-tensioning force is assumed to be acting at the centroid of the section. This is valid, since in ADAPT-PT moments arising from shifts in the centroidal axis of the section are accounted for. In this particular example the column caps have a different centroidal axis than the central regions of the slabs.
FIGURE 5.5-1

SPECIFIC VERIFICATION Chapter 5
146
TABLE 5.5-1 STRESSES IN SECOND SPAN OF TWO-WAY SLAB EXAMPLE MNL5-2M
*Abbreviation refers to data blocks and columns in ADAPT-PT printout of MNL5-2M, section 5.9 TABLE 5.5-2 SUMMARY OF STRESS CALCULATIONS (N/mm2)
Location ADAPT Hand Calculation
Reference Number
Top of in-span -3.38 -3.38 B7.5,C4 Bottom of in-span 1.64 1.65 B7.5,C5 Top at support 1.66 1.67 B7.5,C6 Bottom at support -5.96 -5.95 B7.5,C7
Description Span Right Support
Reference Number*
GEOMETRY Area (mm2) 1.43*106 1.65*106 B4.2, C3
Moment of inertia (mm4) 0.81*1010 0.19*1011 B4.2, C4 Yt (mm) 130 161 B4.2, C6 Yb (mm) 130 299 B4.2, C5 MOMENTS Dead and live (kNm) 244.26 -576.80 B6.1 ,B6.2 Balanced (PT) (kNm) -88.69 264.20 B7.6,C3-4 Net moment (kNm) 155.57 -312.60 POST-TENSIONING FORCE P (kN) 1238 1650 B7.2, C2 STRESSES Axial P/A (N/mm2)
In-span = 1.238*106/1.43*106 = -0.866 B7.2,C7
Support = 1.65*106/1.65*106= -1.00 Bending M*Y/I In-span +155.57*106*130/0.81*1010 +2.511 Support 312.60*106*161/0.19*1011 = 2.666
-312.60*106*299/0.19*1011 = -4.952 Net stresses: In-span Top: -0.866 – 2.511= -3.377 B7.5,C4 Bottom: -0.866 + 2.511 = 1.645 B7.5,C5 Support Top: -1.000 + 2.666= 1.666 B7.5,C6 Bottom: -1.000 – 4.952= -5.952 B7.5,C7

SPECIFIC VERIFICATION Chapter 5
147
5.6 SECONDARY MOMENTS Secondary moments are the consequence of the support restraints to free movement of a member under prestressing. The background for the secondary moments is given in Chapter 3-Analysis and Design Background, Volume II of the manual. ADAPT-PT employs the direct definition of secondary actions (moments and shears), as stated above, when calculating the secondary moments. In the following, first the direct method used in ADAPT-PT is verified using the two-way slab example (MNL5-2M). This is then checked against an alternative method. The method adopted by ADAPT-PT is more general and capable of extension to more complex applications. Observe a typical frame as shown in Chapter 3, Volume II (Fig. 3.8.2-1). The frame is acted upon by dead load, live load and forces exerted by the post-tensioning tendon. Fig. 3.8.2-2 shows the free body diagram of the beam/slab member of the frame due to the post-tensioning forces only. In the free body diagram shown, by definition, the actions at the supports are the secondary actions, since these are the actions induced by the post- tensioning tendon. Hence, at any distance Xi, as shown in Fig. 3.8.2-3, the secondary shear is the algebraic sum of all reactions, and the secondary moment is the moment of all actions. The governing relationship is expressed in the figure. The secondary actions of the two-way slab example are quoted from ADAPT-PT report (data block 7.6) and entered in Fig. 5.6-1. The secondary actions constitute a self-equilibrating force system. Verify the validity of the solution by the sum of reactions being zero. Sum of reactions = 8.90 - 8.932 – 8.854 + 8.886 = 0.0 kN (OK) Likewise, the sum of moments of the secondary action must be zero. Moment at left of support 2: Msec = 8.90*5.75 = 51.175 kNm At right of support 2: Msec = 51.175 - 9.75 = 41.425 kNm The remainders of the moments are calculated from the right of the frame to reduce accumulation of errors due to numerical computations.

SPECIFIC VERIFICATION Chapter 5
148
The secondary moments given in ADAPT-PT are reduced to the face-of-support if dead and live moments are also reduced. The reduction to face is by proration, since the secondary moments vary linearly from support to support. Secondary moment at left of support 3: Msec = 41.16 + [(0.45/2)/8.20]*(41.43 - 41.16) = 41.17 kNm (ADAPT 41.17, B8.3, C4, OK) Secondary moment at mid-length of second span: Msec = 0.5*(41.43+ 41.17) = 41.30 kNm (ADAPT 41.29, B8.3, C3, OK) Using the alternative method, the secondary moments at the locations used in the preceding are recalculated in the following: Msec = Mbal - P*e At center of first span: Mbal = -104.40 kNm (B7.6, C3) P = 1238 kN (B7.2, C2) e = 25 - 130 = -105 mm (B7.2,C3-4) Note that eccentricity above neutral axis is taken as positive. Msec = -104.40 + 1238*105/1000 = 25.59 kNm (ADAPT 25.59, 8.3, C3, OK)

SPECIFIC VERIFICATION Chapter 5
149
FIGURE 5.6-1
At the left of third support: Mbal = 264.2 kNm (B7.6, C4) The file PTBMSF.DAT is generated by ADAPT-PT contains the distribution of post-tensioning moments and shears. The moment of 265.00 kNm given in the output (B7.6, C4) is already reduced to face-of-support.

SPECIFIC VERIFICATION Chapter 5
150
P = 1650 kN (B7.2, C2) e = 235 + 200 – 299.33 = 135.67 mm (B7.2,C5, B4.2,C4) Msec = 264.2 - 1650*135.67/1000 = 40.34 kNm (ADAPT 41.17, Fig. 5.6-1)
5.7 FACTORED MOMENTS AND DESIGN MOMENTS In the terminology of ADAPT-PT factored moments and design moments are synonymous and use the symbol Mu. The program checks and satisfies the following requirement. Demand Moment <= Design Capacity Depending on the building code specified, in the calculation of design capacity, the program uses “strength reduction factor φ “ or material factors. For the ACI version, the relationship used is: Mu <= φ*Mn where, Mu = factored moment Mn = nominal moment, defined as the ultimate moment a section can develop φ = code specified strength reduction factor Using ACI-05, factored moments are computed from the following relationship: Mu = 1.2*Md + 1.6*Ml + 1.0*Msec The factors 1.2, 1.6 and 1.0 are the default values used by ADAPT-PT. However, the user may select his/her own factors. Also user can enter unto four load combinations. Factors used in the computations, regardless whether they are ADAPT-PT's default values or user's selection, are given in the concise report under block A. Data block 8 gives the envelope of all the combinations. The moments for each combination are reported in BLK10.DAT file in the subdirectory, where data was executed. The calculated design moments are listed in block 8. The values listed are based on gross cross-section and linear elastic material properties. Hence they are the elastic design moments. The following is the calculation of factored moments for the three-span beam example (MNL5-3M) given at the end of section 5.9 of this manual.

SPECIFIC VERIFICATION Chapter 5
151
TABLE 5.7-1 CALCULATION AND COMPARISON OF DESIGN MOMENTS (kNm)
Moments Hand Calculation
ADAPT Reference Number
First span moment Md = 1.2*746.40 895.68 B6.1,C4 Ml = 1.6*213.30 341.28 B6.2,C4 Msec = 1.0*372.50 372.50 B8.3,C3 Mu = (sum of the above) 1609.46 1609.46 B8.1,C4 Second support (left side) Md = 1.2*-1066 -1279.20 B6.1,C4 Ml = 1.6*-304.60 -487.36 B6.2,C6 Msec = 1.0*612.40 612.40 B8.3,C4 Mu = (sum of the above) -1154.16 -1154.16 B8.1,C6
Values are from example MNL5-3M
5.8 MILD REINFORCEMENT 5.8.1 Reinforcement Required for Strength
ADAPT-PT checks the reinforcement requirements at 1/20th points along each span, in addition to the face-of-supports. At each location, the design capacity of the design section is first calculated. If the capacity does not equal or exceed the design moment, the program calculates the reinforcement necessary to cover the shortfall. The reinforcement calculated is reported under the columns marked with "Ultimate" referring to ultimate strength rebar (data blocks 10.1 through 10.2 of printout). Herein, the first field and the second support rebar of the beam example MNL5-3M are verified. Refer the example and the ADAPT-PT report given at the end of the section 5.9 of this chapter. The geometries of the field and support sections and the locations of the post-tensioning and rebar are extracted from the input data of Chapter 3 and shown in Fig. 5.8-1.
5.8.1.1 ACI Strength Requirements
(i) At Support
Mu = -1154.16 kNm (B8.1,C6) P = 1660 kN, post-tensioning force (B7.2,C2) fse = 1200 N/mm2, final average stress (B1) Aps = area of PT tendon
= 1660 *1000/1200 = 1383 mm2 which is 14 strands 12.7 mm
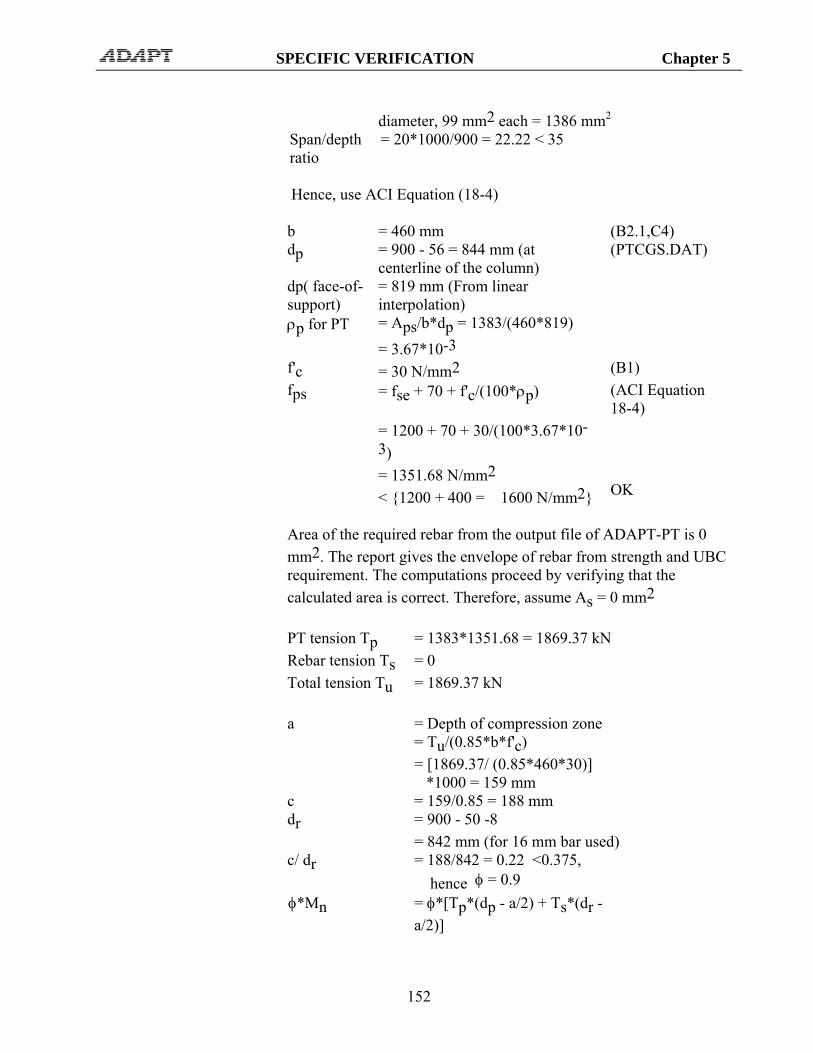
SPECIFIC VERIFICATION Chapter 5
152
diameter, 99 mm2 each = 1386 mm2 Span/depth ratio
= 20*1000/900 = 22.22 < 35
Hence, use ACI Equation (18-4)
b = 460 mm (B2.1,C4) dp = 900 - 56 = 844 mm (at
centerline of the column) (PTCGS.DAT)
dp( face-of- support)
= 819 mm (From linear interpolation)
ρp for PT = Aps/b*dp = 1383/(460*819)
= 3.67*10-3
f'c = 30 N/mm2 (B1) fps = fse + 70 + f'c/(100*ρp) (ACI Equation
18-4) = 1200 + 70 + 30/(100*3.67*10-
3)
= 1351.68 N/mm2 < {1200 + 400 = 1600 N/mm2}
OK
Area of the required rebar from the output file of ADAPT-PT is 0 mm2. The report gives the envelope of rebar from strength and UBC requirement. The computations proceed by verifying that the calculated area is correct. Therefore, assume As = 0 mm2
PT tension Tp = 1383*1351.68 = 1869.37 kN Rebar tension Ts = 0 Total tension Tu = 1869.37 kN
a = Depth of compression zone = Tu/(0.85*b*f'c) = [1869.37/ (0.85*460*30)]
*1000 = 159 mm
c = 159/0.85 = 188 mm dr = 900 - 50 -8 = 842 mm (for 16 mm bar used) c/ dr = 188/842 = 0.22 <0.375,
hence φ = 0.9
φ*Mn = φ*[Tp*(dp - a/2) + Ts*(dr - a/2)]

SPECIFIC VERIFICATION Chapter 5
153
φ*Mn = 0.9*[1869.37 *(819 - 159/2)] /1000
= 1244.16 kNm (ADAPT 1154.16 kNm, B8.1, C6)
(ii) At In-Span
Mu = 1609.46 kNm (B8.1, C4) P = 1660 kN, post-tensioning force (B7.1, C2)
fse, Aps and the applicable ACI equation are same as at support.
b = 5190 mm (B2.1,C6) dp = 820 mm ρ for PT = Aps/b*dp = 1383/(5190*820)
= 3.25*10-4
fps = 1200 + 70 + 30/(100*3.25*10-4) = 2193.08 N/mm2
> {1200 + 400 = 1600 N/mm2},
Hence, use fps = 1600 N/mm2 Area of the required rebar from the output of ADAPT-PT is 0 mm2 (from Section 29, X=10m). Therefore, assume As = 0 mm2.
PT tension Tp
= 1383*1600 = 2212.80 kN
Rebar tension Ts
= 0 kN
Total tension Tu
= 2212.80 kN
a = 2212.80*1000/(0.85*5190*30)
= 16.72 mm < 120 mm OK
c = 16.72 /0.85 = 19.67 mm dr = 900 - 50 -8 = 842 mm (for 16 mm bar used) c/ dr = 19.67/842 = 0.023 <0.375,
hence φ = 0.9
φ*Mn = 0.9*[2212.80*(820 – 16.72/2) ]/1000
= 1616.40 kNm (ADAPT

SPECIFIC VERIFICATION Chapter 5
154
1609.46, B8.1, C4)
FIGURE 5.8-1
5.8.1.2 UBC’s Strength Requirement
UBC –1997 Section 2618 requires that one-way slabs and beams reinforced with unbonded post-tensioning be designed to develop a nominal capacity (Mn) to carry their self-weight plus 25 percent of unreduced live loading by means other than the primary post-tensioning, using a strength reduction factor of 1. This option may be suppressed by users, where UBC does not apply.
The reinforcement calculated by ADAPT-PT for the in-span location of the first span of beam under consideration is 2466 mm2 (B10.1.1, C6). The following is the verification of this reinforcement. The reinforcement

SPECIFIC VERIFICATION Chapter 5
155
calculated for this requirement will be reported under column “Ultimate” in the report.
Demand:
Md = 746.40 kNm (B6.1,C4) Ml = 213.30 kNm (B6.2,C4) Mu = 1*Md + 0.25*Ml = 799.73 kNm
Provided:
Ts = 2322*460 = 1068.12 kN dr = 842 mm (from preceding Section A) b = 5190 mm a = 1068.12*103/(0.85*5190*30)
= 8.07 mm < 120 mm (OK)
φMn = 0.9*1068.12*(842 – 8.07/2) = 805.54 kNm Required Mu= 799.73 kNm OK
φ is 1 for UBC, but conservatively program using 0.9.
5.8.2 Code Specified Minimum Reinforcement Prestressed members made with unbonded tendons are checked for the minimum mild reinforcement stipulated in respective codes. The requirements are different for the one-way and two-way systems. Herein the values obtained for the one-way beam example (MNL5-3M) and the two-way system example (MNL5-2M) (Examples given in the section 5.9 of this manual) are verified. Minimum reinforcement over the supports is generally provided at the top, since this is the face where tension commonly occurs. Where loading and span conditions cause tension at bottom, ADAPT-PT reports the minimum rebar at the bottom. The test used by the program for the location of minimum rebar at the supports is the sign of the governing design moment Mu (B8.1). 5.8.2.1 One-way system
Consider the beam example MNL5-3M. The minimum bonded reinforcement is As = 0.004*A, where A is the area of part of cross section between flexural
tension face and center of gravity of the section in mm2. For minimum rebar calculation, the section associated with bending of the member is used. That is to say the section based on effective width-not the entire tributary (i) For In-Span

SPECIFIC VERIFICATION Chapter 5
156
Yb = Depth of neutral axis = 589.44 mm (B4.1, C7) b = Width of section = 460 mm (B2.1,C4) As = 0.004*589.44*460 = 1084.57 mm2 (ADAPT 1085,
B10.1.1, C7 OK) (ii) Over the Support
Yt = Depth of neutral axis = 310.56 mm
(B4.1, C8)
Width of flange = 2380 mm (B2.3, C2) Width of web = 460 mm (B2.1,C4) Flange thickness
= 120 mm (B2.1, C7)
A = 2380*120 + 460*(310.56 - 120) = 373,258 mm2
As = 0.004*373258 = 1493 mm2 (ADAPT 1493,
B10.1.1, C7, OK)
5.8.2.2 Two-Way System
(i) Over the Support
The area of steel required is As = 0.00075 * Acf where, Acf is the larger gross cross-sectional area of the design strips of the two orthogonal slab frames intersecting at the column in question. Acf may be calculated by multiplying the average of two adjacent spans in one direction by the average slab thickness of the corresponding design strip in the other direction. This calculation is done for both directions and the larger value from the two directions is chosen for design. Consider the second support of two-way example MNL5-2M: h = slab thickness = 260 mm (B2.1,C5) L1 = average of backward and forward
spans in feet
= 0.5*(5.75 + 8.20) (orthogonal direction)

SPECIFIC VERIFICATION Chapter 5
157
= 6.975 m L 2 = 0.5*(2.50 + 3.0) = 2.75 m As = 0.00075 * Acf = 0.00075*260*6975 = 1360.125 mm2 (ADAPT 1360,
B10.1.1, C7 OK) (ii) Field
The field minimum rebar is required if tensile stress under working condition is in excess of 0.166*(f'c)1/2. The tensile force Nc generated in the tensile block is to be carried by mild reinforcement using the following relationship: As = Nc/(0.5*fy) Consider the second span of the two-way slab example MNL5-2M: Tensile stress at bottom = 1.65 N/mm2 (B7.5, Env-2,C5)
1.65 > {0.166*(f'c)1/2= 0.166*(28)1/2 = 0.878 N/mm2} Hence, the rebar required. Compression stress at top = -3.39 N/mm2 (B7.5, Env-2, C4)
FIGURE 5.8.2-1 Depth of neutral axis from bottom (Fig.5.8.2-1): 1.65*260/(1.65 + 3.39) = 85.12 mm Nc = 85.12*1.65*5.5/2 = 386.23 kN

SPECIFIC VERIFICATION Chapter 5
158
(for 5.50 m) As = 386232/(0.5*460) = 1679 mm2 (ADAPT 1675 mm2, B29,
C6) 5.9 BEAM SHEAR
In the following, the one-way shear for the first span of the beam example (MNL5-3M) of this section is verified. The factored moments and shears used in the determination of stirrup requirements are given at 20th points along each span in data block 12 columns 4 and 5. Consider the moments and shears of span one at distances X = 0.18 and X = 19.76 m from the left support. These are the face-of support locations. Note that ACI code recommends checking shear stresses from a distance h/2 (1/2 of depth of member) from the face-of-support. But the program calculates the shear stress at each 1/20th points along the span regardless of the ACI recommendation. Obviously, the 20th point divisions used by the program would not necessarily coincide with h/2 distance from the face-of-support. Where considered critical, the user should follow the checking procedure outlined in the following for the h/2 distance. Using the previous calculations, the stirrup area and spacing are verified at X = 19.76 m: dp dp( face-of- support )
= 844 mm(at centerline of the column) = 819 mm (From linear interpolation)
(B7.2,C6)
Vu*dp/Mu = 509.7*819/(1166*1000) (B12, C4-5) = 0.358 < 1, vc1 = 0.0498*(30)1/2 + 0.358*4.826 = 2N/mm2
{0.166*(f'c)1/2 = 0.87} < {vc1 = 2 N/mm2} < {0.412*(f'c)1/2 = 2.18} Hence, vc1 governs. vu = Vu/(φ*b* dp) = 509.70*1000/(0.75*819*460) = 1.80 N/mm2 Stress ratio vu/vc = 1.80/2.00 = 0.90 vc/2 < vu < vc Minimum reinforcement is required.

SPECIFIC VERIFICATION Chapter 5
159
‘Av’ is the minimum of the following: Av = ( s* 0.33 b w)/ f y = (1000*0.33 * 460)/ 460 = 330 mm2 Av = s * Aps /(80* (f y / f pu ) *d *( b w / d) 0.5 ) = 1000* 1383/(80 *(460/ 1860) * 819*(460/ 819)^0.5 ) = 113.88 mm2 Av = s *b w * f c
0.5 / 16* f y = 1000*460 *30 0.5/ (16* 460 ) = 342 mm2 ∴ Av = 113.88 mm2 (ADAPT 113.90 mm2, B12, C7) Select 16 mm with two legs: 2 * 199 = 398 mm2 Hence, Spacing = 398*1000/ 113.90 = 3494 mm Maximum spacing = 600mm or 0.75*h = 0.75* 900 = 675 mm So s = 600 mm (ADAPT 600 mm, B12, C8) TABLE 5.9-1 SHEAR STRESSES AND THE REQUIRED STIRRUPS FOR
BEAM EXAMPLE MNL5-3M Description X = 0.18 X = 19.76 m Reference
Number Dead load moments (Md) -121.80 -1066.00 B6.1, C3, C5 Live load moments (Ml) -34.79 -304.60 B6.2, C2, C6 Secondary moments (Msec) 131.10 612.40 B8.3, C2,C4 Mu = 1.2Md+1.6Ml+Msec = -70.72 -1154.16 From ADAPT-PT output[considered 1% increase]:
-71.40 -1166.00 B12, C5
Dead load shear (Vd) -225.90 322.40 section_fc_dup.dat Live load shear (Vl) -64.54 92.10 -do- Secondary shear (Vsec) -24.58 -24.58 B7.6, C5, C6 Vu = 1.2Vd+1.6Vl+Vsec = -398.92 509.66 From ADAPT-PT output: -398.90 509.70 B12, C4
Note: Units are in kN-m, kN unless noted otherwise.

SPECIFIC VERIFICATION Chapter 5
160
Example of One-way Slab, Canadian Code &SI units (MNL5-1C)
FIGURE 5.9-1
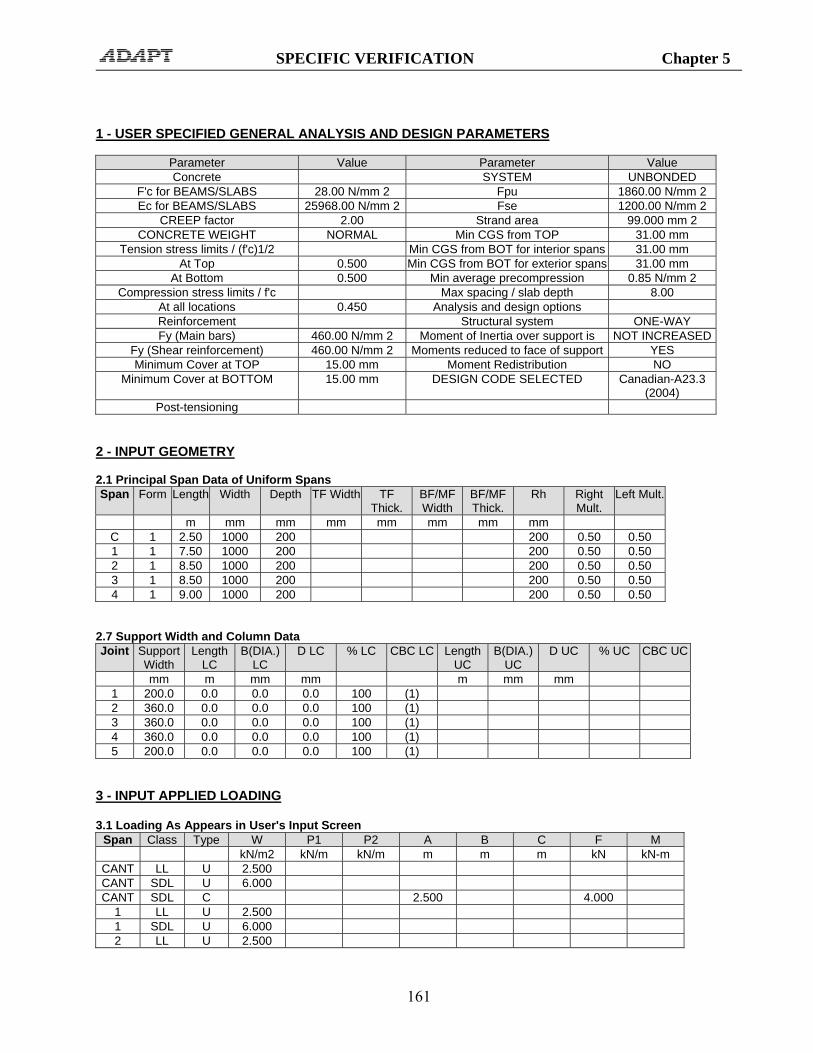
SPECIFIC VERIFICATION Chapter 5
161
1 - USER SPECIFIED GENERAL ANALYSIS AND DESIGN PARAMETERS
Parameter Value Parameter Value Concrete SYSTEM UNBONDED
F'c for BEAMS/SLABS 28.00 N/mm 2 Fpu 1860.00 N/mm 2 Ec for BEAMS/SLABS 25968.00 N/mm 2 Fse 1200.00 N/mm 2
CREEP factor 2.00 Strand area 99.000 mm 2 CONCRETE WEIGHT NORMAL Min CGS from TOP 31.00 mm
Tension stress limits / (f'c)1/2 Min CGS from BOT for interior spans 31.00 mm At Top 0.500 Min CGS from BOT for exterior spans 31.00 mm
At Bottom 0.500 Min average precompression 0.85 N/mm 2 Compression stress limits / f'c Max spacing / slab depth 8.00
At all locations 0.450 Analysis and design options Reinforcement Structural system ONE-WAY Fy (Main bars) 460.00 N/mm 2 Moment of Inertia over support is NOT INCREASED
Fy (Shear reinforcement) 460.00 N/mm 2 Moments reduced to face of support YES Minimum Cover at TOP 15.00 mm Moment Redistribution NO
Minimum Cover at BOTTOM 15.00 mm DESIGN CODE SELECTED Canadian-A23.3 (2004)
Post-tensioning 2 - INPUT GEOMETRY 2.1 Principal Span Data of Uniform Spans Span Form Length Width Depth TF Width TF
Thick. BF/MF Width
BF/MF Thick.
Rh Right Mult.
Left Mult.
m mm mm mm mm mm mm mm C 1 2.50 1000 200 200 0.50 0.50 1 1 7.50 1000 200 200 0.50 0.50 2 1 8.50 1000 200 200 0.50 0.50 3 1 8.50 1000 200 200 0.50 0.50 4 1 9.00 1000 200 200 0.50 0.50
2.7 Support Width and Column Data Joint Support
Width Length
LC B(DIA.)
LC D LC % LC CBC LC Length
UC B(DIA.)
UC D UC % UC CBC UC
mm m mm mm m mm mm 1 200.0 0.0 0.0 0.0 100 (1) 2 360.0 0.0 0.0 0.0 100 (1) 3 360.0 0.0 0.0 0.0 100 (1) 4 360.0 0.0 0.0 0.0 100 (1) 5 200.0 0.0 0.0 0.0 100 (1)
3 - INPUT APPLIED LOADING 3.1 Loading As Appears in User's Input Screen
Span Class Type W P1 P2 A B C F M kN/m2 kN/m kN/m m m m kN kN-m
CANT LL U 2.500 CANT SDL U 6.000 CANT SDL C 2.500 4.000
1 LL U 2.500 1 SDL U 6.000 2 LL U 2.500

SPECIFIC VERIFICATION Chapter 5
162
2 LL C 3.650 9.000 2 SDL U 6.000 2 SDL C 3.650 16.000 3 LL U 2.500 3 LL P 0.750 4.300 6.000 3 SDL U 6.000 4 LL U 2.500 4 SDL U 6.000
NOTE: LIVE LOADING is SKIPPED with a skip factor of 1.00 3.2 Compiled loads
Span Class Type P1 P2 F M A B C Reduction Factor
kN/m kN/m kN kN-m m m m % CL LL U 2.500 0.000 CL SDL U 6.000 CL SDL C 4.000 2.500 1 LL U 2.500 0.000 1 SDL U 6.000 2 LL U 2.500 0.000 2 LL C 9.000 3.650 0.000 2 SDL U 6.000 2 SDL C 16.000 3.650 3 LL U 2.500 0.000 3 LL P 0.750 4.300 6.000 0.000 3 SDL U 6.000 4 LL U 2.500 0.000 4 SDL U 6.000
4 - CALCULATED SECTION PROPERTIES 4.1 Section Properties of Uniform Spans and Cantilevers
Span Area I Yb Yt mm2 mm4 mm mm
CANT 200000.00 0.67E+09 100.00 100.00 1 200000.00 0.67E+09 100.00 100.00 2 200000.00 0.67E+09 100.00 100.00 3 200000.00 0.67E+09 100.00 100.00 4 200000.00 0.67E+09 100.00 100.00
5 - MOMENTS, SHEARS AND REACTIONS 5.1 Span Moments and Shears (Excluding Live Load)
Span Load Case Moment Left
Moment Midspan
Moment Right
Shear Left
Shear Right
kN-m kN-m kN-m kN kN CANT SW ----- ----- 0.00 ----- 0.00
1 SW 0.00 0.00 0.00 0.00 0.00 2 SW 0.00 0.00 0.00 0.00 0.00 3 SW 0.00 0.00 0.00 0.00 0.00 4 SW 0.00 0.00 0.00 0.00 0.00
CANT SDL ----- ----- -28.75 ----- 19.00 1 SDL -28.75 5.71 -44.20 -20.44 24.56 2 SDL -44.20 39.66 -43.25 -34.74 32.26

SPECIFIC VERIFICATION Chapter 5
163
3 SDL -43.25 9.05 -47.02 -25.06 25.94 4 SDL -47.02 37.24 0.00 -32.22 21.78
5.2 Reactions and Column Moments (Excluding Live Load)
Joint Load Case Reaction Moment Lower Column
Moment Upper Column
kN kN-m kN-m 1 SW 0.00 0.00 0.00 2 SW 0.00 0.00 0.00 3 SW 0.00 0.00 0.00 4 SW 0.00 0.00 0.00 5 SW 0.00 0.00 0.00 1 SDL 39.44 0.00 0.00 2 SDL 59.30 0.00 0.00 3 SDL 57.32 0.00 0.00 4 SDL 58.17 0.00 0.00 5 SDL 21.78 0.00 0.00
5.3 Span Moments and Shears (Live Load)
Span Moment Left Max
Moment Left Min
Moment Midspan
Max
Moment Midspan Min
Moment Right Max
Moment Right Min
Shear Left
Shear Right
kN-m kN-m kN-m kN-m kN-m kN-m kN kN CL ----- ----- ----- ----- -7.81 ----- ----- 6.25 1 -7.81 0.00 14.55 -11.34 -25.69 -5.09 -9.74 12.80 2 -25.69 -5.09 25.71 -7.12 -25.97 -4.96 -17.74 16.24 3 -25.97 -4.96 15.65 -10.94 -23.76 -5.65 -13.52 13.61 4 -23.76 -5.65 20.23 -4.99 0.00 0.00 -13.89 10.12
5.4 Reactions and Column Moments (Live Load)
Joint Reaction Max
Reaction Min
Moment Lower
Column Max
Moment Lower
Column Min
Moment Upper
Column Max
Moment Upper
Column Min kN kN kN-m kN-m kN-m kN-m
1 15.99 5.31 0.00 0.00 0.00 0.00 2 30.54 9.03 0.00 0.00 0.00 0.00 3 29.76 8.90 0.00 0.00 0.00 0.00 4 27.50 9.63 0.00 0.00 0.00 0.00 5 10.12 -1.11 0.00 0.00 0.00 0.00
6 - MOMENTS REDUCED TO FACE OF SUPPORT 6.1 Reduced Moments at Face of Support (Excluding Live Load)
Span Load Case
Moment Left
Moment Midspan
Moment Right
kN-m kN-m kN-m CANT SW ----- ----- 0.00
1 SW 0.00 0.00 0.00 2 SW 0.00 0.00 0.00 3 SW 0.00 0.00 0.00 4 SW 0.00 0.00 0.00
CANT SDL ----- ----- -26.88 1 SDL -26.74 5.71 -39.88 2 SDL -38.04 39.66 -37.54 3 SDL -38.84 9.05 -42.45 4 SDL -41.32 37.24 2.15
6.2 Reduced Moments at Face of Support (Live Load)

SPECIFIC VERIFICATION Chapter 5
164
Span Moment Left Max
Moment Left Min
Moment Midspan
Max
Moment Midspan Min
Moment Right Max
Moment Right Min
kN-m kN-m kN-m kN-m kN-m kN-m CL ----- ----- ----- ----- -7.20 ----- 1 -7.91 0.84 14.55 -11.34 -23.43 -3.50 2 -22.54 -5.08 25.71 -7.11 -23.09 -4.97 3 -23.58 -3.40 15.65 -10.94 -21.35 -4.07 4 -21.30 -5.53 20.23 -4.99 -0.11 1.00
7 - SELECTED POST-TENSIONING FORCES AND TENDON PROFILES 7.1 Tendon Profile Tendon A
Span Type X1/L X2/L X3/L A/L CL 1 --- --- 0.000 --- 1 1 0.100 0.500 0.100 --- 2 1 0.100 0.500 0.100 --- 3 1 0.100 0.500 0.100 --- 4 1 0.100 0.500 0.100 ---
7.2 Selected Post-Tensioning Forces and Tendon Drape Tendon A
Span Force CGS Left CGS C1 CGS C2 CGS Right P/A Wbal WBal (%DL) kN mm mm mm mm MPa kN/-
CL 400.000 100.00 --- --- 150.00 2.00 6.400 84 1 400.000 150.00 --- 50.00 169.00 2.00 6.229 104 2 600.000 169.00 --- 31.00 169.00 3.00 9.168 116 3 500.000 169.00 --- 50.00 169.00 2.50 6.588 110 4 500.000 169.00 --- 31.00 100.00 2.50 5.111 85
All Tendons
Span Force Total P/A Total WBal (%DL)
kN MPa CL 400 2 84 1 400 2 104 2 600 3 116 3 500 2.5 110 4 500 2.5 85
Approximate weight of strand: 124.7 Kg 7.4 Required Minimum Post-Tensioning Forces Based on Stress Conditions Based on Minimum P/A
Type Left Center Right Left Center Right kN kN kN kN kN kN
CL ----- ----- 207.03 ----- ----- 170.00 1 204.62 33.61 422.24 170.00 170.00 170.00 2 396.51 496.46 404.61 170.00 170.00 170.00 3 420.25 95.98 402.90 170.00 170.00 170.00 4 393.12 416.63 0.00 170.00 170.00 170.00
7.5 Service Stresses (tension shown positive) Envelope of Service 1
Span Left Top
Max-T
Left Top
Max-C
Left Bot
Max-T
Left Bot
Max-C
Center Top
Max-T
Center Top
Max-C
Center Bot
Max-T
Center Bot
Max-C
Right Top
Max-T
Right Top
Max-C
Right Bot
Max-T
Right Bot
Max-C
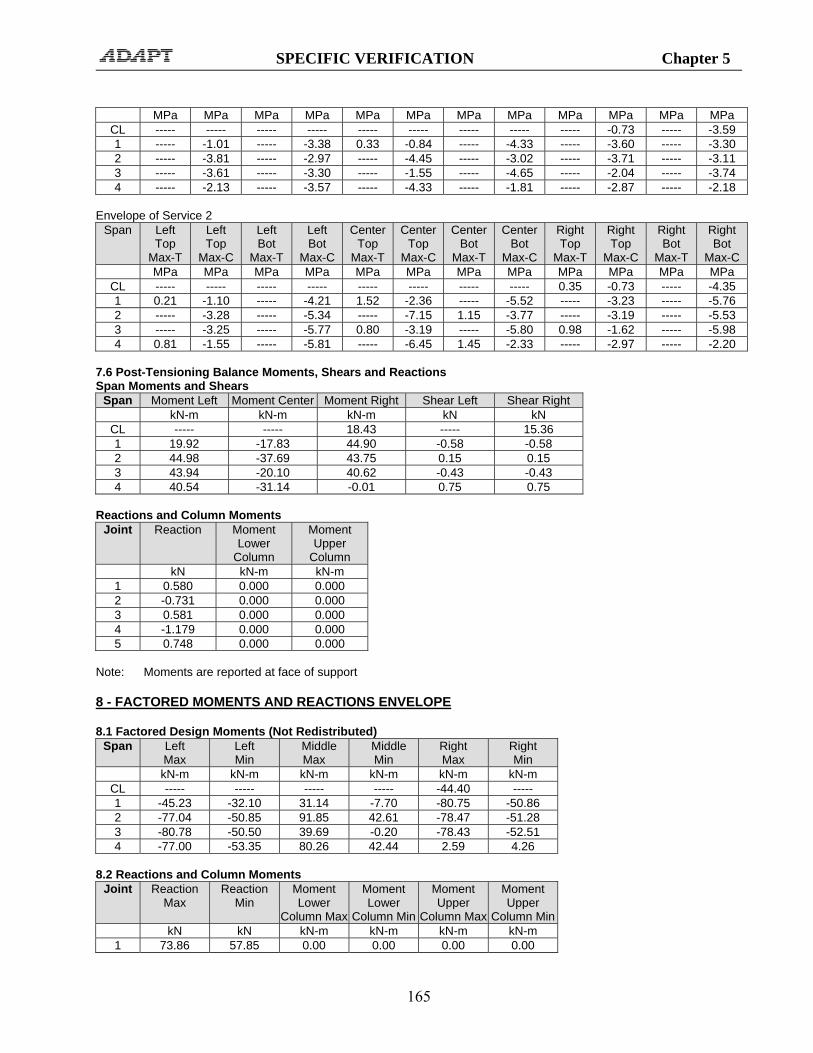
SPECIFIC VERIFICATION Chapter 5
165
MPa MPa MPa MPa MPa MPa MPa MPa MPa MPa MPa MPa CL ----- ----- ----- ----- ----- ----- ----- ----- ----- -0.73 ----- -3.59 1 ----- -1.01 ----- -3.38 0.33 -0.84 ----- -4.33 ----- -3.60 ----- -3.30 2 ----- -3.81 ----- -2.97 ----- -4.45 ----- -3.02 ----- -3.71 ----- -3.11 3 ----- -3.61 ----- -3.30 ----- -1.55 ----- -4.65 ----- -2.04 ----- -3.74 4 ----- -2.13 ----- -3.57 ----- -4.33 ----- -1.81 ----- -2.87 ----- -2.18
Envelope of Service 2
Span Left Top
Max-T
Left Top
Max-C
Left Bot
Max-T
Left Bot
Max-C
Center Top
Max-T
Center Top
Max-C
Center Bot
Max-T
Center Bot
Max-C
Right Top
Max-T
Right Top
Max-C
Right Bot
Max-T
Right Bot
Max-C MPa MPa MPa MPa MPa MPa MPa MPa MPa MPa MPa MPa
CL ----- ----- ----- ----- ----- ----- ----- ----- 0.35 -0.73 ----- -4.35 1 0.21 -1.10 ----- -4.21 1.52 -2.36 ----- -5.52 ----- -3.23 ----- -5.76 2 ----- -3.28 ----- -5.34 ----- -7.15 1.15 -3.77 ----- -3.19 ----- -5.53 3 ----- -3.25 ----- -5.77 0.80 -3.19 ----- -5.80 0.98 -1.62 ----- -5.98 4 0.81 -1.55 ----- -5.81 ----- -6.45 1.45 -2.33 ----- -2.97 ----- -2.20
7.6 Post-Tensioning Balance Moments, Shears and Reactions Span Moments and Shears
Span Moment Left Moment Center Moment Right Shear Left Shear Right kN-m kN-m kN-m kN kN
CL ----- ----- 18.43 ----- 15.36 1 19.92 -17.83 44.90 -0.58 -0.58 2 44.98 -37.69 43.75 0.15 0.15 3 43.94 -20.10 40.62 -0.43 -0.43 4 40.54 -31.14 -0.01 0.75 0.75
Reactions and Column Moments
Joint Reaction Moment Lower
Column
Moment Upper
Column kN kN-m kN-m
1 0.580 0.000 0.000 2 -0.731 0.000 0.000 3 0.581 0.000 0.000 4 -1.179 0.000 0.000 5 0.748 0.000 0.000
Note: Moments are reported at face of support 8 - FACTORED MOMENTS AND REACTIONS ENVELOPE 8.1 Factored Design Moments (Not Redistributed)
Span Left Max
Left Min
Middle Max
Middle Min
Right Max
Right Min
kN-m kN-m kN-m kN-m kN-m kN-m CL ----- ----- ----- ----- -44.40 ----- 1 -45.23 -32.10 31.14 -7.70 -80.75 -50.86 2 -77.04 -50.85 91.85 42.61 -78.47 -51.28 3 -80.78 -50.50 39.69 -0.20 -78.43 -52.51 4 -77.00 -53.35 80.26 42.44 2.59 4.26
8.2 Reactions and Column Moments
Joint Reaction Max
Reaction Min
Moment Lower
Column Max
Moment Lower
Column Min
Moment Upper
Column Max
Moment Upper
Column Min kN kN kN-m kN-m kN-m kN-m
1 73.86 57.85 0.00 0.00 0.00 0.00

SPECIFIC VERIFICATION Chapter 5
166
2 119.20 86.93 0.00 0.00 0.00 0.00 3 116.87 85.58 0.00 0.00 0.00 0.00 4 112.78 85.98 0.00 0.00 0.00 0.00 5 43.15 26.31 0.00 0.00 0.00 0.00
8.3 Secondary Moments
Span Left Midspan Right kN-m kN-m kN-m
1 0.06 2.17 4.25 2 4.32 3.71 3.09 3 3.14 4.90 6.65 4 6.60 3.37 0.07
Note: Moments are reported at face of support 10 - MILD STEEL - NO REDISTRIBUTION 10.1 Required Rebar 10.1.1 Total Strip Required Rebar
Span Location From To As Required Ultimate Minimum m m mm2 mm2 mm2
CL TOP 0.13 2.50 300.00 245.30 300.00 1 TOP 0.00 1.13 300.00 245.40 300.00 1 TOP 2.63 4.88 300.00 0.00 300.00 1 TOP 6.00 7.50 311.90 311.90 300.00 2 TOP 0.00 1.27 311.90 311.90 300.00 2 TOP 2.98 5.53 300.00 0.00 300.00 2 TOP 7.22 8.50 311.90 311.90 300.00 3 TOP 0.00 1.70 311.90 311.90 300.00 3 TOP 2.98 5.53 300.00 0.00 300.00 3 TOP 6.80 8.50 300.00 299.30 300.00 4 TOP 0.00 1.35 300.00 299.30 300.00 4 TOP 3.15 4.05 300.00 0.00 300.00 4 TOP 7.65 9.00 300.00 0.00 300.00 1 BOT 1.50 5.63 300.00 245.40 300.00 2 BOT 1.70 6.80 311.90 311.90 300.00 3 BOT 2.13 6.38 300.00 246.80 300.00 4 BOT 1.80 9.00 300.00 299.30 300.00
10.2 Provided Rebar 10.2.1 Total Strip Provided Rebar
Span ID Location From Quantity Size Length Area m m mm2
CL 1 TOP 0.00 2 10 31.50 200.00 4 2 TOP 7.20 3 10 1.80 300.00
CL 3 TOP 1.33 2 10 30.18 200.00 1 4 BOT 0.83 2 10 5.48 200.00 2 5 BOT 0.97 2 10 6.56 200.00 3 6 BOT 1.40 2 10 5.70 200.00 4 7 BOT 1.05 2 10 7.96 200.00 1 8 BOT 1.58 1 10 4.36 100.00 2 9 BOT 1.82 2 10 4.86 200.00 3 10 BOT 2.25 1 10 4.00 100.00 4 11 BOT 1.95 1 10 6.00 100.00

SPECIFIC VERIFICATION Chapter 5
167
10.2.2 Total Strip Steel Disposition Span ID Location From Quantity Size Length
m m CL 1 TOP 0.00 2 10 2.50 CL 3 TOP 1.33 2 10 1.18 1 1 TOP 0.00 2 10 7.50 1 3 TOP 0.00 2 10 7.50 2 1 TOP 0.00 2 10 8.50 2 3 TOP 0.00 2 10 8.50 3 1 TOP 0.00 2 10 8.50 3 3 TOP 0.00 2 10 8.50 4 1 TOP 0.00 2 10 4.50 4 2 TOP 7.20 3 10 1.80 4 3 TOP 0.00 2 10 4.50 1 4 BOT 0.83 2 10 5.48 1 8 BOT 1.58 1 10 4.36 2 5 BOT 0.97 2 10 6.56 2 9 BOT 1.82 2 10 4.86 3 6 BOT 1.40 2 10 5.70 3 10 BOT 2.25 1 10 4.00 4 7 BOT 1.05 2 10 7.96 4 11 BOT 1.95 1 10 6.00
12 - SHEAR REINFORCEMENT 12.1 Shear Calculation Envelope CL
X/L X d Vu Mu Ratio Req. Spacing m mm kN kNm mm2 mm
0.00 0.00 179.40 5.00 -0.00 0.05 0.00 0.00 0.05 0.13 179.40 6.40 -0.69 0.06 0.00 0.00 0.10 0.25 179.40 7.82 -1.50 0.07 0.00 0.00 0.15 0.38 179.40 9.22 -2.43 0.08 0.00 0.00 0.20 0.50 179.40 10.63 -3.47 0.10 0.00 0.00 0.25 0.63 179.40 12.03 -4.64 0.11 0.00 0.00 0.30 0.75 179.40 13.45 -5.92 0.12 0.00 0.00 0.35 0.88 179.40 14.85 -7.32 0.14 0.00 0.00 0.40 1.00 179.40 16.25 -8.84 0.15 0.00 0.00 0.45 1.13 179.40 17.65 -10.47 0.16 0.00 0.00 0.50 1.25 179.40 19.07 -12.23 0.17 0.00 0.00 0.55 1.38 179.40 20.47 -14.10 0.19 0.00 0.00 0.60 1.50 179.40 21.88 -16.10 0.20 0.00 0.00 0.65 1.63 179.40 23.28 -18.21 0.21 0.00 0.00 0.70 1.75 179.40 24.70 -20.44 0.22 0.00 0.00 0.75 1.88 179.40 26.10 -22.79 0.24 0.00 0.00 0.80 2.00 179.40 27.50 -25.25 0.25 0.00 0.00 0.85 2.13 179.40 28.90 -27.84 0.26 0.00 0.00 0.90 2.25 179.40 30.32 -30.54 0.28 0.00 0.00 0.95 2.38 179.40 31.72 -33.36 0.29 0.00 0.00 0.96 2.40 179.40 32.00 -33.94 0.29 0.00 0.00
SPAN 1
X/L X d Vu Mu Ratio Req. Spacing m mm kN kNm mm2 mm
0.01 0.10 179.40 -39.61 -32.42 0.36 0.00 0.00 0.05 0.38 179.40 -36.52 -22.34 0.33 0.00 0.00 0.10 0.75 179.40 -32.30 -9.97 0.29 0.00 0.00
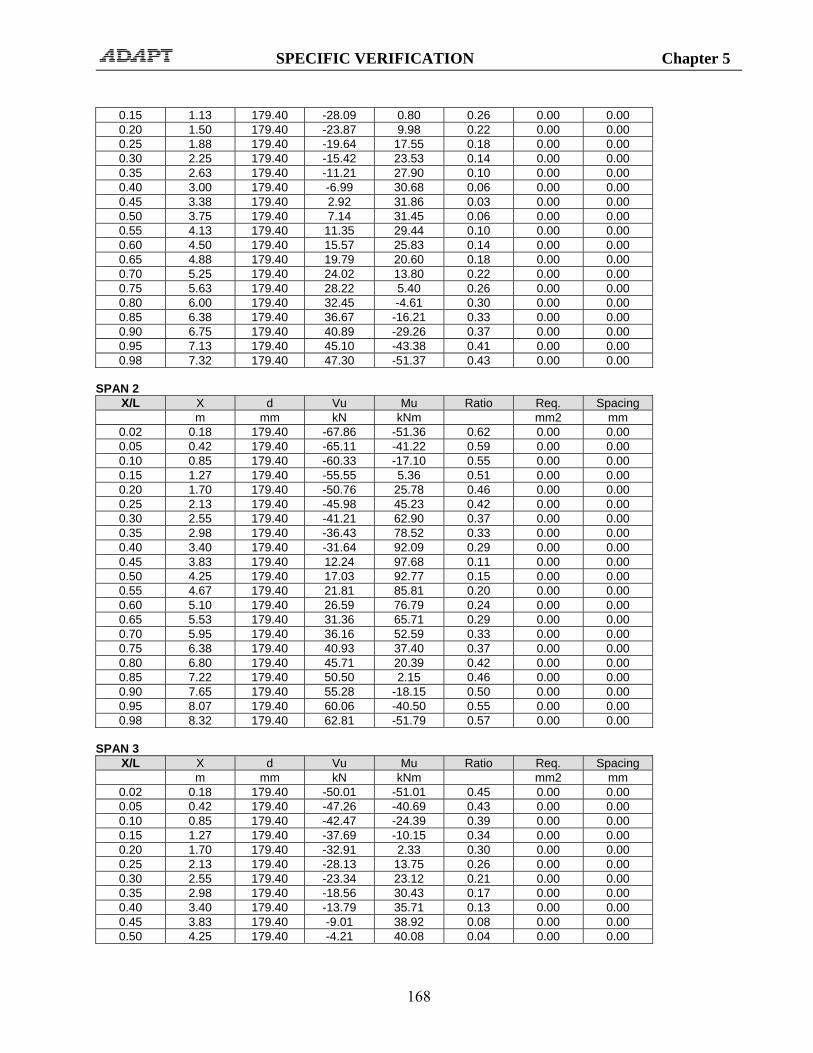
SPECIFIC VERIFICATION Chapter 5
168
0.15 1.13 179.40 -28.09 0.80 0.26 0.00 0.00 0.20 1.50 179.40 -23.87 9.98 0.22 0.00 0.00 0.25 1.88 179.40 -19.64 17.55 0.18 0.00 0.00 0.30 2.25 179.40 -15.42 23.53 0.14 0.00 0.00 0.35 2.63 179.40 -11.21 27.90 0.10 0.00 0.00 0.40 3.00 179.40 -6.99 30.68 0.06 0.00 0.00 0.45 3.38 179.40 2.92 31.86 0.03 0.00 0.00 0.50 3.75 179.40 7.14 31.45 0.06 0.00 0.00 0.55 4.13 179.40 11.35 29.44 0.10 0.00 0.00 0.60 4.50 179.40 15.57 25.83 0.14 0.00 0.00 0.65 4.88 179.40 19.79 20.60 0.18 0.00 0.00 0.70 5.25 179.40 24.02 13.80 0.22 0.00 0.00 0.75 5.63 179.40 28.22 5.40 0.26 0.00 0.00 0.80 6.00 179.40 32.45 -4.61 0.30 0.00 0.00 0.85 6.38 179.40 36.67 -16.21 0.33 0.00 0.00 0.90 6.75 179.40 40.89 -29.26 0.37 0.00 0.00 0.95 7.13 179.40 45.10 -43.38 0.41 0.00 0.00 0.98 7.32 179.40 47.30 -51.37 0.43 0.00 0.00
SPAN 2
X/L X d Vu Mu Ratio Req. Spacing m mm kN kNm mm2 mm
0.02 0.18 179.40 -67.86 -51.36 0.62 0.00 0.00 0.05 0.42 179.40 -65.11 -41.22 0.59 0.00 0.00 0.10 0.85 179.40 -60.33 -17.10 0.55 0.00 0.00 0.15 1.27 179.40 -55.55 5.36 0.51 0.00 0.00 0.20 1.70 179.40 -50.76 25.78 0.46 0.00 0.00 0.25 2.13 179.40 -45.98 45.23 0.42 0.00 0.00 0.30 2.55 179.40 -41.21 62.90 0.37 0.00 0.00 0.35 2.98 179.40 -36.43 78.52 0.33 0.00 0.00 0.40 3.40 179.40 -31.64 92.09 0.29 0.00 0.00 0.45 3.83 179.40 12.24 97.68 0.11 0.00 0.00 0.50 4.25 179.40 17.03 92.77 0.15 0.00 0.00 0.55 4.67 179.40 21.81 85.81 0.20 0.00 0.00 0.60 5.10 179.40 26.59 76.79 0.24 0.00 0.00 0.65 5.53 179.40 31.36 65.71 0.29 0.00 0.00 0.70 5.95 179.40 36.16 52.59 0.33 0.00 0.00 0.75 6.38 179.40 40.93 37.40 0.37 0.00 0.00 0.80 6.80 179.40 45.71 20.39 0.42 0.00 0.00 0.85 7.22 179.40 50.50 2.15 0.46 0.00 0.00 0.90 7.65 179.40 55.28 -18.15 0.50 0.00 0.00 0.95 8.07 179.40 60.06 -40.50 0.55 0.00 0.00 0.98 8.32 179.40 62.81 -51.79 0.57 0.00 0.00
SPAN 3
X/L X d Vu Mu Ratio Req. Spacing m mm kN kNm mm2 mm
0.02 0.18 179.40 -50.01 -51.01 0.45 0.00 0.00 0.05 0.42 179.40 -47.26 -40.69 0.43 0.00 0.00 0.10 0.85 179.40 -42.47 -24.39 0.39 0.00 0.00 0.15 1.27 179.40 -37.69 -10.15 0.34 0.00 0.00 0.20 1.70 179.40 -32.91 2.33 0.30 0.00 0.00 0.25 2.13 179.40 -28.13 13.75 0.26 0.00 0.00 0.30 2.55 179.40 -23.34 23.12 0.21 0.00 0.00 0.35 2.98 179.40 -18.56 30.43 0.17 0.00 0.00 0.40 3.40 179.40 -13.79 35.71 0.13 0.00 0.00 0.45 3.83 179.40 -9.01 38.92 0.08 0.00 0.00 0.50 4.25 179.40 -4.21 40.08 0.04 0.00 0.00

SPECIFIC VERIFICATION Chapter 5
169
0.55 4.67 179.40 7.88 39.10 0.07 0.00 0.00 0.60 5.10 179.40 13.14 35.88 0.12 0.00 0.00 0.65 5.53 179.40 18.40 30.39 0.17 0.00 0.00 0.70 5.95 179.40 23.67 22.65 0.22 0.00 0.00 0.75 6.38 179.40 28.51 12.73 0.26 0.00 0.00 0.80 6.80 179.40 33.29 0.75 0.30 0.00 0.00 0.85 7.22 179.40 38.06 -11.75 0.35 0.00 0.00 0.90 7.65 179.40 42.84 -26.16 0.39 0.00 0.00 0.95 8.07 179.40 47.63 -42.61 0.43 0.00 0.00 0.98 8.32 179.40 50.39 -53.03 0.46 0.00 0.00
SPAN 4
X/L X d Vu Mu Ratio Req. Spacing m mm kN kNm mm2 mm
0.02 0.18 179.40 -58.34 -53.89 0.53 0.00 0.00 0.05 0.45 179.40 -55.31 -42.71 0.50 0.00 0.00 0.10 0.90 179.40 -50.25 -19.75 0.46 0.00 0.00 0.15 1.35 179.40 -45.19 0.90 0.41 0.00 0.00 0.20 1.80 179.40 -40.11 19.26 0.36 0.00 0.00 0.25 2.25 179.40 -35.05 35.31 0.32 0.00 0.00 0.30 2.70 179.40 -29.99 49.06 0.27 0.00 0.00 0.35 3.15 179.40 -24.92 60.52 0.23 0.00 0.00 0.40 3.60 179.40 -19.87 69.67 0.18 0.00 0.00 0.45 4.05 179.40 -14.79 76.51 0.13 0.00 0.00 0.50 4.50 179.40 -9.73 81.06 0.09 0.00 0.00 0.55 4.95 179.40 -4.67 83.31 0.04 0.00 0.00 0.60 5.40 179.40 2.65 83.26 0.02 0.00 0.00 0.65 5.85 179.40 7.72 80.91 0.07 0.00 0.00 0.70 6.30 179.40 12.78 76.24 0.12 0.00 0.00 0.75 6.75 179.40 17.85 69.29 0.16 0.00 0.00 0.80 7.20 179.40 22.91 60.05 0.21 0.00 0.00 0.85 7.65 179.40 27.98 48.49 0.25 0.00 0.00 0.90 8.10 179.40 33.03 34.62 0.30 0.00 0.00 0.95 8.55 179.40 38.10 18.46 0.35 0.00 0.00 0.99 8.90 179.40 42.03 4.30 0.38 0.00 0.00
Note: "Vu" is related to the load combination which produces the maximum "Ratio" Note: Sections with **** have exceeded the maximum allowable shear stress. 14 - DEFLECTIONS 14.1 Maximum Span Deflections
Span SW SW+PT SW+PT+SDL
SW+PT+SDL+Creep
LL X Total
mm mm mm mm mm mm mm CL 0.0 -0.8 5.3 15.8(157) 1.0(2568) 0.0(*****) 16.8(148) 1 0.0 -3.3 -3.9 -11.6(644) -0.6(13335) 0.0(*****) -11.5(649) 2 0.0 -10.5 1.7 5.0(1690) 5.6(1520) 0.0(*****) 10.4(820) 3 0.0 -3.7 -3.9 -11.7(723) -0.4(18905) 0.0(*****) -11.5(737) 4 0.0 -11.9 4.1 12.3(733) 6.5(1378) 0.0(*****) 18.7(480)

SPECIFIC VERIFICATION Chapter 5
170
Example of Two-way Slab, ACI Code & SI units (MNL5-2M)
FIGURE 5.9-2
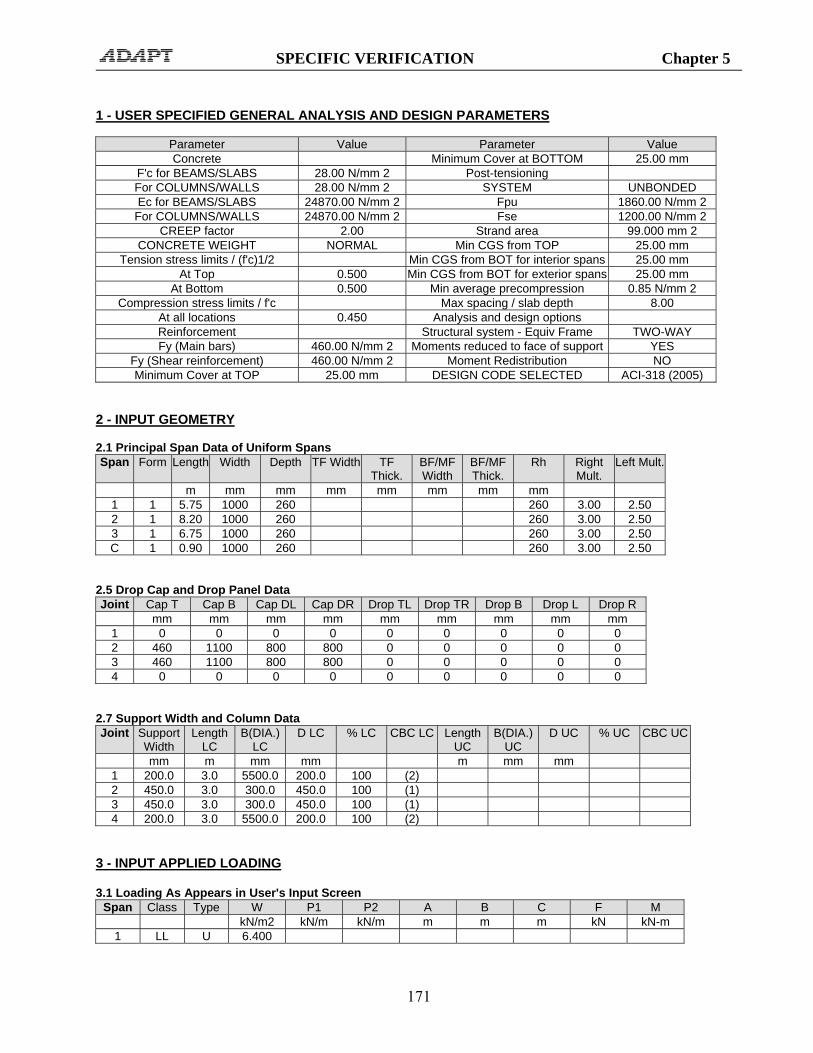
SPECIFIC VERIFICATION Chapter 5
171
1 - USER SPECIFIED GENERAL ANALYSIS AND DESIGN PARAMETERS
Parameter Value Parameter Value Concrete Minimum Cover at BOTTOM 25.00 mm
F'c for BEAMS/SLABS 28.00 N/mm 2 Post-tensioning For COLUMNS/WALLS 28.00 N/mm 2 SYSTEM UNBONDED Ec for BEAMS/SLABS 24870.00 N/mm 2 Fpu 1860.00 N/mm 2
For COLUMNS/WALLS 24870.00 N/mm 2 Fse 1200.00 N/mm 2 CREEP factor 2.00 Strand area 99.000 mm 2
CONCRETE WEIGHT NORMAL Min CGS from TOP 25.00 mm Tension stress limits / (f'c)1/2 Min CGS from BOT for interior spans 25.00 mm
At Top 0.500 Min CGS from BOT for exterior spans 25.00 mm At Bottom 0.500 Min average precompression 0.85 N/mm 2
Compression stress limits / f'c Max spacing / slab depth 8.00 At all locations 0.450 Analysis and design options Reinforcement Structural system - Equiv Frame TWO-WAY Fy (Main bars) 460.00 N/mm 2 Moments reduced to face of support YES
Fy (Shear reinforcement) 460.00 N/mm 2 Moment Redistribution NO Minimum Cover at TOP 25.00 mm DESIGN CODE SELECTED ACI-318 (2005)
2 - INPUT GEOMETRY 2.1 Principal Span Data of Uniform Spans Span Form Length Width Depth TF Width TF
Thick. BF/MF Width
BF/MF Thick.
Rh Right Mult.
Left Mult.
m mm mm mm mm mm mm mm 1 1 5.75 1000 260 260 3.00 2.50 2 1 8.20 1000 260 260 3.00 2.50 3 1 6.75 1000 260 260 3.00 2.50 C 1 0.90 1000 260 260 3.00 2.50
2.5 Drop Cap and Drop Panel Data Joint Cap T Cap B Cap DL Cap DR Drop TL Drop TR Drop B Drop L Drop R
mm mm mm mm mm mm mm mm mm 1 0 0 0 0 0 0 0 0 0 2 460 1100 800 800 0 0 0 0 0 3 460 1100 800 800 0 0 0 0 0 4 0 0 0 0 0 0 0 0 0
2.7 Support Width and Column Data Joint Support
Width Length
LC B(DIA.)
LC D LC % LC CBC LC Length
UC B(DIA.)
UC D UC % UC CBC UC
mm m mm mm m mm mm 1 200.0 3.0 5500.0 200.0 100 (2) 2 450.0 3.0 300.0 450.0 100 (1) 3 450.0 3.0 300.0 450.0 100 (1) 4 200.0 3.0 5500.0 200.0 100 (2)
3 - INPUT APPLIED LOADING 3.1 Loading As Appears in User's Input Screen
Span Class Type W P1 P2 A B C F M kN/m2 kN/m kN/m m m m kN kN-m
1 LL U 6.400

SPECIFIC VERIFICATION Chapter 5
172
1 SDL U 13.500 2 LL U 5.500 2 SDL U 13.500 3 LL U 6.000 3 SDL U 13.500
CANT LL U 6.000 CANT SDL U 13.500
4 - CALCULATED SECTION PROPERTIES 4.2 Section Properties for Non-Uniform Spans
Span Segment
Area I Yb Yt
mm2 mm4 mm mm 1 1 1430000.00 0.20E+12 130.00 130.00 1 2 1430000.00 0.81E+10 130.00 130.00 1 3 1650000.00 0.19E+11 299.33 160.67 1 4 1650000.00 0.21E+11 299.33 160.67 2 1 1650000.00 0.21E+11 299.33 160.67 2 2 1650000.00 0.19E+11 299.33 160.67 2 3 1430000.00 0.81E+10 130.00 130.00 2 4 1650000.00 0.19E+11 299.33 160.67 2 5 1650000.00 0.21E+11 299.33 160.67 3 1 1650000.00 0.21E+11 299.33 160.67 3 2 1650000.00 0.19E+11 299.33 160.67 3 3 1430000.00 0.81E+10 130.00 130.00 3 4 1430000.00 0.20E+12 130.00 130.00
CR 1 1430000.00 0.81E+10 130.00 130.00 5 - MOMENTS, SHEARS AND REACTIONS 5.1 Span Moments and Shears (Excluding Live Load)
Span Load Case Moment Left
Moment Midspan
Moment Right
Shear Left
Shear Right
kN-m kN-m kN-m kN kN 1 SW 0.00 0.00 0.00 0.00 0.00 2 SW 0.00 0.00 0.00 0.00 0.00 3 SW 0.00 0.00 0.00 0.00 0.00
CANT SW 0.00 ----- ----- 0.00 ----- 1 SDL 0.00 106.65 -400.42 -143.83 283.11 2 SDL -418.91 176.90 -475.43 -297.53 311.32 3 SDL -476.02 169.83 -30.08 -316.66 184.53
CANT SDL -30.07 ----- ----- -66.82 ----- 1 XL 0.00 0.00 0.00 0.00 0.00 2 XL 0.00 0.00 0.00 0.00 0.00 3 XL 0.00 0.00 0.00 0.00 0.00
CANT XL 0.00 ----- ----- 0.00 ----- 5.2 Reactions and Column Moments (Excluding Live Load)
Joint Load Case Reaction Moment Lower Column
Moment Upper Column
kN kN-m kN-m 1 SW 0.00 0.00 0.00 2 SW 0.00 0.00 0.00 3 SW 0.00 0.00 0.00 4 SW 0.00 0.00 0.00 1 SDL 143.83 0.00 0.00

SPECIFIC VERIFICATION Chapter 5
173
2 SDL 580.64 -18.48 0.00 3 SDL 627.98 -0.60 0.00 4 SDL 251.35 0.00 0.00 1 XL 0.00 0.00 0.00 2 XL 0.00 0.00 0.00 3 XL 0.00 0.00 0.00 4 XL 0.00 0.00 0.00
5.3 Span Moments and Shears (Live Load)
Span Moment Left Max
Moment Left Min
Moment Midspan
Max
Moment Midspan Min
Moment Right Max
Moment Right Min
Shear Left
Shear Right
kN-m kN-m kN-m kN-m kN-m kN-m kN kN 1 0.00 0.00 57.81 57.81 -175.33 -175.33 -70.71 131.69 2 -176.58 -176.58 67.36 67.36 -197.20 -197.20 -121.51 126.54 3 -202.92 -202.92 79.80 79.80 -13.37 -13.37 -139.46 83.29
CR -13.36 ----- ----- ----- ----- ----- -29.70 ----- 5.4 Reactions and Column Moments (Live Load)
Joint Reaction Max
Reaction Min
Moment Lower
Column Max
Moment Lower
Column Min
Moment Upper
Column Max
Moment Upper
Column Min kN kN kN-m kN-m kN-m kN-m
1 70.71 70.71 0.00 0.00 0.00 0.00 2 253.20 253.20 -1.24 -1.24 0.00 0.00 3 266.00 266.00 -5.72 -5.72 0.00 0.00 4 112.99 112.99 0.00 0.00 0.00 0.00
6 - MOMENTS REDUCED TO FACE OF SUPPORT 6.1 Reduced Moments at Face of Support (Excluding Live Load)
Span Load Case
Moment Left
Moment Midspan
Moment Right
kN-m kN-m kN-m 1 SW 0.00 0.00 0.00 2 SW 0.00 0.00 0.00 3 SW 0.00 0.00 0.00
CANT SW 0.00 ----- ----- 1 SDL 14.01 106.60 -338.60 2 SDL -353.80 176.90 -407.30 3 SDL -406.70 169.80 -12.00
CANT SDL -23.76 ----- ----- 1 XL 0.00 0.00 0.00 2 XL 0.00 0.00 0.00 3 XL 0.00 0.00 0.00
CANT XL 0.00 ----- ----- 6.2 Reduced Moments at Face of Support (Live Load)
Span Moment Left Max
Moment Left Min
Moment Midspan
Max
Moment Midspan Min
Moment Right Max
Moment Right Min
kN-m kN-m kN-m kN-m kN-m kN-m 1 6.89 6.89 57.81 57.81 -146.60 -146.60 2 -150.00 -150.00 67.36 67.36 -169.50 -169.50 3 -172.40 -172.40 79.80 79.80 -5.20 -5.20
CR -10.56 ----- ----- ----- ----- -----

SPECIFIC VERIFICATION Chapter 5
174
7 - SELECTED POST-TENSIONING FORCES AND TENDON PROFILES 7.1 Tendon Profile Tendon A
Span Type X1/L X2/L X3/L A/L 1 2 0.050 0.500 0.080 --- 2 2 0.070 0.500 0.070 --- 3 2 0.070 0.500 0.070 ---
CR 2 0.000 --- --- --- 7.2 Selected Post-Tensioning Forces and Tendon Drape Tendon A
Span Force CGS Left CGS C1 CGS C2 CGS Right P/A Wbal WBal (%DL) kN mm mm mm mm MPa kN/-
1 1238.000 130.00 --- 25.00 235.00 0.87 54.918 74 2 1238.000 235.00 --- 25.00 235.00 0.87 35.967 48 3 1650.000 235.00 --- 25.00 150.00 1.15 56.426 76
CR 1650.000 150.00 --- --- 130.00 1.15 81.490 110 All Tendons
Span Force Total P/A Total WBal (%DL)
kN MPa 1 1238 0.87 74 2 1238 0.87 48 3 1650 1.15 76
CR 1650 1.15 110 Approximate weight of strand: 203.8 Kg 7.4 Required Minimum Post-Tensioning Forces Based on Stress Conditions Based on Minimum P/A
Type Left Center Right Left Center Right kN kN kN kN kN kN
1 0.00 3.98 707.12 1215.50 1215.50 1402.50 2 802.94 698.49 1149.74 1402.50 1215.50 1402.50 3 1108.50 658.27 0.00 1402.50 1215.50 1215.50
CR 0.00 ----- ----- 1215.50 ----- ----- 7.5 Service Stresses (tension shown positive) Envelope of Service 1
Span Left Top Left Bottom Center Top Center Bottom
Right Top Right Bottom
MPa MPa MPa MPa MPa MPa 1 -1.14 -0.59 -1.18 -0.55 0.66 -3.37 2 0.86 -3.75 -2.62 0.88 0.65 -4.08 3 0.50 -3.80 -1.97 -0.34 -1.48 -0.83
CR -1.14 -1.17 ----- ----- ----- ----- Envelope of Service 2
Span Left Top Left Bottom Center Top Center Bottom
Right Top Right Bottom
MPa MPa MPa MPa MPa MPa 1 -1.22 -0.51 -1.83 0.10 1.53 -5.00 2 1.76 -5.42 -3.38 1.64 1.66 -5.96 3 1.53 -5.71 -2.87 0.56 -1.42 -0.88
CR -1.02 -1.29 ----- ----- ----- ----- 7.6 Post-Tensioning Balance Moments, Shears and Reactions

SPECIFIC VERIFICATION Chapter 5
175
Span Moments and Shears Span Moment Left Moment Center Moment Right Shear Left Shear Right
kN-m kN-m kN-m kN kN 1 0.89 -104.40 217.10 -8.90 -8.90 2 209.40 -88.69 264.20 0.03 0.03 3 281.80 -143.30 33.89 8.89 8.89
CR 26.08 ----- ----- 65.20 ----- Reactions and Column Moments
Joint Reaction Moment Lower
Column
Moment Upper
Column kN kN-m kN-m
1 8.900 0.000 0.000 2 -8.932 -9.750 0.000 3 -8.854 18.820 0.000 4 8.886 0.000 0.000
Note: Moments are reported at face of support 8 - FACTORED MOMENTS AND REACTIONS ENVELOPE 8.1 Factored Design Moments (Not Redistributed)
Span Left Max
Left Min
Middle Max
Middle Min
Right Max
Right Min
kN-m kN-m kN-m kN-m kN-m kN-m 1 28.73 28.73 246.01 246.01 -591.71 -591.71 2 -623.14 -623.14 361.35 361.35 -718.79 -718.79 3 -705.90 -705.90 361.43 361.43 -21.84 -21.84
CR -45.41 ----- ----- ----- ----- ----- 8.2 Reactions and Column Moments
Joint Reaction Max
Reaction Min
Moment Lower
Column Max
Moment Lower
Column Min
Moment Upper
Column Max
Moment Upper
Column Min kN kN kN-m kN-m kN-m kN-m
1 294.60 294.60 0.00 0.00 0.00 0.00 2 1092.91 1092.91 -33.92 -33.92 0.00 0.00 3 1170.35 1170.35 8.96 8.96 0.00 0.00 4 491.37 491.37 0.00 0.00 0.00 0.00
8.3 Secondary Moments
Span Left Midspan Right kN-m kN-m kN-m
1 0.89 25.59 49.17 2 41.42 41.29 41.17 3 57.98 29.99 0.89
Note: Moments are reported at face of support 10 - MILD STEEL - NO REDISTRIBUTION 10.1 Required Rebar 10.1.1 Total Strip Required Rebar
Span Location From To As Required Ultimate Minimum m m mm2 mm2 mm2
1 TOP 0.00 0.86 1073.00 0.00 1073.00

SPECIFIC VERIFICATION Chapter 5
176
1 TOP 4.60 5.75 3010.00 3010.00 1360.00 2 TOP 0.00 1.23 3374.00 3374.00 1360.00 2 TOP 6.97 8.20 3518.00 3518.00 1458.00 3 TOP 0.00 1.01 3316.00 3316.00 1458.00 3 TOP 5.74 6.75 1073.00 0.00 1073.00
CR TOP 0.00 0.14 1073.00 0.00 1073.00 1 BOT 2.01 2.01 771.90 0.00 771.90 2 BOT 2.87 4.92 1675.00 416.70 1675.00 3 BOT 3.71 5.40 1285.00 237.50 1285.00
29 - DETAILED REBAR SPAN 1
X/L X Analysis Top
Analysis Bot
Minimum Top
Minimum Bot
Selected Top
Selected Bot
m mm2 mm2 mm2 mm2 mm2 mm2 0.00 0.00 0.00 0.00 1073.00 0.00 1073.00 0.00 0.05 0.29 0.00 0.00 1073.00 0.00 1073.00 0.00 0.10 0.57 0.00 0.00 1073.00 0.00 1073.00 0.00 0.15 0.86 0.00 0.00 1073.00 0.00 1073.00 0.00 0.20 1.15 0.00 0.00 0.00 0.00 0.00 0.00 0.25 1.44 0.00 0.00 0.00 0.00 0.00 0.00 0.30 1.73 0.00 0.00 0.00 0.00 0.00 0.00 0.35 2.01 0.00 0.00 0.00 771.90 0.00 771.90 0.40 2.30 0.00 0.00 0.00 0.00 0.00 0.00 0.45 2.59 0.00 0.00 0.00 0.00 0.00 0.00 0.50 2.88 0.00 0.00 0.00 0.00 0.00 0.00 0.55 3.16 0.00 0.00 0.00 0.00 0.00 0.00 0.60 3.45 0.00 0.00 0.00 0.00 0.00 0.00 0.65 3.74 0.00 0.00 0.00 0.00 0.00 0.00 0.70 4.03 0.00 0.00 0.00 0.00 0.00 0.00 0.75 4.31 0.00 0.00 0.00 0.00 0.00 0.00 0.80 4.60 142.60 0.00 0.00 0.00 142.60 0.00 0.85 4.89 748.50 0.00 1360.00 0.00 1360.00 0.00 0.90 5.17 1294.00 0.00 1360.00 0.00 1360.00 0.00 0.95 5.46 2601.00 0.00 1360.00 0.00 2601.00 0.00 1.00 5.75 3010.00 0.00 1360.00 0.00 3010.00 0.00
SPAN 2
X/L X Analysis Top
Analysis Bot
Minimum Top
Minimum Bot
Selected Top
Selected Bot
m mm2 mm2 mm2 mm2 mm2 mm2 0.00 0.00 3374.00 0.00 1360.00 0.00 3374.00 0.00 0.05 0.41 2218.00 0.00 1360.00 0.00 2218.00 0.00 0.10 0.82 566.90 0.00 1360.00 0.00 1360.00 0.00 0.15 1.23 0.00 0.00 1360.00 0.00 1360.00 0.00 0.20 1.64 0.00 0.00 0.00 0.00 0.00 0.00 0.25 2.05 0.00 0.00 0.00 0.00 0.00 0.00 0.30 2.46 0.00 0.00 0.00 0.00 0.00 0.00 0.35 2.87 0.00 0.00 0.00 915.50 0.00 915.50 0.40 3.28 0.00 0.00 0.00 1384.00 0.00 1384.00 0.45 3.69 0.00 368.00 0.00 1645.00 0.00 1645.00 0.50 4.10 0.00 416.70 0.00 1675.00 0.00 1675.00 0.55 4.51 0.00 247.30 0.00 1474.00 0.00 1474.00 0.60 4.92 0.00 0.00 0.00 1058.00 0.00 1058.00 0.65 5.33 0.00 0.00 0.00 0.00 0.00 0.00 0.70 5.74 0.00 0.00 0.00 0.00 0.00 0.00

SPECIFIC VERIFICATION Chapter 5
177
0.75 6.15 0.00 0.00 0.00 0.00 0.00 0.00 0.80 6.56 0.00 0.00 0.00 0.00 0.00 0.00 0.85 6.97 0.00 0.00 1458.00 0.00 1458.00 0.00 0.90 7.38 629.90 0.00 1458.00 0.00 1458.00 0.00 0.95 7.79 2275.00 0.00 1458.00 0.00 2275.00 0.00 1.00 8.20 3518.00 0.00 1458.00 0.00 3518.00 0.00
SPAN 3
X/L X Analysis Top
Analysis Bot
Minimum Top
Minimum Bot
Selected Top
Selected Bot
m mm2 mm2 mm2 mm2 mm2 mm2 0.00 0.00 3316.00 0.00 1458.00 0.00 3316.00 0.00 0.05 0.34 2546.00 0.00 1458.00 0.00 2546.00 0.00 0.10 0.68 1184.00 0.00 1458.00 0.00 1458.00 0.00 0.15 1.01 324.70 0.00 1458.00 0.00 1458.00 0.00 0.20 1.35 0.00 0.00 0.00 0.00 0.00 0.00 0.25 1.69 0.00 0.00 0.00 0.00 0.00 0.00 0.30 2.02 0.00 0.00 0.00 0.00 0.00 0.00 0.35 2.36 0.00 0.00 0.00 0.00 0.00 0.00 0.40 2.70 0.00 0.00 0.00 0.00 0.00 0.00 0.45 3.04 0.00 0.00 0.00 0.00 0.00 0.00 0.50 3.38 0.00 0.00 0.00 0.00 0.00 0.00 0.55 3.71 0.00 0.00 0.00 692.00 0.00 692.00 0.60 4.05 0.00 0.00 0.00 1043.00 0.00 1043.00 0.65 4.39 0.00 88.05 0.00 1285.00 0.00 1285.00 0.70 4.72 0.00 237.50 0.00 0.00 0.00 237.50 0.75 5.06 0.00 178.60 0.00 0.00 0.00 178.60 0.80 5.40 0.00 57.89 0.00 0.00 0.00 57.89 0.85 5.74 0.00 0.00 1073.00 0.00 1073.00 0.00 0.90 6.08 0.00 0.00 1073.00 0.00 1073.00 0.00 0.95 6.41 0.00 0.00 1073.00 0.00 1073.00 0.00 1.00 6.75 0.00 0.00 1073.00 0.00 1073.00 0.00
CR
X/L X Analysis Top
Analysis Bot
Minimum Top
Minimum Bot
Selected Top
Selected Bot
m mm2 mm2 mm2 mm2 mm2 mm2 0.00 0.00 0.00 0.00 1073.00 0.00 1073.00 0.00 0.05 0.04 0.00 0.00 1073.00 0.00 1073.00 0.00 0.10 0.09 0.00 0.00 1073.00 0.00 1073.00 0.00 0.15 0.14 0.00 0.00 1073.00 0.00 1073.00 0.00 0.20 0.18 0.00 0.00 0.00 0.00 0.00 0.00 0.25 0.23 0.00 0.00 0.00 0.00 0.00 0.00 0.30 0.27 0.00 0.00 0.00 0.00 0.00 0.00 0.35 0.32 0.00 0.00 0.00 0.00 0.00 0.00 0.40 0.36 0.00 0.00 0.00 0.00 0.00 0.00 0.45 0.41 0.00 0.00 0.00 0.00 0.00 0.00 0.50 0.45 0.00 0.00 0.00 0.00 0.00 0.00 0.55 0.50 0.00 0.00 0.00 0.00 0.00 0.00 0.60 0.54 0.00 0.00 0.00 0.00 0.00 0.00 0.65 0.58 0.00 0.00 0.00 0.00 0.00 0.00 0.70 0.63 0.00 0.00 0.00 0.00 0.00 0.00 0.75 0.68 0.00 0.00 0.00 0.00 0.00 0.00 0.80 0.72 0.00 0.00 0.00 0.00 0.00 0.00 0.85 0.77 0.00 0.00 0.00 0.00 0.00 0.00 0.90 0.81 0.00 0.00 0.00 0.00 0.00 0.00 0.95 0.85 0.00 0.00 0.00 0.00 0.00 0.00 1.00 0.90 0.00 0.00 0.00 0.00 0.00 0.00

SPECIFIC VERIFICATION Chapter 5
178
Example of a Beam, ACI Code &SI units (MNL5-3M)
FIGURE 5.9-3

SPECIFIC VERIFICATION Chapter 5
179
1 - USER SPECIFIED GENERAL ANALYSIS AND DESIGN PARAMETERS
Parameter Value Parameter Value Concrete SYSTEM UNBONDED
F'c for BEAMS/SLABS 30.00 N/mm 2 Fpu 1860.00 N/mm 2 For COLUMNS/WALLS 30.00 N/mm 2 Fse 1200.00 N/mm 2 Ec for BEAMS/SLABS 25743.00 N/mm 2 Strand area 99.000 mm 2
For COLUMNS/WALLS 25743.00 N/mm 2 Min CGS from TOP 56.00 mm CREEP factor 2.00 Min CGS from BOT for interior spans 80.00 mm
CONCRETE WEIGHT NORMAL Min CGS from BOT for exterior spans 80.00 mm Tension stress limits / (f'c)1/2 Min average precompression 0.85 N/mm 2
At Top 0.750 Max spacing / slab depth 8.00 At Bottom 0.750 Analysis and design options
Compression stress limits / f'c Structural system BEAM At all locations 0.450 Moment of Inertia over support is NOT INCREASEDReinforcement Moments reduced to face of support YES Fy (Main bars) 460.00 N/mm 2 Moment Redistribution NO
Fy (Shear reinforcement) 460.00 N/mm 2 Effective flange width consideration YES Minimum Cover at TOP 50.00 mm Effective flange width implementation
method ACI-318
Minimum Cover at BOTTOM 50.00 mm DESIGN CODE SELECTED ACI-318 (2005) Post-tensioning
2 - INPUT GEOMETRY 2.1 Principal Span Data of Uniform Spans Span Form Length Width Depth TF Width TF
Thick. BF/MF Width
BF/MF Thick.
Rh Right Mult.
Left Mult.
m mm mm mm mm mm mm mm 1 2 20.00 460 900 5190 120 900 0.50 0.50 2 2 17.00 460 900 5190 120 900 0.50 0.50 3 2 5.00 460 900 5190 120 900 0.50 0.50
2.3 Effective Width Data of Uniform Spans
Span Effective Width mm
1 2380 2 2380 3 1250
2.7 Support Width and Column Data Joint Support
Width Length
LC B(DIA.)
LC D LC % LC CBC LC Length
UC B(DIA.)
UC D UC % UC CBC UC
mm m mm mm m mm mm 1 360.0 3.0 360.0 360.0 100 (1) 2 480.0 3.0 480.0 480.0 100 (1) 3 480.0 3.0 480.0 480.0 100 (1) 4 360.0 3.0 360.0 360.0 100 (1)
3 - INPUT APPLIED LOADING 3.1 Loading As Appears in User's Input Screen
Span Class Type W P1 P2 A B C F M kN/m2 kN/m kN/m m m m kN kN-m

SPECIFIC VERIFICATION Chapter 5
180
1 LL L 8.000 0.000 20.000 1 SDL L 28.000 0.000 20.000 2 LL L 8.000 0.000 17.000 2 SDL L 28.000 0.000 17.000 3 LL L 8.000 0.000 5.000 3 SDL L 28.000 0.000 5.000
4 - CALCULATED SECTION PROPERTIES 4.1 Section Properties of Uniform Spans and Cantilevers
Span Area Yb Yt b_eff I Yb Yt mm2 mm mm mm mm4 mm mm
1 981600.00 675.51 224.49 2380.00 0.5074E+11 589.44 310.56 2 981600.00 675.51 224.49 2380.00 0.5074E+11 589.44 310.56 3 981600.00 675.51 224.49 1250.00 0.3979E+11 522.67 377.33
5 - MOMENTS, SHEARS AND REACTIONS 5.1 Span Moments and Shears (Excluding Live Load)
Span Load Case Moment Left
Moment Midspan
Moment Right
Shear Left
Shear Right
kN-m kN-m kN-m kN kN 1 SW 0.00 0.00 0.00 0.00 0.00 2 SW 0.00 0.00 0.00 0.00 0.00 3 SW 0.00 0.00 0.00 0.00 0.00 1 SDL -162.87 746.41 -1144.32 -230.93 329.07 2 SDL -1009.94 301.62 -409.81 -273.30 202.70 3 SDL -346.57 -82.68 6.22 -140.56 -0.56 1 XL 0.00 0.00 0.00 0.00 0.00 2 XL 0.00 0.00 0.00 0.00 0.00 3 XL 0.00 0.00 0.00 0.00 0.00
5.2 Reactions and Column Moments (Excluding Live Load)
Joint Load Case Reaction Moment Lower Column
Moment Upper Column
kN kN-m kN-m 1 SW 0.00 0.00 0.00 2 SW 0.00 0.00 0.00 3 SW 0.00 0.00 0.00 4 SW 0.00 0.00 0.00 1 SDL 230.93 -162.85 0.00 2 SDL 602.37 134.37 0.00 3 SDL 343.26 63.25 0.00 4 SDL -0.56 -6.22 0.00 1 XL 0.00 0.00 0.00 2 XL 0.00 0.00 0.00 3 XL 0.00 0.00 0.00 4 XL 0.00 0.00 0.00
5.3 Span Moments and Shears (Live Load)
Span Moment Left Max
Moment Left Min
Moment Midspan
Max
Moment Midspan Min
Moment Right Max
Moment Right Min
Shear Left
Shear Right
kN-m kN-m kN-m kN-m kN-m kN-m kN kN 1 -46.53 -46.53 213.26 213.26 -326.95 -326.95 -65.98 94.02 2 -288.55 -288.55 86.18 86.18 -117.09 -117.09 -78.09 57.91

SPECIFIC VERIFICATION Chapter 5
181
3 -99.02 -99.02 -23.62 -23.62 1.78 1.78 -40.16 -0.16 5.4 Reactions and Column Moments (Live Load)
Joint Reaction Max
Reaction Min
Moment Lower
Column Max
Moment Lower
Column Min
Moment Upper
Column Max
Moment Upper
Column Min kN kN kN-m kN-m kN-m kN-m
1 65.98 65.98 -46.53 -46.53 0.00 0.00 2 172.11 172.11 38.39 38.39 0.00 0.00 3 98.07 98.07 18.07 18.07 0.00 0.00 4 -0.16 -0.16 -1.78 -1.78 0.00 0.00
6 - MOMENTS REDUCED TO FACE OF SUPPORT 6.1 Reduced Moments at Face of Support (Excluding Live Load)
Span Load Case
Moment Left
Moment Midspan
Moment Right
kN-m kN-m kN-m 1 SW 0.00 0.00 0.00 2 SW 0.00 0.00 0.00 3 SW 0.00 0.00 0.00 1 SDL -121.80 746.40 -1066.00 2 SDL -945.20 301.60 -362.00 3 SDL -313.60 -82.68 5.66 1 XL 0.00 0.00 0.00 2 XL 0.00 0.00 0.00 3 XL 0.00 0.00 0.00
6.2 Reduced Moments at Face of Support (Live Load)
Span Moment Left Max
Moment Left Min
Moment Midspan
Max
Moment Midspan Min
Moment Right Max
Moment Right Min
kN-m kN-m kN-m kN-m kN-m kN-m 1 -34.79 -34.79 213.30 213.30 -304.60 -304.60 2 -270.00 -270.00 86.18 86.18 -103.40 -103.40 3 -89.61 -89.61 -23.62 -23.62 1.62 1.62
7 - SELECTED POST-TENSIONING FORCES AND TENDON PROFILES 7.1 Tendon Profile Tendon A
Span Type X1/L X2/L X3/L A/L 1 1 0.015 0.500 0.030 --- 2 1 0.035 0.500 0.000 --- 3 1 0.000 0.500 0.060 ---
7.2 Selected Post-Tensioning Forces and Tendon Drape Tendon A
Span Force CGS Left CGS C1 CGS C2 CGS Right P/A Wbal WBal (%DL) kN mm mm mm mm MPa kN/-
1 1660.000 676.00 --- 80.00 844.00 1.69 22.576 81 2 925.000 844.00 --- 80.00 844.00 0.94 19.563 70 3 925.000 844.00 --- 630.00 676.00 0.94 38.480 137
Approximate weight of strand: 381.5 Kg 7.4 Required Minimum Post-Tensioning Forces

SPECIFIC VERIFICATION Chapter 5
182
Based on Stress Conditions Based on Minimum P/A Type Left Center Right Left Center Right
kN kN kN kN kN kN 1 0.00 1321.04 1004.32 834.36 834.36 834.36 2 864.45 105.01 0.00 834.36 834.36 834.36 3 0.00 0.00 0.00 834.36 834.36 834.36
7.5 Service Stresses (tension shown positive) Envelope of Service 1
Span Left Top Left Bottom Center Top Center Bottom
Right Top Right Bottom
MPa MPa MPa MPa MPa MPa 1 -1.62 -1.82 -2.88 0.57 0.01 -4.91 2 -0.11 -4.68 -1.60 0.30 -0.25 -2.25 3 0.05 -2.31 -0.26 -1.89 -1.01 -0.85
Envelope of Service 2
Span Left Top Left Bottom Center Top Center Bottom
Right Top Right Bottom
MPa MPa MPa MPa MPa MPa 1 -1.48 -2.10 -3.79 2.30 1.31 -7.39 2 1.04 -6.88 -1.97 1.00 0.19 -3.09 3 0.64 -3.14 -0.10 -2.10 -1.02 -0.84
7.6 Post-Tensioning Balance Moments, Shears and Reactions Span Moments and Shears
Span Moment Left Moment Center Moment Right Shear Left Shear Right kN-m kN-m kN-m kN kN
1 121.30 -616.00 879.90 -24.58 -24.58 2 768.50 -220.30 280.20 20.21 20.21 3 236.00 17.93 0.84 24.92 24.92
Reactions and Column Moments
Joint Reaction Moment Lower
Column
Moment Upper
Column kN kN-m kN-m
1 24.580 126.700 0.000 2 -44.780 -115.900 0.000 3 -4.707 -36.510 0.000 4 24.920 2.263 0.000
Note: Moments are reported at face of support 8 - FACTORED MOMENTS AND REACTIONS ENVELOPE 8.1 Factored Design Moments (Not Redistributed)
Span Left Max
Left Min
Middle Max
Middle Min
Right Max
Right Min
kN-m kN-m kN-m kN-m kN-m kN-m 1 -70.72 -70.72 1609.46 1609.46 -1154.16 -1154.16 2 -1068.74 -1068.74 830.41 830.41 -436.14 -436.14 3 -403.30 -403.30 -76.97 -76.97 11.61 11.61
8.2 Reactions and Column Moments
Joint Reaction Max
Reaction Min
Moment Lower
Column Max
Moment Lower
Column Min
Moment Upper
Column Max
Moment Upper
Column Min kN kN kN-m kN-m kN-m kN-m

SPECIFIC VERIFICATION Chapter 5
183
1 407.23 407.23 -143.23 -143.23 0.00 0.00 2 953.46 953.46 106.80 106.80 0.00 0.00 3 564.16 564.16 68.30 68.30 0.00 0.00 4 23.99 23.99 -8.05 -8.05 0.00 0.00
8.3 Secondary Moments
Span Left Midspan Right kN-m kN-m kN-m
1 131.10 372.50 612.40 2 497.50 330.60 163.70 3 116.40 60.04 2.22
Note: Moments are reported at face of support 10 - MILD STEEL - NO REDISTRIBUTION 10.1 Required Rebar 10.1.1 Total Strip Required Rebar
Span Location From To As Required Ultimate Minimum m m mm2 mm2 mm2
1 TOP 0.00 3.00 1493.00 384.70 1493.00 1 TOP 16.00 20.00 3637.00 3637.00 1493.00 2 TOP 0.00 4.25 3125.00 3125.00 1493.00 2 TOP 14.45 17.00 1493.00 1162.00 1493.00 3 TOP 0.00 5.00 1073.00 998.40 1073.00 1 BOT 1.00 15.00 2466.00 2466.00 1085.00 2 BOT 5.10 14.45 1085.00 1006.00 1085.00 3 BOT 4.50 5.00 17.53 17.53 0.00
10.2 Provided Rebar 10.2.1 Total Strip Provided Rebar
Span ID Location From Quantity Size Length Area m m mm2
1 1 TOP 0.00 8 16 4.00 1608.80 1 2 TOP 14.70 10 16 10.70 2011.00 2 3 TOP 13.60 8 16 8.40 1608.80 1 4 TOP 17.70 9 16 4.30 1809.90 1 8 BOT 0.00 3 16 0.00 603.30 1 5 BOT 0.00 7 16 16.30 1407.70 2 6 BOT 3.95 3 16 11.66 603.30 3 7 BOT 3.95 1 16 1.06 201.10 1 9 BOT 2.70 6 16 11.60 1206.60 2 10 BOT 4.80 3 16 9.10 603.30
10.2.2 Total Strip Steel Disposition
Span ID Location From Quantity Size Length m m
1 1 TOP 0.00 8 16 4.00 1 2 TOP 14.70 10 16 5.30 1 4 TOP 17.70 9 16 2.30 2 2 TOP 0.00 10 16 5.40 2 3 TOP 13.60 8 16 3.40 2 4 TOP 0.00 9 16 2.00 3 3 TOP 0.00 8 16 5.00 1 8 BOT 0.00 3 16 0.00
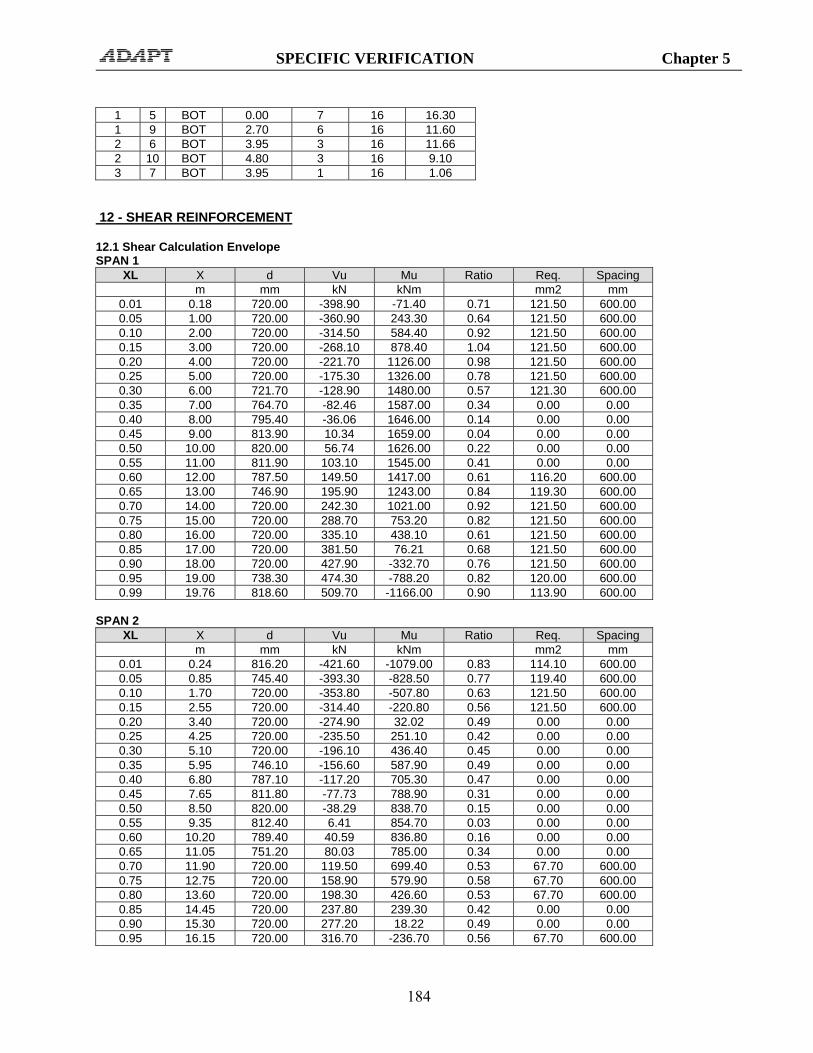
SPECIFIC VERIFICATION Chapter 5
184
1 5 BOT 0.00 7 16 16.30 1 9 BOT 2.70 6 16 11.60 2 6 BOT 3.95 3 16 11.66 2 10 BOT 4.80 3 16 9.10 3 7 BOT 3.95 1 16 1.06
12 - SHEAR REINFORCEMENT 12.1 Shear Calculation Envelope SPAN 1
XL X d Vu Mu Ratio Req. Spacing m mm kN kNm mm2 mm
0.01 0.18 720.00 -398.90 -71.40 0.71 121.50 600.00 0.05 1.00 720.00 -360.90 243.30 0.64 121.50 600.00 0.10 2.00 720.00 -314.50 584.40 0.92 121.50 600.00 0.15 3.00 720.00 -268.10 878.40 1.04 121.50 600.00 0.20 4.00 720.00 -221.70 1126.00 0.98 121.50 600.00 0.25 5.00 720.00 -175.30 1326.00 0.78 121.50 600.00 0.30 6.00 721.70 -128.90 1480.00 0.57 121.30 600.00 0.35 7.00 764.70 -82.46 1587.00 0.34 0.00 0.00 0.40 8.00 795.40 -36.06 1646.00 0.14 0.00 0.00 0.45 9.00 813.90 10.34 1659.00 0.04 0.00 0.00 0.50 10.00 820.00 56.74 1626.00 0.22 0.00 0.00 0.55 11.00 811.90 103.10 1545.00 0.41 0.00 0.00 0.60 12.00 787.50 149.50 1417.00 0.61 116.20 600.00 0.65 13.00 746.90 195.90 1243.00 0.84 119.30 600.00 0.70 14.00 720.00 242.30 1021.00 0.92 121.50 600.00 0.75 15.00 720.00 288.70 753.20 0.82 121.50 600.00 0.80 16.00 720.00 335.10 438.10 0.61 121.50 600.00 0.85 17.00 720.00 381.50 76.21 0.68 121.50 600.00 0.90 18.00 720.00 427.90 -332.70 0.76 121.50 600.00 0.95 19.00 738.30 474.30 -788.20 0.82 120.00 600.00 0.99 19.76 818.60 509.70 -1166.00 0.90 113.90 600.00
SPAN 2
XL X d Vu Mu Ratio Req. Spacing m mm kN kNm mm2 mm
0.01 0.24 816.20 -421.60 -1079.00 0.83 114.10 600.00 0.05 0.85 745.40 -393.30 -828.50 0.77 119.40 600.00 0.10 1.70 720.00 -353.80 -507.80 0.63 121.50 600.00 0.15 2.55 720.00 -314.40 -220.80 0.56 121.50 600.00 0.20 3.40 720.00 -274.90 32.02 0.49 0.00 0.00 0.25 4.25 720.00 -235.50 251.10 0.42 0.00 0.00 0.30 5.10 720.00 -196.10 436.40 0.45 0.00 0.00 0.35 5.95 746.10 -156.60 587.90 0.49 0.00 0.00 0.40 6.80 787.10 -117.20 705.30 0.47 0.00 0.00 0.45 7.65 811.80 -77.73 788.90 0.31 0.00 0.00 0.50 8.50 820.00 -38.29 838.70 0.15 0.00 0.00 0.55 9.35 812.40 6.41 854.70 0.03 0.00 0.00 0.60 10.20 789.40 40.59 836.80 0.16 0.00 0.00 0.65 11.05 751.20 80.03 785.00 0.34 0.00 0.00 0.70 11.90 720.00 119.50 699.40 0.53 67.70 600.00 0.75 12.75 720.00 158.90 579.90 0.58 67.70 600.00 0.80 13.60 720.00 198.30 426.60 0.53 67.70 600.00 0.85 14.45 720.00 237.80 239.30 0.42 0.00 0.00 0.90 15.30 720.00 277.20 18.22 0.49 0.00 0.00 0.95 16.15 720.00 316.70 -236.70 0.56 67.70 600.00

SPECIFIC VERIFICATION Chapter 5
185
0.99 16.76 803.00 345.00 -440.50 0.55 64.10 600.00 SPAN 3
XL X d Vu Mu Ratio Req. Spacing m mm kN kNm mm2 mm
0.05 0.24 805.00 -196.80 -407.40 0.33 0.00 0.00 0.05 0.25 803.40 -196.40 -405.40 0.33 0.00 0.00 0.10 0.50 767.00 -184.80 -357.30 0.32 0.00 0.00 0.15 0.75 734.90 -173.20 -312.00 0.30 0.00 0.00 0.20 1.00 720.00 -161.60 -269.80 0.29 0.00 0.00 0.25 1.25 720.00 -150.00 -230.60 0.27 0.00 0.00 0.30 1.50 720.00 -138.40 -194.00 0.25 0.00 0.00 0.35 1.75 720.00 -126.80 -160.60 0.22 0.00 0.00 0.40 2.00 720.00 -115.20 -130.10 0.20 0.00 0.00 0.45 2.25 720.00 -103.60 -102.40 0.18 0.00 0.00 0.50 2.50 720.00 -92.01 -77.74 0.16 0.00 0.00 0.55 2.75 720.00 -80.41 -55.96 0.14 0.00 0.00 0.60 3.00 720.00 -68.81 -37.13 0.12 0.00 0.00 0.65 3.25 720.00 -57.21 -21.22 0.10 0.00 0.00 0.70 3.50 720.00 -45.61 -8.24 0.08 0.00 0.00 0.75 3.75 720.00 -38.10 -17.69 0.07 0.00 0.00 0.80 4.00 720.00 -30.60 -9.02 0.05 0.00 0.00 0.85 4.25 720.00 -23.10 -2.25 0.04 0.00 0.00 0.90 4.50 720.00 7.45 14.39 0.03 0.00 0.00 0.95 4.75 720.00 15.85 12.72 0.04 0.00 0.00 0.96 4.82 720.00 18.20 11.73 0.04 0.00 0.00
Note: "Vu" is related to the load combination which produces the maximum "Ratio" Note: Sections with **** have exceeded the maximum allowable shear stress. 14 - DEFLECTIONS 14.1 Maximum Span Deflections
Span SW SW+PT SW+PT+SDL
SW+PT+SDL+Creep
LL X Total
mm mm mm mm mm mm mm 1 0.0 -187.9 3.8 11.4(1758) 5.7(3520) 0.0(****) 17.0(1177) 2 0.0 6.5 1.2 3.5(4819) 1.1(15498) 0.0(****) 4.6(3676) 3 0.0 0.2 -0.2 -0.6(8958) -0.1(54170) 0.0(****) -0.6(7692)
5.10 PUNCHING SHEAR
5.10.1 Overview
Punching shear calculation applies to column-supported slabs, classified as two-way structural systems. This section (i) defines the different conditions for punching shear calculation, (ii) presents the relationships used for code check of each condition using ACI-318, (iii) presents a numerical example for each condition, and (iv) demonstrates that the program ADAPT-PT correctly recognizes each case, and accordingly.

SPECIFIC VERIFICATION Chapter 5
186
Depending on the location of a column with respect to the slab edges, four conditions are identified. These are:
• Interior column, where the distance from each face of a column to the slab edge is at least four times the slab thickness (columns 4 and 5 in Fig. 5.10-1)
• Edge column, where one face of a column in direction of design strip is closer to the slab edge in the same direction by four times the slab thickness (column 2 in Fig. 5.10-1
• Corner column, where two adjacent faces of a column are closer to their associated slab edges by less than four times the slab thickness (column 1 in Fig. 5.10-1
• End column, where a column face is closer to a slab edge normal to the design strip by less than four times the slab thickness (Column 6 in Fig. 5.10-1
Columns at re-entrant corners, such as column 3 in Fig. 5.10-1 are conservatively treated as edge columns. Punching shear relationships of the code do not apply to columns that are connected to one or more beams, nor do they apply to walls/supports. Adequacy of shear transfer in such cases has to be established differently. The calculations are presented by way of a numerical example. The geometry, material, loading and other particulars of the structure selected for the numerical example are given below and in Fig. 5.10-1. Thickness of slab = 9 in (229 mm)

SPECIFIC VERIFICATION Chapter 5
187
Figure 5.10-1 5.10.1.1 Material Properties
(i) Concrete
Compressive strength, f’c = 4000 psi (27.58 MPa) Weight = 150 pcf (2403 kg/m3) Modulus of elasticity = 3605 ksi (24856 MPa)
(ii) Prestressing
Low relaxation, unbonded system
Strand diameter = ½ in (13 mm) Strand area = 0.153 in2 (98 mm2) Modulus of elasticity = 28000 ksi (193054 MPa) Ultimate strength of strand, fpu
= 270 ksi (1862 MPa)

SPECIFIC VERIFICATION Chapter 5
188
Minimum strand cover From top fiber = 1 in all spans (25 mm) From bottom fiber Interior spans = 1 in (25 mm) Exterior spans = 1 in (25 mm)
(iii) Nonprestressed Reinforcement
Yield stress fy = 60 ksi (413.69 MPa) Modulus of elasticity = 29000 ksi (199,949 MPa) Minimum rebar cover = 0.75 in top and bottom (19 mm)
(iv) Loading
Dead load = self weight + 20 psf (superimposed) Live load = (1.92 kN/m2)
5.10.2 Relationships
The calculations are intended to determine whether or not a given slab-column connection meets the minimum safety requirements of the code against failure. It is not the intent of the calculations to find the “actual” condition of stress distribution at the column-slab location. The relationships used are empirical. Using test results, the relationships are calibrated to deliver safe designs. The calculation steps are:
1. Determine the factored column moment (design moment Mu) and the factored shear (design shear Vu). In many instances, column reaction is conservatively used as design value for punching shear.
2. Consider a fraction of the unbalanced moment ( γ Mu ) to contribute to the punching shear demand. The unbalanced moment is conservatively taken as the sum of upper and column moments at a joint.
3. Using the code relationships, select an assumed (critical) failure surface and calculate a hypothetical maximum punching shear stress for the assumed surface.
4. Using the geometry of the column-slab location and its material properties, calculate an “allowable” punching shear stress.
5. If the maximum punching shear stress calculated does not exceed the allowable value, the section is considered safe.
6. If the hypothetical maximum punching shear stress exceeds the allowable value by a moderate amount, punching shear reinforcement may be provided to bring the connection within the safety requirements of the code.
7. If the hypothetical maximum punching shear reinforcement exceeds the allowable values by a large margin, the section has to be enlarged.

SPECIFIC VERIFICATION Chapter 5
189
The basic relationship is as follows:
where, Vu = absolute value of the direct shear Mu = unbalanced column moment Ac = area of concrete of assumed critical section γv = fraction of the moment transferred by shear c = distance from centroidal axis of critical section to the perimeter of the critical
section in the direction of analysis Jc = a geometry property of critical section, analogues to polar moment of inertia
of segments forming area Ac The first critical shear failure plane is assumed at a distance d/2 from the face of support, where “d” is the effective depth of the section. Expressions for Ac, Jc, and γv for all types of columns are given below. 5.10.2.1 Interior Column (Fig. 5.10-2)
v u V
A
M c
J
u
c
u
c= +
γ × ×

SPECIFIC VERIFICATION Chapter 5
190
FIGURE 5.10-2
Ac = 2d(c1 + c2 + 2d) Jc = (c1 + d) *d3/6 + (c1 + d) 3*d/6 + d * (c2 + d) * (c1+ d) 2 /2 γ V = 1- {1/[1+ (2/3) * ((c1 +d) / (c2 +d)) ½]}
where c1 and c2 are the column dimensions with c1 perpendicular to the axis of moment, and d is the effective depth.
5.10.2.2 End Column (Refer Fig. 5.10-3)

SPECIFIC VERIFICATION Chapter 5
191
FIGURE 5.10-3 FOR A DESIGN STRIP IN LEFT-
RIGHT DIRECTION
Ac = d (2c1 + c2 + 2d) cAB = (c1 + d/2 ) 2 / (2c1 + c2 + 2d ) cCD = (c1 + d/2 ) - cAB Jc = (c1 + d/2) *d3/6 + 2d * (cAB
3 + cCD3) / 3 + d * (c2 + d) cAB
2 γ V = 1- {1/[1+ (2/3) * ((c1 +d/2) / (c2 +d)) ½]}
where c1 and c2 are the column dimensions with c1 parallel to the axis of moment, and d is the effective depth.
5.10.2.3 Edge Column (Refer Fig. 5.10-4)
FIGURE 5.10-4 FOR A DESIGN STRIP IN LEFT-
RIGHT DIRECTION
Ac = d (2c2 + c1 + 2d) Jc = (c1 + d) 3 * d /12 + (c1 + d) *d3/12 + d * (c2 + d/2) * (c1+ d) 2 /2

SPECIFIC VERIFICATION Chapter 5
192
γ V = 1- {1/[1+ (2/3) * ((c1 +d) / (c2 +d/2)) ½]}
where c1 and c2 are the column dimensions with c1 perpendicular to the axis of moment and d is the effective depth. Column at the re-entrant corner as shown in Fig.5.10-5 is treated as Edge-column.
FIGURE 5.10-5
5.10.2.4 Corner Column (Refer Fig. 5.10-6)
FIGURE 5.10-6
Ac = d (c1 + c2 + d) cAB = (c1 + d/2 ) 2 / 2 * (c1 + c2 + d )

SPECIFIC VERIFICATION Chapter 5
193
cCD = (c1 + d/2 ) - cAB Jc = (c1 + d/2) *d3/12 + d * (cAB
3 + cCD3) / 3 + d * (c2 + d/2) cAB
2 γ V = 1- {1/[1+ (2/3) * ((c2 +d/2) / (c1 +d/2)) ½]}
where c1 and c2 are the column dimensions with c1 parallel to the axis of moment and d is the effective depth. For corner columns (Fig. 1.1-6) the column reaction does not act at the centroid of the critical section. The governing moment for the analysis of the design section is: Mue = Mu – Vu* e
FIGURE 5.10-7
5.10.2.5 Support with Drop Cap (Refer Fig. 5.10-8)
For supports provided with drop caps, or drop panels, a minimum of two punching shear checks are necessary. The first check is at distance “d1/2” from the face of the column, where d1 is the effective depth of the thickened section

SPECIFIC VERIFICATION Chapter 5
194
(drop cap or drop panel). The second check is at a distance d2/2 from the face of drop cap/panel, where d2 is the slab thickness.
FIGURE 5.10-8
5.10.3 Punching Shear Stress Calculations In order to keep the focus on punching shear stress calculation, the work starts by assuming that the design values (Mu and Vu) for each column-slab condition are given. In the general case, these are calculated from the analysis of a design strip, using the Equivalent Frame Method, or Finite Elements. The values used in this writing are obtained from an ADAPT-PT computer run. The hand calculations of the stresses are compared with the computer output for verification. Excellent agreement is obtained. 5.10.3.1 Support #1 – Corner Column (Refer Fig. 5.10-6)
Actions at the joint are:
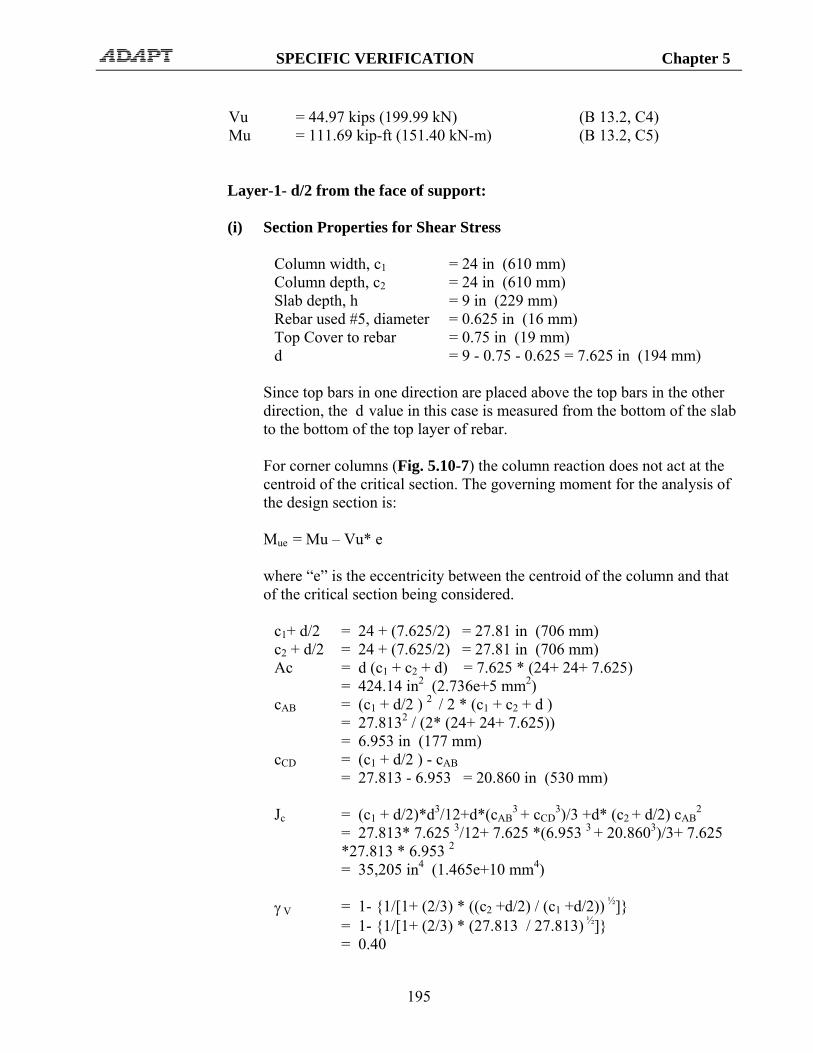
SPECIFIC VERIFICATION Chapter 5
195
Vu = 44.97 kips (199.99 kN) (B 13.2, C4) Mu = 111.69 kip-ft (151.40 kN-m) (B 13.2, C5)
Layer-1- d/2 from the face of support:
(i) Section Properties for Shear Stress
Column width, c1 = 24 in (610 mm) Column depth, c2 = 24 in (610 mm) Slab depth, h = 9 in (229 mm) Rebar used #5, diameter = 0.625 in (16 mm) Top Cover to rebar = 0.75 in (19 mm) d = 9 - 0.75 - 0.625 = 7.625 in (194 mm)
Since top bars in one direction are placed above the top bars in the other direction, the d value in this case is measured from the bottom of the slab to the bottom of the top layer of rebar. For corner columns (Fig. 5.10-7) the column reaction does not act at the centroid of the critical section. The governing moment for the analysis of the design section is: Mue = Mu – Vu* e where “e” is the eccentricity between the centroid of the column and that of the critical section being considered.
c1+ d/2 = 24 + (7.625/2) = 27.81 in (706 mm) c2 + d/2 = 24 + (7.625/2) = 27.81 in (706 mm) Ac = d (c1 + c2 + d) = 7.625 * (24+ 24+ 7.625) = 424.14 in2 (2.736e+5 mm2) cAB = (c1 + d/2 ) 2 / 2 * (c1 + c2 + d ) = 27.8132 / (2* (24+ 24+ 7.625)) = 6.953 in (177 mm) cCD = (c1 + d/2 ) - cAB = 27.813 - 6.953 = 20.860 in (530 mm) Jc = (c1 + d/2)*d3/12+d*(cAB
3 + cCD3)/3 +d* (c2 + d/2) cAB
2 = 27.813* 7.625 3/12+ 7.625 *(6.953 3 + 20.8603)/3+ 7.625
*27.813 * 6.953 2 = 35,205 in4 (1.465e+10 mm4) γ V = 1- {1/[1+ (2/3) * ((c2 +d/2) / (c1 +d/2)) ½]} = 1- {1/[1+ (2/3) * (27.813 / 27.813) ½]} = 0.40

SPECIFIC VERIFICATION Chapter 5
196
(ii) Stress Due to Shear
Vu / Ac = 44.97 / 424.14 = 0.106 ksi (0.73 MPa) (ADAPT-PT 0.11 ksi,
B13.2, C6)
(iii) Stress Due to Bending For the first support, if the column moment is clockwise, the moment due to shear must be deducted from the column moment. Eccentricity, e = (c1+ d/2) - cAB - c1/2 =27.813
– 6.953 – 12
= 8.860 in (225 mm) Mue = 111.69 - 44.97 * 8.860 /12 = 78.49 kip-ft (106.40 kN-m) M stress = (γ V * Mue * cAB)/ Jc = (0.40 * 78.49 * 12 * 6.953)/
35,205
= 0.074 ksi (0.51 MPa) (ADAPT-PT 0.074 ksi, B13.2, C7)
(iv) Total Stress
Total stress = Stress due to shear +
stress due to bending
= 0.106 +0.074 = 0.180 ksi (1.24 MPa) (ADAPT-PT 0.180 ksi,
B13.2, C8)
(v) Allowable Stress Column cross section is closer to a discontinuous edge than 4 times the slab thickness. Therefore, according to ACI-318-05 section 11.12.2.2, allowable stress shall be computed according to section 11.12.2.1. ∴Allowable stress is the least of φ vc = φ *( 2 + 4/βc )* √ f ‘c φ = 0.75 βc = long side of column/ short side of column = long side of column/ short side of column ∴ φ vc = 0.75 *( 2 + 4/1 )* √ 4000/1000 = 0.285 ksi (1.96 MPa)

SPECIFIC VERIFICATION Chapter 5
197
φ vc = φ *(( αs* d/ b0 )+ 2 )* √ f ‘c αs = 20 for corner columns d = 7.625 in (194 mm) b0 = Perimeter of the critical section = 2 * 27.813 = 55.626 in (1413 mm) φ vc = 0.75 *(( 20 * 7.625/ 55.626 )+ 2 )* √ 4000/1000 = 0.225 ksi (1.55 MPa) φ vc = φ *4* √ f ‘c = 0.75 * 4 * √ 4000/1000 = 0.190 ksi (1.31 MPa) ----------------- Controls ∴ Allowable Stress = 0.190 ksi (1.31 MPa) (ADAPT-PT 0.190
ksi, B13.2, C9)
(v) Stress Ratio Stress ratio = Actual / Allowable = 0.180 / 0.190 = 0.95 < 1 (ADAPT-PT 0.951, B13.2,
C10) ∴No reinforcement required.
5.10.3.2 Support #2 – Edge Column (Refer Fig. 5.10-4) Actions at the joint are: Vu = 99.65 kips (443.26 kN) (B 13.2, C4) Mu = 35.46 kip-ft (48.06 kN-m)
(B 13.2, C5)
Layer-1- d/2 from the face of support: (i) Section Properties for Shear Stress Computations
Column width, c1 = 24 in (610 mm) Column depth, c2 = 24 in (610 mm) Slab depth, h = 9 in (229 mm) Rebar used #5, diameter = 0.625 in (16 mm) Top Cover to rebar = 0.75 in (19 mm) d = 9 - 0.75 - 0.625 = 7.625 in (194 mm)

SPECIFIC VERIFICATION Chapter 5
198
Since top bars in one direction are placed above the top bars in the other direction, the d value in this case is measured from the bottom of the slab to the bottom of the top layer of rebar. c1+ d = 24 + 7.625 = 3 1.63 in (803 mm) c2 +d/2 = 24 + 7.625/2 = 27.81 in (706 mm) Ac = d (2c2 + c1 + 2d) = 7.625 * (2*24+ 24+ 2*7.625) = 665.28 in2 (4.292e+5 mm2) Jc = (c1+d) 3 *d /12 + (c1 + d)*d3/12+d*(c2+d/2)*(c1+ d) 2/2 = 31.625 3 *7.625 /12 + 31.625 *7.625 3/12+7.625
*27.813 *31.625 2/2 = 127,318 in4 (5.299e+10 mm4) γ V = 1- {1/[1+ (2/3) * ((c1 +d) / (c2 +d/2)) ½]} = 1- {1/[1+ (2/3) * (31.625 / 27.813) ½]} = 0.416
(ii) Stress Due to Direct Shear
Vu / Ac = 99.65 / 665.28 = 0.150 ksi (1.03 MPa) (ADAPT-PT 0.15 ksi, B13.2,
C6)
(iii) Stress Due to Bending M stress = (γ V * Mu * (c1+ d))/2* Jc = (0.416 * 35.46 * 12 * 31.625)
/ 2*127,318 = 0.022 ksi (0.15 MPa) (ADAPT-PT 0.022 ksi,
B13.2, C7)
(iv) Total Stress Total stress = Stress due to shear +
stress due to bending
= 0.150 + 0.022 = 0.172 ksi (1.18 MPa) (ADAPT-PT 0.172 ksi,
B13.2, C8)
(v) Allowable Stress Column cross section is closer to a discontinuous edge than 4 times the slab thickness. Therefore, according to ACI-318-05 section 11.12.2.2, allowable stress shall be computed according to section 11.12.2.1. ∴Allowable stress is the least of

SPECIFIC VERIFICATION Chapter 5
199
φ vc = φ *( 2 + 4/βc )* √ f ‘c φ = 0.75 βc = long side of column/ short side of column = 24/24 =1 ∴ φ vc = 0.75 *( 2 + 4/1 )* √ 4000/1000 = 0.285 ksi (1.96 MPa) φ vc = φ *(( αs* d/ b0 )+ 2 )* √ f ‘c αs = 30 for edge column d = 7.625 in (194 mm) b0 = Perimeter of the critical section = 2 * 27.813 +31.625 = 87.251 in (2216 mm) φ vc = 0.75 *(( 30 * 7.625/ 87.251 )+ 2 )* √ 4000/1000 = 0.219 ksi (1.51 MPa) φ vc = φ *4* √ f ‘c = 0.75 * 4 * √ 4000/1000 = 0.190 ksi (1.31 MPa) ----------------- Controls ∴ Allowable Stress = 0.190 ksi (1.31 MPa) (ADAPT-PT 0.190
ksi, B13.2, C9)
(v) Stress Ratio Stress ratio = Actual / Allowable = 0.172 / 0.190 = 0.91 < 1 (ADAPT-PT 0.905, B13.2,
C10)
∴No reinforcement required.
5.10.3.3 Support #3 – Edge Column (Refer Fig. 5.10-5) Actions at the joint are: Vu = 155.11 kips (690.00 kN) (B 13.2, C4) Mu = 172.50 kip-ft (233.88 kN-m) (B 13.2, C5) Layer-1- d/2 from the face of support: (i) Section Properties for Shear Stress Computations
Column width, c1 = 28 in (711 mm) Column depth, c2 = 28 in (711 mm)

SPECIFIC VERIFICATION Chapter 5
200
Slab depth, h = 9 in (229 mm) Rebar used #5, diameter = 0.625 in (16 mm) Top Cover to rebar = 0.75 in (19 mm) d = 9 - 0.75 - 0.625 = 7.625 in (194 mm) Since top bars in one direction are placed above the top bars in the other direction, the d value in this case is measured from the bottom of the slab to the bottom of the top layer of rebar. c1+ d = 28 + 7.625 = 35.63 in (905 mm) c2 +d/2 = 28 + 7.625/2 = 31.81 in (808 mm) Ac = d (2c2 + c1 + 2d) = 7.625 * (2*28+ 28+ 2*7.625) = 756.78 in2 (4.882e+5 mm2) Jc = (c1+d) 3 *d /12 + (c1 + d)*d3/12+d*(c2+d/2)*(c1+ d) 2/2 = 35.625 3 *7.625 /12 + 35.625 *7.625 3/12 +7.625
*31.813 *35.625 2/2 = 183,976 in4 (7.658e+10 mm4) γ V = 1- {1/[1+ (2/3) * ((c1 +d) / (c2 +d/2)) ½]} = 1- {1/[1+ (2/3) * (35.625 / 31.813) ½]} = 0.414
(ii) Stress Due to Direct Shear
Vu / Ac = 155.11 / 756.78 = 0.205 psi (1.41 MPa)
(iii) Stress Due to Bending M stress = (γ V * Mu * (c1+ d ))/2* Jc = (0.414 * 172.50 * 12 * 35.625)
/ 2*183,976 = 0.083 psi (0.57 MPa)
(iv) Total Stress Total stress = Stress due to shear +
stress due to bending
= 0.205 + 0.083 = 0.288 ksi (1.99 MPa) (ADAPT-PT 0.288 ksi,
B30, C9)
(v) Allowable Stress Column cross section is closer to a discontinuous edge than 4 times the slab thickness. Therefore, according to ACI-318-05 section 11.12.2.2, allowable stress shall be computed according to section 11.12.2.1.

SPECIFIC VERIFICATION Chapter 5
201
∴Allowable stress is the least of φ vc = φ *( 2 + 4/βc )* √ f ‘c φ = 0.75 βc = long side of column/ short side of column = 28/28 =1 ∴ φ vc = 0.75 *( 2 + 4/1 )* √ 4000/1000 = 0.285 ksi (1.96 MPa) φ vc = φ *(( αs* d/ b0 )+ 2 )* √ f ‘c αs = 30 for edge column d = 7.625 in (194 mm) b0 = Perimeter of the critical section = 2 * 31.813 +35.625 = 99.251 in (2521 mm) φ vc = 0.75 *(( 30 * 7.625/ 99.251 )+ 2 )* √ 4000/1000 = 0.204 ksi (1.41 MPa) φ vc = φ *4* √ f ‘c = 0.75 * 4 * √ 4000/1000 = 0.190 ksi (1.31 MPa) ----------------- Controls ∴ Allowable Stress = 0.190 ksi (1.31 MPa)
(ADAPT-PT 0.190 ksi, B30, C10)
(vi) Stress Ratio
Stress ratio = Actual / Allowable = 0.288 / 0.190 = 1.52 > 1 N.G (ADAPT-PT 1.52, B30, C11) For 4√f ‘c allowable stress, according to ACI-318-05 section 11.12.3.2, the maximum allowed is 1.5 times the permissible value. Therefore enlarge the section resisting the punching shear. But the program continues with the calculation of shear stress for the successive layers to give an idea to the users.
5.10.3.4 Support #4 – Interior Column (Refer Fig. 5.10-2)
Actions at the joint are:
Vu = 198.15 kips (881.41 kN) (B 13.2, C4) Mu = 29.35 kip-ft (39.79 kN-m) (B 13.2, C5)

SPECIFIC VERIFICATION Chapter 5
202
Layer-1- d/2 from the face of support: (i) Section Properties for Shear Stress Computations
Column width, c1 = 24 in (610 mm) Column depth, c2 = 24 in (610 mm) Slab depth, h = 9 in (229 mm) Rebar used #5, diameter = 0.625 in (16 mm) Top Cover to rebar = 0.75 in (19 mm) d = 9 - 0.75 - 0.625 = 7.625 in (194 mm) Since top bars in one direction are placed above the top bars in the other direction, the d value in this case is measured from the bottom of the slab to the bottom of the top layer of rebar. c1+ d = 24 + 7.625 = 31.63 in (803 mm) c2 +d = 24 + 7.625 = 31.63 in (803 mm) Ac = 2d(c1 + c2 + 2d)) = 2*7.625 * (24+ 24+ 2*7.625) = 964.56 in2 (6.223e+5 mm2) Jc = (c1+ d)*d3/6+ (c1 + d) 3*d/6 +d* (c2 + d)*(c1+ d) 2 /2 = 31.625*7.625 3/6 +31.625 3*7.625 /6+7.625 *31.625*
31.625 2 /2 = 163,120 in4 (6.790e+10 mm4) γ V = 1- {1/[1+ (2/3) * ((c1 +d) / (c2 +d)) ½]} = 1- {1/[1+ (2/3) * (31.625 / 31.625) ½]} = 0.40
(ii) Stress Due to Direct Shear
Vu / Ac = 198.15 / 964.56 = 0.205 ksi (1.42 MPa)
(iii) Stress Due to Bending M stress = (γ V * Mu * (c1+ d))/ (2* Jc) = (0.40 * 29.35 * 12 * 31.625)
/ 2*163,120 = 0.014 ksi (0.09 MPa)
(iv) Total Stress
Total stress = Stress due to shear +
stress due to bending
= 0.205 + 0.014 = 0.219 psi (1.51 MPa) (ADAPT-PT 0.219 ksi,
B30, C9)

SPECIFIC VERIFICATION Chapter 5
203
(v) Allowable Stress
From ACI-318-05 equation 11.36 Allowable Stress is
φ vc = φ *[( βp* √ f ‘c + 0.3 * fpc ) + Vp]
where,
φ = 0.75 βp is the smaller of 3.5 or (( αs* d/ b0 )+ 1.5) αs = 40 for interior column b0 = Perimeter of the critical section = 4 * 31.625 = 126.50 in (3213 mm) d = 7.625 in (194 mm) βp = (( αs* d/ b0 )+ 1.5) = (( 40* 7.625 / 126.50 )+ 1.5) = 3.91 >3.50, ∴use 3.50 fpc = P/A = 125.03 psi (0.86 MPa) (ADAPT-PT B 7.2) φ vc = 0.75 *( 3.5* √ 4000 + 0.3 *125.03 )/1000 = 0.194 ksi (1.34 MPa)
∴ Allowable Stress = 0.194 ksi (1.34 MPa) (ADAPT-PT 0.194
ksi, B30, C10)
Note that in the evaluation of allowable stresses, the term corresponding to the vertical component of tendon force (Vp) is conservatively disregarded.
(vi) Stress Ratio
Stress ratio = Actual / Allowable = 0.219 / 0.194 = 1.13 > 1 (ADAPT-PT 1.13, B30, C11)
Punching Shear Stress exceeds the permissible value. Provide shear reinforcement.
(vii) Check Maximum Shear stress
φ vn ≤ φ 6*√f’c
φ 6*√f’c = 0.75*6*√4000/1000

SPECIFIC VERIFICATION Chapter 5
204
= 0.285 ksi > 0.219 ksi OK
(viii) Shear Reinforcement Design
u c 0v
y
(v φv )b sAφ f sin α−
=
c cφv φ2 f '= = 0.75* 2√ 4000 /1000 = 0.095 ksi
(0.219 0.095)126.50 7.625 / 2Av0.75 60
− ×=
× = 1.33 in2
(ADAPT 1.33, B30, C12)
Assume #5 stirrups, area of 1 leg = 0.31 in2
Number of legs, Nlegs = 1.33 / 0.31 = 4.3
Distance between the legs = b0 / Nlegs = 126.50/5
= 25.30 in
> smax =2d = 15.25 in
∴ Distance between the legs = 15.25 in
(ADAPT 15.25, B30, C14)
∴ Number of legs, Nlegs = 126.50 / 15.25 = 8.30 ≈ 9
(ADAPT 9, B30, C13)
Since the stress exceeded at this location, check the next critical location at d from the face of support.
Layer-2- d from the face of support: (i) Section Properties for Shear Stress Computations
Column width, c1 = 24 in (610 mm) Column depth, c2 = 24 in (610 mm) Slab depth, h = 9 in (229 mm) Rebar used #5, diameter = 0.625 in (16 mm) Top Cover to rebar = 0.75 in (19 mm) d = 9 - 0.75 - 0.625 = 7.625 in (194 mm)

SPECIFIC VERIFICATION Chapter 5
205
Since top bars in one direction are placed above the top bars in the other direction, the d value in this case is measured from the bottom of the slab to the bottom of the top layer of rebar. c1+ 2d = 24 + 2*7.625 = 39.25 in (997 mm) c2 +2d = 24 + 2* 7.625 = 39.25 in (997 mm) Ac = 2d(c1 + c2 + 4d)) = 2*7.625 * (24+ 24+ 4*7.625) = 1197.13 in2 (7.723e+5 mm2) Jc = (c1+ 2d)*d3/6+ (c1 + 2d) 3*d/6 +d* (c2 + 2d)*(c1+ 2d) 2 /2 = 39.25*7.625 3/6 +39.25 3*7.625 /6+7.625 *39.25* 39.25 2
/2 = 310274 in4 (12.91+10 mm4) γ V = 1- {1/[1+ (2/3) * ((c1 +2d) / (c2 +2d)) ½]} = 1- {1/[1+ (2/3) * (39.25 / 39.25) ½]} = 0.40
(ii) Stress Due to Direct Shear
Vu / Ac = 198.15 / 1197.13 = 0.166 ksi (1.14 MPa)
(iii) Stress Due to Bending M stress = (γ V * Mu * (c1+ 2d))/ (2* Jc) = (0.40 * 29.35 * 12 * 39.25)
/ 2*310274 = 0.009 ksi (0.06 MPa)
(iv) Total Stress Total stress = Stress due to shear +
stress due to bending
= 0.166 + 0.009 = 0.175 psi (1.21 MPa) (ADAPT-PT 0.174 ksi,
B30, C9)
(v) Allowable Stress From ACI-318-05 equation 11.36 Allowable Stress is φ vc = φ *[( βp* √ f ‘c + 0.3 * fpc ) + Vp] where,

SPECIFIC VERIFICATION Chapter 5
206
φ = 0.75 βp is the smaller of 3.5 or (( αs* d/ b0 )+ 1.5) αs = 40 for interior column b0 = Perimeter of the critical section = 4 * 39.25 = 157 in (3988 mm) d = 7.625 in (194 mm) βp = (( αs* d/ b0 )+ 1.5) = (( 40* 7.625 / 157 )+ 1.5) = 3.44 <3.50, fpc = P/A = 125.03 psi (0.86 MPa) (ADAPT-PT B 7.2) φ vc = 0.75 *( 3.44* √ 4000 + 0.3 *125.03 )/1000 = 0.191 ksi (1.32 MPa) ∴ Allowable Stress = 0.191 ksi (1.32 MPa) (ADAPT-PT 0.191
ksi, B30, C10) Note that in the evaluation of allowable stresses, the term corresponding to the vertical component of tendon force (Vp) is conservatively disregarded. ACI -318-05, section 11.12.6.2(b) requires to check the shear stress at the section d/2 outside the outermost line shear reinforcement against φ *2* √ f ‘c. Therefore program considers this limit with the allowable stress if any layer needed shear reinforcement by calculation. φ vc = φ *2* √ f ‘c = 0.75 *2* √ 4000/1000 = 0.095 ksi
(vi) Stress Ratio Stress ratio = Actual / Allowable = 0.175 / 0.191 = 0.92 < 1 & > 0.095
ksi (ADAPT-PT 0.91, B30, C11)
Punching Shear Stress exceeds the permissible value. Provide shear reinforcement.
(vii) Check Maximum Shear stress
φ vn ≤ φ6*√f’c
φ6*√f’c = 0.75*6*√4000/1000
= 0.285 ksi > 0.175 ksi OK
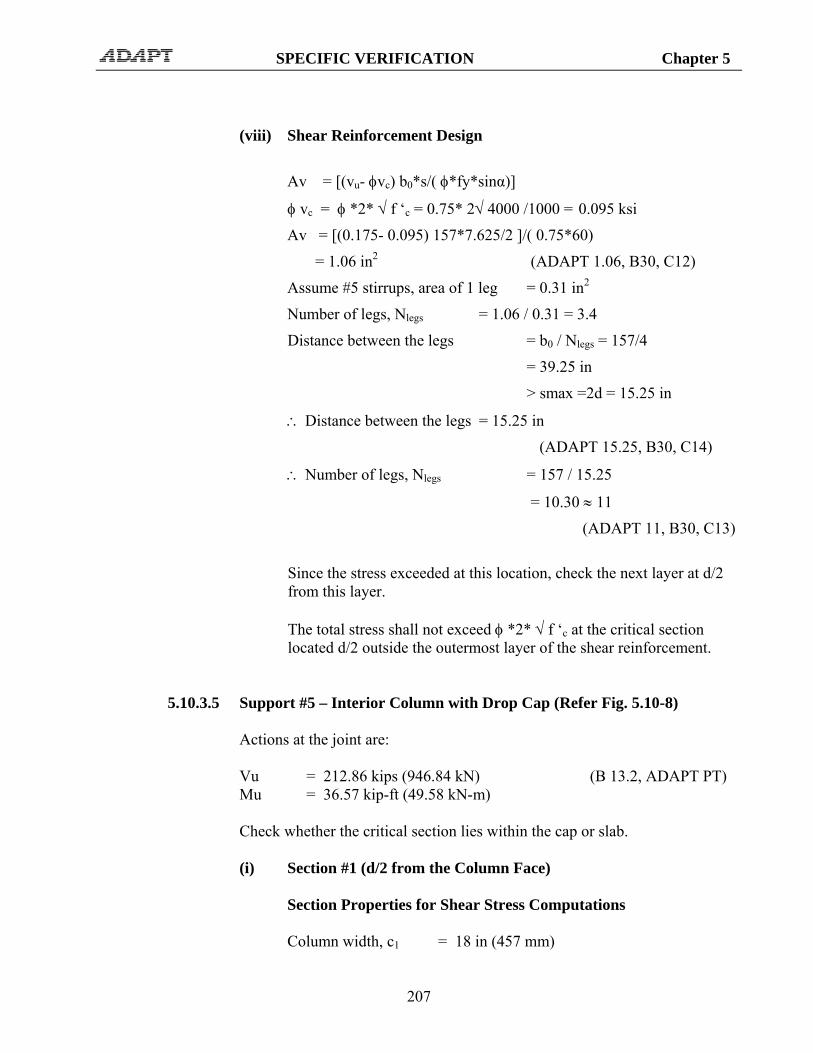
SPECIFIC VERIFICATION Chapter 5
207
(viii) Shear Reinforcement Design
Av = [(vu- φvc) b0*s/( φ*fy*sinα)]
φ vc = φ *2* √ f ‘c = 0.75* 2√ 4000 /1000 = 0.095 ksi
Av = [(0.175- 0.095) 157*7.625/2 ]/( 0.75*60)
= 1.06 in2 (ADAPT 1.06, B30, C12)
Assume #5 stirrups, area of 1 leg = 0.31 in2
Number of legs, Nlegs = 1.06 / 0.31 = 3.4
Distance between the legs = b0 / Nlegs = 157/4
= 39.25 in
> smax =2d = 15.25 in
∴ Distance between the legs = 15.25 in
(ADAPT 15.25, B30, C14)
∴ Number of legs, Nlegs = 157 / 15.25
= 10.30 ≈ 11
(ADAPT 11, B30, C13)
Since the stress exceeded at this location, check the next layer at d/2 from this layer. The total stress shall not exceed φ *2* √ f ‘c at the critical section located d/2 outside the outermost layer of the shear reinforcement.
5.10.3.5 Support #5 – Interior Column with Drop Cap (Refer Fig. 5.10-8) Actions at the joint are: Vu = 212.86 kips (946.84 kN) (B 13.2, ADAPT PT) Mu = 36.57 kip-ft (49.58 kN-m) Check whether the critical section lies within the cap or slab. (i) Section #1 (d/2 from the Column Face)
Section Properties for Shear Stress Computations Column width, c1 = 18 in (457 mm)

SPECIFIC VERIFICATION Chapter 5
208
Column depth, c2 = 18 in (457 mm) Slab depth, h = 9 +9 = 18 in (457 mm) Rebar used #5, diameter
= 0.625 in (16 mm)
Top Cover to rebar = 0.75 in (19 mm) d1 = 18- 0.75- 0.625 = 16.625 in (422 mm) Since top bars in one direction are placed above the top bars in the other direction, the d1 value in this case is measured from the bottom of the drop panel to the bottom of the top layer of rebar. c1+ d1 = 18 + 16.625 = 34.63 in (880 mm) c2+ d1 = 18 + 16.625 = 34.63 in (880 mm) Ac = 2d(c1 + c2 + 2d))= 2*16.625 * (18+ 18+ 2*16.625) = 2302.56 in2 (1.486e+6 mm2) Jc = (c1+ d)*d3/6+ (c1 + d) 3*d/6 +d* (c2 + d)*(c1+ d) 2 /2 = 34.625*16.625 3/6 +34.625 3*16.625 /6+16.625 *34.625*
34.625 2 /2 = 486,604 in4 (2.025e+11 mm4) γ V = 1- {1/[1+ (2/3) * ((c1 +d) / (c2 +d)) ½]} = 1- {1/[1+ (2/3) * (34.625 / 34.625) ½]} = 0.40
Stress Due to Direct Shear Vu / Ac = 212.86 / 2302.56 = 0.092 ksi (0.64 MPa)
Stress Due to Bending M stress = (γ V * Mu * (c1+ d))/ (2* Jc) = (0.40 * 36.57 * 12 * 34.625)/ 2*486,604 = 0.006 ksi (0.04 MPa)
Total Stress Total Stress = Stress due to shear + stress due to bending = 0.092 + 0.006 = 0.099 ksi (0.68 MPa)
(ADAPT-PT 0.099 ksi, B30, C9) Allowable Stress From ACI-318-05 (equation 11.36)

SPECIFIC VERIFICATION Chapter 5
209
Allowable Stress is φ vc = φ *[( βp* √ f ‘c + 0.3 * fpc ) + Vp] where, φ = 0.75 βp is the smaller of 3.5 or (( αs* d/ b0 )+ 1.5) αs = 40 for interior column b0 = Perimeter of the critical section = 4 * 34.625 = 138.50 in (3518 mm) d = 16.625 in (422 mm) βp = (( αs* d/ b0 )+ 1.5) = (( 40* 16.625 / 138.50 )+ 1.5) = 6.30 >3.50, ∴use 3.50 fpc = P/A = 125.03 psi (0.86 MPa) (ADAPT-PT B 7.2) φ vc = 0.75 *( 3.5* √ 4000 + 0.3 *125.03 )/1000 = 0.194 ksi (1.34 MPa)
(ADAPT-PT 0.190 ksi, B30, C10) Note that in the evaluation of allowable stresses, the term corresponding to the vertical component of tendon force (Vp) is conservatively disregarded. Stress Ratio Stress Ratio = Actual / Allowable = 0.099 / 0.194 = 0.51 (ADAPT-PT 0.52, B30, C11)
(ii) Section #2 (d/2 from the Drop Cap Face)
Section Properties for Shear Stress Computations Cap width, c1 = 45 in (1143 mm) Cap depth, c2 = 45 in (1143 mm) Slab depth, h = 9 in (229 mm) Rebar used #5, diameter
= 0.625 in (16 mm)
Top Cover to rebar = 0.75 in (19 mm) d2 = 9- 0.75- 0.625 = 7.625 in (194 mm)

SPECIFIC VERIFICATION Chapter 5
210
Since top bars in one direction are placed above the top bars in the other direction, the d2 value in this case is measured from the bottom of the slab to the bottom of the top layer of rebar. c1 CAP+ d2 = 45 + 7.625 = 52.63 in (1337 mm) c2 CAP+ d2 = 45 + 7.625 = 52.63 in (1337 mm) Ac = 2d(c1 + c2 + 2d) = 2*7.625 * (45+ 45+ 2*7.625) = 1605.06 in2 (1.036e+6 mm2) Jc = (c1+ d)*d3/6+ (c1 + d) 3*d/6 +d* (c2 + d)*(c1+ d) 2 /2 = (52.625 *7.625 3)/6 +(52.625 3*7.625) /6+(7.625
*52.625*52.625 2) /2 = 744,729 in4 (3.100e+11 mm4) γ V = 1- {1/[1+ (2/3) * ((c1 +d) / (c2 +d)) ½]} = 1- {1/[1+ (2/3) * (52.625 / 52.625) ½]} = 0.40 Stress Due to Direct Shear Vu / Ac = 212.86 / 1605.06 = 0.133 ksi (0.91 MPa) Stress Due to Bending M stress = (γ V * Mu * (c1+ d))/ (2* Jc) = (0.40 * 36.57 * 12 * 52.625)
/ 2*744,729 = 0.006 ksi (0.04 MPa) Total Stress Total Stress = Stress due to shear
+ stress due to bending = 0.133 + 0.006 = 0.139 ksi (0.96 MPa) (ADAPT-PT 0.139 ksi,
B30, C9) Allowable Stress From ACI-318-05 equation 11.36 Allowable Stress, φ vc = φ *[( βp* √ f ‘c + 0.3 * fpc ) + Vp] where,

SPECIFIC VERIFICATION Chapter 5
211
φ = 0.75 βp is the smaller of 3.5 or ( αs* d/ b0 )+ 1.5) αs = 40 for interior column b0 = Perimeter of the critical section = 4 * 52.625 = 210.50 in (5347 mm) d = 7.625 in (194 mm) βp = ( αs* d/ b0 )+ 1.5)
= ( 40* 7.625 / 210.50)+ 1.5)
= 2.95 < 3.50, ∴use 2.95 = P/A = 125.03 psi (0.86 MPa) ( ADAPT B7.2 ) ∴Allowable Stress = 0.168 ksi (1.16 MPa) (ADAPT-PT 0.164
ksi, B30, C10) Note that in the evaluation of allowable stresses, the term corresponding to the vertical component of tendon force (Vp) is conservatively disregarded. Stress Ratio Total Stress = Actual / Allowable = 0.139 / 0.168 = 0.83 < 1, OK (ADAPT-PT 0.85, B30, C11)
5.10.3.6 Support #6 – End Column (Refer Fig. 5.10-3) Actions at the joint are: Vu = 100.88 kips (448.73 kN) (B 30.2, ADAPT PT) Mu = 337.50 kip-ft (457.58 kN-m) (i) Section Properties for Shear Stress Computations
Column width, c1 = 28 in (711 mm) Column depth, c2 = 28 in (711 mm) Slab depth, h = 9 in (229 mm) Rebar used #5, diameter = 0.625 in (16 mm) Top Cover to rebar = 0.75 in (19 mm) d = 9 - 0.75 - 0.625 = 7.625 in (194 mm) Since top bars in one direction are placed above the top bars in the other direction, the d value in this case is measured from the bottom of the slab to the bottom of the top layer of rebar.

SPECIFIC VERIFICATION Chapter 5
212
c1 +d/2 = 28 + 7.625/2 = 31.81 in (808 mm) c2+ d = 28 + 7.625 = 35.63 in (905 mm) Ac = d (2c1 + c2 + 2d) = 7.625 * (2*28+ 28+ 2*7.625) = 756.78 in2 (4.882e+5 mm2) cAB = (c1 + d/2 )2 /(2c1 + c2 + 2d ) = 31.8132 / (2*28 + 28 + 2*7.625) = 10.200 in (259 mm) cCD = 31.813 - 10.200 = 21.613 in (549 mm) Jc = 31.813 *7.625 3/6 + 2*7.625 *(10.200 3 + 21.613 3)
/3 +7.625 *35.625*10.200 2 = 87,327 in4 (3.635e+10 mm4) γ V = 1- {1/[1+ (2/3) * ((c1 +d/2) / (c2 +d)) ½]} = 1- {1/[1+ (2/3) * (31.813 / 35.625) ½]} = 0.386
(ii) Stress Due to Direct Shear
Vu / Ac = 100.88 / 756.78 = 0.133 ksi (0.92 MPa)
(iii) Stress Due to Bending Mue = Mu – Vu* e For the last support, if the column moment is anticlockwise, the moment due to shear must be deducted. Eccentricity, e = (c1+ d/2) - cAB - c1/2 = 31.813 – 10.200 – 14 = 7.613 in (193 mm) Mue = 337.5- 100.88 * 7.613 /12 = 273.50 kip-ft (370.81 kN-m) M stress = (γ V * Mue * cAB)/ Jc = (0.386 * 273.50 * 12 * 10.200)/ 87,327 = 0.148 ksi (1.02 MPa)
(iv) Total Stress Total stress = Stress due to shear +
stress due to bending
= 0.133 + 0.148 = 0.281 ksi (1.94 MPa) (ADAPT-PT 0.281 ksi ,
B30, C9)
(v) Allowable Stress

SPECIFIC VERIFICATION Chapter 5
213
Column cross section is closer to a discontinuous edge than 4 times the slab thickness. Therefore, according to ACI-318-05 section 11.12.2.2, allowable stress shall be computed according to section 11.12.2.1. ∴Allowable stress is the least of φ vc = φ *( 2 + 4/βc )* √ f ‘c φ = 0.75 βc = long side of column/ short side of column = 28/28 =1 φ vc = 0.75 *( 2 + 4/1 )* √ 4000/1000 = 0.285 ksi (1.96 MPa) φ vc = φ *(( αs* d/ b0 )+ 2 )* √ f ‘c αs = 30 for end column d = 7.625 in (194 mm) b0 = Perimeter of the critical section = 2 * 31.813 +35.625 = 99.251 in (2521 mm) φ vc = 0.75 *(( 30 * 7.625/ 99.251 )+ 2 )* √ 4000/1000 = 0.204 ksi (1.41 MPa) φ vc = φ *4* √ f ‘c = 0.75 * 4 * √ 4000/1000 = 0.190 ksi (1.31 MPa) ----------------- Controls ∴ Allowable Stress = 0.190 ksi (1.31 MPa) (ADAPT-PT 0.190
ksi, B30, C10)
(vi) Stress Ratio Stress ratio = Actual / Allowable = 0.281 / 0.190 = 1.48 > 1, N.G (ADAPT-PT 1.48, B30, C11) Punching Shear Stress exceeds the permissible value. Provide shear reinforcement.
(vii) Check Maximum Shear stress
φ vn ≤ φ6*√f’c
φ6*√f’c = 0.75*6*√4000/1000

SPECIFIC VERIFICATION Chapter 5
214
= 0.285 ksi > 0.282 ksi OK
(viii) Shear Reinforcement Design
Av = [(vu- φvc) b0*s/( φ*fy*sinα)]
φ vc = φ *2* √ f ‘c = 0.75* 2√ 4000 /1000 = 0.095 ksi
Av = [(0.281- 0.095) 99.251*7.625/2 ]/( 0.75*60)
= 1.57 in2 (ADAPT 1.57, B30, C13)
Assume #5 stirrups, area of 1 leg = 0.31 in2
Number of legs, Nlegs = 1.57 / 0.31 = 5.06
Distance between the legs = b0 / Nlegs = 99.251/4
= 24.81 in
> smax =2d = 15.25 in
∴ Distance between the legs = 15.25 in
(ADAPT 15.25, B30, C14)
∴ Number of legs, Nlegs = 99.251 / 15.25
= 6.51 ≈ 7
(ADAPT 7, B30, C13)
Since the stress exceeded at this location, check the next layer at d/2 from this layer.
5.10.4 Computed Values
5.10.4.1 Computer Report for American Units
Comments: If a stress ratio exceeds 1.50, the section has to be enlarged, or re-designed such as to bring the ratio to 1.50 or less. In this case, column 3 has been conservatively modeled as an “edge column.” Its punching shear capacity is larger than assumed in the program. For this reason, it is acceptable if reinforced.

SPECIFIC VERIFICATION Chapter 5
215
1 - USER SPECIFIED GENERAL ANALYSIS AND DESIGN PARAMETERS
Parameter Value Parameter Value Concrete Minimum Cover at BOTTOM 0.75 in
F'c for BEAMS/SLABS 4000.00 psi Post-tensioning For COLUMNS/WALLS 4000.00 psi SYSTEM UNBONDED Ec for BEAMS/SLABS 3605.00 ksi Fpu 270.00 ksi
For COLUMNS/WALLS 3605.00 ksi Fse 175.00 ksi CREEP factor 2.00 Strand area 0.153 in 2
CONCRETE WEIGHT NORMAL Min CGS from TOP 1.00 in UNIT WEIGHT 150.00 pcf Min CGS from BOT for interior spans 1.00 in
Tension stress limits / (f'c)1/2 Min CGS from BOT for exterior spans 1.00 in At Top 6.000 Min average precompression 125.00 psi
At Bottom 6.000 Max spacing / slab depth 8.00 Compression stress limits / f'c Analysis and design options
At all locations 0.450 Structural system TWO-WAY Reinforcement Moment of Inertia over support is NOT INCREASEDFy (Main bars) 60.00 ksi Moments reduced to face of support YES
Fy (Shear reinforcement) 60.00 ksi Moment Redistribution NO Minimum Cover at TOP 0.75 in DESIGN CODE SELECTED ACI-318 (2005)
2 - INPUT GEOMETRY 2.1 Principal Span Data of Uniform Spans Span Form Length Width Depth TF Width TF
Thick. BF/MF Width
BF/MF Thick.
Rh Right Mult.
Left Mult.
ft in in in in in in in C 1 1.00 192.00 9.00 9.00 0.06 0.94 1 1 25.00 192.00 9.00 9.00 0.06 0.94 2 1 30.00 192.00 9.00 9.00 0.06 0.94 3 1 30.00 360.00 9.00 9.00 0.50 0.50 4 1 30.00 360.00 9.00 9.00 0.50 0.50 5 1 30.00 360.00 9.00 9.00 0.50 0.50 C 1 1.17 360.00 9.00 9.00 0.50 0.50
2.5 Drop Cap and Drop Panel Data Joint Cap T Cap B Cap DL Cap DR Drop TL Drop TR Drop B Drop L Drop R
in in in in in in in in in 1 0.00 0.00 0.00 0.00 0.00 0.00 0.00 0.00 0.00 2 0.00 0.00 0.00 0.00 0.00 0.00 0.00 0.00 0.00 3 0.00 0.00 0.00 0.00 0.00 0.00 0.00 0.00 0.00 4 0.00 0.00 0.00 0.00 0.00 0.00 0.00 0.00 0.00 5 18.00 45.00 22.50 22.50 0.00 0.00 0.00 0.00 0.00 6 0.00 0.00 0.00 0.00 0.00 0.00 0.00 0.00 0.00
2.7 Support Width and Column Data Joint Support
Width Length
LC B(DIA.)
LC D LC % LC CBC LC Length
UC B(DIA.)
UC D UC % UC CBC UC
in ft in in ft in in 1 24.0 10.0 24.0 24.0 100 (1) 10.0 24.0 24.0 100 (1) 2 24.0 10.0 24.0 24.0 100 (1) 10.0 24.0 24.0 100 (1) 3 28.0 10.0 28.0 28.0 100 (1) 10.0 28.0 28.0 100 (1) 4 24.0 10.0 24.0 24.0 100 (1) 10.0 24.0 24.0 100 (1) 5 18.0 10.0 18.0 18.0 100 (1) 10.0 18.0 18.0 100 (1) 6 28.0 10.0 28.0 28.0 100 (1) 10.0 28.0 28.0 100 (1)

SPECIFIC VERIFICATION Chapter 5
216
3 - INPUT APPLIED LOADING 3.1 Loading As Appears in User's Input Screen
Span Class Type W P1 P2 A B C F M k/ft2 k/ft k/ft ft ft ft k k-ft
CANT LL U 0.040 CANT SDL U 0.020
1 LL U 0.040 1 SDL U 0.020 2 LL U 0.040 2 SDL U 0.020 3 LL U 0.040 3 SDL U 0.020 4 LL U 0.040 4 SDL U 0.020 5 LL U 0.040 5 SDL U 0.020
CANT LL U 0.040 CANT SDL U 0.020
NOTE: SELFWEIGHT INCLUSION REQUIRED (SW= SELF WEIGHT Computed from geometry input and treated as dead loading. Unit selfweight W = 150.0 pcf 7 - SELECTED POST-TENSIONING FORCES AND TENDON PROFILES 7.1 Tendon Profile Tendon A
Span Type X1/L X2/L X3/L A/L CL 1 --- --- 0.000 --- 1 2 0.000 0.428 0.000 --- 2 2 0.000 0.500 0.000 --- 3 2 0.000 0.500 0.000 --- 4 2 0.000 0.500 0.000 --- 5 2 0.000 0.586 0.000 ---
CR 1 0.000 --- --- --- 7.2 Selected Post-Tensioning Forces and Tendon Drape Tendon A
Span Force CGS Left CGS C1 CGS C2 CGS Right P/A Wbal WBal (%DL) k in in in in psi k/-
CL 220.000 4.50 --- --- 4.50 127.31 0.000 0 1 220.000 4.50 --- 1.00 8.00 127.31 1.198 57 2 220.000 8.00 --- 1.00 8.00 127.31 1.141 54 3 405.100 8.00 --- 1.00 8.00 125.03 2.101 53 4 405.100 8.00 --- 1.00 8.00 125.03 2.101 53 5 405.100 8.00 --- 1.00 4.50 125.03 1.530 38
CR 405.100 4.50 --- --- 4.50 125.03 0.000 0 All Tendons
Span Force Total P/A Total WBal (%DL)
k psi CL 220 127.31 0 1 220 127.31 57 2 220 127.31 54 3 405.1 125.03 53

SPECIFIC VERIFICATION Chapter 5
217
4 405.1 125.03 53 5 405.1 125.03 38
CR 405.1 125.03 0 Approximate weight of strand: 982.4 LB 7.4 Required Minimum Post-Tensioning Forces Based on Stress Conditions Based on Minimum P/A
Type Left Center Right Left Center Right k k k k k k
CL ----- ----- 0.00 ----- ----- 216.00 1 52.38 0.00 101.37 216.00 216.00 216.00 2 166.93 59.38 236.37 216.00 216.00 216.00 3 327.33 137.88 366.00 405.00 405.00 405.00 4 320.34 82.17 110.98 405.00 405.00 455.63 5 136.31 128.40 338.64 455.63 405.00 405.00
CR 0.00 ----- ----- 405.00 ----- ----- 7.5 Service Stresses (tension shown positive) Envelope of Service 1
Span Left Top Left Bottom Center Top Center Bottom
Right Top Right Bottom
psi psi psi psi psi psi CL ----- ----- ----- ----- -127.31 -127.31 1 59.96 -314.59 -263.75 9.12 88.78 -343.41 2 142.42 -397.05 -294.50 39.87 -30.15 -438.72 3 181.92 -431.98 -337.94 87.88 210.69 -460.76 4 171.07 -421.14 -305.25 55.19 69.17 -520.93 5 99.57 -590.02 -379.63 129.56 226.67 -476.73
CR -125.03 -125.03 ----- ----- ----- ----- Envelope of Service 2
Span Left Top Left Bottom Center Top Center Bottom
Right Top Right Bottom
psi psi psi psi psi psi CL ----- ----- ----- ----- -127.31 -127.31 1 134.01 -388.64 -319.13 64.51 178.28 -432.91 2 263.33 -517.96 -371.83 117.21 95.92 -564.78 3 298.70 -548.77 -417.30 167.24 336.93 -586.99 4 288.47 -538.54 -377.27 127.20 145.07 -693.45 5 177.69 -767.58 -454.41 204.35 329.55 -579.61
CR -125.03 -125.03 ----- ----- ----- ----- 7.6 Post-Tensioning Balance Moments, Shears and Reactions Span Moments and Shears
Span Moment Left Moment Center Moment Right Shear Left Shear Right k-ft k-ft k-ft k k
CL ----- ----- 0.00 ----- 0.00 1 42.08 -32.26 53.09 2.05 2.05 2 76.50 -50.09 96.42 1.05 1.05 3 119.75 -79.66 127.83 -0.12 -0.12 4 125.50 -77.53 172.42 -0.21 -0.21 5 157.17 -53.21 72.60 -2.45 -2.45
CR 0.00 ----- ----- 0.00 ----- Reactions and Column Moments
Joint Reaction Moment Lower
Column
Moment Upper
Column

SPECIFIC VERIFICATION Chapter 5
218
k k-ft k-ft 1 -2.054 27.775 27.775 2 1.000 12.850 12.850 3 1.175 19.217 19.217 4 0.087 -1.394 -1.394 5 2.243 -10.317 -10.317 6 -2.451 -48.308 -48.308
Note: Moments are reported at face of support 8 - FACTORED MOMENTS AND REACTIONS ENVELOPE 8.1 Factored Design Moments (Not Redistributed)
Span Left Max
Left Min
Middle Max
Middle Min
Right Max
Right Min
k-ft k-ft k-ft k-ft k-ft k-ft CL ----- ----- ----- ----- 0.00 ----- 1 -73.88 -73.88 125.14 125.14 -147.71 -147.71 2 -179.13 -179.13 147.14 147.14 -217.37 -217.37 3 -339.80 -339.80 294.51 294.51 -367.02 -367.02 4 -341.04 -341.04 272.87 272.87 -449.17 -449.17 5 -482.41 -482.41 301.04 301.04 -238.11 -238.11
CR 0.00 ----- ----- ----- ----- ----- 8.2 Reactions and Column Moments
Joint Reaction Max
Reaction Min
Moment Lower
Column Max
Moment Lower
Column Min
Moment Upper
Column Max
Moment Upper
Column Min k k k-ft k-ft k-ft k-ft
1 44.96 44.96 -55.85 -55.85 -55.85 -55.85 2 99.66 99.66 -17.74 -17.74 -17.74 -17.74 3 155.12 155.12 -86.25 -86.25 -86.25 -86.25 4 198.12 198.12 14.69 14.69 14.69 14.69 5 212.89 212.89 -18.26 -18.26 -18.26 -18.26 6 100.89 100.89 168.76 168.76 168.76 168.76
8.3 Secondary Moments
Span Left Midspan Right k-ft k-ft k-ft
1 53.50 29.88 6.25 2 28.85 14.09 -0.49 3 36.85 38.49 40.15 4 37.69 40.60 43.57 5 24.93 59.85 93.75
Note: Moments are reported at face of support 13 - PUNCHING SHEAR REINFORCEMENT 13.1 Critical Section Geometry Column Layer Cond. a d b1 b2
in in in in 1 1 3 3.81 7.63 27.81 27.81 2 1 4 3.81 7.63 31.63 27.81 3 1 4 3.81 7.63 35.63 31.81 4 1 1 3.81 7.63 31.63 31.63 5 2 1 3.81 7.63 52.63 52.63

SPECIFIC VERIFICATION Chapter 5
219
6 1 2 3.81 7.63 31.81 35.63 13.2 Critical Section Stresses Label Layer Cond. Factored
shear Factored moment
Stress due to shear
Stress due to moment
Total stress Allowable stress
Stress ratio
k k-ft ksi ksi ksi ksi 1 1 3 -44.97 +111.69 0.11 0.074 0.180 0.190 0.951 2 1 4 -99.65 +35.46 0.15 0.022 0.172 0.190 0.905 3 1 4 -155.11 +172.50 0.20 0.083 0.288 0.190 1.517 4 1 1 -198.15 -29.35 0.21 0.014 0.219 0.194 1.128 5 2 1 -212.86 +36.57 0.13 0.006 0.139 0.164 0.849 6 1 2 -100.88 -337.50 0.13 0.148 0.281 0.190 1.483
13.3 Punching Shear Reinforcement Reinforcement option: Stirrups Bar Size: 5
Col. Dist N_Legs Dist N_Legs Dist N_Legs Dist N_Legs Dist N_Legs in in in in in
1 2 3 *** *** 4 3.8 9 7.6 11 11.4 13 15.3 15 19.1 17 5 6 3.8 7 7.6 8 11.4 9 15.3 10 19.1 11 6 22.9 12
Dist. = Distance measured from the face of support Note: Columns with --- have not been checked for punching shear. Note: Columns with *** have exceeded the maximum allowable shear stress. 30 - PUNCHING SHEAR REINFORCEMENT Reinforcement option: Stirrup Bar Size: 5 Column - 1 Layer Cond. a d b1 b2 Vu Mu Stress Allow. Ratio As NLegs Dist.
in in in in k k-ft ksi ksi in2 in 1 3 3.81 7.63 27.81 27.81 -44.97 111.69 0.180 0.190 0.95 0.00 0 0.00
Dist. = Distance between the legs Column - 2 Layer Cond. a d b1 b2 Vu Mu Stress Allow. Ratio As NLegs Dist.
in in in in k k-ft ksi ksi in2 in 1 4 3.81 7.63 31.63 27.81 -99.65 35.46 0.172 0.190 0.91 0.00 0 0.00
Dist. = Distance between the legs Column - 3 Layer Cond. a d b1 b2 Vu Mu Stress Allow. Ratio As NLegs Dist.
in in in in k k-ft ksi ksi in2 in 1 4 3.81 7.63 35.63 31.81 -155.11 172.50 0.288 0.190 1.52 **** **** **** 2 4 7.63 7.63 43.25 35.63 -155.11 172.50 0.239 0.190 1.26 1.40 8 15.25 3 4 11.44 7.63 50.87 39.44 -155.11 172.50 0.205 0.179 1.15 1.21 9 15.25 4 4 15.25 7.63 58.50 43.25 -155.11 172.50 0.178 0.170 1.05 1.03 10 15.25 5 4 19.06 7.63 66.13 47.06 -155.11 172.50 0.158 0.163 0.97 0.86 11 15.25 6 4 22.87 7.63 73.75 50.87 -155.11 172.50 0.142 0.157 0.90 0.70 12 15.25 7 4 26.69 7.63 81.37 54.69 -155.11 172.50 0.129 0.152 0.85 0.54 13 15.25

SPECIFIC VERIFICATION Chapter 5
220
8 4 30.50 7.63 89.00 58.50 -155.11 172.50 0.117 0.148 0.80 0.39 14 15.25 9 4 34.31 7.63 96.63 62.31 -155.11 172.50 0.108 0.144 0.75 0.25 15 15.25
10 4 38.12 7.63 104.25 66.13 -155.11 172.50 0.100 0.141 0.71 0.11 16 15.25 11 4 41.94 7.63 111.87 69.94 -155.11 172.50 0.093 0.138 0.68 0.00 0 0.00
Dist. = Distance between the legs Column - 4 Layer Cond. a d b1 b2 Vu Mu Stress Allow. Ratio As NLegs Dist.
in in in in k k-ft ksi ksi in2 in 1 1 3.81 7.63 31.63 31.63 -198.15 -29.35 0.219 0.194 1.13 1.33 9 15.25 2 1 7.63 7.63 39.25 39.25 -198.15 -29.35 0.174 0.191 0.91 1.06 11 15.25 3 1 11.44 7.63 46.87 46.87 -198.15 -29.35 0.145 0.176 0.82 0.79 13 15.25 4 1 15.25 7.63 54.50 54.50 -198.15 -29.35 0.124 0.166 0.75 0.54 15 15.25 5 1 19.06 7.63 62.13 62.13 -198.15 -29.35 0.108 0.158 0.69 0.28 17 15.25 6 1 22.87 7.63 69.75 69.75 -198.15 -29.35 0.096 0.151 0.64 0.00 0 0.00
Dist. = Distance between the legs Column - 5 Layer Cond. a d b1 b2 Vu Mu Stress Allow. Ratio As NLegs Dist.
in in in in k k-ft ksi ksi in2 in 1 1 8.31 16.62 34.62 34.62 -212.86 36.57 0.099 0.190 0.52 0.00 0 0.00 2 1 3.81* 7.63 52.63 52.63 -212.86 36.57 0.139 0.164 0.85 0.00 0 0.00
Dist. = Distance between the legs Column - 6 Layer Cond. a d b1 b2 Vu Mu Stress Allow. Ratio As NLegs Dist.
in in in in k k-ft ksi ksi in2 in 1 2 3.81 7.63 31.81 35.63 -100.88 -337.50 0.281 0.190 1.48 1.57 7 15.25 2 2 7.63 7.63 35.63 43.25 -100.88 -337.50 0.215 0.190 1.13 1.17 8 15.25 3 2 11.44 7.63 39.44 50.87 -100.88 -337.50 0.171 0.179 0.96 0.84 9 15.25 4 2 15.25 7.63 43.25 58.50 -100.88 -337.50 0.140 0.170 0.83 0.56 10 15.25 5 2 19.06 7.63 47.06 66.13 -100.88 -337.50 0.118 0.163 0.72 0.31 11 15.25 6 2 22.87 7.63 50.87 73.75 -100.88 -337.50 0.100 0.157 0.64 0.08 12 15.25 7 2 26.69 7.63 54.69 81.37 -100.88 -337.50 0.087 0.152 0.57 0.00 0 0.00
Dist. = Distance between the legs Note: Columns with --- have not been checked for punching shear. Note: Columns with *** have exceeded the maximum allowable shear stress. Note: For the layers with As = 0.00, more reinforcement is provided to satisfy provision 13.3.7.4 of canadian-04 design code. Legend (2.1): Span C = Cantilever Form 1 = Rectangular, 2 = T or Inverted L, 3 = I, 4 = Extended T or L section Rh Elevation of top surface TF Top flange MF Middle flange BF Bottom flange Legend (2.5): Drop Cap Dimensions: Drop Panel Dimensions: CAP T = Total depth of cap DROP TL = Total depth left of joint CAP B = Transverse Width DROP TR = Total depth right of joint CAP DL = Extension left of joint DROP B = Transverse Width CAP DR = Extension right of joint DROP L = Extension left of joint --- DROP R = Extension right of joint

SPECIFIC VERIFICATION Chapter 5
221
Legend (2.7): The Column Boundary Condition (CBC): Fixed at both 1 Hinged at near end, fixed at far end 2 Fixed at near end, hinged at far end 3 Fixed at near end, roller with rotational fixity at far end 4 LC Lower Column UC Upper Column Legend (3.1): Class: SW: Selfweight, LL: Live Load, SDL: Superimposed Dead Load, X: Other Loading Type: U: Uniform, P: Partial Uniform, L: Line Load, M: Applied Moment C: Concentrated Load, R: Triangle, V: Variable, T: Trapezoidal Legend (7.1): Type 1 = reversed parabola 2 = simple parabola with straight portion over support 3 = harped tendon 4 = straight tendon 5 = extended reversed parabola Legend (7.2): CGS C1: CGS of left middle point of tendon for type 5 profile CGS C2: CGS of right middle point of tendon for type 5 profile or middle point of other types Legend (13): Cond. : 1 = Interior, 2 = End, 3 = Corner, 4 = Edge a : The distance between the layer and face of column or drop cap(*) d : Effective depth b1 : length of section parallel to span line b2 : length of section normal to span line Vu : Factored shear Mu : Factored moment Stress : Maximum stress Allow : Allowable stress Ratio : Ratio of calculated to allowable stress As : Required area of reinforcement Nlegs : Number of legs for stirrup Legend (30): Cond. : 1 = Interior, 2 = End, 3 = Corner, 4 = Edge a : The distance between the layer and face of column or drop cap(*) d : Effective depth b1 : length of section parallel to span line b2 : length of section normal to span line Vu : Factored shear Mu : Factored moment Stress : Maximum stress Allow : Allowable stress Ratio : Ratio of calculated to allowable stress As : Required area of reinforcement Nlegs : Number of legs for stirrup
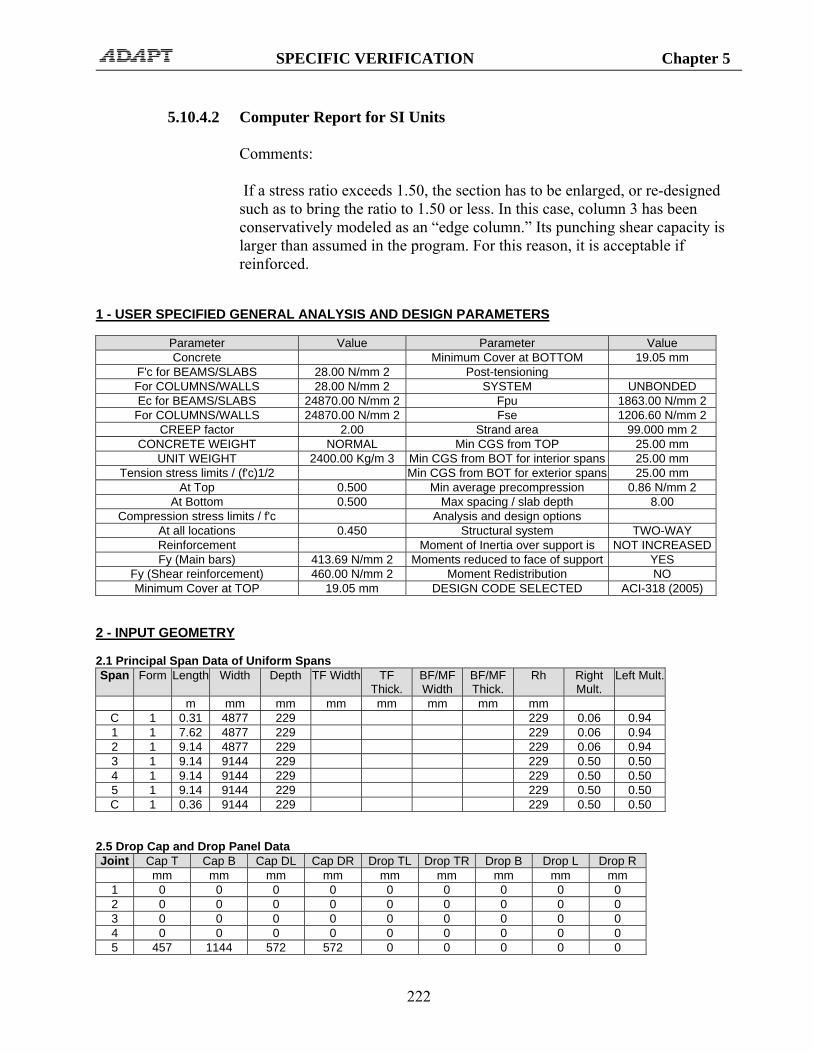
SPECIFIC VERIFICATION Chapter 5
222
5.10.4.2 Computer Report for SI Units Comments: If a stress ratio exceeds 1.50, the section has to be enlarged, or re-designed such as to bring the ratio to 1.50 or less. In this case, column 3 has been conservatively modeled as an “edge column.” Its punching shear capacity is larger than assumed in the program. For this reason, it is acceptable if reinforced.
1 - USER SPECIFIED GENERAL ANALYSIS AND DESIGN PARAMETERS
Parameter Value Parameter Value Concrete Minimum Cover at BOTTOM 19.05 mm
F'c for BEAMS/SLABS 28.00 N/mm 2 Post-tensioning For COLUMNS/WALLS 28.00 N/mm 2 SYSTEM UNBONDED Ec for BEAMS/SLABS 24870.00 N/mm 2 Fpu 1863.00 N/mm 2
For COLUMNS/WALLS 24870.00 N/mm 2 Fse 1206.60 N/mm 2 CREEP factor 2.00 Strand area 99.000 mm 2
CONCRETE WEIGHT NORMAL Min CGS from TOP 25.00 mm UNIT WEIGHT 2400.00 Kg/m 3 Min CGS from BOT for interior spans 25.00 mm
Tension stress limits / (f'c)1/2 Min CGS from BOT for exterior spans 25.00 mm At Top 0.500 Min average precompression 0.86 N/mm 2
At Bottom 0.500 Max spacing / slab depth 8.00 Compression stress limits / f'c Analysis and design options
At all locations 0.450 Structural system TWO-WAY Reinforcement Moment of Inertia over support is NOT INCREASEDFy (Main bars) 413.69 N/mm 2 Moments reduced to face of support YES
Fy (Shear reinforcement) 460.00 N/mm 2 Moment Redistribution NO Minimum Cover at TOP 19.05 mm DESIGN CODE SELECTED ACI-318 (2005)
2 - INPUT GEOMETRY 2.1 Principal Span Data of Uniform Spans Span Form Length Width Depth TF Width TF
Thick. BF/MF Width
BF/MF Thick.
Rh Right Mult.
Left Mult.
m mm mm mm mm mm mm mm C 1 0.31 4877 229 229 0.06 0.94 1 1 7.62 4877 229 229 0.06 0.94 2 1 9.14 4877 229 229 0.06 0.94 3 1 9.14 9144 229 229 0.50 0.50 4 1 9.14 9144 229 229 0.50 0.50 5 1 9.14 9144 229 229 0.50 0.50 C 1 0.36 9144 229 229 0.50 0.50
2.5 Drop Cap and Drop Panel Data Joint Cap T Cap B Cap DL Cap DR Drop TL Drop TR Drop B Drop L Drop R
mm mm mm mm mm mm mm mm mm 1 0 0 0 0 0 0 0 0 0 2 0 0 0 0 0 0 0 0 0 3 0 0 0 0 0 0 0 0 0 4 0 0 0 0 0 0 0 0 0 5 457 1144 572 572 0 0 0 0 0

SPECIFIC VERIFICATION Chapter 5
223
6 0 0 0 0 0 0 0 0 0 2.7 Support Width and Column Data Joint Support
Width Length
LC B(DIA.)
LC D LC % LC CBC LC Length
UC B(DIA.)
UC D UC % UC CBC UC
mm m mm mm m mm mm 1 610.0 3.0 610.0 610.0 100 (1) 3.0 610.0 610.0 100 (1) 2 610.0 3.0 610.0 610.0 100 (1) 3.0 610.0 610.0 100 (1) 3 711.0 3.0 711.0 711.0 100 (1) 3.0 711.0 711.0 100 (1) 4 610.0 3.0 610.0 610.0 100 (1) 3.0 610.0 610.0 100 (1) 5 457.0 3.0 457.0 457.0 100 (1) 3.0 457.0 457.0 100 (1) 6 711.0 3.0 711.0 711.0 100 (1) 3.0 711.0 711.0 100 (1)
3 - INPUT APPLIED LOADING 3.1 Loading As Appears in User's Input Screen
Span Class Type W P1 P2 A B C F M kN/m2 kN/m kN/m m m m kN kN-m
CANT LL U 1.915 CANT SDL U 0.958
1 LL U 1.915 1 SDL U 0.958 2 LL U 1.915 2 SDL U 0.958 3 LL U 1.915 3 SDL U 0.958 4 LL U 1.915 4 SDL U 0.958 5 LL U 1.915 5 SDL U 0.958
CANT LL U 1.915 CANT SDL U 0.958
NOTE: SELFWEIGHT INCLUSION REQUIRED (SW= SELF WEIGHT Computed from geometry input and treated as dead loading. Unit selfweight W = 2400.0 Kg/m^3 7 - SELECTED POST-TENSIONING FORCES AND TENDON PROFILES 7.1 Tendon Profile Tendon A
Span Type X1/L X2/L X3/L A/L CL 2 --- --- 0.000 --- 1 2 0.000 0.428 0.000 --- 2 2 0.000 0.500 0.000 --- 3 2 0.000 0.500 0.000 --- 4 2 0.000 0.500 0.000 --- 5 2 0.000 0.586 0.000 ---
CR 2 0.000 --- --- --- 7.2 Selected Post-Tensioning Forces and Tendon Drape Tendon A
Span Force CGS Left CGS C1 CGS C2 CGS Right P/A Wbal WBal (%DL) kN mm mm mm mm MPa kN/-
CL 978.600 115.00 --- --- 115.00 0.88 0.000 0 1 978.600 115.00 --- 25.00 204.00 0.88 17.638 57

SPECIFIC VERIFICATION Chapter 5
224
2 978.600 204.00 --- 25.00 204.00 0.88 16.762 54 3 1800.850 204.00 --- 25.00 204.00 0.86 30.845 53 4 1800.850 204.00 --- 25.00 204.00 0.86 30.845 53 5 1800.850 204.00 --- 25.00 115.00 0.86 22.525 39
CR 1800.850 115.00 --- --- 115.00 0.86 0.000 0 All Tendons
Span Force Total P/A Total WBal (%DL)
kN MPa CL 978.6 0.88 0 1 978.6 0.88 57 2 978.6 0.88 54 3 1800.85 0.86 53 4 1800.85 0.86 53 5 1800.85 0.86 39
CR 1800.85 0.86 0 Approximate weight of strand: 446.8 Kg 7.4 Required Minimum Post-Tensioning Forces Based on Stress Conditions Based on Minimum P/A
Type Left Center Right Left Center Right kN kN kN kN kN kN
CL ----- ----- 0.00 ----- ----- 960.45 1 214.64 0.00 434.51 960.45 960.45 960.45 2 728.30 248.45 1032.76 960.45 960.45 960.45 3 1425.84 580.64 1598.78 1800.80 1800.80 1800.80 4 1401.69 340.97 458.38 1800.80 1800.80 2025.10 5 542.44 560.36 1487.44 2025.10 1800.80 1800.80
CR 0.00 ----- ----- 1800.80 ----- ----- 7.5 Service Stresses (tension shown positive) Envelope of Service 1
Span Left Top Left Bottom Center Top Center Bottom
Right Top Right Bottom
MPa MPa MPa MPa MPa MPa CL ----- ----- ----- ----- -0.89 -0.86 1 0.40 -2.15 -1.81 0.05 0.60 -2.35 2 0.96 -2.72 -2.02 0.26 -0.22 -3.00 3 1.24 -2.96 -2.32 0.60 1.44 -3.16 4 1.17 -2.89 -2.10 0.38 0.47 -3.56 5 0.66 -4.00 -2.62 0.90 1.56 -3.28
CR -0.87 -0.85 ----- ----- ----- ----- Envelope of Service 2
Span Left Top Left Bottom Center Top Center Bottom
Right Top Right Bottom
MPa MPa MPa MPa MPa MPa CL ----- ----- ----- ----- -0.89 -0.86 1 0.91 -2.66 -2.19 0.43 1.21 -2.97 2 1.80 -3.55 -2.55 0.80 0.64 -3.87 3 2.04 -3.76 -2.86 1.14 2.30 -4.02 4 1.98 -3.70 -2.59 0.87 0.99 -4.74 5 1.19 -5.20 -3.14 1.42 2.28 -4.00
CR -0.87 -0.85 ----- ----- ----- ----- 7.6 Post-Tensioning Balance Moments, Shears and Reactions Span Moments and Shears

SPECIFIC VERIFICATION Chapter 5
225
Span Moment Left Moment Center Moment Right Shear Left Shear Right kN-m kN-m kN-m kN kN
CL ----- ----- 0.49 ----- 0.00 1 57.62 -44.11 72.53 9.16 9.16 2 104.40 -68.37 131.60 4.72 4.72 3 163.30 -108.70 174.50 -0.55 -0.55 4 171.60 -106.10 233.70 -0.75 -0.75 5 210.80 -73.72 100.60 -11.43 -11.43
CR 0.90 ----- ----- 0.00 ----- Reactions and Column Moments
Joint Reaction Moment Lower
Column
Moment Upper
Column kN kN-m kN-m
1 -9.157 37.800 37.800 2 4.442 17.480 17.480 3 5.266 26.170 26.170 4 0.202 -1.683 -1.683 5 10.680 -15.150 -15.150 6 -11.430 -66.380 -66.380
Note: Moments are reported at face of support 8 - FACTORED MOMENTS AND REACTIONS ENVELOPE 8.1 Factored Design Moments (Not Redistributed)
Span Left Max
Left Min
Middle Max
Middle Min
Right Max
Right Min
kN-m kN-m kN-m kN-m kN-m kN-m CL ----- ----- ----- ----- 0.00 ----- 1 -99.91 -99.91 169.97 169.97 -200.24 -200.24 2 -242.80 -242.80 199.70 199.70 -294.92 -294.92 3 -460.62 -460.62 399.86 399.86 -497.58 -497.58 4 -463.26 -463.26 371.20 371.20 -606.54 -606.54 5 -646.64 -646.64 411.18 411.18 -325.43 -325.43
CR 0.00 ----- ----- ----- ----- ----- 8.2 Reactions and Column Moments
Joint Reaction Max
Reaction Min
Moment Lower
Column Max
Moment Lower
Column Min
Moment Upper
Column Max
Moment Upper
Column Min kN kN kN-m kN-m kN-m kN-m
1 200.09 200.09 -75.62 -75.62 -75.62 -75.62 2 443.57 443.57 -23.99 -23.99 -23.99 -23.99 3 690.43 690.43 -116.77 -116.77 -116.77 -116.77 4 882.32 882.32 19.41 19.41 19.41 19.41 5 945.80 945.80 -22.17 -22.17 -22.17 -22.17 6 450.25 450.25 230.27 230.27 230.27 230.27
8.3 Secondary Moments
Span Left Midspan Right kN-m kN-m kN-m
1 72.81 40.71 8.62 2 39.35 19.23 -0.65 3 50.21 52.53 54.88 4 51.91 55.12 58.37 5 30.86 80.50 128.70

SPECIFIC VERIFICATION Chapter 5
226
Note: Moments are reported at face of support 13 - PUNCHING SHEAR REINFORCEMENT 13.1 Critical Section Geometry Column Layer Cond. a d b1 b2
mm mm mm mm 1 1 3 96.97 193.95 706.98 706.98 2 1 4 96.97 193.95 803.95 706.98 3 1 4 96.97 193.95 904.95 807.98 4 1 1 96.97 193.95 803.95 803.95 5 2 1 96.97 193.95 1338.00 1338.00 6 1 2 96.97 193.95 807.98 904.95
13.2 Critical Section Stresses Label Layer Cond. Factored
shear Factored moment
Stress due to shear
Stress due to moment
Total stress Allowable stress
Stress ratio
kN kN-m MPa MPa MPa MPa 1 1 3 -200.09 +151.23 0.73 0.510 1.240 1.318 0.941 2 1 4 -443.58 +48.04 1.03 0.151 1.182 1.318 0.897 3 1 4 -690.43 +233.64 1.41 0.570 1.982 1.318 1.504 4 1 1 -882.32 -38.79 1.41 0.091 1.506 1.318 1.143 5 2 1 -945.84 +44.33 0.91 0.038 0.949 1.136 0.835 6 1 2 -450.24 -460.62 0.92 1.027 1.948 1.318 1.478
13.3 Punching Shear Reinforcement Reinforcement option: Stirrups Bar Size: 16
Col. Dist N_Legs Dist N_Legs Dist N_Legs Dist N_Legs Dist N_Legs mm mm mm mm mm
1 2 3 *** *** 4 97.0 9 193.9 11 290.9 13 387.9 15 484.9 17 5 6 97.0 7 193.9 8 290.9 9 387.9 10 484.9 11 6 581.9 12
Dist. = Distance measured from the face of support Note: Columns with --- have not been checked for punching shear. Note: Columns with *** have exceeded the maximum allowable shear stress. 30 - PUNCHING SHEAR REINFORCEMENT Reinforcement option: Stirrup Bar Size: 16 Column - 1 Layer Cond. a d b1 b2 Vu Mu Stress Allow. Ratio As NLegs Dist.
mm mm mm mm kN kN-m MPa MPa mm2 mm 1 3 96.97 193.95 706.98 706.98 -200.09 151.23 1.240 1.318 0.94 0.00 0 0.00
Dist. = Distance between the legs Column - 2 Layer Cond. a d b1 b2 Vu Mu Stress Allow. Ratio As NLegs Dist.
mm mm mm mm kN kN-m MPa MPa mm2 mm 1 4 96.97 193.95 803.95 706.98 -443.58 48.04 1.182 1.318 0.90 0.00 0 0.00

SPECIFIC VERIFICATION Chapter 5
227
Dist. = Distance between the legs Column - 3 Layer Cond. a d b1 b2 Vu Mu Stress Allow. Ratio As NLegs Dist.
mm mm mm mm kN kN-m MPa MPa mm2 mm 1 4 96.97 193.95 904.95 807.98 -690.43 233.64 1.982 1.318 1.50 **** **** **** 2 4 193.95 193.95 1098.90 904.95 -690.43 233.64 1.648 1.318 1.25 809.00 8 387.903 4 290.92 193.95 1292.80 1001.90 -690.43 233.64 1.408 1.240 1.14 694.60 9 387.904 4 387.90 193.95 1486.80 1098.90 -690.43 233.64 1.228 1.179 1.04 589.60 10 387.905 4 484.88 193.95 1680.80 1195.90 -690.43 233.64 1.088 1.129 0.96 491.30 11 387.906 4 581.85 193.95 1874.70 1292.80 -690.43 233.64 0.976 1.089 0.90 397.70 12 387.907 4 678.83 193.95 2068.70 1389.80 -690.43 233.64 0.885 1.054 0.84 307.70 13 387.908 4 775.80 193.95 2262.60 1486.80 -690.43 233.64 0.809 1.025 0.79 220.40 14 387.909 4 872.78 193.95 2456.60 1583.80 -690.43 233.64 0.744 1.000 0.74 135.40 15 387.90
10 4 969.75 193.95 2650.50 1680.80 -690.43 233.64 0.690 0.978 0.71 52.05 16 387.9011 4 1066.70 193.95 2844.50 1777.70 -690.43 233.64 0.642 0.958 0.67 0.00 0 0.00
Dist. = Distance between the legs Column - 4 Layer Cond. a d b1 b2 Vu Mu Stress Allow. Ratio As NLegs Dist.
mm mm mm mm kN kN-m MPa MPa mm2 mm 1 1 96.97 193.95 803.95 803.95 -882.32 -38.79 1.506 1.318 1.14 765.90 9 387.902 1 193.95 193.95 997.90 997.90 -882.32 -38.79 1.199 1.299 0.92 606.50 11 387.903 1 290.92 193.95 1191.80 1191.80 -882.32 -38.79 0.996 1.195 0.83 452.10 13 387.904 1 387.90 193.95 1385.80 1385.80 -882.32 -38.79 0.852 1.120 0.76 300.70 15 387.905 1 484.88 193.95 1579.80 1579.80 -882.32 -38.79 0.744 1.063 0.70 151.10 17 387.906 1 581.85 193.95 1773.70 1773.70 -882.32 -38.79 0.660 1.019 0.65 0.00 0 0.00
Dist. = Distance between the legs Column - 5 Layer Cond. a d b1 b2 Vu Mu Stress Allow. Ratio As NLegs Dist.
mm mm mm mm kN kN-m MPa MPa mm2 mm 1 1 210.97 421.95 878.95 878.95 -945.84 44.33 0.676 1.318 0.51 0.00 0 0.00 2 1 96.97* 193.95 1338.00 1338.00 -945.84 44.33 0.949 1.136 0.84 0.00 0 0.00
Dist. = Distance between the legs Column - 6 Layer Cond. a d b1 b2 Vu Mu Stress Allow. Ratio As NLegs Dist.
mm mm mm mm kN kN-m MPa MPa mm2 mm 1 2 96.97 193.95 807.98 904.95 -450.24 -460.62 1.948 1.318 1.48 913.50 7 387.902 2 193.95 193.95 904.95 1098.90 -450.24 -460.62 1.489 1.318 1.13 678.90 8 387.903 2 290.92 193.95 1001.90 1292.80 -450.24 -460.62 1.184 1.240 0.95 486.70 9 387.904 2 387.90 193.95 1098.90 1486.80 -450.24 -460.62 0.970 1.179 0.82 321.90 10 387.905 2 484.88 193.95 1195.90 1680.80 -450.24 -460.62 0.813 1.129 0.72 176.20 11 387.906 2 581.85 193.95 1292.80 1874.70 -450.24 -460.62 0.694 1.089 0.64 44.15 12 387.907 2 678.83 193.95 1389.80 2068.70 -450.24 -460.62 0.602 1.054 0.57 0.00 0 0.00
Dist. = Distance between the legs Note: Columns with --- have not been checked for punching shear. Note: Columns with *** have exceeded the maximum allowable shear stress. Note: For the layers with As = 0.00, more reinforcement is provided to satisfy provision 13.3.7.4 of canadian-04 design code.

SPECIFIC VERIFICATION Chapter 5
228
5.11 INITIAL STRESS ANALYSIS
The Initial Stress Analysis allows the user to determine if additional mild steel reinforcing is required at force transfer of prestressing to concrete. Stress checks can be performed for any loading, post-tensioning, or concrete strength conditions. For initial stress check, user enters the initial concrete strength and the initial load combination factors during data input. This section verifies the results of the Initial Stress Check (Data block 27, detailed stresses) and the Reinforcement Requirements (Data block 29, detailed rebar). The reinforcement should be provided if the tension stress exceeds the allowable values. The two-span T-beam shown in Fig.-1 will be used for the verification.
FIGURE 5.11-1
Geometry and loading: L = 20 m Superimposed Dead Load = 23.88 kN/m Live Load = 22.11 kN/m Allowable stress at transfer of prestressing (initial stress): Tension Stress = 0.25(f’)
1/2
Compression Stress = 0.60(f’ci)
Load Combination: 1.0 SW + 1.15 PT
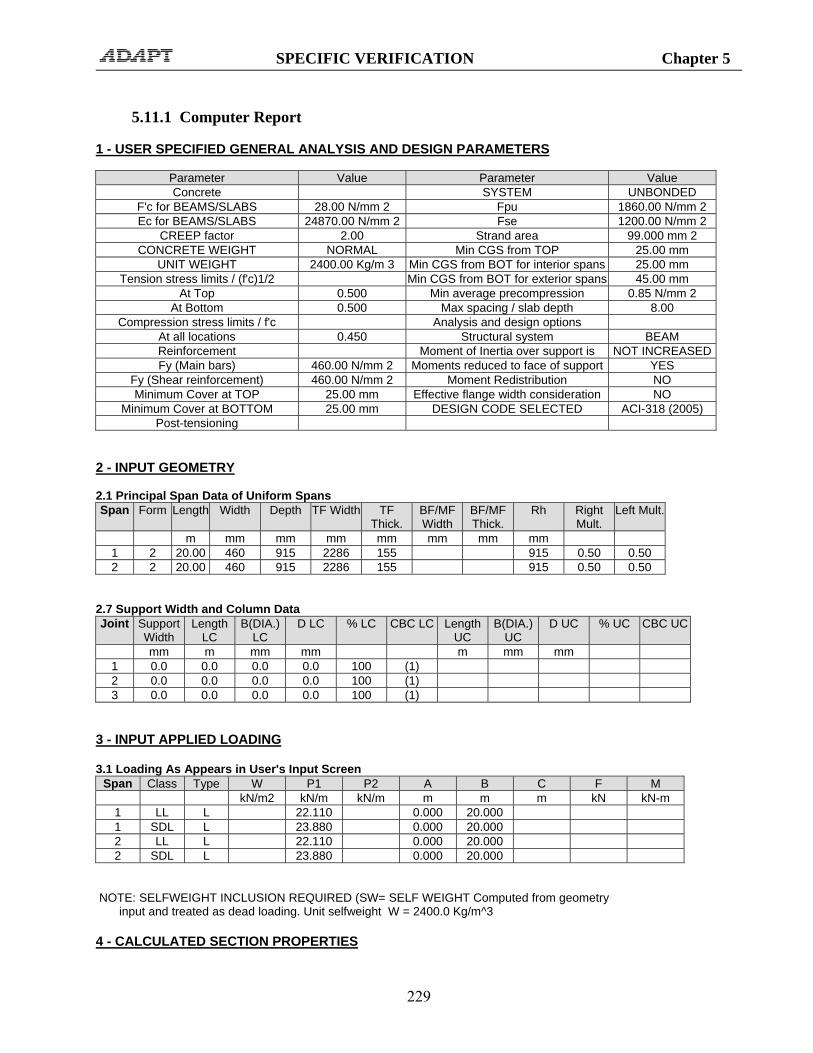
SPECIFIC VERIFICATION Chapter 5
229
5.11.1 Computer Report 1 - USER SPECIFIED GENERAL ANALYSIS AND DESIGN PARAMETERS
Parameter Value Parameter Value Concrete SYSTEM UNBONDED
F'c for BEAMS/SLABS 28.00 N/mm 2 Fpu 1860.00 N/mm 2 Ec for BEAMS/SLABS 24870.00 N/mm 2 Fse 1200.00 N/mm 2
CREEP factor 2.00 Strand area 99.000 mm 2 CONCRETE WEIGHT NORMAL Min CGS from TOP 25.00 mm
UNIT WEIGHT 2400.00 Kg/m 3 Min CGS from BOT for interior spans 25.00 mm Tension stress limits / (f'c)1/2 Min CGS from BOT for exterior spans 45.00 mm
At Top 0.500 Min average precompression 0.85 N/mm 2 At Bottom 0.500 Max spacing / slab depth 8.00
Compression stress limits / f'c Analysis and design options At all locations 0.450 Structural system BEAM Reinforcement Moment of Inertia over support is NOT INCREASEDFy (Main bars) 460.00 N/mm 2 Moments reduced to face of support YES
Fy (Shear reinforcement) 460.00 N/mm 2 Moment Redistribution NO Minimum Cover at TOP 25.00 mm Effective flange width consideration NO
Minimum Cover at BOTTOM 25.00 mm DESIGN CODE SELECTED ACI-318 (2005) Post-tensioning
2 - INPUT GEOMETRY 2.1 Principal Span Data of Uniform Spans Span Form Length Width Depth TF Width TF
Thick. BF/MF Width
BF/MF Thick.
Rh Right Mult.
Left Mult.
m mm mm mm mm mm mm mm 1 2 20.00 460 915 2286 155 915 0.50 0.50 2 2 20.00 460 915 2286 155 915 0.50 0.50
2.7 Support Width and Column Data Joint Support
Width Length
LC B(DIA.)
LC D LC % LC CBC LC Length
UC B(DIA.)
UC D UC % UC CBC UC
mm m mm mm m mm mm 1 0.0 0.0 0.0 0.0 100 (1) 2 0.0 0.0 0.0 0.0 100 (1) 3 0.0 0.0 0.0 0.0 100 (1)
3 - INPUT APPLIED LOADING 3.1 Loading As Appears in User's Input Screen
Span Class Type W P1 P2 A B C F M kN/m2 kN/m kN/m m m m kN kN-m
1 LL L 22.110 0.000 20.000 1 SDL L 23.880 0.000 20.000 2 LL L 22.110 0.000 20.000 2 SDL L 23.880 0.000 20.000
NOTE: SELFWEIGHT INCLUSION REQUIRED (SW= SELF WEIGHT Computed from geometry input and treated as dead loading. Unit selfweight W = 2400.0 Kg/m^3 4 - CALCULATED SECTION PROPERTIES

SPECIFIC VERIFICATION Chapter 5
230
4.1 Section Properties of Uniform Spans and Cantilevers
Span Area I Yb Yt mm2 mm4 mm mm
1 703930.00 0.54E+11 610.29 304.71 2 703930.00 0.54E+11 610.29 304.71
7 - SELECTED POST-TENSIONING FORCES AND TENDON PROFILES 7.1 Tendon Profile Tendon A
Span Type X1/L X2/L X3/L A/L 1 1 0.000 0.500 0.100 --- 2 1 0.100 0.500 0.000 ---
7.2 Selected Post-Tensioning Forces and Tendon Drape Tendon A
Span Force CGS Left CGS C1 CGS C2 CGS Right P/A Wbal WBal (%DL) kN mm mm mm mm MPa kN/-
1 2391.000 610.00 --- 25.00 890.00 3.40 34.669 86 2 2391.000 890.00 --- 25.00 610.00 3.40 34.669 86
All Tendons
Span Force Total P/A Total WBal (%DL)
kN MPa 1 2391 3.4 86 2 2391 3.4 86
Approximate weight of strand: 625.7 Kg Note: Moments are reported at face of support 10 - MILD STEEL - NO REDISTRIBUTION 10.1 Required Rebar 10.1.1 Total Strip Required Rebar
Span Location From To As Required Ultimate Minimum m m mm2 mm2 mm2
1 TOP 19.00 20.00 4457.00 4457.00 0.00 2 TOP 0.00 1.00 4457.00 4457.00 0.00 1 BOT 3.00 11.00 2171.00 2171.00 0.00 1 BOT 17.00 20.00 3499.00 3300.00 3499.00 2 BOT 0.00 3.00 3499.00 3300.00 3499.00 2 BOT 9.00 17.00 2171.00 2171.00 0.00
23 - DETAILED MOMENTS SPAN 1
X/L X SW SDL XL LL Min LL Max PT Secondary m kN-m kN-m kN-m kN-m kN-m kN-m kN-m
0.00 0.00 0.01 0.02 0.00 0.01 0.01 -0.72 0.00 0.05 1.00 116.05 167.21 0.00 154.82 154.82 -219.69 46.56 0.10 2.00 215.52 310.53 0.00 287.51 287.51 -410.96 93.12

SPECIFIC VERIFICATION Chapter 5
231
0.15 3.00 298.41 429.97 0.00 398.10 398.10 -574.26 139.68 0.20 4.00 364.73 525.52 0.00 486.57 486.57 -709.57 186.24 0.25 5.00 414.47 597.20 0.00 552.94 552.94 -816.90 232.80 0.30 6.00 447.64 645.00 0.00 597.19 597.19 -896.25 279.36 0.35 7.00 464.24 668.91 0.00 619.33 619.33 -947.63 325.92 0.40 8.00 464.27 668.95 0.00 619.37 619.37 -971.02 372.48 0.45 9.00 447.72 645.11 0.00 597.29 597.29 -966.43 419.04 0.50 10.00 414.60 597.39 0.00 553.11 553.11 -933.86 465.60 0.55 11.00 364.91 525.78 0.00 486.81 486.81 -861.45 512.16 0.60 12.00 298.64 430.30 0.00 398.41 398.41 -737.33 558.72 0.65 13.00 215.80 310.94 0.00 287.89 287.89 -561.51 605.28 0.70 14.00 116.38 167.69 0.00 155.26 155.26 -333.98 651.84 0.75 15.00 0.40 0.57 0.00 0.53 0.53 -54.75 698.40 0.80 16.00 -132.16 -190.43 0.00 -176.32 -176.32 276.19 744.96 0.85 17.00 -281.30 -405.31 0.00 -375.27 -375.27 658.84 791.52 0.90 18.00 -447.01 -644.08 0.00 -596.34 -596.34 1093.20 838.08 0.95 19.00 -629.29 -906.72 0.00 -839.51 -839.51 1450.00 884.64 1.00 20.00 -828.14 -1193.20 0.00 -1104.80 -1104.80 1599.90 931.20
SPAN 2
X/L X SW SDL XL LL Min LL Max PT Secondary m kN-m kN-m kN-m kN-m kN-m kN-m kN-m
0.00 0.00 -828.14 -1193.20 0.00 -1104.80 -1104.80 1599.90 931.20 0.05 1.00 -629.29 -906.72 0.00 -839.51 -839.51 1450.00 884.64 0.10 2.00 -447.01 -644.08 0.00 -596.34 -596.34 1093.20 838.08 0.15 3.00 -281.30 -405.31 0.00 -375.27 -375.27 658.84 791.52 0.20 4.00 -132.16 -190.43 0.00 -176.32 -176.32 276.19 744.96 0.25 5.00 0.40 0.57 0.00 0.53 0.53 -54.75 698.40 0.30 6.00 116.38 167.69 0.00 155.26 155.26 -333.98 651.84 0.35 7.00 215.80 310.94 0.00 287.89 287.89 -561.51 605.28 0.40 8.00 298.64 430.30 0.00 398.41 398.41 -737.33 558.72 0.45 9.00 364.91 525.78 0.00 486.81 486.81 -861.45 512.16 0.50 10.00 414.60 597.39 0.00 553.11 553.11 -933.86 465.60 0.55 11.00 447.72 645.11 0.00 597.29 597.29 -966.43 419.04 0.60 12.00 464.27 668.95 0.00 619.37 619.37 -971.03 372.48 0.65 13.00 464.24 668.91 0.00 619.33 619.33 -947.65 325.92 0.70 14.00 447.64 645.00 0.00 597.19 597.19 -896.30 279.36 0.75 15.00 414.47 597.20 0.00 552.94 552.94 -816.97 232.80 0.80 16.00 364.73 525.52 0.00 486.57 486.57 -709.67 186.24 0.85 17.00 298.41 429.97 0.00 398.10 398.10 -574.39 139.68 0.90 18.00 215.52 310.53 0.00 287.51 287.51 -411.14 93.12 0.95 19.00 116.05 167.21 0.00 154.82 154.82 -219.92 46.56 1.00 20.00 0.01 0.02 0.00 0.01 0.01 -0.72 0.00
27 - DETAILED STRESSES SPAN 1
X/L X SW Top
SW Bot
SDL Top
SDL Bot
XL Top
XL Bot
LL Top Max-T
LL Top Max-C
LL Bot Max-T
LL Bot Max-C
PT Top
PT Bot
m MPa MPa MPa MPa MPa MPa MPa MPa MPa MPa MPa MPa 0.00 0.00 0.00 0.00 0.00 0.00 0.00 0.00 0.00 0.00 0.00 0.00 -3.39 -3.40 0.05 1.00 -0.65 1.30 -0.94 1.88 0.00 0.00 -0.87 -0.87 1.74 1.74 -2.17 -5.86 0.10 2.00 -1.21 2.42 -1.74 3.49 0.00 0.00 -1.61 -1.61 3.23 3.23 -1.09 -8.01 0.15 3.00 -1.67 3.35 -2.41 4.83 0.00 0.00 -2.23 -2.23 4.47 4.47 -0.18 -9.84 0.20 4.00 -2.04 4.09 -2.95 5.90 0.00 0.00 -2.73 -2.73 5.46 5.46 0.58 -11.360.25 5.00 -2.32 4.65 -3.35 6.70 0.00 0.00 -3.10 -3.10 6.21 6.21 1.18 -12.570.30 6.00 -2.51 5.02 -3.61 7.24 0.00 0.00 -3.35 -3.35 6.70 6.70 1.63 -13.46

SPECIFIC VERIFICATION Chapter 5
232
0.35 7.00 -2.60 5.21 -3.75 7.51 0.00 0.00 -3.47 -3.47 6.95 6.95 1.91 -14.030.40 8.00 -2.60 5.21 -3.75 7.51 0.00 0.00 -3.47 -3.47 6.95 6.95 2.05 -14.300.45 9.00 -2.51 5.03 -3.62 7.24 0.00 0.00 -3.35 -3.35 6.70 6.70 2.02 -14.240.50 10.00 -2.32 4.65 -3.35 6.71 0.00 0.00 -3.10 -3.10 6.21 6.21 1.84 -13.880.55 11.00 -2.05 4.10 -2.95 5.90 0.00 0.00 -2.73 -2.73 5.46 5.46 1.43 -13.070.60 12.00 -1.67 3.35 -2.41 4.83 0.00 0.00 -2.23 -2.23 4.47 4.47 0.74 -11.670.65 13.00 -1.21 2.42 -1.74 3.49 0.00 0.00 -1.61 -1.61 3.23 3.23 -0.25 -9.70 0.70 14.00 -0.65 1.31 -0.94 1.88 0.00 0.00 -0.87 -0.87 1.74 1.74 -1.52 -7.15 0.75 15.00 0.00 0.00 0.00 0.01 0.00 0.00 0.00 0.00 0.01 0.01 -3.09 -4.01 0.80 16.00 0.74 -1.48 1.07 -2.14 0.00 0.00 0.99 0.99 -1.98 -1.98 -4.94 -0.30 0.85 17.00 1.58 -3.16 2.27 -4.55 0.00 0.00 2.10 2.10 -4.21 -4.21 -7.09 4.00 0.90 18.00 2.51 -5.02 3.61 -7.23 0.00 0.00 3.34 3.34 -6.69 -6.69 -9.52 8.87 0.95 19.00 3.53 -7.06 5.08 -10.18 0.00 0.00 4.71 4.71 -9.42 -9.42 -11.52 12.88 1.00 20.00 4.64 -9.30 6.69 -13.39 0.00 0.00 6.19 6.19 -12.40 -12.40 -12.36 14.56
X/L X Initial
Top Max-T
Initial Top
Max-C
Initial Bot
Max-T
Initial Bot
Max-C
Env-1 Top
Max-T
Env-1 Top
Max-C
Env-1 Bot
Max-T
Env-1 Bot
Max-C
Env-2 Top
Max-T
Env-2 Top
Max-C
Env-2 Bot
Max-T
Env-2 Bot
Max-C m MPa MPa MPa MPa MPa MPa MPa MPa MPa MPa MPa MPa
0.00 0.00 ----- -3.90 ----- -3.92 0.00 ----- 0.00 ----- 0.00 ----- 0.00 ----- 0.05 1.00 ----- -3.14 ----- -5.44 0.00 ----- 0.00 ----- 0.00 ----- 0.00 ----- 0.10 2.00 ----- -2.47 ----- -6.79 0.00 ----- 0.00 ----- 0.00 ----- 0.00 ----- 0.15 3.00 ----- -1.88 ----- -7.97 0.00 ----- 0.00 ----- 0.00 ----- 0.00 ----- 0.20 4.00 ----- -1.38 ----- -8.97 0.00 ----- 0.00 ----- 0.00 ----- 0.00 ----- 0.25 5.00 ----- -0.96 ----- -9.80 0.00 ----- 0.00 ----- 0.00 ----- 0.00 ----- 0.30 6.00 ----- -0.64 ----- -10.45 0.00 ----- 0.00 ----- 0.00 ----- 0.00 ----- 0.35 7.00 ----- -0.40 ----- -10.93 0.00 ----- 0.00 ----- 0.00 ----- 0.00 ----- 0.40 8.00 ----- -0.25 ----- -11.23 0.00 ----- 0.00 ----- 0.00 ----- 0.00 ----- 0.45 9.00 ----- -0.19 ----- -11.36 0.00 ----- 0.00 ----- 0.00 ----- 0.00 ----- 0.50 10.00 ----- -0.21 ----- -11.31 0.00 ----- 0.00 ----- 0.00 ----- 0.00 ----- 0.55 11.00 ----- -0.40 ----- -10.93 0.00 ----- 0.00 ----- 0.00 ----- 0.00 ----- 0.60 12.00 ----- -0.83 ----- -10.07 0.00 ----- 0.00 ----- 0.00 ----- 0.00 ----- 0.65 13.00 ----- -1.50 ----- -8.73 0.00 ----- 0.00 ----- 0.00 ----- 0.00 ----- 0.70 14.00 ----- -2.41 ----- -6.91 0.00 ----- 0.00 ----- 0.00 ----- 0.00 ----- 0.75 15.00 ----- -3.56 ----- -4.61 0.00 ----- 0.00 ----- 0.00 ----- 0.00 ----- 0.80 16.00 ----- -4.95 ----- -1.82 0.00 ----- 0.00 ----- 0.00 ----- 0.00 ----- 0.85 17.00 ----- -6.58 1.44 ----- 0.00 ----- 0.00 ----- 0.00 ----- 0.00 ----- 0.90 18.00 ----- -8.45 5.19 ----- 0.00 ----- 0.00 ----- 0.00 ----- 0.00 ----- 0.95 19.00 ----- -9.72 7.75 ----- 0.00 ----- 0.00 ----- 0.00 ----- 0.00 ----- 1.00 20.00 ----- -9.58 7.45 ----- 0.00 ----- 0.00 ----- 0.00 ----- 0.00 -----
SPAN 2
X/L X SW Top
SW Bot
SDL Top
SDL Bot
XL Top
XL Bot
LL Top Max-T
LL Top Max-C
LL Bot Max-T
LL Bot Max-C
PT Top
PT Bot
m MPa MPa MPa MPa MPa MPa MPa MPa MPa MPa MPa MPa 0.00 0.00 4.64 -9.30 6.69 -13.39 0.00 0.00 6.19 6.19 -12.40 -12.40 -12.36 14.56 0.05 1.00 3.53 -7.06 5.08 -10.18 0.00 0.00 4.71 4.71 -9.42 -9.42 -11.52 12.88 0.10 2.00 2.51 -5.02 3.61 -7.23 0.00 0.00 3.34 3.34 -6.69 -6.69 -9.52 8.87 0.15 3.00 1.58 -3.16 2.27 -4.55 0.00 0.00 2.10 2.10 -4.21 -4.21 -7.09 4.00 0.20 4.00 0.74 -1.48 1.07 -2.14 0.00 0.00 0.99 0.99 -1.98 -1.98 -4.94 -0.30 0.25 5.00 0.00 0.00 0.00 0.01 0.00 0.00 0.00 0.00 0.01 0.01 -3.09 -4.01 0.30 6.00 -0.65 1.31 -0.94 1.88 0.00 0.00 -0.87 -0.87 1.74 1.74 -1.52 -7.15 0.35 7.00 -1.21 2.42 -1.74 3.49 0.00 0.00 -1.61 -1.61 3.23 3.23 -0.25 -9.70 0.40 8.00 -1.67 3.35 -2.41 4.83 0.00 0.00 -2.23 -2.23 4.47 4.47 0.74 -11.670.45 9.00 -2.05 4.10 -2.95 5.90 0.00 0.00 -2.73 -2.73 5.46 5.46 1.43 -13.070.50 10.00 -2.32 4.65 -3.35 6.71 0.00 0.00 -3.10 -3.10 6.21 6.21 1.84 -13.880.55 11.00 -2.51 5.03 -3.62 7.24 0.00 0.00 -3.35 -3.35 6.70 6.70 2.02 -14.240.60 12.00 -2.60 5.21 -3.75 7.51 0.00 0.00 -3.47 -3.47 6.95 6.95 2.05 -14.300.65 13.00 -2.60 5.21 -3.75 7.51 0.00 0.00 -3.47 -3.47 6.95 6.95 1.91 -14.03

SPECIFIC VERIFICATION Chapter 5
233
0.70 14.00 -2.51 5.02 -3.61 7.24 0.00 0.00 -3.35 -3.35 6.70 6.70 1.63 -13.460.75 15.00 -2.32 4.65 -3.35 6.70 0.00 0.00 -3.10 -3.10 6.21 6.21 1.18 -12.570.80 16.00 -2.04 4.09 -2.95 5.90 0.00 0.00 -2.73 -2.73 5.46 5.46 0.58 -11.360.85 17.00 -1.67 3.35 -2.41 4.83 0.00 0.00 -2.23 -2.23 4.47 4.47 -0.18 -9.84 0.90 18.00 -1.21 2.42 -1.74 3.49 0.00 0.00 -1.61 -1.61 3.23 3.23 -1.09 -8.01 0.95 19.00 -0.65 1.30 -0.94 1.88 0.00 0.00 -0.87 -0.87 1.74 1.74 -2.16 -5.87 1.00 20.00 0.00 0.00 0.00 0.00 0.00 0.00 0.00 0.00 0.00 0.00 -3.39 -3.40
X/L X Initial
Top Max-T
Initial Top
Max-C
Initial Bot
Max-T
Initial Bot
Max-C
Env-1 Top
Max-T
Env-1 Top
Max-C
Env-1 Bot
Max-T
Env-1 Bot
Max-C
Env-2 Top
Max-T
Env-2 Top
Max-C
Env-2 Bot
Max-T
Env-2 Bot
Max-C m MPa MPa MPa MPa MPa MPa MPa MPa MPa MPa MPa MPa
0.00 0.00 ----- -9.58 7.45 ----- 0.00 ----- 0.00 ----- 0.00 ----- 0.00 ----- 0.05 1.00 ----- -9.72 7.75 ----- 0.00 ----- 0.00 ----- 0.00 ----- 0.00 ----- 0.10 2.00 ----- -8.45 5.19 ----- 0.00 ----- 0.00 ----- 0.00 ----- 0.00 ----- 0.15 3.00 ----- -6.58 1.44 ----- 0.00 ----- 0.00 ----- 0.00 ----- 0.00 ----- 0.20 4.00 ----- -4.95 ----- -1.82 0.00 ----- 0.00 ----- 0.00 ----- 0.00 ----- 0.25 5.00 ----- -3.56 ----- -4.61 0.00 ----- 0.00 ----- 0.00 ----- 0.00 ----- 0.30 6.00 ----- -2.41 ----- -6.91 0.00 ----- 0.00 ----- 0.00 ----- 0.00 ----- 0.35 7.00 ----- -1.50 ----- -8.73 0.00 ----- 0.00 ----- 0.00 ----- 0.00 ----- 0.40 8.00 ----- -0.83 ----- -10.07 0.00 ----- 0.00 ----- 0.00 ----- 0.00 ----- 0.45 9.00 ----- -0.40 ----- -10.93 0.00 ----- 0.00 ----- 0.00 ----- 0.00 ----- 0.50 10.00 ----- -0.21 ----- -11.31 0.00 ----- 0.00 ----- 0.00 ----- 0.00 ----- 0.55 11.00 ----- -0.19 ----- -11.36 0.00 ----- 0.00 ----- 0.00 ----- 0.00 ----- 0.60 12.00 ----- -0.25 ----- -11.23 0.00 ----- 0.00 ----- 0.00 ----- 0.00 ----- 0.65 13.00 ----- -0.40 ----- -10.93 0.00 ----- 0.00 ----- 0.00 ----- 0.00 ----- 0.70 14.00 ----- -0.64 ----- -10.45 0.00 ----- 0.00 ----- 0.00 ----- 0.00 ----- 0.75 15.00 ----- -0.96 ----- -9.80 0.00 ----- 0.00 ----- 0.00 ----- 0.00 ----- 0.80 16.00 ----- -1.38 ----- -8.97 0.00 ----- 0.00 ----- 0.00 ----- 0.00 ----- 0.85 17.00 ----- -1.88 ----- -7.97 0.00 ----- 0.00 ----- 0.00 ----- 0.00 ----- 0.90 18.00 ----- -2.46 ----- -6.79 0.00 ----- 0.00 ----- 0.00 ----- 0.00 ----- 0.95 19.00 ----- -3.14 ----- -5.44 0.00 ----- 0.00 ----- 0.00 ----- 0.00 ----- 1.00 20.00 ----- -3.90 ----- -3.92 0.00 ----- 0.00 ----- 0.00 ----- 0.00 -----
29 - DETAILED REBAR SPAN 1
X/L X Analysis Top
Analysis Bot
Minimum Top
Minimum Bot
Selected Top
Selected Bot
m mm2 mm2 mm2 mm2 mm2 mm2 0.00 0.00 0.00 0.00 0.00 0.00 0.00 0.00 0.05 1.00 0.00 0.00 0.00 0.00 0.00 0.00 0.10 2.00 0.00 0.00 0.00 0.00 0.00 0.00 0.15 3.00 0.00 468.00 0.00 0.00 0.00 468.00 0.20 4.00 0.00 922.20 0.00 0.00 0.00 922.20 0.25 5.00 0.00 1219.00 0.00 0.00 0.00 1219.00 0.30 6.00 0.00 1434.00 0.00 0.00 0.00 1434.00 0.35 7.00 0.00 1377.00 0.00 0.00 0.00 1377.00 0.40 8.00 0.00 1235.00 0.00 0.00 0.00 1235.00 0.45 9.00 0.00 2171.00 0.00 0.00 0.00 2171.00 0.50 10.00 0.00 1823.00 0.00 0.00 0.00 1823.00 0.55 11.00 0.00 1220.00 0.00 0.00 0.00 1220.00 0.60 12.00 0.00 0.00 0.00 0.00 0.00 0.00 0.65 13.00 0.00 0.00 0.00 0.00 0.00 0.00 0.70 14.00 0.00 0.00 0.00 0.00 0.00 0.00 0.75 15.00 0.00 0.00 0.00 0.00 0.00 0.00 0.80 16.00 0.00 0.00 0.00 0.00 0.00 0.00

SPECIFIC VERIFICATION Chapter 5
234
0.85 17.00 0.00 0.00 0.00 263.60 0.00 263.60 0.90 18.00 0.00 0.00 0.00 2009.00 0.00 2009.00 0.95 19.00 1976.00 806.40 0.00 3499.00 1976.00 3499.00 1.00 20.00 4457.00 3300.00 0.00 3321.00 4457.00 3321.00
SPAN 2
X/L X Analysis Top
Analysis Bot
Minimum Top
Minimum Bot
Selected Top
Selected Bot
m mm2 mm2 mm2 mm2 mm2 mm2 0.00 0.00 4457.00 3300.00 0.00 3321.00 4457.00 3321.00 0.05 1.00 1976.00 806.40 0.00 3499.00 1976.00 3499.00 0.10 2.00 0.00 0.00 0.00 2009.00 0.00 2009.00 0.15 3.00 0.00 0.00 0.00 263.60 0.00 263.60 0.20 4.00 0.00 0.00 0.00 0.00 0.00 0.00 0.25 5.00 0.00 0.00 0.00 0.00 0.00 0.00 0.30 6.00 0.00 0.00 0.00 0.00 0.00 0.00 0.35 7.00 0.00 0.00 0.00 0.00 0.00 0.00 0.40 8.00 0.00 0.00 0.00 0.00 0.00 0.00 0.45 9.00 0.00 1220.00 0.00 0.00 0.00 1220.00 0.50 10.00 0.00 1823.00 0.00 0.00 0.00 1823.00 0.55 11.00 0.00 2171.00 0.00 0.00 0.00 2171.00 0.60 12.00 0.00 1235.00 0.00 0.00 0.00 1235.00 0.65 13.00 0.00 1377.00 0.00 0.00 0.00 1377.00 0.70 14.00 0.00 1434.00 0.00 0.00 0.00 1434.00 0.75 15.00 0.00 1219.00 0.00 0.00 0.00 1219.00 0.80 16.00 0.00 922.20 0.00 0.00 0.00 922.20 0.85 17.00 0.00 468.00 0.00 0.00 0.00 468.00 0.90 18.00 0.00 0.00 0.00 0.00 0.00 0.00 0.95 19.00 0.00 0.00 0.00 0.00 0.00 0.00 1.00 20.00 0.00 0.00 0.00 0.00 0.00 0.00
Legend (2.1): Span C = Cantilever Form 1 = Rectangular, 2 = T or Inverted L, 3 = I, 4 = Extended T or L section Rh Elevation of top surface TF Top flange MF Middle flange BF Bottom flange Legend (2.7): The Column Boundary Condition (CBC): Fixed at both 1 Hinged at near end, fixed at far end 2 Fixed at near end, hinged at far end 3 Fixed at near end, roller with rotational fixity at far end 4 LC Lower Column UC Upper Column Legend (3.1): Class: SW: Selfweight, LL: Live Load, SDL: Superimposed Dead Load, X: Other Loading Type: U: Uniform, P: Partial Uniform, L: Line Load, M: Applied Moment C: Concentrated Load, R: Triangle, V: Variable, T: Trapezoidal Legend (4.1, 4.2): Yb: distance from centroid to bottom fiber Yt: distance from centroid to top fiber I: gross moment of inertia Legend (7.1):

SPECIFIC VERIFICATION Chapter 5
235
Type 1 = reversed parabola 2 = simple parabola with straight portion over support 3 = harped tendon 4 = straight tendon 5 = extended reversed parabola Legend (7.2): CGS C1: CGS of left middle point of tendon for type 5 profile CGS C2: CGS of right middle point of tendon for type 5 profile or middle point of other types Legend (10.1, 11.1): From: Beginning of rebar measured from left support of the span To: End of rebar measured from left support of the span As Required: Envelope of minimum and ultimate rebar Ultimate: Required rebar for ultimate load combinations Minimum: Required minimum rebar
5.11.2 Verification
In this example, steel for initial condition is only required at the bottom of the second support. The following computations verify that the calculated stress and the area are correct. The results are referenced to the Results Report, i.e. the notation ADAPT B4.2, C3 refers to column 3 of block/section 4.2. Stresses due to initial conditions are reported in the section 27-Detailed Stress of the detailed report. The maximum tensile stress are at X/L = 0.95 in span 1 and X/L = 0.05 in span 2. Stresses are calculated as:
Stress: f = (+ M(combined)/S) - P/A Where,
Sb = I/Yb = 5.437 x 1010 mm4 / 610.29 mm = 8.908 x 107 mm3 (ADAPT B4.1, C3, C4) St = I/Yt = 5.437 x 1010 mm4 / 304.71 mm = 1.7843 x 108 mm3 (ADAPT B4.1, C3, C5)
P/A = 1.15 * 3.40 N/mm2 = 3.91 N/mm2 (ADAPT B7.2, C7)
Moments are reported under block/section 23-Detailed Moments of the detailed report. Evaluating the combination of 1.00 SW + 1.15 PT at X/L=0.05 gives:
M(combined, X/L=0.05) = 1.00*(-629.28) + 1.15*(1450) = 1038.22 kN-m fb = (1038.22 x 106)/(8.908 x 107) - 3.91 = 7.74 N/mm2 (T) (ADAPT 7.75,B27, C5) ft = (-1038.22 x 106)/(1.784 x 108) - 3.91

SPECIFIC VERIFICATION Chapter 5
236
= -9.73 N/mm2 (C) (ADAPT -9.72,B27, C4)
The allowable tensile stresses are calculated as:
f’ci = 21 N/mm2 fallowable, (T) = 0.25(f’ci)1/2 = 0.25 * 211/2 = 1.15 N/mm2 (tension)
Since the tensile stress fb (7.74 N/mm2 ) is greater than the allowable value (1.15 N/mm2), nonprestressed reinforcement needs to be provided. Mild reinforcement is provided for the tension force (T) on the concrete section using the following relationship from ACI-318:
As = T/(0.5*fy) T = tension force fy = 460 N/mm2 (ADAPT B1) > 413.69 MPa , so use fy = 413.69 MPa
The tensile force is found by assuming a linear stress distribution as shown in Fig. 5.11-2:
h = 915 mm bw = 460 mm X = [7.74/(7.74 + 9.73)]*915 = 405.39 mm
FIGURE 5.11-2
T = (405.39*460/2)*7.74 = 721.67 kN

SPECIFIC VERIFICATION Chapter 5
237
Steel required for the initial conditions is reported in block/section 29-Detailed Rebar under minimum rebar column.
As = 721669/(0.5*413.69) = 3489 mm2 (ADAPT 3499 mm2, B29, C6)
Data Block 27 - Compressive Stresses The initial compressive strength, f’ci, is the strength entered in the Material/Concrete input screen. In this example: f’ci = 21 N/mm2 Allowable stresses were as 0.60*f’ci. Therefore, the maximum allowable stress is: 0.60*21 = 12.6 N/mm2 The maximum compressive stress, as shown in the Data Block 27, is 11.36 N/mm2 at X/L = 0.45 in span 1 and X/L = 0.55 in span 2. 11.36/21 = 0.54 The maximum stress is 0.54 *f’ci < 0.60 f’ci OK
5.12 DEFLECTION
5.12.1 Background
The background theory for computation of deflection profile of concrete members, with due allowance to cracking of the section, is given in chapter 3-Analysis and Design Background, of Volume 2. The following is an example of longhand deflection calculation and its comparison with the solutions obtained from ADAPT-PT. It serves two purposes. First, it demonstrates that the software correctly computes deflections. Second, the detailed description of deflection calculation may be used as a guide for verification of users' problems. The longhand computation is broken into two parts. The first assumes, as its entry value, the equivalent moment of inertia, Ie, computed by the software. The second illustrates how the software computes Ie.
5.12.2 Deflection Computation
Consider the two-span beam shown in Fig 5.12-1. The particulars of the beam are:
f'c = 28 MPa

SPECIFIC VERIFICATION Chapter 5
238
Ec = 24870 MPa Concrete; normal weight = 2400 kg/m3 Creep/shrinkage factor = 2.0 Steel yield strength = 460 MPa Distance from tension fiber to centroid of tension steel = 71 mm
Distance from compression fiber to centroid of compression rebar = 71 mm Cover = 60 mm top and bottom
Loading: Applied dead load = 10 kN/m;
Concentrated dead load, P = 25 kN at center of first span; Live loading = 12 kN/m of beam.
FIGURE 5.12-1
The computed deflections by ADAPT-PT are given in Fig 5.12-2 graphically. The graphs are a representation of the deflection computations at 1/20th points. The 1/20th point deflections for the dead loading are listed in file CDF_D.INT and the combined deflections for dead and live loading are given in file CDF_DPSL.INT. The values for the current problem are extracted from these files and divided by modulus of elasticity of concrete (Ec) to get deflection and listed in Table 5.12-1.

SPECIFIC VERIFICATION Chapter 5
239
In the regular output of ADAPT-PT, only the summary of maximum deflections of each span is given (data block 14). For the current problem, this summary is reproduced in Table 5.12-2. In the following, the deflection values of span 1 from this table are a summary of the longhand computations.
TABLE 5.12-1 ADAPT-PT COMPUTED DEFLECTIONS OF SPAN 1 X/L X Deflections, δ
(m) SW* SW+PT** (mm)
SW+PT+SDL***
(mm)
SW+PT+SDL+LL**** (mm)
0.00 0.00 0.00 0.00 0.00 0.00 0.05 0.70 2.33 -2.35 0.86 4.94 0.10 1.40 4.58 -4.73 1.57 9.62 0.15 2.10 6.67 -7.09 2.10 13.89 0.20 2.80 8.53 -9.33 2.46 17.60 0.25 3.50 10.12 -11.33 2.70 20.63 0.30 4.20 11.40 -13.01 2.84 22.90 0.35 4.90 12.33 -14.30 2.89 24.39 0.40 5.60 12.90 -15.14 2.88 25.13 0.45 6.30 13.10 -15.51 2.81 25.14 0.50 7.00 12.93 -15.38 2.70 24.47 0.55 7.70 12.41 -14.75 2.56 23.20 0.60 8.40 11.57 -13.64 2.40 21.45 0.65 9.10 10.44 -12.10 2.25 19.33 0.70 9.80 9.07 -10.20 2.12 16.91 0.75 10.50 7.52 -8.06 1.98 14.27 0.80 11.20 5.87 -5.79 1.82 11.46 0.85 11.90 4.19 -3.57 1.60 8.55 0.90 12.60 2.58 -1.59 1.24 5.60 0.95 13.30 1.14 -0.23 0.70 2.69 1.00 14.00 0.00 0.00 0.00 0.00
Note: Ec = Modulus elasticity of concrete = 24870.00 N/mm2 * = Reproduced from file CDF_D.INT ** = Reproduced from file CDF_DP.INT *** = Reproduced from file CDF_DPS.INT **** = Reproduced from file CDF_DPSL.INT
TABLE 5.12-2: SUMMARY OF MAXIMUM DEFLECTIONS
14.1 Maximum Span Deflections Span SW SW+PT SW+PT+
SDL SW+PT+SDL
+Creep LL X Total
mm mm mm mm mm mm mm 1 13.1 -15.5 2.9 8.7(1614) 22.3(627) 0.0(*****) 30.9(453) 2 -1.4 0.6 -2.4 -7.1(979) -1.8(3953) 0.0(*****) -8.8(794)
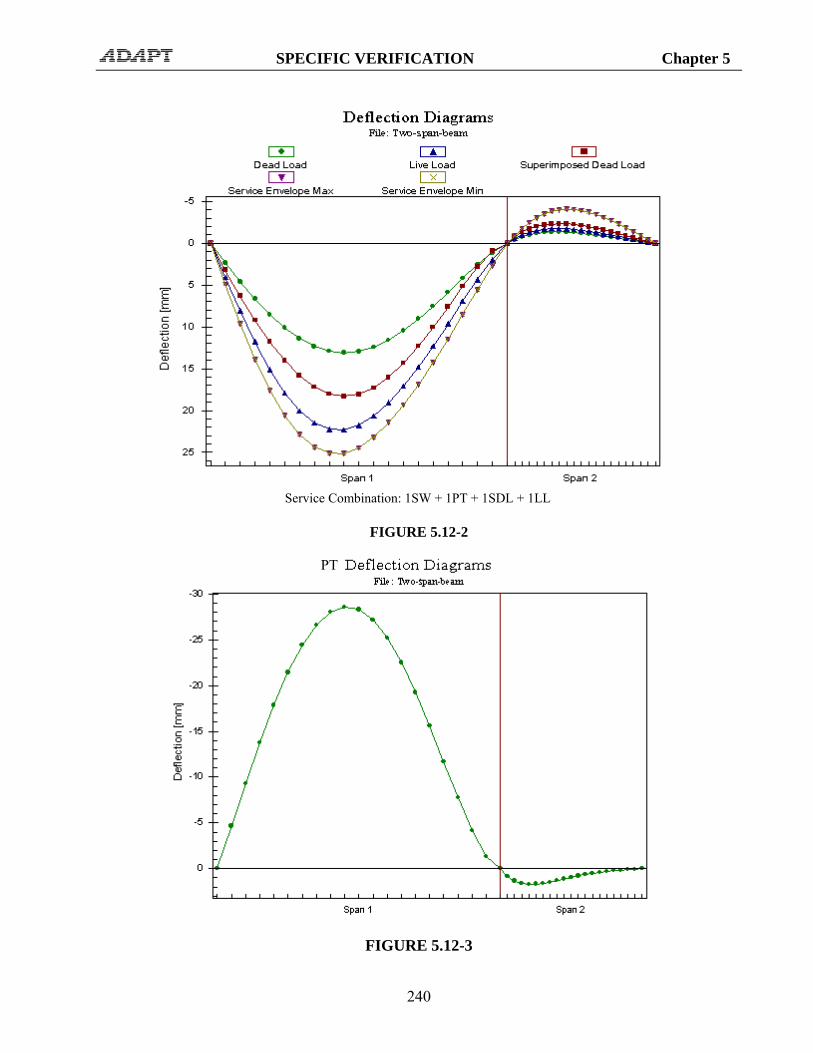
SPECIFIC VERIFICATION Chapter 5
240
FIGURE 5.12-2
FIGURE 5.12-3
Service Combination: 1SW + 1PT + 1SDL + 1LL
PT

SPECIFIC VERIFICATION Chapter 5
241
The procedure adopted for deflection calculation is described next. Refer to Fig 5.12-3. The distance, t, offset to the tangent at A, from point B, is given by the second equation of the moment-area method.
t = (moment of the bending moment diagram about B)/(Ec*Ie) θa = t /AB (wmax + t') = θa * a
where, a, is the distance from support, A, the location at which the maximum deflection occurs (wmax). The distance, a, is read from the Table 5.12-1. For the current problem, this distance is 6300 mm. The user may verify that 6300 mm is the maximum deflection by opening the deflection graph and clicking on the maximum point. The X and Y coordinates of the point will display. Likewise, the offset, t', at location of maximum deflection is given by:
t' = (moment of the bending moment diagram between A, and D, about, D)/(Ec* Ie)
wmax = θa * a - t'
FIGURE 8.1-3

SPECIFIC VERIFICATION Chapter 5
242
5.12.2.1 Deflection due to Selfweight
The computation is summarized in Table 5.12-3. The values of the equivalent moment of inertia and the applied moment are extracted from the file, D_IE.INT, generated by ADAPT-PT. A printout of this file for the current problem is given Table 5.12-3 and Table 5.12-4. Refer to Table 5.12-3 and Table 5.12-4 again:
t = ∑Ai*Xi /(Ec*Ie) = 46.90 mm θa = 46.90 mm /14,000 mm = 3.350E-03 (wmax + t' ) = 3.350E-03*6,300 mm = 21.11 mm
t' = ∑A'i*X'i /(Ec*Ie) = 8.01 mm
wmax = 21.11 – 8.01 = 13.10 mm
(ADAPT-PT 13.1 mm, data block 14, column 2)
TABLE 5.12-3 MOMENT-AREA INTERIM COMPUTATIONS X Moment* Ie* Ai Ci Xi Xi' AiXi/EcIe AiXi'/EcIe
(mm) (N.mm) (mm4) (N.mm2) (mm) (mm) (mm) (mm) (mm) 0 1.00E-02 7.93E+09 n/a n/a n/a n/a n/a n/a
700 3.46E+07 7.93E+09 1.210E+10 233.333 13533.333 5833.333 0.830 3.58E-01 1400 6.46E+07 7.93E+09 3.472E+10 314.655 12914.655 5214.655 2.272 9.18E-01 2100 9.02E+07 7.93E+09 5.417E+10 330.755 12230.755 4530.755 3.358 1.24E+002800 1.11E+08 7.93E+09 7.047E+10 337.803 11537.803 3837.803 4.121 1.37E+003500 1.28E+08 7.93E+09 8.358E+10 341.988 10841.988 3141.988 4.593 1.33E+004200 1.40E+08 7.93E+09 9.352E+10 344.760 10144.760 2444.760 4.809 1.16E+004900 1.47E+08 7.93E+09 1.003E+11 346.988 9446.988 1746.988 4.803 8.88E-01 5600 1.50E+08 7.93E+09 1.040E+11 348.822 8748.822 1048.822 4.609 5.53E-01 6300 1.48E+08 7.93E+09 1.044E+11 350.665 8050.665 350.665 4.260 1.86E-01 7000 1.42E+08 7.93E+09 1.017E+11 352.450 7352.450 -347.550 3.789 0.00E+007700 1.32E+08 7.93E+09 9.583E+10 354.517 6654.517 -1045.483 3.232 0.00E+008400 1.16E+08 7.93E+09 8.680E+10 357.151 5957.151 -1742.849 2.621 0.00E+009100 9.67E+07 7.93E+09 7.458E+10 360.791 5260.791 -2439.209 1.989 0.00E+009800 7.25E+07 7.93E+09 5.921E+10 366.704 4566.704 -3133.296 1.370 0.00E+0010500 4.37E+07 7.93E+09 4.067E+10 378.855 3878.855 -3821.145 0.800 0.00E+0011200 1.05E+07 7.93E+09 1.897E+10 421.593 3221.593 -4478.407 0.310 0.00E+0011900 -2.73E+07 7.93E+09 -5.897E+09 88.348 2188.348 -5511.652 -0.065 0.00E+0012600 -6.96E+07 7.93E+09 -3.393E+10 299.092 1699.092 -6000.908 -0.292 0.00E+0013300 -1.17E+08 7.93E+09 -6.514E+10 320.614 1020.614 -6679.386 -0.337 0.00E+0014000 -1.68E+08 7.93E+09 -9.950E+10 328.948 328.948 -7371.052 -0.166 0.00E+00
∑ = 46.904 8.01E+00 Note: * Copied from file D_IE.INT
Ec = Modulus elasticity of concrete = 24870.00 N/mm2.

SPECIFIC VERIFICATION Chapter 5
243
Ai = Moment area each 1/20th subdivision (assumed as a trapezoid) (see Fig 5.12-3) C = Centroid of each 1/20th subdivision (assumed as a trapezoid) Xi = Moment arm of each 1/20th subdivision about point, B (see Fig 5.12-3) Xi' = Moment arm of each 1/20th subdivision about point, D (see Fig 5.12-3)
TABLE 5.12-4 ADAPT-PT MOMENTS AND MOMENT OF INERTIAS DUE
TO SELFWEIGHT
ADAPT STRUCTURAL CONCRETE SOFTWARE SYSTEM DATE: Apr 1,2010 TIME: 11:28Data ID: Two-span Output File ID: D_IE.INT
==============================================================================
Applied moment (Ma), Cracked moment (Mcr), Gross Moment of Inertia (Ig) Cracked I (Icr) and Effective I (Ie)
S pts Ma Mcr Ig Icr Ie ----------------------------------------------------------------------------- 1 0 0.1000000E-01 0.1643583E+09 0.79334001E+10 0.35965766E+09 0.79334001E+101 1 0.3457000E+08 0.1643583E+09 0.79334001E+10 0.39684918E+09 0.79334001E+101 2 0.6462000E+08 0.1643583E+09 0.79334001E+10 0.79719840E+09 0.79334001E+101 3 0.9015000E+08 0.1643583E+09 0.79334001E+10 0.14058943E+10 0.79334001E+101 4 0.1112000E+09 0.1643583E+09 0.79334001E+10 0.20719323E+10 0.79334001E+101 5 0.1276000E+09 0.1643583E+09 0.79334001E+10 0.26568640E+10 0.79334001E+101 6 0.1396000E+09 0.1643583E+09 0.79334001E+10 0.32789911E+10 0.79334001E+101 7 0.1470000E+09 0.1643583E+09 0.79334001E+10 0.37925463E+10 0.79334001E+101 8 0.1500000E+09 0.1643583E+09 0.79334001E+10 0.42929088E+10 0.79334001E+101 9 0.1483000E+09 0.1643583E+09 0.79334001E+10 0.44784497E+10 0.79334001E+101 10 0.1422000E+09 0.1643583E+09 0.79334001E+10 0.44074916E+10 0.79334001E+101 11 0.1316000E+09 0.1643583E+09 0.79334001E+10 0.41151882E+10 0.79334001E+101 12 0.1164000E+09 0.1643583E+09 0.79334001E+10 0.36818716E+10 0.79334001E+101 13 0.9669000E+08 0.1643583E+09 0.79334001E+10 0.31892923E+10 0.79334001E+101 14 0.7247000E+08 0.1643583E+09 0.79334001E+10 0.21235201E+10 0.79334001E+101 15 0.4373000E+08 0.1643583E+09 0.79334001E+10 0.14727880E+10 0.79334001E+101 16 0.1047000E+08 0.1643583E+09 0.79334001E+10 0.91057600E+09 0.79334001E+101 17 -.2732000E+08 0.3592759E+09 0.79334001E+10 0.14843846E+10 0.79334001E+101 18 -.6962000E+08 0.3592759E+09 0.79334001E+10 0.17526044E+10 0.79334001E+101 19 -.1165000E+09 0.3592759E+09 0.79334001E+10 0.21733747E+10 0.79334001E+101 20 -.1678000E+09 0.3592759E+09 0.79334001E+10 0.23915607E+10 0.79334001E+10
5.12.2.2 Deflection due to Live Loading
Deflection calculation for live load is followed in a similar manner, in which the applied moment and the associated equivalent moment of inertia are due to the simultaneous application of selfweight, post-tensioning, superimposed dead load and live load. The values of the parameters involved are given in Tables 5.12-5 through 5.12-8.
i. Deflection due to SW + PT + SDL:
t = ∑Ai*Xi /(Ec*Ie) = 17.66 mm
θa = 17.66 mm/14,000 mm = 1.261E-03 (wmax + t' ) = 1.261E-03*6,300 mm = 7.947 mm
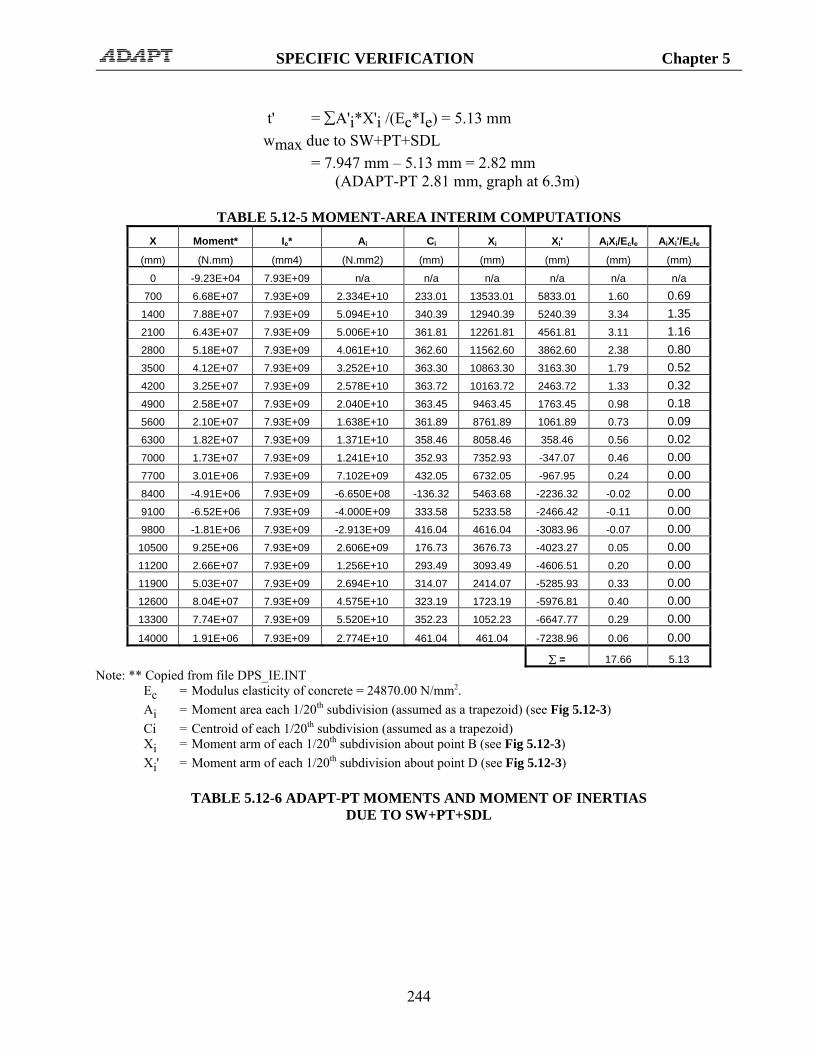
SPECIFIC VERIFICATION Chapter 5
244
t' = ∑A'i*X'i /(Ec*Ie) = 5.13 mm wmax due to SW+PT+SDL = 7.947 mm – 5.13 mm = 2.82 mm (ADAPT-PT 2.81 mm, graph at 6.3m)
TABLE 5.12-5 MOMENT-AREA INTERIM COMPUTATIONS
X Moment* Ie* Ai Ci Xi Xi' AiXi/EcIe AiXi'/EcIe
(mm) (N.mm) (mm4) (N.mm2) (mm) (mm) (mm) (mm) (mm)
0 -9.23E+04 7.93E+09 n/a n/a n/a n/a n/a n/a
700 6.68E+07 7.93E+09 2.334E+10 233.01 13533.01 5833.01 1.60 0.69 1400 7.88E+07 7.93E+09 5.094E+10 340.39 12940.39 5240.39 3.34 1.35 2100 6.43E+07 7.93E+09 5.006E+10 361.81 12261.81 4561.81 3.11 1.16 2800 5.18E+07 7.93E+09 4.061E+10 362.60 11562.60 3862.60 2.38 0.80 3500 4.12E+07 7.93E+09 3.252E+10 363.30 10863.30 3163.30 1.79 0.52 4200 3.25E+07 7.93E+09 2.578E+10 363.72 10163.72 2463.72 1.33 0.32 4900 2.58E+07 7.93E+09 2.040E+10 363.45 9463.45 1763.45 0.98 0.18 5600 2.10E+07 7.93E+09 1.638E+10 361.89 8761.89 1061.89 0.73 0.09 6300 1.82E+07 7.93E+09 1.371E+10 358.46 8058.46 358.46 0.56 0.02 7000 1.73E+07 7.93E+09 1.241E+10 352.93 7352.93 -347.07 0.46 0.00 7700 3.01E+06 7.93E+09 7.102E+09 432.05 6732.05 -967.95 0.24 0.00 8400 -4.91E+06 7.93E+09 -6.650E+08 -136.32 5463.68 -2236.32 -0.02 0.00 9100 -6.52E+06 7.93E+09 -4.000E+09 333.58 5233.58 -2466.42 -0.11 0.00 9800 -1.81E+06 7.93E+09 -2.913E+09 416.04 4616.04 -3083.96 -0.07 0.00
10500 9.25E+06 7.93E+09 2.606E+09 176.73 3676.73 -4023.27 0.05 0.00 11200 2.66E+07 7.93E+09 1.256E+10 293.49 3093.49 -4606.51 0.20 0.00 11900 5.03E+07 7.93E+09 2.694E+10 314.07 2414.07 -5285.93 0.33 0.00 12600 8.04E+07 7.93E+09 4.575E+10 323.19 1723.19 -5976.81 0.40 0.00 13300 7.74E+07 7.93E+09 5.520E+10 352.23 1052.23 -6647.77 0.29 0.00 14000 1.91E+06 7.93E+09 2.774E+10 461.04 461.04 -7238.96 0.06 0.00
∑ = 17.66 5.13 Note: ** Copied from file DPS_IE.INT
Ec = Modulus elasticity of concrete = 24870.00 N/mm2. Ai = Moment area each 1/20th subdivision (assumed as a trapezoid) (see Fig 5.12-3) Ci = Centroid of each 1/20th subdivision (assumed as a trapezoid) Xi = Moment arm of each 1/20th subdivision about point B (see Fig 5.12-3) Xi' = Moment arm of each 1/20th subdivision about point D (see Fig 5.12-3)
TABLE 5.12-6 ADAPT-PT MOMENTS AND MOMENT OF INERTIAS DUE TO SW+PT+SDL

SPECIFIC VERIFICATION Chapter 5
245
ADAPT STRUCTURAL CONCRETE SOFTWARE SYSTEM DATE: Apr 1,2010 TIME: 11:28 Data ID: Two-span Output File ID: DPS_IE.INT ============================================================================== Applied moment (Ma), Cracked moment (Mcr), Gross Moment of Inertia (Ig) Cracked I (Icr) and Effective I (Ie) S pts Ma Mcr Ig Icr Ie ------------------------------------------------------------------------------- 1 0 -.9229000E+05 0.3592759E+09 0.79334001E+10 0.16055849E+10 0.79334001E+10 1 1 0.6677000E+08 0.1643583E+09 0.79334001E+10 0.39684918E+09 0.79334001E+10 1 2 0.7876000E+08 0.1643583E+09 0.79334001E+10 0.79719840E+09 0.79334001E+10 1 3 0.6428000E+08 0.1643583E+09 0.79334001E+10 0.14058943E+10 0.79334001E+10 1 4 0.5175000E+08 0.1643583E+09 0.79334001E+10 0.20719323E+10 0.79334001E+10 1 5 0.4116000E+08 0.1643583E+09 0.79334001E+10 0.26568640E+10 0.79334001E+10 1 6 0.3250000E+08 0.1643583E+09 0.79334001E+10 0.32789911E+10 0.79334001E+10 1 7 0.2578000E+08 0.1643583E+09 0.79334001E+10 0.37925463E+10 0.79334001E+10 1 8 0.2101000E+08 0.1643583E+09 0.79334001E+10 0.42929088E+10 0.79334001E+10 1 9 0.1817000E+08 0.1643583E+09 0.79334001E+10 0.44784497E+10 0.79334001E+10 1 10 0.1728000E+08 0.1643583E+09 0.79334001E+10 0.44074916E+10 0.79334001E+10 1 11 0.3010000E+07 0.1643583E+09 0.79334001E+10 0.41151882E+10 0.79334001E+10 1 12 -.4910000E+07 0.3592759E+09 0.79334001E+10 0.24829816E+10 0.79334001E+10 1 13 -.6518000E+07 0.3592759E+09 0.79334001E+10 0.20556161E+10 0.79334001E+10 1 14 -.1806000E+07 0.3592759E+09 0.79334001E+10 0.16085420E+10 0.79334001E+10 1 15 0.9251000E+07 0.1643583E+09 0.79334001E+10 0.14727880E+10 0.79334001E+10 1 16 0.2663000E+08 0.1643583E+09 0.79334001E+10 0.91057600E+09 0.79334001E+10 1 17 0.5033000E+08 0.1643583E+09 0.79334001E+10 0.50706038E+09 0.79334001E+10 1 18 0.8037000E+08 0.1643583E+09 0.79334001E+10 0.30751213E+09 0.79334001E+10 1 19 0.7735000E+08 0.1643583E+09 0.79334001E+10 0.39173213E+09 0.79334001E+10 1 20 0.1910000E+07 0.1643583E+09 0.79334001E+10 0.13872516E+10 0.79334001E+10
ii. Deflection due to SW + PT + SDL + LL:
t = ∑Ai*Xi /(Ec*Ie) = 99.65 mm θa = 99.65/14,000 = 7.118E-03 (wmax + t' ) = 7.118E-03*6,300 mm = 44.84 mm
t' = ∑A'i*X'i /(Ec*Ie) = 19.70 mm wmax due to SW+PT+SDL+LL = 44.84 mm – 19.70 mm = 25.14 mm
wmax due to live load = wmax due to SW+PT+SDL+LL – wmax due to SW+PT+SDL = 25.14 – 2.82 = 22.32 mm
(ADAPT-PT 22.3 mm, data block 14, column 6)
TABLE 5.12-7 MOMENT-AREA INTERIM COMPUTATIONS X Moment* Ie* Ai Ci Xi Xi' AiXi/EcIe AiXi'/EcIe
(mm) (N.mm) (mm4) (N.mm2) (mm) (mm) (mm) (mm) (mm)

SPECIFIC VERIFICATION Chapter 5
246
0 -9.23E+04 7.93E+09 n/a n/a n/a n/a n/a n/a
700 1.12E+08 7.93E+09 3.906E+10 233.14 13533.14 5833.14 2.68 1.15
1400 1.63E+08 7.93E+09 9.608E+10 328.28 12928.28 5228.28 6.30 2.55
2100 1.82E+08 6.25E+09 1.205E+11 343.66 12243.66 4543.66 8.36 3.10
2800 1.96E+08 5.51E+09 1.322E+11 345.43 11545.43 3845.43 10.43 3.48
3500 2.07E+08 5.29E+09 1.412E+11 346.88 10846.88 3146.88 11.40 3.31
4200 2.14E+08 5.39E+09 1.474E+11 348.09 10148.09 2448.09 11.26 2.72
4900 2.17E+08 5.59E+09 1.509E+11 349.19 9449.19 1749.19 10.44 1.93
5600 2.16E+08 5.90E+09 1.516E+11 350.27 8750.27 1050.27 9.28 1.11
6300 2.11E+08 6.11E+09 1.495E+11 351.37 8051.37 351.37 8.06 0.35
7000 2.02E+08 6.30E+09 1.446E+11 352.48 7352.48 -347.52 6.89 0.00
7700 1.74E+08 7.33E+09 1.317E+11 358.71 6658.71 -1041.29 5.17 0.00
8400 1.46E+08 7.93E+09 1.122E+11 360.08 5960.08 -1739.92 3.52 0.00
9100 1.19E+08 7.93E+09 9.296E+10 361.95 5261.95 -2438.05 2.48 0.00
9800 9.24E+07 7.93E+09 7.407E+10 364.76 4564.76 -3135.24 1.71 0.00
10500 6.61E+07 7.93E+09 5.549E+10 369.36 3869.36 -3830.64 1.09 0.00
11200 4.02E+07 7.93E+09 3.722E+10 378.38 3178.38 -4521.62 0.60 0.00
11900 1.48E+07 7.93E+09 1.927E+10 403.89 2503.89 -5196.11 0.24 0.00
12600 -1.02E+07 7.93E+09 1.628E+09 976.49 2376.49 -5323.51 0.02 0.00
13300 -7.41E+07 7.93E+09 -2.948E+10 261.48 961.48 -6738.52 -0.14 0.00
14000 -2.16E+08 7.93E+09 -1.016E+11 292.85 292.85 -7407.15 -0.15 0.00
∑ = 99.65 19.70 Note: ** Copied from file DPSL_IE.INT
Ec = Modulus elasticity of concrete = 24870.00 N/mm2. Ai = Moment area each 1/20th subdivision (assumed as a trapezoid) (see Fig 5.12-3) Ci = Centroid of each 1/20th subdivision (assumed as a trapezoid) Xi = Moment arm of each 1/20th subdivision about point B (see Fig 5.12-3) Xi' = Moment arm of each 1/20th subdivision about point D (see Fig 5.12-3)
TABLE 5.12-8 ADAPT-PT MOMENTS AND MOMENT OF INERTIAS DUE TO SW+PT+SDL+LL ADAPT STRUCTURAL CONCRETE SOFTWARE SYSTEM DATE: Apr 1,2010 TIME: 11:28 Data ID: Two-span Output File ID: DPSL_IE.INT ============================================================================== Applied moment (Ma), Cracked moment (Mcr), Gross Moment of Inertia (Ig) Cracked I (Icr) and Effective I (Ie) S pts Ma Mcr Ig Icr Ie -------------------------------------------------------------------------------- 1 0 -.9229000E+05 0.3592759E+09 0.79334001E+10 0.16055849E+10 0.79334001E+10 1 1 0.1117000E+09 0.1643583E+09 0.79334001E+10 0.39684918E+09 0.79334001E+10 1 2 0.1628000E+09 0.1643583E+09 0.79334001E+10 0.79719840E+09 0.79334001E+10 1 3 0.1815000E+09 0.1643583E+09 0.79334001E+10 0.14058943E+10 0.62531092E+10 1 4 0.1963000E+09 0.1643583E+09 0.79334001E+10 0.20719323E+10 0.55124234E+10 1 5 0.2071000E+09 0.1643583E+09 0.79334001E+10 0.26568640E+10 0.52943099E+10 1 6 0.2140000E+09 0.1643583E+09 0.79334001E+10 0.32789911E+10 0.53876101E+10 1 7 0.2170000E+09 0.1643583E+09 0.79334001E+10 0.37925463E+10 0.55917722E+10 1 8 0.2160000E+09 0.1643583E+09 0.79334001E+10 0.42929088E+10 0.58967956E+10 1 9 0.2110000E+09 0.1643583E+09 0.79334001E+10 0.44784497E+10 0.61113866E+10 1 10 0.2022000E+09 0.1643583E+09 0.79334001E+10 0.44074916E+10 0.63011538E+10 1 11 0.1741000E+09 0.1643583E+09 0.79334001E+10 0.41151882E+10 0.73276554E+10
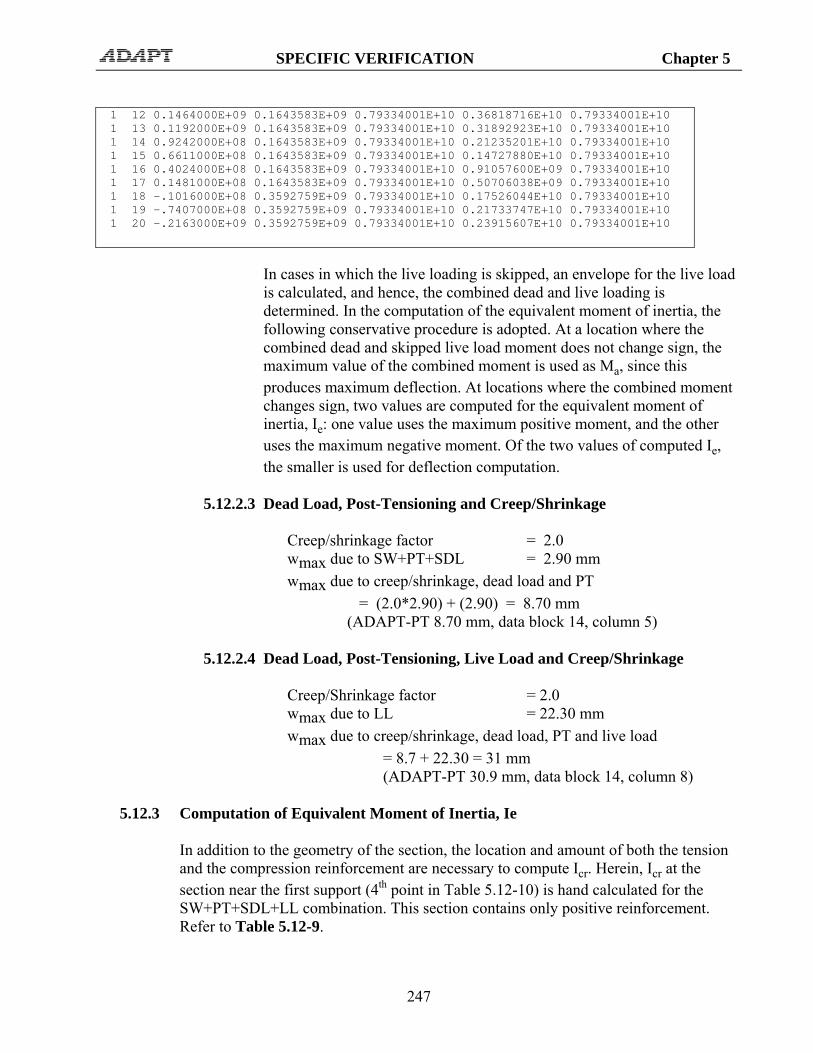
SPECIFIC VERIFICATION Chapter 5
247
1 12 0.1464000E+09 0.1643583E+09 0.79334001E+10 0.36818716E+10 0.79334001E+10 1 13 0.1192000E+09 0.1643583E+09 0.79334001E+10 0.31892923E+10 0.79334001E+10 1 14 0.9242000E+08 0.1643583E+09 0.79334001E+10 0.21235201E+10 0.79334001E+10 1 15 0.6611000E+08 0.1643583E+09 0.79334001E+10 0.14727880E+10 0.79334001E+10 1 16 0.4024000E+08 0.1643583E+09 0.79334001E+10 0.91057600E+09 0.79334001E+10 1 17 0.1481000E+08 0.1643583E+09 0.79334001E+10 0.50706038E+09 0.79334001E+10 1 18 -.1016000E+08 0.3592759E+09 0.79334001E+10 0.17526044E+10 0.79334001E+10 1 19 -.7407000E+08 0.3592759E+09 0.79334001E+10 0.21733747E+10 0.79334001E+10 1 20 -.2163000E+09 0.3592759E+09 0.79334001E+10 0.23915607E+10 0.79334001E+10
In cases in which the live loading is skipped, an envelope for the live load is calculated, and hence, the combined dead and live loading is determined. In the computation of the equivalent moment of inertia, the following conservative procedure is adopted. At a location where the combined dead and skipped live load moment does not change sign, the maximum value of the combined moment is used as Ma, since this produces maximum deflection. At locations where the combined moment changes sign, two values are computed for the equivalent moment of inertia, Ie: one value uses the maximum positive moment, and the other uses the maximum negative moment. Of the two values of computed Ie, the smaller is used for deflection computation.
5.12.2.3 Dead Load, Post-Tensioning and Creep/Shrinkage
Creep/shrinkage factor = 2.0 wmax due to SW+PT+SDL = 2.90 mm wmax due to creep/shrinkage, dead load and PT
= (2.0*2.90) + (2.90) = 8.70 mm (ADAPT-PT 8.70 mm, data block 14, column 5)
5.12.2.4 Dead Load, Post-Tensioning, Live Load and Creep/Shrinkage
Creep/Shrinkage factor = 2.0 wmax due to LL = 22.30 mm wmax due to creep/shrinkage, dead load, PT and live load = 8.7 + 22.30 = 31 mm (ADAPT-PT 30.9 mm, data block 14, column 8)
5.12.3 Computation of Equivalent Moment of Inertia, Ie
In addition to the geometry of the section, the location and amount of both the tension and the compression reinforcement are necessary to compute Icr. Herein, Icr at the section near the first support (4th point in Table 5.12-10) is hand calculated for the SW+PT+SDL+LL combination. This section contains only positive reinforcement. Refer to Table 5.12-9.
SPECIFIC VERIFICATION Chapter 5
248
For this combination since tension occurs at the bottom fiber of the section, indicated by the positive moment in Table 5.12-10, the following are the primary equations used in determining the cracking moment of inertia, Icr.
Icr = b(c)3/3 + nsAs (d-c)2 + npAps (dp-c)2 + As’(n-1)(c-d’)2
For the current problem, As = 436.9 mm2 (Table 5.12-9) As' = 0 mm2 (Table 5.12-9) Ap = 1500*103/1200 = 1250 mm2 b = 2000 mm d = 429 mm dp = 500- 225.59 =274.41 mm d' = 71 mm Ec = 24,870 N/mm2
Es = Es' = 200,000 N/mm2
Ep = 200,000 N/mm2 ns = Es/Ec = 8.04 np = Ep/Ec = 8.04 c = 500-396.90 = 103.10 mm (Extracted from Icr_p.dat file)
Solving for Icr,
Icr = 2000*(103.10)3/3 + 8.04*436.90*(429 – 103.10)2 + 8.04*1250* (274.41 –
103.10)2 + 0*(8.40-1)(103.10-71)2 = 0.1399E+10mm4 (ADAPT-PT 0.1406E+10 mm4, DPSL_IE.INT file)
Ie = (Mcr / Ma)3 Ig + [1-(Mcr / Ma)3]Icr ≤ Ig (5.10.2-1)
Where for the current problem,
Mcr = 0.1643583E+09 N.mm (Extracted from DPSL_IE.INT file) Ma = 0.1815000E+09 N.mm (Extracted from DPSL_IE.INT file)
Ig = 0.7933400E+10 mm4 (Extracted from DPSL_IE.INT file)
After substitution,
Ie = (0.1643583E+09 / 0.1815000E+09)3 *0.7933400E+10 + [1-(0.1643583E+09 / 0.1815000E+09)3]* 0.1399E+10
= 0.6251E+10 mm4 < Ig = 0.79334E+10 mm4
(ADAPT-PT 0.6253E+10 mm4, DPSL_IE.INT file)

SPECIFIC VERIFICATION Chapter 5
249
TABLE 5.12-9 ADAPT-RC 1/20TH POINT REINFORCEMENT OUTPUTS
29 - DETAILED REBAR SPAN 1
X/L X Analysis Top
Analysis Bot
Minimum Top
Minimum Bot
Selected Top
Selected Bot
m mm2 mm2 mm2 mm2 mm2 mm2 0.00 0.00 0.00 0.00 1019.00 0.00 1019.00 0.00 0.05 0.70 0.00 0.00 1019.00 0.00 1019.00 0.00 0.10 1.40 0.00 194.60 1019.00 0.00 1019.00 194.60 0.15 2.10 0.00 436.90 1019.00 0.00 1019.00 436.90 0.20 2.80 0.00 667.40 0.00 0.00 0.00 667.40 0.25 3.50 0.00 782.30 0.00 0.00 0.00 782.30 0.30 4.20 0.00 864.60 0.00 0.00 0.00 864.60 0.35 4.90 0.00 893.60 0.00 548.90 0.00 893.60 0.40 5.60 0.00 1070.00 0.00 548.90 0.00 1070.00 0.45 6.30 0.00 1020.00 0.00 548.90 0.00 1020.00 0.50 7.00 0.00 850.70 0.00 548.90 0.00 850.70 0.55 7.70 0.00 654.20 0.00 548.90 0.00 654.20 0.60 8.40 0.00 286.80 0.00 548.90 0.00 548.90 0.65 9.10 0.00 0.00 0.00 548.90 0.00 548.90 0.70 9.80 0.00 0.00 0.00 0.00 0.00 0.00 0.75 10.50 0.00 0.00 0.00 0.00 0.00 0.00 0.80 11.20 0.00 0.00 0.00 0.00 0.00 0.00 0.85 11.90 0.00 0.00 1019.00 0.00 1019.00 0.00 0.90 12.60 0.00 0.00 1019.00 0.00 1019.00 0.00 0.95 13.30 0.00 0.00 1019.00 0.00 1019.00 0.00 1.00 14.00 232.90 844.00 1019.00 0.00 1019.00 844.00
TABLE 5.12-10 ADAPT-PT MOMENTS AND MOMENT OF INERTIAS DUE TO SW+PT+SDL+LL
ADAPT STRUCTURAL CONCRETE SOFTWARE SYSTEM DATE: Apr 1,2010 TIME: 11:28 Data ID: Two-span Output File ID: DPSL_IE.INT ============================================================================== Applied moment (Ma), Cracked moment (Mcr), Gross Moment of Inertia (Ig) Cracked I (Icr) and Effective I (Ie) S pts Ma Mcr Ig Icr Ie ------------------------------------------------------------------------------ 1 0 -.9229000E+05 0.3592759E+09 0.79334001E+10 0.16055849E+10 0.79334001E+10 1 1 0.1117000E+09 0.1643583E+09 0.79334001E+10 0.39684918E+09 0.79334001E+10 1 2 0.1628000E+09 0.1643583E+09 0.79334001E+10 0.79719840E+09 0.79334001E+10 1 3 0.1815000E+09 0.1643583E+09 0.79334001E+10 0.14058943E+10 0.62531092E+10 1 4 0.1963000E+09 0.1643583E+09 0.79334001E+10 0.20719323E+10 0.55124234E+10 1 5 0.2071000E+09 0.1643583E+09 0.79334001E+10 0.26568640E+10 0.52943099E+10 1 6 0.2140000E+09 0.1643583E+09 0.79334001E+10 0.32789911E+10 0.53876101E+10 1 7 0.2170000E+09 0.1643583E+09 0.79334001E+10 0.37925463E+10 0.55917722E+10 1 8 0.2160000E+09 0.1643583E+09 0.79334001E+10 0.42929088E+10 0.58967956E+10 1 9 0.2110000E+09 0.1643583E+09 0.79334001E+10 0.44784497E+10 0.61113866E+10 1 10 0.2022000E+09 0.1643583E+09 0.79334001E+10 0.44074916E+10 0.63011538E+10 1 11 0.1741000E+09 0.1643583E+09 0.79334001E+10 0.41151882E+10 0.73276554E+10 1 12 0.1464000E+09 0.1643583E+09 0.79334001E+10 0.36818716E+10 0.79334001E+10 1 13 0.1192000E+09 0.1643583E+09 0.79334001E+10 0.31892923E+10 0.79334001E+10 1 14 0.9242000E+08 0.1643583E+09 0.79334001E+10 0.21235201E+10 0.79334001E+10

SPECIFIC VERIFICATION Chapter 5
250
1 15 0.6611000E+08 0.1643583E+09 0.79334001E+10 0.14727880E+10 0.79334001E+10 1 16 0.4024000E+08 0.1643583E+09 0.79334001E+10 0.91057600E+09 0.79334001E+10 1 17 0.1481000E+08 0.1643583E+09 0.79334001E+10 0.50706038E+09 0.79334001E+10 1 18 -.1016000E+08 0.3592759E+09 0.79334001E+10 0.17526044E+10 0.79334001E+10 1 19 -.7407000E+08 0.3592759E+09 0.79334001E+10 0.21733747E+10 0.79334001E+10 1 20 -.2163000E+09 0.3592759E+09 0.79334001E+10 0.23915607E+10 0.79334001E+10
5.13 ONE-WAY SHEAR VERIFICATION FOR BRITISH VERSION The following describes the general method of verification for each of the datum columns of ADAPT-PT report for one-way shear calculation (Data Block 12). Following the description, a specific section of the three span T-beam given at the end of this section is verified. ADAPT-PT reports moments, shears and stresses at 1/20th points along each span in MOMENTS.DAT, SHEARS.DAT and STRESSES.DAT files. These files are reproduced and attached at the end of this section for ease of reference. Shear calculations are carried out for sections which fall outside the face-of-support. Sections which are adjacent to the supports (up to two times the member depth from the face-of-support) exhibit a stronger shear resistance compared to sections away from supports. This added strength, referred to in BS8110 3.4.5.8 as enhanced shear strength is conservatively disregarded in the shear evaluations by ADAPT-PT. Hence, sections near the supports and concentrated loading are treated the same as regular sections. Column 4. Vu This is the factored shear. The factors are read from the A.2 block of the concise report in the Report Generator; the shears from SHEARS.DAT. User can enter up to four strength load combinations in the input screen. In such a case, program evaluates the shear stress ratio for all the combinations and the factored shear associated with the highest stress ratio is selected and reported in data block 12. STRUPRC_det.dat file gives the shear reinforcement calculation for each strength load combination. Vu = 1.4*Vd + 1.60*Vl + Vsec Consider a section in the second span distanced 1.7 meters from the second-support. Refer to SHEARS.DAT printout, second span, X/L=0.10; the following values are read off and combined into V: Vu = 1.4*(-225.30) + 1.6*(-64.37) + 15.78= -402.63 kN
(Block 12, Column 4, -402.60 kN) Column 5. Mu

SPECIFIC VERIFICATION Chapter 5
251
Factored moments are calculated at 1/20th points from the MOMENTS.DAT file using the following relationship. The numerical factors are given in A.2 block of the concise report in Report Generator. Mu = 1.4*Md + 1.6*Ml + Msec Observe that due to the patterned nature of live load, it is possible that at a given section there will be both a positive and a negative live load moment due to different arrangements of loads. Also, the user can enter up to four strength load combinations in the input screen. In such a case, program evaluates the shear stress ratio for all the combinations and the factored moment associated with the highest stress ratio is selected and reported in data block 12. For the section being used as an example: Mu = 1.4*(-591.32) + 1.6*(-168.95) + 284.32 = -813.85 kNm Conservatively program multiplies this value with 1.01 factor, Mu = 1.01 * 813.85 = 821.99 kNm (Block 12, Column 5, -821.90) Column 6. Vc vc is the design concrete shear 3.9 of BS8110 as follows: vc = (0.79*[100*(Aps+As)/(bv*dr)]
1/3 *(400/dr)1/4* (fcu/25)1/3)/γm
where, Aps = Area of prestressing steel As = area of nonprestressed reinforcement on tension side bv = width of section (stem width for T-sections) dr = distance of tension rebar to compression fiber γm = material constant stipulated as 1.25 The following adjustments are observed when calculating vc: if [100*(Aps+As)/(bv*dr)] > 3 , set it equal to 3; if (400/dr) < 1 , set it equal to 1; The enhancement in concrete shear stress vc is considered due to higher concrete strength fcu. The enhancement states that for concrete strengths up to fcu = 40 N/mm2, vc may be multiplied by (fcu/25)1/3.
SPECIFIC VERIFICATION Chapter 5
252
For the particular section of the example: Aps = 1660*1000/1060 = 1566 mm2; where, 1660 kN is the specified post-tensioning force for span 1 from (B7.2, C2). Observe that the same force is used for the section under consideration in the second span, since it is assumed that terminated tendons extend over the support from first span into the second span and are anchored at one-fifth point of second span; 1060 N/mm2 is the average stress in tendon specified by user as part of input and given in B1. bv = 460 mm from (B2.1, C4); dr = 900 - 25 - 16/2 = 867 mm; where 25 mm is cover to rebar from B1 and 16 mm is the diameter of top bar specified by user and read from B10.2, C6. Note that the top bar parameters are used, since M is negative, otherwise bottom bar values apply. As = 0 mm (B29, C3) Note that the rebar area chosen is for the tension side, and that it is used if it falls within the rebar cut-off length stipulated by the user during data input. Substituting the values: vc = (0.79*[l00*(1566+0)/(460*867)]
1/3*(1)
l/4* (35/25)1/3)/1.25 = 0.518 N/mm2
Vc = 0.518*460*867 = 206.59 kN (B12,C6; 206.90 kN, OK)
In the preceding (400/867) is set as 1, since it shall not be taken less than 1. Column 7. Vco From Equation 54 of BS8110 4.3.8.4 Vco = 0.67*bv*h*(ft2 + 0.8*fcp*ft)1/2
where, ft = maximum design principal tensile stress ft = 0.24*(fcu)1/2 (BS8110 4.3.8.4); and

SPECIFIC VERIFICATION Chapter 5
253
fcp = design compressive stress at the centroidal axis due to prestress, taken as positive; for T-sections and when the centroidal axis falls within the flange the stress at the interface of stem and flange is used
For the particular case: ft = 0.24*(35)1/2 = 1.42 N/mm2
Strictly speaking, the centroidal axis used for shear should be based on the cross-sectional geometry that is defined by the effective width of the section. However, in the example under consideration, the effective width concept was not used. Hence the properties of the entire section are used. Since centroidal axis (305.08 mm from the flanged side, B4.1, C5) falls within the stem (flange thickness 120 mm, B2.1, C7) the stresses at centroid are used. The stress at the centroidal axis is interpolated between the stresses at the extreme fibers given in the section 27-Detailed Stresses of the detailed report. Also provided in STRESS.DAT file under PT. Refer the report and read the extreme fiber stresses for span 2, X/L = 0.1 as follows: Stress at top, ftop = -5.70 N/mm2 (compression) stress at bottom, fbot = 3.68 N/mm2 total depth = 900 mm depth from bottom to centroidal axis
= 594.92 mm
Hence, fcp = 3.68 + (594.92/900)*(-5.70 - 3.68)
= -2.52 N/mm2
Vco = 0.67*460*900*(1.422 + 0.80*2.52*1.42)1/2 = 612.70 kN
(B12, C7; 612.60 kN)
Note that in the preceding relationship compression is substituted as positive Column 8. Vcr The design ultimate resistance of a section cracked in flexure is given by Equation 55 of BS8110,: Vcr = (1 - 0.55*fpea/fpu)*vc *bv*d + (Mo/M)*V

SPECIFIC VERIFICATION Chapter 5
254
But, Vcr need not be less than 0.1*bv*d*(fcu)l/2. The parameters are: fpea = adjusted fpe fpea = PTF/(Aps + (fy/fpu)*As); PTF is the prestressing force (B7.2, C2); but if fpe = PTF/Aps > 0.6*fpu set fpe = 0.6*fpu; fpe is user input, see B1 fpu = tendon's ultimate strength; user input, see B1; vc = design concrete shear stress given under column 6; Mo = defined under column 9; and V = given under column 5. For the section under consideration PTF = 1660 kN (B7.2, C2); fpe = 1060 N/mm2 (B1) Aps = PTF/fpe = 1660*1000/1060 = 1566 N/mm2;
As = 0 mm2 (B29, C3); M/Mo = 1.06 V = 402.60 kN Substitute; fpea = (1660*1000)/(1566 + (460/1770)*0)
= 1060 N/mm2
Vcr = (1 - 0.55*1060/1770)*0.518*460*867
+ 402.63*1000/1.67
= 379.64 kN (B12, C8, 379.50 kN, OK) Column 9. Ratio M/Mo Herein; M = applied factor moment (B12, C5) Mo = moment necessary to produce zero stress in the concrete at the
extreme tension fiber (decompression moment); in this calculation only 0.80 of the stress due to prestress is taken into account

SPECIFIC VERIFICATION Chapter 5
255
Mo is calculated from the prestressing stresses and the section modulii. The following two conditions are differentiated: One, if applied moment due to dead and live loading alone is positive, then Mo = 0.80(P*e +fcp*Sb); and, two, when the sum of dead and live loading are negative Mo = 0.80(P*e +fcp*St); Strictly speaking Mbal should be used instead of P*e in the above equations for M0. where, fcp = design compressive stress at the centroidal axis due to
prestress, taken as positive; for T-sections and when the centroidal axis falls within the flange the stress at the interface of stem and flange is used
Sb and St e
= bottom and top section modulii derived from B4.1. = eccentricity of the tendon from N.A
For the particular example and from MOMENTS.DAT file it is noted that (DL + LL) moments add up to a negative number, hence relationship (ii) is used. Stress at top, ftop = -5.70 N/mm2 (compression) stress at bottom, fbot = 3.68 N/mm2 total depth = 900 mm depth from bottom to centroidal axis CGS of tendon
= 594.92 mm = 708 mm (B21, C7)
Hence, fcp = 3.68 + (594.92/900)*(-5.70 - 3.68)
= -2.52 N/mm2 St = I/Yt = (0.5164*1011)/305.08 = 169.3*106 mm3 e = 708 – 594.92 = 113.08 mm Mo = 0.80(1660*1000*113.08 +2.52*169.3*106)/106 = 491.48 kNm; M = 821.99 kNm (from column 5); hence
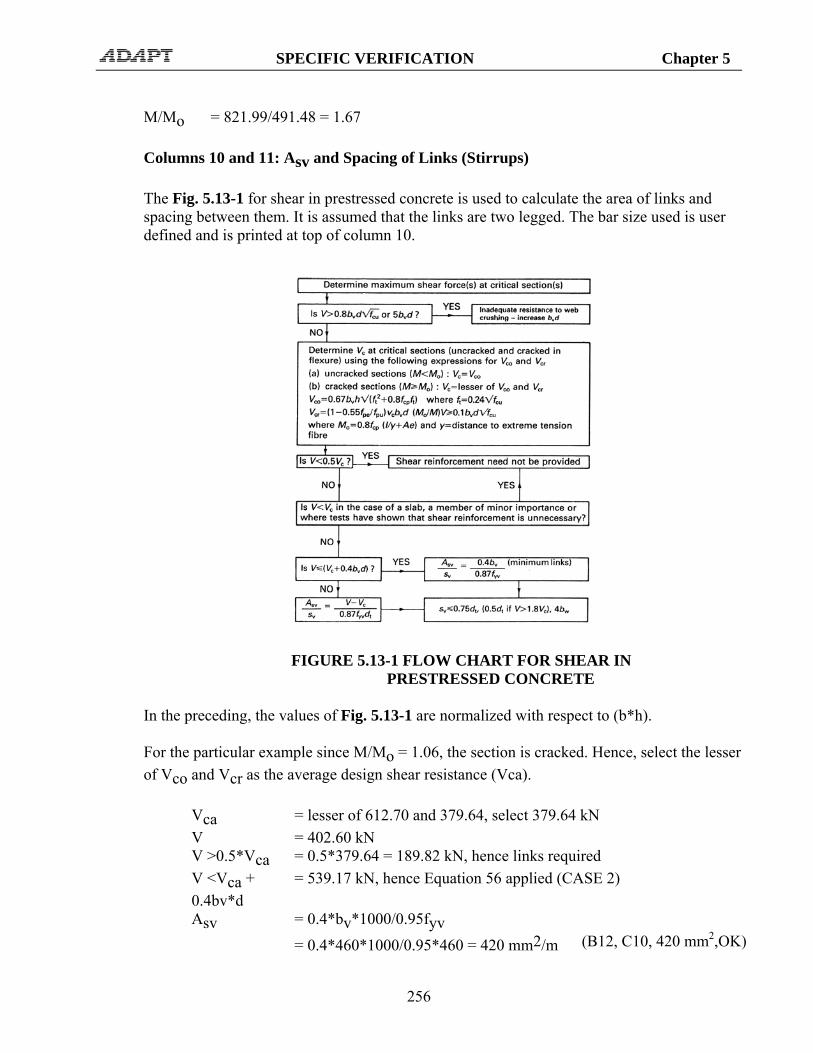
SPECIFIC VERIFICATION Chapter 5
256
M/Mo = 821.99/491.48 = 1.67 Columns 10 and 11: Asv and Spacing of Links (Stirrups) The Fig. 5.13-1 for shear in prestressed concrete is used to calculate the area of links and spacing between them. It is assumed that the links are two legged. The bar size used is user defined and is printed at top of column 10.
FIGURE 5.13-1 FLOW CHART FOR SHEAR IN
PRESTRESSED CONCRETE In the preceding, the values of Fig. 5.13-1 are normalized with respect to (b*h). For the particular example since M/Mo = 1.06, the section is cracked. Hence, select the lesser of Vco and Vcr as the average design shear resistance (Vca).
Vca = lesser of 612.70 and 379.64, select 379.64 kN V = 402.60 kN V >0.5*Vca = 0.5*379.64 = 189.82 kN, hence links required V <Vca + 0.4bv*d
= 539.17 kN, hence Equation 56 applied (CASE 2)
Asv = 0.4*bv*1000/0.95fyv = 0.4*460*1000/0.95*460 = 420 mm2/m (B12, C10, 420 mm2,OK)

SPECIFIC VERIFICATION Chapter 5
257
Area for each two-legged 12mm bar used is 2*113 = 226 mm2; hence, the required spacing sv is given by: sv = 1000*226/420 = 538.10 mm (B12,C11, 538.50 mm, OK) 5.13.1 Beam Example (MNL5-3B)
FIGURE 5.13-2

SPECIFIC VERIFICATION Chapter 5
258
1 - USER SPECIFIED GENERAL ANALYSIS AND DESIGN PARAMETERS
Parameter Value Parameter Value Concrete Post-tensioning
Fcu for BEAMS/SLABS 35.00 N/mm 2 SYSTEM UNBONDED For COLUMNS/WALLS 35.00 N/mm 2 Fpu 1770.00 N/mm 2 Ec for BEAMS/SLABS 26568.00 N/mm 2 Fse 1060.00 N/mm 2
For COLUMNS/WALLS 26568.00 N/mm 2 Strand area 150.000 mm 2 CREEP factor 2.00 Min CGS from TOP 35.00 mm
CONCRETE WEIGHT NORMAL Min CGS from BOT for interior spans 80.00 mm Tension stress limits / (f'c)1/2 Min CGS from BOT for exterior spans 80.00 mm
At Top 0.450 Min average precompression 1.00 N/mm 2 At Bottom 0.450 Max spacing / slab depth 8.00
Compression stress limits / f'c Analysis and design options At all locations 0.330 Structural system BEAM Reinforcement Moment of Inertia over support is NOT INCREASEDFy (Main bars) 460.00 N/mm 2 Moments reduced to face of support YES
Fy (Shear reinforcement) 460.00 N/mm 2 Moment Redistribution NO Minimum Cover at TOP 25.00 mm Effective flange width consideration NO
Minimum Cover at BOTTOM 25.00 mm DESIGN CODE SELECTED British-BS8110 (1997)
2 - INPUT GEOMETRY 2.1 Principal Span Data of Uniform Spans Span Form Length Width Depth TF Width TF
Thick. BF/MF Width
BF/MF Thick.
Rh Right Mult.
Left Mult.
m mm mm mm mm mm mm mm 1 2 20.00 460 900 2500 120 900 0.50 0.50 2 2 17.00 460 900 2500 120 900 0.50 0.50 3 2 5.00 460 900 2500 120 900 0.50 0.50
2.7 Support Width and Column Data Joint Support
Width Length
LC B(DIA.)
LC D LC % LC CBC LC Length
UC B(DIA.)
UC D UC % UC CBC UC
mm m mm mm m mm mm 1 360.0 3.0 360.0 360.0 100 (3) 2 480.0 3.0 480.0 480.0 100 (1) 3 480.0 3.0 480.0 480.0 100 (1) 4 360.0 3.0 360.0 360.0 100 (3)
3 - INPUT APPLIED LOADING 3.1 Loading As Appears in User's Input Screen
Span Class Type W P1 P2 A B C F M kN/m2 kN/m kN/m m m m kN kN-m
1 LL L 8.000 0.000 20.000 1 SDL L 28.000 0.000 20.000 2 LL L 8.000 0.000 17.000 2 SDL L 28.000 0.000 17.000 3 LL L 8.000 0.000 5.000 3 SDL L 28.000 0.000 5.000

SPECIFIC VERIFICATION Chapter 5
259
4 - CALCULATED SECTION PROPERTIES 4.1 Section Properties of Uniform Spans and Cantilevers
Span Area I Yb Yt mm2 mm4 mm mm
1 658800.00 0.52E+11 594.92 305.08 2 658800.00 0.52E+11 594.92 305.08 3 658800.00 0.52E+11 594.92 305.08
5 - MOMENTS, SHEARS AND REACTIONS 5.1 Span Moments and Shears (Excluding Live Load)
Span Load Case Moment Left
Moment Midspan
Moment Right
Shear Left
Shear Right
kN-m kN-m kN-m kN kN 1 SW 0.00 0.00 0.00 0.00 0.00 2 SW 0.00 0.00 0.00 0.00 0.00 3 SW 0.00 0.00 0.00 0.00 0.00 1 SDL -125.89 760.18 -1153.74 -228.61 331.39 2 SDL -1014.79 293.37 -421.47 -272.90 203.10 3 SDL -368.38 -94.60 4.18 -144.51 -4.51 1 XL 0.00 0.00 0.00 0.00 0.00 2 XL 0.00 0.00 0.00 0.00 0.00 3 XL 0.00 0.00 0.00 0.00 0.00
5.2 Reactions and Column Moments (Excluding Live Load)
Joint Load Case Reaction Moment Lower Column
Moment Upper Column
kN kN-m kN-m 1 SW 0.00 0.00 0.00 2 SW 0.00 0.00 0.00 3 SW 0.00 0.00 0.00 4 SW 0.00 0.00 0.00 1 SDL 228.61 -125.85 0.00 2 SDL 604.29 138.94 0.00 3 SDL 347.61 53.08 0.00 4 SDL -4.51 -4.18 0.00 1 XL 0.00 0.00 0.00 2 XL 0.00 0.00 0.00 3 XL 0.00 0.00 0.00 4 XL 0.00 0.00 0.00
5.3 Span Moments and Shears (Live Load)
Span Moment Left Max
Moment Left Min
Moment Midspan
Max
Moment Midspan Min
Moment Right Max
Moment Right Min
Shear Left
Shear Right
kN-m kN-m kN-m kN-m kN-m kN-m kN kN 1 -35.97 -35.97 217.20 217.20 -329.64 -329.64 -65.32 94.68 2 -289.94 -289.94 83.82 83.82 -120.42 -120.42 -77.97 58.03 3 -105.25 -105.25 -27.03 -27.03 1.19 1.19 -41.29 -1.29
5.4 Reactions and Column Moments (Live Load)
Joint Reaction Max
Reaction Min
Moment Lower
Column Max
Moment Lower
Column Min
Moment Upper
Column Max
Moment Upper
Column Min kN kN kN-m kN-m kN-m kN-m
1 65.32 65.32 -35.96 -35.96 0.00 0.00 2 172.66 172.66 39.70 39.70 0.00 0.00

SPECIFIC VERIFICATION Chapter 5
260
3 99.32 99.32 15.17 15.17 0.00 0.00 4 -1.29 -1.29 -1.19 -1.19 0.00 0.00
6 - MOMENTS REDUCED TO FACE OF SUPPORT 6.1 Reduced Moments at Face of Support (Excluding Live Load)
Span Load Case
Moment Left
Moment Midspan
Moment Right
kN-m kN-m kN-m 1 SW 0.00 0.00 0.00 2 SW 0.00 0.00 0.00 3 SW 0.00 0.00 0.00 1 SDL -85.19 760.20 -1075.00 2 SDL -950.10 293.40 -373.50 3 SDL -334.50 -94.60 2.92 1 XL 0.00 0.00 0.00 2 XL 0.00 0.00 0.00 3 XL 0.00 0.00 0.00
6.2 Reduced Moments at Face of Support (Live Load)
Span Moment Left Max
Moment Left Min
Moment Midspan
Max
Moment Midspan Min
Moment Right Max
Moment Right Min
kN-m kN-m kN-m kN-m kN-m kN-m 1 -24.34 -24.34 217.20 217.20 -307.10 -307.10 2 -271.50 -271.50 83.82 83.82 -106.70 -106.70 3 -95.57 -95.57 -27.03 -27.03 0.83 0.83
7 - SELECTED POST-TENSIONING FORCES AND TENDON PROFILES 7.1 Tendon Profile Tendon A
Span Type X1/L X2/L X3/L A/L 1 1 0.000 0.500 0.100 --- 2 1 0.100 0.500 0.100 --- 3 1 0.100 0.500 0.000 ---
7.2 Selected Post-Tensioning Forces and Tendon Drape Tendon A
Span Force CGS Left CGS C1 CGS C2 CGS Right P/A Wbal WBal (%DL) kN mm mm mm mm MPa kN/-
1 1660.000 595.00 --- 80.00 865.00 2.52 21.580 77 2 925.000 865.00 --- 80.00 865.00 1.40 20.100 72 3 925.000 865.00 --- 750.00 595.00 1.40 -5.920 -21
All Tendons
Span Force Total P/A Total WBal (%DL)
kN MPa 1 1660 2.52 77 2 925 1.4 72 3 925 1.4 -21
Approximate weight of strand: 425.5 Kg 7.4 Required Minimum Post-Tensioning Forces Based on Stress Conditions Based on Minimum P/A

SPECIFIC VERIFICATION Chapter 5
261
Type Left Center Right Left Center Right kN kN kN kN kN kN
1 0.00 435.74 0.00 658.80 658.80 658.80 2 0.00 0.00 0.00 658.80 658.80 658.80 3 0.00 0.00 0.00 658.80 658.80 658.80
7.5 Service Stresses (tension shown positive) Envelope of Service 1
Span Left Top Left Bottom Center Top Center Bottom
Right Top Right Bottom
MPa MPa MPa MPa MPa MPa 1 -2.26 -3.02 -4.68 1.70 0.72 -8.83 2 0.26 -7.93 -1.86 -0.51 -0.30 -3.55 3 -0.28 -3.60 -1.50 -1.22 -1.50 -1.21
7.6 Post-Tensioning Balance Moments, Shears and Reactions Span Moments and Shears
Span Moment Left Moment Center Moment Right Shear Left Shear Right kN-m kN-m kN-m kN kN
1 65.86 -611.40 834.30 -15.00 -15.00 2 751.80 -299.30 293.60 15.78 15.78 3 239.50 137.40 13.20 0.31 0.31
Reactions and Column Moments
Joint Reaction Moment Lower
Column
Moment Upper
Column kN kN-m kN-m
1 15.000 93.330 0.000 2 -30.780 -82.180 0.000 3 15.480 -48.170 0.000 4 0.305 6.829 0.000
Note: Moments are reported at face of support 8 - FACTORED MOMENTS AND REACTIONS ENVELOPE 8.1 Factored Design Moments (Not Redistributed)
Span Left Max
Left Min
Middle Max
Middle Min
Right Max
Right Min
kN-m kN-m kN-m kN-m kN-m kN-m 1 -62.18 -62.18 1655.10 1655.10 -1606.66 -1606.66 2 -1457.14 -1457.14 721.87 721.87 -646.96 -646.96 3 -626.59 -626.59 -181.75 -181.75 -1.36 -1.36
8.2 Reactions and Column Moments
Joint Reaction Max
Reaction Min
Moment Lower
Column Max
Moment Lower
Column Min
Moment Upper
Column Max
Moment Upper
Column Min kN kN kN-m kN-m kN-m kN-m
1 439.55 439.55 -140.33 -140.33 0.00 0.00 2 1091.56 1091.56 175.80 175.80 0.00 0.00 3 661.03 661.03 50.41 50.41 0.00 0.00 4 -8.08 -8.08 -0.94 -0.94 0.00 0.00
8.3 Secondary Moments
Span Left Midspan Right kN-m kN-m kN-m
1 96.03 243.30 389.70

SPECIFIC VERIFICATION Chapter 5
262
2 307.40 177.00 46.66 3 -5.38 -6.07 -6.77
Note: Moments are reported at face of support 10 - MILD STEEL - NO REDISTRIBUTION 10.1 Required Rebar 10.1.1 Total Strip Required Rebar
Span Location From To As Required Ultimate Minimum m m mm2 mm2 mm2
1 TOP 0.00 3.00 1493.00 0.00 1493.00 1 TOP 17.00 20.00 1493.00 914.70 1493.00 2 TOP 0.00 2.55 1493.00 333.00 1493.00 2 TOP 5.95 5.95 1493.00 0.00 1493.00 2 TOP 14.45 17.00 1493.00 0.00 1493.00 3 TOP 0.00 0.75 1073.00 0.00 1073.00 3 TOP 1.75 2.25 1073.00 0.00 1073.00 3 TOP 4.25 5.00 1073.00 0.00 1073.00 1 BOT 5.00 13.00 1085.00 685.50 1085.00 2 BOT 6.80 11.05 1085.00 0.00 1085.00 3 BOT 2.50 3.25 961.70 0.00 961.70
12 - SHEAR REINFORCEMENT 12.1 Shear Calculation Envelope SPAN 1 X/L X d Vu Mu Vc Vco Vcr Ratio Req. Spacing
m mm kN kNm kN kN kN mm2 mm 0.01 0.18 867.00 -430.20 -62.81 206.90 612.60 2635.00 0.70 420.00 538.50 0.05 1.00 862.50 -387.60 275.80 206.20 612.60 566.40 0.63 420.00 538.50 0.10 2.00 862.50 -335.60 640.90 206.20 612.60 358.70 0.94 420.00 538.50 0.15 3.00 862.50 -283.60 953.60 206.20 612.60 294.00 0.96 420.00 538.50 0.20 4.00 862.50 -231.60 1214.00 214.50 612.60 262.90 0.88 420.00 538.50 0.25 5.00 862.50 -179.60 1421.00 221.10 612.60 239.30 0.75 420.00 538.50 0.30 6.00 862.50 -127.60 1576.00 228.00 612.60 234.70 0.54 420.00 538.50 0.35 7.00 862.50 -75.57 1679.00 232.40 612.60 234.70 0.32 0.00 0.00 0.40 8.00 862.50 -23.57 1729.00 232.40 612.60 234.70 0.10 0.00 0.00 0.45 9.00 862.50 28.43 1727.00 228.00 612.60 234.70 0.12 0.00 0.00 0.50 10.00 862.50 80.43 1672.00 221.10 612.60 234.70 0.34 0.00 0.00 0.55 11.00 862.50 132.40 1564.00 214.50 612.60 234.70 0.56 420.00 538.50 0.60 12.00 862.50 184.40 1404.00 206.20 612.60 244.20 0.76 420.00 538.50 0.65 13.00 862.50 236.40 1191.00 206.20 612.60 285.40 0.83 420.00 538.50 0.70 14.00 862.50 288.40 926.40 206.20 612.60 340.70 0.85 420.00 538.50 0.75 15.00 862.50 340.40 608.90 206.20 612.60 436.30 0.78 420.00 538.50 0.80 16.00 862.50 392.40 238.80 206.20 612.60 778.70 0.64 420.00 538.50 0.85 17.00 867.00 444.40 -183.90 206.90 612.60 1073.00 0.73 420.00 538.50 0.90 18.00 867.00 496.40 -659.10 206.90 612.60 508.80 0.98 420.00 538.50 0.95 19.00 867.00 548.40 -1187.00 206.90 612.60 438.10 1.25 420.00 538.50 0.99 19.76 867.00 588.00 -1623.00 240.80 612.60 421.00 1.40 439.60 514.50
SPAN 2 X/L X d Vu Mu Vc Vco Vcr Ratio Req. Spacing
m mm kN kNm kN kN kN mm2 mm 0.01 0.24 867.00 -478.60 -1472.00 220.50 612.60 374.40 1.28 420.00 538.50
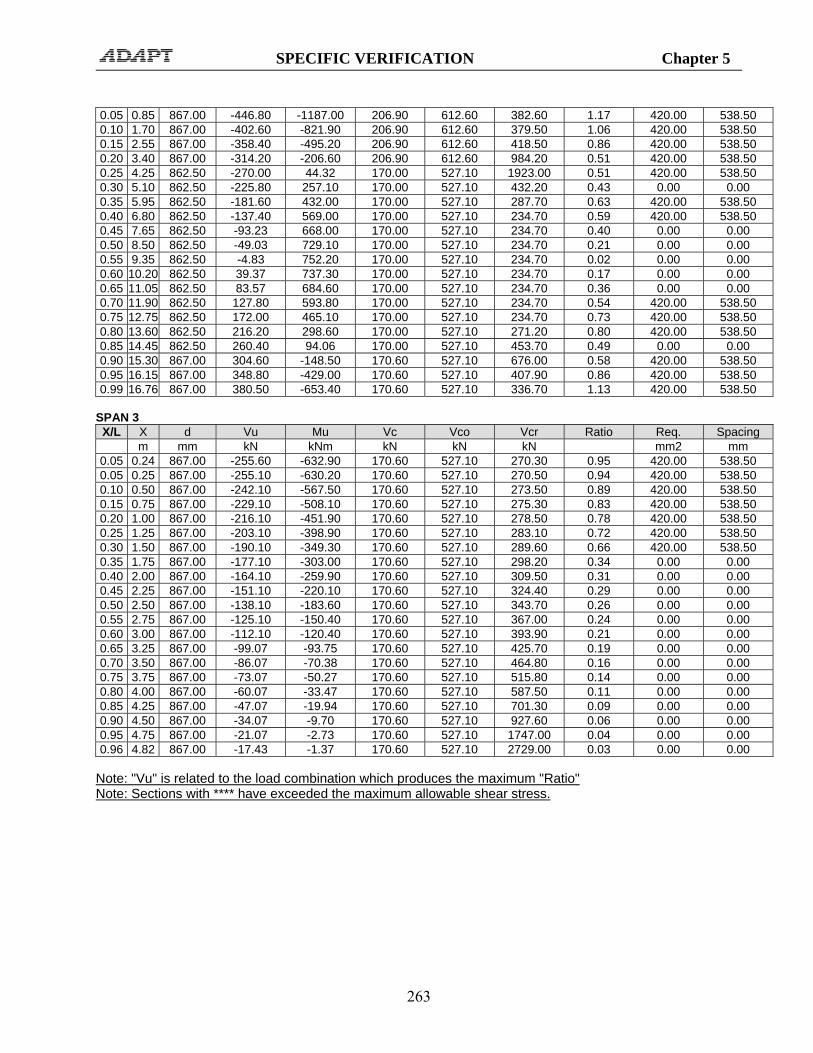
SPECIFIC VERIFICATION Chapter 5
263
0.05 0.85 867.00 -446.80 -1187.00 206.90 612.60 382.60 1.17 420.00 538.50 0.10 1.70 867.00 -402.60 -821.90 206.90 612.60 379.50 1.06 420.00 538.50 0.15 2.55 867.00 -358.40 -495.20 206.90 612.60 418.50 0.86 420.00 538.50 0.20 3.40 867.00 -314.20 -206.60 206.90 612.60 984.20 0.51 420.00 538.50 0.25 4.25 862.50 -270.00 44.32 170.00 527.10 1923.00 0.51 420.00 538.50 0.30 5.10 862.50 -225.80 257.10 170.00 527.10 432.20 0.43 0.00 0.00 0.35 5.95 862.50 -181.60 432.00 170.00 527.10 287.70 0.63 420.00 538.50 0.40 6.80 862.50 -137.40 569.00 170.00 527.10 234.70 0.59 420.00 538.50 0.45 7.65 862.50 -93.23 668.00 170.00 527.10 234.70 0.40 0.00 0.00 0.50 8.50 862.50 -49.03 729.10 170.00 527.10 234.70 0.21 0.00 0.00 0.55 9.35 862.50 -4.83 752.20 170.00 527.10 234.70 0.02 0.00 0.00 0.60 10.20 862.50 39.37 737.30 170.00 527.10 234.70 0.17 0.00 0.00 0.65 11.05 862.50 83.57 684.60 170.00 527.10 234.70 0.36 0.00 0.00 0.70 11.90 862.50 127.80 593.80 170.00 527.10 234.70 0.54 420.00 538.50 0.75 12.75 862.50 172.00 465.10 170.00 527.10 234.70 0.73 420.00 538.50 0.80 13.60 862.50 216.20 298.60 170.00 527.10 271.20 0.80 420.00 538.50 0.85 14.45 862.50 260.40 94.06 170.00 527.10 453.70 0.49 0.00 0.00 0.90 15.30 867.00 304.60 -148.50 170.60 527.10 676.00 0.58 420.00 538.50 0.95 16.15 867.00 348.80 -429.00 170.60 527.10 407.90 0.86 420.00 538.50 0.99 16.76 867.00 380.50 -653.40 170.60 527.10 336.70 1.13 420.00 538.50
SPAN 3 X/L X d Vu Mu Vc Vco Vcr Ratio Req. Spacing
m mm kN kNm kN kN kN mm2 mm 0.05 0.24 867.00 -255.60 -632.90 170.60 527.10 270.30 0.95 420.00 538.50 0.05 0.25 867.00 -255.10 -630.20 170.60 527.10 270.50 0.94 420.00 538.50 0.10 0.50 867.00 -242.10 -567.50 170.60 527.10 273.50 0.89 420.00 538.50 0.15 0.75 867.00 -229.10 -508.10 170.60 527.10 275.30 0.83 420.00 538.50 0.20 1.00 867.00 -216.10 -451.90 170.60 527.10 278.50 0.78 420.00 538.50 0.25 1.25 867.00 -203.10 -398.90 170.60 527.10 283.10 0.72 420.00 538.50 0.30 1.50 867.00 -190.10 -349.30 170.60 527.10 289.60 0.66 420.00 538.50 0.35 1.75 867.00 -177.10 -303.00 170.60 527.10 298.20 0.34 0.00 0.00 0.40 2.00 867.00 -164.10 -259.90 170.60 527.10 309.50 0.31 0.00 0.00 0.45 2.25 867.00 -151.10 -220.10 170.60 527.10 324.40 0.29 0.00 0.00 0.50 2.50 867.00 -138.10 -183.60 170.60 527.10 343.70 0.26 0.00 0.00 0.55 2.75 867.00 -125.10 -150.40 170.60 527.10 367.00 0.24 0.00 0.00 0.60 3.00 867.00 -112.10 -120.40 170.60 527.10 393.90 0.21 0.00 0.00 0.65 3.25 867.00 -99.07 -93.75 170.60 527.10 425.70 0.19 0.00 0.00 0.70 3.50 867.00 -86.07 -70.38 170.60 527.10 464.80 0.16 0.00 0.00 0.75 3.75 867.00 -73.07 -50.27 170.60 527.10 515.80 0.14 0.00 0.00 0.80 4.00 867.00 -60.07 -33.47 170.60 527.10 587.50 0.11 0.00 0.00 0.85 4.25 867.00 -47.07 -19.94 170.60 527.10 701.30 0.09 0.00 0.00 0.90 4.50 867.00 -34.07 -9.70 170.60 527.10 927.60 0.06 0.00 0.00 0.95 4.75 867.00 -21.07 -2.73 170.60 527.10 1747.00 0.04 0.00 0.00 0.96 4.82 867.00 -17.43 -1.37 170.60 527.10 2729.00 0.03 0.00 0.00
Note: "Vu" is related to the load combination which produces the maximum "Ratio" Note: Sections with **** have exceeded the maximum allowable shear stress.
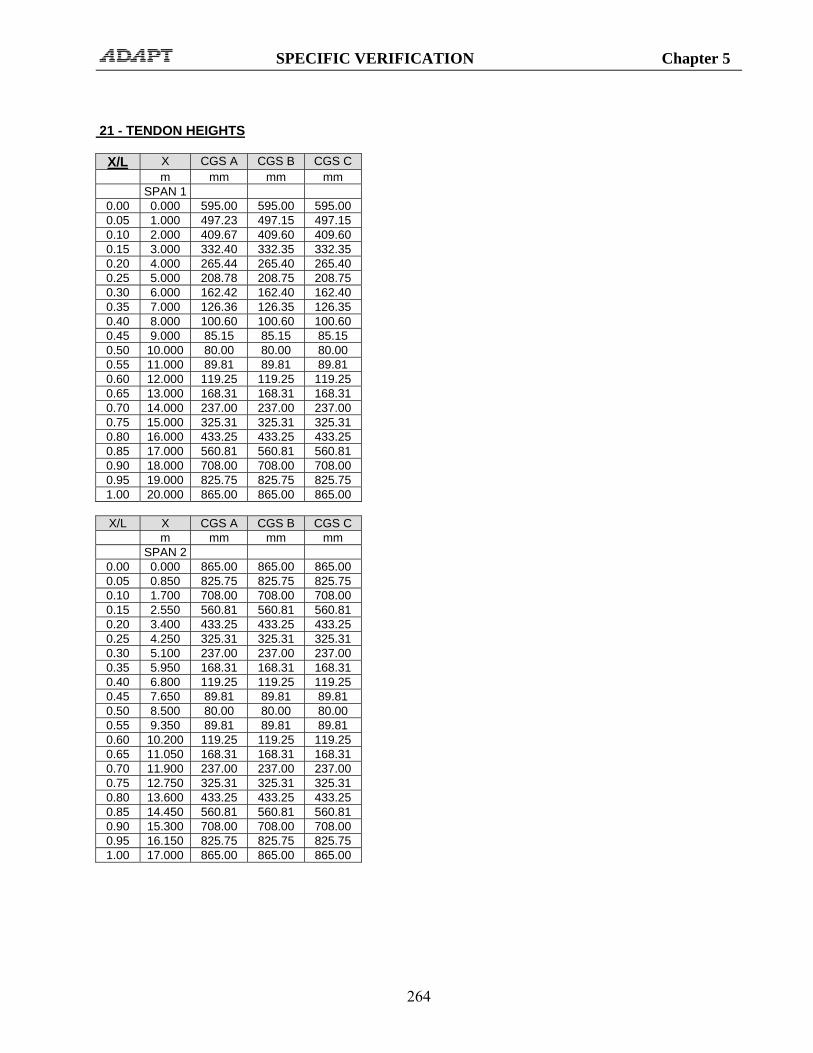
SPECIFIC VERIFICATION Chapter 5
264
21 - TENDON HEIGHTS
X/L X CGS A CGS B CGS C m mm mm mm SPAN 1
0.00 0.000 595.00 595.00 595.00 0.05 1.000 497.23 497.15 497.15 0.10 2.000 409.67 409.60 409.60 0.15 3.000 332.40 332.35 332.35 0.20 4.000 265.44 265.40 265.40 0.25 5.000 208.78 208.75 208.75 0.30 6.000 162.42 162.40 162.40 0.35 7.000 126.36 126.35 126.35 0.40 8.000 100.60 100.60 100.60 0.45 9.000 85.15 85.15 85.15 0.50 10.000 80.00 80.00 80.00 0.55 11.000 89.81 89.81 89.81 0.60 12.000 119.25 119.25 119.25 0.65 13.000 168.31 168.31 168.31 0.70 14.000 237.00 237.00 237.00 0.75 15.000 325.31 325.31 325.31 0.80 16.000 433.25 433.25 433.25 0.85 17.000 560.81 560.81 560.81 0.90 18.000 708.00 708.00 708.00 0.95 19.000 825.75 825.75 825.75 1.00 20.000 865.00 865.00 865.00
X/L X CGS A CGS B CGS C
m mm mm mm SPAN 2
0.00 0.000 865.00 865.00 865.00 0.05 0.850 825.75 825.75 825.75 0.10 1.700 708.00 708.00 708.00 0.15 2.550 560.81 560.81 560.81 0.20 3.400 433.25 433.25 433.25 0.25 4.250 325.31 325.31 325.31 0.30 5.100 237.00 237.00 237.00 0.35 5.950 168.31 168.31 168.31 0.40 6.800 119.25 119.25 119.25 0.45 7.650 89.81 89.81 89.81 0.50 8.500 80.00 80.00 80.00 0.55 9.350 89.81 89.81 89.81 0.60 10.200 119.25 119.25 119.25 0.65 11.050 168.31 168.31 168.31 0.70 11.900 237.00 237.00 237.00 0.75 12.750 325.31 325.31 325.31 0.80 13.600 433.25 433.25 433.25 0.85 14.450 560.81 560.81 560.81 0.90 15.300 708.00 708.00 708.00 0.95 16.150 825.75 825.75 825.75 1.00 17.000 865.00 865.00 865.00

SPECIFIC VERIFICATION Chapter 5
265
X/L X CGS A CGS B CGS C
m mm mm mm SPAN 3
0.00 0.000 865.00 865.00 865.00 0.05 0.250 859.25 859.25 859.25 0.10 0.500 842.00 842.00 842.00 0.15 0.750 820.44 820.44 820.44 0.20 1.000 801.75 801.75 801.75 0.25 1.250 785.94 785.94 785.94 0.30 1.500 773.00 773.00 773.00 0.35 1.750 762.94 762.94 762.94 0.40 2.000 755.75 755.75 755.75 0.45 2.250 751.44 751.44 751.44 0.50 2.500 750.00 750.00 750.00 0.55 2.750 748.45 748.45 748.45 0.60 3.000 743.80 743.80 743.80 0.65 3.250 736.05 736.05 736.05 0.70 3.500 725.20 725.20 725.20 0.75 3.750 711.25 711.25 711.25 0.80 4.000 694.20 694.20 694.20 0.85 4.250 674.05 674.05 674.05 0.90 4.500 650.80 650.80 650.80 0.95 4.750 624.45 624.45 624.45 1.00 5.000 595.00 595.00 595.00
23 - DETAILED MOMENTS SPAN 1
X/L X SW SDL XL LL Min LL Max PT Secondary m kN-m kN-m kN-m kN-m kN-m kN-m kN-m
0.00 0.00 0.00 -125.89 0.00 -35.97 -35.97 93.49 93.33 0.05 1.00 0.00 88.72 0.00 25.35 25.35 -53.80 108.33 0.10 2.00 0.00 275.33 0.00 78.67 78.67 -184.16 123.33 0.15 3.00 0.00 433.93 0.00 123.98 123.98 -297.43 138.33 0.20 4.00 0.00 564.54 0.00 161.30 161.30 -393.59 153.33 0.25 5.00 0.00 667.15 0.00 190.61 190.61 -472.65 168.33 0.30 6.00 0.00 741.76 0.00 211.93 211.93 -534.61 183.33 0.35 7.00 0.00 788.36 0.00 225.25 225.25 -579.46 198.33 0.40 8.00 0.00 806.97 0.00 230.56 230.56 -607.22 213.33 0.45 9.00 0.00 797.58 0.00 227.88 227.88 -617.87 228.33 0.50 10.00 0.00 760.18 0.00 217.20 217.20 -611.42 243.33 0.55 11.00 0.00 694.79 0.00 198.51 198.51 -580.14 258.33 0.60 12.00 0.00 601.40 0.00 171.83 171.83 -516.27 273.33 0.65 13.00 0.00 480.01 0.00 137.14 137.14 -419.83 288.33 0.70 14.00 0.00 330.61 0.00 94.46 94.46 -290.81 303.33 0.75 15.00 0.00 153.22 0.00 43.78 43.78 -129.22 318.33 0.80 16.00 0.00 -52.17 0.00 -14.91 -14.91 64.96 333.33 0.85 17.00 0.00 -285.57 0.00 -81.59 -81.59 291.71 348.33 0.90 18.00 0.00 -546.96 0.00 -156.27 -156.27 551.04 363.33 0.95 19.00 0.00 -836.35 0.00 -238.96 -238.96 761.50 378.33 1.00 20.00 0.00 -1153.70 0.00 -329.64 -329.64 841.66 393.33
SPAN 2
X/L X SW SDL XL LL Min LL Max PT Secondary m kN-m kN-m kN-m kN-m kN-m kN-m kN-m
0.00 0.00 0.00 -1014.80 0.00 -289.94 -289.94 759.47 311.15

SPECIFIC VERIFICATION Chapter 5
266
0.05 0.85 0.00 -792.94 0.00 -226.55 -226.55 697.34 297.74 0.10 1.70 0.00 -591.32 0.00 -168.95 -168.95 537.79 284.32 0.15 2.55 0.00 -409.93 0.00 -117.12 -117.12 326.19 270.91 0.20 3.40 0.00 -248.77 0.00 -71.08 -71.08 107.94 257.49 0.25 4.25 0.00 -107.84 0.00 -30.81 -30.81 -5.32 244.08 0.30 5.10 0.00 12.86 0.00 3.68 3.68 -100.42 230.67 0.35 5.95 0.00 113.34 0.00 32.38 32.38 -177.37 217.25 0.40 6.80 0.00 193.58 0.00 55.31 55.31 -236.16 203.84 0.45 7.65 0.00 253.59 0.00 72.45 72.45 -276.81 190.42 0.50 8.50 0.00 293.37 0.00 83.82 83.82 -299.30 177.01 0.55 9.35 0.00 312.92 0.00 89.41 89.41 -303.63 163.59 0.60 10.20 0.00 312.24 0.00 89.21 89.21 -289.82 150.18 0.65 11.05 0.00 291.33 0.00 83.24 83.24 -257.85 136.77 0.70 11.90 0.00 250.19 0.00 71.48 71.48 -207.73 123.35 0.75 12.75 0.00 188.83 0.00 53.95 53.95 -139.45 109.94 0.80 13.60 0.00 107.23 0.00 30.64 30.64 -53.02 96.52 0.85 14.45 0.00 5.40 0.00 1.54 1.54 51.56 83.11 0.90 15.30 0.00 -116.66 0.00 -33.33 -33.33 174.30 69.70 0.95 16.15 0.00 -258.95 0.00 -73.99 -73.99 269.80 56.28 1.00 17.00 0.00 -421.47 0.00 -120.42 -120.42 292.69 42.87
SPAN 3
X/L X SW SDL XL LL Min LL Max PT Secondary m kN-m kN-m kN-m kN-m kN-m kN-m kN-m
0.00 0.00 0.00 -368.38 0.00 -105.25 -105.25 244.52 -5.30 0.05 0.25 0.00 -333.13 0.00 -95.18 -95.18 239.13 -5.38 0.10 0.50 0.00 -299.63 0.00 -85.61 -85.61 223.09 -5.46 0.15 0.75 0.00 -267.87 0.00 -76.54 -76.54 203.07 -5.53 0.20 1.00 0.00 -237.87 0.00 -67.96 -67.96 185.71 -5.61 0.25 1.25 0.00 -209.62 0.00 -59.89 -59.89 171.01 -5.68 0.30 1.50 0.00 -183.11 0.00 -52.32 -52.32 158.96 -5.76 0.35 1.75 0.00 -158.36 0.00 -45.25 -45.25 149.58 -5.84 0.40 2.00 0.00 -135.36 0.00 -38.67 -38.67 142.86 -5.91 0.45 2.25 0.00 -114.10 0.00 -32.60 -32.60 138.79 -5.99 0.50 2.50 0.00 -94.60 0.00 -27.03 -27.03 137.38 -6.07 0.55 2.75 0.00 -76.85 0.00 -21.96 -21.96 135.87 -6.14 0.60 3.00 0.00 -60.85 0.00 -17.38 -17.38 131.50 -6.22 0.65 3.25 0.00 -46.59 0.00 -13.31 -13.31 124.25 -6.29 0.70 3.50 0.00 -34.09 0.00 -9.74 -9.74 114.14 -6.37 0.75 3.75 0.00 -23.33 0.00 -6.67 -6.67 101.16 -6.45 0.80 4.00 0.00 -14.33 0.00 -4.09 -4.09 85.31 -6.52 0.85 4.25 0.00 -7.08 0.00 -2.02 -2.02 66.60 -6.60 0.90 4.50 0.00 -1.57 0.00 -0.45 -0.45 45.01 -6.68 0.95 4.75 0.00 2.18 0.00 0.62 0.62 20.56 -6.75 1.00 5.00 0.00 4.18 0.00 1.19 1.19 -6.75 -6.83
24 - DETAILED SHEARS SPAN 1
X/L X SW SDL XL LL Min LL Max PT Secondary m kN kN kN kN kN kN kN
0.00 0.00 0.00 -228.61 0.00 0.00 -65.32 -14.99 -15.00 0.05 1.00 0.00 -200.61 0.00 0.00 -57.32 138.92 -15.00 0.10 2.00 0.00 -172.61 0.00 0.00 -49.32 121.82 -15.00 0.15 3.00 0.00 -144.61 0.00 0.00 -41.32 104.72 -15.00 0.20 4.00 0.00 -116.61 0.00 0.00 -33.32 87.62 -15.00 0.25 5.00 0.00 -88.61 0.00 0.00 -25.32 70.52 -15.00

SPECIFIC VERIFICATION Chapter 5
267
0.30 6.00 0.00 -60.61 0.00 0.00 -17.32 53.41 -15.00 0.35 7.00 0.00 -32.61 0.00 0.00 -9.32 36.31 -15.00 0.40 8.00 0.00 -4.61 0.00 0.00 -1.32 19.21 -15.00 0.45 9.00 0.00 23.39 0.00 6.68 0.00 2.11 -15.00 0.50 10.00 0.00 51.39 0.00 14.68 0.00 -14.99 -15.00 0.55 11.00 0.00 79.39 0.00 22.68 0.00 -47.57 -15.00 0.60 12.00 0.00 107.39 0.00 30.68 0.00 -80.15 -15.00 0.65 13.00 0.00 135.39 0.00 38.68 0.00 -112.72 -15.00 0.70 14.00 0.00 163.39 0.00 46.68 0.00 -145.30 -15.00 0.75 15.00 0.00 191.39 0.00 54.68 0.00 -177.88 -15.00 0.80 16.00 0.00 219.39 0.00 62.68 0.00 -210.46 -15.00 0.85 17.00 0.00 247.39 0.00 70.68 0.00 -243.03 -15.00 0.90 18.00 0.00 275.39 0.00 78.68 0.00 -275.61 -15.00 0.95 19.00 0.00 303.39 0.00 86.68 0.00 -145.30 -15.00 1.00 20.00 0.00 331.39 0.00 94.68 0.00 -14.99 -15.00
SPAN 2
X/L X SW SDL XL LL Min LL Max PT Secondary m kN kN kN kN kN kN kN
0.00 0.00 0.00 -272.90 0.00 0.00 -77.97 15.78 15.78 0.05 0.85 0.00 -249.10 0.00 0.00 -71.17 130.40 15.78 0.10 1.70 0.00 -225.30 0.00 0.00 -64.37 245.02 15.78 0.15 2.55 0.00 -201.50 0.00 0.00 -57.57 252.85 15.78 0.20 3.40 0.00 -177.70 0.00 0.00 -50.77 143.92 15.78 0.25 4.25 0.00 -153.90 0.00 0.00 -43.97 122.56 15.78 0.30 5.10 0.00 -130.10 0.00 0.00 -37.17 101.21 15.78 0.35 5.95 0.00 -106.30 0.00 0.00 -30.37 79.85 15.78 0.40 6.80 0.00 -82.50 0.00 0.00 -23.57 58.49 15.78 0.45 7.65 0.00 -58.70 0.00 0.00 -16.77 37.14 15.78 0.50 8.50 0.00 -34.90 0.00 0.00 -9.97 15.78 15.78 0.55 9.35 0.00 -11.10 0.00 0.00 -3.17 -5.58 15.78 0.60 10.20 0.00 12.70 0.00 3.63 0.00 -26.93 15.78 0.65 11.05 0.00 36.50 0.00 10.43 0.00 -48.29 15.78 0.70 11.90 0.00 60.30 0.00 17.23 0.00 -69.65 15.78 0.75 12.75 0.00 84.10 0.00 24.03 0.00 -91.00 15.78 0.80 13.60 0.00 107.90 0.00 30.83 0.00 -112.36 15.78 0.85 14.45 0.00 131.70 0.00 37.63 0.00 -133.72 15.78 0.90 15.30 0.00 155.50 0.00 44.43 0.00 -155.07 15.78 0.95 16.15 0.00 179.30 0.00 51.23 0.00 -69.65 15.78 1.00 17.00 0.00 203.10 0.00 58.03 0.00 15.78 15.78
SPAN 3
X/L X SW SDL XL LL Min LL Max PT Secondary m kN kN kN kN kN kN kN
0.00 0.00 0.00 -144.51 0.00 0.00 -41.29 0.29 0.31 0.05 0.25 0.00 -137.51 0.00 0.00 -39.29 42.84 0.31 0.10 0.50 0.00 -130.51 0.00 0.00 -37.29 85.39 0.31 0.15 0.75 0.00 -123.51 0.00 0.00 -35.29 74.75 0.31 0.20 1.00 0.00 -116.51 0.00 0.00 -33.29 64.12 0.31 0.25 1.25 0.00 -109.51 0.00 0.00 -31.29 53.48 0.31 0.30 1.50 0.00 -102.51 0.00 0.00 -29.29 42.84 0.31 0.35 1.75 0.00 -95.51 0.00 0.00 -27.29 32.20 0.31 0.40 2.00 0.00 -88.51 0.00 0.00 -25.29 21.57 0.31 0.45 2.25 0.00 -81.51 0.00 0.00 -23.29 10.93 0.31 0.50 2.50 0.00 -74.51 0.00 0.00 -21.29 0.29 0.31 0.55 2.75 0.00 -67.51 0.00 0.00 -19.29 11.76 0.31 0.60 3.00 0.00 -60.51 0.00 0.00 -17.29 23.23 0.31 0.65 3.25 0.00 -53.51 0.00 0.00 -15.29 34.70 0.31

SPECIFIC VERIFICATION Chapter 5
268
0.70 3.50 0.00 -46.51 0.00 0.00 -13.29 46.17 0.31 0.75 3.75 0.00 -39.51 0.00 0.00 -11.29 57.64 0.31 0.80 4.00 0.00 -32.51 0.00 0.00 -9.29 69.11 0.31 0.85 4.25 0.00 -25.51 0.00 0.00 -7.29 80.58 0.31 0.90 4.50 0.00 -18.51 0.00 0.00 -5.29 92.05 0.31 0.95 4.75 0.00 -11.51 0.00 0.00 -3.29 103.52 0.31 1.00 5.00 0.00 -4.51 0.00 0.00 -1.29 114.99 0.31
27 - DETAILED STRESSES SPAN 1
X/L X SW Top
SW Bot
SDL Top
SDL Bot
XL Top
XL Bot
LL Top Max-T
LL Top Max-C
LL Bot Max-T
LL Bot Max-C
PT Top
PT Bot
m MPa MPa MPa MPa MPa MPa MPa MPa MPa MPa MPa MPa 0.00 0.00 0.05 1.00 0.00 0.00 -0.52 1.02 0.00 0.00 -0.15 -0.15 0.29 0.29 -2.20 -3.14 0.10 2.00 0.00 0.00 -1.63 3.17 0.00 0.00 -0.46 -0.46 0.91 0.91 -1.43 -4.64 0.15 3.00 0.00 0.00 -2.56 5.00 0.00 0.00 -0.73 -0.73 1.43 1.43 -0.76 -5.95 0.20 4.00 0.00 0.00 -3.34 6.50 0.00 0.00 -0.95 -0.95 1.86 1.86 -0.19 -7.05 0.25 5.00 0.00 0.00 -3.94 7.69 0.00 0.00 -1.13 -1.13 2.20 2.20 0.27 -7.97 0.30 6.00 0.00 0.00 -4.38 8.55 0.00 0.00 -1.25 -1.25 2.44 2.44 0.64 -8.68 0.35 7.00 0.00 0.00 -4.66 9.08 0.00 0.00 -1.33 -1.33 2.60 2.60 0.90 -9.20 0.40 8.00 0.00 0.00 -4.77 9.30 0.00 0.00 -1.36 -1.36 2.66 2.66 1.07 -9.52 0.45 9.00 0.00 0.00 -4.71 9.19 0.00 0.00 -1.35 -1.35 2.63 2.63 1.13 -9.64 0.50 10.00 0.00 0.00 -4.49 8.76 0.00 0.00 -1.28 -1.28 2.50 2.50 1.09 -9.56 0.55 11.00 0.00 0.00 -4.10 8.00 0.00 0.00 -1.17 -1.17 2.29 2.29 0.91 -9.20 0.60 12.00 0.00 0.00 -3.55 6.93 0.00 0.00 -1.02 -1.02 1.98 1.98 0.53 -8.47 0.65 13.00 0.00 0.00 -2.84 5.53 0.00 0.00 -0.81 -0.81 1.58 1.58 -0.04 -7.36 0.70 14.00 0.00 0.00 -1.95 3.81 0.00 0.00 -0.56 -0.56 1.09 1.09 -0.80 -5.87 0.75 15.00 0.00 0.00 -0.91 1.77 0.00 0.00 -0.26 -0.26 0.50 0.50 -1.76 -4.01 0.80 16.00 0.00 0.00 0.31 -0.60 0.00 0.00 0.09 0.09 -0.17 -0.17 -2.90 -1.77 0.85 17.00 0.00 0.00 1.69 -3.29 0.00 0.00 0.48 0.48 -0.94 -0.94 -4.24 0.84 0.90 18.00 0.00 0.00 3.23 -6.30 0.00 0.00 0.92 0.92 -1.80 -1.80 -5.78 3.83 0.95 19.00 0.00 0.00 4.94 -9.64 0.00 0.00 1.41 1.41 -2.75 -2.75 -7.02 6.25 1.00 20.00
X/L X Env-1
Top Max-T
Env-1 Top
Max-C
Env-1 Bot
Max-T
Env-1 Bot
Max-C m MPa MPa MPa MPa
0.00 0.00 0.05 1.00 ----- -2.88 ----- -1.83 0.10 2.00 ----- -3.52 ----- -0.56 0.15 3.00 ----- -4.06 0.48 ----- 0.20 4.00 ----- -4.48 1.31 ----- 0.25 5.00 ----- -4.80 1.92 ----- 0.30 6.00 ----- -5.00 2.31 ----- 0.35 7.00 ----- -5.08 2.48 ----- 0.40 8.00 ----- -5.06 2.44 ----- 0.45 9.00 ----- -4.93 2.18 ----- 0.50 10.00 ----- -4.68 1.70 ----- 0.55 11.00 ----- -4.37 1.09 ----- 0.60 12.00 ----- -4.04 0.44 ----- 0.65 13.00 ----- -3.69 ----- -0.25 0.70 14.00 ----- -3.31 ----- -0.97 0.75 15.00 ----- -2.92 ----- -1.74 0.80 16.00 ----- -2.51 ----- -2.54

SPECIFIC VERIFICATION Chapter 5
269
0.85 17.00 ----- -2.07 ----- -3.39 0.90 18.00 ----- -1.62 ----- -4.27 0.95 19.00 ----- -0.67 ----- -6.14 1.00 20.00
SPAN 2
X/L X SW Top
SW Bot
SDL Top
SDL Bot
XL Top
XL Bot
LL Top Max-T
LL Top Max-C
LL Bot Max-T
LL Bot Max-C
PT Top
PT Bot
m MPa MPa MPa MPa MPa MPa MPa MPa MPa MPa MPa MPa 0.00 0.00 0.05 0.85 0.00 0.00 4.68 -9.14 0.00 0.00 1.34 1.34 -2.61 -2.61 -6.64 5.51 0.10 1.70 0.00 0.00 3.49 -6.81 0.00 0.00 1.00 1.00 -1.95 -1.95 -5.70 3.68 0.15 2.55 0.00 0.00 2.42 -4.72 0.00 0.00 0.69 0.69 -1.35 -1.35 -4.45 1.24 0.20 3.40 0.00 0.00 1.47 -2.87 0.00 0.00 0.42 0.42 -0.82 -0.82 -3.16 -1.28 0.25 4.25 0.00 0.00 0.64 -1.24 0.00 0.00 0.18 0.18 -0.35 -0.35 -1.37 -1.47 0.30 5.10 0.00 0.00 -0.08 0.15 0.00 0.00 -0.02 -0.02 0.04 0.04 -0.81 -2.56 0.35 5.95 0.00 0.00 -0.67 1.31 0.00 0.00 -0.19 -0.19 0.37 0.37 -0.36 -3.45 0.40 6.80 0.00 0.00 -1.14 2.23 0.00 0.00 -0.33 -0.33 0.64 0.64 -0.01 -4.12 0.45 7.65 0.00 0.00 -1.50 2.92 0.00 0.00 -0.43 -0.43 0.83 0.83 0.23 -4.59 0.50 8.50 0.00 0.00 -1.73 3.38 0.00 0.00 -0.50 -0.50 0.97 0.97 0.36 -4.85 0.55 9.35 0.00 0.00 -1.85 3.61 0.00 0.00 -0.53 -0.53 1.03 1.03 0.39 -4.90 0.60 10.20 0.00 0.00 -1.84 3.60 0.00 0.00 -0.53 -0.53 1.03 1.03 0.31 -4.74 0.65 11.05 0.00 0.00 -1.72 3.36 0.00 0.00 -0.49 -0.49 0.96 0.96 0.12 -4.37 0.70 11.90 0.00 0.00 -1.48 2.88 0.00 0.00 -0.42 -0.42 0.82 0.82 -0.18 -3.80 0.75 12.75 0.00 0.00 -1.12 2.18 0.00 0.00 -0.32 -0.32 0.62 0.62 -0.58 -3.01 0.80 13.60 0.00 0.00 -0.63 1.24 0.00 0.00 -0.18 -0.18 0.35 0.35 -1.09 -2.01 0.85 14.45 0.00 0.00 -0.03 0.06 0.00 0.00 -0.01 -0.01 0.02 0.02 -1.71 -0.81 0.90 15.30 0.00 0.00 0.69 -1.34 0.00 0.00 0.20 0.20 -0.38 -0.38 -2.43 0.60 0.95 16.15 0.00 0.00 1.53 -2.98 0.00 0.00 0.44 0.44 -0.85 -0.85 -3.00 1.70 1.00 17.00
X/L X Env-1
Top Max-T
Env-1 Top
Max-C
Env-1 Bot
Max-T
Env-1 Bot
Max-C m MPa MPa MPa MPa
0.00 0.00 0.05 0.85 ----- -0.62 ----- -6.23 0.10 1.70 ----- -1.21 ----- -5.08 0.15 2.55 ----- -1.33 ----- -4.83 0.20 3.40 ----- -1.27 ----- -4.96 0.25 4.25 ----- -0.55 ----- -3.06 0.30 5.10 ----- -0.91 ----- -2.37 0.35 5.95 ----- -1.22 ----- -1.77 0.40 6.80 ----- -1.48 ----- -1.26 0.45 7.65 ----- -1.69 ----- -0.84 0.50 8.50 ----- -1.86 ----- -0.51 0.55 9.35 ----- -1.99 ----- -0.27 0.60 10.20 ----- -2.06 ----- -0.12 0.65 11.05 ----- -2.09 ----- -0.06 0.70 11.90 ----- -2.08 ----- -0.09 0.75 12.75 ----- -2.01 ----- -0.21 0.80 13.60 ----- -1.91 ----- -0.43 0.85 14.45 ----- -1.75 ----- -0.73 0.90 15.30 ----- -1.55 ----- -1.12 0.95 16.15 ----- -1.03 ----- -2.13 1.00 17.00
SPAN 3
X/L X SW SW SDL SDL XL XL LL Top LL Top LL Bot LL Bot PT PT

SPECIFIC VERIFICATION Chapter 5
270
Top Bot Top Bot Top Bot Max-T Max-C Max-T Max-C Top Bot m MPa MPa MPa MPa MPa MPa MPa MPa MPa MPa MPa MPa
0.00 0.00 0.05 0.25 0.00 0.00 1.97 -3.84 0.00 0.00 0.56 0.56 -1.10 -1.10 -2.82 1.35 0.10 0.50 0.00 0.00 1.77 -3.45 0.00 0.00 0.51 0.51 -0.99 -0.99 -2.72 1.17 0.15 0.75 0.00 0.00 1.58 -3.09 0.00 0.00 0.45 0.45 -0.88 -0.88 -2.60 0.94 0.20 1.00 0.00 0.00 1.41 -2.74 0.00 0.00 0.40 0.40 -0.78 -0.78 -2.50 0.74 0.25 1.25 0.00 0.00 1.24 -2.42 0.00 0.00 0.35 0.35 -0.69 -0.69 -2.41 0.57 0.30 1.50 0.00 0.00 1.08 -2.11 0.00 0.00 0.31 0.31 -0.60 -0.60 -2.34 0.43 0.35 1.75 0.00 0.00 0.94 -1.82 0.00 0.00 0.27 0.27 -0.52 -0.52 -2.29 0.32 0.40 2.00 0.00 0.00 0.80 -1.56 0.00 0.00 0.23 0.23 -0.45 -0.45 -2.25 0.24 0.45 2.25 0.00 0.00 0.67 -1.31 0.00 0.00 0.19 0.19 -0.38 -0.38 -2.22 0.19 0.50 2.50 0.00 0.00 0.56 -1.09 0.00 0.00 0.16 0.16 -0.31 -0.31 -2.22 0.18 0.55 2.75 0.00 0.00 0.45 -0.89 0.00 0.00 0.13 0.13 -0.25 -0.25 -2.21 0.16 0.60 3.00 0.00 0.00 0.36 -0.70 0.00 0.00 0.10 0.10 -0.20 -0.20 -2.18 0.11 0.65 3.25 0.00 0.00 0.28 -0.54 0.00 0.00 0.08 0.08 -0.15 -0.15 -2.14 0.03 0.70 3.50 0.00 0.00 0.20 -0.39 0.00 0.00 0.06 0.06 -0.11 -0.11 -2.08 -0.09 0.75 3.75 0.00 0.00 0.14 -0.27 0.00 0.00 0.04 0.04 -0.08 -0.08 -2.00 -0.24 0.80 4.00 0.00 0.00 0.08 -0.17 0.00 0.00 0.02 0.02 -0.05 -0.05 -1.91 -0.42 0.85 4.25 0.00 0.00 0.04 -0.08 0.00 0.00 0.01 0.01 -0.02 -0.02 -1.80 -0.64 0.90 4.50 0.00 0.00 0.01 -0.02 0.00 0.00 0.00 0.00 -0.01 -0.01 -1.67 -0.89 0.95 4.75 0.00 0.00 -0.01 0.03 0.00 0.00 0.00 0.00 0.01 0.01 -1.53 -1.17 1.00 5.00
X/L X Env-1
Top Max-T
Env-1 Top
Max-C
Env-1 Bot
Max-T
Env-1 Bot
Max-C m MPa MPa MPa MPa
0.00 0.00 0.05 0.25 ----- -0.29 ----- -3.58 0.10 0.50 ----- -0.45 ----- -3.27 0.15 0.75 ----- -0.57 ----- -3.03 0.20 1.00 ----- -0.69 ----- -2.79 0.25 1.25 ----- -0.82 ----- -2.54 0.30 1.50 ----- -0.95 ----- -2.29 0.35 1.75 ----- -1.08 ----- -2.03 0.40 2.00 ----- -1.22 ----- -1.76 0.45 2.25 ----- -1.36 ----- -1.50 0.50 2.50 ----- -1.50 ----- -1.22 0.55 2.75 ----- -1.62 ----- -0.98 0.60 3.00 ----- -1.72 ----- -0.79 0.65 3.25 ----- -1.78 ----- -0.66 0.70 3.50 ----- -1.82 ----- -0.59 0.75 3.75 ----- -1.82 ----- -0.58 0.80 4.00 ----- -1.80 ----- -0.63 0.85 4.25 ----- -1.74 ----- -0.74 0.90 4.50 ----- -1.66 ----- -0.91 0.95 4.75 ----- -1.54 ----- -1.13 1.00 5.00
29 - DETAILED REBAR SPAN 1
X/L X Analysis Top
Analysis Bot
Minimum Top
Minimum Bot
Selected Top
Selected Bot
m mm2 mm2 mm2 mm2 mm2 mm2 0.00 0.00 0.00 0.00 1493.00 0.00 1493.00 0.00

SPECIFIC VERIFICATION Chapter 5
271
0.05 1.00 0.00 0.00 1493.00 0.00 1493.00 0.00 0.10 2.00 0.00 0.00 1493.00 0.00 1493.00 0.00 0.15 3.00 0.00 0.00 1493.00 0.00 1493.00 0.00 0.20 4.00 0.00 0.00 0.00 0.00 0.00 0.00 0.25 5.00 0.00 368.80 0.00 0.00 0.00 368.80 0.30 6.00 0.00 559.50 0.00 0.00 0.00 559.50 0.35 7.00 0.00 685.50 0.00 1085.00 0.00 1085.00 0.40 8.00 0.00 685.50 0.00 1085.00 0.00 1085.00 0.45 9.00 0.00 559.50 0.00 1085.00 0.00 1085.00 0.50 10.00 0.00 368.80 0.00 1085.00 0.00 1085.00 0.55 11.00 0.00 0.00 0.00 1085.00 0.00 1085.00 0.60 12.00 0.00 0.00 0.00 1085.00 0.00 1085.00 0.65 13.00 0.00 0.00 0.00 1085.00 0.00 1085.00 0.70 14.00 0.00 0.00 0.00 0.00 0.00 0.00 0.75 15.00 0.00 0.00 0.00 0.00 0.00 0.00 0.80 16.00 0.00 0.00 0.00 0.00 0.00 0.00 0.85 17.00 0.00 0.00 1493.00 0.00 1493.00 0.00 0.90 18.00 0.00 0.00 1493.00 0.00 1493.00 0.00 0.95 19.00 0.00 0.00 1493.00 0.00 1493.00 0.00 1.00 20.00 847.50 0.00 1493.00 0.00 1493.00 0.00
SPAN 2
X/L X Analysis Top
Analysis Bot
Minimum Top
Minimum Bot
Selected Top
Selected Bot
m mm2 mm2 mm2 mm2 mm2 mm2 0.00 0.00 222.00 0.00 1493.00 0.00 1493.00 0.00 0.05 0.85 0.00 0.00 1493.00 0.00 1493.00 0.00 0.10 1.70 0.00 0.00 1493.00 0.00 1493.00 0.00 0.15 2.55 0.00 0.00 1493.00 0.00 1493.00 0.00 0.20 3.40 0.00 0.00 0.00 0.00 0.00 0.00 0.25 4.25 0.00 0.00 0.00 0.00 0.00 0.00 0.30 5.10 0.00 0.00 0.00 0.00 0.00 0.00 0.35 5.95 0.00 0.00 1493.00 0.00 1493.00 0.00 0.40 6.80 0.00 0.00 0.00 1085.00 0.00 1085.00 0.45 7.65 0.00 0.00 0.00 1085.00 0.00 1085.00 0.50 8.50 0.00 0.00 0.00 1085.00 0.00 1085.00 0.55 9.35 0.00 0.00 0.00 1085.00 0.00 1085.00 0.60 10.20 0.00 0.00 0.00 1085.00 0.00 1085.00 0.65 11.05 0.00 0.00 0.00 1085.00 0.00 1085.00 0.70 11.90 0.00 0.00 0.00 0.00 0.00 0.00 0.75 12.75 0.00 0.00 0.00 0.00 0.00 0.00 0.80 13.60 0.00 0.00 0.00 0.00 0.00 0.00 0.85 14.45 0.00 0.00 1493.00 0.00 1493.00 0.00 0.90 15.30 0.00 0.00 1493.00 0.00 1493.00 0.00 0.95 16.15 0.00 0.00 1493.00 0.00 1493.00 0.00 1.00 17.00 0.00 0.00 1493.00 0.00 1493.00 0.00
SPAN 3
X/L X Analysis Top
Analysis Bot
Minimum Top
Minimum Bot
Selected Top
Selected Bot
m mm2 mm2 mm2 mm2 mm2 mm2 0.00 0.00 0.00 0.00 1073.00 0.00 1073.00 0.00 0.05 0.25 0.00 0.00 1073.00 0.00 1073.00 0.00 0.10 0.50 0.00 0.00 1073.00 0.00 1073.00 0.00 0.15 0.75 0.00 0.00 1073.00 0.00 1073.00 0.00 0.20 1.00 0.00 0.00 0.00 0.00 0.00 0.00 0.25 1.25 0.00 0.00 0.00 0.00 0.00 0.00 0.30 1.50 0.00 0.00 0.00 0.00 0.00 0.00 0.35 1.75 0.00 0.00 1073.00 0.00 1073.00 0.00

SPECIFIC VERIFICATION Chapter 5
272
0.40 2.00 0.00 0.00 1073.00 0.00 1073.00 0.00 0.45 2.25 0.00 0.00 1073.00 0.00 1073.00 0.00 0.50 2.50 0.00 0.00 0.00 961.70 0.00 961.70 0.55 2.75 0.00 0.00 0.00 961.70 0.00 961.70 0.60 3.00 0.00 0.00 0.00 961.70 0.00 961.70 0.65 3.25 0.00 0.00 0.00 961.70 0.00 961.70 0.70 3.50 0.00 0.00 0.00 0.00 0.00 0.00 0.75 3.75 0.00 0.00 0.00 0.00 0.00 0.00 0.80 4.00 0.00 0.00 0.00 0.00 0.00 0.00 0.85 4.25 0.00 0.00 1073.00 0.00 1073.00 0.00 0.90 4.50 0.00 0.00 1073.00 0.00 1073.00 0.00 0.95 4.75 0.00 0.00 1073.00 0.00 1073.00 0.00 1.00 5.00 0.00 0.00 1073.00 0.00 1073.00 0.00
Legend (2.1): Span C = Cantilever Form 1 = Rectangular, 2 = T or Inverted L, 3 = I, 4 = Extended T or L section Rh Elevation of top surface TF Top flange MF Middle flange BF Bottom flange Legend (2.7): The Column Boundary Condition (CBC): Fixed at both 1 Hinged at near end, fixed at far end 2 Fixed at near end, hinged at far end 3 Fixed at near end, roller with rotational fixity at far end 4 LC Lower Column UC Upper Column Legend (3.1): Class: SW: Selfweight, LL: Live Load, SDL: Superimposed Dead Load, X: Other Loading Type: U: Uniform, P: Partial Uniform, L: Line Load, M: Applied Moment C: Concentrated Load, R: Triangle, V: Variable, T: Trapezoidal Legend (4.1, 4.2): Yb: distance from centroid to bottom fiber Yt: distance from centroid to top fiber I: gross moment of inertia Legend (7.1): Type 1 = reversed parabola 2 = simple parabola with straight portion over support 3 = harped tendon 4 = straight tendon 5 = extended reversed parabola Legend (7.2): CGS C1: CGS of left middle point of tendon for type 5 profile CGS C2: CGS of right middle point of tendon for type 5 profile or middle point of other types Legend (10.1, 11.1): From: Beginning of rebar measured from left support of the span To: End of rebar measured from left support of the span As Required: Envelope of minimum and ultimate rebar Ultimate: Required rebar for ultimate load combinations Minimum: Required minimum rebar

SPECIFIC VERIFICATION Chapter 5
273
Legend (12): d: Effective depth of section for shear rebar calculation Vu: Ultimate shear Ratio: ratio of ultimate to allowable shear stress Req.: Required shear reinforcement per unit length Spacing: Spacing between shear rebar

274

275
APPENDIX

276

APPENDIX
277
1. NOTATION a = Depth of compression zone Ac = area of concrete resisting shear Amin = code required minimum area of non-prestressed reinforcement Aps = cross-sectional area of tendon at the location of shear check As = area of nonprestressed tensile reinforcement As' = area of nonprestressed compressive reinforcement Asv = area of links (in2/ft or mm2/m) Av = area of stirrups b = width of section (stem in the case of T-sections) bo = perimeter of critical section bv = width of section (stem width for T-sections) C = torsional constant of section dp = distance of centroid of post-tensioning to extreme compression fiber dr = distance of compression fiber to centroid of nonprestressed reinforcement (but not less
than 0.8 times total depth of section when checking shear) e = eccentricity of post-tensioning/prestressing with respect to the centroidal axis of the
section (positive if CGS is above the neutral axis) E = modulus of elasticity fbot = stress at bottom fcp = design compressive stress at centroid due to prestressing fcu = cube strength at 28 days f'c = 28 day compressive strength of concrete fpbot = stresses due to prestressing only, at bottom fiber fpe = stress in prestressing steel fpea = PTF/(Aps + (fy/fpu)*As) fps = stress in tendon of limited state fptop = stresses due to prestressing only, at top fiber fpu = tendon's ultimate strength fse = effective stress in tendon after all losses ft = maximum design principal tensile stress, 0.24*(fcu)1/2 ftop = stress at top fy = yield strength of stirrups fy = yield stress of reinforcement

APPENDIX
278
fyv = yield stress of link (stirrup) reinforcement FEM = Fixed-End Moment h = member thickness (height of section) I = gross moment of inertia Jc = a parameter similar to the moment of inertia of the critical surface, defined in ACI-318
(Chapter 11) Commentary [2] Kc = column stiffness Kec = equivalent column stiffness Kt = stiffness of torsional member L = span length M = 1.2*Md + 1.6*Ml + Msec Mbal = balanced moment due to balanced loading Md = dead load moment Ml = live load moment Mn = nominal moment of a section Mo = static moment of span = moment reduce to zero precompression in extreme fiber (decompression moment) Msec = secondary moment Mu = factored moment Nc = force of tensile block PT = post-tensioning force PTF = prestressing force sv = spacing of links S = section modulus Sb = bottom section modulii St = top section modulii T = tension force Tp = tension due to post-tensioning Ts = tension due to nonprestressed rebar Tu = total tension v = factored shear stress

APPENDIX
279
va = allowable shear stress vc = design concrete shear stress vca = Vc/b*h vco = design concrete shear resistance of uncracked sections vcr = resisting design concrete shear stress for cracked sections vu = factored maximum shear stress V = factored applied shear force Vc = shear resistance of concrete Vd = factored shear force due to dead load Vl = factored shear force due to live load Vsec = factored shear force due to secondary load Vu = factored column reaction; factored shear force w = load intensity Wbal = balanced loading Wu = factored loading Yb = distance of centroidal axis to bottom fiber Yt = distance of centroidal axis to top fiber β1 = 0.85 for 4000 psi concrete, otherwise as defined in ACI-318(10) γm = material constant stipulated as 1.25 φ = strength reduction factor ρ = ratio of nonprestressed tensile reinforcement (see ACI-318(8)) ρ' = ratio of nonprestressed compression reinforcement (see ACI-318(8)) ρbal = reinforcement ratio producing balanced strain condition (see ACI-318(8)) ρp = ratio of prestressed reinforcement ω = index of nonprestressed tensile reinforcement (see ACI-318(18)) ω' = index of nonprestressed compressive reinforcement (see ACI-318(18)) ωp = index of prestressing reinforcement as defined in ACI-318(18)

APPENDIX
280
This Page Left Intentionally
BLANK