Embed Size (px)
Citation preview

PT Wijaya Karya Bangunan Gedung Tbk.
Wonderful Company at a Wonderful Price
BUY (TP: IDR 450)
WIKA’s building construction arm. PT Wijaya Karya Bangunan
Gedung Tbk. (WEGE) specializes in building construction focusing in
high-rise projects. Historically, the company was focused on capturing
the private market, however, in 2016 it was merged with WIKA’s
Building Construction Division (DBG), which opened up new project
sources which are the government and state owned enterprise (SOE).
With the new contract sources, WEGE has been able to generate
exponentially greater new contract growth and shield their order book
growth from economic downturns especially during a hawkish interest
rate environment that affects the private sector. We forecast new
contracts acquired to be at IDR7,437bn/IDR10,186bn in FY18E/FY19F
(95%/85% of company’s target and implying 1%/37% YoY growth).
Backward and forward synergies to boost new contract growth
and financial performance. WEGE has been striving to improve
efficiency and performance by acquiring or investing in a geotechnical,
precast, and modular business to further expand its services. Company
has also been expanding into running concessions in various businesses
such as the hotel and office space business to increase recurring
income. The company benefits as these concession businesses will
require construction work that can be done by WEGE, providing extra
synergy and driving new contract growth. Consequently, revenue/net
profit is set to rise by 16.2%/13.9% YoY in FY19F.
Positive operating cash flow, no turnkey projects, and free of
debt. WEGE has zero leverage as of 9M18 as the company’s balance
sheet is healthy on the back of timely project payments and no
exposure to turnkey based projects. These translate to positive
operating cash flow, which is highly valuable and a sought after metric
in the construction sector. WEGE’s robust balance sheet and cash flow
is in contrast with the rest of the sector, which has been punished due
to negative operating cash flow and high DER levels.
Undemanding valuation despite excellent fundamentals. We
initiate WEGE with a BUY call and TP of IDR450, implying 53.1%
upside. WEGE currently trades at 6.0x FY19F PE, implying a 36%
discount to its parent which is trading at 9.2x FY19F PE. The company’s
fundamentals and its valuation is mismatched when analyzed based on
the main metrics that investors evaluate a construction company (burn
rate, new contract growth, operating cash flow).
Risks to our call: 1) Lower new contract achievement than forecast,
2) slower burn rate, 3) execution and project payment delays.
Highlights (IDR Bn) 2017 2018E 2019F 2020F 2021F
Revenue 3,899 6,004 6,974 8,515 9,095
% growth 102.1% 54.0% 16.2% 22.1% 6.8%
Gross Profit 464 665 761 963 1,022
Net Profit 295 415 472 576 592
% growth 105.9% 40.6% 13.9% 22.0% 2.7%
Gross Margin (%) 11.9% 11.1% 10.9% 11.3% 11.2%
Net Margin (%) 7.6% 6.9% 6.8% 6.8% 6.5%
Return on Equity (%) 25.2% 22.5% 21.9% 22.9% 20.2%
Return on Assets (%) 8.9% 7.9% 7.3% 7.6% 6.8%
EPS (IDR) 49 43 49 60 62
Stock Information
Sector Construction
Bloomberg Ticker WEGE IJ
Market Cap. (IDR tn) 2.81
Share Out./Float (mn) 9,572/2,939
Current Price 294
52-week Target Price IDR 450
Upside (%) 53.1%
Share Price Performance
52W High (08/27/18) 302
52W Low (02/08/18) 190
52W Beta 1.0
YTD Change (%) 22.5%
Relative Valuations
Trailing P/E 6.0x
Forward P/E 6.0x
P/BV 1.2x
EV/EBITDA 4.2x
Anthony Angkawijaya Equity Analyst +62 21 392 5550 ext. 611 [email protected]
29 January 2019
2 Coal Mining Sector | 23 January 2018
Renewal package over starterpack. We believe the new competition landscape would be focusing more on renewal package/reload package as
operators would likely to focus more on expansion and quality improvement since the focus would not be in acquisition anymore. Based on the information from investor relation of TLKM, currently government is work-ing on a new regulation to set guid-ance on tariff gap between start-erpacks and reload packages with price of reload packages must be lower than starter packs to encourage sus-tainable customer shift to reload/renewal packages. Doing so would help prevent the industry from return-ing to starterpack-heavy sales model lead to a lower churn rates and achieve the efficiency objectives as set by the existing prepaid SIM card regis-
tration policy. Potential surge in data pricing on
welcoming festive season. After the
64%16%
20%
2017
Revenue Share(%)
Telkomsel
XL Axiata
Indosat Ooredoo 66%
17%
17%
1Q18
Revenue Share(%)
Telkomsel
XL Axiata
Indosat Ooredoo
69,830
85,398
103,294
129,044
160,724 167,617
44,946 52,012
58,879
84,484
101,094 105,792
24,280
40,304
50,687 56,483
61,357 64,375
2013 2014 2015 2016 2017 1Q18
BTS on air
TLKM EXCL ISAT
Source:
2 Houseware - WOOD | 19 September 2018
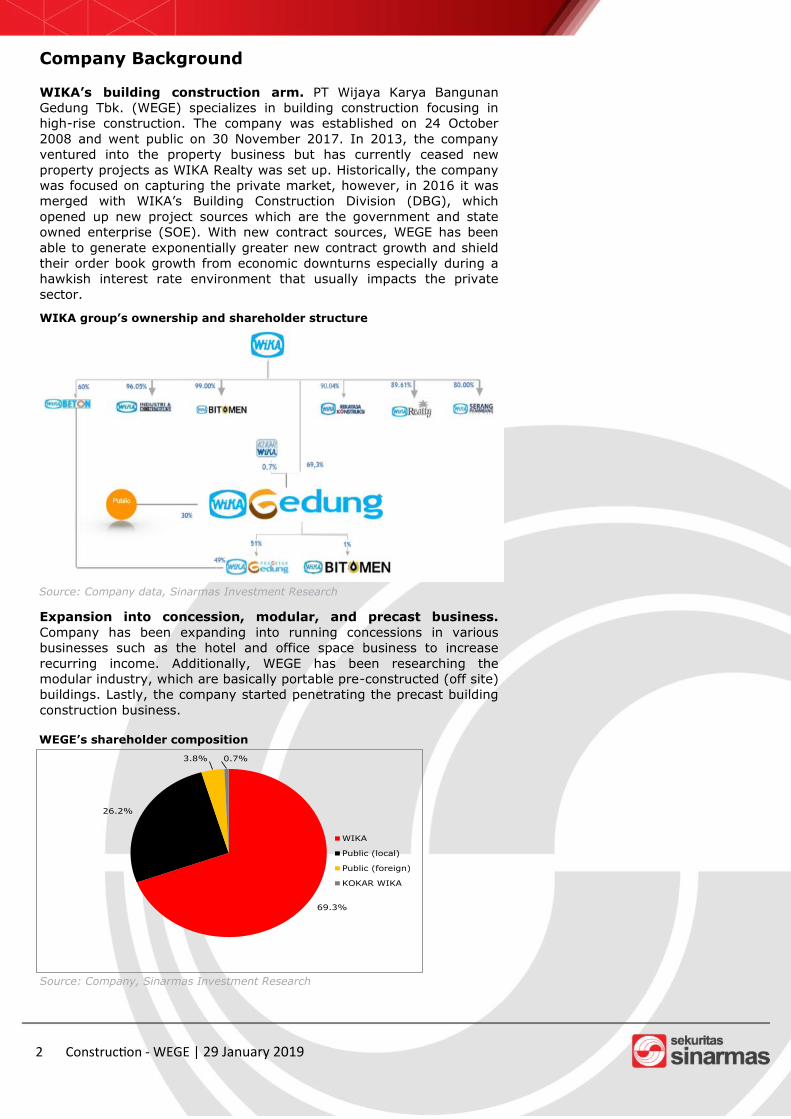
Company Background
WIKA’s building construction arm. PT Wijaya Karya Bangunan
Gedung Tbk. (WEGE) specializes in building construction focusing in
high-rise construction. The company was established on 24 October
2008 and went public on 30 November 2017. In 2013, the company
ventured into the property business but has currently ceased new
property projects as WIKA Realty was set up. Historically, the company
was focused on capturing the private market, however, in 2016 it was
merged with WIKA’s Building Construction Division (DBG), which
opened up new project sources which are the government and state
owned enterprise (SOE). With new contract sources, WEGE has been
able to generate exponentially greater new contract growth and shield
their order book growth from economic downturns especially during a
hawkish interest rate environment that usually impacts the private
sector.
Expansion into concession, modular, and precast business.
Company has been expanding into running concessions in various
businesses such as the hotel and office space business to increase
recurring income. Additionally, WEGE has been researching the
modular industry, which are basically portable pre-constructed (off site)
buildings. Lastly, the company started penetrating the precast building
construction business.
2 Construction - WEGE | 29 January 2019
WIKA group’s ownership and shareholder structure
Source: Company data, Sinarmas Investment Research
WEGE’s shareholder composition
Source: Company, Sinarmas Investment Research
69.3%
26.2%
3.8% 0.7%
WIKA
Public (local)
Public (foreign)
KOKAR WIKA
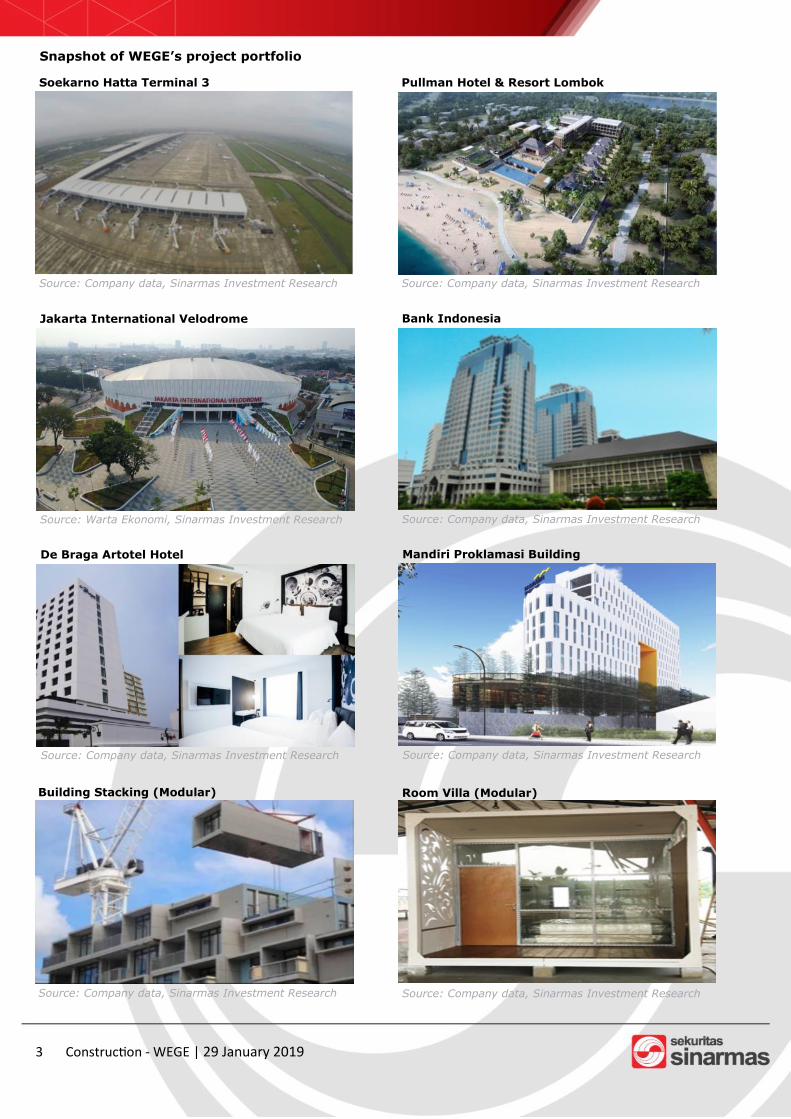
Snapshot of WEGE’s project portfolio
Soekarno Hatta Terminal 3
Source: Company data, Sinarmas Investment Research
Pullman Hotel & Resort Lombok
Source: Company data, Sinarmas Investment Research
Jakarta International Velodrome
Source: Warta Ekonomi, Sinarmas Investment Research
Bank Indonesia
Source: Company data, Sinarmas Investment Research
De Braga Artotel Hotel
Source: Company data, Sinarmas Investment Research
Mandiri Proklamasi Building
Source: Company data, Sinarmas Investment Research
Building Stacking (Modular)
Source: Company data, Sinarmas Investment Research
Room Villa (Modular)
Source: Company data, Sinarmas Investment Research
3 Construction - WEGE | 29 January 2019

4 Coal Mining Sector | 23 January 2018
Renewal package over starterpack. We believe the new competition landscape would be focusing more on renewal package/reload package as operators would likely to focus more on expansion and quality improvement since the focus would not be in acquisition anymore. Based on the information from investor relation of TLKM, currently government is working on a new regulation to set guidance on tariff gap between starterpacks and reload packages with price of reload packages must be lower than starter packs to encourage sustainable cus-tomer shift to reload/renewal packag-es. Doing so would help prevent the industry from returning to starterpack-heavy sales model lead to a lower churn rates and achieve the efficiency objectives as set by the existing pre-paid SIM card registration policy. Potential surge in data pricing on welcoming festive season. After the recent price wars caused by the SIM card regulation, we expect there will be an increase in data pricing considering that the price wars is beginning to subside and the implementation of SIM regulation would reduce the potential price war in
the future. Furthermore, based on our meeting with Telkomsel Investor Relation, there is an indication that Telkomsel plan to increase their data
64%16%
20%
2017
Revenue Share(%)
Telkomsel
XL Axiata
Indosat Ooredoo 66%
17%
17%
1Q18
Revenue Share(%)
Telkomsel
XL Axiata
Indosat Ooredoo
69,830
85,398
103,294
129,044
160,724 167,617
44,946 52,012
58,879
84,484
101,094 105,792
24,280
40,304
50,687 56,483
61,357 64,375
2013 2014 2015 2016 2017 1Q18
BTS on air
TLKM EXCL ISAT
Source:
Investment Thesis
Backward and forward synergies to boost new contract growth
and financial performance. WEGE has been striving to improve
efficiency and performance by acquiring or investing in a geotechnical,
precast, or modular business to further expand the services it provides.
On the other end, the company has been venturing into different
concessions such as De Braga Artotel (hotel) in Bandung, Mandiri
Proklamasi (office), and in the future is eyeing the hospital and airport
terminal business. This movement towards concession businesses is
part of WIKA group’s efforts to augment recurring income, which we
view as beneficial to counter any cyclicality that might occur in the
construction business. The company has allocated IDR367bn/IDR796bn
for concession development capex in FY18E/FY19F with varying
ownership stakes. Furthermore, WEGE benefits as these concession
businesses will require construction work that can be done by WEGE,
providing extra synergy and driving new contract growth.
Secure investments with beneficial agreements and conditions.
The concessions that the company has ventured to is a safe investment
as there are certain conditions that must be met prior to WEGE
agreeing to take a stake. For example, in the Mandiri Proklamasi office
building project, WEGE was guaranteed 80% occupancy prior to project
initiation. There are two main schemes under which the concession
projects will be done through. One is the public private partnership
(PPP), in which the government is the project owner and provides
guarantee. WEGE will then build and finance the project to then lease it
to a SOE that will operate the business and receive recurring income by
doing so. Another likely scheme is through joint operation, in which
WEGE’s role is to build and then market the project.
Diverse client profile and numerous repeat customers to secure
future contracts. Ever since WEGE was merged with DBG in 2016,
WEGE has been able to tap into the government and state owned
enterprises (SOEs) for contracts. Illustrated in the chart below, WEGE’s
contract source has shifted significantly from 99% contracts coming
from the private sector to 66%/33% in 9M18/FY19F. Going forward,
contract source is estimated be composed of a relatively equal blend
between private, SOE, and the government.
This contributed largely to FY16’s new contract spike of 145% YoY and
FY13-FY17 4 year new contract CAGR of 48%. Additionally, WEGE’s
projects that originate from WIKA group only accounts for <15% of
4 Construction - WEGE | 29 January 2019
WEGE’s contract source
Source: Company data, Sinarmas Investment
99%92%
54%66%
33%
1%5%
29%15%
31%
3%
17% 19%
36%
0%
10%
20%
30%
40%
50%
60%
70%
80%
90%
100%
2015 2016 2017 9M18 2019F
Private SOE Government
42%
29%
52% 53%41%
58%
71%
48% 47%59%
0%
10%
20%
30%
40%
50%
60%
70%
80%
90%
100%
2014 2015 2016 2017 9M18
New Customer Repeat Customer
Repeat vs. new customer composition
Source: Company data, Sinarmas Investment
5 Coal Mining Sector | 23 January 2018
Renewal package over starterpack. We believe the new competition landscape would be focusing more on renewal package/reload package as operators would likely to focus more on expansion and quality improvement since the focus would not be in acquisition anymore. Based on the information from investor relation of TLKM, currently government is working on a new regulation to set guidance on tariff gap between starterpacks and reload packages with price of reload packages must be lower than starter packs to encourage sustainable cus-tomer shift to reload/renewal packag-es. Doing so would help prevent the
industry from returning to starterpack-heavy sales model lead to a lower churn rates and achieve the efficiency objectives as set by the existing pre-paid SIM card registration policy. Potential surge in data pricing on welcoming festive season. After the recent price wars caused by the SIM card regulation, we expect there will be an increase in data pricing considering that the price wars is
64%16%
20%
2017
Revenue Share(%)
Telkomsel
XL Axiata
Indosat Ooredoo 66%
17%
17%
1Q18
Revenue Share(%)
Telkomsel
XL Axiata
Indosat Ooredoo
69,830
85,398
103,294
129,044
160,724 167,617
44,946 52,012
58,879
84,484
101,094 105,792
24,280
40,304
50,687 56,483
61,357 64,375
2013 2014 2015 2016 2017 1Q18
BTS on air
TLKM EXCL ISAT
Source: Company data
their order book, which we view as positive towards margin and from a
dependency perspective. Moreover, WEGE’s excellent quality of work
and timely project execution results in great customer retention as the
company’s latest four years customer composition consists of on
average 56% repeat customer. The company’s customer base is
composed of major business groups in Indonesia, such as Trans Corp
Group, Agung Podomoro Group, and many more.
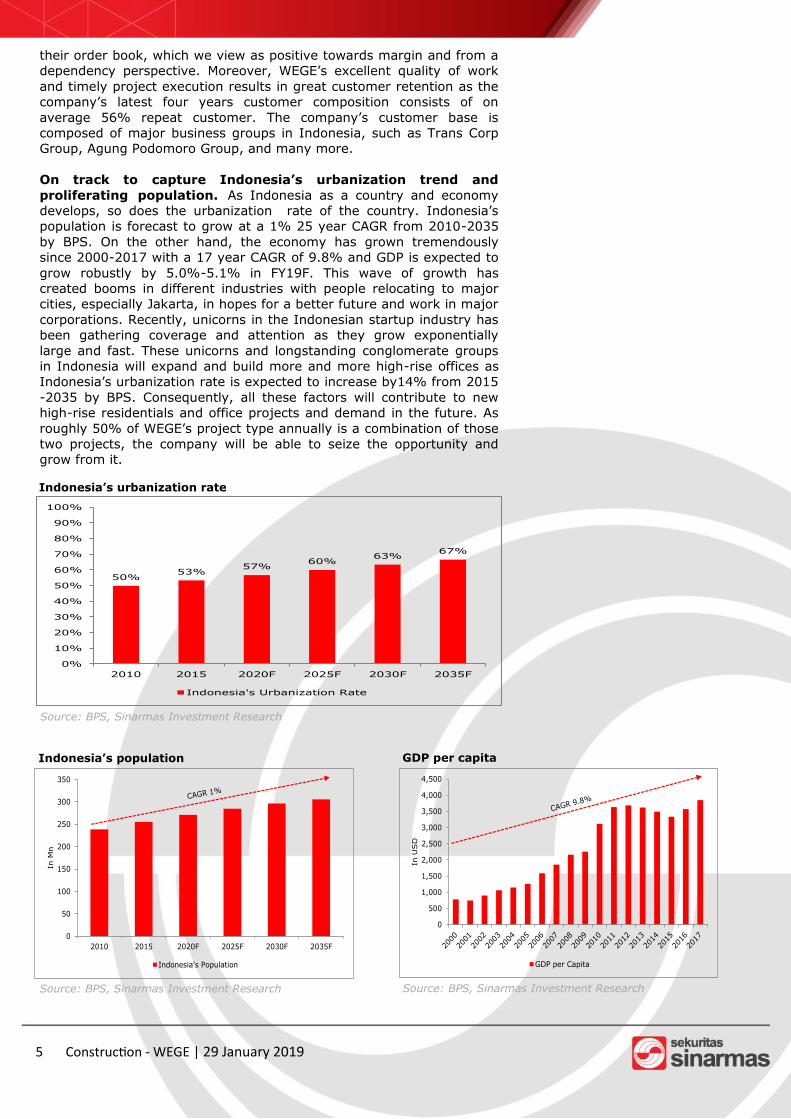
On track to capture Indonesia’s urbanization trend and
proliferating population. As Indonesia as a country and economy
develops, so does the urbanization rate of the country. Indonesia’s
population is forecast to grow at a 1% 25 year CAGR from 2010-2035
by BPS. On the other hand, the economy has grown tremendously
since 2000-2017 with a 17 year CAGR of 9.8% and GDP is expected to
grow robustly by 5.0%-5.1% in FY19F. This wave of growth has
created booms in different industries with people relocating to major
cities, especially Jakarta, in hopes for a better future and work in major
corporations. Recently, unicorns in the Indonesian startup industry has
been gathering coverage and attention as they grow exponentially
large and fast. These unicorns and longstanding conglomerate groups
in Indonesia will expand and build more and more high-rise offices as
Indonesia’s urbanization rate is expected to increase by14% from 2015
-2035 by BPS. Consequently, all these factors will contribute to new
high-rise residentials and office projects and demand in the future. As
roughly 50% of WEGE’s project type annually is a combination of those
two projects, the company will be able to seize the opportunity and
grow from it.
Indonesia’s population
Source: BPS, Sinarmas Investment Research
50%53%
57%60%
63%67%
0%
10%
20%
30%
40%
50%
60%
70%
80%
90%
100%
2010 2015 2020F 2025F 2030F 2035F
Indonesia's Urbanization Rate
0
50
100
150
200
250
300
350
2010 2015 2020F 2025F 2030F 2035F
In M
n
Indonesia's Population
GDP per capita
Source: BPS, Sinarmas Investment Research
5 Construction - WEGE | 29 January 2019
Indonesia’s urbanization rate
Source: BPS, Sinarmas Investment Research
0
500
1,000
1,500
2,000
2,500
3,000
3,500
4,000
4,500
In U
SD
GDP per Capita

6 Coal Mining Sector | 23 January 2018
Renewal package over starterpack. We believe the new competition
landscape would be focusing more on renewal package/reload package as operators would likely to focus more on expansion and quality improvement since the focus would not be in acquisition anymore. Based on the information from investor relation of TLKM, currently government is working on a new regulation to set guidance on tariff gap between starterpacks and reload packages with price of reload packages must be lower than starter packs to encourage sustainable cus-tomer shift to reload/renewal packag-
es. Doing so would help prevent the industry from returning to starterpack-heavy sales model lead to a lower churn rates and achieve the efficiency
ob-
jectives as set by the existing prepaid SIM card registration policy. Potential surge in data pricing on
64%16%
20%
2017
Revenue Share(%)
Telkomsel
XL Axiata
Indosat Ooredoo 66%
17%
17%
1Q18
Revenue Share(%)
Telkomsel
XL Axiata
Indosat Ooredoo
69,830
85,398
103,294
129,044
160,724 167,617
44,946 52,012
58,879
84,484
101,094 105,792
24,280
40,304
50,687 56,483
61,357 64,375
2013 2014 2015 2016 2017 1Q18
BTS on air
TLKM EXCL ISAT
Source:
Financial Highlight
New contract achievement to jump in 2019 while burn rate will
slowly normalize. We forecast new contracts acquired to be at
IDR7,437bn/IDR10,186bn in FY18E/FY19F (95%/85% of company’s
target). Meanwhile, burn rate is set to rise to 46% in FY18E before
moderating to 40% in FY19F as 2018’s new contract growth was
flattish (+1% YoY) as some projects tender process might have been
delayed. In the long run, we are conservative with our estimates as we
bake in long term new contract YoY growth at 5% and burn rate to
normalize at 35%. However, we would like to highlight that the
possibility for certain years when new contract secured will
beat 5% YoY growth rate is highly probably, which will then
provide even further upside surprise.
This translates to robust top line and bottom line growth.
Despite our conservative burn rate and new contract estimates,
revenue and NPATMI is still set to grow by 16.2% and 13.9% in FY19F.
This translates to FY19F EPS of IDR49.
Slight margin decrease in the short term as cement price is set
to rise. As a huge chunk of a high-rise structure’s building composition
is cement and other raw materials such as steel’s price fluctuate, gross
margin is set to drop slightly to 11.1%/10.9% in FY18E/FY19F while
cement price is estimated to rise 3% in FY19F. Gross margin will also
be slightly affected by the fading property revenue as the company no
longer generates property revenue after WIKA Realty’s inception.
However, it should pick back up starting in 2020 once concession
6 Construction - WEGE | 29 January 2019
30%42%
26%36% 46% 40% 40% 38% 35%
78%
-35%
145%
69%
1%
37%
5% 5% 5%
-60%
-40%
-20%
0%
20%
40%
60%
80%
100%
120%
140%
160%
0
2,000
4,000
6,000
8,000
10,000
12,000
14,000
16,000
18,000
20,000
2014 2015 2016 2017 2018E 2019F 2020F 2021F 2022F
IDR B
n
New Contract Contract Carryover Burn Rate New Contract Growth (YoY)
Order book breakdown
Source: Company data, Sinarmas Investment
50.4%
24.2%
105.9%
40.6%
13.9%22.0%
2.7%
0.0%
20.0%
40.0%
60.0%
80.0%
100.0%
120.0%
0
100
200
300
400
500
600
700
2015 2016 2017 2018E 2019F 2020F 2021F
IDR B
n
Net Profit Net Profit Growth (RHS)
WEGE’s net profit projection
Source: BPS, Sinarmas Investment Research
WEGE’s revenue projection
Source: BPS, Sinarmas Investment Research
17.5%
34.7%
102.1%
54.0%
16.2%22.1%
6.8%
0.0%
20.0%
40.0%
60.0%
80.0%
100.0%
120.0%
0
1,000
2,000
3,000
4,000
5,000
6,000
7,000
8,000
9,000
10,000
2015 2016 2017 2018E 2019F 2020F 2021F
IDR B
n
Revenue Revenue Growth (RHS)

7 Coal Mining Sector | 23 January 2018
Renewal package over starterpack.
We believe the new competition landscape would be focusing more on renewal package/reload package as operators would likely to focus more on expansion
and
quality improvement since the focus would not be in acquisition anymore. Based on the information from investor relation of TLKM, currently government
64%16%
20%
2017
Revenue Share(%)
Telkomsel
XL Axiata
Indosat Ooredoo 66%
17%
17%
1Q18
Revenue Share(%)
Telkomsel
XL Axiata
Indosat Ooredoo
69,830
85,398
103,294
129,044
160,724 167,617
44,946 52,012
58,879
84,484
101,094 105,792
24,280
40,304
50,687 56,483
61,357 64,375
2013 2014 2015 2016 2017 1Q18
BTS on air
TLKM EXCL ISAT
Source:
revenue starts to kick in more significantly. One other factor to note, as
capex ramps up in 2018 onwards, depreciation expense will follow suit.
However, it is a noncash expense and the investments will generate
even greater value down the road. Thus, net profit margin will also
decline slightly to 6.9%/6.8% in FY18E/FY19F.
Sensitivity analysis projects even greater upside potential. We
baked in conservative estimates both burn rate and new contract
growth wise in our model. However, for every 2% increment in burn
rate, EPS will rise by 4.8%. While for every 5% increment in new
contract growth, EPS will advance by 2.1%. Note that company
estimates FY19F net profit of IDR533bn vs. our conservative estimate
FY19F estimate of IDR472bn. Any improvement in project execution
and project tender success will provide significant earnings upside.
3.6
%
6.3
%
8.1
%
7.4
%
7.6
%8.5
%
7.8
%
8.4
% 9.4
%
8.3
%
6.3
%
8.4
%
5.5
%
4.1
%
7.1
%
9.8
%
7.8
%
3.1
% 3.8
%
5.1
%
0.0%
2.0%
4.0%
6.0%
8.0%
10.0%
12.0%
2013 2014 2015 2016 2017
WEGE TOTL NRCA ACST
11.9%12.3%
11.9%11.1% 10.9%
11.3% 11.2%
10.0% 10.1% 10.4%
9.3% 9.0%9.3% 9.1%
11.5% 11.4% 11.4%
10.5% 10.2% 10.3% 10.2%
8.1%7.4% 7.6%
6.9% 6.8% 6.8% 6.5%
0.0%
2.0%
4.0%
6.0%
8.0%
10.0%
12.0%
14.0%
2015 2016 2017 2018E 2019F 2020F 2021F
Gross Margin Operating Margin EBITDA Margin Net Margin
7 Construction - WEGE | 29 January 2019
WEGE’s margins
Source: Company data, Sinarmas Investment
Net margin comparison to peers
Source: Company data, Sinarmas Investment
49 22% 27% 32% 37% 42% 47% 52%
32% 37 38 39 40 41 41 42
34% 40 40 41 42 43 44 45
36% 42 43 44 45 46 46 47
38% 44 45 46 47 48 49 50
40% 46 47 48 49 50 51 52
42% 48 50 51 52 53 54 55
44% 51 52 53 54 55 56 57
46% 53 54 55 56 58 59 60
Burn
rate
New contract growth
Changes in burn rate and new contract growth sensitivity analysis effects to FY19F EPS
Source: Sinarmas Investment Research

8 Coal Mining Sector | 23 January 2018
Renewal package over starterpack. We believe the new competition landscape would be focusing more on renewal package/reload package as operators would likely to focus more on expansion and quality improvement since the focus would not be in acquisition anymore. Based on the information from investor relation of TLKM, currently government is working on a new regulation to set guidance on tariff gap between starterpacks and reload packages with price of reload packages must be lower than starter packs to encourage sustainable cus-tomer shift to reload/renewal packag-es. Doing so would help prevent the industry from returning to starterpack-heavy sales model lead to a lower churn rates and achieve the efficiency objectives as set by the existing pre-paid SIM card registration policy. Potential surge in data pricing on welcoming festive season. After the recent price wars caused by the SIM card regulation, we expect there will be an increase in data pricing considering that the price wars is beginning to subside and the implementation of SIM regulation would reduce the potential price war in
the
future. Furthermore, based on our meeting with Telkomsel Investor Relation, there is an indication that
64%16%
20%
2017
Revenue Share(%)
Telkomsel
XL Axiata
Indosat Ooredoo 66%
17%
17%
1Q18
Revenue Share(%)
Telkomsel
XL Axiata
Indosat Ooredoo
69,830
85,398
103,294
129,044
160,724 167,617
44,946 52,012
58,879
84,484
101,094 105,792
24,280
40,304
50,687 56,483
61,357 64,375
2013 2014 2015 2016 2017 1Q18
BTS on air
TLKM EXCL ISAT
Source:
Investment Risk
Lower new contract achievement than forecast. Any 5% reduction
in new contract achievement will result in a 2.1% decrease in FY19F
EPS and vice versa. Certain investors’ wait-and-see attitude in the
election year has the potential to slightly impact property project
developments and initiation. Nonetheless, the low base new contract
achievement in 2018 should translate to a robust FY19F new contract
achievement of 37% YoY growth (85% of management target) as the
company’s new contract project type segmentation in 2019 based on
their pipeline is equally distributed with office space/residential/public
facilities/commercial accounting for 24%/35%/30%/11% of new
contracts.
Slower burn rate. Raw material delivery, sudden changes to project
specification, and weather can impact project progress to a certain
extent. Every 2% drop in burn rate results in a 4.8% drop in FY19F EPS
and vice versa. However, since 2018’s new contract growth was
flattish, we believe our 40% burn rate estimate in 2019 is a
conservative forecast and is highly achievable.
Execution and project payment delays. Any significant delay in
project execution will translate to payment delay as payment is made
based on progress. Moreover, major delays in payment will stretch
receivable days and can compel WEGE to take loans. However, since
company has zero debt as of 9M18, we believe their balance sheet is
extremely healthy and they have the capability to take out quite a lump
sum of debt if push comes to shove.
8 Construction - WEGE | 29 January 2019

9 Coal Mining Sector | 23 January 2018
Renewal package over starterpack. We believe the new competition landscape would be focusing more on renewal package/reload package as operators would likely to focus more on expansion and quality improvement since the focus would not be in acquisition anymore. Based on the information from investor relation of TLKM, currently government is working on a new regulation to set guidance on tariff gap between starterpacks and reload packages with price of reload packages must be lower than starter packs to encourage sustainable cus-tomer shift to reload/renewal packag-es. Doing so would help prevent the industry from returning to starterpack-
heavy sales model lead to a lower churn rates and achieve the efficiency objectives as set by the existing pre-
64%16%
20%
2017
Revenue Share(%)
Telkomsel
XL Axiata
Indosat Ooredoo 66%
17%
17%
1Q18
Revenue Share(%)
Telkomsel
XL Axiata
Indosat Ooredoo
69,830
85,398
103,294
129,044
160,724 167,617
44,946 52,012
58,879
84,484
101,094 105,792
24,280
40,304
50,687 56,483
61,357 64,375
2013 2014 2015 2016 2017 1Q18
BTS on air
TLKM EXCL ISAT
Source:
Valuation
We calculated our valuation by taking a scope at three different angles:
1. DCF valuation excluding concession capex (bull scenario):
This scenario translates to a TP of IDR530, implying 80.1% upside.
We bake in 0% terminal growth and the TP implies PER of 10.8x.
2. PER valuation (base scenario): We assign a 9.2x PE multiple for
the stock and it translates to a target price of IDR450 and potential
upside of 53.1%. We believe 9.2x PE ratio is justified as it
represents a 16.7% discount to WIKA’s target PE multiple. Note
that WIKA currently trades at 9.2x 2019F PE, and our construction
sector blended 2019 target PE multiple stands at 9.2x.
3. DCF valuation by baking in full concession capex planned
(bear scenario): This scenario results in a TP of IDR323, implying
9.9% upside. We bake in 0% terminal growth and the TP implies
PER of 6.6x.
We initiate WEGE with a BUY call and TP of IDR450, implying
53.1% upside. We choose the second scenario as our valuation
method for WEGE and we believe it is fair as the company has excellent
fundamentals. WEGE currently trades at 6.0x FY19F PE, implying a
36% discount to its parent which is trading at 9.2x FY19F PE. The
company’s fundamentals and its valuation is mismatched when
analyzed based on the main metrics that investors evaluate a
construction company (burn rate, new contract growth, operating cash
flow).
9 Construction - WEGE | 29 January 2019
DCF excluding concession capex plan baked in (scenario 1)
Source: Sinarmas Investment Research
2018E 2019F 2020F 2021F 2022F
EBIT * (1-Tax) 426 682 832 866 897
Depreciation & Amortization 20 30 46 62 79
Capex 87 542 517 331 346
Changes in Working Capital 756 269 447 162 127
Free Cash Flow -397 -98 -84 435 503
Present Value of FCF -455 -98 -74 332 335 2,310
Enterprise Value at 2019 2,052
Debt 0
Cash 744
Equity Value 3,094
Equity Value/Share 323
DCF with full concession capex plan baked in (scenario 3)
Source: Sinarmas Investment Research
2018E 2019F 2020F 2021F 2022F
EBIT * (1-Tax) 426 682 832 866 897
Depreciation & Amortization 20 30 46 62 79
Capex 70 142 117 131 146
Changes in Working Capital 756 269 447 162 127
Free Cash Flow -380 302 316 635 703
Present Value of FCF -435 302 276 484 468 3,229
Enterprise Value at 2019 3,776
Debt 0
Cash 744
Equity Value 5,068
Equity Value/Share 529
10 Coal Mining - ADRO | 23 January 2018
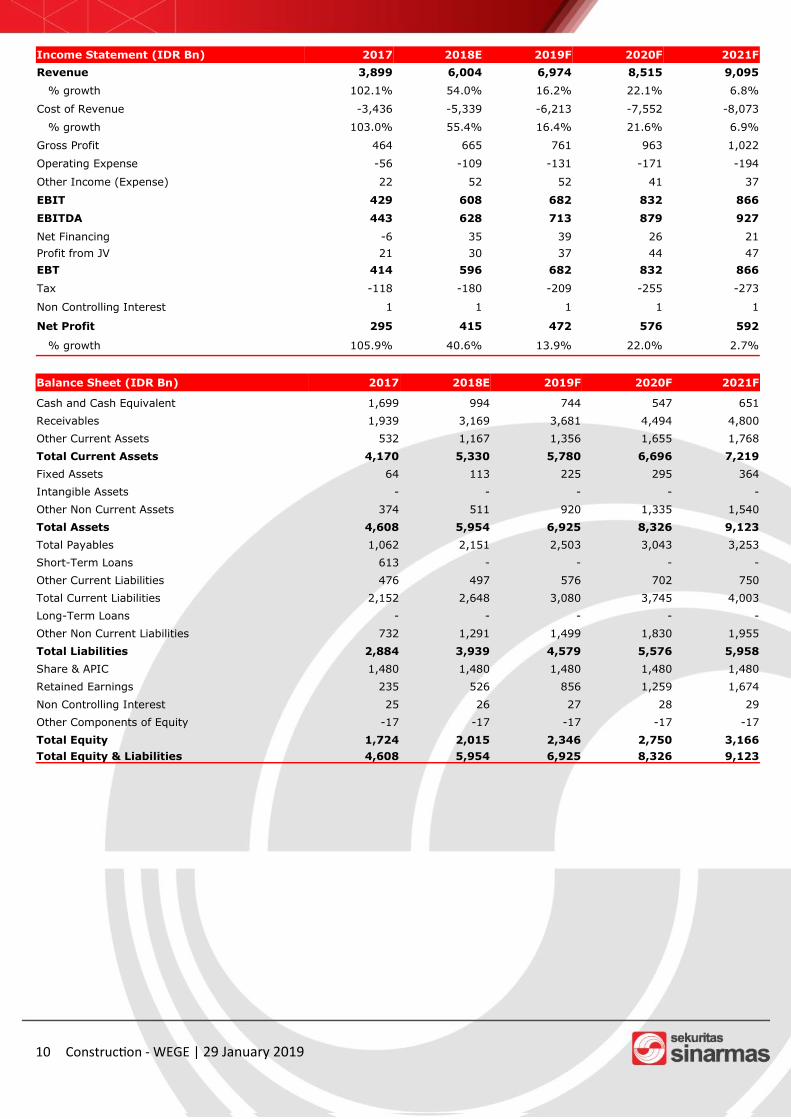
Income Statement (IDR Bn) 2017 2018E 2019F 2020F 2021F
Revenue 3,899 6,004 6,974 8,515 9,095
% growth 102.1% 54.0% 16.2% 22.1% 6.8%
Cost of Revenue -3,436 -5,339 -6,213 -7,552 -8,073
% growth 103.0% 55.4% 16.4% 21.6% 6.9%
Gross Profit 464 665 761 963 1,022
Operating Expense -56 -109 -131 -171 -194
Other Income (Expense) 22 52 52 41 37
EBIT 429 608 682 832 866
EBITDA 443 628 713 879 927
Net Financing -6 35 39 26 21
Profit from JV 21 30 37 44 47
EBT 414 596 682 832 866
Tax -118 -180 -209 -255 -273
Non Controlling Interest 1 1 1 1 1
Net Profit 295 415 472 576 592
% growth 105.9% 40.6% 13.9% 22.0% 2.7%
Balance Sheet (IDR Bn) 2017 2018E 2019F 2020F 2021F
Cash and Cash Equivalent 1,699 994 744 547 651
Receivables 1,939 3,169 3,681 4,494 4,800
Other Current Assets 532 1,167 1,356 1,655 1,768
Total Current Assets 4,170 5,330 5,780 6,696 7,219
Fixed Assets 64 113 225 295 364
Intangible Assets - - - - -
Other Non Current Assets 374 511 920 1,335 1,540
Total Assets 4,608 5,954 6,925 8,326 9,123
Total Payables 1,062 2,151 2,503 3,043 3,253
Short-Term Loans 613 - - - -
Other Current Liabilities 476 497 576 702 750
Total Current Liabilities 2,152 2,648 3,080 3,745 4,003
Long-Term Loans - - - - -
Other Non Current Liabilities 732 1,291 1,499 1,830 1,955
Total Liabilities 2,884 3,939 4,579 5,576 5,958
Share & APIC 1,480 1,480 1,480 1,480 1,480
Retained Earnings 235 526 856 1,259 1,674
Non Controlling Interest 25 26 27 28 29
Other Components of Equity -17 -17 -17 -17 -17
Total Equity 1,724 2,015 2,346 2,750 3,166
Total Equity & Liabilities 4,608 5,954 6,925 8,326 9,123
10 Construction - WEGE | 29 January 2019
11 Coal Mining - ADRO | 23 January 2018
11 Retail | 27 April 2018
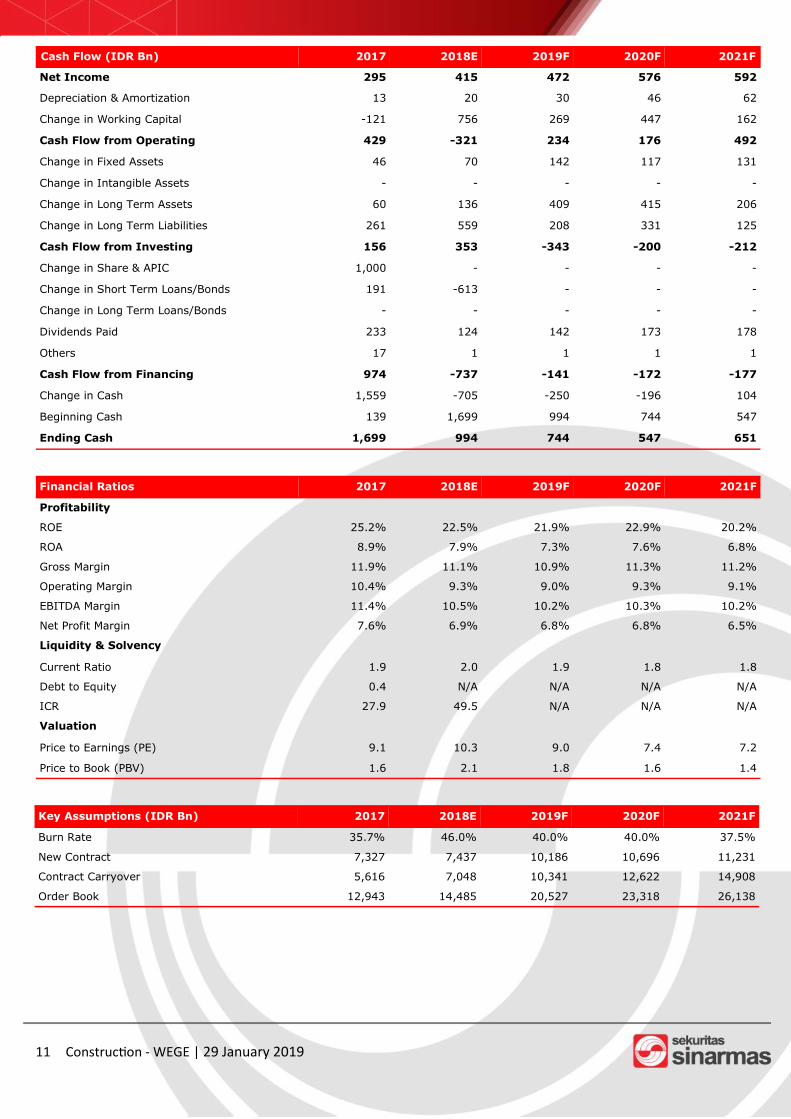
Cash Flow (IDR Bn) 2017 2018E 2019F 2020F 2021F
Net Income 295 415 472 576 592
Depreciation & Amortization 13 20 30 46 62
Change in Working Capital -121 756 269 447 162
Cash Flow from Operating 429 -321 234 176 492
Change in Fixed Assets 46 70 142 117 131
Change in Intangible Assets - - - - -
Change in Long Term Assets 60 136 409 415 206
Change in Long Term Liabilities 261 559 208 331 125
Cash Flow from Investing 156 353 -343 -200 -212
Change in Share & APIC 1,000 - - - -
Change in Short Term Loans/Bonds 191 -613 - - -
Change in Long Term Loans/Bonds - - - - -
Dividends Paid 233 124 142 173 178
Others 17 1 1 1 1
Cash Flow from Financing 974 -737 -141 -172 -177
Change in Cash 1,559 -705 -250 -196 104
Beginning Cash 139 1,699 994 744 547
Ending Cash 1,699 994 744 547 651
Financial Ratios 2017 2018E 2019F 2020F 2021F
Profitability
ROE 25.2% 22.5% 21.9% 22.9% 20.2%
ROA 8.9% 7.9% 7.3% 7.6% 6.8%
Gross Margin 11.9% 11.1% 10.9% 11.3% 11.2%
Operating Margin 10.4% 9.3% 9.0% 9.3% 9.1%
EBITDA Margin 11.4% 10.5% 10.2% 10.3% 10.2%
Net Profit Margin 7.6% 6.9% 6.8% 6.8% 6.5%
Liquidity & Solvency
Current Ratio 1.9 2.0 1.9 1.8 1.8
Debt to Equity 0.4 N/A N/A N/A N/A
ICR 27.9 49.5 N/A N/A N/A
Valuation
Price to Earnings (PE) 9.1 10.3 9.0 7.4 7.2
Price to Book (PBV) 1.6 2.1 1.8 1.6 1.4
Key Assumptions (IDR Bn) 2017 2018E 2019F 2020F 2021F
Burn Rate 35.7% 46.0% 40.0% 40.0% 37.5%
New Contract 7,327 7,437 10,186 10,696 11,231
Contract Carryover 5,616 7,048 10,341 12,622 14,908
Order Book 12,943 14,485 20,527 23,318 26,138
11 Construction - WEGE | 29 January 2019

SINARMAS SEKURITAS INVESTMENT RATINGS GUIDE BUY: Share price may rise by more than 15% over the next 12 months. ADD: Share price may range between 10% to 15% over the next 12 months. NEUTRAL: Share price may range between –10% to +10% over the next 12 months. REDUCE: Share price may range between –10% to –15% over the next 12 months. SELL: Share price may fall by more than 15% over the next 12 months. DISCLAIMER This report has been prepared by PT Sinarmas Sekuritas, an affiliate of Sinarmas Group. This material is: (i) created based on information that we consider reliable, but we do not represent that it is accurate or complete, and it should not be relied upon as such; (ii) for your private information, and we are not soliciting any action based upon it; (iii) not to be construed as an offer to sell or a solicitation of an offer to buy any security. Opinions expressed are current opinions as of original publication date appearing on this material and the in-formation, including the opinions contained herein, is subjected to change without notice. The analysis con-tained herein is based on numerous assumptions. Different assumptions could result in materially different results. The analyst(s) responsible for the preparation of this publication may interact with trading desk per-sonnel, sales personnel and other constituencies for the purpose of gathering, integrating and interpreting market information. Research will initiate, update and cease coverage solely at the discretion of Sinarmas Re-search department. If and as applicable, Sinarmas Sekuritas’ investment banking relationships, investment banking and non-investment banking compensation and securities ownership, if any, are specified in disclaim-ers and related disclosures in this report. In addition, other members of Sinarmas Group may from time to time perform investment banking or other services (including acting as advisor, manager or lender) for, or solicit investment banking or other business from companies under our research coverage. Further, the Sinar-mas Group, and/or its officers, directors and employees, including persons, without limitation, involved in the preparation or issuance of this material may, to the extent permitted by law and/or regulation, have long or short positions in, and buy or sell, the securities (including ownership by Sinarmas Group), or derivatives (including options) thereof, of companies under our coverage, or related securities or derivatives. In addition, the Sinarmas Group, including Sinarmas Sekuritas, may act as market maker and principal, willing to buy and sell certain of the securities of companies under our coverage. Further, the Sinarmas Group may buy and sell certain of the securities of companies under our coverage, as agent for its clients. Investors should consider this report as only a single factor in making their investment decision and, as such, the report should not be viewed as identifying or suggesting all risks, direct or indirect, that may be associat-ed with any investment decision. Recipients should not regard this report as substitute for exercise of their own judgment. Past performance is not necessarily a guide to future performance. The value of any invest-ments may go down as well as up and you may not get back the full amount invested. Sinarmas Sekuritas specifically prohibits the redistribution of this material in whole or in part without the writ-ten permission of Sinarmas Sekuritas and Sinarmas Sekuritas accepts no liability whatsoever for the actions of third parties in this respect. If publication has been distributed by electronic transmission, such as e-mail, then such transmission cannot be guaranteed to be secure or error-free as information could be intercepted, corrupted, lost, destroyed, arrive late or incomplete, or contain viruses. The sender therefore does not accept liability for any errors or omissions in the contents of this publication, which may arise as a result of electronic transmission. If verification is required, please request a hard-copy version. Additional information is available upon request. Images may depict objects or elements which are protected by third party copyright, trademarks and other intellectual properties.
©Sinarmas Sekuritas(2019). All rights reserved.
12 Construction - WEGE | 29 January 2019


![Laporan Penilaian Angunan a.n Siti Afiah[1]](https://img.dokumen.tips/doc/110x75/56d6be981a28ab301692c89f/laporan-penilaian-angunan-an-siti-afiah1.jpg)