Embed Size (px)
Citation preview

Pertanika J. Soc. Sci. & Hum. 28 (1): 267 - 277 (2020)
ISSN: 0128-7702 e-ISSN 2231-8534
SOCIAL SCIENCES & HUMANITIESJournal homepage: http://www.pertanika.upm.edu.my/
Article history:Received: 21 January 2017Accepted: 03 December 2019Published: 19 March 2020
ARTICLE INFO
E-mail addresses:[email protected] (Ahmad Zamri Khairani)[email protected] (Mohd Effendi@Ewan Mohd Matore)[email protected] (Mohd Zahuri Khairani)* Corresponding author
© Universiti Putra Malaysia Press
Psychometric Properties of Raven’s Advanced Progressive Matrices with a Sample of Malaysian Youth
Ahmad Zamri Khairani1*, Mohd Effendi@Ewan Mohd Matore2 and Mohd Zahuri Khairani3 1School of Educational Studies, Universiti Sains Malaysia, 11800 Penang, Malaysia2Department of Leadership and Education Policy, Faculty of Education, Universiti Kebangsaan Malaysia, Bangi 43600, Selangor, Malaysia3Department of Art and Design , Faculty of Art, Computing & Creative Industry, Universiti Pendidikan Sultan Idris, 35900 Tanjung Malim, Perak, Malaysia
ABSTRACT
The Raven’s Advanced Progressive Matrices (RAPM) is considered as one of the most successful measure of general intelligence, particularly the problem-solving and reasoning abilities. However, despite of this, there is no attempt to assess its psychometric properties in Malaysia. To bridge this shortage, the present study assessed the psychometric properties of the 23-item RAPM using a sample of 1,793 Malaysian youth. The assessment involved Rasch Model analysis measurement framework using the following criteria: model assumptions, reliability, construct validity evidence, differential item functioning (DIF), and test targeting. The results showed satisfactory findings from the data for most of the criteria, especially the reliability and validity evidence. Nevertheless, the items in the RAPM was found to lack the ability to target the respondents’ general intelligence in the measured scale.
Keywords: Malaysia, problem-solving, Rasch model, Raven’s Advanced Progressive Matrices, reasoning ability
INTRODUCTION
The Raven’s Progressive Matrices (RPM) was developed to measure problem-solving and reasoning ability (Raven et al., 1998). It includes the ability to perceive and think clearly, find meaning from confusion, and formulate new concepts when faced with novel information (TalentLens, 2011). The RPM is considered by many as the most successful inter-cultural measure of general

Ahmad Zamri Khairani, Mohd Effendi@Ewan Mohd Matore and Mohd Zahuri Khairani
268 Pertanika J. Soc. Sci. & Hum. 28 (1): 267 - 277 (2020)
intelligence (Salthouse, 2005), particularly since it was considered as culture-free test (Chen et al., 2017). The instrument (and its forms) has been used in at least 45 countries (Brouwers et al., 2009). In Asian, the RAPM has been studied in countries such as Afghanistan, China, Hong Kong, India, Japan, Malaysia, Philippines, Singapore, South Korea and Taiwan (TalentLens, 2007). In Malaysia, studies on Raven’s instrument include the work of Hashmi et al., (2015) using the Coloured Progressive Matrices for students with learning ability, while Amin et al. (2015) used the RAPM in their study among engineering students.
There are many forms of RPM. The Raven’s Standard Progressive Matrices (RSPM) contains 60 items presented in 5 set of 12 items. Meanwhile, the Raven’s Advanced Progressive Matrices (RAPM), is a more difficult version of the RSPM. The original RAPM contains 36 items with a test-taking time of 40 - 60 minutes. However, because of these time constraints, shorter versions of RAPM are available such as a 12-item version (Arthur & Day, 1994) and an 18-item medium form (Sefcek et al., 2016). Apart from the two versions, simplified version called the Colored Progressive Matrices is also available, which is mainly used to measure those with limited intellectual ability.
Because of its popularity, studies have been conducted in various settings to further investigate the psychometric properties (such as test-retest reliability, convergent validity) of the RAPM, with many of the studies reporting positive results. However,
many of these studies only dealt with test-level statistics such as internal consistency and factor structure of the instrument using raw score measurement theory or classical test theory (CTT) (Bors & Stokes, 1998; Raven, 2000; Wicherts et al., 2010). CTT assumes that a person’s score is combination of his or her true ability score, as well as some error in the measurement. It should be noted that both true score and error score are unobservable. Therefore, assumptions are needed in order to measure a person’s score. Hambleton and Jones (1993) specified that the assumptions were (1) both unobserved scores are uncorrelated, (b) that the average of the error scores in the population is zero, and (c) that the error scores on parallel tests are uncorrelated. Nevertheless, as rightly observed by Vigneu and Bors (2005), the fact that some items in RAPM are very easy whereas others are relatively difficult resulted in skewed distributions of the items which violate the assumptions of normality in assessing factor structure using CTT. As such, the objective of the present study is to evaluate the psychometric properties of the RAPM using the Rasch Model analysis. This study is significant since information on the psychometric properties of the RAMP will help users to have clean, correct, and useful data that in turns help to interpret the results more appropriately.
The development of item response theory (IRT) and its models provides an opportunity for more stringent analysis of dichotomously scored data. In Rasch Measurement Model framework, which is one family of IRT models, a person’s score

Psychometric Properties of RAPM
269Pertanika J. Soc. Sci. & Hum. 28 (1): 267 - 277 (2020)
can be described by his or her underlying ability through the following equation.
𝑃 𝜃 =exp(𝜃 − 𝑏)
1 + exp (𝜃 − 𝑏) (1)
where,P(θ) = probability of a person with θ ability is able to answer correctly b = difficulty of the item
The Rasch Model is a measurement framework that transforms the ordinal raw scores into equal interval measure, which in turns, facilitate linear measurement (Linacre, 2006). This model is increasingly employed to validate instruments (Arsad et al., 2016; Taasim & Yusoff, 2015; Yan & Mok, 2012). Compared to the CTT, Rasch Model analysis is robust towards the normality assumption of distribution and even able to provide person’s score with missing data. In addition, the item-level statistics provided by Rasch analysis helps to provide richer interpretations of the data compared to test-level statistics as in the CTT. This includes a more comprehensive evidence of psychometric properties of the instrument such as reliability and validity. In addition, IRT also provides information on the fairness of testing, i.e. whether items in the particular instrument are interpreted similarly by subgroups (such as gender, social economic status, and location) of the sample tested. Moreover, the framework is also reported as having the ability to examine whether the instrument used is able to target the intended sample. These advantages have been documented by the
work of Muis et al. (2009) who studied the psychometric properties of instrument measuring goal orientation using the CTT and Rasch Model approaches. They reported that even though the CTT analyses were able to show evidence of reliability and validity of the instrument, subsequent analyses using the Rasch Model showed that the instrument had several important shortcomings. For example, the items were not targeting the respondents adequately, and that the lower response of the response category (strongly disagree, disagree) also did not function well. Based on the arguments, we believe that the Rasch Model is the preferred model for analysis compared to the CTT.
METHODS
Research Design
The present study adopted a cross-sectional study design, where the data were collected in a single time period. This design was chosen because of its ability to gather large amounts of information from a vast pool of respondents with regards to the psychometric properties of the RAPM.
Respondents
A total of 1,793 youth from five polytechnics in Perak, Pahang, Melaka, Negeri Sembilan and Sarawak participated in this study. The purposive sample included 960 males (53.54%) and 833 females (46.46%). At this time of study, 594 of the respondents (33.12%) were 19 years old, 321 (17.90%) were 20 years old, 780 (43.50%) were 21 years old, and the remainder were 22 years

Ahmad Zamri Khairani, Mohd Effendi@Ewan Mohd Matore and Mohd Zahuri Khairani
270 Pertanika J. Soc. Sci. & Hum. 28 (1): 267 - 277 (2020)
old. Meanwhile, 603 of the respondents were in their first year study, followed by 281 respondents in the second year, and 909 were in their third year.
Measures
This study employed the 23-item RAPM, a nonverbal assessment in which each item comprises a pattern of diagrammatic puzzles with one piece missing. Respondents were measured through their ability to select the missing photo sheet from a series of possible answers. A total of eight choice answers were given to the respondents. It was dichotomously scored, i. e. an incorrect answer was given 0, while a correct answer was scored 1. In addition, demographic variable such as gender and age were also included. RAPM is a controlled instrument and the permission is required to use the items. However, sample items can be found on the TalentLens website.
Data Collection and Analyses
For data collection, written consents were obtained from the Ministry of Higher Education and respective State Education Departments to facilitate the process. Data gathered were analyzed using the Rasch Measurement Model framework in the following sequence: (1) model assumptions; (2) reliability and construct validity evidence, (3) differential item functioning (DIF) analysis between males and females, and (4) test targeting. The Rasch Model is a measurement framework that requires strict assumptions. Two important assumptions in the Rasch Model analysis are: (1) the
data must fit model’s expectations; and (2) the construct being measured must pose a unidimensional property (Linacre, 2006). The assumption of the model-data fit was examined using the infit and outfit mean squares (MNSQ) statistics, in which the values of 0.6 - 1.4 logits are considered acceptable (Bond & Fox, 2015). Meanwhile, the unidimensional assumption is assessed using the Principal Component Analysis (PCA) of residual procedures, in which the most important factor is removed and the goal is to examine whether other factors can be defined from the residuals. Unidimensional assumption is violated when eigenvalue for second construct extracted is more than 2.0 (Linacre, 2006). Also, according to the same author, the scale is considered showing evidence of unidimensionality when the variance explained by the measurement dimension is more than 40%.
The Rasch Model analysis provides a straightforward statistics to assess reliability of the measurement. The item difficulty reliability index provides information on reproducibility of the results. It is is calculated as the ratio of true item variance to observed item variance high likelihood that items with high difficulty is actually do have high difficulty measures compared to items with low difficulty. Item difficulty reliability depends on the difficulty variance and the sample size. Wide item difficulty range and large sample size provide high item difficulty reliability values and vice versa. According to Bond and Fox (2015), the values of > 0.80 are

Psychometric Properties of RAPM
271Pertanika J. Soc. Sci. & Hum. 28 (1): 267 - 277 (2020)
considered as acceptable, while Fischer (2007) acknowledges that the values of > 0.94 as strong.
Construct validity evidence was investigated using the framework provided by Messick (1993). According to this framework, the investigation of construct validity requires assembling evidence for detecting two threats to construct validity, namely, construct-irrelevant variance and construct under-representation. Construct irrelevant-variance involves considerations of whether the measurement made includes unintended constructs. It was detected through the investigation of model-data fit using the infit and outfit MNSQ mentioned above. Meanwhile, constructs under-representation refers to the inability of the measurement to include important aspects of the intended construct. Threat, in terms of construct under-representation, was conducted through visual inspection of the ordering of the item difficulty, where there is no significant gap between subsequent items on the measurement scale. The intended result projects gaps of no more than 0.5 logits between subsequent items in the measured scale (Baghaei, 2008; Linacre, 2006). Meanwhile, DIF analysis is another important statistic in the item-level analysis of the Rasch Model. It provides evidence
whether an item favours one group over another. An item is considered exhibiting DIF if it is interpreted differently by different groups. Evidence of the DIF items is shown by the size of DIF Contrast statistic of > 0.5 logits (Bond & Fox, 2015). In this study, we investigated whether the items were perceived differently by male and female respondents as reported by various studies (Lúcio et al., 2019; Waschl et al., 2016)
RESULTS
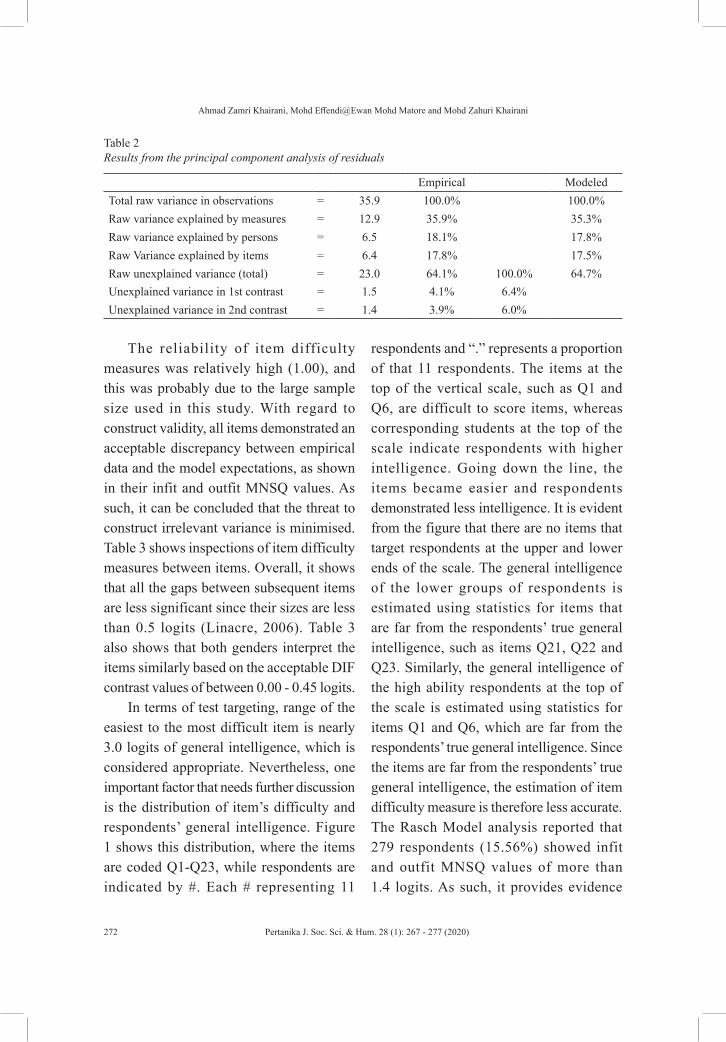
The analysis showed that mean of the infit MNSQ is 0.99 logits (SD = 0.08 logits), while mean for the outfit MNSQ is 1.05 logits (SD = 0.17 logits) (see Table 1). This is very close to the expected values of 1.00 logits for both fit statistics. Meanwhile, for every item in the RAPM, the infit MNSQ values ranged from 0.86 - 1.14 logits, while the outfit MNSQ values ranged from 0.79 -1.38 logits. The values are within the acceptable range of 0.6 - 1.4 logits based on guideline by Bond and Fox (2015). With regard to unidimensional assumptions, as depicted in Table 2, the eigenvalue of the second construct is only 1.5, which is below the value of 2.0 set by Linacre (2006). However, the measurement only explained 35.9% of the variance in the construct.
Table 1Descriptive statistics (in logits)
Measure Model Error Infit MNSQ Outfit MNSQMean 0.00 0.06 0.99 1.05SD 0.92 0.00 0.08 0.17Max. 1.38 0.07 1.14 1.38Min. -1.59 0.06 0.86 0.78
Ahmad Zamri Khairani, Mohd Effendi@Ewan Mohd Matore and Mohd Zahuri Khairani
272 Pertanika J. Soc. Sci. & Hum. 28 (1): 267 - 277 (2020)
The reliability of item difficulty measures was relatively high (1.00), and this was probably due to the large sample size used in this study. With regard to construct validity, all items demonstrated an acceptable discrepancy between empirical data and the model expectations, as shown in their infit and outfit MNSQ values. As such, it can be concluded that the threat to construct irrelevant variance is minimised. Table 3 shows inspections of item difficulty measures between items. Overall, it shows that all the gaps between subsequent items are less significant since their sizes are less than 0.5 logits (Linacre, 2006). Table 3 also shows that both genders interpret the items similarly based on the acceptable DIF contrast values of between 0.00 - 0.45 logits.
In terms of test targeting, range of the easiest to the most difficult item is nearly 3.0 logits of general intelligence, which is considered appropriate. Nevertheless, one important factor that needs further discussion is the distribution of item’s difficulty and respondents’ general intelligence. Figure 1 shows this distribution, where the items are coded Q1-Q23, while respondents are indicated by #. Each # representing 11
respondents and “.” represents a proportion of that 11 respondents. The items at the top of the vertical scale, such as Q1 and Q6, are difficult to score items, whereas corresponding students at the top of the scale indicate respondents with higher intelligence. Going down the line, the items became easier and respondents demonstrated less intelligence. It is evident from the figure that there are no items that target respondents at the upper and lower ends of the scale. The general intelligence of the lower groups of respondents is estimated using statistics for items that are far from the respondents’ true general intelligence, such as items Q21, Q22 and Q23. Similarly, the general intelligence of the high ability respondents at the top of the scale is estimated using statistics for items Q1 and Q6, which are far from the respondents’ true general intelligence. Since the items are far from the respondents’ true general intelligence, the estimation of item difficulty measure is therefore less accurate. The Rasch Model analysis reported that 279 respondents (15.56%) showed infit and outfit MNSQ values of more than 1.4 logits. As such, it provides evidence
Table 2 Results from the principal component analysis of residuals
Empirical ModeledTotal raw variance in observations = 35.9 100.0% 100.0%Raw variance explained by measures = 12.9 35.9% 35.3%Raw variance explained by persons = 6.5 18.1% 17.8%Raw Variance explained by items = 6.4 17.8% 17.5%Raw unexplained variance (total) = 23.0 64.1% 100.0% 64.7%Unexplained variance in 1st contrast = 1.5 4.1% 6.4%Unexplained variance in 2nd contrast = 1.4 3.9% 6.0%

Psychometric Properties of RAPM
273Pertanika J. Soc. Sci. & Hum. 28 (1): 267 - 277 (2020)
that the 23-item RAPM is not accurate enough in terms of targeting the students’ intelligence estimation. It requires more items for the wide range of intelligence of the respondents.
With regards to the students’ general intelligence distribution, of the 30% students who demonstrated high ability (n = 537), the group comprised of 239 third year students (44.5%), followed by 214 first year students (39.9%) and the remaining 84 year two (15.6%). In terms of gender,
this higher intelligence group showed a balanced composition of 269 male students (50.1%) and 268 female students (49.9%). Meanwhile, for the 30% (n = 537) lower group students, it comprised mainly of the third year students (n = 380, 52.1%), followed by the first year students (n = 178, 33.1%) and the second year students (n = 79, 14.8%). In terms of gender, this low intelligence group was largely made by male students (n = 329, 61.3%) compared to 208 female students (38.7%). Surprisingly,
Table 3Item statistics and DIF contrast (in logits)
Item Measure Count SE Infit MNSQ Outfit MNSQ Gap DIF Contrast1 1.38 1711 0.07 1.04 1.08 - -.326 1.36 1713 0.07 0.95 1.14 0.02 0.005 1.07 1713 0.06 0.97 1.03 0.29 0.082 0.96 1713 0.06 0.87 0.78 0.11 -0.213 0.96 1713 0.06 0.91 0.89 0.00 -0.129 0.87 1713 0.06 0.95 0.88 0.09 0.0511 0.61 1713 0.06 0.87 0.87 0.26 0.027 0.45 1713 0.06 0.99 0.98 0.16 -0.254 0.45 1713 0.06 1.00 0.95 0.00 -0.1212 0.42 1713 0.06 0.9 0.83 0.03 0.0110 0.24 1713 0.06 0.91 0.88 0.18 0.108 0.23 1713 0.06 0.97 1.03 0.01 -0.0614 0.11 1713 0.06 0.86 0.79 0.13 0.3916 -0.22 1713 0.06 0.97 1.02 0.33 0.1220 -0.22 1713 0.06 1.07 1.18 0.00 0.0119 -0.30 1713 0.06 1.04 1.12 0.08 -0.1017 -0.58 1713 0.06 1.08 1.14 0.28 -.00415 -0.77 1713 0.06 1.08 1.15 0.19 -0.1018 -1.14 1713 0.06 1.02 1.18 0.37 0.1013 -1.22 1713 0.06 1.14 1.38 0.08 -0.2622 -1.52 1709 0.06 1.09 1.3 0.30 0.0223 -1.54 1713 0.06 1.06 1.25 0.02 0.1121 -1.59 1713 0.06 0.98 1.36 0.05 0.45
Mean 0.00 1712.7 0.06 0.99 1.05SD 0.92 0.9 0.00 0.08 0.17

Ahmad Zamri Khairani, Mohd Effendi@Ewan Mohd Matore and Mohd Zahuri Khairani
274 Pertanika J. Soc. Sci. & Hum. 28 (1): 267 - 277 (2020)
RESPONDENTS MAP OF ITEMS<more>|<rare>
4 .##### +|||
.### |||
3 +|
.#### T||||
.###### |2 +
.#### |T|
.##### || Q1 Q6
.#### S||
1 .#### + Q2 Q3 Q5|S Q9
.##### |.###### | Q11
| Q12 Q4 Q7.###### | Q10 Q8.###### | Q14
0 +M.####### |
.########## M| Q16 Q19 Q20|
.########## | Q17.############ | Q15
|S-1 .########### +
| Q18.########## | Q13
|.######## | Q21 Q22 Q23
S|.########## |T
-2 +.####### |
|||
.#### ||
-3 +T||
.## ||||
-4 .# +<less>|<frequ>
EACH '#' IS 11.
Figure 1. Item difficulty and respondents’ general intelligence
the low ability group of students showed slightly higher academic performance, measured by the Cumulative Grade Point Average (CGPA), of 3.12 compared to the group of high intelligence students (CGPA = 2.98). This finding should require a deeper study especially in understanding the relationship between general intelligence and academic performance.
DISCUSSION
The objective of this study is to evaluate the psychometric properties of the RAPM, which is intended to measure general intelligence of test takers. In order to meet the purpose, this study investigated five criteria from the Rasch Measurement Model framework, namely, model assumptions, reliability, construct validity evidence, DIF, and test targeting. Results of the fit statistics and PCA of residuals showed that both of the assumptions were met; therefore, the measurement of general intelligence by the RAPM shows equal-interval properties. As expected, reliability for the item difficulty measure is high (1.00) since the present study employs large sample size of 1793 youth across the country. Thus, there is highly likely that the item difficulty measure is reproducible. That is, the first item (item Q1) will always be the most difficult for the test takers. In fact, the first 7 items are among the most difficult items in the RAPM. This, however, raises the questions of how appropriate the ordering of the RAPM is, since it is reasonable for test items to be arranged from the easiest to the hardest so that the test takers are comfortable with

Psychometric Properties of RAPM
275Pertanika J. Soc. Sci. & Hum. 28 (1): 267 - 277 (2020)
the test items and thus reduce test anxiety. In his study, Chen (2012) demonstrated that item ordering had moderating effect on relationship between test anxiety and test performance. Also, further study can be conducted to understand the mental image of the test takers, that is, how their mind work when the encounter with RAPM items. This is important in understanding what makes item Q1 the most difficult compared to other items, and what kind of mental operations that is needed to solve this very difficult item.
This study reports high item reliability of the RAPM. This positive result can be related to the large sample size used and wide coverage of item difficulty. Thus, it can be said that the difficulty of RAPM items are highly reproducible for a comparable group of test takers. That is, if the RAPM is administered to other sample of polytechnic students, there is high probability that the ordering of the items remain the same. It should be noted that high reliability of the RAMP items was also reported by the study of Nurhudaya et al., (2019) in Indonesia. Meanwhile, the positive results are also reported for construct validity evidence of the RAPM since there is a very minimum evidence of construct-irrelevant variance and construct under-representative. The high evidence of construct validity of the RAPM enables test users to interpret results from the measurement appropriately since the instrument is measuring general intelligence and not other unintended construct. However, the result is not unexpected as the RAPM has shown evidence of high
construct validity in many studies across many cultures (Brouwers et al., 2009; Kpolovie & Emekene, 2016; Rushton et al., 2004).
In this study, there is also evidence that the RAPM did not really target the respondents, especially at the lower and upper parts of the general intelligence scale continuum. Hence, we argue that there is a need for more items to target this group of respondents. For this, we recommend the original 36-item version when the instrument is administered to Malaysian youth so that more items can function together to estimate the respondents’ intelligence.
CONCLUSION
Its limitation notwithstanding, the present study extends the understanding of Rasch Model analysis in assessing psychometric properties of the RAPM. Practically, the DIF and test targeting analysis employed in this study provide a more stringent assessment of psychometric properties which are not offered by CTT analysis such as confirmatory analysis. Nevertheless, in order to better understand the RAPM items, investigations should go beyond psychometric issues. Researchers need perform more qualitative works in order to understand what makes an item more difficult than other item, thus requiring higher general intelligence ability to solve.
ACKNOWLEDGMENT
The authors gratefully wish to thank and express our gratitude toward School of Educational Studies, Universiti Sains
Ahmad Zamri Khairani, Mohd Effendi@Ewan Mohd Matore and Mohd Zahuri Khairani
276 Pertanika J. Soc. Sci. & Hum. 28 (1): 267 - 277 (2020)
Malaysia, Faculty of Education, Universiti Kebangsaan Malaysia, and Faculty of Art, Computing & Creative Industry, Universiti Pendidikan Sultan Idris for support of this paper.
REFERENCESAmin, H. U., Malik, A. S., Kamel, N., Chooi,
W., & Hussain, M. (2015). P300 correlates with learning & memory abilities and fluid intelligence, Journal of NeuroEngineering and Rehabilitation, 12, 87-101.
Arsad, N., Bais, B., Kamal, B., Hashim, F. H., Wan, W. M. Z., & Husain, H. (2016). Study on the impact of team teaching using the Rasch Measurement Model: Perception of students and lecturers. Pertanika Journal of Social Science and Humanities, 24(5), 197-204.
Arthur, W., Jr., & Day, D. V. (1994). Development of a short form for the Raven Advanced Progressive Matrices Test. Educational and Psychological Measurement, 54, 394-403.
Baghaei, P. (2008). The Rasch Model as a construct validation tool. Rasch Measurement Transactions, 22(1), 1145-1146.
Bond, T. G., & Fox, C. M. (2015). Applying the Rasch model: fundamental measurement in the human sciences. New Jersey, USA: Routledge.
Bors, D. A., & Stokes, T. L. (1998). Raven’s Advanced Progressive Matrices: Norms for first-year university students and the development of a short form. Educational and Psychological Measurement, 58(3), 382-398.
Brouwers, S. A., Van de Vijver, F. J. R., & Van Hemert, D. A. (2009). Variation in Raven’s Progressive Matrices scores across time and place. Learning and Individual Differences, 19, 330-338.
Chen, H. (2012). The moderating effects of item order arranged by difficulty on the relationship
between test anxiety and test performance. Creative Education, 3(3), 328-333.
Chen, Z., Beuckelaer, A., Wang, X., & Liu, J. (2017). Distinct neural substrates of visuospatial and verbal-analytic reasoning as assessed by Raven’s Advanced Progressive Matrices. Scientific Reports, 7, 16230.
Fischer, W. P. J. (2007). Rating scale instrument quality criteria. Rasch Measurement Transaction, 21(1), 1095.
Hambleton, R. K., & Jones, R. W. (1993). Comparison of classical test theory and item response theory and their applications to test development. Educational Measurement: Issues and Practice, 12(3), 3847.
Hashmi, S. I., Gang @ Grace, G. C. A., Seok, C. B. (2015). Performance of students’ with Learning Disabilities (LD) on Ravens’ coloured progressive matrices. Southeast Asia Psychology Journal, 3, 23-33.
Kpolovie, P. J. , & Emekene, C. O. (2016). Psychometric advent of advanced progressive matrices – smart version (APM-SV) for use in Nigeria. European Journal of Statistics and Probability, 4(3), 20-60.
Linacre, J. M. (2006). A user’s guide to WINSTEPS/MINISTEPS: A Rasch model computer programs. Chicago, USA: Winsteps.com.
Lúcio, P. S., Cogo-Moreira, H., Puglisi, M., Polanczyk, G. V., & Little, T. D. (2019). Psychometric investigation of the raven’s colored progressive matrices test in a sample of preschool children. Assessment, 26(7) 1399-1408.
Messick, S. (1993). Validity. In R. L. Linn (Ed.), Educational measurement (2nd ed.) (pp. 13-104). Phoenix, USA: American Council on Education and Oryx Press.
Muis, K. R., Winnie, P. H., & Edwards, O. V. (2009). Modern Psychometric for assessing achievement

Psychometric Properties of RAPM
277Pertanika J. Soc. Sci. & Hum. 28 (1): 267 - 277 (2020)
of goal orientation: A Rasch analysis, British Journal of Educational Psychology, 79, 547-576.
Nurhudaya, Taufik, A., Yudha, E. S., & Suryana, D. (2019). The Raven’s Advanced Progressive Matrices in education assessment with a Rasch analysis. Universal Journal of Educational Research, 7(9), 1996-2002.
Raven, J. (2000). The Raven’s Progressive Matrices: Change and stability over culture and time. Cognitive Psychology, 41, 1-48.
Raven, J., Raven, J. C., & Court, J. H. (1998). Raven manual: Section 4, Advanced progressive matrices, 1998 edition. Oxford, England: Oxford Psychologists Press Ltd.
Rushton, J. P., Skuy, M., & Bons, T. A. (2004). Construct Validity of Raven’s Advanced Progressive Matrices for African and Non-African Engineering Students in South Africa. International Journal of Selection and Assessment, 12(3), 220-229.
Salthouse, T. A. (2005). Relations between cognitive abilities and measures of executive functioning. Neuropsychology, 19(4), 532-545.
Sefcek, J. A., Miller, G. F., & Figueredo, A. J. (2016). Development and validation of an 18-Item medium form of the Ravens Advanced Progressive Matrices. SAGE Open, 6(2), 1-7.
Taasim, S. I., & Yusoff, R. (2015). Rasch measurement theory in validation instruments for electronic financial technology in Malaysia. Journal of Human Capital Development, 8(1), 47-58.
TalentLens. (2007). Raven’s Advanced Progressive Matrices: Frequently asked questions. Retrieved July 4, 2016, from http://www.talentlens.com.au/userfiles/Raven’s%20APM%20FAQs.pdf
TalentLens. (2011). Raven’s Advanced Progressive Matrices: The International Technical Manual. Retrieved July 4, 2016, from https://www.talentlens.co.uk/assets/resources/raven’s%20apm%20international%20technical%20manual.pdf
Vigneu, F., & Bors, D. A. (2005). Items in context: Assessing the dimensionality of Raven’s Advanced Progressive Matrices. Educational and Psychological Measurement, 65(1), 109-123.
Waschl, N. A., Nettelbeck, T., Jackson, S. A., & Burns, N. R. (2016). Dimensionality of the Raven’s Advanced Progressive Matrices: Sex differences and visuospatial ability. Personality and Individual Differences, 100, 157-166.
Wicherts, J. M., Dolan, C. V., Carlson, J. S., & van der Maas, H. L. J. (2010). Raven’s test performance of sub-Saharan Africans: Average performance, psychometric properties, and the Flynn Effect. Learning and Individual Differences, 20(3), 135-151.
Yan, Z., & Mok, M. M. (2012). Validating the coping scale for Chinese athletes using multidimensional Rasch analysis, Psychology of Sport and Exercise, 13, 271-279.