Embed Size (px)
Citation preview
Psychology as a Science
In this lecture we will discuss: science - a method for understanding limits of common sense methods of science
descriptioncorrelationexperimentation
evaluating data with statistics sources of error and bias in research

Science vs. Common Sense
Common sense and intuition often tell us about psychology e.g., suppose a study tells us that ‘separation
weakens romantic attraction’ common sense may tell us - “out of sight, out
of mind” or common sense may say the opposite -
“absence makes the heart grow fonder”
Common sense can be inconsistent and based on hindsight

Science vs. Common Sense
Science helps build explanations that are consistent and predictive rather than conflicting and postdictive (hindsight)
Science is based on knowledge of facts developing theories testing hypotheses public and repeatable procedures

Scientific Inquiry
Facts are what need to be explained objective - viewable by others based on direct observation reasonable observers agree are true
Theory is a set of ideas that explains facts makes predictions about new facts
Hypothesis prediction about new facts can be verified or falsified

Methods in Psychology
Setting - field vs. laboratoryMethods of data collection
self-report vs. observationalResearch plan or design
descriptive correlational experimental

Descriptive Study
Describes a set of factsDoes not look for relationships between
factsDoes not predict what may influence the
factsMay or may not include numerical dataExample: measure the % of new students
from out-of-state each year since 1980
Correlational StudyCollects a set of facts organized into two
or more categories measure parents disciplinary style measure children’s behavior
Examine the relation between categoriesCorrelation reveals relationships among
facts e.g., more democratic parents have children
who behave better

Correlational Study
Correlation cannot prove causation Do democratic parents produce better
behaved children? Do better behaved children encourage parents
to be democratic?May be an unmeasured common factor
e.g., good neighborhoods produce democratic adults and well behaved children

Experiments
Direct way to test a hypothesis about a cause-effect relationship between factors
Factors are called variables One variable is controlled by the experimenter
e.g., democratic vs. authoritarian classroom
The other is observed and measured e.g., cooperative behavior among students

Experimental Variables
Independent variable the controlled factor in an experiment hypothesized to cause an effect on another
variable
Dependent variable the measured facts hypothesized to be affected

Independent Variable
Must have at least two levels categories - male vs. female numeric - ages 10, 12, 14
Simplest is experimental vs. control experimental gets treatment control does not

Experimental Design
Levels may differ between or within people Within-subject experiment - different levels of
the independent variable are applied to the same subject
Between-groups experiment - different levels of the independent variable are applied to different groups of subjects

Experimental Design
Random sample - every member of the population being studied should have an equal chance of being selected for the study
Random assignment - every subject in the study should have an equal chance of being placed in either the experimental or control group
Randomization helps avoid false results

Research SettingsLaboratory
a setting designed for research provide uniform conditions for all subjects permits elimination of irrelevant factors may seem artificial
Field research behavior observed in real-world setting poor control over conditions measures may be more representative of reality
Data-Collection Methods
Self-report - procedures in which people rate or describe their own behavior or mental state questionnaires rating scales
on a scale from 1 to 7 rate your opinion of …
judgements about perceptionson a scale from 1 to 100 how hot is ...
Data-Collection Methods
Observational methods - researchers directly observe and record behavior rather than relying on subject descriptions naturalistic observation - researcher records
behavior as it occurs naturally tests - researcher presents stimuli or problems
and records responses

Descriptive Statistics
Variable - something that can vary or change
Dependent variable - something we measure
Data - a collection of measurementsStatistics - summary descriptions of data
(i.e., mean, medium, range)

Descriptive Statistics
Used to describe or summarize sets of data to make them more understandable measures of central tendency
mean, median, mode
measures of variabilityrange, standard deviation
measures of associationcorrelation coefficient

Measures of Central Tendency
What is the average family income above?
Mean - the arithmetic averageMedian - the center scoreMode - the score that occurs the
most
Measures of Variability
Range - the difference between the highest and lowest score in a set of data
Standard deviation - reflects the average distance between every score and the mean
Correlation Coefficient
Often we measure more than one variable
Grade point and SAT scoreAre they related? Correlation statistic is a way to find
out
Correlation Coefficient
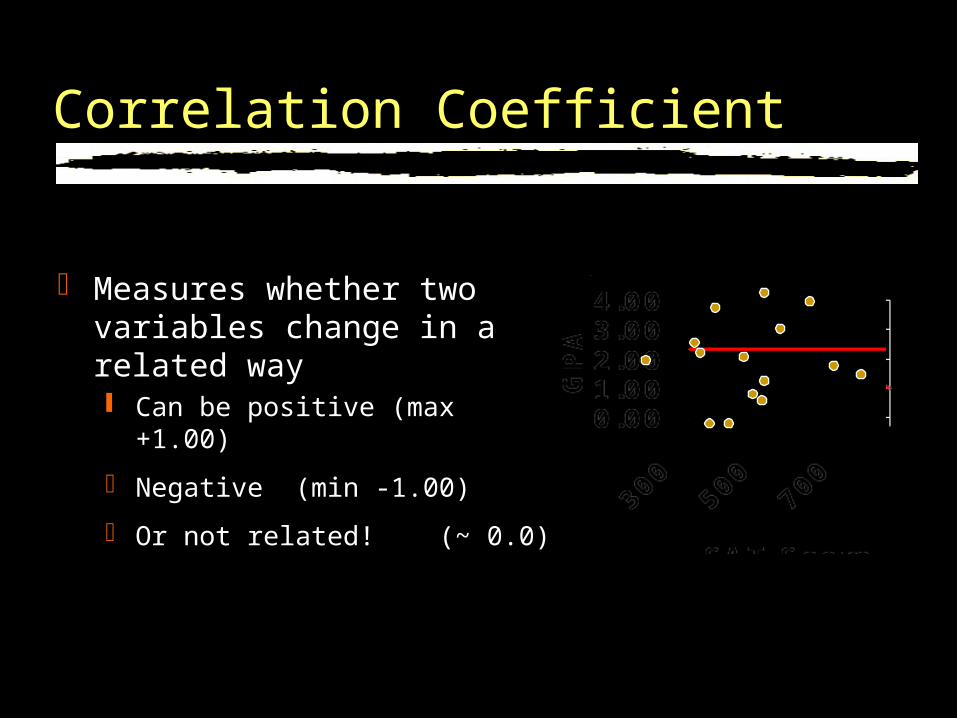
Measures whether two variables change in a related way Can be positive (max +1.00)
Negative (min -1.00)
Or not related! (~ 0.0)

Inferential StatisticsDescriptive statistics summarize a data
setWe often want to go beyond the dataIs the world at large like my sample?Are my descriptive statistics misleading?Inferential statistics give probability that
the sample is like the world at large

Statistics and Probability
Probability means how likely something isHow likely are results like mine to occur
by chance? Statistical inferences
significant result - reflects the real world rather than chance, with high probability (e.g., > .95 )
not significant - results reflect chance

Measurement Errors
Why is inference based on probability instead of certainty?
Data can be misleading because of variability
low variability
high variability

Measurement Errors
Why is inference based on probability instead of certainty?
low bias
high bias
Data can be misleading because of bias

Measurement Error
Variability and bias can combine
Variability &Bias
Variability Bias
Sources of Bias
Biased sample - when the members of a sample differ in a systematic way from the larger population the researcher is interested in
Example interested in all voters contact by telephone biased sample - lower economic groups may not own
telephones
Sources of Bias
Observer-expectancy effect researcher has expectations that influence
measurements
Subject-expectancy effect subject knows design and tries to produce
expected resultBlinding
minimize expectancy by removing knowledge about experimental conditions

Blinding
Single-blind study - when subjects are kept uninformed as to the treatment they are receiving
Double-blind study - when both subjects and experimenter are kept uninformed about aspects of the study that could lead to differential expectations

Ethical Issues in Psychological Research
Right to privacyInformed consent
use of deception
Animal rights Is there justification for discomfort or harm a
research procedure may produce?
APA publishes ethical guidelines