Embed Size (px)
Citation preview
Psychiatric morbidityamong adults living inprivate households,2000
London: The Stationery Office
Nicola SingletonRobert BumpsteadMaureen O’BrienAlison LeeHoward Meltzer
The report of a surveycarried out by SocialSurvey Division of theOffice for NationalStatistics on behalf ofthe Department ofHealth, the ScottishExecutive and theNational Assembly forWales

© Crown copyright 2001
Published with the permission of the Controller of Her Majesty’s
Stationery Office (HMSO).
ISBN 0 11 621480 5
Applications for reproduction should be submitted to HMSO
under HMSO’s Class Licence:
www.clickanduse.hmso.gov.uk
Alternatively applications can be made in writing to:
HMSO
Licensing Division
St. Clement’s House
2-16 Colegate
Norwich
NR3 1BQ
Contact points
For enquiries about this publication, contact
Nicola Singleton
Tel: 020 7533 5305
E-mail: [email protected]
To order this publication, call The Stationery Office
on 0870 600 5522. See also back cover.
For general enquiries, contact the National Statistics
Public Enquiry Service on 0845 601 3034
(minicom: 01633 812399)
E-mail: [email protected]
Fax: 01633 652747
Letters: Room 1.001, Government Buildings,
Cardiff Road, Newport NP10 8XG
You can also find National Statistics on the Internet
at www.statistics.gov.uk
About the Office for National Statistics
The Office for National Statistics (ONS) is the government
agency responsible for compiling, analysing and disseminating
many of the United Kingdom’s economic, social and demo-
graphic statistics, including the retail prices index, trade figures
and labour market data, as well as the periodic census of the
population and health statistics. The Director of ONS is also the
National Statistician and the Registrar General for England and
Wales, and the agency that administers the registration of
births, marriages and deaths there.
This report has been produced by the Social Survey Division of
the Office for National Statistics in accordance with the Official
Statistics Code of Practice.

Contents
PageList of tables vList of figures viiNotes to tables viiiAcknowledgements ix
Summary of key findings 1
1 Aims, concepts and methods 7
1.1 Background aims and coverage of the survey 71.1.1 Background 71.1.2 Aims of the survey 71.1.3 Coverage of the survey 81.1.4 Coverage of this report 81.1.5 Plans for later reports 81.1.6 Access to the data 9
1.2 Sampling and interviewing procedures 91.2.1 Sampling procedures for the initial interview 91.2.2 Organisation of the initial interview 91.2.3 Interviewing procedures 101.2.4 Sampling and interviewing procedures for the second stage interviews 101.2.5 Results of the sampling procedures 11
1.3 Concepts and methods used in assessing psychiatric morbidity 111.3.1 Coverage of disorders 131.3.2 Concepts 141.3.3 Choice of measurement instruments for particular disorders 15
2 Prevalence of mental disorders and substance misuse 21
2.1 Introduction 212.2 Neurotic symptoms and disorders 21
2.2.1 Prevalence of neurotic symptoms 212.2.2 Distribution of CIS-R scores 232.2.3 Prevalence of neurotic disorders 24
2.3 Personality disorder 252.4 Psychotic and severe affective disorders 252.5 Substance misuse and dependence 27
2.5.1 Prevalence of hazardous drinking 272.5.2 Prevalence of alcohol dependence 282.5.3 Prevalence of drug use 292.5.4 Prevalence of drug dependence 30
2.6 Co-occurrence of disorders 32
3 Trends in prevalence of mental disorders and substance misuse 61
3.1 Introduction 613.2 Trends in the prevalence of neurotic symptoms and disorders 61
3.2.1 Neurotic symptoms 623.2.2 The distribution of CIS-R scores 633.2.3 Neurotic disorders 63
3.3 Trends in prevalence of psychotic and severe affective disorders 643.4 Trends in prevalence of substance misuse and dependence 64
3.4.1 Alcohol dependence 643.4.2 Illicit drug use 653.4.3 Drug dependence 66
iii

iv
Page
4 Characteristics of adults with psychiatric disorders 76
4.1 Introduction 764.2 Characteristics of people with neurotic disorders 77
4.2.1 Personal characteristics 774.2.2 Education and employment 794.2.3 Housing and area of residence 804.2.4 Neurotic disorder and physical complaints 80
4.3 Characteristics of people with probable psychotic disorder 814.3.1 Personal characteristics 814.3.2 Education and employment 824.3.3 Housing and area of residence 824.3.4 Probable psychosis and physical complaints 82
4.4 Characteristics of people with alcohol problems 824.4.1 Personal characteristics 824.4.2 Education and employment 834.4.3 Housing and area of residence 844.4.4 Alcohol problems and physical complaints 84
4.5 Characteristics of people with drug dependence 844.5.1 Personal characteristics 844.5.2 Education and employment 854.5.3 Housing and area of residence 854.5.4 Drug dependence and physical complaints 85
5 Treatment and service use by people with psychiatric disorders 103
5.1 Treatment and service use by people with neurotic disorders 1035.1.1 Use of medication and other treatment 1035.1.2 Use of GP, in-patient and day- or out-patient services 1055.1.3 Use of community care services 1055.1.4 Day activity services 1065.1.5 Services refused 106
5.2 Treatment and service use by people with a probable psychotic disorder 1065.2.1 Use of medication and other treatment 1065.2.2 Use of GP, in-patient and day- or out-patient services 1075.2.3 Use of community care services 1075.2.4 Day activity services 1075.2.5 Services refused 107
5.3 Treatment and service use by people with alcohol problems 1075.3.1 Use of medication and other treatment 1085.3.2 Use of health care, community and day activity services 1085.3.3 Services refused 108
5.4 Treatment and service use by people with drug dependence 1085.4.1 Use of medication and other treatment 1085.4.2 Use of health care, community and day activity services 1085.4.3 Services refused 109
Appendices
A Statistical terms and their interpretation 125A1 Confidence intervals 125A2 Sampling errors 125A3 Significance 126
B Estimating the prevalence of psychotic disorder 148
Glossary of survey definitions and terms 151

List of tablesPage
Chapter 1 Aims, concepts and methods1.1 Households eligible for interview 111.2 Response of adults at initial interview stage 111.3 Response at the second stage 111.4 ICD-10 categories of disorder and their
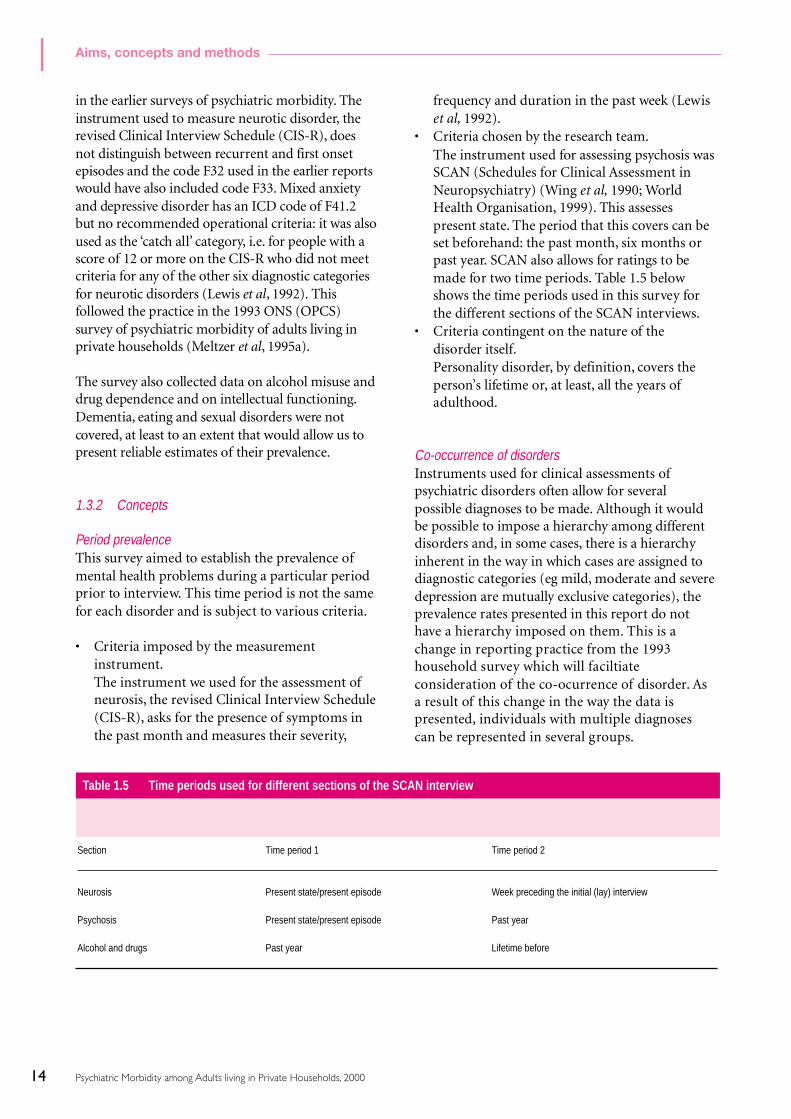
coverage in the survey 131.5 Time periods used for different sections
of the SCAN interview 141.6 Instruments used to assess mental disorder
in the survey 15
Chapter 2 Prevalence of mental disorders and substance misuse
2.1 Proportion of adults with a score of twoor more on each CIS-R symptom by ageand sex 34
2.2 Proportion of adults with a score of two ormore on each CIS-R symptom by ethnicityand sex 35
2.3 Proportion of adults with a score of two ormore on each CIS-R symptom by regionand sex 36
2.4 CIS-R score (grouped) by age and sex 372.5 CIS-R score (grouped) by ethnicity and sex 382.6 CIS-R score (grouped) by region and sex 392.7 Prevalence of neurotic disorders by age
and sex (rate per thousand population) 402.8 Prevalence of neurotic disorders by
ethnicity and sex (rate per thousandpopulation) 41
2.9 Prevalence of neurotic disorders by regionand sex (rate per thousand population) 42
2.10 Prevalence of personality disorder fromclinical interviews by age and sex 43
2.11 Prevalence of probable psychotic disorderby age and sex 44
2.12 Prevalence of probable psychotic disorderby ethnicity and sex 44
2.13 Prevalence of probable psychotic disorderby region and sex 44
2.14 Prevalence of hazardous drinking in thepast year by age and sex 45
2.15 Prevalence of hazardous drinking in thepast year by ethnicity and sex 46
2.16 Prevalence of hazardous drinking in thepast year by region and sex 47
2.17 Prevalence of alcohol dependence by ageand sex (rate per thousand population) 48
2.18 Prevalence of alcohol dependence byethnicity and sex (rate per thousandpopulation) 49
2.19 Prevalence of alcohol dependence by regionand sex (rate per thousand population) 50
2.20 Lifetime experience of drug use by ageand sex 51
Page
2.21 Illicit drug use in the last year by age and sex 522.22 Illicit drug use in the last year by ethnicity
and sex 532.23 Illicit drug use in the last year by region
and sex 542.24 Prevalence of drug dependence by age
and sex (rate per thousand population) 552.25 Prevalence of drug dependence by ethnicity
and sex (rate per thousand population) 562.26 Prevalence of drug dependence by region
and sex (rate per thousand population) 572.27 Number of mental disorders by age group
and sex 582.28 Number of mental disorders by ethnicity
and sex 592.29 Number of mental disorders by region
and sex 60
Chapter 3 Trends in prevalence of mental disorders and substance misuse
3.1 Prevalence of neurotic symptoms in 1993and 2000 by age and sex (people aged 16 to64 only) 68
3.2 Distribution of CIS-R scores (grouped)in 1993 and 2000 by age and sex (peopleaged 16 to 64 only) 69
3.3 Prevalence of neurotic disorders in 1993and 2000 by age and sex (people aged 16 to64 only) 70
3.4 Prevalence of psychotic disorder in the pastyear in 1993 and 2000 by sex 71
3.5 Comparison of the patterns of alcoholdependence by age and sex in 1993 and2000 (people aged 16 to 64 only) 71
3.6 Prevalence of illicit drug use in the pastyear in 1993 and 2000 by sex 72
3.7 Drug use in the past year: 1994, 1996,1998 and 2000 (people aged16 to 59 in England and Wales only) 73
3.8 Prevalence of drug dependence in 1993and 2000 by age and sex 74
Chapter 4 Characteristics of adults with psychiatric disorders
4.1 Age, ethnicity, marital status and familyunit type by neurotic disorder and sex 86
4.2 Qualifications, intellectual functioning,social class and employment status byneurotic disorder and sex 88
4.3 Housing tenure, number of accommodationmoves and type of locality by neuroticdisorder and sex 90
v

vi
Page
4.4 Prevalence of longstanding physicalcomplaints by neurotic disorder and sex 91
4.5 Prevalence of longstanding physicalcomplaints by number of neurotic disordersand sex 92
4.6 Sex, age, ethnicity, marital status and familyunit type by probable psychotic disorder 93
4.7 Qualifications, intellectual functioning,social class and employment status byprobable psychotic disorder 93
4.8 Housing tenure, number of accomodationmoves and type of locality by probablepsychotic disorder 93
4.9 Prevalence of longstanding physicalcomplaints by probable psychotic disorder 93
4.10 Age, ethnicity, marital status and familyunit type by level of alcohol problem and sex 94
4.11 Qualifications, intellectual functioning,social class and employment status by levelof alcohol problem and sex 96
4.12 Housing tenure, number of accomodationmoves and type of locality by level of alcoholproblem and sex 98
4.13 Prevalence of longstanding physicalcomplaints by level of alcohol problemand sex 99
4.14 Sex, age, ethnicity, marital status and familyunit type by drug dependence 100
4.15 Qualifications, intellectual functioning,social class and employment status by drugdependence 101
4.16 Housing tenure, number of moves and typeof locality by drug dependence 102
4.17 Prevalence of longstanding physicalcomplaints by drug dependence 102
Chapter 5 Treatment and service use by people with psychotic disorders
5.1 Treatment received for mental or emotionalproblems by number of neurotic disorders 109
5.2 Treatment received for mental or emotionalproblems by type of neurotic disorder 109
5.3 Types of medication taken by number ofneurotic disorders 110
5.4 Types of medication taken by type ofneurotic disorder 110
5.5 Treatment by counselling and therapy bytype of neurotic disorder 111
5.6 Health care services used for mental oremotional problems by number ofneurotic disorders 111
5.7 Health care services used for mental oremotional problems by type of neuroticdisorder 112
5.8 Community care services used by type ofneurotic disorder 112
5.9 Day care services used by type of neuroticdisorder 113
Page
5.10 Services turned down by neurotic disorder 1135.11 Treatment received for mental or emotional
problems by people with and withoutpsychotic disorder 114
5.12 Types of medication taken by people withand without psychotic disorder 114
5.13 Treatment by counselling and therapy bypeople with and without psychotic disorder 114
5.14 Health care services used for mental andemotional problems by people with andwithout psychotic disorder 114
5.15 Community care services used by peoplewith and without psychotic disorder 115
5.16 Day activity services used by people withand without psychotic disorder 115
5.17 Services turned down by people with andwithout psychotic disorder 115
5.18 Treatment received for mental oremotional problems by level of alcoholproblem 116
5.19 Types of medication taken by level ofalcohol problem 116
5.20 Treatment by counselling and therapyby level of alcohol problem 117
5.21 Health care services used for mentaland emotional problems by level ofalcohol problem 117
5.22 Community care services used by levelof alcohol problem 118
5.23 Day activity services used by level ofalcohol problem 119
5.24 Services turned down by level of alcoholproblem 119
5.25 Treatment received for mental or emotionalproblems by drug dependence 120
5.26 Types of medication taken by drugdependence 120
5.27 Treatment by counselling and therapy bydrug dependence 121
5.28 Health care services used for mental oremotional problems by drug dependence 121
5.29 Community services used by drugdependence 122
5.30 Day care services used by drug dependence 1235.31 Services turned down by drug dependence 123
Appendix A
A.1 Standard errors and 95% confidence intervalsfor prevalence of CIS-R symptoms by sex 127
A.2 Standard errors and 95% confidence intervalsfor prevalence of CIS-R symptoms by age 128
A.3 Standard errors and 95% confidence intervalsfor the distribution of CIS-R scores by sex andethnicity 131
A.4 Standard errors and 95% confidence intervalsfor the distribution of CIS-R scores by age 132
A.5 Standard errors and 95% confidence intervalsfor distribution of CIS-R scores by region 134

Page
A.6 Standard errors and 95% confidence intervalsfor prevalence of neurotic disorders by sexand ethnicity 136
A.7 Standard errors and 95% confidence intervalsfor prevalence of neurotic disorders by age 138
A.8 Standard errors and 95% confidence intervalsfor prevalence of personality disorders by sex 140
A.9 Standard errors and 95% confidence intervalsfor prevalence of personality disorders by age 141
A.10 Standard errors and 95% confidence intervalsfor probable psychosis by sex, age andethnicity 142
A.11 Standard errors and 95% confidence intervalsfor prevalence of hazardous drinking by sexand ethnicity 143
A.12 Standard errors and 95% confidence intervalsfor prevalence of hazardous drinking by age 144
A.13 Standard errors and 95% confidence intervalsfor prevalence of alcohol dependence by sexand ethnicity 145
A.14 Standard errors and 95% confidence intervalsfor prevalence of drug use in last year by sex 146
A.15 Standard errors and 95% confidence intervalsfor prevalence of drug dependence by sex 147
A.16 Standard errors and 95% confidence intervalsfor number of disorders by sex 147
Appendix B
B.1 Alternative estimates of psychosis prevalence 150
List of tables continued
List of figuresChapter 1 Aims, concepts and methods1.1 Flow chart showing the organisation of the
sampling and interviewing procedures 121.2 Calculation of the symptom score for
anxiety from the CIS-R 161.3 Algorithm for generalised anxiety disorder 161.4 Topics covered by the AUDIT questionnaire 181.5 Topics included in the assessment of drug
dependence 19
Chapter 2 Prevalence of mental disorders and substance misuse
2.1 Proportion of adults with a score of two ormore on each neurotic symptom by sex 22
2.2 Distribution of CIS-R scores (grouped)by sex 23
2.3 Weekly prevalence of neurotic disordersby sex 25
2.4 Prevalence of personality disorder by sex(from clinical interviews) 26
2.5 Prevalence of probable psychotic disorderin the past year by age 27
2.6 Prevalence of hazardous drinking in thepast year by age and sex 28
2.7 Illicit drug use in the past year by sex 302.8 Prevalence of drug dependence in the past
year by age and sex 312.9 Number of mental disorders by age group 32
Chapter 4 Characteristics of adults with psychiatric disorders
4.1 Marital status of people with different typesof neurotic disorder 77
4.2 Percentage of people with physicalcomplaints by number of neurotic disorders 81
4.3 Age distribution by level of alcohol problem 83
Page
vii

viii
Notes to tables
1 Tables showing percentages
The row or column percentages may add to 99% or101% because of rounding.
The varying positions of the percentage signs andbases in the tables denote the presentation ofdifferent types of information. Where there is apercentage sign at the head of a column and the baseat the foot, the whole distribution is presented andthe individual percentages add to between 99% and101%. Where there is no percentage sign in the tableand a note above the figures, the figures refer to theproportion of people who had the attribute beingdiscussed, and the complementary proportion, toadd to 100%, is not shown in the table.
The following conventions have been used withintables:
- no cases0 values less than 0.5%.. data not available
2 Statistical significance
Unless otherwise stated, differences mentioned inthe text have been found to be statisticallysignificant at the 95% confidence level. Standarderrors that reflect the complex sampling design andweighting procedures used in the survey have beencalculated and used in tests of statisticalsignificance. Tables giving the standard errors forkey estimates are shown in Appendix A.
3 Small bases
Very small bases have been avoided whereverpossible because of the relatively high samplingerrors that attach to small numbers. In general,percentage distributions are shown if the base is 30or more. Where the base is lower, actual numbersare shown in square brackets.

ix
Acknowledgements
We would like to thank everybody who contributedto the survey and the production of this report. Wewere supported by our specialist colleagues in ONSwho carried out the sampling, field work andcomputing elements for the survey.
Particular thanks are due to Professor TerryBrugha, Jane Smith and the rest of the team at theUniversity of Leicester who were responsible forcarrying out the second stage interviews for thesurvey and to Professor Jeremy Coid who providedtraining in administering the SCID-II interview.
Great thanks are also due to all the ONSinterviewers who worked on the survey.
We were assisted at all stages of the survey by agroup of expert advisors who we would like tothank for the valuable specialist advice theyprovided. The group comprised:
Professor P Bebbington, University College, LondonProfessor T Brugha, University of LeicesterDr D Bhugra, Institute of Psychiatry, LondonProfessor J Coid, Forensic Psychiatry Research Unit,
St. Bartholemew's HospitalDr M Farrell, Institute of Psychiatry, LondonProfessor G Lewis, University of Wales, CardiffDr M Prince, Institute of Psychiatry, London
The project was steered by a group comprising thefollowing, to whom thanks are also due forassistance and advice given at various stages of thesurvey.
Ms J Davies (chair), Department of HealthMr J O’Shea (secretariat), Department of HealthMr R Bond, Department of HealthMr A Boucher, Department of HealthMs S Carey, Office for National StatisticsMr D Daniel, Department of HealthDr T Fryers, University of LeicesterDr S Gupta, Department of HealthDr A Higgitt, Department of HealthProfessor R Jenkins, Institute of Psychiatry, LondonDr D Jones, Department of HealthMs T Jones, National Assembly for WalesDr J Loudon, Scottish ExecutiveMr G Russell, Scottish ExecutiveMr J Sweeney, National Assembly for Wales
Most importantly, we would like to thank all theparticipants in the survey for their time and co-operation.

x

Summary of key findings
1Psychiatric Morbidity among Adults living in Private Households, 2000
Summary of key findings
Summaryof keyfindings
Aims, concepts and methods (Chapter 1)
● This survey of psychiatric morbidity among adults in private households was carried out in 2000 bythe Office for National Statistics on behalf of the Department of Health, the Scottish Executive andthe National Assembly for Wales. It is part of a series of such surveys among different populationgroups and is a repeat of the first survey in the series which was carried out in 1993.
● The aims of the survey were to:- estimate the prevalence of psychiatric morbidity according to diagnostic category among the
adult household population of Great Britain;- examine the varying use of services and receipt of care in relation to mental disorder;- identify the nature and extent of disability associated with mental disorder;- establish key current and lifetime factors which may be associated with mental disorder; and- to provide information on changes in the prevalence of disorder and related factors between
1993 and 2000.
● The survey covered people aged 16 to 74 years living in private households in England, Wales andScotland (including the Highlands and Islands).
● The sample was drawn from the small-user postcode address file using a two stage approach.Initially postcode sectors were stratified on the basis of socio-economic status within region and438 sectors selected with a probability proportional to size. Then, within each selected sector, 36addresses were randomly selected for inclusion in the survey. Interviewers visited each address toidentify private households with at least one person aged 16 to 74 years and then one person perhousehold was randomly selected for interview.
● Topics covered in the survey included: assessments of neurotic symptoms and disorders, psychoses,personality disorder, and substance misuse and dependence; general health and service use;intellectual functioning; suicidal thoughts and attempts and stressful life events; social networksand social support; activities of daily living and the need for informal care; socio-demographic andgeneral background data including employment, finances and accommodation.
● A two-stage approach to the assessment of disorder was used. Initial structured interviews werecarried out by ONS interviewers and lasted on average one and a half hours. These covered all thetopics listed above. A sub-sample of people were also asked to take part in a second-stage semi-structured clinical interview carried out by interviewers employed by the University of Leicester,which focussed on psychosis and personality disorder.
● Fieldwork took place between March and September 2000. Initial interviews were completed byover 8,800 individuals, a response rate of just under 70%. The response rate at the second stage was73% with over 600 second stage interviews being completed.

2 Psychiatric Morbidity among Adults living in Private Households, 2000
Summary of key findings
Summary - continued
Prevalence of mental disorders and substance misuse (Chapter 2)
● The most commonly reported neurotic symptoms among both men and women were sleepproblems, fatigue, irritability and worry (not including worry about physical health). Theproportions of all adults experiencing these symptoms ranged from 29% for sleep problems to 19%for worry. The next most frequently occurring symptoms were depression, poor concentration andforgetfulness, depressive ideas and anxiety, reported by about 10% of respondents. The symptomwith the lowest prevalence was panic (2%).
● About 1 in 6 adults were assessed as having a neurotic disorder in the week before interview (164cases per 1,000 adults). The most prevalent neurotic disorder among the population as a whole wasmixed anxiety and depressive disorder (88 cases per 1,000). Generalised anxiety disorder was nextmost commonly found (44 adults per 1,000). The remaining disorders (depressive episode,phobias, obsessive-compulsive disorder and panic) were less prevalent, ranging from 26 to 7 casesper 1,000.
● Prevalence rates were higher among women than men for all neurotic disorders except panic(7 cases per 1,000 for both men and women). The disparity between the rates for women and menwas significant for phobias (22 and 13 cases per 1,000 respectively) and mixed anxiety anddepressive disorder (108 and 68 cases per 1,000).
● The lowest prevalence rates of any neurotic disorder were found among older people, those aged65 to 69 (102 cases per 1,000) and 70 to 74 (94 cases per 1,000).
● The highest prevalence rates for any neurotic disorder, around 200 cases per 1,000, occurred in thethree groups aged between 40 and 54. For men the prevalence of any neurotic disorder peaked inthe 45 to 49 age group at 204 cases per 1,000. Among women the highest prevalence was found inthe 50 to 54 age group (246 cases per 1,000).
● The prevalence of any personality disorder, based on the results of the second-stage SCID-IIclinical interviews, was 54 per 1,000 men and 34 per 1,000 women.
● The prevalence rate for probable psychotic disorder in the past year was 5 per 1,000 adults aged 16to 74. The rate among women was 5 per 1,000 and among men, 6 per 1,000.
● One quarter of informants were assessed as having a hazardous pattern of drinking during the yearbefore interview using the Alcohol Use Disorder Identification Test (AUDIT) (i.e. they had anAUDIT score of 8 or above). The prevalence of hazardous drinking was higher among men (38%)than among women (15%).
● Prevalence of hazardous drinking decreased with age, though there were differences between sexes.For women, prevalence was highest in the group aged from 16 to 19 years (32%), whereas for menthe peak was found among those aged 20 to 24 (62%).
● Respondents who identified themselves as White had higher prevalence rates of hazardousdrinking than those who did not. Overall, 27% of White adults had an AUDIT score of 8 or more,compared with 18% of Black and 8% of South Asian adults.

Summary of key findings
3Psychiatric Morbidity among Adults living in Private Households, 2000
Summary - continued
● The prevalence of alcohol dependence in the 6 months before interview was assessed using theSeverity of Alcohol Dependence questionnaire (SAD-Q). The prevalence of alcohol dependencewas 74 per 1,000 among the overall population, 119 per 1,000 among men and 29 per 1,000 amongwomen.
● Overall, 13% of men and 8% of women aged 16 to 74 reported using illicit drugs in the year priorto interview. Cannabis was the drug mentioned most commonly by both men and women (10%overall), while amphetamines, cocaine and ecstasy were the next most frequently mentioned byboth groups (2% overall, for each drug).
● Prevalence of illicit drug use decreased markedly with age. Prevalence of any illegal drug use in theyear prior to interview was highest in the 20 to 24 year age groups, both for men (37%) and women(29%). Drug use in the past year declined markedly between the ages of 25 and 40, with prevalenceroughly halving in each successive five-year age group. Beyond the age of 45 the proportion ofadults who reported drug use in the previous year tailed off to between 2% and 1%.
● The London region stood out as the region with the highest proportion of people reporting use ofillegal drugs in the previous year. The prevalence of illegal drug use was 16% in London, comparedwith 11% in Great Britain as a whole. Among women the prevalence of illegal drug use in the pastyear was almost double the national average (15% compared with 8%), while among men thedifference was smaller (18% compared with 13%).
● For eight of the main drug types used (cannabis, amphetamines, crack, cocaine, ecstasy, opiates,tranquillisers and volatile substances, such as glue), a series five questions were asked to measuredrug dependence. A positive response to any of the five questions was used to indicate drugdependence, quite a low threshold. People who are habitual users (i.e. daily users for a fortnight ormore) or who have developed some tolerance for the drug, so require more to get the same affect,will be assessed as dependent. Amongst all respondents, the prevalence of dependence on any ofthe drugs considered here was 37 per 1,000 in the population aged 16 to 74.
● As with the prevalence of drug use, the highest prevalence rates of any drug dependence werefound among those between 20 and 24 years of age. Within this group nearly one in ten womenand two in ten men were assessed as drug dependent (94 and 199 cases per 1,000, respectively).
Trends in prevalence of mental disorders and substance misuse (Chapter 3)
● The 2000 psychiatric morbidity survey is a repeat of a survey carried out in 1993. Both surveys wereconducted among adults living in private households in Great Britain and used a similar samplingapproach and covered a similar range of disorders. However, there were some changes in surveymethods and coverage between the two. In 2000, the upper age limit for respondents was extendedfrom 64 to 74. Therefore, to permit comparison, only data relating to those adults aged 16 to 64 inthe 2000 survey are considered in this section.
● The proportions of all adults aged 16 to 64 experiencing neurotic symptoms in 2000 were similar tothose found in 1993. The differences in the prevalence of most symptoms were not statisticallysignificant and where significant differences did occur they tended to be relatively small. Thelargest difference was found with the number of adults reporting sleep problems, the mostcommon type of neurotic symptom. In 1993, 21% of men and 28% of women reportedexperiencing problems with sleep. In 2000, the equivalent figures were 24% and 34%.

4 Psychiatric Morbidity among Adults living in Private Households, 2000
Summary of key findings
Summary - continued
● There was no significant change in the overall rates for any neurotic disorder for all adults: in 1993the proportion of adults with at least one neurotic disorder was 16% or 163 per 1,000, while in 2000the proportion was 17% (173 per 1,000). However, there was a slight but significant increase in theprevalence of neurotic disorder among men, from 126 per 1,000 in 1993 to 144 per 1,000 in 2000.
● The overall prevalence of psychotic disorder, applying the approach for ascertaining cases used in1993, was the same in 1993 and 2000: 4 cases per 1,000 adults aged 16 to 64 years.
● In 1993 indications of any illicit drug dependence were identified in 2% of the population. In2000 prevalence was considerably higher, drug dependence being identified in 4% of adults aged16 to 64. Both the proportions of men and women exhibiting signs of drug dependenceapproximately doubled over the seven-year period, rising to 6% among men and 2% amongwomen. This increase roughly parallels the reported increase in drug use observed between the1993 and 2000 surveys.
Characteristics of adults with psychiatric disorders (Chapter 4)
● Compared with people with no neurotic disorder, those assessed as having a neurotic disorderwere more likely to be women (59% compared with 48% of those without a disorder), agedbetween 35 and 54 (45% compared with 38%), separated or divorced (14% compared with 7%)and living as a one person family unit (20% compared with 16%) or as a lone parent (9%compared with 4%).
● Among those with neurotic disorders, 58% were employed and 39% were economically inactive,compared with 69% of those with no disorder who were employed and 28% who wereeconomically inactive. The proportion of unemployed was similar for both groups.
● Having a neurotic disorder substantially increased the likelihood of reporting one or morephysical complaints. There was a clear relationship between the number of neurotic disorderspresent and the reporting of a physical complaint. Just under two-fifths of adults with no neuroticdisorder (38%) reported having a physical complaint. This rose to over half (57%) of those withone neurotic disorder while among those with two or more neurotic disorders, two-thirds (67%)reported at least one physical complaint.
● People with probable psychotic disorder compared with those without psychosis were more likelyto be separated or divorced (29% compared to 8% of those without disorder) and living in a oneperson family unit (43% compared with 16%). They were less likely to be married or cohabiting,only 39% of those with probable psychosis were married or cohabiting compare with 66% ofthose without disorder.
● Compared with people who did not have a psychotic disorder those with probable psychosis weremore likely to have low educational qualifications (84% had qualificatons no higher than GCSE levelcompared with 63% of those with no psychotic disorder), be in Social Class IV or V (39% comparedwith 22%) and be economically inactive (70% compared with 30%).They were also more likely tolive in accommodation rented from a local authority or housing association (49% compared to 17%of those without psychotic disorder) and live in an urban area (88% compared with 66%).
● People assessed as probably having a psychotic disorder were more likely than those without toreport a longstanding physical health problem. Overall, 62% of those with probable psychosisreported a physical complaint compared with only 42% of those without this disorder.

Summary of key findings
5Psychiatric Morbidity among Adults living in Private Households, 2000
Summary - continued
● Men comprised two thirds of those with hazardous levels of alcohol consumption (67%) and four-fifths (80%) of those dependent on alcohol, compared with only 43% of those with no alcoholproblem.
● There was a clear inverse association between hazardous alcohol use and the age of the respondent.Among respondents who were dependent on alcohol, 30% were aged under 25, compared with21% of those with a hazardous pattern of drinking but no dependence and 12% of those with noalcohol problem.
● Among those judged to be dependent on alcohol, fewer than half (45%) were married orcohabiting, compared with 60% of those with hazardous but non-dependent levels of alcoholconsumption and 69% of those whose level of consumption was not hazardous. This is likely to belinked to the relationship between age and level of alcohol consumption.
● Those dependent on drugs had a much younger age profile than those not dependent – 46% ofthose with signs of dependence on cannabis only and 54% of those dependent on other drugs wereunder 25, compared with only 14% of adults who were not drug dependent. They were also morelikely to be single, 57% of those assessed as dependent on cannabis and 65% of those dependent onother drugs, compared with 21% of those not dependent on drugs. This would be expected giventhe younger age profile of those dependent on drugs.
● Those dependent on drugs were more likely to be unemployed than people with no drugdependence, 11% of people with signs of cannabis dependence and 10% of those dependent onother drugs were unemployed, compared with 3% of those not dependent on drugs.
Treatment and service use (Chapter 5)
● Just under a quarter (24%) of people assessed as having a neurotic disorder were receivingtreatment of some kind for a mental or emotional problem at the time of interview. A fifth (20%)were taking medication, while 9% were having counselling or therapy. A small proportion, 4%,were receiving both forms of treatment.
● The proportion receiving treatment rose with the number of neurotic disorders present. Amongpeople with no neurotic disorder, 4% were receiving treatment, compared with just under a fifth(19%) of those with one neurotic disorder, and over half (54%) of those with two or moredisorders.
● Those with neurotic disorders were 6 times as likely as those without neurotic disorder to be takingpsychoactive medication (20% compared with 3% without neurotic disorder). The proportion ofrespondents receiving psychoactive medication increased substantially with the number ofneurotic disorders, from 16% among people with one disorder to 47% of those with two or moredisorders.
● Just under a tenth (9%) of people with neurotic disorders were receiving counselling or therapy,compared with 1% of those with no neurotic disorder.
● In the year before interview almost two-fifths of those with neurotic disorders (39%) had spoken totheir GP about a mental or emotional problem, compared with 6% of those without a neuroticdisorder.

6 Psychiatric Morbidity among Adults living in Private Households, 2000
Summary of key findings
Summary - continued
● Among respondents assessed as having a neurotic disorder, 16% had used one or more of thecommunity care services in the last year, compared with 4% of those with no neurotic disorder. Inthe three months before interview, 8% of those with a neurotic disorder had used community careservices, compared with 2% of those with no disorder.
● Eighty-five per cent of those with a probable psychotic disorder were having treatment at the timeof interview, compared with only 7% of those with no psychotic disorder. Over four-fifths of thisgroup (84%) were receiving medication compared with 6% of those without a psychotic disorder,while two fifths (40%) were receiving counselling or therapy.
● In the year before interview, 71% of informants who were judged to be probably psychotic hadspoken to their GP about a mental or emotional problem, compared with 11% of those withoutpsychosis.
● Visits to outpatient departments for treatment or check-ups for mental or emotional problemswere very uncommon among those with no psychotic disorders, while 28% of those with probablepsychotic disorders had made one or more such visits in the 3 months prior to interview.
● Overall, over half (51%) of those judged to have a psychotic illness had used one or more of thespecified community care services in the previous twelve months, compared with only 6% of non-psychotic informants. Among the group judged probably psychotic, the most frequently usedservice was community psychiatric nursing, used by 30% of those with a probable psychosis, but byless than half a per cent of other respondents.
● Respondents with probable psychotic disorders were also heavy users of day activity services. In thetwelve months before interview, 37% of them had used one or more day activity services,compared with 1% of respondents without psychosis. The service most likely to be used was acommunity mental health centre, used by 31% in the previous year and 16% in the previousquarter.
● People with drug dependence were more likely than those without to report having consulted theirGP in the year before interview. Among the group who were dependent on other drugs with orwithout cannabis 27% had seen their GP in the previous 12 months as had 18% of those with signsof dependence on cannabis only. Among those not dependent on drugs only 11% had done so.

7Psychiactric Morbidity among Adults living in Private Households, 2000
1Aims, concepts and methods
Aims, concepts and methods11.1 Background, aims and coverage of the
survey
1.1.1 Background
Mental illness was identified as one of the key areasfor action in The Health of the Nation, a WhitePaper published by the Department of Health inJuly 1992 (Department of Health, 1992) andsubsequently in Our Healthier Nation (Departmentof Health, 1999a) and The NHS Plan (Departmentof Health, 2000). Frameworks for action have beenset out in the Health of the Nation Mental IllnessKey Area Handbook (Department of Health, 1994),The Spectrum of Care (Department of Health,1996) and most recently in the National ServiceFramework for Mental Health (Department ofHealth, 1999b).
To provide information to support and monitorthese initiatives, a series of national surveys ofpsychiatric morbidity have been carried out byONS (formerly OPCS) over the past decade,commissioned by the Department of Health, theScottish Executive and the National Assembly forWales. These surveys covered a wide range ofdifferent population groups:
• adults aged 16 to 64 living in private households(Meltzer et al, 1995a, b, c);
• residents of institutions specifically catering forpeople with mental health problems: hospitals,nursing homes, residential care homes, hostels,group homes and supported accommodation(Meltzer et al, 1996a, b, c);
• homeless adults living in hostels, nightshelters,private sector leased accommodation or rooflesspeople using day centres (Gill et al, 1996);
• adults known by services to have a psychoticdisorder (Foster et al, 1996);
• prisoners (Singleton et al, 1998); and• children and adolescents (Meltzer et al, 2000).
The results from these surveys of psychiatricmorbidity have shown the value of using the samepsychiatric assessment procedures and having thesame or similar questions on medication, serviceuse, social functioning etc. for all populations. The
survey covered in this report was carried out in2000 and is a repeat of the first survey of adultsliving in private households. However, the surveyincluded a number of developments, which aredescribed in more detail below. Most notably, therewas a slight increase in the age range, so that itcovered people aged 16 up to 74 years, andmeasures of personality disorder and intellectualfunctioning were included.
The supplementary survey of people likely to besuffering from a psychotic illness and living in thecommunity has also been repeated and the resultswill be published in a separate topic reportfocusing on people with psychotic disorder. Thisreport will include data collected in both the mainand supplementary survey.
1.1.2 Aims of the survey
The main aim of the survey was to collect data onthe prevalence of mental health problems amongadults aged 16 to 74 years living in privatehouseholds in Great Britain. These data will becompared with corresponding data from theprevious OPCS/ONS surveys of psychiatricmorbidity.
More specifically, the survey aimed to:
• estimate the prevalence of psychiatric morbidityaccording to diagnostic category among theadult household population of Great Britain.
The choice of diagnostic categories had to be acompromise between what would betheoretically preferred and what can be reliablycollected from a social survey interview with alimited sample size and where the incidence ofsome psychiatric illness is rare. Prevalence ratesfor neurotic symptoms as well as diagnoses havebeen calculated because of the relationshipbetween the presence of symptoms, socialdisabilities and the need for services. Apart fromthe mental disorders covered in all the earliersurveys, neurosis, psychosis, alcohol misuse anddrug dependence, the survey also included

8 Psychiatric Morbidity among Adults living in Private Households, 2000
Aims, concepts and methods1assessments of personality disorder anddeliberate self-harm, as in the survey ofprisoners, and a measure of intellectualfunctioning. Prevalence data are presented byage, sex, ethnicity and region;
• examine the varying use of services (includingmedication) and the receipt of care in relationto mental disorders and their related socialdisabilities. The range of services considered issimilar to the first survey but with a greateremphasis on use of and satisfaction withprimary care;
• identify the nature and extent of disability anddisadvantage associated with mental illness.Topics covered here include employment,accommodation, income and debt, as well associal networks and perceived social support;
• establish key, current and lifetime factors whichmay be associated with mental disorders, suchas life course factors, eg abuse as a child, playingtruant or being suspended/expelled fromschool, leaving school early with noqualifications, having been in local authoritycare, and recent stressful life events; and
• examine the changes in the prevalence ofdisorders and related factors between 1993 and2000.
1.1.3 Coverage of the survey
RegionThe surveyed population included adults living inprivate households in England, Wales and Scotland(including the Highlands and Islands).
AgeThe survey focused on adults aged 16 to 74 years.Children, defined as those under the age of 16, hadbeen covered in an earlier survey using instrumentsand procedures appropriate to that age group(Meltzer et al, 2000). Surveys of psychiatric morbidityamong elderly people also require differentassessment instruments, sampling and interviewingprocedures. Dementia is common in this group andan appreciable proportion are living in residential carehomes. Therefore, those aged 75 and above were alsoexcluded from the current survey.
Place of residenceThe survey covered only adults resident in privatehouseholds included in the small user PostcodeAddress File (PAF). A small proportion of adults inthe age range 16 to 74 years will be residentelsewhere, for example in institutions or othercommunal establishments or may be homeless.However, many of these groups have been coveredin the earlier surveys of psychiatric morbidity.
1.1.4 Coverage of this report
The main purpose of this report is to present theprevalence rates of psychiatric morbidity amongadults aged 16 to 74 living in private households inGreat Britain in 2000 and to provide a briefoverview of the survey findings. In order tointerpret the results, it is important to have anunderstanding of the conceptual approach and themethods used in the survey. These are described inthe remainder of this chapter.
The prevalence rates for the different mental disorderscovered in the survey are described in Chapter 2. InChapter 3, the results from this survey are comparedwith those found in 1993 taking account of thechanges in methods used (see section 1.3). In Chapter4 people with different types of mental disorder arecompared with those without disorder on a range ofsocio-demographic factors and health statusmeasures, while Chapter 5 looks at the variation inmedication and service use among these same groups.
1.1.5 Plans for later reports
Because of the wealth of information collected in thesurvey and the wide range of mental disorderscovered, a single report cannot adequately describethe data collected and a series of reports are planned:
• this main report of key survey findings;• a short summary report; and• a technical report giving details of the
questionnaire, assessment procedures, samplingand weighting procedures.
A number of other reports are also plannedfocusing in more detail on the following topics:
• psychotic disorder;• personality disorder;
9Psychiactric Morbidity among Adults living in Private Households, 2000
1Aims, concepts and methods
• suicidal thoughts and behaviours;• substance use and misuse: tobacco, alcohol and
other drugs;• the cognitive and mental health of older people
(defined for the purpose of this survey as thoseaged 60 to 74 years); and
• the social and economic circumstances ofpeople with mental disorder.
1.1.6 Access to the data
Anonymised data from the survey will be lodgedwith the Data Archive, University of Essex, within 3months of the publication of this report.Independent researchers who wish to carry outtheir own analyses should apply to the Archive foraccess. For further information about archiveddata, please contact:
The Data ArchiveUniversity of EssexWivenhoe ParkColchesterEssex CO4 3SQTel: (UK) 01206 872001FAX: (UK) 01206 872003Email: [email protected].
1.2 Sampling and interviewing procedures
The survey was carried out between March andSeptember 2000. A two-stage approach to theassessment of mental disorders was used. The firststage interviews were carried out by ONSinterviewers and included structured assessmentand screening instruments for measuring mentaldisorders, as well as covering a range of othertopics, such as service use, risk factors for disorderand background socio-demographic factors. A sub-sample of people were then selected to take part ina second stage interview to assess psychosis andpersonality disorder, the assessment of whichrequires a more detailed interview than waspossible at the first stage and some clinicaljudgement. These interviews were carried out byspecially trained psychologists employed by theUniversity of Leicester. More details of the topicscovered and the assessment instruments used in thetwo stages are given in section 1.3.
1.2.1 Sampling procedures for the initial interview
The small users postcode address file (PAF) wasused as the sampling frame for the survey becauseof its good coverage of private households in GreatBritain. In the PAF, the postcode sectors werestratified on the basis of socio-economic groupwithin NHS Region.
Initially, 438 postal sectors (the primary samplingunits) were selected with a probability proportionalto size (number of delivery points). This included370 sectors in England, 22 in Wales and 46 inScotland. This included a slight oversampling inScotland to increase the sample size to ensure somesampling in the Highlands and Islands Region. Apostal sector contains on average 2,550 deliverypoints. Within each of these sectors, 36 deliverypoints were selected (with the exception of onesector which was accidentally sampled twice),yielding a sample of 15,804 delivery points. Thissample design was similar to that used in the 1993survey of psychiatric morbidity among adults inprivate households but was less ‘clustered’, i.e. moreprimary sampling units were selected (438 in 2000compared with 200 in 1993) with fewer deliverypoints in each cluster (36 compared with 90 in1993). The survey is thus able to provide estimateswith a similar level of precision to the 1993 surveywith a slightly smaller sample size.
Interviewers visited the 15,804 addresses to identifyprivate households with at least one person aged 16to 74 years. The Kish grid method was used toselect systematically one person in each household(Kish, 1965). More details of sampling procedurescan be found in the Technical Report.
1.2.2 Organisation of the initial interview
The selected adult in each household was asked totake part in an initial interview carried out by ONSinterviewers, which lasted on average 11/2 hours.The interview included sections on all topicscovered in the survey. The interview usedComputer-Assisted Personal Interviewing (CAPI)using a questionnaire programmed in Blaise. Therewere two self-completion sections – the personalitydisorder screen and alcohol and drug use anddependence – in which respondents entered theirresponses directly into the computer. A smallnumber of people asked for assistance with these

10 Psychiatric Morbidity among Adults living in Private Households, 2000
Aims, concepts and methods1sections and in these cases interviewers either readthe questions out and the respondent entered theirown responses or the interviewer both read out thequestions and entered the responses.
1.2.3 Interviewing procedures
A small pilot survey was undertaken to test thequestionnaire and interviewing procedures. Thisshowed that the questionnaire content was basicallyacceptable but that it was too long (in the pilot, theaverage interview length was about 2 hours). As aresult several sections were removed from thequestionnaire or trimmed down.
The ONS interviewers who were selected to carryout the initial interviews were generallyexperienced interviewers, many of whom hadworked on previous surveys of psychiatricmorbidity. They were all given a one-day course ofsurvey-specific training covering: how to introducethe survey, the content of questionnaire,confidentiality, and what to do should a respondentbecome distressed.
Each interviewer was allocated a quota of 36addresses to complete within a month. Advanceletters were sent to all addresses explaining thatthey had been selected for the survey, giving somebasic information about the survey and tellingthem that an interviewer would be calling to tellthem more about the survey and asking them ifthey would be willing to be interviewed.
In a few cases it was not possible to carry out aninterview with the respondent even though therespondent was willing to take part. For example, insome cases informants were too ill, had speech orhearing problems, had language problems, or wereaway the entire month of the field period. In suchcircumstances, where possible, proxy informationwas collected to allow the identification of potentialbias as a result of excluding these people. The proxyinformation included some information on thehealth of the respondent and medication and serviceuse together with some basic socio-demographicinformation.
The nature of the interview does not readily permitthe use of an interpreter for informants who have
problems understanding English. This is becausemany of the concepts do not have equivalent termsin other languages. However, a separate survey hasbeen commissioned to investigate the prevalence ofmental health problems in a number of ethnicminority groups which has been conducted by theNational Centre for Social Research.
1.2.4 Sampling and interviewing procedures for thesecond stage interviews
All respondents who completed an initial interviewwere asked if they would be willing to be contactedagain if selected take part in a second stage. Asecond stage sample was then drawn to includepeople as follows:
• all respondents who satisfied one or more of thesift criteria (see section 1.3.3) for psychoticdisorder (regardless of whether or not theysifted positive for personality disorder as well);
• half of those who sifted positive for anti-socialand borderline personality disorder with noevidence of psychotic disorder;
• 1 in 14 of those who sifted positive for otherpersonality disorders with no evidence ofpsychotic disorder; and
• 1 in 14 people who showed no evidence ofeither psychosis or personality disorder.
However, only those who agreed to being contactedfor a second stage interview were then included inthe second stage of the survey.
The second stage interviews were carried out by7 psychologists who had received training andclinical experience in the use of the SCAN andSCID interviews extending over a month. Theywere supervised throughout the fieldwork periodby an experienced field manager to providequality assurance and standardisation. Theycontacted the selected respondents by telephone,where a number had been provided at the timeof the initial interview, to arrange an interviewor, if necessary, called round when they were inthe area. A total of 1,036 respondents wereselected for the second stage of the survey ofwhom 874 agreed to being approached for asecond interview.

11Psychiactric Morbidity among Adults living in Private Households, 2000
1Aims, concepts and methods
1.2.5 Results of the sampling procedures
Figure 1.1 summarises the survey procedures andshows the numbers involved at the different stages.Overall, 10% of sampled addresses were ineligiblebecause they contained no private households. Ofthe remaining addresses, 11% contained no-onewithin the eligible age range, which left an eligiblesample of 12,792 addresses. (Table 1.1)
The proportion of selected adults who agreed totake part in an initial interview is shown in Table1.2. At the initial interview stage, just under 70% ofthose approached agreed to take part in aninterview. Despite the length of the interview, thevast majority of respondents (95%) completed thefull interview. (Table 1.2)
Of the 874 people included in the second stage ofthe survey 638 were interviewed. The majority of these (96%) completed both SCAN and SCID
interviews. (Table 1.3)
1.3 Concepts and methods used in assessingpsychiatric morbidity
Estimates of the prevalence of psychiatricmorbidity depend on the choice of concepts andthe methods used. These, in turn, depend on theparticular purposes and aims of the study. Thispoint needs emphasising because it means thatestimates from the ONS study of psychiatricmorbidity among adults in private households willnot necessarily be comparable with those obtainedfrom other studies using different concepts andmethods.
The rules of classification systems, such as theInternational Classification of Diseases (ICD), areintended to set thresholds of disease severity thatequate to levels that a psychiatrist would regard as acase likely to require clinical assessment andtreatment. However, people with symptoms belowthis threshold may still suffer distress andimpairment of functioning. Most of theinstruments used in this study produce a symptomscore which reflects the severity of symptoms,thresholds are then set to identify those that meetthe criteria for ‘caseness’ according to diseaseclassification systems. However, in many cases wepresent both the grouped scores, which give anoverall indication of the severity of symptoms, aswell as the proportion in each diagnostic category.
Table 1.3 Response at the second-stage
Number %
Full or partial 1st stage interviews 8580 100Selected for second stage 1036 12
Selected for second stage 1036 100Refused approach about 2nd interview
162 16Not issued – ran out of field timeSet sample for second stage 874 84
Set sample for second stage 874 100Refusals/non-contacts 236 27Second stage interviews completed 638 73
Second stage interviews completed 638 100SCAN interview only 12 2SCAN and SCID interview 611 96SCID interview only 15 2
}
Table 1.2 Response of adults at initial interview stage
Number %
Set sample of households 12,792 100Refusals 3,009 24Non-contacts 782 6Incapable 115 1Co-operating adults 8,886 69
Co-operating adults 8,886 100Full interviews 8,450 95Partial interviews 130 1Proxy interviews 296 3Data lost/deleted 10 0
Table 1.1 Households eligible for interview
Number %
Sample of addresses 15,804 100Vacant premises 817 5Institution/business premises 215 1Demolished/no trace of address 257 2Second homes, foreign diplomats etc 230 1Private household addresses 14,285 90
Private household addresses 14,285Extra households found 149Total number of households 14,434 100Household with no-one aged 16 to 74 1,642 11Households eligible for interview 12,792 89

12 Psychiatric Morbidity among Adults living in Private Households, 2000
Aims, concepts and methods1Figure 1.1: Flow chart showing the organisation of the sampling and interviewing procedures
290 issued forsecond stage
interview
144 issued forsecond stage
interview
117 issued forsecond stage
interview
323 issued forsecond stage
interview
375 screenedpositive for psychosis
(+/- PD)
341 screenedpositive for antisocial
or borderline PDwithout psychosis
1,925 screenedpositive for other PD
without psychosis
5,939 screenednegative for both PD
and psychosis
▼
▼
▼▼ ▼▼
▼▼
▼
▼
15,804 addresses in GreatBritain selected from PAF
12,792 eligible householdsfound at these addresses
8,886 adults completed aninitial interview
(including 296 proxy interviews)
638 second stageinterviews completed
▼

13Psychiactric Morbidity among Adults living in Private Households, 2000
1Aims, concepts and methods
Another source of variation in estimates fromdifferent surveys is in the type of interviewersused and the extent to which clinical judgementis required by the measurement instrumentsused. Clinically trained interviewers, such aspsychiatrists, may use clinical judgement basedon their training and experience to assesswhether the symptoms a respondent describesare an indication of disorder. Lay interviewersusing structured measurement instrumentssimply record a respondent’s answers withoutmaking any judgement as to whether the severityis sufficient to be considered abnormal.Therefore, lay interviewer administered measurestend to provide higher prevalence rates fordisorders than those that are clinicianadministered (Brugha et al, 1999).
1.3.1 Coverage of disorders
All diagnostic categories of mental disorderincluded in the survey are given an ICD-10 or, forpersonality disorder, a DSM-IV classification(World Health Organisation, 1993; AmericanPsychiatric Association, 1994).
ICD-10 lists ten broad categories of diagnoses(World Health Organisation, 1992), shown in Table1.4. The disorders covered in this survey are thosewithin the four broad categories of F20-29, F30-39,F40-48 and F60-69 Although neurotic disorders areincluded (F40-48), some stress-related andsomatoform disorders – acute stress reaction, post-traumatic stress disorders, adjustment disorders,dissociative (conversion) disorders andsomatoform disorders – are not specificallymeasured. However, any psychological distress dueto these less common neurotic disorders is likely tobe reflected in the overall score level on the CIS-Rand therefore in the catch-all category of mixedanxiety and depression (described below).This survey gives estimates of the prevalence ofpsychiatric morbidity in general and of specificdiagnostic categories. The choice of diagnosticcategories has been determined by what can bereliably collected from a social survey interviewwhere the incidence of some psychiatric illness israre. The disorders covered in the survey comprisethose listed in the second column of Table 1.4.
The term ‘Depressive episodes and disorders’ (F32-33)is equivalent to the term ‘Depressive episode’ used
Table 1.4 ICD-10 categories of disorder and their coverage in the survey
ICD-10 categories of disorder Disorders covered in this survey
F00 - F09 Organic Mental DisordersF10 - F19 Mental and behavioural disorders due to psychoactive
substance useF20 - F29 Schizophrenia, schizotypal and delusional disorders
F30 - F39 Mood (affective) disorders
F40 - F48 Neurotic, stress-related and somatoform disorders
F50 - F59 Behavioural syndromes associated with physiologicaldisturbances and physical factors
F60 - F69 Disorders of adult personality and behaviour
F70 - F79 Mental retardationF80 - F89 Disorders of psychological developmentF90 - F98 Behavioural and emotional disorders with onset usually
occurring in childhood and adolescence
F20- F29 Schizophrenia, schizotypal and delusional disordersF20 SchizophreniaF21-29 Other non-organic functional psychosesF30-F39 Mood (affective) disordersF30 Manic episodeF31 Bipolar affective disorderF32-33 Depressive episodes and disorders (mild, moderate and
severe)F40-F48 Neurotic, stress-related and somatoform disordersF40 Phobias (agoraphobia, social phobia and specific isolated
phobia)F41.0 Panic disorderF41.1 Generalised Anxiety DisorderF41.2 Mixed anxiety and depressive disorderF42 Obsessive Compulsive Disorder
F60-69 Disorders of adult personality and behaviourF60 Specific personality disorders
14 Psychiatric Morbidity among Adults living in Private Households, 2000
Aims, concepts and methods1in the earlier surveys of psychiatric morbidity. Theinstrument used to measure neurotic disorder, therevised Clinical Interview Schedule (CIS-R), doesnot distinguish between recurrent and first onsetepisodes and the code F32 used in the earlier reportswould have also included code F33. Mixed anxietyand depressive disorder has an ICD code of F41.2but no recommended operational criteria: it was alsoused as the ‘catch all’ category, i.e. for people with ascore of 12 or more on the CIS-R who did not meetcriteria for any of the other six diagnostic categoriesfor neurotic disorders (Lewis et al, 1992). Thisfollowed the practice in the 1993 ONS (OPCS)survey of psychiatric morbidity of adults living inprivate households (Meltzer et al, 1995a).
The survey also collected data on alcohol misuse anddrug dependence and on intellectual functioning.Dementia, eating and sexual disorders were notcovered, at least to an extent that would allow us topresent reliable estimates of their prevalence.
1.3.2 Concepts
Period prevalenceThis survey aimed to establish the prevalence ofmental health problems during a particular periodprior to interview. This time period is not the samefor each disorder and is subject to various criteria.
• Criteria imposed by the measurementinstrument.The instrument we used for the assessment ofneurosis, the revised Clinical Interview Schedule(CIS-R), asks for the presence of symptoms inthe past month and measures their severity,
Table 1.5 Time periods used for different sections of the SCAN interview
Section Time period 1 Time period 2
Neurosis Present state/present episode Week preceding the initial (lay) interview
Psychosis Present state/present episode Past year
Alcohol and drugs Past year Lifetime before
frequency and duration in the past week (Lewiset al, 1992).
• Criteria chosen by the research team.The instrument used for assessing psychosis wasSCAN (Schedules for Clinical Assessment inNeuropsychiatry) (Wing et al, 1990; WorldHealth Organisation, 1999). This assessespresent state. The period that this covers can beset beforehand: the past month, six months orpast year. SCAN also allows for ratings to bemade for two time periods. Table 1.5 belowshows the time periods used in this survey forthe different sections of the SCAN interviews.
• Criteria contingent on the nature of thedisorder itself.Personality disorder, by definition, covers theperson’s lifetime or, at least, all the years ofadulthood.
Co-occurrence of disordersInstruments used for clinical assessments ofpsychiatric disorders often allow for severalpossible diagnoses to be made. Although it wouldbe possible to impose a hierarchy among differentdisorders and, in some cases, there is a hierarchyinherent in the way in which cases are assigned todiagnostic categories (eg mild, moderate and severedepression are mutually exclusive categories), theprevalence rates presented in this report do nothave a hierarchy imposed on them. This is achange in reporting practice from the 1993household survey which will faciltiateconsideration of the co-ocurrence of disorder. Asa result of this change in the way the data ispresented, individuals with multiple diagnosescan be represented in several groups.

15Psychiactric Morbidity among Adults living in Private Households, 2000
1Aims, concepts and methods
1.3.3 Choice of measurement instruments forparticular disorders
Different strategies were used to obtain prevalenceestimates of psychiatric morbidity depending onwhether full assessments could be made in theinitial interviews carried out by ONS interviewers(neurotic disorders and alcohol and drug misuse)or would require a second stage clinical interviewerfor assessment (schizophrenia and other functionalpsychoses and personality disorder). The initialinterviews contained questions that had beenfound in earlier surveys to be strongly associatedwith the presence of psychotic disorder. Allrespondents who answered positively to any one ofthese questions were asked to take part in a secondstage interview. The initial interview also includeda self-completion screening instrument forpersonality disorder and a proportion of those whoscreened positive on this instrument wererandomly selected for second stage clinicalinterviews together with 1 in 14 people whoscreened negative for both psychosis andpersonality disorder. More details of the samplingprocedures for the second stage interviews aregiven in section 1.2.2.
The instruments used for assessing the prevalenceof the main types of disorder covered in the surveyare shown in Table 1.6.
The main features of the instruments used for theassessment of each disorder are given below with
further details in the Technical Report which willbe available on the National Statistics Website atwww.statistics.gov.uk.
Neurotic symptoms and disordersNeurotic symptoms and disorders in the weekpreceding interview were assessed in the first stagelay interviews using the revised version of theClinical Interview Schedule (CIS-R). Data arepresented on the prevalence of 14 neuroticsymptoms, six neurotic disorders, and thedistribution of total CIS-R scores, which give anindication of severity of symptoms.
The CIS-R comprises 14 sections, each covering aparticular area of neurotic symptoms:
Somatic symptomsFatigueConcentration and forgetfulnessSleep problemsIrritabilityWorry about physical healthDepressionDepressive ideasWorryAnxietyPhobiasPanicCompulsionsObsessions
Table 1.6 Instruments used to assess mental disorder in the survey
Topic Lay/clinical Assessment instrument Referenceinterview
Personality Clinical interview Structured Clinical Interview for DSM-IV (SCID-II) First et al (1997)disorder
Psychotic Clinical and lay Schedules for Clinical Assessment in Neuropsychiatry (SCAN) World Health Oroganisationdisorder interview (version 2.1) and algorithm using lay interview data for non-responders (1999)
Neurotic Lay interview Clinical Interview Schedule – Revised (CIS-R) Lewis and Pelosi (1990);disorder Lewis et al (1992)
Alcohol Lay interview Alcohol Use Disorders Identification Test (AUDIT); Severity of Alcohol Babor et al (1992);misuse Dependence Questionnaire (SAD-Q) Stockwell et al (1983)
Drug dependence Lay interview Five questions taken from the ECA study and used in other ONS Robins and Regier (1991)(OPCS) psychiatric morbidity surveys

16 Psychiatric Morbidity among Adults living in Private Households, 2000
Aims, concepts and methods1Each section begins with a number of mandatoryfilter questions. They establish the existence of aparticular neurotic symptom in the past month. Apositive response leads to a more detailedassessment of the symptom in the past week:frequency, duration, severity, and time since onset.Answers to these questions determine theinformant’s score on each section. Possible scoresrange from zero to 4 on each section (except thesection on depressive ideas, which has amaximum score of 5). The example in Figure 1.2,shows the elements that contribute to the scorefor anxiety. Any combination of the elementsproduce the section score. The elements thatcontribute to the scores for each of the symptomscan be found in the Technical Report of thesurvey.
Diagnoses of specific neurotic disorders areobtained by looking at the answers to varioussections of the CIS-R and applying algorithmsbased on the ICD-10 diagnostic criteria forresearch (World Health Organisation 1992). Theitems for all disorders are shown in TechnicalReport. The example shown in Figure 1.3 is forgeneralised anxiety disorder (GAD).
Six diagnostic categories can be obtained from theCIS-R: generalised anxiety disorder, mixed anxietyand depressive disorder, depressive episode,phobias, obsessive-compulsive disorder and panicdisorder. An individual may appear in more than
one category of neurotic disorder. Prevalence ratesare shown as rates per thousand of the populationin the past week, that is, where the respondentexperienced symptoms of the disorder during theweek before interview.
Psychotic disorderMaking assessments of psychotic rather thanneurotic disorders is more problematic for layinterviewers. A structured questionnaire is toorestrictive and a semi-structured questionnairerequires the use of clinical judgements. A two-stageapproach was therefore adopted to assess thepresence of psychotic disorder. The criteria fromthe initial lay interview which were consideredindicative of possible psychotic disorder were:
• self-reported symptoms indicative of psychoticdisorder, eg mood swings, or having been givena diagnosis of psychotic disorder, such asschizophrenia or manic depression;
• taking anti-psychotic medication;• a history of admission to a mental hospital or
ward; and• a positive response to question 5a of the
psychosis screening questionnaire which asksabout auditory hallucinations.
A positive response to any one of these criteria ledto selection for a second stage interview using theSchedule for Assessment in Neuropsychiatry(SCAN) (World Health Organisation, 1999). Asample of people who screened negative were alsointerviewed at the second stage, either because theysifted positive for personality disorder or becausethey were randomly selected from the sample whoscreened negative for both types of disorder.
Not all those people who were selected for a secondstage interview took part in this stage of the survey,either because they refused a further interview or
Figure 1.2 Calculation of symptom score foranxiety from the CIS-R
ScoreFelt generally anxious/nervous/tense for4 days or more in the past seven days 1
In past seven days anxiety/nervousness/tension has been very unpleasant 1
In the past seven days have felt any of thefollowing symptoms when anxious/nervous/tense (Racing heart, sweating orshaking hands, feeling dizzy, difficultygetting one’s breath, dry mouth, butterfliesin stomach, nausea or wanting to vomit) 1
Felt anxious/nervous tense for more thanthree hours in total on any one of the pastseven days 1
Figure 1.3 Algorithm for generalised anxiety disorder
Conditions which must apply are:
• duration greater than six months;• free-floating anxiety;• autonomic overactivity; and• overall score on Anxiety section was 2 or more

17Psychiactric Morbidity among Adults living in Private Households, 2000
1Aims, concepts and methods
could not be contacted during the field workperiod. To obtain an estimate of the prevalence ofpsychotic disorder based on the whole sample whohad undertaken an initial interview, an assessmentof probable psychotic disorder was applied using analgorithm that was first used in the survey ofpsychiatric morbidity among prisoners (Singletonet al, 1998). In the survey of prisoners, datacollected from people who had both an initialinterview and a second stage SCAN interview wereused to identify factors associated with an increasedlikelihood of receiving a SCAN assessment ofpsychotic disorder. This found that the presence ofany two of the four criteria shown above and usedfor the initial screening for SCAN interview, wasindicative of a probable psychotic disorder.
Therefore, in the current survey, an assessment ofprobable psychosis was given to those who screenedpositive for psychosis and were either assessed ashaving a psychotic disorder at SCAN interview or, ifno SCAN interview had been conducted, whoreported two or more of the psychosis screeningcriteria at initial interview. People who screenednegative for psychosis were designated unlikely tohave psychotic disorder. More details about theassessment of psychotic disorder in the survey and therationale for this approach are given in Appendix B.
This approach included several changes from thatused in the 1993 survey. In 1993, a differentscreening procedure was used. People whoanswered positively to any of the items of thePsychosis Screening Questionnaire or who reportedsymptoms or a diagnosis suggesting the presence ofpsychosis or who were being prescribed anti-psychotic medication were considered eligible forsecond stage interviews and no-one who screenednegative was followed up. Also, in 1993 doctors,who were training as psychiatrists, were used toundertake the second stage interviews, whereas in2000 specially trained psychologists were used.These psychologists received 4–6 weeks training inthe administration of the SCAN and SCIDinterviews and were monitored throughout thefield period to enhance standardisation. Theversion of SCAN used in the 2000 survey wasversion 2.1, while in 1993 version 1.0 was used.However, the same items were rated in both yearsand the version 1.0 algorithm was applied to the2000 data to provide the prevalence rates reportedhere. In addition a different approach was used toprovide an assessment of probable psychosis when
a SCAN interview could not be carried out. In1993, people who screened positive but did nothave a SCAN interview were considered likely tohave a psychotic disorder if they reported adiagnosis or symptoms of psychosis and werereceiving anti-psychotic medication.
Personality disorderPersonality disorder is defined as ‘an enduringpattern of inner experience and behaviour thatdeviates markedly from the expectation of theindividual’s culture, is pervasive and inflexible, hasan onset in adolescence or early adulthood, is stableover time, and leads to distress or impairment’(American Psychiatric Association, 1994). Thereare two major classificatory systems to diagnosepersonality disorders: the InternationalClassification of Disease (ICD-10) and Diagnosticand Statistical Manual of Mental Disorders (DSM-IV). In DSM-IV the personality disorders arediagnosed along a separate axis (Axis II). Successiveclassifications within both diagnostic systems havecome closer together. However, several categoriescontinue to differ between each.
Personality disorder was assessed for the first timein this series of national surveys of psychiatricmorbidity in the survey of prisoners in 1997. Atthat time a decision was taken to use the StructuredClinical Interview for DSM-IV (SCID-II)questionnaire which is based on the DSM-IV AxisII classification system. The reasons for the choiceof this instrument is described in some detail in thereport of that survey (Singleton et al, 1998). Thischoice was made in the knowledge that itrepresents the only departure from the use of ICD-10 in reports of the psychiatric morbidity surveyseries. However, it was felt that the scientificadvantages gained by choosing an instrumentbased on the DSM classification system outweighedthe disadvantages of introducing an exception tothe general rule favouring the official ICDclassification. The factors which led to the selectionof the SCID-II for the prisoners survey remainunchanged and, as the use of this instrumentwould also allow comparison between the prisonand household populations, the SCID-II was alsochosen for use in the current survey.
The SCID-II clinical interview covers eachpersonality disorder category in turn and, withineach category, each component criterion is

18 Psychiatric Morbidity among Adults living in Private Households, 2000
Aims, concepts and methods1evaluated by a specified question (or questions)and subsequent specified probes. It has 120 itemsand the clinician must make a judgement of therating for each item on a four point scale:‘inadequate information’, ‘negative’, ‘sub-threshold’,and ‘threshold’. The SCID-II is in modular form.The latest version has 12 modules (plus a ‘nototherwise specified’):
AvoidantDependantObsessive compulsiveParanoidSchizotypalSchizoidHistrionicNarcissisticBorderlineAntisocialPassive-aggressiveDepressive
There is also a self-completion screeningquestionnaire covering the same areas as theclinical interview. In the present survey, it wasdecided to administer the self-completion(screening) questionnaire of the SCID-II in theinitial interviews and to omit two categories ofpersonality disorder, depressive and passive-aggressive, which are omitted from the formalversion of the DSM-IV.
Alcohol misuse and dependenceThe principal instrument used to assess alcoholmisuse was the Alcohol Use DisordersIdentification Test (AUDIT). This measure wasdeveloped from a six-country WHO collaborativeproject and has been shown to be a good indicatorof hazardous drinking (Saunders et al, 1993). Itdefines hazardous alcohol use as an establishedpattern of drinking which brings the risk ofphysical and psychological harm. Taking the yearbefore interview as a reference period, the AUDITconsists of 10 questions covering the topics shownin Figure 1.4. Answers to all questions are scoredfrom zero to 4 and then summed to provide a totalscore ranging from zero to 40. A total score of 8indicates hazardous alcohol use. Further detailsabout scoring are given in the Technical Report ofthe survey.
Figure 1.4 Topics covered by AUDITquestionnaire
• Hazardous alcohol consumption:- frequency of drinking;- typical quantity; and- frequency of heavy drinking.
• Dependence symptoms:- impaired control over drinking;- increased salience of drinking; and- morning drinking.
• Harmful alcohol consumption:- feeling of guilt or remorse after drinking;- blackouts;- alcohol-related injury; and- others concerned about drinking.
Alcohol dependence was assessed using the Severityof Alcohol Dependence questionnaire (SAD-Q)(Stockwell et al, 1983). The SAD-Q was asked of allrespondents who had an AUDIT score of 10 ormore. It consists of 20 questions, covering a range ofsymptoms of dependence, and possible scores rangefrom 0 to 3 on each question. Adding up the scoresfrom all questions gives a total SAD-Q score ofbetween zero and 60 indicating different levels ofalcohol dependence. A total SAD-Q score of 3 or lessindicates no dependence, while a score of four orabove suggests some alcohol dependence. Milddependence is indicated by a score of between 4 and19, moderate dependence by a score of 20 to 34, andsevere dependence by a SAD-Q score of 35 to 60.The reference period for the questions on alcoholdependence was the 6 months prior to interview.Both instruments were included in the self-completion section of the questionnaire thatrespondents completed on the laptop.
This approach is different to that used in the1993 survey and follows the successful use of theAUDIT in the 1997 survey of psychiatricmorbidity among prisoners. In 1993, alcoholmisuse was measured using 12 questions takenfrom the 1984 U.S. National Alcohol Surveywhich focussed on the three components ofdependence: loss of control, symptomaticbehaviour and binge drinking. Details of thesequestions can be found in Report 1 from the1993 survey (Meltzer et al, 1994a).

19Psychiactric Morbidity among Adults living in Private Households, 2000
1Aims, concepts and methods
Drug dependenceA number of questions designed to measure druguse were contained in the questionnaire.Information was first collected on all the types ofdrugs respondents had ever used, and then aboutdrugs used in the year before interview.
Further information about drug use in the pastyear, and in the past month was collected for:cannabis, amphetamines, crack, cocaine, ecstasy,tranquillisers, opiates and volatile substances, suchas glue. Included in the questions about drug use inthe past year and month were five questions tomeasure drug dependence. The topics covered bythese questions are shown in Figure 1.5. A positiveresponse to any of the five questions was used toindicate drug dependence. Because people could bedependent on more than one drug, they werefurther grouped into those who were dependent oncannabis only, those who were dependent onanother drug (including those also dependent oncannabis), and those with no drug dependence.
The questions used to measure drug dependenceare the same as those used in 1993 but the use ofcomputer-assisted self-interviewing techniques in2000 allowed questions to be asked separatelyabout different types of drugs as in the 1997 surveyof prisoners. The initial questions about types ofdrugs used were also amended slightly to bringthem in line with the those used in the BritishCrime Survey (Ramsay and Partridge, 1999).
Figure 1.5 Topics included in the assessmentof drug dependence
• Frequency of drug use: used drug every day fortwo weeks or more
• Stated dependence: felt they needed it or weredependent on it
• Inability to cut down: tried to cut down butcouldn’t
• Need for larger amounts: needed more to getan effect
• Withdrawal symptoms: feeling sick becausestopped or cut down
were also included in the survey questionnaire. Thetopics covered were:
• general health and service use:– self-perceived health status: the SF-12 and
long-standing illness;– medication and service use: GP, in-patient,
out-patient, day care and community care;and
– lifetime experience of treatment in mentalhospitals/wards.
• socio-demographic data:– personal characteristics: eg age, marital status,
ethnicity;• education and employment;• finances – income and debt;• accommodation – tenure, stability, quality;• stressful life events experienced;• social networks and social support;• activities of daily living and need for informal
care; and• intellectual functioning:
– all participants completed the New AdultReading Test (NART), a measure ofcrystallised intelligence, reflecting the extentof intellectual development by adulthood.NART scores tend to remain stable across thelife course (Nelson & O’Connell, 1978; Nelsonwith Willison, 1991). Those over 60 completedtwo tests which were likely to be sensitive tocognitive decline associated with ageing ordementia. The Modified Telephone Interviewfor Cognitive Screening (TICS-m) wasdeveloped as a brief screening test fordementia (Plassman et al, 1994). Those sscoring below a cut-point have a highprobability of significant cognitiveimpairment, and of meeting criteria for aclinical diagnosis of dementia. The animalnaming test assesses verbal fluency, in this casethe number of different animals a participantcan name in one minute.
References
American Psychiatric Association (1994) Diagnostic andStatistical Manual of Mental Disorders. 4th edition (DSM-IV),APA: Washington DC.
Babor T F, de la Fuente J R, Saunders J and Grant M (1992)AUDIT The Alcohol Use Disorders Identification Test: Guidelinesfor use in Primary Health Care, World Health Organisation:Geneva.
Other topics covered by the surveyQuestions to gather information on a range offactors that might be related to mental disorder

20 Psychiatric Morbidity among Adults living in Private Households, 2000
Aims, concepts and methods1Brugha TS, Bebbington P, Jenkins R, Meltzer H, Taub NA,Janas M and Vernon J (1999). Cross validation of a householdpopulation survey diagnostic interview: a comparison CIS-Rwith SCAN ICD-10 diagnostic categories. PsychologicalMedicine 29, 1029-1042
Department of Health (1992) The Health of the Nation,HMSO:London.
Department of Health (1994) Health of the Nation MentalIllness Key Area Handbook, HMSO:London.
Department of Health (1996) The Spectrum of Care,TSO:London.
Department of Health (1999a) Our Healthier Nation,TSO:London.
Department of Health (1999b) National Service Framework forMental Health, TSO:London.
Department of Health (2000) The NHS Plan, TSO: London.
First MB, Gibbon M, Spitzer RL, William JBW and Benjamin L(1997) Structrured Clinical Interview for DSM - IV Axis IIPersonality Disorders, American Psychriatric Press: Washington.
Foster K, Meltzer H, Gill B and Hinds K. (1996) OPCS Surveysof Psychiatric Morbidity in Great Britain, Report 8: Adults with apsychotic disorder living in the community, HMSO: London.
Gill B, Meltzer H, Hinds K and Petticrew M (1996) OPCSSurveys of Psychiatric Morbidity in Great Britain, Report 7:Psychiatric morbidity among homeless people, HMSO: London.
Kish L (1965) Survey Sampling. Wiley & Sons: London.
Lewis G and Pelosi A J (1990) Manual of the revised clinicalinterview schedule (CIS-R), Institute of Psychiatry: London.
Lewis G, Pelosi A, Araya R C and Dunne G (1992) Measuringpsychiatric disorder in the community: a standardizedassessment for use by lay interviewers. Psychological Medicine22, 465–486.
Meltzer H, Gill B, Petticrew M and Hinds K (1995a) OPCSSurveys of Psychiatric Morbidity in Great Britain, Report 1: theprevalence of psychiatric morbidity among adults living inprivate households, HMSO: London.
Meltzer H, Gill B, Petticrew M and Hinds K (1995b) OPCSSurveys of Psychiatric Morbidity in Great Britain, Report 2:Physical complaints, service use and treatment of adults withpsychiatric disorders, HMSO: London.
Meltzer H, Gill B, Petticrew M and Hinds K (1995c) OPCSSurveys of Psychiatric Morbidity in Great Britain, Report 3:Economic activity and social functioning of adults withpsychiatric disorders, HMSO: London.
Meltzer H, Gatward R, Goodman R and Ford T (2000) Mentalhealth of children and adolescents in Great Britain, TSO:London.
Nelson H and O’Connell A (1978) Dementia. The estimationof pre-morbid intelligence levels using the New Adult ReadingTest. Cortex. 14:234–44.
Nelson H with Willison J (1991) National Adult Reading Test(NART) Test Manual. NFER-Nelson: Windsor, England
Paykel E S and Myers J K (1974) Suicidal feelings in a generalpopulation. British Journal of Psychiatry 124, 460–64.
Plassman BL, Newman TT, Welsh KA, Helms M, Breitner JCS(1994) Properties of the Telephone Interview for CognitiveStatus. Neuropsychiatry, Neuropsychology, and BehaviouralNeurology 7:235–41.
Ramsay M and Partridge S (1999) Drug Misuse Declared in1998: results from the British Crime Survey, Home Office:London.
Robins LN and Regier DA (1991) Psychiatric disorders inAmerica: the Epidemiological Catchment Area Study, The FreePress (Macmillan Inc.): New York.
Saunders J B, Aasland O G, Babor T F, de la Fuente J R andGrant M (1993) Development of the alcohol use disordersidentification test (AUDIT): WHO collaborative project onearly detection of persons with harmful alcohol consumption– II. Addiction 88, 791–804.
Singleton N, Meltzer H, Gatward R, Coid J and Deasy D (1998)Psychiatric morbidity among prisoners in England and Wales,TSO: London.
Stockwell T, Murphy D and Hogson R (1983) The severity ofalcohol dependence questionnaire: its use, reliability andvalidity. British Journal of Addiction 78, 145-155.
Wing J K, Babor T, Brugha T, Burke J, Cooper J E, Giel R,Jablensky A, Regier D and Sartorius N. (1990) SCAN:Schedules for Clinical Assessment in Neuropsychiatry. Archivesof General Psychiatry 47, 586–593.
World Health Organisation (1992) The ICD-10 Classification ofMental and Behavioural Disorders: Clinical descriptions anddiagnostic guidelines, World Health Organisation : Geneva.
World Health Organisation (1993) The ICD-10 classification ofmental and behavioural disorders: diagnostic criteria for research,World Health Organisation: Geneva.
World Health Organisation Division of Mental Health (1999)SCAN Schedules for Clinical Assessment in NeuropsychiatryVersion 2.1. World Health Organisation: Geneva.

21
2
Psychiatric Morbidity among Adults living in Private Households, 2000
Prevalence of mental disorders and substance misuse
2 Prevalence of mental disorders andsubstance misuse
2.1 Introduction
This chapter reports the prevalence of mentaldisorders and substance misuse among adultsliving in private households in Great Britain. Thechapter is divided into 5 sections. They describe, inturn, the prevalence of neurotic symptoms anddisorders, personality disorder and functionalpsychoses, examine alcohol and drug misuse, andconsider the occurrence of multiple psychiatricdisorders. In all sections in this chapter thevariation in prevalence between age groups, sexes,region and ethnicity is described.
Because of the small proportion of the sample inminority ethnic groups, these groups have beencollapsed into four for use as a classificatoryvariable. The three groups, Black Caribbean, BlackAfrican and Other Black groups have beencombined into a single Black group. The Indian,Pakistani and Bangladeshi groups have beencombined into a single South Asian group, while allother groups except the White group have beencombined into a fourth group. However, all thesesub-groups, except the White group, are small, soquite large apparent differences could appear bychance and care needs to be taken in interpretingthe data.
The sample for England can be sub-divided byRegion. The regions used for the presentation ofdata in this report are NHS Regional Office areas.There are 8 such offices. Data is also presented forEngland as a whole, Wales and Scotland. Thesample sizes in a number of regions are quite smalland there was also differential non-responsebetween regions. As a result the sampling errorsassociated with regional estimates can be quitelarge and few differences in estimates betweenregions are statistically significant. Examples ofsampling errors associated with regional estimatescan be found in Table A.5 in Appendix A.
Most of the mental disorders covered in thischapter are comparatively rare, sometimes presentin less than 1% of the population. Therefore, toassist comparison between sub-groups, we present
the prevalence of disorders (neurotic disorders,probable psychosis, personality disorder andalcohol and drug dependence) as rates per 1,000population. However the prevalence of symptomsand substance use is considerably higher so thesetables present prevalence rates as a percentage ofthe population.
2.2 Neurotic symptoms and disorders
Neurotic symptoms and disorders in the weekpreceding interview were assessed in the first stagelay interviews using the revised version of theClinical Interview Schedule (CIS-R) (Lewis andPelosi, 1990; Lewis et al, 1992). Data are presentedon the prevalence of 14 neurotic symptoms, thedistribution of total CIS-R scores, which give anindication of the overall severity of symptoms andof six categories of neurotic disorder.
2.2.1 Prevalence of neurotic symptoms
The CIS-R comprises 14 sections, each covering aparticular type of neurotic symptoms. This sectionreports on symptoms of moderate to high severitywhich were experienced in the week beforeinterview, that is, where the symptom score wastwo or more. Details of the way in which symptomsare scored can be found in Chapter 1 and theTechnical Report. Informants may have reportedseveral neurotic symptoms.
Of the 14 neurotic symptoms the most commonlyreported among both men and women were sleepproblems, fatigue, irritability and worry (notincluding worry about physical health). Theproportions of all adults experiencing thesesymptoms ranged from 29% for sleep problems to19% for worry. The next most frequently occurringsymptoms reported by about 10% of respondents,were depression, poor concentration andforgetfulness, depressive ideas and anxiety. Thesymptom with the lowest prevalence was panic(2%). (Table 2.1 and Figure 2.1)

22
2
Psychiatric Morbidity among Adults living in Private Households, 2000
Prevalence of mental disorders and substance misuse
Women were more likely to report neuroticsymptoms than men. They were around twice aslikely to have obsessions, somatic symptoms,compulsions and phobias, and almost one and a halftimes more likely to suffer symptoms of fatigue andproblems with sleep. However, men were as likely aswomen to worry about physical health or to havesymptoms of panic or anxiety. The small differencesin prevalence between men and women forsymptoms of depression and poor concentrationand forgetfulness were also not statisticallysignificant. (Table 2.1 and Figure 2.1)
Older people were least likely to report neuroticsymptoms. When compared with the populationoverall, people aged 65 to 74 years had lowerprevalence rates for almost all symptoms, with theexception of sleep problems, compulsions andworry about physical health. For example,symptoms of worry were reported by nearly 1 in 5of the total population but by only 1 in 10 elderlypeople. This age difference was more pronounced
among men. Compared with men overall, menaged 65 to 74 were half as likely to report depressiveideas, worry, depression, obsessions orcompulsions, and only about a third as likely toshow symptoms of irritability, anxiety, phobias orpanic. (Table 2.1)
The only symptom to show a consistent relationshipwith age throughout the 12 bands was irritabilityamong women, which gradually declined with age.When compared with women aged 70 to 74 years,women aged 16 to 19 were nearly six times morelikely to have felt irritable (35% compared with 6%).This group of young women were also more likely toreport depressive ideas (20%) when compared withwomen overall (11%). (Table 2.1)
In general, observed differences among the sampleaccording to ethnic group were small, and,because only 4% of the sample identifiedthemselves as belonging to an ethnic group otherthan White, any apparent differences in the
Panic
Compulsions
Phobias
Obsessions
Worry–Physical health
Somatic symptoms
Anxiety
Depressive ideas
Concentration andforgetfulness
Depression
Worry
Irritability
Fatigue
Sleep Problems
0 5 10 15 20 25 30 35
PercentageWomenMenAll
Figure 2.1 Proportions of adults with a score of 2 or more on eachneurotic symptom by sex
Percentage

23
2
Psychiatric Morbidity among Adults living in Private Households, 2000
Prevalence of mental disorders and substance misuse
prevalence of symptoms are difficult to interpretand are unlikely to be statistically significant.
Although several neurotic symptoms appeared tobe more prevalent among people, particularly men,in the Other group, none of the differences werestatistically significant. (Table 2.2)
The variation in the prevalence of neuroticsymptoms between the regions of England, andScotland and Wales was generally not marked andnot statistically significant, but some generalpatterns could be seen. Prevalence rates higher thanthe national average for most symptoms werefound in the North West, London and Wales forboth women and men, and Northern and Yorkshire(men only). Regions with prevalence rates lowerthan the national average for most symptoms werethe West Midlands and Scotland (both women andmen), the South West and South East (womenonly) and Trent (men only). (Table 2.3)
2.2.2 Distribution of CIS-R scores
Adding up the scores on all fourteen symptomscovered by the CIS-R produces a total CIS-R scorewhich reflects the overall severity of neuroticsymptoms. Total scores range between zero and 57.A score of 12 or above indicates significant levels ofneurotic symptoms, while a score of 18 or moresuggests a level of symptoms likely to requiretreatment. Figure 2.2 shows the distribution of the
total CIS-R scores for the surveyed sample. Overall,15% of the sample had total symptom scores on orabove the threshold of 12. Most of those with scoresbelow the threshold had a score of less then 6, morethan two-thirds of the sample. Among those abovethe threshold, about half had a CIS-R score of 18 ormore, 7% of the sample. (Table 2.4)
Women were more likely than men to have a CIS-Rscore on or above the threshold of 12. Theproportion of women with significant levels ofneurotic symptoms was 18%, compared with 12%of men. Women were also more likely than men tohave a CIS-R score of 18 or more, 9% comparedwith 6%. (Table 2.4 and Figure 2.2)
Among the overall population, the proportion ofadults with a score of 12 or more varied littlebetween the ages of 25 and 54 (about 17%), but wassignificantly smaller among those aged 65 to 74(9%). There was more apparent variation when menand women are considered separately. Women agedbetween 50 and 54 were the group most likely tohave scores on or above the threshold of 12 (23%),while among men it was those aged between 45 and49 (19%). The groups with the smallest proportionsat or above the threshold were men aged 65 to 74(5%), men aged 16 to 24 (8%) and women aged 70to 74 (11%). (Table 2.4)
In all ethnic groups, women were more likely thanmen to have CIS-R scores above the threshold of12. However, the difference was only significant in
0 –5 6–11 12–17 18 and over0
20
40
60
80
100
Per
cent
age
CIS-R Score (grouped)
Women Men
Figure 2.2 Distribution of CIS-R scores (grouped) by sex

24
2
Psychiatric Morbidity among Adults living in Private Households, 2000
Prevalence of mental disorders and substance misuse
the White group. They were also more likely tohave scores of 18 or above and this was particularlymarked in the South Asian group: 15% of SouthAsian women had a CIS-R score of 18 or morecompared with 4% of South Asian men. (Table 2.5)
The small size of the samples from ethnic minoritygroups means that apparently quite largedifferences in prevalence rates can occur by chance.The apparent differences in the proportions withCIS-R scores above 12 among the different ethnicgroups were not statistically significant.
There was some variation in the distribution oftotal CIS-R score by region, though this was notgenerally marked. In a few regions, the differencesbetween local and national averages reachedstatistical significance. In particular, the largestproportions of both men and women with a CIS-Rscore of 18 or more were found in the North West,20% overall, compared with the Great Britainaverage of 15%. (Table 2.6)
2.2.3 Prevalence of neurotic disorders
This section describes the distribution of neuroticdisorders among the different groups within thesample. Diagnoses are obtained by looking at theanswers to various sections of the CIS-R andapplying algorithms based on the ICD-10diagnostic criteria for research (World HealthOrganisation,1992).
Six diagnoses are possible from the CIS-R:generalised anxiety disorder, mixed anxiety anddepressive disorder, depressive episode, phobias,obsessive compulsive disorder and panic disorder.An individual may appear in more than onecategory of neurotic disorder. Prevalence rates areshown as rates per 1,000 of the population in thepast week, that is, where the respondentexperienced symptoms of the disorder during theweek before interview.
There were 164 cases per 1,000 of neurotic disorderin the week before interview. This represents about1 in 6 of all adults.
The most prevalent neurotic disorder among thepopulation as a whole was mixed anxiety anddepressive disorder (88 cases per 1,000). This disorder
is a ‘catch-all’ category which included people withsignificant neurotic psychopathology who could notbe coded into any of the other five neurotic disorders.Generalised anxiety disorder was next mostcommonly found (44 adults per 1,000). Theremaining disorders (depressive episode, phobias,obsessive compulsive disorder and panic) were lessprevalent, ranging from 26 to 7 cases per 1,000.
Prevalence rates were higher among women thanmen for all disorders except panic (7 cases per1,000 for both men and women). The disparitybetween the rates for women and men wasgreatest for phobias (22 and 13 cases per 1,000respectively) and mixed anxiety and depressivedisorder (108 and 68 cases per 1,000), bothstatistically significant.The differences inprevalence for other disorders were notstatistically significant. (Table 2.7 and Figure 2.3.)
Prevalence rates of ‘any neurotic disorder’ showedsome variation by age. The lowest prevalence ratesof any neurotic disorder were found among olderpeople, in particular those aged 65 to 69 (102 casesper 1,000) and 70 to 74 (94 cases per 1,000). Thiswas most marked among men aged 65 to 74 (57cases per 1,000) but among women low rates werealso found among those aged 70 to 74 (119 casesper 1,000). Unlike women, the prevalence ofneurotic disorder among young men also appearedlow (86 cases per 1,000 for men aged 16 to 19).(Table 2.7 and Figure 2.3)
The highest prevalence rates, nearly 200 cases per1,000, occurred in the three groups aged between40 and 54. In most age groups prevalence of anyneurotic disorder was higher among women thanmen. However, prevalence of any neurotic disorderfor men peaked in the 45 to 49 age group (204 casesper 1,000) and was higher than for women of thesame age (188 cases per 1,000). The highestprevalence rate for any neurotic disorder amongwomen was found in the 50 to 54 age group (246cases per 1,000). (Table 2.7 and Figure 2.3)
South Asian adults and those in the Other groupappeared to have higher rates of prevalence formost neurotic disorders than their whitecounterparts, while Black adults appeared to havelower rates than both groups but these differenceswere not statistically significant. (Table 2.8)

25
2
Psychiatric Morbidity among Adults living in Private Households, 2000
Prevalence of mental disorders and substance misuse
The regional variations in the prevalence ofneurotic disorders were generally not statisticallysignificant. The highest prevalence of any neuroticdisorder occurred in the North West, with 203cases per 1,000, and was particularly markedamong women, 252 cases per 1,000. (Table 2.9)
2.3 Personality disorder
The prevalence rates presented here are based onthe results of the second-stage SCID-II clinicalinterviews which were undertaken by a sub-sample of the people who took part in the initialstage of the survey. The data from this sub-samplehave been weighted to take into account non-response at both interview stages and the differentsampling fractions used when selecting people forthe second stage interviews. Because theprevalence is based on a sub-sample of only 626interviews, prevalence rates are shown brokendown by sex and broad age bands only and not byethnic group or region.
The prevalence rate for any personality disorderwas 54 per 1,000 men and 34 per 1,000 women.Obsessive-compulsive personality disorder hadthe highest prevalence of any category ofpersonality disorder and was more commonamong men than women. Among the sub-samplewho had a clinical interview, 19 per 1,000 people
were assessed as having obsessive-compulsivepersonality disorder, 26 per 1,000 men and 13 per1,000 women. The following types of personalitydisorder were the next most frequently occurring:avoidant, schizoid, borderline, paranoid and anti-social personality disorder. These were assessed asbeing present in between 6 and 8 cases per 1,000.Paranoid, borderline and anti-social personalitydisorder all appeared to be more prevalent amongmen than women but the differences were notstatistically significant. The prevalence ofdependent and schizotypal personality disorderwas very low, only 1 per 1,000 cases, while no casesof histrionic or narcissistic personality disorderwere found. (Table 2.10 and Figure 2.4)
2.4 Psychotic and severe affective disorders
In the 1993 survey of psychiatric morbidity amongadults in private households, psychotic disorderwas assessed on the basis of clinical interviewsusing the Schedule for Clinical Assessment inNeuropsychiatry (SCAN) of a sub-sample of thepopulation who screened positive for possiblepsychotic disorder. If a SCAN interview could notbe conducted, an assessment was made based on analgorithm which used data from the initialinterviews. It was assumed that all those whoscreened negative for psychotic disorder were truenegatives. It was felt that the prevalence rates for
Mixed anxietyand depressive
disorder
Generalisedanxietydisorder
Depressiveepisode
All Phobias Obsessivecompulsive
disorder
Panic disorder Any neuroticdisorder
0
50
100
150
200
250
Pre
vale
nce
per
thou
sand
pop
ulat
ion
Neurotic disorders
Women Men All
Figure 2.3 Weekly prevalence of neurotic disorders by sex

26
2
Psychiatric Morbidity among Adults living in Private Households, 2000
Prevalence of mental disorders and substance misuse
disorder obtained in this way may have beenunderestimates as a few cases of psychotic disorderamong the screen negative cases might have beenmissed. In addition, the algorithm used to assign anassessment to those screen positives who did nothave a second stage interview might miss peoplewho were not in contact with services because apositive assessment required people to be receivinganti-psychotic medication.
In the 2000 survey, all those who screened positivefor psychosis, using a refined screening method,were again eligible for a second stage interview.However, the inclusion of a personality disorderassessment in the second stage interviews meantthat some people who screened negative forpsychosis but positive for personality disorderreceived a SCAN assessment. In addition a sampleof those who screened negative for both psychosisand personality disorder were also selected for asecond interview.
The prevalence rates used in this report have beenobtained using a similar approach to that in 1993.For those who screened positive for psychosis theresults of the SCAN assessment, if available, is used.For those who did not take part in the second-stage, for whatever reason, an algorithm (based onthat developed in the 1997 survey of psychiatricmorbidity among prisoners (Singleton et al, 1998))was used to provide an assessment of probable
psychosis. Those who screened negative forpsychosis were assessed as psychosis negative,regardless of whether or not they had had a secondstage SCAN interview. This provides an assessmentof probable psychosis for all those who took part inthe survey which is used throughout the report.
The reasons for this approach and the implicationswith respect to the likelihood of underestimatingthe true prevalence of psychotic disorder arediscussed in Appendix B. The prevalence ratesobtained using all the second stage interview dataare shown in Appendix B and these give an idea ofthe probable range within which anyunderestimate might lie.
The prevalence rate for probable psychotic disorderin the year prior to interview was 5 per 1,000. Therate among women was 5 per 1,000 and amongmen, 6 per 1,000. The pattern of variation inprobable psychosis by age appears to show aconcentration of cases among those aged between30 and 54 years of age. However, none of thedifferences are statistically significant. The highestrates among women was observed in the 40- to 44-year-old age group (12 per 1,000) and for men inthe group aged 30 to 34 (13 per 1,000). While casesof probable psychotic disorder were found innearly all female age groups, observed cases amongmen were confined to those aged over 30 years.(Table 2.11 and Figure 2.5)
Obsessive-Compulsive
Avoidant Schizoid Paranoid Borderline Antisocial Dependent Schizotypal Histrionic Narcissistic Anypersonality
disorder
0
10
20
30
40
50
60
Pre
vale
nce
per
thou
sand
pop
ulta
ion
Personality disorder
Women Men All
Figure 2.4 Prevalence of personality disorder by sex (from clinical interviews)
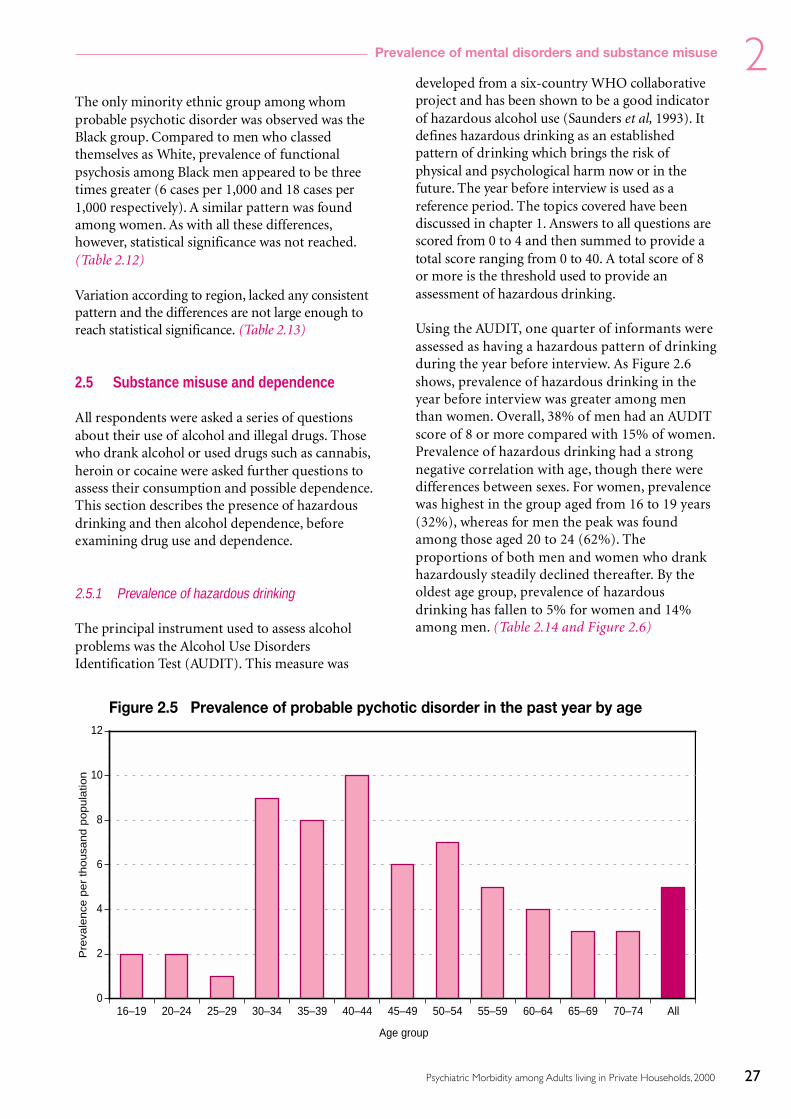
27
2
Psychiatric Morbidity among Adults living in Private Households, 2000
Prevalence of mental disorders and substance misuse
The only minority ethnic group among whomprobable psychotic disorder was observed was theBlack group. Compared to men who classedthemselves as White, prevalence of functionalpsychosis among Black men appeared to be threetimes greater (6 cases per 1,000 and 18 cases per1,000 respectively). A similar pattern was foundamong women. As with all these differences,however, statistical significance was not reached.(Table 2.12)
Variation according to region, lacked any consistentpattern and the differences are not large enough toreach statistical significance. (Table 2.13)
2.5 Substance misuse and dependence
All respondents were asked a series of questionsabout their use of alcohol and illegal drugs. Thosewho drank alcohol or used drugs such as cannabis,heroin or cocaine were asked further questions toassess their consumption and possible dependence.This section describes the presence of hazardousdrinking and then alcohol dependence, beforeexamining drug use and dependence.
2.5.1 Prevalence of hazardous drinking
The principal instrument used to assess alcoholproblems was the Alcohol Use DisordersIdentification Test (AUDIT). This measure was
developed from a six-country WHO collaborativeproject and has been shown to be a good indicatorof hazardous alcohol use (Saunders et al, 1993). Itdefines hazardous drinking as an establishedpattern of drinking which brings the risk ofphysical and psychological harm now or in thefuture. The year before interview is used as areference period. The topics covered have beendiscussed in chapter 1. Answers to all questions arescored from 0 to 4 and then summed to provide atotal score ranging from 0 to 40. A total score of 8or more is the threshold used to provide anassessment of hazardous drinking.
Using the AUDIT, one quarter of informants wereassessed as having a hazardous pattern of drinkingduring the year before interview. As Figure 2.6shows, prevalence of hazardous drinking in theyear before interview was greater among menthan women. Overall, 38% of men had an AUDITscore of 8 or more compared with 15% of women.Prevalence of hazardous drinking had a strongnegative correlation with age, though there weredifferences between sexes. For women, prevalencewas highest in the group aged from 16 to 19 years(32%), whereas for men the peak was foundamong those aged 20 to 24 (62%). Theproportions of both men and women who drankhazardously steadily declined thereafter. By theoldest age group, prevalence of hazardousdrinking has fallen to 5% for women and 14%among men. (Table 2.14 and Figure 2.6)
16–19 20–24 25–29 30–34 35–39 40–44 45–49 50–54 55–59 60–64 65–69 70–74 All0
2
4
6
8
10
12
Pre
vale
nce
per
thousa
nd p
opula
tion
Age group
Figure 2.5 Prevalence of probable pychotic disorder in the past year by age

28
2
Psychiatric Morbidity among Adults living in Private Households, 2000
Prevalence of mental disorders and substance misuse
Also from the AUDIT, 4% of adults had a score of16 or more suggesting they may be at risk of majorharm as a result of their drinking patterns.Variations in the proportion of people with thesevery high AUDIT scores between sexes anddifferent age groups showed a similar pattern tothat found with hazardous drinking. Overall, menwere three times more likely than women to havean AUDIT score of 16 or over (6% compared with2%). The highest proportion of people with AUDITscores of 16 or more was found among men aged 20to 24 years (14%).
Respondents who classified themselves as Whitehad higher prevalence rates of hazardous drinkingthan those in the Black and South Asian groups.Overall, 27% of White adults had an AUDIT scoreof 8 or more, compared with 18% of Black adultsand 8% of South Asian adults. The difference wasmost marked among men; White men were abouttwice as likely as Black men, and about four timesmore likely than South Asian men, to drinkhazardously. Differences in the prevalence ofhazardous drinking between sexes were found inall ethnic groups. (Table 2.15)
In the 10 different areas of Great Britain there wassignificant variation in the proportions of adultsdrinking hazardously. The Eastern region had thelowest prevalence of hazardous drinking (20%). TheEastern region also showed the lowest prevalence ofhazardous drinking among men (29%), while for
women the lowest prevalence rate was found in theSouth East (11%). Both were significantly differentfrom the Great Britain prevalences. (Table 2.16)
Some regions had rates of hazardous drinkinghigher than the national average. The proportion ofadults with an AUDIT score of 8 or above was 32%in the North West and 31% in Northern andYorkshire regions, compared with the nationalaverage of 26%. (Table 2.16.)
2.5.2 Prevalence of alcohol dependence
The prevalence of alcohol dependence in the 6months before interview was assessed using theSeverity of Alcohol Dependence questionnaire(SAD-Q) (Stockwell et al, 1983). The SAD-Q wasasked of all respondents who had an AUDIT score of10 or more. A total SAD-Q score of 3 or lessindicates no dependence, while a score of four orabove suggests some alcohol dependence. Milddependence is indicated by a score of between 4 and19, moderate dependence by a score of 20 to 34, andsevere dependence by a SAD-Q score of 35 to 60.
Overall, 93% of the surveyed sample showed noalcohol dependence. Some degree of alcoholdependence was found in 74 per 1,000 adults, 119per 1,000 men and 29 per 1,000 women. Theprevalence rate of mild alcohol dependence was 69per 1,000 among the overall population, 111 per
16–19 20–24 25–29 30–34 35–39 40–44 45–49 50–54 55–59 60–64 65–69 70–74 All0
10
20
30
40
50
60
70
Per
cent
age
Age group
Women Men All
Figure 2.6 Prevalence of hazardous drinking in the past year by age and sex
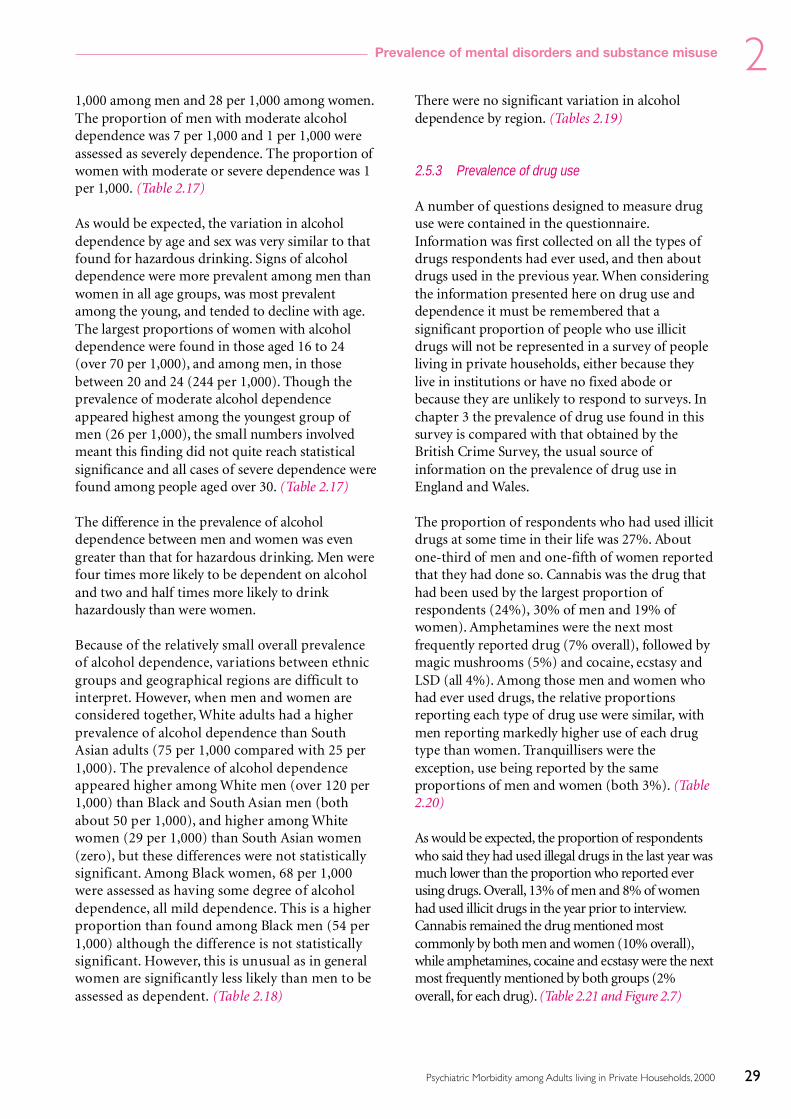
29
2
Psychiatric Morbidity among Adults living in Private Households, 2000
Prevalence of mental disorders and substance misuse
1,000 among men and 28 per 1,000 among women.The proportion of men with moderate alcoholdependence was 7 per 1,000 and 1 per 1,000 wereassessed as severely dependence. The proportion ofwomen with moderate or severe dependence was 1per 1,000. (Table 2.17)
As would be expected, the variation in alcoholdependence by age and sex was very similar to thatfound for hazardous drinking. Signs of alcoholdependence were more prevalent among men thanwomen in all age groups, was most prevalentamong the young, and tended to decline with age.The largest proportions of women with alcoholdependence were found in those aged 16 to 24(over 70 per 1,000), and among men, in thosebetween 20 and 24 (244 per 1,000). Though theprevalence of moderate alcohol dependenceappeared highest among the youngest group ofmen (26 per 1,000), the small numbers involvedmeant this finding did not quite reach statisticalsignificance and all cases of severe dependence werefound among people aged over 30. (Table 2.17)
The difference in the prevalence of alcoholdependence between men and women was evengreater than that for hazardous drinking. Men werefour times more likely to be dependent on alcoholand two and half times more likely to drinkhazardously than were women.
Because of the relatively small overall prevalenceof alcohol dependence, variations between ethnicgroups and geographical regions are difficult tointerpret. However, when men and women areconsidered together, White adults had a higherprevalence of alcohol dependence than SouthAsian adults (75 per 1,000 compared with 25 per1,000). The prevalence of alcohol dependenceappeared higher among White men (over 120 per1,000) than Black and South Asian men (bothabout 50 per 1,000), and higher among Whitewomen (29 per 1,000) than South Asian women(zero), but these differences were not statisticallysignificant. Among Black women, 68 per 1,000were assessed as having some degree of alcoholdependence, all mild dependence. This is a higherproportion than found among Black men (54 per1,000) although the difference is not statisticallysignificant. However, this is unusual as in generalwomen are significantly less likely than men to beassessed as dependent. (Table 2.18)
There were no significant variation in alcoholdependence by region. (Tables 2.19)
2.5.3 Prevalence of drug use
A number of questions designed to measure druguse were contained in the questionnaire.Information was first collected on all the types ofdrugs respondents had ever used, and then aboutdrugs used in the previous year. When consideringthe information presented here on drug use anddependence it must be remembered that asignificant proportion of people who use illicitdrugs will not be represented in a survey of peopleliving in private households, either because theylive in institutions or have no fixed abode orbecause they are unlikely to respond to surveys. Inchapter 3 the prevalence of drug use found in thissurvey is compared with that obtained by theBritish Crime Survey, the usual source ofinformation on the prevalence of drug use inEngland and Wales.
The proportion of respondents who had used illicitdrugs at some time in their life was 27%. Aboutone-third of men and one-fifth of women reportedthat they had done so. Cannabis was the drug thathad been used by the largest proportion ofrespondents (24%), 30% of men and 19% ofwomen). Amphetamines were the next mostfrequently reported drug (7% overall), followed bymagic mushrooms (5%) and cocaine, ecstasy andLSD (all 4%). Among those men and women whohad ever used drugs, the relative proportionsreporting each type of drug use were similar, withmen reporting markedly higher use of each drugtype than women. Tranquillisers were theexception, use being reported by the sameproportions of men and women (both 3%). (Table2.20)
As would be expected, the proportion of respondentswho said they had used illegal drugs in the last year wasmuch lower than the proportion who reported everusing drugs. Overall, 13% of men and 8% of womenhad used illicit drugs in the year prior to interview.Cannabis remained the drug mentioned mostcommonly by both men and women (10% overall),while amphetamines, cocaine and ecstasy were the nextmost frequently mentioned by both groups (2%overall, for each drug). (Table 2.21 and Figure 2.7)

30
2
Psychiatric Morbidity among Adults living in Private Households, 2000
Prevalence of mental disorders and substance misuse
As with hazardous drinking, prevalence of illicitdrug use showed a strong negative correlation withage. Prevalence of any illegal drug use in the yearprior to interview was highest in the 20- to 24-year-old age groups, both for men (37%) and women(29%). Drug use in the past year declined markedlybetween the ages of 25 and 40, with prevalenceroughly halving in each successive five-year agegroup. Beyond the age of 50 the proportion ofadults who reported drug use in the previous yeartailed off to between 2% and 1%. (Table 2.21)
Prevalence of illegal drug use in the year beforeinterview was lower among South Asian men thanthose from other ethnic groups. While theproportions of men in the White, Black and Othergroups reporting drug use in the previous yearwere similar, 14%, 12% and 13% respectively,prevalence among South Asian men was lower at5%. Among women, the trend appeared to be theopposite: South Asian women being slightly morelikely to report having taken illicit drugs in theprevious year (12%) than either White or Blackwomen (both 8%), but this finding was notstatistically significant. (Table 2.22)
The London region stood out as the region withthe highest proportion of people reporting use ofillegal drugs in the previous year. The prevalence of
illegal drug use was 16% in London, comparedwith 11% in the Great Britain as a whole. Amongwomen in London the prevalence of illegal druguse in the past year was almost double the nationalaverage (15% compared with 8%), while amongmen the difference was smaller but still statisticallysignificant (18% compared with 13%). There wereparticularly high proportions of female cannabisand cocaine users in London (14% and 4%)compared with women nationally (7% and 1%).Other regions which appeared to have relativelyhigh prevalence of illegal drug use when comparedwith the Great Britain average were Scotland (men)and the North West (women), though thesedifferences were not quite large enough to reachstatistical significance. (Table 2.23)
The smallest proportions of illegal drug users werefound among women in the Trent region (3%) andamong men in the West Midlands (9%).
2.5.4 Prevalence of drug dependence
Further information about drug use in the year,and month, preceding interview was collectedabout eight drugs: cannabis, amphetamines, crack,cocaine, ecstasy, tranquillisers, opiates and volatilesubstances, such as glue. Included in the questions
Can
nabi
s
Am
phet
amin
es
Coc
aine
Cra
ck
Ecs
tasy
Her
oin
LSD
Mag
icm
ushr
oom
s
Met
hado
ne
Tran
quill
iser
s
Am
yl n
itrite
Ana
bolic
ster
oids
Vol
atile
subs
tanc
es
Any
dru
g
0
2
4
6
8
10
12
14
Per
cent
age
Drugs used in the last year
Women Men All
Figure 2.7 Illicit drug use in the past year by sex
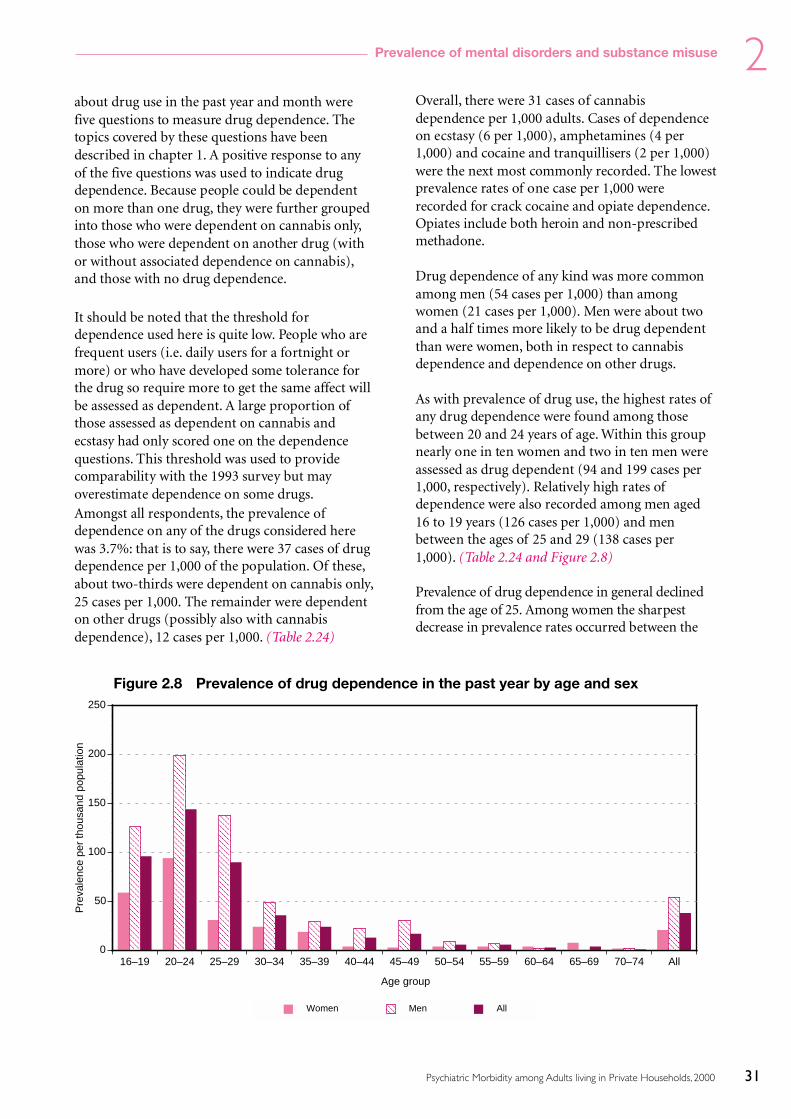
31
2
Psychiatric Morbidity among Adults living in Private Households, 2000
Prevalence of mental disorders and substance misuse
about drug use in the past year and month werefive questions to measure drug dependence. Thetopics covered by these questions have beendescribed in chapter 1. A positive response to anyof the five questions was used to indicate drugdependence. Because people could be dependenton more than one drug, they were further groupedinto those who were dependent on cannabis only,those who were dependent on another drug (withor without associated dependence on cannabis),and those with no drug dependence.
It should be noted that the threshold fordependence used here is quite low. People who arefrequent users (i.e. daily users for a fortnight ormore) or who have developed some tolerance forthe drug so require more to get the same affect willbe assessed as dependent. A large proportion ofthose assessed as dependent on cannabis andecstasy had only scored one on the dependencequestions. This threshold was used to providecomparability with the 1993 survey but mayoverestimate dependence on some drugs.Amongst all respondents, the prevalence ofdependence on any of the drugs considered herewas 3.7%: that is to say, there were 37 cases of drugdependence per 1,000 of the population. Of these,about two-thirds were dependent on cannabis only,25 cases per 1,000. The remainder were dependenton other drugs (possibly also with cannabisdependence), 12 cases per 1,000. (Table 2.24)
Overall, there were 31 cases of cannabisdependence per 1,000 adults. Cases of dependenceon ecstasy (6 per 1,000), amphetamines (4 per1,000) and cocaine and tranquillisers (2 per 1,000)were the next most commonly recorded. The lowestprevalence rates of one case per 1,000 wererecorded for crack cocaine and opiate dependence.Opiates include both heroin and non-prescribedmethadone.
Drug dependence of any kind was more commonamong men (54 cases per 1,000) than amongwomen (21 cases per 1,000). Men were about twoand a half times more likely to be drug dependentthan were women, both in respect to cannabisdependence and dependence on other drugs.
As with prevalence of drug use, the highest rates ofany drug dependence were found among thosebetween 20 and 24 years of age. Within this groupnearly one in ten women and two in ten men wereassessed as drug dependent (94 and 199 cases per1,000, respectively). Relatively high rates ofdependence were also recorded among men aged16 to 19 years (126 cases per 1,000) and menbetween the ages of 25 and 29 (138 cases per1,000). (Table 2.24 and Figure 2.8)
Prevalence of drug dependence in general declinedfrom the age of 25. Among women the sharpestdecrease in prevalence rates occurred between the
16–19 20–24 25–29 30–34 35–39 40–44 45–49 50–54 55–59 60–64 65–69 70–74 All0
50
100
150
200
250
Pre
vale
nce
per
thou
sand
pop
ulat
ion
Age group
Women Men All
Figure 2.8 Prevalence of drug dependence in the past year by age and sex

32
2
Psychiatric Morbidity among Adults living in Private Households, 2000
Prevalence of mental disorders and substance misuse
16–19 20–24 25–29 30–34 35–39 40–44 45–49 50–54 55–59 60–64 65–69 70–74 All adults0
20
40
60
80
100
Per
cent
age
Age group
None 1 2 3
Figure 2.9 Number of mental disorders by age group
ages of 20 and 30, while among men it occurred alittle later between the years of 25 and 35.Specifically, dependence on drugs other thancannabis fell to 5 cases per 1,000 among womenaged 25 to 29, and to 2 cases per 1,000 for men agedbetween 30 and 34. The number of cases of any drugdependence fell to below 10 per 1,000 amongstwomen over 40 and men over 50 years of age.
Patterns of dependence on different types of drugsagain tended to show an inverse correlation withage, though to varying degrees. The most age-variant dependence was found with ecstasy andamphetamines, where almost all cases ofdependence occurred between the ages of 16 and29. Men aged 20 to 24 reported the highestprevalence of ecstasy and amphetaminedependence (54 and 25 cases per 1,000,respectively). Prevalence rates of dependence ontranquillisers showed no overall relationship withage, being most commonly found in younger menand older women. In particular, dependence ontranquillisers was highest among women aged 65 to69 (8 cases per 1,000), and tranquilliserdependence accounted for 80% of all drugdependence found amongst women over 50. (Table2.24)
There were large apparent variations in drugdependence by ethnicity but these do not reachstatistical significance. (Table 2.25)
There was some apparent regional variation in drugdependence. Scotland had the highest rates of drugdependence, 60 cases per 1,000. This variation waspartly due to higher rates of cannabis dependence:double the Great Britain average for men inScotland (83 cases per 1,000). Prevalence of drugdependence was also high in London and theNorth West, but the differences did not quite reachstatistical significance. (Table 2.26)
2.6 Co-occurrence of disorders
The next section looks at the extent to whichneurotic disorder, psychotic disorder, alcohol ordrug dependence co-occur among respondents inthe survey. A simple count of the number ofdisorders each person was assessed as having isused for this comparison.
Just over three-quarters of respondents (77%) hadnone of the 4 disorders. Nearly a fifth (19%) hadjust one disorder, 3% were assessed has having twodisorders, while only 1% had more than two.Slightly fewer women had 2 or more disorders thandid men, 2% compared with 6% of men. Olderpeople, both men and women, tended to have fewerdisorders than younger people. For example 7% of16- to 19-year-olds and 10% of those aged 20 to 24were assessed as having 2 or more disorderscompared with 1% or less of those on the over 60

33
2
Psychiatric Morbidity among Adults living in Private Households, 2000
Prevalence of mental disorders and substance misuse
age groups. This is likely to be a reflection of thehigher rates of drug and alcohol dependenceamong younger people. (Table 2.27 and Figure 2.9)
There were no significant differences betweenethnic groups in the proportion of people assessedas having multiple disorders nor between regions.However adults in the North West were most likelyto be assessed as having one or more disorders.(Table 2.28 and 2.29)
References
Lewis G, and Pelosi AJ. (1990) Manual of the revised clinicalinterview schedule (CIS-R), Institute of Psychiatry: London.
Lewis G, Pelosi AJ, Araya RC, and Dunn G. (1992) Measuringpsychiatric disorder in the community: a standardisedinstrument for use by lay interviewers, Psychological Medicine,22, 465–486
Saunders JB, Aasland OG, Babor TF, de la Fuente JR and GrantM. (1993) Development of the alcohol use disordersidentification test (AUDIT): WHO collaborative project onearly detection of persons with harmful alcohol consumption -II, Addiction, 88, 791–804
Singleton N, Meltzer H, Gatward R, Coid J and Deasy D (1998)Psychiatric Morbidity among Adults in England and Wales.TSO:London
Stockwell T, Murphy D and Hodgson R (1983) The severity ofalcohol dependence questionnaire: its use, reliability andvalidity. British Journal of Addiction 78, 145–155
World Health Organisation (1992) The ICD-10 Classification ofMental and Behavioural Disorders: Clinical descriptions anddiagnostic guidelines. WHO: Geneva

34
2
Psychiatric Morbidity among Adults living in Private Households, 2000
Prevalence of mental disorders and substance misuse
Table 2.1 Proportion of adults with a score of two or more on each CIS-R symptom
by age and sex
Age
16–19 20–24 25–29 30–34 35–39 40–44 45–49 50–54 55–59 60–64 65–69 70–74 All
Proportion of adults with a score of 2 or more on each symptomWomen
Sleep Problems 36 32 31 30 32 34 36 37 38 35 37 36 34Fatigue 35 31 33 33 32 37 29 42 30 26 25 26 32Irritability 35 29 28 28 26 24 19 20 17 12 10 6 22Worry 28 26 24 21 22 26 22 23 19 18 12 10 21Depression 16 11 11 14 13 14 9 12 11 7 10 7 12Concentration and forgetfulness 13 11 9 13 11 12 11 15 9 7 6 6 11Depressive ideas 20 12 12 12 13 14 9 12 10 7 4 4 11Anxiety 7 8 10 9 9 11 10 13 11 8 7 6 9Somatic symptoms 4 9 10 9 10 9 9 10 9 6 5 5 8Worry–Physical health 8 10 6 7 7 8 5 9 8 7 6 8 7Obsessions 7 7 10 9 9 9 6 5 4 6 4 6 7Phobias 8 6 7 7 6 8 3 8 5 4 4 3 6Compulsions 5 4 5 3 4 5 2 3 3 3 2 3 4Panic 2 1 2 2 2 4 2 3 2 2 1 1 2
Base 151 258 398 574 564 460 363 435 389 407 373 356 4728
Men
Sleep Problems 23 23 28 22 25 25 27 22 25 23 18 19 24Fatigue 15 16 27 22 26 24 29 21 23 25 17 17 23Irritability 15 17 23 19 24 20 23 19 15 14 7 5 18Worry 11 13 20 21 19 17 21 21 14 13 8 7 17Depression 8 8 11 7 12 13 15 10 10 13 6 4 10Concentration and forgetfulness 4 6 9 10 10 10 11 12 9 11 6 6 9Depressive ideas 7 7 10 8 10 9 10 8 7 8 2 4 8Anxiety 6 4 8 9 8 10 12 11 6 7 2 3 8Somatic symptoms 3 1 5 5 6 9 11 7 4 6 3 2 5Worry–Physical health 4 2 5 6 6 8 10 8 9 10 5 6 7Obsessions 5 6 5 3 4 3 5 4 4 5 2 2 4Phobias 5 6 4 4 5 2 4 4 2 2 1 1 3Compulsions 3 3 2 4 2 2 2 2 2 3 1 1 2Panic 3 1 2 2 2 2 4 1 2 1 0 0 2
Base 183 202 332 379 442 382 360 387 314 332 295 244 3852
All Adults
Sleep Problems 29 28 29 26 28 29 31 29 32 29 28 28 29Fatigue 24 24 30 28 29 31 29 32 27 26 21 22 27Irritability 24 23 25 24 25 22 21 20 16 13 8 6 20Worry 19 20 22 21 21 22 21 22 16 16 10 9 19Depression 12 10 11 11 13 14 12 11 10 10 8 5 11Concentration and forgetfulness 8 8 9 11 11 11 11 13 9 9 6 6 10Depressive ideas 13 10 11 10 11 11 9 10 9 7 3 4 9Anxiety 7 6 9 9 9 11 11 12 9 7 4 5 9Somatic symptoms 3 5 7 7 8 9 10 8 6 6 4 4 7Worry–Physical health 6 6 6 6 6 8 8 8 8 8 6 7 7Obsessions 6 7 7 6 6 6 6 4 4 5 3 4 6Phobias 6 6 5 5 5 5 4 6 3 3 2 2 5Compulsions 4 4 3 4 3 3 2 3 3 3 2 2 3Panic 2 1 2 2 2 3 3 2 2 1 1 1 2
Base 334 460 730 953 1006 842 723 822 703 739 668 600 8580

35
2
Psychiatric Morbidity among Adults living in Private Households, 2000
Prevalence of mental disorders and substance misuse
Table 2.2 Proportion of adults with a score of two or more on each CIS-R symptom
by ethnicity and sex
Ethnicity
White Black South Asian* Other All
Proportion of adults with a score of 2 or more on each symptomWomen
Sleep Problems 34 29 28 45 34Fatigue 32 26 32 38 32Irritability 22 22 26 26 22Worry 21 21 28 27 21Depression 11 18 16 17 12Concentration and Forgetfulness 10 13 13 17 11Depressive ideas 11 16 17 17 11Anxiety 9 13 10 9 9Somatic symptoms 8 14 12 14 8Worry–Physical health 7 16 11 10 7Obsessions 7 9 13 3 7Phobias 6 7 6 5 6Compulsions 4 6 5 3 4Panic 2 1 0 3 2
Base 4456 90 76 76 4728
Men
Sleep Problems 23 24 31 25 24Fatigue 22 24 19 32 23Irritability 18 14 15 26 18Worry 16 15 24 21 17Depression 10 8 10 17 10Concentration and Forgetfulness 9 10 9 12 9Depressive ideas 8 11 11 9 8Anxiety 8 5 6 16 8Somatic symptoms 5 8 3 5 5Worry–Physical health 6 6 11 13 7Obsessions 4 4 9 6 4Phobias 4 2 3 4 3Compulsions 2 4 2 4 2Panic 2 0 - 4 2
Base 3575 95 66 80 3852
All Adults
Sleep Problems 29 26 29 34 29Fatigue 27 25 26 35 27Irritability 20 17 21 26 20Worry 19 18 26 24 19Depression 11 12 13 17 11Concentration and Forgetfulness 10 11 11 15 10Depressive ideas 9 13 14 12 9Anxiety 8 8 8 13 9Somatic symptoms 7 10 8 7 7Worry–Physical health 7 10 11 12 7Obsessions 5 6 11 5 6Phobias 5 4 4 4 5Compulsions 3 4 3 3 3Panic 2 1 0 4 2
Base 8031 185 142 156 8514
* Indian, Pakistani or Bangladeshi.

36
2
Psychiatric Morbidity among Adults living in Private Households, 2000
Prevalence of mental disorders and substance misuse
Table 2.3 Proportion of adults with a score of two or more on each CIS-R symptom
by region and sex
NHS Regional Office area
Northern Trent West North Eastern London South South England Wales Scotland Alland Midlands West East West
Yorkshire
Proportion of adults with a score of 2 or more on each symptomWomen
Sleep Problems 33 33 38 40 38 32 32 34 35 36 28 34Fatigue 33 31 27 37 30 37 32 30 32 37 29 32Irritability 24 22 22 23 22 25 18 21 22 26 22 22Worry 19 21 24 24 24 22 20 19 22 22 20 21Depression 15 13 8 15 12 11 9 10 12 14 10 12Concentration and Forgetfulness 12 11 8 14 11 10 11 7 11 11 10 11Depressive ideas 9 16 8 14 10 13 10 9 11 13 9 11Anxiety 10 10 7 13 10 9 7 10 9 12 8 9Somatic symptoms 7 9 9 9 6 10 7 10 8 7 8 8Worry–Physical health 7 7 8 10 7 10 7 5 7 7 6 7Obsessions 7 7 6 6 7 8 7 7 7 7 6 7Phobias 6 5 5 6 6 8 5 6 6 8 5 6Compulsions 3 3 5 5 4 4 3 2 4 3 3 4Panic 3 1 1 2 3 2 2 1 2 2 3 2
Base 532 418 405 562 437 495 724 435 4008 214 506 4728
Men
Sleep Problems 30 20 22 28 21 24 21 21 24 26 23 24Fatigue 24 19 18 25 23 24 23 25 23 22 20 23Irritability 19 16 17 23 19 18 15 20 18 15 16 18Worry 17 11 15 17 17 17 16 22 17 18 17 17Depression 13 8 9 9 10 12 9 13 10 11 9 10Concentration and Forgetfulness 8 10 8 11 8 9 9 8 9 12 7 9Depressive ideas 9 5 7 9 7 9 8 7 8 11 7 8Anxiety 8 4 7 9 8 10 7 11 8 9 6 8Somatic symptoms 7 4 6 4 8 6 5 6 6 5 4 5Worry–Physical health 7 6 4 6 8 7 7 6 7 9 5 7Obsessions 4 4 3 6 4 5 5 2 4 5 2 4Phobias 4 2 4 4 3 5 4 3 4 3 3 3Compulsions 4 3 3 2 2 3 1 3 3 2 1 2Panic 3 0 0 1 2 3 2 2 2 4 3 2
Base 431 333 334 429 392 386 578 356 3239 198 415 3852
All Adults
Sleep Problems 32 26 30 34 30 28 26 28 29 31 26 29Fatigue 28 25 22 31 26 31 27 28 27 29 25 27Irritability 21 19 20 23 21 21 16 21 20 20 19 20Worry 18 16 19 21 20 20 18 20 19 20 19 19Depression 14 11 9 12 11 11 9 11 11 13 10 11Concentration and Forgetfulness 10 10 8 13 10 10 10 8 10 12 8 10Depressive ideas 9 11 8 11 8 11 9 8 9 12 8 9Anxiety 9 7 7 11 9 9 7 10 9 10 7 9Somatic symptoms 7 6 7 7 7 8 6 8 7 6 6 7Worry–Physical health 7 6 6 8 7 8 7 5 7 8 6 7Obsessions 6 6 5 6 6 7 6 5 6 6 4 6Phobias 5 3 4 5 5 6 4 4 5 5 4 5Compulsions 4 3 4 4 3 4 2 2 3 3 2 3Panic 3 1 1 2 2 2 2 2 2 3 3 2
Base 963 751 739 991 829 881 1302 791 7247 412 921 8580

37
2
Psychiatric Morbidity among Adults living in Private Households, 2000
Prevalence of mental disorders and substance misuse
Table 2.4 CIS-R score (grouped)
by age and sex
Age
16–19 20–24 25–29 30–34 35–39 40–44 45–49 50–54 55–59 60–64 65–69 70–74 All
CIS-R Score % % % % % % % % % % % % %
Women
0–5 53 60 61 60 62 58 64 57 67 71 73 72 636–11 28 19 18 20 20 21 20 20 18 16 15 17 19Under 12 81 79 79 80 82 79 84 77 85 87 88 89 82
12–17 9 11 13 9 9 9 10 13 7 7 7 7 1018 and over 10 9 8 10 10 12 6 10 8 6 6 4 912 and over 19 21 21 20 18 21 16 23 15 13 12 11 18
Base 151 258 398 574 564 460 363 435 389 407 373 356 4728
Men
0–5 80 77 66 72 71 70 68 72 74 74 84 85 736–11 12 15 20 16 15 16 14 15 13 13 12 9 14Under 12 91 92 86 88 85 85 81 87 87 87 95 94 88
12–17 4 7 8 6 7 9 8 6 6 6 3 4 618 and over 5 2 7 6 8 6 11 7 7 7 2 2 612 and over 9 8 14 12 15 15 19 13 13 13 5 6 12
Base 183 202 332 379 442 382 360 387 314 332 295 244 3852
All adults
0–5 68 68 64 66 66 64 66 64 70 73 78 78 686–11 19 17 19 18 17 18 17 18 16 14 13 14 17Under 12 87 85 83 84 83 82 83 82 86 87 91 92 85
12–17 6 9 10 8 8 9 9 10 7 6 5 5 818 and over 7 6 8 8 9 9 8 9 7 7 4 3 712 and over 13 15 17 16 17 18 17 18 14 13 9 8 15
Base 334 460 730 953 1006 842 723 822 703 739 668 600 8580

38
2
Psychiatric Morbidity among Adults living in Private Households, 2000
Prevalence of mental disorders and substance misuse
Table 2.5 CIS-R score (grouped)
by ethnicity and sex
Ethnicity
White Black South Asian* Other All
CIS-R Score % % % % %
Women
0–15 63 61 61 56 636–11 19 21 16 20 19Under 12 82 82 77 76 82
12–17 10 4 7 11 1018 and over 8 14 15 13 912 and over 18 18 23 24 18
Base 4456 90 76 76 4728
Men
0–5 73 75 73 60 736–11 14 14 11 25 14Under 12 88 89 84 85 88
12–17 6 6 12 7 618 and over 6 6 4 8 612 and over 12 11 16 15 12
Base 3575 95 66 80 3852
All adults
0–5 68 69 67 58 686–11 17 17 14 23 17Under 12 85 86 81 81 85
12–17 8 5 10 9 818 and over 7 9 10 10 712 and over 15 14 19 19 15
Base 8031 185 142 156 8580
* Indian, Pakistani or Bagladeshi.

39
2
Psychiatric Morbidity among Adults living in Private Households, 2000
Prevalence of mental disorders and substance misuse
Table 2.6 CIS-R score (grouped)
by region and sex
NHS Regional Office area
Northern Trent West North Eastern London South South England Wales Scotland Alland Midlands West East West
Yorkshire
CIS-R Score % % % % % % % % % % % %
Women
0–5 63 61 62 57 62 62 64 67 62 58 67 636–11 21 21 23 19 20 17 21 15 20 20 17 19Under 12 83 82 85 76 82 78 85 83 82 79 85 82
12–17 8 8 10 12 10 12 9 9 10 8 8 1018 and over 9 10 5 12 9 9 6 8 8 14 8 912 and over 17 18 15 24 18 22 15 17 18 21 15 18
Base 532 418 405 562 437 495 724 435 4008 214 506 4728
Men
0–5 69 78 77 70 75 73 72 71 73 75 76 736–11 17 13 13 15 13 15 17 15 15 11 13 14Under 12 86 91 89 85 88 87 89 86 88 86 90 88
12–17 7 5 6 9 5 4 7 7 6 7 5 618 and over 7 5 5 6 7 8 5 7 6 7 5 612 and over 14 9 11 15 12 13 11 14 12 14 10 12
Base 431 333 334 429 392 386 578 356 3239 198 415 3852
All adults
0–5 66 69 69 64 68 67 68 69 67 67 72 686–11 19 17 18 17 16 16 19 15 17 15 15 17Under 12 85 87 87 80 85 83 87 84 85 82 87 85
12–17 8 6 8 11 7 8 8 8 8 8 6 818 and over 8 7 5 9 8 9 5 7 7 10 6 712 and over 15 13 13 20 15 17 13 16 15 18 13 15
Base 963 751 739 991 829 881 1302 791 7247 412 921 8580

40
2
Psychiatric Morbidity among Adults living in Private Households, 2000
Prevalence of mental disorders and substance misuse
Table 2.7 Prevalence of neurotic disorders
by age and sex (rate per thousand population)
Age
16–19 20–24 25–29 30–34 35–39 40–44 45–49 50–54 55–59 60–64 65–69 70–74 All
Rates per thousand in past week*Women
Mixed anxiety anddepressive disorder 124 138 131 115 92 127 98 126 75 87 83 68 108
Generalised anxiety disorder 11 18 48 39 54 64 54 73 58 45 37 30 46Depressive episode 27 35 21 30 39 26 28 33 46 14 10 17 28All Phobias 21 15 26 22 35 30 22 27 14 16 13 4 22Obsessive compulsive disorder 9 18 16 13 18 18 15 7 17 15 5 4 13Panic disorder 6 - 12 6 6 5 9 15 10 - 7 7 7
Any neurotic disorder 192 209 216 205 191 229 188 246 176 148 147 119 194
Base 151 258 398 574 564 460 363 435 389 407 373 356 4728
Men
Mixed anxiety anddepressive disorder 51 44 93 59 85 89 85 62 61 72 35 41 68
Generalised anxiety disorder 16 11 32 52 53 58 87 59 40 39 14 16 43Depressive episode 9 8 27 12 36 30 44 32 22 35 2 5 23All Phobias 6 19 11 18 17 12 28 13 12 12 - 4 13Obsessive compulsive disorder 9 20 8 8 8 9 10 7 11 12 - - 9Panic disorder 5 8 8 8 5 5 11 8 18 4 - - 7
Any neurotic disorder 86 100 152 130 154 162 204 150 134 145 50 66 135
Base 183 202 332 379 442 382 360 387 314 332 295 244 3852
All Adults
Mixed anxiety anddepressive disorder 83 94 110 88 89 108 91 95 68 79 60 55 88
Generalised anxiety disorder 14 15 39 45 53 61 71 66 50 42 26 23 44Depressive episode 17 22 24 22 37 28 36 32 34 24 6 11 26All Phobias 13 16 18 20 26 21 25 20 13 14 7 4 18Obsessive compulsive disorder 9 19 12 11 13 13 13 7 14 13 2 2 11Panic disorder 5 4 9 7 6 5 10 12 14 2 4 4 7
Any neurotic disorder 133 158 181 169 172 195 197 198 155 146 102 94 164
Base 334 460 730 953 1006 842 723 822 703 739 668 600 8580
* People may have more than one type of disorder.

41
2
Psychiatric Morbidity among Adults living in Private Households, 2000
Prevalence of mental disorders and substance misuse
Table 2.8 Prevalence of neurotic disorders
by ethnicity and sex (rate per thousand population)
Ethnicity
White Black South Asian* Other All
Rates per thousand in the past week**Women
Mixed anxiety and depressive disorder 107 82 96 19 108Generalised anxiety disorder 46 42 70 27 46Depressive episode 27 28 41 13 28All Phobias 22 37 23 6 22Obsessive compulsive disorder 12 44 56 - 13Panic disorder 7 - - 21 7
Any neurotic disorder 192 178 229 249 194
Base 4456 90 76 76 4728
Men
Mixed anxiety and depressive disorder 67 69 104 87 68Generalised anxiety disorder 44 35 14 5 43Depressive episode 22 26 33 48 23All Phobias 13 7 14 17 13Obsessive compulsive disorder 9 - 24 - 9Panic disorder 7 5 - 13 7
Any neurotic disorder 134 117 156 167 135
Base 3575 95 66 80 3852
All Adults
Mixed anxiety and depressive disorder 87 74 100 134 88Generalised anxiety disorder 45 38 42 40 44Depressive episode 25 27 37 32 26All Phobias 18 19 19 12 18Obsessive compulsive disorder 10 18 40 - 11Panic disorder 7 3 - 16 7
Any neurotic disorder 163 141 192 204 164
Base 8031 185 142 156 8580
* Indian, Pakistani or Bangladeshi.** People may have more than one disorder.
42
2
Psychiatric Morbidity among Adults living in Private Households, 2000
Prevalence of mental disorders and substance misuse
Table 2.9 Prevalence of neurotic disorders
by region and sex (rate per thousand population)
NHS Regional Office area
Northern Trent West North Eastern London South South England Wales Scotland Alland Midlands West East West
Yorkshire
Rates per thousand in past week*Women
Mixed anxiety and depressive disorder 95 96 104 132 119 130 91 100 108 123 92 108Generalised anxiety disorder 51 46 37 75 44 38 38 40 46 56 42 46Depressive episode 26 30 23 44 27 32 21 12 27 43 30 28All Phobias 18 20 17 27 15 30 14 33 22 30 20 22Obsessive compulsive disorder 13 10 15 20 9 19 9 11 13 25 8 13Panic disorder 11 7 1 5 15 9 8 2 7 - 8 7
Any neurotic disorder 180 187 172 252 201 224 163 177 195 230 170 194
Base 532 418 405 562 437 495 724 435 4008 214 506 4728
Men
Mixed anxiety and depressive disorder 78 56 71 88 79 39 67 90 70 75 44 68Generalised anxiety disorder 47 33 34 51 29 68 36 44 44 45 34 43Depressive episode 39 18 12 12 30 40 19 15 23 32 19 23All Phobias 22 8 12 26 17 13 9 4 14 12 7 13Obsessive compulsive disorder 7 6 3 15 13 12 6 6 9 10 8 9Panic disorder 8 3 2 1 5 8 7 10 6 11 17 7
Any neurotic disorder 160 103 119 154 138 140 120 156 136 154 109 135
Base 431 333 334 429 392 386 578 356 3239 198 415 3852
All Adults
Mixed anxiety and depressive disorder 87 76 87 110 99 84 79 95 89 98 68 88Generalised anxiety disorder 49 39 35 63 37 53 37 42 45 50 38 44Depressive episode 32 24 18 28 28 36 20 13 25 37 25 26All Phobias 20 14 14 27 16 21 12 19 18 20 14 18Obsessive compulsive disorder 10 8 9 18 11 16 8 9 11 17 8 11Panic disorder 10 5 1 3 10 9 7 6 7 6 12 7
Any neurotic disorder 170 145 145 203 169 182 142 167 165 190 141 164
Base 963 751 739 991 829 881 1302 791 7247 412 921 8580
* People may have more than one disorder.

43
2
Psychiatric Morbidity among Adults living in Private Households, 2000
Prevalence of mental disorders and substance misuse
Table 2.10 Prevalence of personality disorder from clinical interviews
by age and sex
Age
16-34 35-54 55-74 All
Type of personality disorder Rates per thousand
Women
Obsessive-Compulsive - 8 37 13Avoidant 2 15 2 7Schizoid 6 - 22 8Paranoid 3 5 - 3Borderline 5 7 - 4Antisocial 5 0 - 2Dependent - - 1 0Schizotypal 1 1 1 1Histrionic - - - -Narcissistic - - - -
Any personality disorder 17 29 63 34
Base 95 158 102 355
Men
Obsessive-Compulsive 22 26 30 26Avoidant 9 17 - 10Schizoid 8 2 21 9Paranoid 9 21 2 12Borderline 2 24 - 10Antisocial 8 17 - 10Dependent 5 - - 2Schizotypal - 0 - 0Histrionic - - - -Narcissistic - - - -
Any personality disorder 52 58 53 54
Base 72 126 73 271
All adults
Obsessive-Compulsive 11 17 34 19Avoidant 6 16 1 8Schizoid 7 1 22 8Paranoid 6 13 1 7Borderline 3 15 - 7Antisocial 7 9 - 6Dependent 3 - 0 1Schizotypal 1 1 1 1Histrionic - - - -Narcissistic - - - -
Any personality disorder 34 44 58 44
Base 167 284 175 626

44
2
Psychiatric Morbidity among Adults living in Private Households, 2000
Prevalence of mental disorders and substance misuse
Table 2.11 Prevalence of probable psychotic disorder
by age and sex
Age
16–19 20–24 25–29 30–34 35–39 40–44 45–49 50–54 55–59 60–64 65–69 70–74 All
Rates per thousand in the past year
Women 5 4 2 4 8 12 6 5 - 1 6 2 5Men - - - 13 8 7 5 9 10 7 - 4 6All adults 2 2 1 9 8 10 6 7 5 4 3 3 5
BasesWomen 151 258 398 574 564 460 363 435 389 407 373 356 4728Men 183 202 332 379 442 382 360 387 314 332 295 244 3852All adults 334 460 730 953 1006 842 723 822 703 739 668 600 8580
Table 2.12 Prevalence of probable psychotic disorder
by ethnicity and sex
Ethnicity
White Black South Asian* Other All
Rates per thousand in the past year
Women 5 17 - - 5Men 6 18 - - 6All adults 5 18 - - 5
BasesWomen 4456 90 76 76 4698Men 3575 95 66 80 3816All adults 8031 185 142 156 8514
* Indian, Pakistani or Bangladeshi.
Table 2.13 Prevalence of probable psychotic disorder
by region and sex
NHS Regional Office area
Northern Trent West North Eastern London South South England Wales Scotland Alland Midlands West East West
Yorkshire
Rates per thousand in the past year
Women 8 11 4 5 6 3 3 - 5 - 9 5Men 9 9 3 8 2 4 7 3 6 9 2 6All adults 9 10 3 6 4 4 5 1 5 5 5 5
BasesWomen 532 418 405 562 437 495 724 435 4008 214 506 4728Men 431 333 334 429 392 386 578 356 3239 198 415 3852All adults 963 751 739 991 829 881 1302 791 7247 412 921 8580

45
2
Psychiatric Morbidity among Adults living in Private Households, 2000
Prevalence of mental disorders and substance misuse
Table 2.14 Prevalence of hazardous drinking in the past year
by age and sex
Age
16–19 20–24 25–29 30–34 35–39 40–44 45–49 50–54 55–59 60–64 65–69 70–74 All
AUDIT score % % % % % % % % % % % % %
Women
Score: 0–7 68 71 77 83 84 86 89 87 92 92 94 95 85Score: 8–15 27 24 21 16 14 13 10 12 8 8 6 5 14Score: 16–40 5 5 2 1 2 1 1 1 - - 0 - 2
Hazardous drinking(Score 8 and over) 32 29 23 17 16 14 11 13 8 8 6 5 15
Mean AUDIT Score 6 6 5 5 4 4 4 4 3 3 3 3 4
Base 151 258 397 571 562 457 363 434 388 403 369 352 4705
Men
Score: 0–7 55 38 50 59 59 64 63 70 68 80 76 86 62Score: 8–15 37 48 40 33 35 32 34 27 29 18 22 13 32Score: 16–40 8 14 10 7 6 4 3 3 3 2 2 1 6
Hazardous drinking(Score 8 and over) 45 62 50 41 41 36 37 30 32 20 24 14 38
Mean AUDIT Score 8 9 8 7 7 7 6 6 6 5 5 4 7
Base 183 200 332 378 441 380 357 387 314 331 294 236 3833
All Adults
Score: 0–7 61 55 62 72 71 75 76 79 80 86 85 91 74Score: 8–15 32 35 32 24 24 22 22 19 18 13 13 9 23Score: 16–40 6 9 6 4 4 3 2 2 2 1 1 1 4
Hazardous drinking(Score 8 and over) 39 45 38 28 29 25 24 21 20 14 15 9 26
Mean AUDIT Score 7 7 7 6 6 5 5 5 5 4 4 3 5
Base 334 458 729 949 1003 837 720 821 702 734 663 588 8538

46
2
Psychiatric Morbidity among Adults living in Private Households, 2000
Prevalence of mental disorders and substance misuse
Table 2.15 Prevalence of hazardous drinking in the past year
by ethnicity and sex
Ethnicity
White Black South Asian* Other All
AUDIT score % % % % %
Women
Score: 0–7 84 87 96 91 85Score: 8–15 14 10 4 7 14Score: 16–40 2 4 - 2 2
Hazardous drinking (Score 8 and over) 16 13 4 9 15
Mean AUDIT Score 4 3 1 3 4
Base 4441 90 76 76 4705
Men
Score: 0–7 61 79 89 70 62Score: 8–15 33 19 7 19 32Score: 16–40 6 2 3 11 6
Hazardous drinking (Score 8 and over) 39 21 11 30 38
Mean AUDIT Score 7 5 3 6 7
Base 3562 95 66 80 3833
All Adults
Score: 0–7 73 82 92 80 74Score: 8–15 24 15 6 14 23Score: 16–40 4 3 2 7 4
Hazardous drinking (Score 8 and over) 27 18 8 20 26
Mean AUDIT Score 6 4 2 5 5
Base 8003 185 142 156 8538
* Indian, Pakistani or Bangladeshi.

47
2
Psychiatric Morbidity among Adults living in Private Households, 2000
Prevalence of mental disorders and substance misuse
Table 2.16 Prevalence of hazardous drinking in the past year
by region and sex
NHS Regional Office area
Northern Trent West North Eastern London South South England Wales Scotland Alland Midlands West East West
Yorkshire
AUDIT score % % % % % % % % % % % %
Women
Score: 0–7 81 83 86 79 88 84 89 85 84 85 85 85Score: 8–15 17 16 11 19 11 15 10 14 14 13 13 14Score: 16–40 2 1 2 2 1 1 1 1 1 1 2 2
Hazardous drinking(Score 8 and over) 19 17 14 21 12 16 11 15 16 15 15 15
Mean AUDIT Score 5 4 4 5 4 4 4 4 4 4 4 4
Base 530 415 405 559 435 492 721 430 3987 213 505 4705
Men
Score: 0–7 56 66 60 57 71 66 65 66 63 56 59 62Score: 8–15 37 32 32 39 25 27 29 30 31 40 33 32Score: 16–40 7 2 8 5 4 7 7 4 5 4 8 6
Hazardous drinking(Score 8 and over) 44 34 40 43 29 34 35 34 37 44 41 38
Mean AUDIT Score 7 6 7 7 6 6 7 6 7 7 7 7
Base 430 332 333 426 387 385 577 354 3224 195 414 3833
All Adults
Score: 0–7 69 74 73 68 80 75 77 76 74 70 72 74Score: 8–15 27 24 22 29 18 21 20 22 23 27 23 23Score: 16–40 5 1 5 3 2 4 4 2 3 3 5 4
Hazardous drinking(Score 8 and over) 31 26 27 32 20 25 23 24 26 30 28 26
Mean AUDIT Score 6 5 5 6 5 5 5 5 5 6 6 5
Base 960 747 738 985 822 877 1298 784 7211 408 919 8538

48
2
Psychiatric Morbidity among Adults living in Private Households, 2000
Prevalence of mental disorders and substance misuse
Table 2.17 Prevalence of alcohol dependence
by age and sex (rate per thousand population)
Age
16–19 20–24 25–29 30–34 35–39 40–44 45–49 50–54 55–59 60–64 65–69 70–74 All
SAD-Q Score Rates per thousand in past six months
Women
Score 0–3: No dependence 926 929 947 968 965 978 988 982 993 994 993 1000 971Score 4–19: Mild dependence 74 71 53 30 33 18 10 18 7 6 7 - 28Score 20–34: Moderate dependence - - - 2 2 2 - - - - - - 1Score 35–60: Severe dependence - - - - - 2 2 - - - - - 0
Base 151 258 397 571 562 457 363 434 388 403 369 352 4705
Men
Score 0–3: No dependence 810 756 790 887 831 892 935 928 922 973 971 980 881Score 4–19: Mild dependence 164 237 206 105 158 93 62 63 78 24 29 20 111Score 20–34: Moderate dependence 26 7 5 6 9 12 3 6 - 2 - - 7Score 35–60: Severe dependence - - - 3 3 2 - 3 - 2 - - 1
Base 183 200 332 377 441 380 357 387 313 331 294 236 3831
All Adults
Score 0–3: No dependence 862 847 861 929 897 935 962 955 958 984 983 991 926Score 4–19: Mild dependence 124 150 137 66 96 56 36 41 42 14 17 9 69Score 20–34: Moderate dependence 14 3 3 4 5 7 2 3 - 1 - - 4Score 35–60: Severe dependence - - - 1 1 2 1 1 - 1 - - 1
Base 334 458 729 948 1003 837 720 821 701 734 663 588 8536

49
2
Psychiatric Morbidity among Adults living in Private Households, 2000
Prevalence of mental disorders and substance misuse
Table 2.18 Prevalence of alcohol dependence
by ethnicity and sex (rate per thousand population)
Ethnicity
White Black South Asian* Other All
SAD-Q Score Rates per thousand in past six months
Women
Score 0–3: No dependence 971 932 1000 977 971Score 4–19: Mild dependence 28 68 - 23 28Score 20–34: Moderate dependence 1 - - - 1Score 35–60: Severe dependence 0 - - - 0
Base 4441 90 76 76 4705
Men
Score 0–3: No dependence 877 946 951 869 881Score 4–19: Mild dependence 115 54 49 106 111Score 20–34: Moderate dependence 7 - - 25 7Score 35–60: Severe dependence 1 - - - 1
Base 3561 95 66 80 3831
All Adults
Score 0–3: No dependence 925 940 975 918 926Score 4–19: Mild dependence 71 60 25 68 69Score 20–34: Moderate dependence 4 - - 13 4Score 35–60: Severe dependence 1 - - - 1
Base 8002 185 142 156 8536
* Indian, Pakistani or Bangladeshi.

50
2
Psychiatric Morbidity among Adults living in Private Households, 2000
Prevalence of mental disorders and substance misuse
Table 2.19 Prevalence of alcohol dependence
by region and sex (rate per thousand population)
NHS Regional Office area
Northern Trent West North Eastern London South South England Wales Scotland Alland Midlands West East West
Yorkshire
SAD-Q Score Rates per thousand in past six months
Women
Score 0–3: No dependence 967 983 975 964 970 958 975 987 972 981 961 971Score 4–19: Mild dependence 31 15 25 35 30 40 25 13 27 19 39 28Score 20–34: Moderate dependence 2 1 - 1 - 1 - - 1 - 1 1Score 35–60: Severe dependence - - - - - 1 - - 0 - 2 0
Base 530 415 405 559 435 492 721 430 3987 213 505 4705
Men
Score 0–3: No dependence 871 907 884 857 920 882 871 906 885 843 868 881Score 4–19: Mild dependence 117 88 113 134 65 111 123 90 108 154 117 111Score 20–34: Moderate dependence 7 5 3 7 13 7 6 3 6 - 13 7Score 35–60: Severe dependence 4 - - 2 1 1 - - 1 3 1 1
Base 430 332 333 426 387 384 577 354 3223 195 413 3831
All Adults
Score 0–3: No dependence 919 945 929 910 945 920 923 948 928 908 916 926Score 4–19: Mild dependence 74 52 69 84 48 75 74 50 67 91 76 69Score 20–34: Moderate dependence 4 3 2 4 7 4 3 2 4 - 7 4Score 35–60: Severe dependence 2 - - 1 1 1 - - 1 2 1 1
Base 960 747 738 985 822 876 1298 784 7210 408 918 8536

51
2
Psychiatric Morbidity among Adults living in Private Households, 2000
Prevalence of mental disorders and substance misuse
Table 2.20 Lifetime experience of drug use
by age and sex
Age
16–19 20–24 25–29 30–34 35–39 40–44 45–49 50–54 55–59 60–64 65–69 70–74 All
Percentage reporting using each drugWomen
Drugs ever usedCannabis 34 49 34 27 23 16 14 8 2 2 0 1 19Amphetamines 10 16 10 6 6 3 3 2 0 1 1 0 5Cocaine 4 9 6 4 4 3 1 1 0 - - - 3Crack - 1 0 1 0 0 - - - - - - 0Ecstasy 8 12 7 4 2 1 0 - - - - - 3Heroin 1 1 0 0 1 1 0 - - - - - 0LSD 0 8 5 3 2 1 2 1 0 - - 0 2Magic mushrooms 2 6 7 6 6 3 1 1 - - - - 3Methadone - 1 - 0 1 0 0 0 - - - - 0Tranquillisers 2 4 2 3 3 3 2 4 4 2 2 1 3Amyl nitrite (poppers) 4 6 7 4 4 1 1 0 - - - - 2Anabolic steroids - - - 1 0 0 - - - - 0 - 0Volatile substances 1 2 2 1 0 0 0 - - - - - 1
Any drug 37 50 36 31 26 19 17 12 5 4 3 2 21
Base 151 258 396 572 563 457 363 435 387 403 367 352 4704
Men
Drugs ever usedCannabis 37 54 56 49 35 29 23 17 9 6 1 2 30Amphetamines 11 24 24 17 8 9 4 4 2 - 0 - 10Cocaine 7 16 20 8 4 4 2 1 1 0 0 - 6Crack 2 3 2 1 1 1 1 0 1 - 0 - 1Ecstasy 8 17 19 8 3 1 1 0 - - 0 - 5Heroin 2 2 3 1 1 1 1 1 - - 0 - 1LSD 7 14 16 9 5 5 5 3 - 0 0 - 6Magic mushrooms 9 14 19 12 9 7 4 2 1 1 0 - 7Methadone 2 1 2 1 1 0 1 1 - - - - 1Tranquillisers 3 5 6 2 4 3 3 2 1 0 1 2 3Amyl nitrite (poppers) 6 16 16 12 6 5 2 2 1 0 - - 6Anabolic steroids 1 3 2 1 1 0 0 0 - - - 0 1Volatile substances 3 4 5 4 2 1 1 - 1 - - - 2
Any drug 38 55 60 53 37 32 27 18 12 7 2 4 32
Base 183 200 332 378 441 381 358 387 314 331 294 239 3838
All adults
Drugs ever usedCannabis 36 52 46 37 29 23 18 13 6 4 1 1 24Amphetamines 10 20 17 12 7 6 3 3 1 1 0 0 7Cocaine 6 13 13 6 4 3 2 1 1 0 0 - 4Crack 1 2 1 1 1 0 0 0 0 - 0 - 1Ecstasy 8 14 13 6 3 1 1 0 - - 0 - 4Heroin 1 1 1 0 1 1 1 0 - - 0 - 1LSD 4 11 11 6 4 3 4 2 0 0 0 0 4Magic mushrooms 6 10 14 9 7 5 3 1 0 1 0 0 5Methadone 1 1 1 1 1 0 1 1 - - - - 1Tranquillisers 3 5 4 2 4 3 3 3 2 1 1 1 3Amyl nitrate (poppers) 5 10 12 8 5 3 1 1 0 0 - - 4Anabolic steroids 0 1 1 1 0 0 0 0 - - 0 0 0Volatile substances 2 3 4 3 1 1 0 - 0 - - - 1
Any drug 37 52 49 41 32 25 22 15 8 5 2 3 27
Base 334 458 728 950 1004 838 721 822 701 734 661 591 8542

52
2
Psychiatric Morbidity among Adults living in Private Households, 2000
Prevalence of mental disorders and substance misuse
Table 2.21 Illicit drug use in the last year
by age and sex
Age
16–19 20–24 25–29 30–34 35–39 40–44 45–49 50–54 55–59 60–64 65–69 70–74 All
Percentage reporting using each drugWomen
Drugs used in last yearCannabis 20 29 14 9 6 2 2 0 1 - - 1 7Amphetamines 6 4 2 1 0 0 - - - - - - 1Cocaine 3 5 2 1 1 - - - - - - - 1Crack - 0 0 0 0 - - - - - - - 0Ecstasy 6 6 3 1 1 - - - - - - - 1Heroin 1 0 - 0 0 - - - - - - - 0LSD - 1 0 - - - - - - - - - 0Magic mushrooms 1 2 1 0 0 - - - - - - - 0Methadone - - - 0 0 - - - - - - - 0Tranquillisers - - 1 1 1 1 - 0 1 1 1 0 0Amyl nitrite (poppers) 1 1 1 0 - - 0 - - - - - 0Anabolic steroids - - - - - - - - - - - - -Volatile substances - 0 0 - - - - - - - - - 0
Any drug 22 29 15 9 7 3 3 1 2 1 1 1 8
Base 151 258 396 572 563 457 363 435 387 403 367 352 4704
Men
Drugs used in last yearCannabis 30 36 32 16 9 6 6 1 1 1 1 - 12Amphetamines 7 8 7 4 1 1 - 1 - - - - 3Cocaine 4 9 8 5 2 2 0 0 0 - - - 3Crack 1 1 0 0 0 - 0 - 1 - - - 0Ecstasy 6 13 8 3 1 0 - - - - - - 3Heroin 1 1 0 - 1 - 0 - - - - - 0LSD 4 3 2 0 - - - - - - - - 1Magic mushrooms 3 4 3 0 0 - - 0 - - - - 1Methadone 1 1 0 - 0 - - - - - - - 0Tranquillisers 2 2 1 - 1 - - 1 - 0 - 1 1Amyl nitrite (poppers) 2 3 2 1 1 0 0 - 1 - - - 1Anabolic steroids 1 1 1 0 - - - 0 - - - - 0Volatile substances 0 2 - - - - - - - - - - 0
Any drug 32 37 34 18 9 7 6 3 2 1 1 1 13
Base 183 200 332 378 441 381 358 387 314 331 294 239 3838
All adults
Drugs used in last yearCannabis 25 32 24 12 7 4 4 1 1 0 0 1 10Amphetamines 7 6 5 3 1 1 - 0 - - - - 2Cocaine 4 7 5 3 1 1 0 0 0 - - - 2Crack 0 1 0 0 0 - 0 - 0 - - - 0Ecstasy 6 9 6 2 1 0 - - - - - - 2Heroin 1 0 0 0 0 - 0 - - - - - 0LSD 2 2 1 0 - - - - - - - - 0Magic mushrooms 2 3 2 0 0 - - 0 - - - - 1Methadone 0 0 0 0 0 - - - - - - - 0Tranquillisers 1 1 1 0 1 0 - 1 0 0 0 0 1Amyl nitrite (poppers) 1 2 1 1 0 0 0 - 0 - - - 1Anabolic steroids 0 0 0 0 - - - 0 - - - - 0Volatile substances 0 1 0 - - - - - - - - - 0
Any drug 28 33 25 13 8 5 4 2 2 1 1 1 11
Base 334 458 728 950 1004 838 721 822 701 734 661 591 8542

53
2
Psychiatric Morbidity among Adults living in Private Households, 2000
Prevalence of mental disorders and substance misuse
Table 2.22 Illicit drug use in the last year
by ethnicity and sex
Ethnicity
White Black South Asian* Other Total
Percentage reporting using each type of drugWomen
Drugs used in last yearCannabis 7 8 12 16 7Amphetamines 1 1 - - 1Cocaine 1 - 1 - 1Crack 0 1 - - 0Ecstasy 1 1 4 - 1Heroin 0 - - - 0LSD 0 - - - 0Magic mushrooms 0 - - - 0Methadone 0 - - - 0Tranquillisers 0 - - - 0Amyl nitrite (poppers) 0 1 - - 0Anabolic steroids - - - - -Volatile substances 0 - - - 0
Any drug 8 8 12 16 8
Base 4443 90 76 75 4684
Men
Drugs used in last yearCannabis 13 12 5 11 12Amphetamines 3 - 1 5 3Cocaine 3 1 1 4 3Crack 0 - 1 3 0Ecstasy 3 1 1 1 3Heroin 0 - 1 2 0LSD 1 - - - 1Magic mushrooms 1 1 - - 1Methadone 0 - 1 2 0Tranquillisers 1 - 1 3 1Amyl nitrite (poppers) 1 1 - - 1Anabolic steroids 0 - - - 0Volatile substances 0 - - - 0
Any drug 14 12 5 13 13
Base 3568 95 66 79 3808
All adults
Drugs used in last yearCannabis 10 10 9 13 10Amphetamines 2 1 0 3 2Cocaine 2 1 1 2 2Crack 0 1 0 2 0Ecstasy 2 1 2 0 2Heroin 0 - 0 1 0LSD 0 - - - 0Magic mushrooms 1 1 - - 1Methadone 0 - 0 1 0Tranquillisers 1 - 0 2 1Amyl nitrite (poppers) 1 1 - - 1Anabolic steroids 0 - - - 0Volatile substances 0 - - - 0
Any drug 11 10 9 15 11
Base 8011 185 142 154 8492
* Indiian, Pakistani or Bangladeshi.

54
2
Psychiatric Morbidity among Adults living in Private Households, 2000
Prevalence of mental disorders and substance misuse
Table 2.23 Illicit drug use in the last year
by region and sex
NHS Regional Office area
Northern Trent West North Eastern London South South England Wales Scotland Alland Midlands West East West
Yorkshire
Percentage reporting using each drugWomen
Drugs used in last yearCannabis 6 3 5 7 8 14 6 6 7 6 7 7Amphetamines 1 1 1 2 1 1 1 0 1 1 3 1Cocaine 1 0 - 1 1 4 1 0 1 - 1 1Crack 0 - 0 - - 0 0 0 0 - 0 0Ecstasy 1 1 0 0 1 4 0 1 1 0 2 1Heroin 0 1 - 0 - - - 0 0 - - 0LSD 0 - 0 0 0 0 - - 0 - 0 0Magic mushrooms 0 0 0 0 0 1 0 1 0 - 1 0Methadone 0 - - - - - - 0 0 - - 0Tranquillisers 0 0 - 0 0 1 1 0 0 0 0 0Amyl nitrite (poppers) - 0 0 1 - 0 0 - 0 - 0 0Anabolic steroids - - - - - - - - - - - -Volatile substances 0 - - - 0 - - - 0 - - 0
Any drug 6 3 5 9 8 15 7 6 8 6 8 8
Base 528 415 405 559 435 490 722 432 3986 213 505 4704
Men
Drugs used in last yearCannabis 10 11 8 14 12 16 13 11 12 11 15 12Amphetamines 3 3 2 2 1 3 4 2 3 1 4 3Cocaine 2 1 2 2 4 6 3 3 3 2 2 3Crack 0 0 1 1 - 0 0 - 0 - - 0Ecstasy 3 1 3 2 2 5 4 2 3 1 3 3Heroin 0 0 1 1 - 1 - - 0 - - 0LSD 1 1 1 1 0 1 1 - 1 1 2 1Magic mushrooms 1 0 0 2 1 1 1 1 1 - 1 1Methadone - 0 1 0 - 0 - - 0 - - 0Tranquillisers 1 1 1 1 0 1 0 1 1 - 1 1Amyl nitrite (poppers) 1 1 1 1 1 0 2 1 1 1 0 1Anabolic steroids 0 - 1 1 0 - - - 0 1 - 0Volatile substances - - - 1 - - 0 - 0 - 0 0
Any drug 11 12 9 14 13 18 13 12 13 11 17 13
Base 430 332 333 427 388 385 578 356 3229 194 415 3838
All adults
Drugs used in last yearCannabis 8 7 7 11 10 15 9 8 10 8 11 10Amphetamines 2 2 1 2 1 2 2 1 2 1 3 2Cocaine 1 1 1 1 2 5 2 2 2 1 1 2Crack 0 0 0 0 - 0 0 0 0 - 0 0Ecstasy 2 1 1 1 2 4 2 2 2 0 3 2Heroin 0 0 0 0 - 0 - 0 0 - - 0LSD 0 0 1 0 0 1 0 - 0 0 1 0Magic mushrooms 1 0 0 1 0 1 1 1 1 - 1 1Methadone 0 0 0 0 - 0 - 0 0 - - 0Tranquillisers 1 0 0 1 0 1 1 1 1 0 1 1Amyl nitrite (poppers) 0 0 1 1 0 0 1 1 1 1 0 1Anabolic steroids 0 - 1 0 0 - - - 0 1 - 0Volatile substances 0 - - 0 0 - 0 - 0 - 0 0
Any drug 9 8 7 12 11 16 10 9 10 9 12 11
Base 958 747 738 986 823 875 1300 788 7215 407 920 8542

55
2
Psychiatric Morbidity among Adults living in Private Households, 2000
Prevalence of mental disorders and substance misuse
Table 2.24 Prevalence of drug dependence
by age and sex (rate per thousand population)
Age
16–19 20–24 25–29 30–34 35–39 40–44 45–49 50–54 55–59 60–64 65–69 70–74 All
Rates per thousand in past yearWomen
Dependence on...Cannabis 42 81 28 21 15 1 3 - 1 - - - 16Amphetamines 16 12 3 1 2 - - - - - - - 3Cocaine - 10 - 2 - - - - - - - - 1Crack - 3 - 3 - - - - - - - - 1Ecstasy 30 6 3 2 - - - - - - - - 3Heroin/Methadone 6 3 - 1 1 - - - - - - - 1Tranquillisers - - 1 4 3 2 - 4 3 4 8 - 2Volatile substances - - - - - - - - - - - - -
Cannabis only 18 76 27 16 14 1 3 - 1 - - - 14Other drug(s) with or
without cannabis dependence 41 18 5 7 6 2 - 4 3 4 8 - 7
Any drug dependence 59 94 31 24 19 4 3 4 4 4 8 - 21
Base 150 258 396 572 563 457 363 435 387 403 367 352 4703
Men
Dependence on...Cannabis 107 175 117 49 21 14 31 5 2 2 - - 46Amphetamines 12 25 18 - 1 - - 3 - - - - 5Cocaine 11 6 8 - 6 9 - - - - - - 4Crack 8 - - - 5 - - - 5 - - - 2Ecstasy 23 54 27 2 2 - - - - - - - 9Heroin/Methadone 8 6 2 - 5 - 1 - - - - - 2Tranquillisers 4 6 2 - 6 - - - - - - 2 2Volatile substances 2 - - - - - - - - - - - 0
Cannabis only 77 127 92 48 19 14 29 5 2 2 - - 37Other drug(s) with or
without cannabis dependence 48 73 46 2 11 9 1 3 5 - - 2 17
Any drug dependence 126 199 138 49 29 23 31 9 7 2 - 2 54
Base 183 200 332 378 441 381 358 387 314 331 294 239 3838
All Adults
Dependence on...Cannabis 78 125 77 34 18 8 17 3 2 1 - - 31Amphetamines 14 18 11 1 2 - - 2 - - - - 4Cocaine 6 8 4 1 3 4 - - - - - - 2Crack 5 2 - 2 2 - - - 2 - - - 1Ecstasy 26 29 16 2 1 - - - - - - - 6Heroin/Methadone 7 4 1 1 3 - 1 - - - - - 1Tranquillisers 2 3 2 2 5 1 - 2 1 2 4 1 2Volatile substances 1 - - - - - - - - - - - 0
Cannabis only 51 100 62 31 16 8 16 3 2 1 - - 25Other drug(s) with or
without cannabis dependence 45 44 27 5 8 6 1 3 4 2 4 1 12
Any drug dependence 96 144 90 36 24 13 17 6 5 3 4 1 37
Base 334 458 728 950 1004 838 721 822 701 734 661 591 8542

56
2
Psychiatric Morbidity among Adults living in Private Households, 2000
Prevalence of mental disorders and substance misuse
Table 2.25 Prevalence of drug dependence
by ethnicity and sex (rate per thousand population)
Ethnicity
White Black South Asian* Other All
Women Rates per thousand in past year
Dependence on...Cannabis 15 24 28 56 16Amphetamines 2 15 - - 3Cocaine 1 - - - 1Crack 0 14 - - 1Ecstasy 3 - - - 3Heroin/Methadone 1 - - - 1Tranquillisers 3 - - - 2Volatile substances - - - - -
Cannabis only 13 10 28 56 14Other drug(s) with or without
cannabis dependence 7 29 - - 8
Any drug dependence 20 39 28 56 21
Base 4443 90 76 75 4684
Men
Dependence on...Cannabis 48 31 - 30 46Amphetamines 6 - - - 5Cocaine 3 - - 25 4Crack 1 - - 25 2Ecstasy 10 - - 8 9Heroin/Methadone 1 - 6 25 2Tranquillisers 1 - - 25 2Volatile substances 0 - - - 0
Cannabis only 38 31 - 30 37Other drug(s) with or without
cannabis dependence 17 - 6 33 17
Any drug dependence 56 31 6 62 54
Base 3568 95 66 79 3808
All Adults
Dependence on...Cannabis 32 28 14 42 31Amphetamines 4 6 - - 4Cocaine 2 - - 14 2Crack 1 6 - 14 1Ecstasy 6 - - 5 6Heroin/Methadone 1 - 3 14 1Tranquillisers 2 - - 14 2Volatile substances 0 - - - 0
Cannabis only 25 23 14 42 25Other drug(s) with or without
cannabis dependence 12 11 3 18 12
Any drug dependence 38 34 17 60 38
Base 8011 185 142 154 8492
* Indian, Pakistani or Bangladeshi.

57
2
Psychiatric Morbidity among Adults living in Private Households, 2000
Prevalence of mental disorders and substance misuse
Table 2.26 Prevalence of drug dependence
by region and sex (rate per thousand population)
NHS Regional Office area
Northern Trent West North Eastern London South South England Wales Scotland Alland Midlands West East West
Yorkshire
Rates per thousand in past yearWomen
Dependence on...Cannabis 18 4 1 14 24 46 13 1 16 12 18 16Amphetamines 1 2 - 4 5 - 2 - 2 3 10 3Cocaine 1 - - 4 - 1 1 - 1 - 3 1Crack 1 - - - - 2 - - 0 - 3 1Ecstasy 5 1 - - 9 2 - - 2 - 13 3Heroin/Methadone 1 4 - 3 - - - 1 1 - - 1Tranquillisers 2 2 - 4 3 4 3 3 3 3 - 2Volatile substances - - - - - - - - - - - -
Cannabis only 17 - 1 14 16 43 11 1 14 12 11 14Other drug(s) with or
without cannabis dependence 7 10 - 10 12 7 5 4 7 3 16 7
Any drug dependence 24 10 1 25 27 50 16 5 21 15 27 21
Base 528 414 405 559 435 490 722 432 3985 213 505 4703
Men
Dependence on...Cannabis 31 32 30 68 27 37 58 51 43 30 83 46Amphetamines 7 - 2 1 1 13 8 - 5 - 12 5Cocaine - - 8 - 13 4 7 2 4 - - 4Crack - - 7 - - 4 2 - 2 - - 2Ecstasy 3 10 10 12 4 5 17 9 9 - 10 9Heroin/Methadone 1 2 7 4 - 4 - - 2 - - 2Tranquillisers 1 - - 7 - 4 1 - 2 - - 2Volatile substances - - - - - - - - - - 1 0
Cannabis only 22 27 22 54 23 33 41 39 34 30 72 37Other drug(s) with or
without cannabis dependence 13 12 18 20 19 19 23 11 17 - 22 17
Any drug dependence 34 39 40 74 41 52 65 51 51 30 94 54
Base 430 332 333 427 388 385 578 356 3229 194 415 3838
All Adults
Dependence on...Cannabis 25 18 16 41 26 41 36 25 30 21 50 31Amphetamines 4 1 1 3 3 7 5 - 3 1 11 4Cocaine 1 - 4 2 7 3 4 1 3 - 1 2Crack 1 - 3 - - 3 1 - 1 - 1 1Ecstasy 4 6 5 6 7 4 9 5 6 - 11 6Heroin/Methadone 1 3 3 3 - 2 - 1 2 - - 1Tranquillisers 2 1 - 6 1 4 2 1 2 1 - 2Volatile substances - - - - - - - - - - 1 0
Cannabis only 19 13 12 34 19 38 26 20 24 21 41 25Other drug(s) with or
without cannabis dependence 10 11 9 15 15 13 14 7 12 1 19 12
Any drug dependence 29 24 21 49 34 51 41 27 36 23 60 37
Base 958 746 738 986 823 875 1300 788 7214 407 920 8541

58
2
Psychiatric Morbidity among Adults living in Private Households, 2000
Prevalence of mental disorders and substance misuse
Table 2.27 Number of mental disorders
by age group and sex
Age
16–19 20–24 25–29 30–34 35–39 40–44 45–49 50–54 55–59 60–64 65–69 70–74 All adults
Number of disorders % % % % % % % % % % % % %
Women
None 72 72 75 77 78 75 80 74 82 85 84 88 781 24 20 21 20 20 23 19 24 18 14 15 12 192 3 6 4 3 3 2 1 1 1 1 1 - 23+ 1 2 1 0 0 0 - 0 - - - - 0
Base 151 258 398 574 564 460 363 435 389 407 373 356 4728
Men
None 71 60 65 77 71 75 73 79 80 83 93 91 751 21 27 23 17 23 20 24 18 17 15 6 8 192 6 10 10 4 6 4 3 2 3 1 1 0 53+ 2 2 2 1 1 1 0 0 - - - - 1
Base 183 202 332 379 442 382 360 387 314 332 295 244 3852
All adults
None 71 67 69 77 74 75 76 77 81 84 88 89 771 22 23 22 19 21 22 22 21 17 15 11 10 192 5 8 7 4 4 3 2 2 2 1 1 0 33+ 2 2 1 1 0 0 0 0 - - - - 1
Base 334 460 730 953 1006 842 723 822 703 739 668 600 8580

59
2
Psychiatric Morbidity among Adults living in Private Households, 2000
Prevalence of mental disorders and substance misuse
Table 2.28 Number of mental disorders
by ethnicity and sex
Ethnicity
White Black South Asian* Other All adults
Number of disorders % % % % %
Women
None 78 78 77 69 781 19 15 20 29 192 2 6 3 2 23+ 0 1 - - 0
Base 4456 90 76 76 4698
Men
None 75 82 83 72 751 20 14 13 23 192 5 4 4 3 53+ 1 - - 2 1
Base 3575 95 66 80 3816
All adults
None 77 81 80 71 771 19 14 16 25 192 3 5 4 3 33+ 1 1 - 1 1
Base 8031 185 142 156 8514
* Indian, Pakistani or Bangladeshi.

60
2
Psychiatric Morbidity among Adults living in Private Households, 2000
Prevalence of mental disorders and substance misuse
Table 2.29 Number of mental disorders
by region and sex
NHS Regional Office area
Northern Trent West North Eastern London South South England Wales Scotland All adultsand Yorkshire Midlands West East West
Number of disorders % % % % % % % % % % % %
Women
None 79 79 81 71 78 74 81 82 78 74 81 781 18 19 19 26 19 21 17 18 20 26 15 192 3 1 1 2 3 4 1 1 2 0 2 23+ 0 0 - 0 0 1 0 0 0 - 1 0
Base 532 418 405 562 437 495 724 435 4008 214 506 4728
Men
None 73 79 77 70 78 75 76 76 75 75 76 751 22 18 18 23 18 19 18 20 19 17 18 192 4 3 5 5 3 5 6 4 4 8 4 53+ 1 - - 2 1 1 1 1 1 1 2 1
Base 431 333 334 429 392 386 578 356 3239 198 415 3852
All adults
None 76 79 79 71 78 75 78 79 77 74 78 771 20 19 18 25 19 20 18 19 20 21 17 192 3 2 3 4 3 5 4 2 3 4 3 33+ 1 0 - 1 0 1 0 1 1 1 2 1
Base 963 751 739 991 829 881 1302 791 7247 412 921 8580

61Psychiatric Morbidity among Adults living in Private Households, 2000
3Trends in prevalence of mental disorders and substance misuse
Trends in prevalence of mental disorders andsubstance misuse3
3.1 Introduction
This chapter is divided into 4 sections whichdescribe changes in the prevalence of neuroticdisorders, functional psychoses, and drug andalcohol dependence between 1993 and 2000.The 2000 psychiatric morbidity survey is a repeatof the survey carried out in 1993 (Meltzer et al,1994). Both surveys were conducted among adultsliving in private households in Great Britain andused a similar sampling approach and covered asimilar range of disorders. However, there weresome changes in survey methods and coveragebetween the two. In 2000, the upper age limit forrespondents was extended from 64 to 74.Therefore, to permit comparison, only data relatingto those adults aged 16 to 64 in the 2000 survey areconsidered in this chapter. The only change to thegeographical coverage of the survey was that in2000 the Highlands and Islands of Scotland werealso included in the sample. In the 2000 survey,computer assisted interviewing replaced the paperand pencil questionnaires used in 1993. Hencemode effects and other possible effects arising fromdevelopments in survey methodology between1993 and 2000 are also considered in this chapter.
Section 3.1 describes trends in neurotic symptomsand disorders. The structured instrument used toassess neurosis, the Clinical Interview Schedule –revised version (CIS-R), was employed in both the1993 and 2000 surveys. Trends in the prevalence offunctional psychoses are presented in section 3.2.Although a two stage approach to the assessment ofpsychotic disorder was used in both 1993 and 2000there were changes to the screening and samplingprocedures for the second stage as well asdifferences in the types of interviewers used for thesecond stage SCAN interviewers and in the level oftraining and supervision provided to them.
Sections 3.3 and 3.4 report trends in drug andalcohol misuse. However, the questions used in1993 to assess substance misuse differed in anumber of respects from those used in the 2000survey. Where possible, comparisons are madebetween prevalence rates of substance use and
dependence in the two surveys, but these sectionsare also supplemented by additional data fromother surveys.All sections consider the differences in prevalenceover time within broad age groups and for menand women separately.
3.2 Trends in the prevalence of neuroticsymptoms and disorders
Neurotic symptoms and disorders in the weekpreceding interview were assessed using the CIS-Rin both the 1993 and 2000 surveys. Data are firstpresented on the prevalence of 14 neuroticsymptoms, and then the distribution of total CIS-Rscores, which give an indication of severity ofsymptoms. Finally, data is presented on theprevalence of six neurotic disorders.
The only change to the questions asked in theCIS-R questionnaire in 2000 compared to that usedin 1993 was that the questions on suicidal thoughtsand attempts, which in 1993 were only asked ofpeople with symptoms of depression in the pastyear, were expanded and asked of everyone at theend of the main body of the CIS-R. This approachhad been used successfully on the 1997 survey ofpsychiatric morbidity among prisoners (Singletonet al, 1998) and provides a more complete pictureof the extent of suicidal ideation among the generalpopulation.
The method of administering the questionnairechanged from paper and pencil to computerassisted personal interviewing (CAPI). Computerassisted face-to-face interviewing is used in mostmajor government household surveys, and thereare no indications that using a computer disturbsthe interviewing situation. By automating the routethrough the questionnaire, a CAPI system canprevent many interviewer mistakes thereforeimproving data quality. As a result there may beslightly more complete data in this section in 2000but the two sets of CIS-R data from 1993 and 2000are generally comparable.

62 Psychiatric Morbidity among Adults living in Private Households, 2000
3 Trends in prevalence of mental disorders and substance misuse
3.2.1 Neurotic symptoms
The proportions of all adults aged 16 to 64experiencing neurotic symptoms in 2000 weresimilar to those found in 1993. The differences inthe prevalence of most symptoms were notstatistically significant and where significantdifferences did occur they tended to be relativelysmall. The largest difference was found with thenumber of adults reporting sleep problems, themost common type of neurotic symptom. In 1993,21% of men and 28% of women reportedexperiencing problems with sleep. In 2000, theequivalent figures were 24% and 34%. Overall, thisrepresents an increase of 4 percentage points in theprevalence of this symptom among the adultpopulation.
As table 3.1 shows, there were also increases in theproportions of adults exhibiting symptoms ofdepression, poor concentration and forgetfulness,and worry about physical health. The proportionof adults reporting poor concentration increasedfrom 10% to 11% among women, and from 6% to9% among men between 1993 and 2000. A similarincrease was recorded in the proportion ofrespondents with worries about their physicalhealth. Among both men and women, theproportion experiencing this symptom increased to7%.
There were differences in the trends in neuroticsymptoms between men and women. Althoughwomen continued to be more likely to report mostneurotic symptoms than men, there was a greaterincrease in the prevalence of most neuroticsymptoms between 1993 and 2000 among menthan among women. The proportion of menshowing symptoms of depression in 2000 was 11%,an increase of 3 percentage points from 1993.Similarly, the proportion of men with depressiveideas rose by 2 percentage points in 2000 to reach9%. However, increases in the proportion ofwomen with these symptoms in 2000 were small,around 1%, and did not reach levels of statisticalsignificance. (Table 3.1)
No significant differences were found between the1993 and 2000 prevalence levels of the followingsymptoms among either men or women; fatigue,irritability, worry, anxiety, phobias and somaticsymptoms. While the proportion of women
reporting symptoms of panic decreased from 3% in1993 to 2% in 2000, there was no significant changein the proportion of men experiencing thissymptom.
Slightly larger falls were found in the proportionsof adults reporting symptoms of eithercompulsions or obsessions. In 1993, theproportions of men with either obsessive orcompulsive symptoms were 7% and 5%respectively. The equivalent figures for 2000 were5% and 3%. Among women a downward trend inthe prevalence of these symptoms was alsoapparent. In 1993, 8% of women reported havingcompulsions while 12% mentioned obsessivesymptoms. By 2000, the prevalence of thesesymptoms among women was 4% and 7%.It was felt that in the 1993 survey the prevalence ofobsessions and compulsions was over-estimated. Itwas apparent that some people misunderstood thequestions about repetitive thoughts and activitiesand mentioned worrying thoughts and necessaryactions rather than true obsessions or compulsions.In 2000, an introduction to the section was addedto try and make this clearer and interviewertraining modified slightly. These changes may havecontributed to the reduced reporting of thesesymptoms in 2000. (Table 3.1)
The largest and most widespread increases in theprevalence of neurotic symptoms were foundamong the middle-aged group of men. Men aged45 to 54 reported significant increases in the ratesof 8 of the 14 neurotic symptoms from 1993 to2000. This trend was most pronounced in theprevalence of symptoms of irritability, up 6% to21%, and in symptoms of worry and sleepproblems which both increased by 5 percentagepoints to 21% and 24%, respectively. Prevalence ofsymptoms of depression, anxiety, andconcentration and forgetfulness, were all up 4percentage points in comparison with 1993 figures,while a rise of 3% occurred in the proportion ofthese men with worries about their physical health.(Table 3.1)
More widely, the prevalence of symptoms ofdepression increased by about 3 percentage pointsacross all the age bands of men aged 35 to 64. Asimilar growth in the proportion of men reportingproblems with concentration and forgetfulness wasfound among those aged 25 to 54. However,

63Psychiatric Morbidity among Adults living in Private Households, 2000
3Trends in prevalence of mental disorders and substance misuse
beyond these instances, other changes in prevalencerates of symptoms tended to be quite small,particularly among the groups of men aged 16 to24 and 55 to 64. There were no significant increasesin the prevalence of any neurotic symptomsamongst the youngest group.
Less variation by age was apparent in trends offemale neurotic symptoms. Significant declines inthe proportions of women reporting symptoms ofcompulsion and obsession were found in all agegroups (range 2% to 6%), while most groupsshowed increases in the reported prevalence of twosymptoms, problems with sleep and worries aboutphysical health. For these symptoms the increase waslargest among the youngest group of women aged 16to 24, rising by 7 percentage points for sleepproblems and 5% in respect to worries aboutphysical health. Worry about physical health affectednearly 1 in 10 women aged 16 to 24 in 2000,compared with 1 in 20 in 1993. Otherwise,prevalence of most symptoms tended to remain thesame across most age groups. (Table 3.1)
3.2.2 The distribution of CIS-R scores
The distribution of total CIS-R scores in 2000 wasgenerally very similar to those found in 1993. Theproportion of adults with a CIS-R score of 12 orabove, indicating significant levels of neuroticsymptoms, was 15% in 1993 and 16% in 2000.There was also no significant change in the overallproportion of adults with a total symptom score of18 or above (7 to 8%), the level which suggestsneurotic symptoms likely to require treatment.(Table 3.2)
In 2000, women continued to be more likely thanmen to have a CIS-R score of 12 or above. However,the proportion of women with a total symptomscore on or above the threshold score of 12 did notchange significantly between 1993 and 2000, whileamong men there was some change. The overallproportion of men on or above the threshold scoreof 12 increased by 2 percentage points. Much thelargest increase occurred in the group of men agedbetween 45 and 54 years, where the proportion on orabove the threshold score rose 5% above the 1993rate to reach 16% in 2000. The proportion of men inthis group with total symptom scores of 18 or abovealso increased significantly from 6% to 9%.
In 1993, the men most likely to experiencesignificant levels of neurotic symptoms were thegroup aged 35 to 44, while in 2000 the most likelygroup were aged 45 to 54. This could suggest acohort effect, as the same group of men movesthrough the age bands. However, the proportionof men aged 35 to 44 on or above the thresholdscore of 12 also appeared to increase from 1993:from 12% in 1993 to 15% in 2000, though this didnot quite reach statistical significance. (Table 3.2and Figure 3.1)
3.2.3 Neurotic disorders
To permit the comparison between 1993 and 2000presented in this section, the 1993 data has beenreanalysed using the same reporting approach asadopted for the 2000 data. In this approach, peoplecan be assessed as having more than one type ofdisorder. This approach helps to give a fullerpicture of the prevalence of more minor disorders.Once again, the analysis only includes adults agedbetween 16 and 64 years.
There was no significant change in the overall ratesfor any neurotic disorder for all adults. Table 3.3shows that in 1993 the proportion of adults with atleast one neurotic disorder was 16% or 163 per1,000, while in 2000 the proportion was 17% (173per 1,000). As was found with the trend data forneurotic symptoms and total symptom scores inthe previous sections, significant changes weresmall and limited to certain groups.
The only neurotic disorder to show a significantincrease in overall prevalence since 1993 wasmixed anxiety and depressive disorder, a catch-allcategory, which can be applied to people withsignificant neurotic symptoms who do not fulfilthe criteria for any of the other five neuroticdisorders. In 2000, the prevalence rate for mixedanxiety and depressive disorder was 92 per 1,000adults, an increase of 14 per 1,000 compared with1993. The 2000 data also indicated a smalldecrease in the prevalence of obsessive-compulsive disorder. Among all adults, prevalenceof this disorder fell by 4 cases per 1,000 since1993, to 12 per 1,000 in 2000 but, as noted above,this may reflect the slight change in the way thesection was asked. (Table 3.3)

64 Psychiatric Morbidity among Adults living in Private Households, 2000
3 Trends in prevalence of mental disorders and substance misuse
The most marked changes in prevalence were againfound among the group of middle-aged men. Theproportion of men aged 45 to 54 with any neuroticdisorder grew from 126 per 1,000 in 1993 to 176per 1,000 in 2000. Among this group of men, theprevalence of mixed anxiety and depressive orderwas 40 per 1,000 in 1993 but had increased to 73per 1,000 in 2000. This group also showed smallincreases in the prevalence of generalised anxietydisorder (by 18 per 1,000) and depressive episodes(by 12 per 1,000), though these were notstatistically significant. The prevalence of mixedanxiety and depressive disorder also increasedamong men in the younger middle-age group, 35 to44 years, by 28 per 1,000. (Table 3.3)
Most variation in the prevalence of neuroticdisorders between 1993 and 2000 among womenoccurred among the youngest and oldest agegroups. An increased prevalence of mixed anxietyand depressive disorder and depressive episodeswas found among women aged 55 to 64. In 1993the prevalence rates for these disorders were 52 and11 per 1,000 respectively, while the equivalent ratesin 2000 were 81 and 30 per 1,000. Among womenaged 16 to 24 the proportion with phobias andwith generalised anxiety disorder decreasedbetween 1993 and 2000. (Table 3.3)
3.3 Trends in prevalence of psychotic andsevere affective disorders
As described earlier, a number of changes weremade to the way in which the prevalence ofpsychotic disorders was assessed between the 1993and 2000 surveys. The criteria used for screeningpeople to select them for a second stage assessmentwere different, as were the algorithms used toprovide an assessment of probable psychosis forthose cases who were selected for the second stagebut were not interviewed. To permit comparisonbetween the rates obtained in the two years, the1993 screening approach was applied to the 2000survey data to identify those people who wouldhave been selected for a second-stage interview in1993. Those people who screened positive in thisway were then given an assessment of psychoticdisorder based on SCAN interview data, if it wasavailable, or else by applying the 1993 algorithm(which gave a positive assessment to people whoreported a diagnosis or symptoms of psychotic
disorder and who were taking anti-psychoticmedication). The prevalence rates for psychoticdisorder among those aged 16 to 64 years obtainedin this way are reported here compared with theresults from the 1993 survey.
The overall rate for psychotic disorder was thesame in 1993 and 2000: 4 cases per 1,000 adults.While in 2000 the rate for men appeared slightlyhigher than that for women (5 per 1,000 and 3 per1,000, respectively) the difference is not statisticallysignificant and is also not significantly differentfrom 1993 when the rate was 4 per 1,000 for bothmen and women. (Table 3.4)
3.4 Trends in prevalence of substancemisuse and dependence
This section examines trends in substance misuseand dependence. In the 1993 adult psychiatricmorbidity survey a paper and pencil self-administered questionnaire was used to collectinformation about alcohol and illicit drug use. Thisallows respondents to record their answers withoutrevealing potentially embarrassing information tothe interviewer, or other people. The use of self-administered questionnaires has been shown toprovide higher estimates of substance misuse thanface to face interviews.
The period since 1993 has seen the development ofthe computer-assisted self interview (CASI) whererespondents read questions from the screen and typetheir answers into a laptop computer. The use of CASIis itself an improvement on the paper self-administered questionnaire as respondents experiencea higher degree of privacy and anonymity, leading tomore self-disclosure and less bias toward givingsocially desirable answers. Because the computercontrols the order of questions and checks that givenanswers lie within a permissible range, CASI alsoproduces a more consistent data set with reducednon-response to individual questions. CASI wastherefore used to assess substance misuse in the 2000psychiatric survey.
3.4.1 Alcohol dependence
Studying trends in alcohol misuse and dependencebetween the psychiatric morbidity surveys of 1993

65Psychiatric Morbidity among Adults living in Private Households, 2000
3Trends in prevalence of mental disorders and substance misuse
and 2000 is problematic. The first psychiatricsurvey in 1993 included questions on quantity andfrequency of consumption of different types ofalcoholic beverage and then focussed on threecomponents of alcohol dependence: loss of control,symptomatic behaviour and binge drinking usingquestions developed for the US National AlcoholSurvey. The survey in 2000 adopted a differentapproach using the Alcohol Use DisordersIdentification Test (AUDIT), which had been usedsuccessfully in the 1997 survey of psychiatricmorbidity among prisoners, together with theSeverity of Alcohol Dependence questionnaire(SAD-Q). The AUDIT was developed from a six-country WHO collaborative project and is anestablished indicator of hazardous drinking. As itsname suggests, the SAD-Q is a measure of alcoholdependence.
Data produced from these two instruments are noteasily comparable with data from the 1993psychiatric survey. Nevertheless, a comparison ofthe relative prevalence of alcohol dependencebetween different groups shows a degree ofcontinuity between results from the two surveys. In1993 men were about three and half times morelikely to be alcohol dependant than were women.Using different instruments to assess dependencein 2000 the position appeared to have changed verylittle, alcohol dependence being four times morecommon in men.
Alcohol dependence among men remained mostcommon in the group aged between 20 and 24years, though in 2000 the proportion of men aged25 to 29 years also assessed as probably dependenton alcohol had relatively increased so the rate wasalmost as great. Similarly, in both 1993 and 2000,the youngest group of women aged 16 to 19 weremost likely to be dependent, but in 2000 verynearly as many women in the group aged 20 to 24were also assessed as alcohol dependent. Among alladults the shape of the distribution of alcoholdependence was very similar in 1993 and 2000,rising to a peak among respondents in their earlytwenties and declining steadily thereafter. (Table3.5)
3.4.2 Illicit drug use
As well as the change in mode of interview therewere also some changes in the initial questions usedto introduce the section and find out if therespondent had ever used illicit drugs. In additionthe more detailed questions on drug use anddependence were asked individually about the mostcommon and addictive drugs. This reduces thecomparability of the data from the two surveys andmust be borne in mind when considering thechanges. To provide an indication as to the likelymagnitude of any discrepancy caused by thesechanges and a better time trend, the analysis hereincludes comparisons with data on drug use fromthe British Crime Survey where CASI methodshave also been used.
In both the psychiatric surveys of 1993 and 2000respondents were asked which of a list of drugs theyhad used in the previous year. In 1993, only adultsaged between 16 and 64 years of age wereinterviewed, and only respondents in this age groupare included in the data from the 2000 survey shownhere. The results are shown in table 3.6 and indicatea considerable increase in the proportions of adultsusing drugs over the seven-year period.
The proportion of respondents who reported useof any illegal drugs in the year before interview was5% in 1993, 4% among women and 7% amongmen. In 2000, the prevalence of self-reported druguse had more than doubled to 12% overall: 9%among women and 15% among men. This increasewas mainly due to increases in the proportions ofcannabis users, up from 3% to 8% among women,and from 6% to 14% for men. Other drugcategories showing overall increased use includeecstasy, tranquillisers, amphetamines and acombined category for cocaine and crack use.(Table 3.6)
The results from the 1993 survey should be viewedas a minimum estimate of actual drug use. Greaterdisclosure of drug use would be expected fromrespondents using the 2000 CASI instrument thancompared with the 1993 paper questionnaire. Thelargest mode effects tend to occur with the mostsensitive items and among the youngestrespondents (Wright et al, 1998). As young peopleform much the largest group of drug users theeffect may be further amplified in these results.
66 Psychiatric Morbidity among Adults living in Private Households, 2000
3 Trends in prevalence of mental disorders and substance misuse
Consequently, the apparent increases in drug usebetween 1993 and 2000 may be exaggerated.
A source of corroborating evidence with the 2000psychiatric survey is the British Crime Survey(BCS). Since 1994, this survey has collectedinformation about illegal drug use and has usedCASI administered questions very similar to thosein the 2000 psychiatric morbidity questionnaire.The BCS interviews adults aged 16 to 59 living inEngland and Wales, and only adults in these groupsare considered in the following analysis. Inevitablysome differences between the surveys, whether inprocedure or method, may remain. Caution shouldtherefore be exercised before placing undue weightin apparent differences between the estimates fromthe BCS and ONS psychiatric survey.
Table 3.7 shows prevalence rates for use of eachparticular drug and for drug use in general from1994 to 2000. Data from the 1994, 1996, 1998 and2000 BCS surveys are included (Ramsay and Percy,1996; Ramsay and Spiller, 1997; Ramsay andPartridge, 1999, Ramsay et al, 2001), together withdata from the 2000 psychiatric survey. All thesesurveys used CASI to collect self-reportinformation. The level of drug use recorded by the1994 BCS is considerably higher than that in the1993 psychiatric morbidity survey, and the BCSand 2000 psychiatric data show a more consistentrelationship. This suggests that some of thedifference in the prevalence of drug use between1993 and 2000 is due to mode effects. However,after discounting mode effects from the trend dataa pattern of increasing drug use can still be seen,but one that is less exaggerated. (Table 3.7)
3.4.3 Drug dependence
Five questions to measure dependence on illicitdrugs were included in both the 1993 and 2000psychiatric surveys. A positive response to any ofthe five questions was used to indicate drugdependence. In 1993 dependence was not reportedfor individual drugs but the data has been re-analysed here to permit comparison of threedifferent groups of people: those who weredependent on cannabis only, those who weredependent on one or more other drugs (includingthose also dependent on cannabis), and those withno drug dependence. Only adults aged 16 to 64 are
considered in the following analysis. As was thecase with prevalence of drug use, 1993 estimates ofdrug dependence should be regarded as an absoluteminimum. The size of apparent differences in theprevalence of drug dependence between 1993 and2000 may therefore be exaggerated.
Table 3.8 shows the prevalence of drug dependenceamong men and women in 1993 and 2000. In 1993,indications of drug dependence were identified in22 per 1,000 adults. In 2000, prevalence wasconsiderably higher, drug dependence beingidentified in 42 per 1,000 adults aged 16 to 64. Theproportions of adults showing evidence of drugdependence approximately doubled over the seven-year period, rising from 29 to 60 per 1,000 men and15 to 23 per 1,000 women. This increase roughlyparallels the increase in reported drug use observedbetween the 1993 and 2000 surveys and hence mayalso be partly due to mode effects.
Trends in dependence on cannabis alone weresimilar between men and women, but trends independence on other drugs differed. In 1993 20 per1,000 men and 8 per 1,000 women were assessed asbeing dependent on cannabis. In 2000 theequivalent rates were 41 per 1,000 and 16 per 1,000.Among men, dependence on other drugs, with orwithout cannabis, was found in 9 men per 1,000 in1993 and rose to 19 per 1,000 in 2000. However,among women this figure remained stable at under10 per 1,000 in both years. (Table 3.8)
Drug dependence remained most common amongthe youngest age groups. The proportion of adultsaged 16 to 24 showing signs of dependence on anydrug increased from 69 per 1,000 in 1993 to 122per 1,000 people in 2000. However, the largestrelative increases were found in the group agedbetween 25 and 34, where the proportiondependent on any drug appeared to triple from 19per 1,000 in 1993 to 61 per 1,000 in 2000. Thisincrease in dependence between 1993 and 2000 wasmost pronounced among the men in this agegroup. In 1993 the proportion of men aged 25 to 34showing evidence of dependence on cannabis alonewas 14 per 1,000, while the proportion dependenton any drug was 22 per 1,000. In 2000, theseproportions had increased to 69 per 1,000 forcannabis dependence and 93 per 1,000 for any drugdependence. (Table 3.8)

67Psychiatric Morbidity among Adults living in Private Households, 2000
3Trends in prevalence of mental disorders and substance misuse
References
Ramsay M and Percy A (1996). Drug misuse declared: results ofthe 1994 British Crime Survey Research Study 151, HomeOffice: London.
Ramsay M and Spiller J (1997). Drug misuse declared in 1996:latest results from the British Crime Survey Research Study 172,Home Office: London.
Ramsay M and Partridge S (1999). Drug misuse declared in1998: results from the British Crime Survey Research Study 197,Home Office: London.
Ramsay et al (2001). Drug misuse declared in 2000: results fromthe British Crime Survey Research Study 224, Home Office:London.
Singleton N, Meltzer H, Garward R, Coid J and Deasy D(1998). Psychiatric Morbidity among prisoners in England andWales.TSO: London
Wright DL, Aquilino WS and Supple AJ (1998). A comparisonof computer - assisted and paper-and-pencil self-administeredquestionnaires in a survey on, smoking, alcohol, and drug use.Public Opinion Quarterly, 62 (3), 331–353.
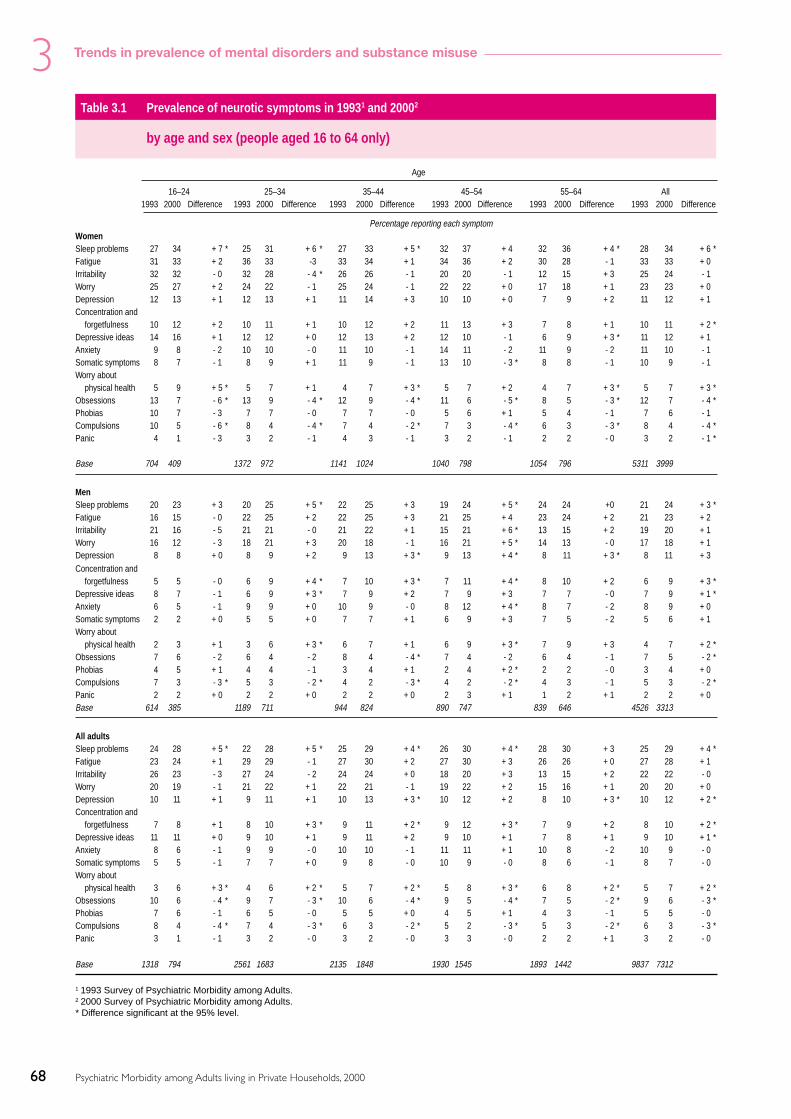
68 Psychiatric Morbidity among Adults living in Private Households, 2000
3 Trends in prevalence of mental disorders and substance misuse
Table 3.1 Prevalence of neurotic symptoms in 19931 and 20002
by age and sex (people aged 16 to 64 only)
Age
16–24 25–34 35–44 45–54 55–64 All1993 2000 Difference 1993 2000 Difference 1993 2000 Difference 1993 2000 Difference 1993 2000 Difference 1993 2000 Difference
Percentage reporting each symptomWomenSleep problems 27 34 + 7 * 25 31 + 6 * 27 33 + 5 * 32 37 + 4 32 36 + 4 * 28 34 + 6 *Fatigue 31 33 + 2 36 33 -3 33 34 + 1 34 36 + 2 30 28 - 1 33 33 + 0Irritability 32 32 - 0 32 28 - 4 * 26 26 - 1 20 20 - 1 12 15 + 3 25 24 - 1Worry 25 27 + 2 24 22 - 1 25 24 - 1 22 22 + 0 17 18 + 1 23 23 + 0Depression 12 13 + 1 12 13 + 1 11 14 + 3 10 10 + 0 7 9 + 2 11 12 + 1Concentration and
forgetfulness 10 12 + 2 10 11 + 1 10 12 + 2 11 13 + 3 7 8 + 1 10 11 + 2 *Depressive ideas 14 16 + 1 12 12 + 0 12 13 + 2 12 10 - 1 6 9 + 3 * 11 12 + 1Anxiety 9 8 - 2 10 10 - 0 11 10 - 1 14 11 - 2 11 9 - 2 11 10 - 1Somatic symptoms 8 7 - 1 8 9 + 1 11 9 - 1 13 10 - 3 * 8 8 - 1 10 9 - 1Worry about
physical health 5 9 + 5 * 5 7 + 1 4 7 + 3 * 5 7 + 2 4 7 + 3 * 5 7 + 3 *Obsessions 13 7 - 6 * 13 9 - 4 * 12 9 - 4 * 11 6 - 5 * 8 5 - 3 * 12 7 - 4 *Phobias 10 7 - 3 7 7 - 0 7 7 - 0 5 6 + 1 5 4 - 1 7 6 - 1Compulsions 10 5 - 6 * 8 4 - 4 * 7 4 - 2 * 7 3 - 4 * 6 3 - 3 * 8 4 - 4 *Panic 4 1 - 3 3 2 - 1 4 3 - 1 3 2 - 1 2 2 - 0 3 2 - 1 *
Base 704 409 1372 972 1141 1024 1040 798 1054 796 5311 3999
MenSleep problems 20 23 + 3 20 25 + 5 * 22 25 + 3 19 24 + 5 * 24 24 +0 21 24 + 3 *Fatigue 16 15 - 0 22 25 + 2 22 25 + 3 21 25 + 4 23 24 + 2 21 23 + 2Irritability 21 16 - 5 21 21 - 0 21 22 + 1 15 21 + 6 * 13 15 + 2 19 20 + 1Worry 16 12 - 3 18 21 + 3 20 18 - 1 16 21 + 5 * 14 13 - 0 17 18 + 1Depression 8 8 + 0 8 9 + 2 9 13 + 3 * 9 13 + 4 * 8 11 + 3 * 8 11 + 3Concentration and
forgetfulness 5 5 - 0 6 9 + 4 * 7 10 + 3 * 7 11 + 4 * 8 10 + 2 6 9 + 3 *Depressive ideas 8 7 - 1 6 9 + 3 * 7 9 + 2 7 9 + 3 7 7 - 0 7 9 + 1 *Anxiety 6 5 - 1 9 9 + 0 10 9 - 0 8 12 + 4 * 8 7 - 2 8 9 + 0Somatic symptoms 2 2 + 0 5 5 + 0 7 7 + 1 6 9 + 3 7 5 - 2 5 6 + 1Worry about
physical health 2 3 + 1 3 6 + 3 * 6 7 + 1 6 9 + 3 * 7 9 + 3 4 7 + 2 *Obsessions 7 6 - 2 6 4 - 2 8 4 - 4 * 7 4 - 2 6 4 - 1 7 5 - 2 *Phobias 4 5 + 1 4 4 - 1 3 4 + 1 2 4 + 2 * 2 2 - 0 3 4 + 0Compulsions 7 3 - 3 * 5 3 - 2 * 4 2 - 3 * 4 2 - 2 * 4 3 - 1 5 3 - 2 *Panic 2 2 + 0 2 2 + 0 2 2 + 0 2 3 + 1 1 2 + 1 2 2 + 0Base 614 385 1189 711 944 824 890 747 839 646 4526 3313
All adultsSleep problems 24 28 + 5 * 22 28 + 5 * 25 29 + 4 * 26 30 + 4 * 28 30 + 3 25 29 + 4 *Fatigue 23 24 + 1 29 29 - 1 27 30 + 2 27 30 + 3 26 26 + 0 27 28 + 1Irritability 26 23 - 3 27 24 - 2 24 24 + 0 18 20 + 3 13 15 + 2 22 22 - 0Worry 20 19 - 1 21 22 + 1 22 21 - 1 19 22 + 2 15 16 + 1 20 20 + 0Depression 10 11 + 1 9 11 + 1 10 13 + 3 * 10 12 + 2 8 10 + 3 * 10 12 + 2 *Concentration and
forgetfulness 7 8 + 1 8 10 + 3 * 9 11 + 2 * 9 12 + 3 * 7 9 + 2 8 10 + 2 *Depressive ideas 11 11 + 0 9 10 + 1 9 11 + 2 9 10 + 1 7 8 + 1 9 10 + 1 *Anxiety 8 6 - 1 9 9 - 0 10 10 - 1 11 11 + 1 10 8 - 2 10 9 - 0Somatic symptoms 5 5 - 1 7 7 + 0 9 8 - 0 10 9 - 0 8 6 - 1 8 7 - 0Worry about
physical health 3 6 + 3 * 4 6 + 2 * 5 7 + 2 * 5 8 + 3 * 6 8 + 2 * 5 7 + 2 *Obsessions 10 6 - 4 * 9 7 - 3 * 10 6 - 4 * 9 5 - 4 * 7 5 - 2 * 9 6 - 3 *Phobias 7 6 - 1 6 5 - 0 5 5 + 0 4 5 + 1 4 3 - 1 5 5 - 0Compulsions 8 4 - 4 * 7 4 - 3 * 6 3 - 2 * 5 2 - 3 * 5 3 - 2 * 6 3 - 3 *Panic 3 1 - 1 3 2 - 0 3 2 - 0 3 3 - 0 2 2 + 1 3 2 - 0
Base 1318 794 2561 1683 2135 1848 1930 1545 1893 1442 9837 7312
1 1993 Survey of Psychiatric Morbidity among Adults.2 2000 Survey of Psychiatric Morbidity among Adults.* Difference significant at the 95% level.

69Psychiatric Morbidity among Adults living in Private Households, 2000
3Trends in prevalence of mental disorders and substance misuse
Table 3.2 Distribution of CIS-R scores (grouped) in 19931 and 20002
by age and sex (people aged 16 to 64 only)
Age
16–24 25–34 35–44 45–54 55–64 All
1993 2000 Difference 1993 2000 Difference 1993 2000 Difference 1993 2000 Difference 1993 2000 Difference 1993 2000 Difference
% % % % % % % % % % % %Women0-5 56 57 + 1 56 61 + 4 58 60 + 2 61 60 - 1 67 69 + 2 59 61 + 26–11 26 23 - 3 24 19 - 5 * 23 20 - 3 19 20 + 1 20 17 - 4 23 20 - 3 *Under 12 81 80 - 1 81 80 - 1 81 80 - 0 80 80 - 0 88 86 - 2 82 81 - 1
12–17 9 11 + 2 10 11 + 0 9 9 + 0 10 12 + 2 7 7 + 0 9 10 + 118 and over 10 9 - 0 9 9 + 1 11 11 + 0 10 8 - 2 5 7 + 1 9 9 + 012 and over 19 20 + 1 19 20 + 1 19 20 + 0 20 20 + 0 12 14 + 2 18 19 + 1
Base 704 409 1372 972 1141 1024 1040 798 1054 796 5311 3999
Men0–5 74 78 + 4 72 69 - 3 70 70 - 0 75 70 - 5 74 74 - 0 73 72 - 16–11 17 13 - 4 16 18 + 2 17 15 - 2 14 14 + 0 14 13 - 1 16 15 - 1Under 12 92 91 - 0 88 87 - 1 88 85 - 3 89 84 - 5 * 88 87 - 1 89 87 - 2
12–17 5 5 + 1 7 7 + 0 5 8 + 2 5 7 + 2 6 6 + 0 6 7 + 118 and over 4 3 - 0 5 6 + 1 7 7 + 0 6 9 + 3 * 6 7 + 1 5 7 + 1 *12 and over 8 9 + 0 12 13 + 1 12 15 + 3 11 16 + 5 * 12 13 + 1 11 13 + 2 *
Base 614 385 1189 711 994 824 890 747 839 646 4526 3313
All adults0–5 65 68 + 3 64 65 + 1 64 65 + 1 68 65 - 3 71 71 + 1 66 67 + 06–11 21 18 - 3 20 19 - 2 20 18 - 3 17 17 + 0 17 15 - 2 19 17 - 2 *Under 12 87 86 - 1 85 84 - 1 84 83 - 1 85 82 - 2 88 86 - 2 85 84 - 1 *
12–17 7 8 + 1 9 9 + 0 7 8 + 1 7 9 + 2 6 7 + 0 7 8 + 118 and over 7 6 - 0 7 8 + 1 9 9 + 0 8 9 + 0 6 7 + 1 7 8 + 112 and over 13 14 + 1 15 16 + 1 16 17 + 1 15 18 + 2 12 14 + 2 15 16 + 1 *
Base 1318 794 2561 1683 2135 1848 1930 1545 1893 1442 9837 7312
1 1993 Survey of Psychiatric Morbidity among Adults.2 2000 Survey of Psychiatric Morbidity among Adults.* Difference significant at the 95% level.

70 Psychiatric Morbidity among Adults living in Private Households, 2000
3 Trends in prevalence of mental disorders and substance misuse
Table 3.3 Prevalence of neurotic disorders in 19931 and 20002
by age and sex (people aged 16 to 64 only)
Age
16–24 25–34 35–44 45–54 55–64 All
1993 2000 Difference 1993 2000 Difference 1993 2000 Difference 1993 2000 Difference 1993 2000 Difference 1993 2000 Difference
Rate per thousand for each disorderWomenMixed anxiety and
depressive disorder 103 132 +30 117 122 + 5 114 109 - 6 102 113 + 11 52 81 + 29* 101 112 + 11Generalised anxiety
disorder 32 15 - 17* 39 43 + 4 48 58 + 10 77 64 - 13 70 52 - 19 52 48 - 4Depressive episode 33 31 - 1 34 26 - 8 27 33 + 6 31 30 - 1 11 30 + 19* 28 30 + 2Phobias 42 17 - 24* 26 24 - 2 20 32 + 12 21 25 + 4 18 15 - 2 26 24 - 2Obsessive-compulsive
disorder 28 14 - 14 18 14 - 3 23 18 - 5 20 11 - 9 16 16 + 0 21 15 - 6Panic disorder 8 3 - 5 12 9 - 3 10 6 - 4 11 12 +1 9 5 - 4 10 7 - 3
Any neurotic disorder 203 202 - 1 206 210 + 4 210 209 - 1 214 218 + 4 149 162 + 13 199 202 + 3
Base 704 409 1372 972 1141 1024 1040 798 1054 796 5311 3999
MenMixed anxiety and
depressive disorder 45 47 + 2 67 75 + 8 60 87 + 28 * 40 73 + 34* 59 66 + 7 55 72 + 17*Generalised anxiety
disorder 14 14 + 0 36 42 + 6 55 55 + 1 54 72 + 18 43 39 - 4 40 46 + 6Depressive episode 18 8 - 10 12 19 + 8 18 33 + 15 25 38 + 12 22 28 + 6 19 26 + 7 *Phobias 13 12 - 1 13 14 + 1 8 14 + 6 16 20 + 4 12 12 + 0 13 15 + 2Obsessive-compulsive
disorder 13 14 + 1 10 8 - 2 14 8 - 6 15 9 - 6 10 11 + 1 12 10 - 3Panic disorder 12 6 - 6 8 8 + 0 6 5 - 1 13 9 - 3 6 11 + 5 9 8 - 1
Any neurotic disorder 102 93 - 10 130 141 + 11 139 158 + 19 126 176 + 51* 131 140 + 9 126 144 + 18*
Base 614 385 1189 711 994 824 890 747 839 646 4526 3313
All adultsMixed anxiety and
depressive disorder 73 89 + 15 92 98 + 6 88 98 + 10 71 93 + 22* 56 74 + 18 78 92 + 14*Generalised anxiety
disorder 23 14 - 8 38 42 + 5 51 57 + 5 66 68 + 2 57 46 - 11 46 47 + 1Depressive episode 25 20 - 6 23 23 + 0 23 33 + 10 28 34 + 6 17 29 + 13* 23 28 + 5Phobias 27 15 - 12* 20 19 - 1 14 23 + 9 19 23 + 4 15 14 - 1 19 19 + 0Obsessive-compulsive
disorder 21 14 - 7 14 11 - 3 19 13 - 6 17 10 - 8 13 14 + 1 17 12 - 4 *Panic disorder 10 4 - 5 10 8 - 2 8 5 - 2 12 11 - 1 8 8 + 0 10 7 - 2
Any neurotic disorder 152 146 - 6 168 175 + 7 175 183 + 8 170 197 + 27 140 151 + 11 163 173 + 10
Base 1318 794 2561 1683 2135 1848 1930 1545 1893 1442 9837 7312
1 1993 Survey of Psychiatric Morbidity among Adults.2 2000 Survey of Psychiatric Morbidity among Adults.* Difference significant at the 95% level.

71Psychiatric Morbidity among Adults living in Private Households, 2000
3Trends in prevalence of mental disorders and substance misuse
Table 3.4 Prevalence of psychotic disorder in the pastyear in 19931 and 20002
by sex (people aged 16 to 64 only)
1993 2000 Difference
Rate per thousand
Women 4 3 - 2Men 4 5 + 1All 4 4 - 0
BasesWomen 5311 3999Men 4526 3313All 9837 7312
1 1993 Survey of Psychiatric Morbidity among Adults.2 2000 Survey of Psychiatric Morbidity among Adults.
Table 3.5 Comparison of the patterns of alcohol dependence
by age and sex in 19931 and 20002 (people aged 16 to 64 only)
Age
16–19 20–24 25–29 30–34 35–39 40–44 45–49 50–54 55–59 60–64 All
Rates per thousand1993Women 68 45 28 16 24 4 7 14 1 1 21Men 113 176 115 85 57 53 35 42 8 12 75All adults 99 110 72 50 40 27 21 28 4 7 47
2000Women 74 71 53 32 35 22 12 18 7 6 32Men 190 244 210 113 169 108 65 72 78 27 130All adults 138 153 139 71 103 65 38 45 42 16 81
Bases1993Women 231 473 705 665 607 534 570 469 453 601 5308Men 231 383 575 612 533 459 471 419 404 435 4522All adults 452 856 1280 1277 1140 993 1041 888 857 1036 98302000Women 151 258 397 571 562 457 363 434 389 403 3985Men 183 200 332 377 441 380 357 387 313 331 3301All adults 334 458 729 948 1003 837 720 821 702 734 7286
1 1993 Survey of Psychiatric Morbidity among Adults using questions from the U.S.National Alcohol Survey.2 2000 Survey of psychiatric Morbidity among Adults using the SAD-Q.

72 Psychiatric Morbidity among Adults living in Private Households, 2000
3 Trends in prevalence of mental disorders and substance misuse
Table 3.6 Prevalence of illicit drug use in the past year in 19931 and 20002
by sex (people aged 16 to 64 only)
Women Men All adults
1993 2000 Difference 1993 2000 Difference 1993 2000 Difference
Percentage reporting use of each drug in the past year
Cannabis 3 8 + 5* 6 14 +7* 5 11 + 6*Amphetamines 0 1 + 1* 2 3 + 1* 1 2 + 1*Cocaine/crack3 0 1 + 1* 0 3 + 3* 0 2 + 2*Ecstasy 0 1 + 1* 1 3 + 2* 0 2 + 2*LSD/magic mushrooms3 0 1 + 0* 1 1 + 0 1 1 + 0*Tranquillisers 0 0 + 0 0 1 + 1* 0 1 + 0*Heroin - 0 + 0 0 0 + 0 0 0 + 0Volatile substances/amyl nitrate3 0 0 + 0* 0 1 + 1* 0 1 + 1*Methadone and other opiates4 0 0 + 0 0 0 + 0 0 0 + 0
Any drug5 4 9 + 5* 7 15 + 8* 5 12 + 7*
Base 5311 3985 4526 3305 9837 7290
1 1993 Survey of Psychiatric Morbidity among Adults.2 2000 Survey of Psychiatric Morbidity among Adults.3 Acid and magic mushrooms, volatile substances (glue) and amyl nitrate, and cocaine & crack were recorded in the same answer categories in the 1993
survey. In the 2000 survey these answer categories were distinct, but have been combined here to permit comparison.4 In the 2000 survey methadone and physeptone were offered as an answer category, where as in 1993 this category also included a range of other non-
heroin opiates such as morphine and demerol.5 Also includes: sleeping tablets, asked in 1993 only, and anabolic steroids, asked in 2000 only.* Difference significant at the 95% level.

73Psychiatric Morbidity among Adults living in Private Households, 2000
3Trends in prevalence of mental disorders and substance misuse
Table 3.7 Drug use in the past year: 1994, 1996, 1998 and 2000 (people aged 16 to 59 in England and Wales only)
1994 1996 1998 2000 2000
Source: BCS1 BCS BCS BCS PMA2
Percentage reporting use of each drug in the past yearWomenCannabis 7 7 7 7 9Amphetamines 2 2 2 1 1Cocaine 0 0 1 1 1Crack 0 0 0 0 0Ecstasy 1 1 1 1 1Heroin 0 0 0 0 0LSD 1 0 0 0 0Magic mushrooms 0 0 0 0 0Methadone 0 0 0 0 0Tranquillisers 1 0 1 1 0Amyl nitrate (poppers) 1 1 1 1 0Anabolic steroids 0 0 0 0 -Volatile substances 0 0 0 0 0
Any drug3 8 8 8 8 9
Base 5200 5912 5572 6957 3198
MenCannabis 10 11 12 12 15Amphetamines 3 4 3 3 3Cocaine 0 1 2 3 4Crack 0 0 0 1 0Ecstasy 1 2 2 2 3Heroin 0 0 0 0 0LSD 2 2 1 1 1Magic mushrooms 1 1 1 1 1Methadone 0 0 0 0 0Tranquillisers 1 0 1 1 1Amyl nitrate (poppers) 2 2 2 2 1Anabolic steroids 0 0 0 0 0Volatile substances 0 0 0 0 0
Any drug3 12 13 14 14 16
Base 4446 5028 4416 6064 2653
AllCannabis 8 9 9 9 12Amphetamines 2 3 3 2 2Cocaine 0 1 1 2 2Crack 0 0 0 0 0Ecstasy 1 1 1 2 2Heroin 0 0 0 0 0LSD 1 1 1 1 0Magic mushrooms 1 1 1 1 1Methadone 0 0 0 0 0Tranquillisers 1 0 1 1 1Amyl nitrate (poppers) 1 1 1 1 1Anabolic steroids 0 0 0 0 0Volatile substances 0 0 0 0 0
Any drug3 10 10 11 11 13
Base 9646 10940 9988 13021 5851
1 British Crime Survey. The BCS is conducted in England and Wales amongst adults aged 16 to 59.2 2000 Survey of Psychiatric Morbidity among Adults.3 Any drug includes the following drugs presented as answer options in the BCS: smoke unknown; pills unknown; anything else.

74 Psychiatric Morbidity among Adults living in Private Households, 2000
3 Trends in prevalence of mental disorders and substance misuse
Table 3.8 Prevalence of drug dependence in 19931 and 20002
by age and sex (people aged 16 to 64 only)
Age
16–24 25–34 35–44 45–54 55–64 All
1993 2000 Difference 1993 2000 Difference 1993 2000 Difference 1993 2000 Difference 1993 2000 Difference 1993 2000 Difference
Rate per thousand in the past yearWomenSigns of
dependence on....Cannabis only 28 52 + 24 7 21 + 14* 3 8 + 5 10 2 + 1 - 1 + 1 8 16 + 8 *Another drug with
or without cannabis 12 28 + 16 10 6 - 3 5 4 - 1 2 2 + 0 8 3 - 5 7 8 + 1
Any drugdependence 40 80 + 40* 16 27 + 11 8 12 + 4 3 3 + 1 8 4 - 4 15 23 + 9 *
Base 704 408 1372 968 1141 1020 1040 798 1054 790 5311 3984
MenSigns of
dependence on....Cannabis only 71 102 + 31 14 69 + 56* 13 17 + 3 1 17 + 16* 1 2 + 1 20 41 + 21*Another drug with
or without cannabis 27 60 + 33* 8 23 + 15* 2 10 + 8 3 2 - 0 2 3 + 0 9 19 + 10*
Any drug dependence 98 162 + 64* 22 93 + 71* 15 26 + 11 3 19 + 16* 3 4 + 1 29 60 + 31*
Base 614 383 1189 710 994 822 890 745 839 645 4526 3305
All adultsSigns of
dependence on...Cannabis only 50 77 + 28* 10 46 + 35* 8 12 + 4 1 9 + 9* 0 1 + 1 14 28 + 15*Another drug with
or without cannabis 20 44 + 25* 9 15 + 6 3 7 + 4 3 2 - 0 5 3 - 2 8 13 + 5 *
Any drugdependence 69 122 + 52* 19 61 + 41* 11 19 + 8 3 11 + 8* 5 4 - 1 22 42 + 20*
Base 1318 791 2561 1678 2135 1842 1930 1543 1893 1435 9837 7289
1 1993 Survey of Psychiatric Morbidity among Adults.2 2000 Survey of Psychiatric Morbidity among Adults.* Difference significant at the 95% level.

75
4
Psychiatric Morbidity among Adults living in Private Households, 2000
Characteristics of adults with psychiatric disorders
76
4
Psychiatric Morbidity among Adults living in Private Households, 2000
Characteristics of adults with psychiatric disorders
4 Characteristics of adults with psychiatricdisorders
4.1 Introduction
This chapter focuses on individuals who wereidentified as having one or more neuroticdisorders, or alcohol or drug dependence. It showsthe associations between the presence of thesedisorders and key socio-demographic andeconomic characteristics for those with differenttypes of mental disorder: neurotic disorder,probable psychosis, alcohol or drug dependence. Italso examines the relationship between thepresence of these disorders and physicalcomplaints. There will be a topic report which willlook in detail at personality disorder, which willcover the characteristics of people with thisdisorder. A report covering in more depth thesocial and economic circumstances of people withmental disorder is also planned.
In this chapter, the characteristics of people witheach type of disorder are shown and the ways inwhich they differ from the rest of the populationhighlighted. Only differences which are statisticallysignificant are picked out. However, it should beremembered that, since each disorder is consideredseparately, those classified as without the disorderin question may have one of the other disorders.Also, many of the characteristics considered may beinter-related, for example age and marital status, soif people with a disorder tend to be younger thanthose without, they will probably also be less likelyto be married. This chapter is limited to adescription of the main characteristics of peoplewith disorder and no attempt has been made toidentify the relative importance of differentcharacteristics, which will be covered in subsequentpublications.
The characteristics covered in this chapter aredivided into several groups: personalcharacteristics, education and employment, andhousing and area of residence. The personalcharacteristics considered are age, sex, ethnicity,marital status, and family unit type. Ethnicity wasclassified by the respondent, selected from ninegroups: White, Black Caribbean, Black African,Black other, Indian, Pakistani, Bangladeshi, Chinese
and other. Because most of these groups were verysmall, they have been regrouped for the purpose ofthe current analysis, as described in chapter 2, intoWhite, Black, South Asian (Indian, Pakistani andBangladeshi) and all other groups combined.
Each informant’s family unit was classified into oneof six family unit types in the same way as in the1993 survey. ‘Couple no children’ included marriedor cohabiting couples without children. ‘Couple withchild’ comprised a married or cohabiting coupleliving with at least one child from their current or aprevious relationship. ‘Lone parent’ describes a manor woman living with at least one child. The childneed not be under eighteen and could be an adultwho had never married and has no children. Inmany cases the family unit and householdcomposition are the same, but this is not necessarilythe case. For example, ‘One person’ does notnecessarily imply that the respondent lives alone. Itincludes those who live alone, but it also includesadults living with a sibling, or grandparents livingwith their children and their family, as well as thoseliving with unrelated people in shared households.The category ‘adult living with parents’ wouldcontain the same members as a ‘couple with child’,except in this case it is the adult son or daughter whois the respondent. Similarly, ‘adult living with oneparent’ covers a similar type of family unit, exceptthat only one parent is present.
Educational level was based on the highesteducational qualification obtained. Employmentstatus is categorised into four groups; thoseworking full time (either for themselves or for anemployer), those working part time, those whowere unemployed, either waiting to take up a job,looking for work or intending to look for work buttemporarily unable to do so because of short termillness or injury, and those who are economicallyinactive – in full time education, long term sick,retired or looking after the family.
Social class was based on the Registrar General’sStandard Occupational Classification, Volume 3(OPCS, 1991). It was based on the informant’s ownoccupation. Where the informant was unemployed

77
4
Psychiatric Morbidity among Adults living in Private Households, 2000
Characteristics of adults with psychiatric disorders
or economically inactive at the time of interview,social class was based on the most recent previousoccupation.
Intellectual functioning was assessed using theNational Adult Reading Test (NART). This is a testof the subject’s ability to read and pronounce,correctly, 50 words. All of the words have non-standard pronunciation, and thus the correctpronunciation cannot easily be guessed. The scoreson the NART have been converted into predictedWAIS-R verbal IQ ratings, which are presented inthis chapter, using the algorithm recommended insection 2 of the NART test manual (Nelson andWillison, 1991).
4.2 Characteristics of people with neuroticdisorders
This section examines the characteristics ofrespondents with and without neurotic disorders.The disorders considered are based on ICD-10categories of diagnosis (World Health Organisation,1992) and relate to symptoms experienced byrespondents in the week before interview. Theyconsist of depressive episodes and disorders (mild,moderate and severe), phobias, panic disorders,generalised anxiety disorder, mixed anxiety anddepressive disorder and obsessive compulsivedisorder. People could have more than one disorder,and hence many appear in more than one category.
4.2.1 Personal characteristics
Seventeen per cent of respondents were assessed ashaving one or more of the neurotic disorders listedabove in the week before interview. Compared withpeople with no neurotic disorder, those with aneurotic disorder were more likely to be:• women (59% compared with 48% of those
without a disorder);• aged between 35 and 54 (45% compared
with 38%);• separated or divorced (14% compared with
7%); and• living as a one person family unit (20%
compared with 16%) or as a lone parent (9%compared with 4%).
They were less likely to be:• aged between 65 and 74 (7% compared with
12%); and• married or cohabiting (62% compared with
67%).
When men and women are considered separately, asimilar pattern is seen for women as for both sexescombined. Men with neurotic disorders were lesslikely than those without to be aged between 16and 24, 11% compared with 16%. Men withneurotic disorders were also less likely than thosewithout to be single, 21% compared with 27%.Neither of these differences was found for women.(Table 4.1 and Figure 4.1)
Mixed anxietyand depressive
disorder
Generalisedanxiety disorder
Depressiveepisode
All phobias
Obsessivecompulsive
disorder
Panic disorder
No neuroticdisorder
0 10 20 30 40 50 60 70 80 90 100
Typ
e of
dis
orde
r
Percentage
Separated Divorced Widowed Single Married\cohabiting
Figure 4.1 Marital status of people with different types of neurotic disorder
78
4
Psychiatric Morbidity among Adults living in Private Households, 2000
Characteristics of adults with psychiatric disorders
Generalised anxiety disorder affected 5% of adultsin the week before interview. Compared with adultswith no neurotic disorder, those with generalisedanxiety disorder were more likely to be:• aged between 35 and 54 (55% compared
with 38%);• divorced or separated (20% compared with
7%); and• living as a one person family unit (22%
compared with 16%) or as a lone parent(11% compared with 4%).
They were less likely to be:• aged between 16 and 24 (5% compared with
15%) or between 65 and 74 (6% comparedwith 12%); and
• married or cohabiting (61% compared with67%).
Women with generalised anxiety disorder wereparticularly likely to be living as lone parents, 17%compared with 8% among women with noneurotic disorder. Men with generalised anxietydisorder were less likely than those with noneurotic disorder to be single, 19% compared with27%. (Table 4.1 and Figure 4.1)
Three per cent of adults were assessed as having adepressive episode or disorder in the week beforeinterview. Compared with adults with no neuroticdisorder, those who had had a depressive episodewere more likely to be:• aged between 35 and 54 (51% compared
with 38%);• divorced or separated (20% compared with
7%); and• living as a one person family unit (28%
compared with 16%) or as a lone parent(11% compared with 4%).
They were less likely to be:• aged between 65 and 74 (4% compared with
12%);• married or cohabiting (54% compared with
67%); and• living as a couple without children (21%
compared with 32%).
In general, this pattern was similar for both menand women. Men with depressive episode wereless likely to be aged between 16 and 24, 5%compared with 16% without a disorder, but this
was not true for women. Women with a depressiveepisode were more likely to be lone parents thanthose with no neurotic disorder, 17% comparedwith 8%. (Table 4.1)
Two per cent of adults had experienced a phobia inthe week before interview. Compared with peoplewith no neurotic disorder, those with a phobia weremore likely to be:• women (62% compared with 48%);• aged between 35 and 54 (50% compared
with 38%);• separated or divorced (21% compared with
7%); and• living as a one person family unit (29%
compared with 16%) or as a lone parent(12% compared with 4%).
They were less likely to be:• aged 65 to 74 (4% compared with 12%); and• married or cohabiting (47% compared with
67%).
Men with phobias were no more likely than thosewithout to be lone parents, whereas among womenwith phobias, 19% were lone parents, comparedwith 8% of women without phobias. (Table 4.1)
Obsessive compulsive disorders were found in onlyone per cent of respondents. Compared with peoplewith no neurotic disorder, those with obsessivecompulsive disorder were more likely to be:• women (61% compared with 48% of those
without any disorder);• divorced or separated (16% compared with
7%); and• living in a one person family unit (36%
compared with 16%).
They were less likely than those with no neuroticdisorder to be:• aged 65 to 74 years (2% compared with 12%
with no disorder); and• married or cohabiting (48% compared with
67%).
One per cent of adults were assessed as having apanic disorder. The base for people with panicdisorder was very small, and therefore nodifferences reached the level of statisticalsignificance. However, this disorder was notable in

79
4
Psychiatric Morbidity among Adults living in Private Households, 2000
Characteristics of adults with psychiatric disorders
that it was equally likely to occur in men andwomen, whereas all other disorders, occurred morefrequently in women. (Table 4.1)
The largest proportion of adults with any disorderwas those with mixed anxiety and depressivedisorder, at 9%. The personal characteristics ofpeople in this group were found to be very similarto those with any neurotic disorder, and are notreported separately here. (Table 4.1)
4.2.2 Education and employment
This section examines the relationship betweeneducational attainment, intellectual functioningand social class and employment status andneurotic disorders.
People with a neurotic disorder were more likelythan those without:• to have no formal educational qualifications,
31% compared with 27%. There was nodifference in terms of educationalqualifications between women with andwithout neurotic disorders. Among menhowever, 29% of those with neuroticdisorders had no qualifications, comparedwith 24% of those without;
• to have a predicted IQ of less than 90, 26%compared with 20%. This relationship heldfor both men and women;
• to come from Social Class V (7% comparedwith 5%), and conversely, a little less likely tocome from Social Class I, (3% comparedwith 5%); and
• to be economically inactive. Among those withneurotic disorders, 58% were employed and39% were economically inactive, comparedwith 69% of those with no disorder who wereemployed and 28% who were economicallyinactive. The proportion of unemployed wassimilar for both groups. The relationship wasfound to hold for both men and women.
Respondents with panic disorder were more likelythan those without• to have no educational qualifications (44%
compared with 27%).
Respondents with phobias were more likely thanthose without neurotic disorders to:• have no educational qualifications (39%
compared with 27% of those without aneurotic disorder);
• have a predicted IQ below 90 (32% comparedwith 20%);
• be economically inactive (57% compared with28%); and
• to be in Social Classes IV or V, semi- orunskilled (37% compared with 21%).
They were particularly unlikely to be:• in employment (39% compared with 69% of
those without neurotic disorders).
Compared with people with no neurotic disorder,respondents reporting a depressive episode wereparticularly likely to:• have no educational qualifications (38%
compared with 27% of those with nodisorder);
• have a predicted IQ below 90 (33% comparedwith 20%). It is possible that poorperformance on a test of intellectual functionmay be a result of being depressed, or beassociated with medication being taken forthe depressive episode;
• to have occupations in Social Classes IV and V(30% compared with 21%); and
• to be economically inactive (52% comparedwith 28%).
They were particularly unlikely:• to have a degree (8% compared with 15% of
those with no neurotic disorder); and• to have a predicted IQ of 110 or more (19%
compared with 31%).
People with obsessive compulsive disorder wereparticularly likely to:• have a predicted IQ below 90 (34% compared
with 20% of those with no neurotic disorder);and
• be economically inactive (48% compared with28%).
They were particularly unlikely to have a predictedIQ of 110 or above – 17% compared with 31% ofthose with no neurotic disorder. (Table 4.2)

80
4
Psychiatric Morbidity among Adults living in Private Households, 2000
Characteristics of adults with psychiatric disorders
4.2.3 Housing and area of residence
Respondents with a neurotic disorder, whencompared with those who had no neuroticdisorder, were more likely to:• be tenants of Local Authorities and Housing
Associations, 26% compared with 15% withno disorder;
• have moved three or more times in the lasttwo years, 6% compared with 3% of thosewith no neurotic disorder; and
• live in an urban area, 71% compared with65% of those with no disorder.
They were less likely to:• own their own home outright (15%
compared with 25%);• have lived in the same accommodation for the
last two years (75% compared with 81%); and• live in a semi-rural area (21% compared with
26%).
Similar patterns were found when men and womenwere considered separately.
Those with phobias and depressive episodes wereparticularly likely to be Local Authority andHousing Association tenants: 37% and 36%,respectively, rented from this source compared with15% of those with no neurotic disorder. Amongpeople with obsessive compulsive disorder therewas a particularly high proportion renting fromsources other than Local Authorities and HousingAssociations, 22%, compared with 10% ofrespondents with no neurotic disorder. (Table 4.3)
4.2.4 Neurotic disorder and physical complaints
Overall, 42% of adults reported a physicalcomplaint. Women were slightly more likely thanmen to report a longstanding illness, 43%
compared with 40% of men. Having a neuroticdisorder substantially increased the likelihood ofreporting one or more physical complaints. Fiftyeight per cent of adults with a neurotic disorderreported a physical complaint, compared with 38%of adults with no neurotic disorder. (Table 4.4)
The prevalence of musculo-skeletal complaints wasalmost twice as high among those with a neuroticdisorder than among those with no disorder, 29%compared with 16%. Also, having a neuroticdisorder more than doubled the likelihood ofreporting complaints of the digestive system and ofthe nervous system (both 9% compared with 4%),of the genito-urinary system (4% compared with2%) and skin complaints (3% compared with 1%).(Table 4.4)
There was a clear relationship between the numberof neurotic disorders and the reporting of aphysical complaint. Just under two fifths of adultswith no neurotic disorder (38%) reported having aphysical complaint. This rose to over half (57%) ofthose with one neurotic disorder while amongthose with two or more neurotic disorders, two-thirds (67%) reported at least one physicalcomplaint. A similar relationship was evident forwomen, but although men with neurotic disorderswere more likely than those without to have aphysical complaint, there was no clear relationshipwith the number of neurotic disorders. (Table 4.5and Figure 4.2)
The relationship between individual complaintsand the number of neurotic disorders was lessclear-cut. In general, people with one neuroticdisorder were more likely than those with nodisorder to report most types of long-standingphysical complaint and those with two or moreneurotic disorders were still more likely to do so.However, the differences between those with onedisorder and two or more failed to reach levels ofstatistical significance. (Table 4.5)

81
4
Psychiatric Morbidity among Adults living in Private Households, 2000
Characteristics of adults with psychiatric disorders
4.3 Characteristics of people with probablepsychotic disorder
This section describes the characteristics of peoplewho were assessed as having probable psychosis, i.e.those given an assessment of psychotic disorder inthe past year at clinical interview or who did nothave a clinical interview but had two or moreindicators of psychosis in the initial interview. Thevery small number of people identified as probablyhaving psychotic disorder means that quite largedifferences between these people and those withoutdisorder may have occurred by chance, so caremust be taken when interpreting the tables shownhere. However, some differences are so great thatthey do reach statistical significance and these aredescribed in this section. Because of the smallnumber of people with probable psychosis, data areonly presented for men and women together.
4.3.1 Personal characteristics
A third of people assessed as probably having apsychotic disorder in this survey were aged 35 to 44years and overall, three-quarters were aged 25 to 54years. The majority (92%) classed themselves asWhite. Only about two fifths of them were marriedor cohabiting and nearly a quarter were divorced.(Table 4.6)
People with probable psychotic disorder comparedwith those without disorder were more likely to be:• separated or divorced (29% compared to 8%
of those without disorder); and• living in a one person family unit (43%
compared with 16%).
They were less likely to be married or cohabiting –only 39% of those with probable psychosis were
Any longstandingphysical complaint
Musculo-skeletal complaints
Respiratory system complaints
Heart and circulatory system complaints
Digestive system complaints
Nervous systemcomplaints
Endocrine disorders
Genito-urinarysystem complaints
Skin complaints
Ear complaints
Eye complaints
Neoplasms
Blood disorders
Infectious and parasiticdiseases
0 10 20 30 40 50 60 70 80
Com
plai
nt
Percentage of respondents
No disordersOne disorderTwo plus disorders
Figure 4.2 Percentage of people with physical complaints by numberof neurotic disorders

82
4
Psychiatric Morbidity among Adults living in Private Households, 2000
Characteristics of adults with psychiatric disorders
married or cohabiting compare with 66% of thosewithout disorder.
4.3.2 Education and employment
The majority of people who were assessed ashaving a psychotic disorder (84%) had educationalqualifications of GCSE level or below. Over a halfwere in Social Classes IIIM, IV or V and more thantwo thirds were economically inactive.Compared with people who did not have apsychotic disorder those with probable psychosiswere more likely to:• have educational qualifications no higher than
at GCSE level (84% compared with 63% ofthose with no psychotic disorder);
• be in Social Class IV or V (39% comparedwith 22%); and
• be economically inactive (70% compared with30%).
They were less likely to:• have a degree or A levels (2% and 7%,
respectively, compared with 15% for bothqualifications among those withoutpsychosis);
• be in Social Class I or II (19% compared with34%); and
• be employed (28% compared with 67%).
4.3.3 Housing and area of residence
Almost half the people who were assessed asprobably having a psychotic disorder were living inaccommodation rented from a Local Authority orHousing Association and most lived in urban areas.(Table 4.8)
Compared with people who did not have apsychotic disorder those with probable psychosiswere more likely to:• live in accommodation rented from a local
authority or housing association (49%compared to 17% of those without psychoticdisorder); and
• live in an urban area (88% compared with66%).
They were less likely to:• own their own home, either outright or with a
mortgage (10% owned their homes outright
and 28% with a mortgage compared with 24%and 49% among those without disorder); and
• live in either semi-rural or rural locations(10% and 3%, respectively, compared with25% and 9%).
4.3.4 Probable psychosis and physical complaints
People assessed as probably having a psychoticdisorder were more likely than those without toreport a longstanding physical health problem.Overall, 62% of those with probable psychosisreported a physical complaint compared with only42% of those without this disorder. (Table 4.9)
4.4 Characteristics of people with alcoholproblems
For the purpose of this analysis, people have beendivided into 3 groups based on their scores on thetwo measures of alcohol misuse and dependence theAUDIT and the SAD-Q: those scoring below 8 onthe AUDIT (no pattern of hazardous alcoholconsumption); those with an AUDIT score of 8 ormore but with a SAD-Q score of 0-3 (a hazardouspattern of drinking but no signs of dependence); andthose scoring 10 or more on the AUDIT and 4 ormore on the SAD-Q (mild to severe dependence onalcohol).
4.4.1 Personal characteristics
Respondents whose scores on the AUDIT andSAD-Q measures indicated hazardous ordependent levels of alcohol use were substantiallymore likely to be men than those who drank atnon-hazardous levels. Men comprised two thirds ofthose with hazardous levels of alcohol consumption(67%) and four-fifths (80%) of those dependent onalcohol, compared with only 43% of those withlower scores.
There was a clear association between hazardousalcohol use and the age of the respondent. Amongrespondents who were assessed as dependent onalcohol, 30% were aged under 25, compared with21% of those with a hazardous pattern of drinkingbut no dependence and 12% of those with nopattern of hazardous alcohol use. Conversely, only

83
4
Psychiatric Morbidity among Adults living in Private Households, 2000
Characteristics of adults with psychiatric disorders
8% of those who were alcohol dependent were aged55 or over, compared with 17% of the group whodrank at hazardous levels but were not dependentand 29% of those with lower levels of alcohol use.The tendency for people who were hazardousdrinkers of dependent on alcohol to be youngerthan those who drank less was even more markedamong women than among men. For example, overa quarter of women who were hazardous but non-dependent drinkers (27%) were aged under 25,compared with less than a fifth of the men (19%)in this group. Similarly, 37% of women who wereclassified as alcohol dependent were under 25 yearsof age compared with 28% of alcohol dependentmen. (Table 4.10 and Figure 4.3)
Among those judged to be dependent on alcohol,fewer than half (45%) were married or cohabiting,compared with 60% of those with hazardous butnon-dependent levels of alcohol consumption and69% of those whose level of consumption was nothazardous. The pattern was similar for men andwomen. The proportion of single people increasedwith the level of alcohol use, from 18% of thosewith no hazardous alcohol use to 45% among thoseclassed as alcohol dependence. This is likely to belinked to the relationship between age and level ofalcohol consumption. (Table 4.10)
4.4.2 Education and employment
There was no clear association between levels ofalcohol use and educational qualifications, otherthan that those with lower levels of use wereslightly more likely than those with hazardouslevels or dependence on alcohol to have noqualifications, 29% compared with 23% of thosewith hazardous levels of consumption and 22% ofthose with alcohol dependence. However, thosewith alcohol dependence were the most likely tohave a predicted IQ below 90, 26% did socompared with 21% of those with no dependencewith or without hazardous drinking patterns.
There were no social class differences associatedwith levels of alcohol use. However, respondentswith no hazardous pattern of alcohol use were themost likely to be economically inactive, 34%compared with 18% of those classed as hazardousdrinkers and 19% of people with alcoholdependence. Again, this is likely to be associatedwith the younger age profile and the lowerproportion of women among those who hadhazardous levels of alcohol consumption or adependence on alcohol, since a large proportion ofthe economically inactive group will be retiredpeople and women caring for families. (Table 4.11)
No hazardous drinking Hazardous drinkingnot dependent
Alcohol dependent0
10
20
30
40
50
60
70
80
90
100
Per
cent
age
Level of alcohol consumption
16–24 25–34 35–44 45–54 55–64 65–74
Figure 4.3 Age distribution by level of alcohol problem
Age group:

84
4
Psychiatric Morbidity among Adults living in Private Households, 2000
Characteristics of adults with psychiatric disorders
4.4.3 Housing and area of residence
The group of respondents classed as not having analcohol problem were the most likely to own theirhomes outright, 26% did so compared with 19%of those with hazardous levels of alcoholconsumption and 12% of people dependent onalcohol. Those with hazardous levels of alcoholconsumption but no dependence were more likelythan those in either of the other categories to owntheir home with a mortgage, 54% compared with48% of those with no alcohol problem and 49% ofthose dependent on alcohol. This last groupincluded the highest proportion of tenants. Over afifth of them (22%) rented from a Local Authorityor housing association, compared with 18% ofthose with no alcohol problem and 13% of thosewith hazardous levels of consumption but nodependence. Seventeen per cent rented fromanother type of landlord, compared with 8% oflight or non-drinkers and 13% of those withhazardous levels of consumption but nodependency. (Table 4.12)
There was an association between levels of alcoholconsumption and the likelihood of having movedaccommodation in the two years before interview.Among those with non-hazardous levels ofconsumption, 82% had remained in the sameaccommodation throughout this period, comparedwith 76% of those with hazardous levels ofdrinking and 68% of those dependent on alcohol.Conversely, 16% of those dependent on alcoholhad moved two or more times in the previous twoyears, compared with 9% of those reportinghazardous drinking and 5% of those with loweralcohol consumption.
Those dependent on alcohol were the most likely tolive in urban areas, 73% compared with 68% ofthose drinking alcohol at hazardous levels butwithout dependence and 65% of those with lowerlevels of alcohol use. (Table 4.12)
4.4.4 Alcohol problems and physical complaints
There was no significant difference between theproportion of people reporting long-standingillness among the different groups of peoplecategorised on the basis of their level of alcohol use.When considering these figures it must be
remembered that the prevalence of long-standingphysical complaints increases with age and thegroup of people with non-hazardous drinkingpatterns contains a much higher proportion ofpeople in the older age groups. (Table 4.13)
4.5 Characteristics of people with drugdependence
For the purpose of this analysis, respondents wereallocated to one of three groups: those with nodrug dependence; those with signs of cannabisdependence but no other drug dependence; andthose dependent on a drug other than cannabis,with or without cannabis dependence. Because ofthe small number of people who were assessed asbeing drug dependent, the data is not presented formen and women separately. As mentioned inchapter 2 on the prevalence of disorders, thethreshold used to assess dependence in this surveywas set quite low so that some people who arefrequent users but not truly dependent on drugsmay be included in the dependent categories.
4.5.1 Personal characteristics
Overall, 3% of the sample were assessed asdependent on illicit drugs: 2% on cannabis aloneand 1% on another drug, whether with or withoutcannabis dependence. Those with a drugdependence were more likely to be male than thosewithout. Thus, 73% of those dependent oncannabis alone and 69% of those dependent ondrugs other than cannabis were male, comparedwith 49% of those who were not dependent on anydrug. (Table 4.14)
Those dependent on drugs had a much youngerage profile than those not dependent - 46% ofthose dependent on cannabis only and 54% ofthose dependent on other drugs were under 25,compared with only 14% of adults who were notdrug dependent. They were also more likely to besingle, 57% of those dependent on cannabis and65% of those dependent on other drugs, comparedwith 21% of those not dependent on drugs and lesslikely to married or cohabiting. This would beexpected given the younger age profile of thosedependent on drugs. (Table 4.14)

85
4
Psychiatric Morbidity among Adults living in Private Households, 2000
Characteristics of adults with psychiatric disorders
4.5.2 Education and employment
The relationship between educationalqualifications and drug dependency followed noclear pattern. Among adults dependent on drugsother than cannabis, only 4% had qualifications atdegree level or higher, significantly fewer thaneither those dependent on cannabis only, of whom13% had qualifications at this level, or those notdependent on drugs, of whom 15% had a degree.However, people with drug dependency were alsoless likely to have no qualifications: 15% of thosedependent on cannabis only and 21% of thosedependent on other drugs had no qualificationscompared with 28% of those who were not drugdependent. This may reflect an association betweenage or ethnic group and the likelihood of havingeducational qualifications, rather than a directrelationship between educational attainment anddrug dependence. (Table 4.15)
Those dependent on drugs other than cannabis hadlower predicted IQs than those with signs ofdependence on cannabis only or those notdependent on drugs, 39% of them had predictedIQs below 90, compared with 26% of thosedependent on cannabis and 21% of non-drugdependent adults.
Those dependent on drugs were more likely to beunemployed than people with no drug dependence,11% of people with signs of cannabis dependenceand 10% of those dependent on other drugs wereunemployed, compared with 3% of those notdependent on drugs. Eighteen per cent of peoplewith cannabis dependence were economicallyinactive, compared with 30% of people withoutdrug dependence and 29% of people dependent onother drugs. (Table 4.15)
4.5.3 Housing and area of residence
Among adults not dependent on drugs almostthree quarters (74%) owned their own home,either outright or on a mortgage, compared with50% of cannabis dependent adults and 39% ofpeople dependent on drugs other than cannabis.Both those dependent on cannabis (28%) and ondrugs other than cannabis (35%) were more likelythan non-drug dependent adults (9%) to live inaccommodation rented from a source other than a
Local Authority or Housing Association. Again, thisis likely to be related to the younger age of thosedependent on drugs. People with drug dependencewere also significantly more mobile than thosewithout drug dependency – 28% of thosedependent on drugs other than cannabis and 20%of those dependent on cannabis had moved two ormore times in the previous two years comparedwith just 7% of people who were not dependent ondrugs. (Table 4.16)
4.5.4 Drug dependence and physical complaints
People dependent on other drugs, with or withoutcannabis dependence, were less likely to report alongstanding physical health problem than thosewith no drug dependence: 28% reported a physicalcomplaint compared with 42% of those withoutdependence. However, this would be expected giventhe generally young age of the people with drugdependence and the difference is largely due to ahigher prevalence among those withoutdependence of those conditions, such asmusculoskeletal and heart and circulatory systemcomplaints which are more common among olderpeople. (Table 4.17)
References
Nelson HE and Willison J (1991) National Adult Reading Test(NART) Test Manual, NFER-Nelson, Windsor, England
OPCS (1991) Standard Occupational Classification, Volume 3.HMSO: London
Singleton N, Meltzer H, Gatward R, Coid J and Deasy D (1998)Psychiatric morbidity among prisoners in England and WalesTSO: London
World Health Organisation (1992) The ICD-10 Classificationof Mental and Behavioural Disorders: Clinical descriptions anddiagnostic guidelines, WHO: Geneva
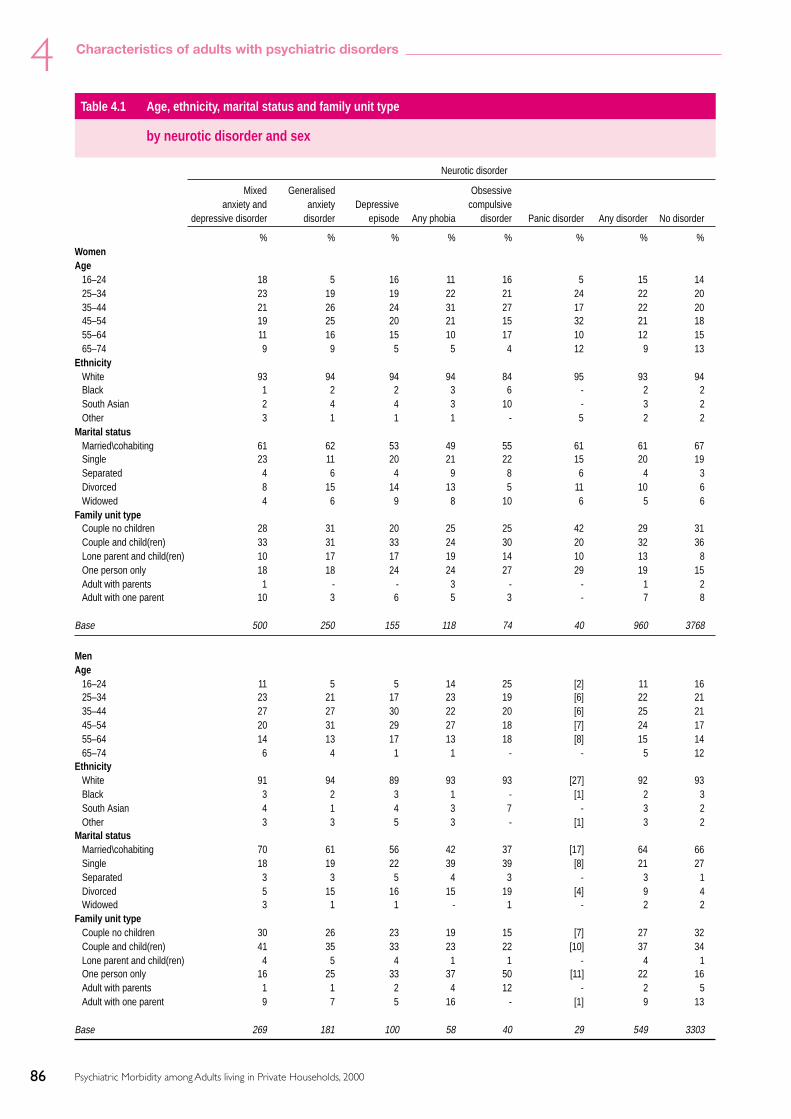
86
4
Psychiatric Morbidity among Adults living in Private Households, 2000
Characteristics of adults with psychiatric disorders
Table 4.1 Age, ethnicity, marital status and family unit type
by neurotic disorder and sex
Neurotic disorder
Mixed Generalised Obsessiveanxiety and anxiety Depressive compulsive
depressive disorder disorder episode Any phobia disorder Panic disorder Any disorder No disorder
% % % % % % % %WomenAge
16–24 18 5 16 11 16 5 15 1425–34 23 19 19 22 21 24 22 2035–44 21 26 24 31 27 17 22 2045–54 19 25 20 21 15 32 21 1855–64 11 16 15 10 17 10 12 1565–74 9 9 5 5 4 12 9 13
EthnicityWhite 93 94 94 94 84 95 93 94Black 1 2 2 3 6 - 2 2South Asian 2 4 4 3 10 - 3 2Other 3 1 1 1 - 5 2 2
Marital statusMarried\cohabiting 61 62 53 49 55 61 61 67Single 23 11 20 21 22 15 20 19Separated 4 6 4 9 8 6 4 3Divorced 8 15 14 13 5 11 10 6Widowed 4 6 9 8 10 6 5 6
Family unit typeCouple no children 28 31 20 25 25 42 29 31Couple and child(ren) 33 31 33 24 30 20 32 36Lone parent and child(ren) 10 17 17 19 14 10 13 8One person only 18 18 24 24 27 29 19 15Adult with parents 1 - - 3 - - 1 2Adult with one parent 10 3 6 5 3 - 7 8
Base 500 250 155 118 74 40 960 3768
MenAge
16–24 11 5 5 14 25 [2] 11 1625–34 23 21 17 23 19 [6] 22 2135–44 27 27 30 22 20 [6] 25 2145–54 20 31 29 27 18 [7] 24 1755–64 14 13 17 13 18 [8] 15 1465–74 6 4 1 1 - - 5 12
EthnicityWhite 91 94 89 93 93 [27] 92 93Black 3 2 3 1 - [1] 2 3South Asian 4 1 4 3 7 - 3 2Other 3 3 5 3 - [1] 3 2
Marital statusMarried\cohabiting 70 61 56 42 37 [17] 64 66Single 18 19 22 39 39 [8] 21 27Separated 3 3 5 4 3 - 3 1Divorced 5 15 16 15 19 [4] 9 4Widowed 3 1 1 - 1 - 2 2
Family unit typeCouple no children 30 26 23 19 15 [7] 27 32Couple and child(ren) 41 35 33 23 22 [10] 37 34Lone parent and child(ren) 4 5 4 1 1 - 4 1One person only 16 25 33 37 50 [11] 22 16Adult with parents 1 1 2 4 12 - 2 5Adult with one parent 9 7 5 16 - [1] 9 13
Base 269 181 100 58 40 29 549 3303

87
4
Psychiatric Morbidity among Adults living in Private Households, 2000
Characteristics of adults with psychiatric disorders
All adultsSex
Male 39 48 45 38 39 49 41 52Female 61 52 55 62 61 51 59 48
Age16–24 15 5 11 12 19 9 13 1525–34 23 20 18 22 21 24 22 2035–44 23 27 27 27 25 16 23 2045–54 19 28 24 23 16 28 22 1855–64 12 15 16 11 17 16 13 1465–74 7 6 4 4 2 6 7 12
EthnicityWhite 92 94 91 94 88 94 93 93Black 2 2 2 2 4 1 2 2South Asian 3 2 4 3 9 - 3 2Other 3 2 3 1 - 5 2 2
Marital statusMarried\cohabiting 65 61 54 47 48 64 62 67Single 21 15 21 28 29 20 21 23Separated 4 5 5 7 6 3 4 2Divorced 6 15 15 14 10 9 10 5Widowed 4 4 5 5 7 3 4 4
Family unit typeCouple no children 29 29 21 23 21 33 28 32Couple and child(ren) 36 33 33 24 27 31 34 35Lone parent and child(ren) 8 11 11 12 9 5 9 4One person only 17 22 28 29 36 28 20 16Adult with parents 1 1 1 3 5 - 1 3Adult with one parent 9 5 5 9 2 3 8 10
Base 769 431 255 176 114 69 1509 7071
Neurotic disorder
Mixed Generalised Obsessiveanxiety and anxiety Depressive compulsive
depressive disorder disorder episode Any phobia disorder Panic disorder Any disorder No disorder
% % % % % % % %
Table 4.1 - continued Age, ethnicity, marital status and family unit type
by neurotic disorder and sex
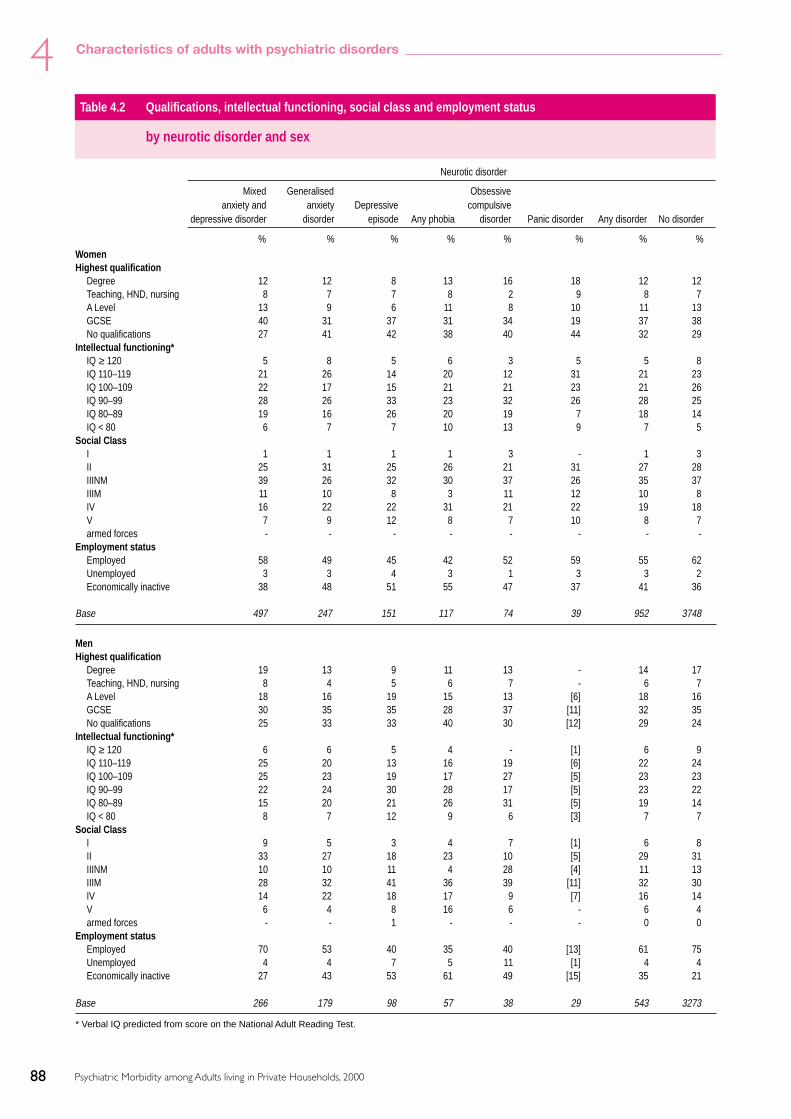
88
4
Psychiatric Morbidity among Adults living in Private Households, 2000
Characteristics of adults with psychiatric disorders
WomenHighest qualification
Degree 12 12 8 13 16 18 12 12Teaching, HND, nursing 8 7 7 8 2 9 8 7A Level 13 9 6 11 8 10 11 13GCSE 40 31 37 31 34 19 37 38No qualifications 27 41 42 38 40 44 32 29
Intellectual functioning*IQ ≥ 120 5 8 5 6 3 5 5 8IQ 110–119 21 26 14 20 12 31 21 23IQ 100–109 22 17 15 21 21 23 21 26IQ 90–99 28 26 33 23 32 26 28 25IQ 80–89 19 16 26 20 19 7 18 14IQ < 80 6 7 7 10 13 9 7 5
Social ClassI 1 1 1 1 3 - 1 3II 25 31 25 26 21 31 27 28IIINM 39 26 32 30 37 26 35 37IIIM 11 10 8 3 11 12 10 8IV 16 22 22 31 21 22 19 18V 7 9 12 8 7 10 8 7armed forces - - - - - - - -
Employment statusEmployed 58 49 45 42 52 59 55 62Unemployed 3 3 4 3 1 3 3 2Economically inactive 38 48 51 55 47 37 41 36
Base 497 247 151 117 74 39 952 3748
MenHighest qualification
Degree 19 13 9 11 13 - 14 17Teaching, HND, nursing 8 4 5 6 7 - 6 7A Level 18 16 19 15 13 [6] 18 16GCSE 30 35 35 28 37 [11] 32 35No qualifications 25 33 33 40 30 [12] 29 24
Intellectual functioning*IQ ≥ 120 6 6 5 4 - [1] 6 9IQ 110–119 25 20 13 16 19 [6] 22 24IQ 100–109 25 23 19 17 27 [5] 23 23IQ 90–99 22 24 30 28 17 [5] 23 22IQ 80–89 15 20 21 26 31 [5] 19 14IQ < 80 8 7 12 9 6 [3] 7 7
Social ClassI 9 5 3 4 7 [1] 6 8II 33 27 18 23 10 [5] 29 31IIINM 10 10 11 4 28 [4] 11 13IIIM 28 32 41 36 39 [11] 32 30IV 14 22 18 17 9 [7] 16 14V 6 4 8 16 6 - 6 4armed forces - - 1 - - - 0 0
Employment statusEmployed 70 53 40 35 40 [13] 61 75Unemployed 4 4 7 5 11 [1] 4 4Economically inactive 27 43 53 61 49 [15] 35 21
Base 266 179 98 57 38 29 543 3273
Table 4.2 Qualifications, intellectual functioning, social class and employment status
by neurotic disorder and sex
Neurotic disorder
Mixed Generalised Obsessiveanxiety and anxiety Depressive compulsive
depressive disorder disorder episode Any phobia disorder Panic disorder Any disorder No disorder
% % % % % % % %
* Verbal IQ predicted from score on the National Adult Reading Test.

89
4
Psychiatric Morbidity among Adults living in Private Households, 2000
Characteristics of adults with psychiatric disorders
All adultsHighest qualification
Degree 15 13 8 12 15 9 13 15Teaching, HND, nursing 8 6 6 8 4 4 7 7A Level 15 12 12 12 10 15 14 15GCSE 36 33 36 30 35 28 35 36No qualifications 26 37 38 39 36 44 31 27
Intellectual functioning*IQ ≥ 120 5 7 5 5 2 4 6 8IQ 110–119 22 23 14 19 14 27 21 23IQ 100–109 23 20 17 19 24 22 22 24IQ 90–99 25 25 32 25 26 23 26 24IQ 80–89 18 18 24 22 24 13 19 14IQ < 80 7 7 10 10 10 11 7 6
Social ClassI 4 3 1 2 4 1 3 5II 28 29 22 25 17 23 27 29IIINM 28 18 22 20 34 22 25 24IIIM 18 21 23 15 21 27 19 19IV 15 22 20 26 17 22 18 16V 7 7 10 11 7 5 7 5armed forces - - 0 - - - 0 0
Employment statusEmployed 63 51 43 39 47 53 58 69Unemployed 3 3 5 3 5 2 4 3Economically inactive 34 45 52 57 48 44 39 28
Base 763 426 249 174 112 68 1495 7021
Table 4.2 - continued Qualifications, intellectual functioning, social class and employment status
by neurotic disorder and sex
Neurotic disorder
Mixed Generalised Obsessiveanxiety and anxiety Depressive compulsive
depressive disorder disorder episode Any phobia disorder Panic disorder Any disorder No disorder
% % % % % % % %
* Verbal IQ predicted from score on the National Adult Reading Test.

90
4
Psychiatric Morbidity among Adults living in Private Households, 2000
Characteristics of adults with psychiatric disorders
Table 4.3 Housing tenure, number of accommodation moves and type of locality
by neurotic disorder and sex
WomenHousing Tenure
Owned outright 19 18 9 9 5 18 17 26Owned with mortgage 46 48 40 42 36 36 45 49Rented from LA or HA 24 24 34 34 37 30 26 17Rented from other source 11 9 17 15 22 16 12 9
Number of moves in last 2 years0 75 78 77 75 65 71 75 811 15 13 12 10 18 21 14 132 4 4 5 8 10 2 5 33 and over 6 5 6 7 7 7 6 2
Type of localityUrban 70 74 81 80 81 72 72 65Semi-rural 21 18 13 13 12 21 20 26Rural 9 8 6 7 8 7 8 9
Base 500 250 155 118 74 40 960 3768
MenHousing Tenure
Owned outright 13 14 9 7 11 [1] 13 25Owned with mortgage 54 48 43 29 40 [13] 50 50Rented from LA or HA 22 30 38 43 27 [12] 26 14Rented from other source 11 7 10 21 23 [2] 12 10
Number of moves in last 2 years0 76 75 75 66 68 [21] 75 801 15 14 15 18 14 [5] 15 132 4 5 2 9 5 [1] 4 43 and over 6 6 8 7 13 [2] 6 3
Type of localityUrban 65 76 78 88 75 [20] 69 65Semi-rural 25 16 17 11 23 [9] 23 25Rural 9 9 5 1 2 - 8 9
Base 269 181 100 58 40 29 549 3303
All adultsHousing Tenure
Owned outright 17 16 9 8 7 11 15 25Owned with mortgage 49 48 41 37 38 42 47 49Rented from LA or HA 23 27 36 37 33 31 26 15Rented from other source 11 8 13 17 22 15 12 10
Number of moves in last 2 years0 75 77 77 71 66 69 75 811 15 14 13 13 16 22 15 132 4 4 3 9 8 2 5 43 and over 6 5 7 7 9 7 6 3
Type of localityUrban 68 75 79 83 78 69 71 65Semi-rural 23 17 15 12 16 28 21 26Rural 9 8 6 5 5 4 8 9
Base 769 431 255 176 114 69 1509 7071
Neurotic disorder
Mixed Generalised Obsessiveanxiety and anxiety Depressive compulsive
depressive disorder disorder episode Any phobia disorder Panic disorder Any disorder No disorder
% % % % % % % %
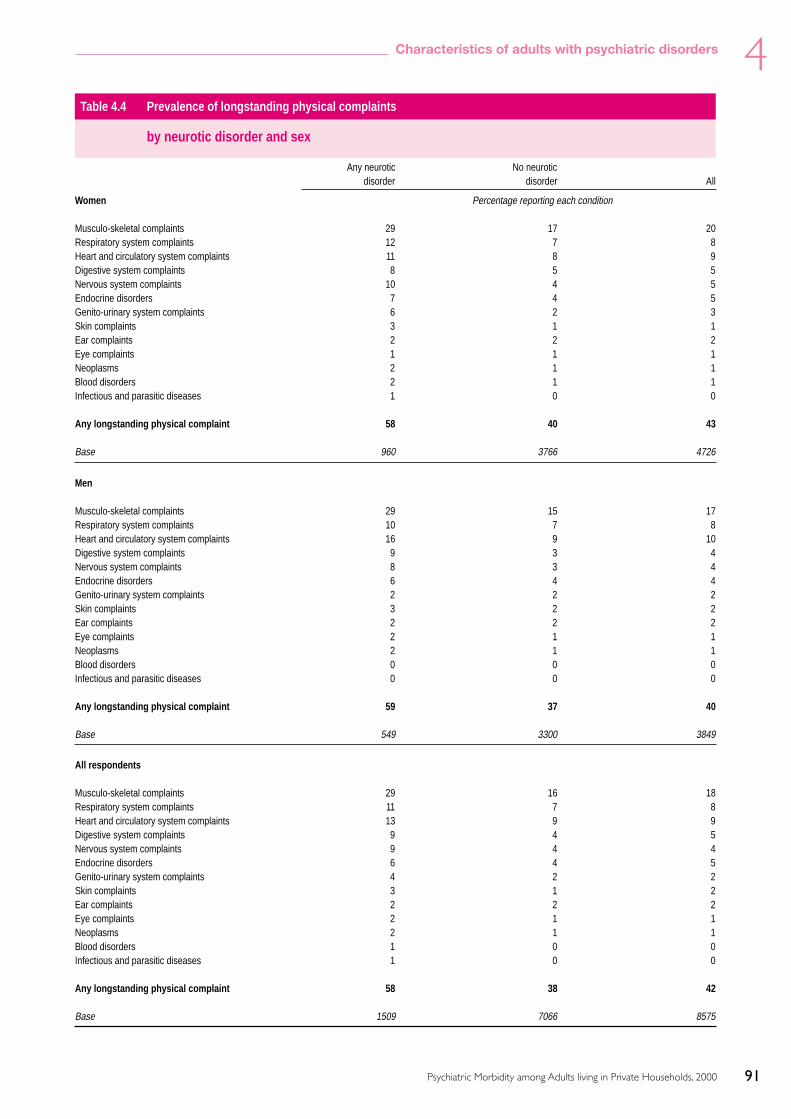
91
4
Psychiatric Morbidity among Adults living in Private Households, 2000
Characteristics of adults with psychiatric disorders
Table 4.4 Prevalence of longstanding physical complaints
by neurotic disorder and sex
Any neurotic No neuroticdisorder disorder All
Women Percentage reporting each condition
Musculo-skeletal complaints 29 17 20Respiratory system complaints 12 7 8Heart and circulatory system complaints 11 8 9Digestive system complaints 8 5 5Nervous system complaints 10 4 5Endocrine disorders 7 4 5Genito-urinary system complaints 6 2 3Skin complaints 3 1 1Ear complaints 2 2 2Eye complaints 1 1 1Neoplasms 2 1 1Blood disorders 2 1 1Infectious and parasitic diseases 1 0 0
Any longstanding physical complaint 58 40 43
Base 960 3766 4726
Men
Musculo-skeletal complaints 29 15 17Respiratory system complaints 10 7 8Heart and circulatory system complaints 16 9 10Digestive system complaints 9 3 4Nervous system complaints 8 3 4Endocrine disorders 6 4 4Genito-urinary system complaints 2 2 2Skin complaints 3 2 2Ear complaints 2 2 2Eye complaints 2 1 1Neoplasms 2 1 1Blood disorders 0 0 0Infectious and parasitic diseases 0 0 0
Any longstanding physical complaint 59 37 40
Base 549 3300 3849
All respondents
Musculo-skeletal complaints 29 16 18Respiratory system complaints 11 7 8Heart and circulatory system complaints 13 9 9Digestive system complaints 9 4 5Nervous system complaints 9 4 4Endocrine disorders 6 4 5Genito-urinary system complaints 4 2 2Skin complaints 3 1 2Ear complaints 2 2 2Eye complaints 2 1 1Neoplasms 2 1 1Blood disorders 1 0 0Infectious and parasitic diseases 1 0 0
Any longstanding physical complaint 58 38 42
Base 1509 7066 8575

92
4
Psychiatric Morbidity among Adults living in Private Households, 2000
Characteristics of adults with psychiatric disorders
Table 4.5 Prevalence of longstanding physical complaints
by number of neurotic disorders and sex
Number of neurotic disorders
None One Two or more
Women Percentage reporting each condition
Musculo-skeletal complaints 17 28 39Respiratory system complaints 7 12 17Heart and circulatory system complaints 8 11 9Digestive system complaints 5 8 12Nervous system complaints 4 9 16Endocrine disorders 4 7 6Genito-urinary system complaints 2 5 8Skin complaints 1 3 1Ear complaints 2 2 4Eye complaints 1 1 2Neoplasms 1 2 4Blood disorders 1 2 2Infectious and parasitic diseases 0 0 1
Any longstanding physical complaint 40 56 72
Base 3766 829 131
Men
Musculo-skeletal complaints 15 29 29Respiratory system complaints 7 10 11Heart and circulatory system complaints 9 16 18Digestive system complaints 3 9 11Nervous system complaints 3 7 11Endocrine disorders 4 6 9Genito-urinary system complaints 2 2 4Skin complaints 2 2 5Ear complaints 2 2 3Eye complaints 1 2 3Neoplasms 1 2 3Blood disorders 0 0 -Infectious and parasitic diseases 0 0 -
Any longstanding physical complaint 37 59 62
Base 3300 455 94
All respondents
Musculo-skeletal complaints 16 28 34Respiratory system complaints 7 11 14Heart and circulatory system complaints 9 13 13Digestive system complaints 4 8 12Nervous system complaints 4 8 13Endocrine disorders 4 6 7Genito-urinary system complaints 2 4 6Skin complaints 1 3 3Ear complaints 2 2 3Eye complaints 1 2 3Neoplasms 1 2 4Blood disorders 0 1 1Infectious and parasitic diseases 0 0 1
Any longstanding physical complaint 38 57 67
Base 7066 1284 225

93
4
Psychiatric Morbidity among Adults living in Private Households, 2000
Characteristics of adults with psychiatric disorders
Table 4.6 Sex, age, ethnicity, marital status and familyunit type
by probable psychotic disorder
No psychotic Probabledisorder psychosis
% %All adultsSex
Male 50 53Female 50 47
Age16–24 15 625–34 20 2035–44 21 3545–54 18 2155–64 14 1265–74 11 7
EthnicityWhite 93 92Black 2 8South Asian 2 -Other 2 -
Marital statusMarried\cohabiting 66 39Single 23 29Separated 2 7Divorced 5 23Widowed 4 3
Family unit typeCouple no children 31 22Couple and child(ren) 35 17Lone parent and child(ren) 5 7One person 16 43Adult with parents 3 5Adult with one parent 10 7
Base 8520 60
Table 4.7 Qualifications, intellectual functioning,social class and employment status
by probable psychotic disorder
No psychotic Probabledisorder psychosis
% %All adultsHighest qualification
Degree 15 2Teaching, HND, nursing 7 7A Level 15 7GCSE 36 44No qualifications 27 40
Intellectual functioning*IQ ≥ 120 8 10IQ 110–119 23 17IQ 100–109 24 21IQ 90–99 24 24IQ 80–89 15 21IQ < 80 7 8
Social classI 5 1II 29 18IIINM 25 21IIIM 19 21IV 16 21V 6 19armed forces 0 -
Employment statusEmployed 67 28Unemployed 3 2Economically inactive 30 70
Base 8177 54
Table 4.8 Housing tenure, number of accomodationmoves and type of locality
by probable psychotic disorder
No psychotic Probabledisorder psychosis
% %All adultsHousing Tenure
Owned outright 24 10Owned with mortgage 49 28Rented from LA or HA 17 49Rented from other source 10 13
Number of moves in last 2 yearsNone 80 77One 13 12Two or more 7 11
Type of localityUrban 66 88Semi-rural 25 10Rural 9 3
Base 8442 56
Table 4.9 Prevalence of longstanding physicalcomplaints
by probable psychotic disorder
No psychotic Probabledisorder psychosis
Percentage reporting each conditionAll adultsMusculo-skeletal complaints 18 21Respiratory system complaints 8 9Heart and circulatory system complaints 9 21Digestive system complaints 5 8Nervous system complaints 4 15Endocrine disorders 5 3Genito-urinary system complaints 2 3Skin complaints 2 1Ear complaints 2 -Eye complaints 1 4Neoplasms 1 3Blood disorders 0 -Infectious and parasitic diseases 0 -
Any longstanding physical complaint 42 62
Base 8515 60
* Verbal IQ predicted from score on the National Adult Reading Test.

94
4
Psychiatric Morbidity among Adults living in Private Households, 2000
Characteristics of adults with psychiatric disorders
Table 4.10 Age, ethnicity, marital status and family unit type
by level of alcohol problem and sex
No hazardous drinking1 Hazardous drinking Alcohol dependent3
not dependent2
% % %WomenAge
16–24 12 27 3725–34 19 25 2935–44 21 20 2145–54 19 15 955–64 16 9 365–74 13 5 2
EthnicityWhite 93 97 94Black 2 1 4South Asian 3 1 -Other 2 1 1
Marital statusMarried\cohabiting 68 56 37Single 16 34 45Separated 3 2 7Divorced 7 6 9Widowed 6 2 2
Family unit typeCouple no children 32 27 21Couple and child(ren) 36 29 17Lone parent and child(ren) 9 6 16One person only 15 20 28Adult with parents 2 3 5Adult with one parent 7 15 13
Base 4012 551 144
MenAge
16–24 11 19 2825–34 18 24 2835–44 21 20 2545–54 19 19 1155–64 17 11 665–74 13 7 2
EthnicityWhite 91 96 95Black 3 2 1South Asian 4 1 1Other 2 1 2
Marital statusMarried\cohabiting 71 62 47Single 21 30 45Separated 2 1 2Divorced 4 5 5Widowed 2 2 1
Family unit typeCouple no children 34 29 19Couple and child(ren) 37 33 27Lone parent and child(ren) 1 1 2One person only 15 18 23Adult with parents 3 5 8Adult with one parent 10 13 21
Base 2452 957 423
1 AUDIT score < 8.2 AUDIT score ≥ 8 but SAD-Q < 4.3 AUDIT score ≥ 8 and SAD-Q score 4+.

95
4
Psychiatric Morbidity among Adults living in Private Households, 2000
Characteristics of adults with psychiatric disorders
All adultsSex
Male 43 67 80Female 57 33 20
Age16-24 12 21 3025-34 19 24 2835-44 21 20 2445-54 19 18 1055-64 16 10 665-74 13 7 2
EthnicityWhite 92 97 95Black 3 1 2South Asian 3 1 1Other 2 1 2
Marital statusMarried\cohabiting 69 60 45Single 18 31 45Separated 3 2 3Divorced 6 5 6Widowed 4 2 1
Family unit typeCouple no children 33 28 20Couple and child(ren) 37 32 25Lone parent and child(ren) 6 3 4One person only 15 19 24Adult with parents 2 4 7Adult with one parent 8 13 19
Base 6464 1508 567
Table 4.10 - Continued Age, ethnicity, marital status and family unit type
by level of alcohol problem and sex
No hazardous drinking1 Hazardous drinking Alcohol dependent3
not dependent2
% % %
1 AUDIT score < 8.2 AUDIT score ≥ 8 but SAD-Q < 4.3 AUDIT score ≥ 8 and SAD-Q score 4+.

96
4
Psychiatric Morbidity among Adults living in Private Households, 2000
Characteristics of adults with psychiatric disorders
Table 4.11 Qualifications, intellectual functioning, social class and employment status
by level of alcohol problem and sex
No hazardous drinking1 Hazardous drinking Alcohol dependence3
dependence2
% % %WomenHighest qualification
Degree 12 14 13Teaching, HND, nursing 7 8 7A Level 13 15 16GCSE 37 40 42No qualifications 31 23 22
Intellectual functioning*IQ ≥ 120 8 4 3IQ 110–119 23 20 20IQ 100–109 24 27 24IQ 90–99 25 28 30IQ 80–89 15 14 19IQ < 80 6 5 4
Social ClassI 3 3 3II 28 27 24IIINM 37 37 38IIIM 8 9 10IV 18 18 19V 7 6 6Armed forces - - -
Employment statusEmployed 58 74 70Unemployed 2 2 4Economically inactive 39 24 26
Base 4012 551 144
MenHighest qualification
Degree 18 16 14Teaching, HND, nursing 7 7 7A Level 15 18 20GCSE 34 36 38No qualifications 27 23 22
Intellectual functioning*IQ ≥ 120 9 8 4IQ 110–119 25 23 19IQ 100–109 23 25 24IQ 90–99 21 23 26IQ 80–89 13 15 21IQ < 80 8 6 6
Social ClassI 8 8 5II 32 31 25IIINM 13 11 12IIIM 29 29 38IV 14 16 14V 3 5 5Armed forces 0 0 0
Employment statusEmployed 70 81 76Unemployed 3 4 6Economically inactive 27 15 18
Base 2452 957 423
1 AUDIT score < 8.2 AUDIT score ≥ 8 but SAD-Q < 4.3 AUDIT score ≥ 8 and SAD-Q score 4+.• Verbal IQ predicted from score on the National Adult Reading Test.

97
4
Psychiatric Morbidity among Adults living in Private Households, 2000
Characteristics of adults with psychiatric disorders
Table 4.11 - Continued Qualifications, intellectual functioning, social class and employment status
by level of alcohol problem and sex
No hazardous drinking1 Hazardous drinking Alcohol Dependence3
not dependentt2
% % %All adultsHighest qualifications
Degree 15 15 13Teaching, HND, nursing 7 7 7A Level 13 17 19GCSE 36 37 39No qualifications 29 23 22
Intellectual functioning*IQ ≥ 120 8 7 4IQ 110–119 24 22 19IQ 100–109 24 26 24IQ 90–99 23 25 27IQ 80–89 14 15 21IQ < 80 7 6 6
Social ClassI 5 6 5II 29 30 24IIINM 27 20 17IIIM 17 22 33IV 16 17 15V 6 6 5Armed forces 0 0 0
Employment statusEmployed 63 79 75Unemployed 3 3 6Economically inactive 34 18 19
Base 6464 1508 567
1 AUDIT score < 8.2 AUDIT score ≥ 8 but SAD-Q < 4.3 AUDIT score ≥ 8 and SAD-Q score 4+.* Verbal IQ predicted from Score on the National Adult Reading Test.
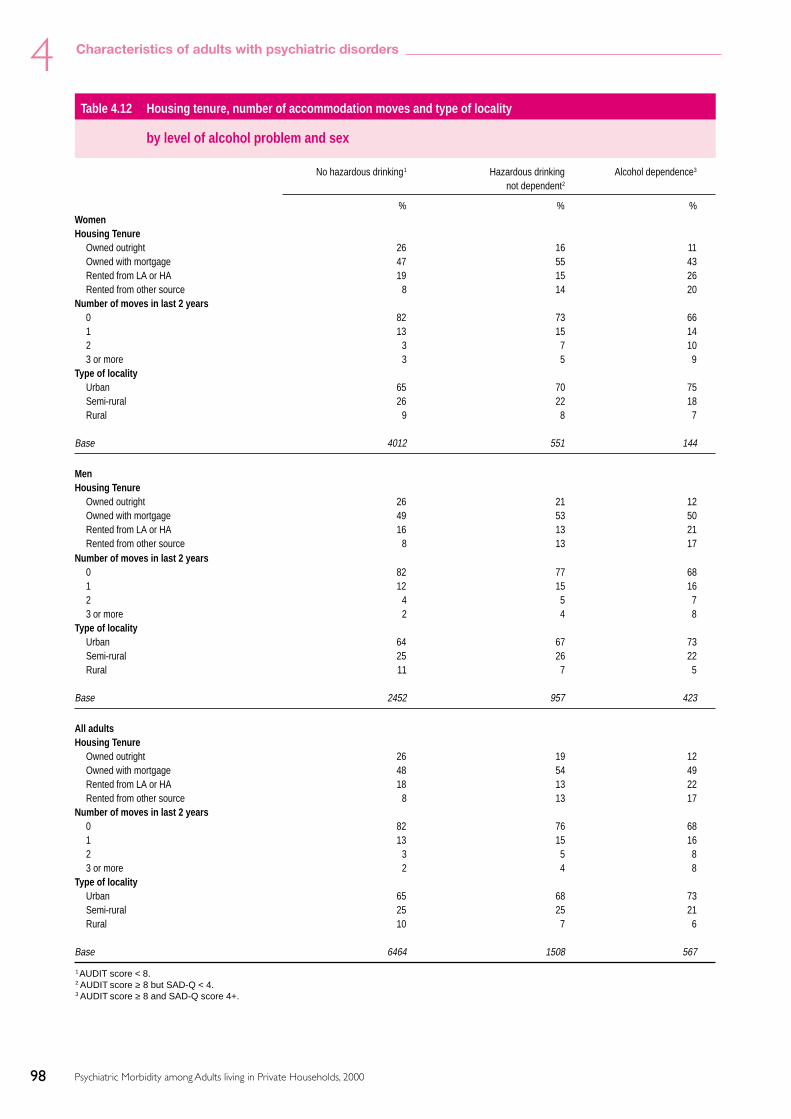
98
4
Psychiatric Morbidity among Adults living in Private Households, 2000
Characteristics of adults with psychiatric disorders
Table 4.12 Housing tenure, number of accommodation moves and type of locality
by level of alcohol problem and sex
No hazardous drinking1 Hazardous drinking Alcohol dependence3
not dependent2
% % %WomenHousing Tenure
Owned outright 26 16 11Owned with mortgage 47 55 43Rented from LA or HA 19 15 26Rented from other source 8 14 20
Number of moves in last 2 years0 82 73 661 13 15 142 3 7 103 or more 3 5 9
Type of localityUrban 65 70 75Semi-rural 26 22 18Rural 9 8 7
Base 4012 551 144
MenHousing Tenure
Owned outright 26 21 12Owned with mortgage 49 53 50Rented from LA or HA 16 13 21Rented from other source 8 13 17
Number of moves in last 2 years0 82 77 681 12 15 162 4 5 73 or more 2 4 8
Type of localityUrban 64 67 73Semi-rural 25 26 22Rural 11 7 5
Base 2452 957 423
All adultsHousing Tenure
Owned outright 26 19 12Owned with mortgage 48 54 49Rented from LA or HA 18 13 22Rented from other source 8 13 17
Number of moves in last 2 years0 82 76 681 13 15 162 3 5 83 or more 2 4 8
Type of localityUrban 65 68 73Semi-rural 25 25 21Rural 10 7 6
Base 6464 1508 567
1 AUDIT score < 8.2 AUDIT score ≥ 8 but SAD-Q < 4.3 AUDIT score ≥ 8 and SAD-Q score 4+.

99
4
Psychiatric Morbidity among Adults living in Private Households, 2000
Characteristics of adults with psychiatric disorders
Table 4.13 Prevalence of longstanding physical complaints
by level of alcohol problem and sex
No hazardous drinking1 Hazardous drinking Alcohol dependent3
not dependent2
Percentage reporting each conditionWomen
Musculo-skeletal complaints 21 15 10Respiratory system complaints 8 7 7Heart and circulatory system complaints 10 4 5Digestive system complaints 6 4 5Nervous system complaints 5 4 2Endocrine disorders 5 3 1Genito-urinary system complaints 3 2 5Skin complaints 1 1 4Ear complaints 2 2 2Eye complaints 1 1 2Neoplasms 2 1 2Blood disorders 1 0 1Infectious and parasitic diseases 0 0 -
Any longstanding physical complaint 44 37 40
Base 4011 551 144
Men
Musculo-skeletal complaints 18 15 15Respiratory system complaints 7 7 8Heart and circulatory system complaints 11 7 7Digestive system complaints 5 4 3Nervous system complaints 4 3 6Endocrine disorders 5 4 2Genito-urinary system complaints 2 1 1Skin complaints 1 2 1Ear complaints 2 1 2Eye complaints 1 1 2Neoplasms 1 1 0Blood disorders 0 0 -Infectious and parasitic diseases 0 0 0
Any physical complaint 42 37 38
Base 2449 957 423
All adults
Musculo-skeletal complaints 20 15 14Respiratory system complaints 8 7 8Heart and circulatory system complaints 10 6 7Digestive system complaints 5 4 4Nervous system complaints 5 3 5Endocrine disorders 5 4 2Genito-urinary system complaints 3 1 2Skin complaints 1 2 2Ear complaints 2 2 2Eye complaints 1 1 2Neoplasms 1 1 1Blood disorders 1 0 0Infectious and parasitic diseases 0 0 0
Any physical complaint 43 37 38
Base 6460 1508 567
1 AUDIT score <8.2 AUDIT score >8 but SAD-Q score 0-3.3 AUDIT score >8 and SAD-Q score 4+.

100
4
Psychiatric Morbidity among Adults living in Private Households, 2000
Characteristics of adults with psychiatric disorders
Table 4.14 Sex, age, ethnicity, marital status and family unit type
by drug dependence
Type of dependence
Dependent on otherDependent on drug(s) with or
No dependence cannabis only without cannabis
% % %All adultsSex
Male 49 73 69Female 51 27 31
Age16–24 14 46 5425–34 20 37 2535–44 21 10 1245–54 19 7 355–64 15 1 365–74 12 - 3
EthnicityWhite 93 93 94Black 2 2 2South Asian 3 1 1Other 2 3 3
Marital statusMarried\cohabiting 67 36 29Single 21 57 65Separated 2 1 3Divorced 6 6 2Widowed 4 - 1
Family unit typeCouple no children 31 17 17Couple and child(ren) 36 19 11Lone parent and child(ren) 5 4 4One person only 16 25 33Adult with parents 3 9 12Adult with one parent 9 26 23
Base 8283 173 85

101
4
Psychiatric Morbidity among Adults living in Private Households, 2000
Characteristics of adults with psychiatric disorders
Table 4.15 Qualifications, intellectual functioning, social class and employment status
by drug dependence
Type of dependence
Dependent on otherDependent on drug(s) with or
No dependence cannabis only without cannabis
% % %All adultsHighest qualification
Degree 15 13 4Teaching, HND, nursing 7 10 7A Level 14 20 26GCSE 36 42 42No qualifications 28 15 21
Intellectual functioning*IQ ≥ 120 8 5 1IQ 110–119 23 18 11IQ 100–109 24 26 13IQ 90–99 24 25 36IQ 80–89 15 18 26IQ < 80 6 8 13
Social ClassI 5 3 4II 29 23 19IIINM 25 20 26IIIM 19 31 19IV 16 19 18V 6 5 13Armed forces 0 - -
Employment statusEmployed 67 71 60Unemployed 3 11 10Economically inactive 30 18 29
Base 8283 173 85
* Verbal IQ predicted from score on the National Adult Reading Test.

102
4
Psychiatric Morbidity among Adults living in Private Households, 2000
Characteristics of adults with psychiatric disorders
Table 4.16 Housing tenure, number of moves and type of locality
by drug dependence
Type of dependence
Dependent on otherDependent on drug(s) with or
No dependence cannabis only without cannabis
% % %All adultsHousing tenure
Owned outright 24 8 6Owned with mortgage 50 42 33Rented from LA or HA 17 22 26Rented from other source 9 28 35
Number of moves in last 2 years0 80 65 611 13 15 112 4 8 153 and over 3 12 13
Type of localityUrban 66 77 75Semi-rural 25 16 20Rural 9 7 4
Base 8265 177 84
Table 4.17 Prevalence of longstanding physical complaints
by drug dependence
Type of dependence
No dependence Dependent on Dependent oncannabis only other drug(s) with or
without cannabis
Percentage reporting each conditionAll adults
Musculo-skeletal complaints 19 11 11Respiratory system complaints 8 10 3Heart and circulatory system complaints 9 3 2Digestive system complaints 5 3 -Nervous system complaints 4 5 4Endocrine disorders 5 1 1Genito-urinary system complaints 2 1 1Skin complaints 1 4 2Ear complaints 2 2 5Eye complaints 1 1 0Neoplasms 1 1 1Blood disorders 1 - -Infectious and parasitic diseases 0 - -
Any longstanding physical complaint 42 34 28
Base 8278 173 85
103
5Treatment and service use by people with psychiatric disorders
Psychiatric Morbidity among Adults living in Private Households, 2000
5 Treatment and service use by people withpsychiatric disorders
This chapter looks at the extent to which peoplewith and without neurotic disorders, probablepsychosis, alcohol and drug dependence had usedmedication, other forms of treatment and a rangeof health and community services. It also examinesthe extent to which help or treatment has not beenaccessed, and why.
Two types of treatment are discussed in this section– medication and therapy or counselling. Themedications considered are those mainly used inthe treatment of mental disorders (psychoactivemedication). The drugs are from the BritishNational Formulary classes of hypnotics andanxiolytics, antidepressants, and medication usedin the treatment of psychotic illness:
Antidepressants
• Tricyclic antidepressants.• Monoamine oxidase inhibitors.• Compound antidepressants.
Hypnotics and anxiolytics
• Hypnotics.• Anxiolytics.
Drugs used in psychoses etc.
• Antipsychotic drugs (including depotinjections).
• Antimanic drugs.
Other forms of treatment are for mental oremotional problems grouped into two broadcategories, therapy and counselling. These includedpsychotherapy, behavioural or cognitive therapy,art music or drama therapy, social skills training,marital or family therapy, sex therapy andcounselling.
In addition to questions about current treatment,respondents were asked about their use of services,because of mental, nervous or emotional problems,in a range of settings. People were asked aboutconsultations with a GP or family doctor on their
own behalf in the year before interview, whetherthey had had any in-patient stays during that time,attended for treatment or check-ups as an out-patient or a day-patient, whether they attended anyday activity services or received any other care inthe community. They were also asked about anyhelp for mental and emotional problems that theyhad been offered but which they had turned down.
5.1 Treatment and service use by people withneurotic disorders
5.1.1 Use of medication and other treatment.
Just under a quarter (24%) of people assessed ashaving a neurotic disorder were receiving treatmentof some kind for mental or emotional problems atthe time of interview. A fifth (20%) were takingpsychoactive medication, while 9% were havingcounselling or therapy. A small proportion, 4%,were receiving both forms of treatment. Theproportion receiving treatment rose with thenumber of neurotic disorders present. Amongpeople with no neurotic disorder, 4% werereceiving treatment, compared with just under afifth (19%) of those with one neurotic disorder,and over half (54%) of those with two or moredisorders. This trend was observed for each form oftreatment separately. Three per cent of people withno neurotic disorder were being prescribedmedication, compared with 16% of those with oneneurotic disorder and almost half, 47% of thosewith two or more disorders. Only 1% of peoplewithout neurotic disorders were receivingcounselling or therapy, compared with 6% of thosewith one disorder, and a quarter (24%) of thosewith two or more disorders. (Table 5.1)
That only 3% of people without evidence ofneurotic disorder in the past week were beingprescribed psychoactive medication suggests thatthere is little prescription of treatment to thosewithout current active symptoms. Patients whohave recovered from depression or other neuroticdisorders may be maintained on medication forsome time after their recovery to prevent relapse, so

104
5 Treatment and service use by people with psychiatric disorders
Psychiatric Morbidity among Adults living in Private Households, 2000
it might be expected that some people who did nothave a current disorder would be in receipt ofmedication, but in fact the proportion was small.
The group most likely to be receiving treatmentwere those with phobias. Over half of this group(54%) were receiving treatment in some form, withover a quarter (27%) receiving medication only,9% receiving therapy or counselling alone andalmost a fifth (18%) receiving both forms oftreatment. A similar proportion of those withdepressive episode (26%) were receivingmedication alone, while 4% were receivingcounselling or therapy only and 14% were havingboth forms of treatment. Least likely to be receivingany treatment were those with mixed anxiety anddepressive disorder. Of this group, only 16% werebeing treated, 11% by medication only, 3% bycounselling or therapy only and 2% having bothforms of treatment. (Table 5.2)
Anti-depressants were the most commonpsychoactive medication being used. They werebeing prescribed to 16% of people with a currentneurotic disorder, compared with 2% of thosewithout. Again, there was an increase in theproportion being prescribed antidepressants withthe number of disorders present. Among thosewith one disorder, 13% were taking anti-depressants, while among those with two or moredisorders, the proportion was three times as high,at 39%.
Overall, 6% of respondents with neurotic disorderwere taking hypnotics or anxiolytics, comparedwith 1% with no neurotic disorder. This type ofmedication was mostly being taken by peopleassessed as having more than one type of neuroticdisorder. Among those with one disorder, 4% weretaking medication of this kind, compared with 20%of those with two or more disorders. (Table 5.3)
Few people with neurotic disorder, 2%, were takinganti-psychotic medication, compared with virtuallyno-one without neurotic disorder. As with theother medications, the proportion rose with thenumber of neurotic disorders, from 1% of thosewith one disorder to 7% of those with two or more.
Those with neurotic disorder were much morelikely to be taking other forms medication acting
on the Central Nervous System (CNS medication)than those without. Twenty-one per cent were takingprescribed analgesics compared with 9% of thosewith no neurotic disorder, and 5% were taking otherforms of CNS medication, compared with 2% ofthose with no neurotic disorder. (Table 5.4)
Table 5.4 shows the broad types of medicationbeing used by people with different types ofdisorder. However, it should be noted that peoplecould have more than one type of neurotic disorderand, as described above, the use of medication wasmost common among people with more than onetype of disorder. Hypnotics and anxiolytics weremost commonly prescribed to those with phobias(17%), generalised anxiety disorder (14%) anddepressive episode (12%). Anti-depressants weremost commonly prescribed to those with phobias(40%), depressive episode (34%), and obsessivecompulsive disorder (30%). (Table 5.4)
Table 5.5 shows the different types of counsellingor therapy reported by respondents withdifferent disorders. It can be seen that just undera tenth (9%) of people with neurotic disorderswere receiving counselling or therapy, comparedwith 1% of those with no neurotic disorder.Most likely to be treated by this method werethose with phobias (27%), obsessive compulsivedisorder (20%) and depressive episode (17%),whilst those with mixed anxiety and depressivedisorder were least likely to be receivingcounselling or therapy (5%). The most commontypes of therapy were counselling andpsychotherapy. Four per cent of all those with aneurotic disorder were having counselling, while3% were having psychotherapy. Behavioural orcognitive therapy was being given to 1% ofpeople with neurotic disorders. Very few peoplewere being treated by other specific forms oftherapy, less than half of one per cent for each.(Table 5.5)
Those with obsessive compulsive disorder (12%)and phobias (11%) were the most likely to betreated by psychotherapy. These groups were alsothe most likely to have behavioural or cognitivetherapy, 5% of those with obsessive compulsivedisorder and 3% of those with phobias. Counsellingwere most often prescribed for people with phobias(15%), depressive episode (11%) and obsessivecompulsive disorder (10%). (Table 5.5)

105
5Treatment and service use by people with psychiatric disorders
Psychiatric Morbidity among Adults living in Private Households, 2000
5.1.2 Use of GP, in-patient and day- or out-patientservices
Respondents were asked whether they had spokento their GP in the past twelve months about ‘beinganxious or depressed or having a mental, nervousor emotional problem’. In the previous year almosttwo-fifths of those with neurotic disorders (39%)had spoken to their GP about a mental oremotional problem, compared with 6% of thosewithout a neurotic disorder. In the two weeksbefore interview, six times as many of those withneurotic disorders (6%) had spoken to their GPabout a mental or emotional problem as thosewithout disorders (1%). (Table 5.6 and 5.7)
There was a clear association between the numberof disorders and the likelihood of having spoken toa GP. In the previous year, 6% of people with noneurotic disorders had talked to a GP about anervous or emotional problem, compared withover a third (34%) of people with one disorder andover two thirds (69%) of people with two or moreproblems. Similarly, in the previous two weeks, 1%of people without neurotic disorders had spokenwith a GP about such a problem, compared with5% of those with one problem and 17% of thosewith two or more.
Most likely to have seen a GP in the last two weekswere those with phobias (19%), depressive episode(15%), panic disorder (14%) and obsessivecompulsive disorder (13%). Those with mixedanxiety and depressive disorder were the least likelyto have talked to a GP about an emotional ormental problem, only 3% had done so. (Table 5.7)
Respondents were also asked whether they hadmade a visit to an outpatients department fortreatment or a check up because of a mental oremotional problem in the last three months. Threeper cent of those with a neurotic disorder had doneso, compared with less than a half of 1% of thosewithout a disorder.
Those with one neurotic disorder were only slightlymore likely to have visited an outpatientsdepartment than those with no neurotic disorder(1% had done so). However, among those with twoor more disorders, 12% had made a visit to anoutpatients department for a mental or emotionalproblem in the previous quarter. (Table 5.6)
Those with phobias (13%) were almost twice aslikely as those with any other disorder to have visitedhospital as an outpatient for a psychiatric problem.Among those with obsessive compulsive disorderand depressive episode, 7% had made an outpatientvisit for their problems, while 6% of those withgeneralised anxiety disorder had done so. (Table 5.7)
One per cent of those with a current neuroticdisorder had had a stay as an inpatient in the previousquarter because of emotional or mental problems, notsignificantly more than those without a neuroticdisorder, of whom less than half a percent had had astay in hospital for emotional or mental problems.There were no significant differences between peoplewith different types of neurotic disorders in theproportions who had had an in-patient stay. (Tables5.6 and 5.7)
5.1.3 Use of community care services
Respondents were shown a list of community careservices and asked whether they had used any ofthe services in the last year, apart from any contactsduring in-patient or out-patient attendances or atday activity centres that they had alreadymentioned. The services were: a psychiatrist, apsychologist, a community psychiatric nurse, acommunity learning difficulty nurse, other nursingservices, a self-help or support group, a socialworker, a home help or home care worker, anoutreach worker or family support. Those who hadused community care services in the last twelvemonths were also asked which, if any, of them theyhad used in the last quarter.
Among respondents assessed as having a neuroticdisorder, 16% had used one or more of thecommunity care services in the last year, comparedwith 4% of those with no neurotic disorder. In thethree months before interview, 8% of those with aneurotic disorder had used community careservices, compared with 2% of those with noneurotic disorder. (Table 5.8)
The most frequently used services were othernursing services, used by 5% of those with aneurotic disorder in the previous twelve months,compared with 2% of those with no neuroticdisorder. Four per cent of people with a neuroticdisorder had seen a social worker, compared with1% of those with no neurotic disorder. During the

106
5 Treatment and service use by people with psychiatric disorders
Psychiatric Morbidity among Adults living in Private Households, 2000
previous quarter, 3% of those with neuroticdisorders had used other nursing services,compared with 1% of people with no disorder, and2% had used a social worker, compared with lessthan half a per cent of those with no disorder.
Three per cent of people with a neurotic disordermentioned using a psychiatrist, psychologist, homehelp or care worker in the previous twelve months,while in the last quarter the figures were 2% usinga psychiatrist and 1% each for a psychologist andhome help or home care worker.
The groups most likely to use community careservices were: those with phobias, among whom,31% had used a service in the previous twelvemonths, and 20% within the last quarter; thosewith obsessive compulsive disorder, of whom 27%had used a community care service in the pasttwelve months and 20% within the last quarter;and those with depressive episode, 28% havingused a community care service in the previoustwelve months and 16% in the past quarter. In thepast quarter, among people with phobias, 6% hadused a psychiatrist in the community, 6% a socialworker, 5% a community psychiatric nurse and4% other nursing services. For those withobsessive compulsive disorder, 7% had used apsychiatrist, 5% a community psychiatric nurse,4% a psychologist and the same proportion hadused other nursing services. For those withdepressive episodes, 5% each had used apsychiatrist, a social worker and other nursingservices. (Table 5.8)
5.1.4 Day activity services
Respondents were shown a list of day activityservices and asked whether they had used any ofthem in the past twelve months. These servicesincluded a community mental health centre, a dayactivity centre, a sheltered workshop or any otherservice. Use of such services was negligible amongthose with no neurotic disorder. Among those witha neurotic disorder, 3% had used a day activityservice in the previous twelve months and 2%within the last quarter. (Table 5.9)
The heaviest users of day activity services were thosewith phobias. In the previous twelve months, 12%had used such a service, as had 7% within the last
quarter. Nine per cent had used a communitymental health centre in the previous twelve months,and 5% in the last quarter, while 5% had used a dayactivity centre in the twelve months before interview,with 3% using a day activity centre in the previousquarter. Those with obsessive compulsive disorderalso made relatively more use of day activity servicesthan other groups, with 10% using these services inthe past twelve months and 5% in the last quarter.There was negligible use of sheltered workshops orother day services among any group.
5.1.5 Services refused
Finally, people were asked if they had ever beenoffered help from any of a list of services whichthey had turned down. Overall, only 3% ofrespondents had been offered help which they hadturned down. This was 9% among people with aneurotic disorder, and 2% of those with noneurotic disorder. The most commonly turneddown service was counselling, mentioned by halfof those who had turned down a service. No otherservice had been rejected by nearly as manypeople, but 10% had rejected help from acommunity psychiatric nurse and 9% from apsychiatrist. (Table 5.10)
5.2 Treatment and service use by people witha probable psychotic disorder
5.2.1 Use of medication and other treatment
Eighty-five per cent of those with a probablepsychotic disorder were having treatment at thetime of interview, compared with only 7% of thosewith no psychotic disorder. Over four-fifths of thisgroup (84%) were receiving medication comparedwith 6% of those without a psychotic disorder,while two-fifths (40%) were receiving counsellingor therapy. Almost all of those who were receivingcounselling or therapy were also receivingmedication – only 1% of people with a probablepsychotic disorder were having counselling ortherapy without medication. (Table 5.11)
Use of antipsychotic medication was almostentirely restricted to those assessed as having aprobable psychotic disorder. Among this group overhalf (56%) were taking antipsychotic medication,

107
5Treatment and service use by people with psychiatric disorders
Psychiatric Morbidity among Adults living in Private Households, 2000
while amongst those without psychotic disorder,prescribing of this type of medication was negligible.As well as being more likely to be receivingpsychoactive medication, people with probablepsychosis were more likely to be taking othermedication acting on the Central Nervous System(CNS) than those without psychotic disorder.Overall, 89% of those with probable psychosis werebeing prescribed one or more CNS medications,compared with 15% of those without psychosis.Over a fifth (22%) were taking hypnotics andanxiolytics, compared with 2% of those with nopsychotic disorder, and almost half (48%) weretaking antidepressants, compared with only 4% ofthose without psychosis. (Table 5.12)
As for those with neurotic disorders, the mostcommon types of therapy for those with psychoticdisorders were psychotherapy and counselling.Fifteen per cent of those judged probably psychoticwere receiving psychotherapy, while counsellingwas being received by 17%, compared with 1% ofthose without psychosis for both types oftreatment. (Table 5.13)
5.2.2 Use of GP, in-patient and day- or out-patientservices
In the year before interview, 71% of informantswho were judged to be probably psychotic hadspoken to their GP about a mental or emotionalproblem, compared with 11% of those withoutpsychosis. In the two weeks before interview, seventimes as many of those with probable psychoticdisorder (14%) had spoken to their GP about amental or emotional problem as those withoutpsychotic disorder (2%). (Table 5.14)
In the last three months, visits to an outpatientdepartment for mental or emotional problems werevery uncommon among those with no psychoticdisorder, while 28% of those with probable psychoticdisorder had made one or more such visits. Themajority of these visits had been made to apsychiatric out-patient clinic, visited by almost afifth (19%) of those with probable psychosis.Differences in the proportions reporting visits toother types of outpatient departments and forinpatient stays did not reach the level of statisticalsignificance. (Table 5.14)
5.2.3 Use of community care services
Overall, over half (51%) of those judged to have apsychotic illness had used one or more of thespecified community care services in the previoustwelve months, compared with only 6% of non-psychotic informants. Among the group judgedprobably psychotic, the most frequently usedservice was community psychiatric nursing, usedby 30% of those with a probable psychosis, but byjust over half a per cent of other respondents. Overa quarter (26%) of those with probable psychosishad seen a psychiatrist in the community,compared with 1% of those without the disorder,and 18% had seen a social worker, compared with1% of those without psychotic disorder. During theprevious quarter, almost two-fifths (38%) of thosethought to have a psychotic disorder had used oneor more community care services, compared with3% of people with no disorder. (Table 5.15)
5.2.4 Day activity services
As Table 5.16 shows, respondents with probablepsychotic disorders were also heavy users of dayactivity services. In the twelve months beforeinterview, 37% of them had used one or more dayactivity services, compared with 1% of respondentswithout psychosis, and one-fifth (21%) had doneso in the previous three months, compared anegligible number of those without psychoticdisorder. The service most likely to be used was acommunity mental health centre, used by 31% inthe previous year and 16% in the previous quarter.(Table 5.16)
5.2.5 Services refused
Of those with psychotic disorders, 7% had turneddown services which had been offered to them.This was not significantly different than forinformants with no psychotic disorder. (Table 5.17)
5.3 Treatment and service use by people withalcohol problems
When considering the use of medication andhealth and related services by people with differentlevels of drinking, the strong association between

108
5 Treatment and service use by people with psychiatric disorders
Psychiatric Morbidity among Adults living in Private Households, 2000
younger age and alcohol problems, which wasdescribed in chapter 2, needs to be borne in mind.
5.3.1 Use of medication and other treatment
Respondents whose alcohol consumptionreached levels of dependence were notsignificantly different from those whoseconsumption was at a non-hazardous level intheir use of CNS medication or other forms oftreatment. Those whose alcohol consumptionwas at a hazardous level but fell short ofdependence, however, were significantly lesslikely than either of the other two groups to useany CNS medication or any psychoactivemedication. Among those with a hazardouspattern of drinking without dependence, 3%were using psychoactive medication at the timeof interview, compared with 6% of those withless hazardous drinking patterns, and 7% ofthose showing evidence of alcohol dependence.Ten per cent of hazardous drinkers were takingany CNS medication, compared with 17% ofthose with no hazardous drinking patterns, and16% of those with dependence. There were nodifferences in the proportions of the threegroups who were receiving counselling ortherapy. (Tables 5.18 and 5.19)
5.3.2 Use of health care, community and day activityservices
People assessed as having a hazardous pattern ofdrinking were less likely to have seen their GPabout a mental or emotional problem in the pastyear or to have used community care services thanwere those assessed as alcohol dependent or whohad no alcohol problem. There was no differencesin the frequency of use of other health care, dayactivity services by people with different levels ofalcohol problem. (Tables 5.20–5.23)
5.3.3 Services refused
Alcohol dependent informants differed from othersin that they were more likely to have turned downservices that had been offered to them. Eight percent had done so, compared with 3% of each of theother two groups. (Table 5.24)
5.4 Treatment and service use by people withdrug dependence
5.4.1 Use of medication and other treatment
Although a larger proportion of those dependenton drugs other than cannabis reported receivingsome form of treatment (16%) than did thosedependent on cannabis only (9%) or notdependent on drugs (7%) the small size of thegroup reporting dependence on other drugs meansthat the difference is not statistically significant.(Table 5.25–5.27)
5.4.2 Use of health care, community and day activityservices
People with drug dependence were more likelythan those without to report having consulted theirGP in the year before interview. Among the groupwho were dependent on other drugs with orwithout cannabis 27% had seen their GP in theprevious 12 months as had 18% of thosedependent on cannabis only. Among those notdependent on drugs only 11% had done so.However, there was no difference between any ofthe groups in the proportion of people whoreported using in-patient or out-patient services(Table 5.28)
People who were assessed as dependent on otherdrugs with or without cannabis were more likelyto have used community care services than thosewho were not dependent. Within this group 17%reporting using at least one of these services in theyear before interview and 11% had used them inthe past quarter. The most commonly used ofthese services in the previous year was a socialworker, followed by a psychiatrist, a self help orsupport group, a community psychiatric nurseand other nursing services. Only 6% of thosewithout drug dependence had used anycommunity care services in the previous year and3% in the past quarter, while the equivalentfigures for those dependent on cannabis only were8% and 3%. (Table 5.29)
There were no differences related to drug dependencyin the use of day activity services. (Table 5.30)
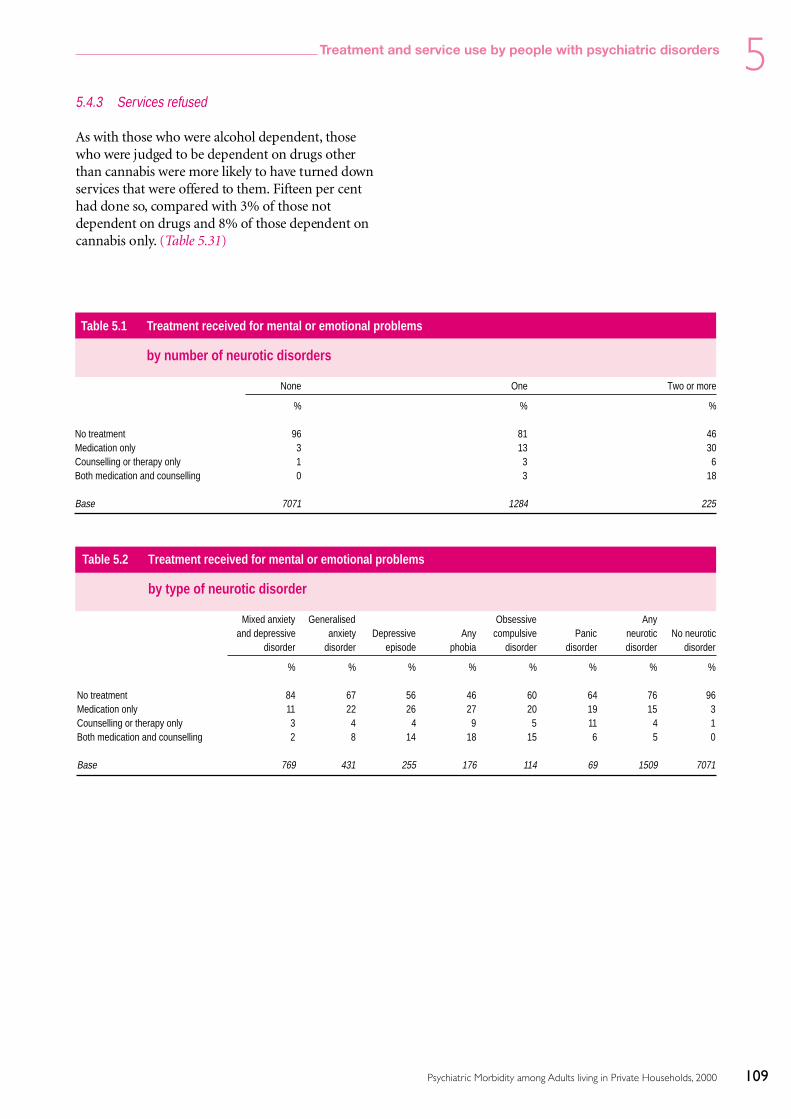
109
5Treatment and service use by people with psychiatric disorders
Psychiatric Morbidity among Adults living in Private Households, 2000
5.4.3 Services refused
As with those who were alcohol dependent, thosewho were judged to be dependent on drugs otherthan cannabis were more likely to have turned downservices that were offered to them. Fifteen per centhad done so, compared with 3% of those notdependent on drugs and 8% of those dependent oncannabis only. (Table 5.31)
Table 5.1 Treatment received for mental or emotional problems
by number of neurotic disorders
None One Two or more
% % %
No treatment 96 81 46Medication only 3 13 30Counselling or therapy only 1 3 6Both medication and counselling 0 3 18
Base 7071 1284 225
Table 5.2 Treatment received for mental or emotional problems
by type of neurotic disorder
Mixed anxiety Generalised Obsessive Anyand depressive anxiety Depressive Any compulsive Panic neurotic No neurotic
disorder disorder episode phobia disorder disorder disorder disorder
% % % % % % % %
No treatment 84 67 56 46 60 64 76 96Medication only 11 22 26 27 20 19 15 3Counselling or therapy only 3 4 4 9 5 11 4 1Both medication and counselling 2 8 14 18 15 6 5 0
Base 769 431 255 176 114 69 1509 7071
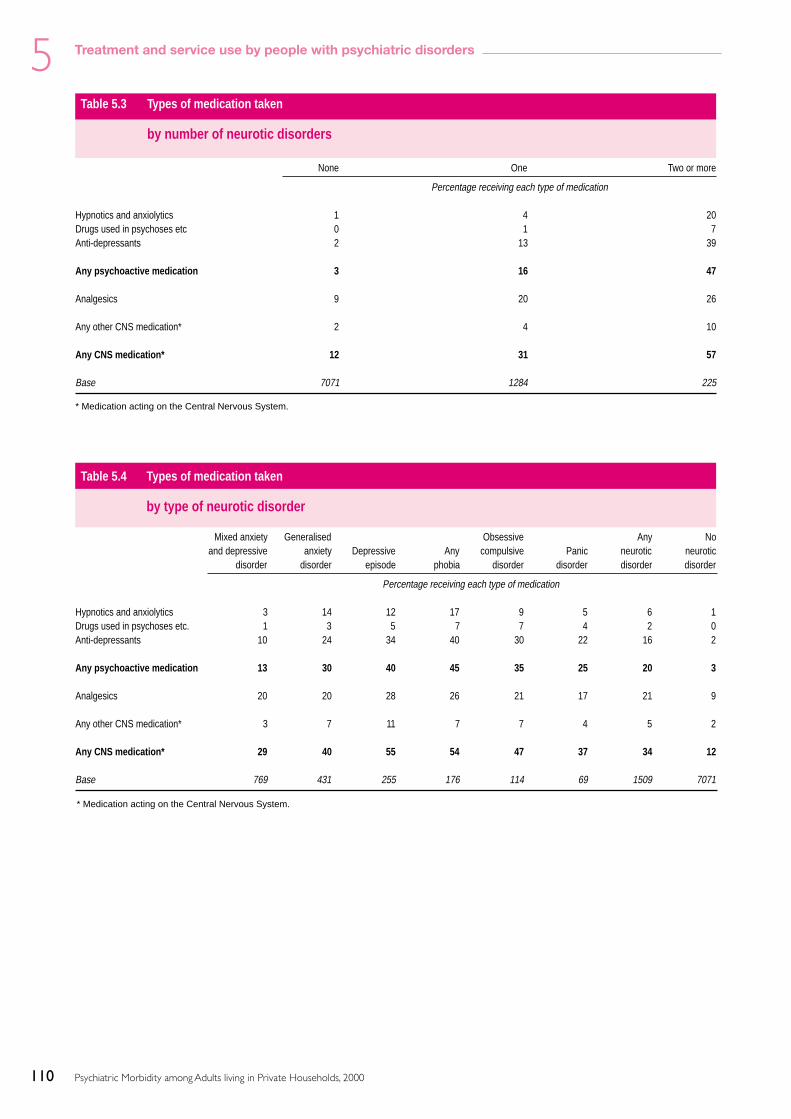
110
5 Treatment and service use by people with psychiatric disorders
Psychiatric Morbidity among Adults living in Private Households, 2000
Table 5.4 Types of medication taken
by type of neurotic disorder
Mixed anxiety Generalised Obsessive Any Noand depressive anxiety Depressive Any compulsive Panic neurotic neurotic
disorder disorder episode phobia disorder disorder disorder disorder
Percentage receiving each type of medication
Hypnotics and anxiolytics 3 14 12 17 9 5 6 1Drugs used in psychoses etc. 1 3 5 7 7 4 2 0Anti-depressants 10 24 34 40 30 22 16 2
Any psychoactive medication 13 30 40 45 35 25 20 3
Analgesics 20 20 28 26 21 17 21 9
Any other CNS medication* 3 7 11 7 7 4 5 2
Any CNS medication* 29 40 55 54 47 37 34 12
Base 769 431 255 176 114 69 1509 7071
Table 5.3 Types of medication taken
by number of neurotic disorders
None One Two or more
Percentage receiving each type of medication
Hypnotics and anxiolytics 1 4 20Drugs used in psychoses etc 0 1 7Anti-depressants 2 13 39
Any psychoactive medication 3 16 47
Analgesics 9 20 26
Any other CNS medication* 2 4 10
Any CNS medication* 12 31 57
Base 7071 1284 225
* Medication acting on the Central Nervous System.
* Medication acting on the Central Nervous System.

111
5Treatment and service use by people with psychiatric disorders
Psychiatric Morbidity among Adults living in Private Households, 2000
Table 5.5 Treatment by counselling and therapy
by type of neurotic disorder
Mixed anxiety Generalised Obsessive Any Noand depressive anxiety Depressive Any compulsive Panic neurotic neurotic
disorder disorder episode phobia disorder disorder disorder disorder
Percentage receiving each type of treatment
Psychotherapy 1 5 7 11 12 7 3 0Behaviour or cognitive therapy 0 2 2 3 5 - 1 0Art, music or drama therapy 0 1 1 1 2 - 0 0Social skills training - - 0 0 1 - 0 -Marital or family therapy 0 0 - 1 1 - 0 0Sex therapy 0 1 - - - - 0 0Counselling 2 5 11 15 10 11 4 0Other therapy 1 1 1 2 1 - 1 0
Any counselling or therapy 5 12 17 27 20 17 9 1
Base 769 431 255 176 114 69 1509 7071
Table 5.6 Health care services used for mental or emotional problems
by number of neurotic disorders
None One Two or more
Percentage reporting using each serviceInpatient stay in last quarter 0 1 1
in secure unit - - -in acute psychiatric ward - 0 0in rehab ward - 0 -in A&E department - 0 1in general ward 0 0 1in other ward - - -
Outpatient visit in last quarter 0 1 12to A&E department 0 0 0to psychiatric outpatients 0 1 7other hospital department 0 0 6other outpatient service 0 0 -
GP consultationsSpoken to GP in last year 6 34 69Spoken to GP in last two weeks 1 5 17
Base 7069 1284 225

112
5 Treatment and service use by people with psychiatric disorders
Psychiatric Morbidity among Adults living in Private Households, 2000
Table 5.7 Health care services used for mental or emotional problems
by type of neurotic disorder
Mixed anxiety Generalised Obsessive Any Noanddepressive anxiety Depressive Any compulsive Panic neurotic neurotic
disorder disorder episode phobia disorder disorder disorder disorder
Percentage reporting using each serviceInpatient stay in last quarter 1 1 1 2 1 - 1 0
in secure unit - - - - - - - -in acute psychiatric ward 0 0 - 1 1 - 0 -in rehab ward - - 1 1 - - 0 -in A&E department 0 0 1 1 1 - 0 -in general ward - 0 1 1 1 - 0 0in other ward - - - - - - - -
Outpatient visit in last quarter 1 6 7 13 7 4 3 0to A&E department 0 0 0 - 1 - 0 0to psychiatric outpatients 0 4 6 7 5 4 2 0other hospital department 0 3 2 6 2 1 1 0other outpatient service 0 - - - - - 0 0
GP consultationsSpoken to GP in last year 29 50 62 65 62 45 39 6Spoken to GP in last two weeks 3 8 15 19 13 14 6 1
Base 769 430 254 176 114 69 1508 7069
Table 5.8 Community care services used
by type of neurotic disorder
Mixed anxiety Generalised Obsessive Any Noand depressive anxiety Depressive Any compulsive Panic neurotic neurotic
disorder disorder episode phobia disorder disorder disorder disorder
Percentage using each serviceServices used in the last year
Psychiatrist 1 6 8 8 9 3 3 0Psychologist 1 3 3 7 5 - 2 0Community psychiatric nurse 1 5 7 10 9 1 3 0Community learning difficulty nurse - - - - - - - 0Other nursing services 5 5 7 8 3 5 5 2Social worker 3 5 9 9 6 4 4 1Self help/support group 2 4 3 3 3 4 3 0Home help/home care worker 1 2 3 2 2 - 1 0Outreach worker 1 2 5 4 2 1 1 0
Any community care service 12 23 28 31 27 16 16 4
Services used in the last quarterPsychiatrist 0 3 5 6 7 1 2 0Psychologist 0 1 1 2 4 - 1 0Community psychiatric nurse 0 3 2 5 5 - 1 0Community learning difficulty nurse - - - - - - - -Other nursing services 2 3 5 4 4 2 3 1Social worker 2 2 5 6 3 1 2 0Self help/support group 1 1 1 3 3 - 1 0Home help/home care worker 1 2 2 2 2 - 1 0Outreach worker 0 1 3 3 2 - 1 0
Any community care service 6 12 16 20 20 4 8 2
Base 769 431 255 176 114 69 1509 7071

113
5Treatment and service use by people with psychiatric disorders
Psychiatric Morbidity among Adults living in Private Households, 2000
Table 5.9 Day care services used
by type of neurotic disorder
Mixed anxiety Generalised Obsessive Any Noand depressive anxiety Depressive Any compulsive Panic neurotic neurotic
disorder disorder episode phobia disorder disorder disorder disorder
Percentage using each servicesServices used in the last year
Community mental health centre 1 4 5 9 7 2 2 0Day activity centre 0 2 3 5 5 3 1 0Sheltered workshop 0 - - - - - 0 0Other day service - 0 - - - - 0 -
Any day care service 1 6 7 12 10 5 3 1
Services used in the last quarterCommunity mental health centre 0 2 2 5 3 - 1 0Day activity centre 0 1 1 3 3 - 1 0Sheltered workshop 0 - - - - - 0 0Other day service - 0 - - - - 0 -
Any day care service 0 3 3 7 5 - 2 0
Base 769 431 255 176 114 69 1509 7071
Table 5.10 Services turned down
by neurotic disorder
Any neurotic disorder No neurotic disorder All adults
Percentage turning down help
Has turned down a service 9 2 3
Base 1509 7070 8579
Turned down help from:Community Psychiatric Nurse 9 3 5Social Worker 9 12 10Occupational/Industrial Therapist 7 3 5Psychiatrist 13 7 9Other nursing services 4 9 7Home help/home care worker 9 5 7Counselling service 47 53 50Other 14 15 15
Base (those turning down help) 132 139 271

114
5 Treatment and service use by people with psychiatric disorders
Psychiatric Morbidity among Adults living in Private Households, 2000
Table 5.11 Treatment received for mental or emotionalproblems
by people with and without psychoticdisorder
No psychotic Probabledisorder psychosis
% %
No treatment 93 15Medication only 5 44Counselling or therapy only 1 1Both medication and counselling 1 39
Base 8520 60
Table 5.13 Treatment by counselling and therapy
by people with and without psychoticdisorder
No psychotic Probabledisorder psychosis
Percentage receiving each type of treatment:
Psychotherapy 1 15Behaviour or cognitive therapy 0 1Art, music or drama therapy 0 4Social skills training 0 1Marital or family therapy 0 2Sex therapy 0 -Counselling 1 17Other therapy 0 8
Any counselling or therapy 2 40
Base 8520 60
Table 5.14 Health care services used for mental andemotional problems
by people with and without psychoticdisorder
No psychotic Probabledisorder Psychosis
Percentage reporting using each service
Inpatient stay in last quarter 0 6in secure unit - -in acute psychiatric ward - 4in rehabilitation ward 0 2in A&E department 0 -in general ward 0 -in other ward - -
Outpatient visit in last quarter 1 28to A&E department 0 1to psychiatric outpatients 0 19other hospital department 0 6other outpatient service 0 3
GP consultationsSpoken to GP in last year 11 71Spoken to GP in last two weeks 2 14
Base 8518 60
Table 5.12 Types of medication taken
by people with and without psychoticdisorder
No psychotic Probabledisorder psychosis
Percentage receiving each type of medication
Hypnotics and anxiolytics 2 22Drugs used in psychoses etc. 0 56Anti-depressants 4 48
Any psychoactive medication 6 84
Analgesics 11 23
Any other CNS medication* 2 32
Any CNS medication* 15 89
Base 8520 60
* Medication acting on the Central Nervous System.
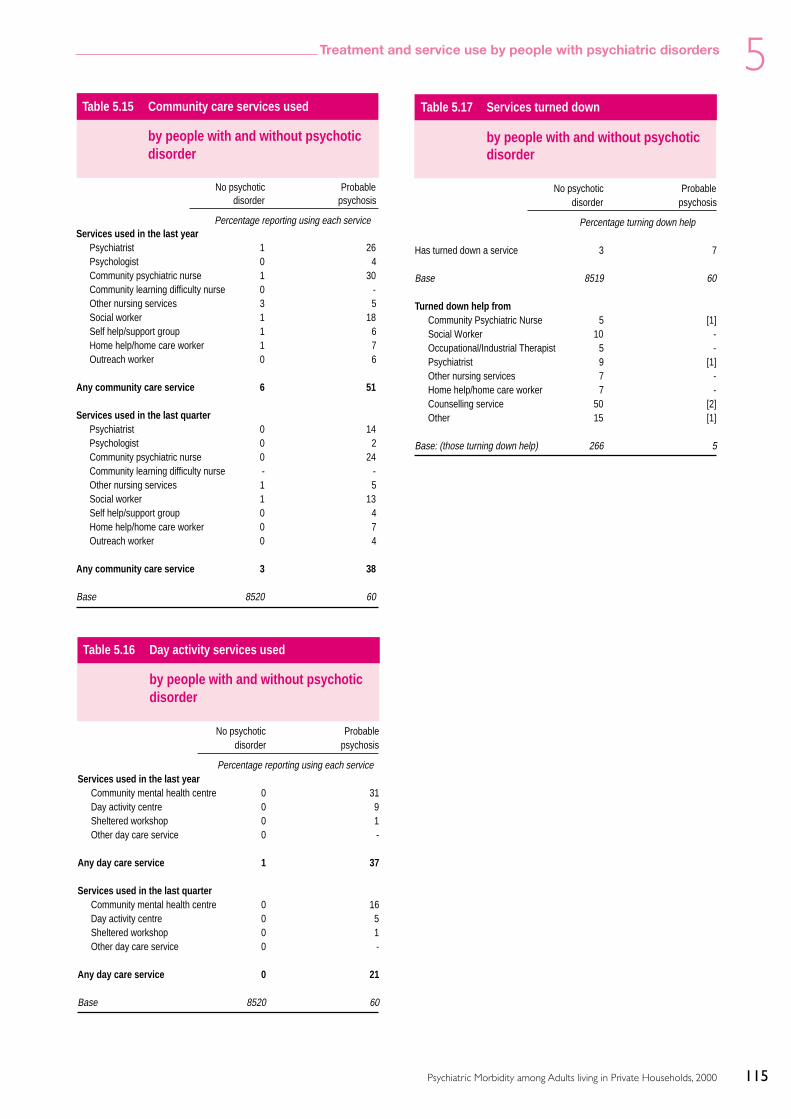
115
5Treatment and service use by people with psychiatric disorders
Psychiatric Morbidity among Adults living in Private Households, 2000
Table 5.15 Community care services used
by people with and without psychoticdisorder
No psychotic Probabledisorder psychosis
Percentage reporting using each serviceServices used in the last year
Psychiatrist 1 26Psychologist 0 4Community psychiatric nurse 1 30Community learning difficulty nurse 0 -Other nursing services 3 5Social worker 1 18Self help/support group 1 6Home help/home care worker 1 7Outreach worker 0 6
Any community care service 6 51
Services used in the last quarterPsychiatrist 0 14Psychologist 0 2Community psychiatric nurse 0 24Community learning difficulty nurse - -Other nursing services 1 5Social worker 1 13Self help/support group 0 4Home help/home care worker 0 7Outreach worker 0 4
Any community care service 3 38
Base 8520 60
Table 5.16 Day activity services used
by people with and without psychoticdisorder
No psychotic Probabledisorder psychosis
Percentage reporting using each serviceServices used in the last year
Community mental health centre 0 31Day activity centre 0 9Sheltered workshop 0 1Other day care service 0 -
Any day care service 1 37
Services used in the last quarterCommunity mental health centre 0 16Day activity centre 0 5Sheltered workshop 0 1Other day care service 0 -
Any day care service 0 21
Base 8520 60
Table 5.17 Services turned down
by people with and without psychoticdisorder
No psychotic Probabledisorder psychosis
Percentage turning down help
Has turned down a service 3 7
Base 8519 60
Turned down help fromCommunity Psychiatric Nurse 5 [1]Social Worker 10 -Occupational/Industrial Therapist 5 -Psychiatrist 9 [1]Other nursing services 7 -Home help/home care worker 7 -Counselling service 50 [2]Other 15 [1]
Base: (those turning down help) 266 5

116
5 Treatment and service use by people with psychiatric disorders
Psychiatric Morbidity among Adults living in Private Households, 2000
Table 5.18 Treatment received for mental or emotional problems
by level of alcohol problem
No hazardous Hazardous drinking Alcoholdrinking1 not dependent2 dependent3
% % %
No treatment 92 96 90Medication only 5 3 6Counselling or therapy only 1 1 2Both medication and counselling 1 1 2
Base 6464 1508 567
1 AUDIT score <8.2 AUDIT score >8 but SAD-Q score 0–3.3 AUDIT score >8 and SAD-Q score 4+.
Table 5.19 Types of medication taken
by level of alcohol problem
No hazardous Hazardous drinking Alcoholdrinking1 not dependent2 dependent3
Percentage receiving each type of medication
Hypnotics and anxiolytics 2 1 3Drugs used in psychoses etc. 1 0 0Anti-depressants 5 3 6
Any psychoactive medication 6 3 7
Analgesics 12 7 10
Any other CNS medication* 2 1 4
Any CNS medication* 17 10 16
Base 6464 1508 567
1 AUDIT score <8.2 AUDIT score >8 but SAD-Q score 0–3.3 AUDIT score >8 and SAD-Q score 4+.* Medication acting on the Central Nervous System.
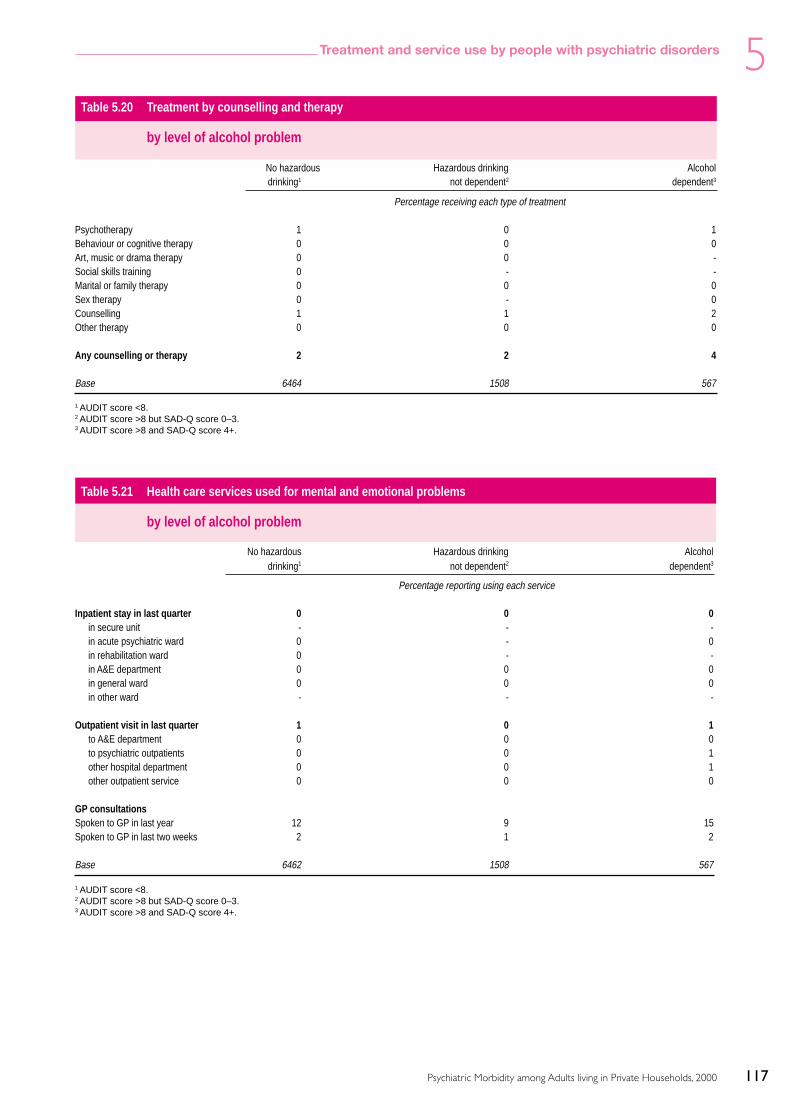
117
5Treatment and service use by people with psychiatric disorders
Psychiatric Morbidity among Adults living in Private Households, 2000
Table 5.20 Treatment by counselling and therapy
by level of alcohol problem
No hazardous Hazardous drinking Alcoholdrinking1 not dependent2 dependent3
Percentage receiving each type of treatment
Psychotherapy 1 0 1Behaviour or cognitive therapy 0 0 0Art, music or drama therapy 0 0 -Social skills training 0 - -Marital or family therapy 0 0 0Sex therapy 0 - 0Counselling 1 1 2Other therapy 0 0 0
Any counselling or therapy 2 2 4
Base 6464 1508 567
1 AUDIT score <8.2 AUDIT score >8 but SAD-Q score 0–3.3 AUDIT score >8 and SAD-Q score 4+.
Table 5.21 Health care services used for mental and emotional problems
by level of alcohol problem
No hazardous Hazardous drinking Alcoholdrinking1 not dependent2 dependent3
Percentage reporting using each service
Inpatient stay in last quarter 0 0 0in secure unit - - -in acute psychiatric ward 0 - 0in rehabilitation ward 0 - -in A&E department 0 0 0in general ward 0 0 0in other ward - - -
Outpatient visit in last quarter 1 0 1to A&E department 0 0 0to psychiatric outpatients 0 0 1other hospital department 0 0 1other outpatient service 0 0 0
GP consultationsSpoken to GP in last year 12 9 15Spoken to GP in last two weeks 2 1 2
Base 6462 1508 567
1 AUDIT score <8.2 AUDIT score >8 but SAD-Q score 0–3.3 AUDIT score >8 and SAD-Q score 4+.

118
5 Treatment and service use by people with psychiatric disorders
Psychiatric Morbidity among Adults living in Private Households, 2000
Table 5.22 Community care services used
by level alcohol problem
No hazardous Hazardous drinking Alcoholdrinking1 not dependent2 dependent3
Percentage reporting using each serviceServices used in the last year
Psychiatrist 1 1 2Psychologist 0 0 2Community psychiatric nurse 1 0 2Community learning difficulty nurse 0 - -Other nursing services 3 2 2Social worker 1 1 3Self help/support group 1 0 1Home help/home care worker 1 0 0Outreach worker 0 0 0
Any community care service 7 4 8
Services used in the last quarterPsychiatrist 0 0 1Psychologist 0 0 1Community psychiatric nurse 0 0 1Community learning difficulty nurse - - -Other nursing services 1 1 1Social worker 1 0 2Self help/support group 0 0 1Home help/home care worker 1 0 0Outreach worker 0 0 0
Any community care service 3 2 5
Base 6464 1508 567
1 AUDIT score <8.2 AUDIT score >8 but SAD-Q score 0–3.3 AUDIT score >8 and SAD-Q score 4+.

119
5Treatment and service use by people with psychiatric disorders
Psychiatric Morbidity among Adults living in Private Households, 2000
Table 5.23 Day activity services used
by level of alcohol problem
No hazardous Hazardous drinking Alcoholdrinking1 not dependent2 dependent3
Percentage reporting using each serviceServices used in the last year
Community mental health centre 1 0 1Day activity centre 0 0 1Sheltered workshop 0 0 -Other day service 0 - -
Any day care service 1 1 2
Services used in the last quarterCommunity mental health centre 0 0 1Day activity centre 0 0 0Sheltered workshop - 0 -Other day service 0 - -
Any day care service 0 0 1
Base 6464 1508 567
1 AUDIT score <8.2 AUDIT score >8 but SAD-Q score 0–3.3 AUDIT score >8 and SAD-Q score 4+.
Table 5.24 Services turned down
by level of alcohol problem
No hazardous Hazardous drinking Alcoholdrinking1 not dependent2 dependent3
Percentage turning down help
Has turned down a service 3 3 8
Base 6463 1508 567
Turned down help fromCommunity Psychiatric Nurse 8 1 2Social Worker 9 8 17Occupational/Industrial Therapist 5 11 -Psychiatrist 9 1 18Other nursing services 4 13 10Home help/home care worker 8 3 8Counselling service 51 58 42Other 17 6 17
Base: (those turning down help) 180 38 49
1 AUDIT score <8.2 AUDIT score >8 but SAD-Q score 0–3.3 AUDIT score >8 and SAD-Q score 4+.

120
5 Treatment and service use by people with psychiatric disorders
Psychiatric Morbidity among Adults living in Private Households, 2000
Table 5.26 Types of medication taken
by drug dependence
Type of dependence
No dependence Cannabis only Other drug(s) withor without cannabis
Percentage receiving each type of medication
Hypnotics and anxiolytics 2 2 7Drugs used in psychoses etc. 1 1 1Anti-depressants 4 8 6
Any psychactive medication 6 9 10
Analgesics 11 6 9
Any other CNS medication* 2 1 4
Any CNS medication* 16 13 17
Base 8283 173 85
Table 5.25 Treatment received for mental or emotional problems
by drug dependence
Type of dependence
No dependence Cannabis only Other drug(s) withor without cannabis
% % %
No treatment 93 91 84Medication only 5 5 9Counselling or therapy only 1 0 5Both medication and counselling 1 4 1
Base 8283 173 85
* Medication acting on the Central Nervous System.

121
5Treatment and service use by people with psychiatric disorders
Psychiatric Morbidity among Adults living in Private Households, 2000
Table 5.28 Health care services used for mental or emotional problems
by drug dependence
Type of dependence
No dependence Cannabis only Other drug(s) withor without cannabis
Percentage reporting using each service
Inpatient stay in last quarter 0 - 1in secure unit - - -in acute psychiatric ward 0 - -in rehabilitation ward 0 - -in A&E department 0 - 1in general ward 0 - 1in other ward - - -
Outpatient visit in last quarter 1 0 1to A&E department 0 - -to psychiatric outpatients 0 - 1other hospital department 0 0 1other outpatient service 0 - -
GP consultationsSpoken to GP in last year 11 18 27Spoken to GP in last two weeks 1 3 7
Base 8281 173 85
Table 5.27 Treatment by counselling and therapy
by drug dependence
Type of dependence
No dependence Cannabis only Other drug(s) withor without cannabis
Percentage receiving each type of treatment
Psychotherapy 1 2 1Behaviour or cognitive therapy 0 - -Art, music or drama therapy 0 0 -Social skills training 0 - -Marital or family therapy 0 - -Sex therapy 0 - 2Counselling 1 2 4Other therapy 0 - 1
Any counselling or therapy 2 4 7
Base 8283 173 85

122
5 Treatment and service use by people with psychiatric disorders
Psychiatric Morbidity among Adults living in Private Households, 2000
Table 5.29 Community care services used
by drug dependence
Type of dependence
No dependence Cannabis only Other drug(s) withor without cannabis
Percentage reporting using each serviceServices used in the last year
Psychiatrist 1 2 5Psychologist 0 1 2Community psychiatric nurse 1 3 4Community learning difficulty nurse 0 - -Other nursing services 3 0 4Social worker 1 3 6Self help/support group 1 1 4Home help/home care worker 1 0 1Outreach worker 0 1 1
Any community care service 6 8 17
Services used in the last quarterPsychiatrist 0 1 3Psychologist 0 1 1Community psychiatric nurse 0 1 1Community learning difficulty nurse - - -Other nursing services 1 0 1Social worker 1 2 5Self help/support group 0 - 4Home help/home care worker 0 0 1Outreach worker 0 1 1
Any community care service 3 3 11
Base 8283 173 85

123
5Treatment and service use by people with psychiatric disorders
Psychiatric Morbidity among Adults living in Private Households, 2000
Table 5.30 Day care services used
by drug dependence
Type of dependence
No dependence Cannabis only Other drug(s) withor without cannabis
Percentage reporting using each serviceServices used in the last year
Community mental health centre 1 2 2Day activity centre 0 0 1Sheltered workshop 0 - -Other day service 0 - -
Any day care service 1 3 3
Services used in the last quarterCommunity mental health centre 0 1 1Day activity centre 0 - 0Sheltered workshop 0 - -Other day service 0 - -
Any day care service 0 1 1
Base 8283 173 85
Table 5.31 Services turned down
by drug dependence
Type of dependence
No dependence Cannabis only Other drug(s) withor without cannabis
Percentage turning down help
Has turned down a service 3 8 15
Base 8282 173 85
Turned down help fromCommunity Psychiatric Nurse 6 - [1]Social Worker 10 - [4]Occupational/Industrial Therapist 5 - [1]Psychiatrist 9 [2] [3]Other nursing services 6 [1] [1]Home help/home care worker 8 - -Counselling service 50 [9] [8]Other 15 [3] [2]
Base: (those turning down help) 236 15 16

124 Psychiatric Morbidity among Adults living in Private Households, 2000
Appendix A Statistical terms and their interpretation

125Psychiatric Morbidity among Adults living in Private Households, 2000
Appendix A Statistical terms and their interpretation
Statistical terms and their interpretation
A1 Confidence intervals
The percentages and means quoted in the text ofthis report represent summary information about avariable (eg CIS-R score) based on the sample ofpeople interviewed in this study. However,extrapolation from these sample statistics isrequired in order to make inferences aboutdistribution of that particular variable in thepopulation. This is done by calculating confidenceintervals around the statistic in question. Theseconfidence intervals indicate the range withinwhich the ‘true’ (or population) percentage is likelyto lie. Where 95% confidence intervals arecalculated, this simply indicates that one is ‘95%confident’ that the population percentage lieswithin this range. (More accurately, it indicatesthat, if repeated samples were drawn from thepopulation, the percentage would lie within thisrange in 95% of the samples.)
Confidence intervals are calculated on the basis ofthe sampling error (see below). The upper 95%confidence intervals are calculated by adding thesampling error (SE) multiplied by 1.96 to thesample percentage or mean. The lower confidenceinterval is derived by subtracting the same value.99% confidence intervals can also be calculated, byreplacing the value 1.96 by the value 2.58.
A2 Sampling errors
The sampling error is a measure of the degree towhich a percentage (or other summary statistic)would vary if repeatedly calculated in a series ofsamples. It is used in the calculation of confidenceintervals and statistical significance tests. In thissurvey simple random sampling did not take place,a multi-stage stratified sampling design was used.In addition, the data was weighted firstly to takeaccount of differing selection probabilities and,secondly, to compensate for non-response usingpost-stratification. To take account of the complexsample design and weighting procedures used inthis survey, sampling errors were calculated usingSTATA and the sampling errors associated with keyprevalence estimates in Chapter 2 are shown in
Tables A.1 to A.11 below. However, this does notaffect the interpretation of the sampling errors ortheir use in the calculation of confidence intervals.
The effect of a complex sampling design on theprecision of survey estimates is usually quantifiedby means of the design factor (deft). For any surveyestimate, the deft is calculated as the ratio of thestandard error allowing for the full complexity ofthe survey design to the standard error assuming asimple random sample. The standard error basedon a simple random sample multiplied by the deftgives the standard error of a complex design.
se(p) = deft x se(p)sys
where:
p(1 - p)se(p)sys = N
The formula to measure whether the differencesbetween the percentages is likely to be due entirelyto sampling error for a complex design is:
deft1
2* p1(100 - p
1)
+ deft
22* p
2(100 - p
2)
se(p1-p
2) =
n1
n2
where p1 and p
2 are observed percentages for the two
sub-samples and n1 and n2 are the sub-sample sizes.The 95% confidence interval for the differencebetween two percentages is then given by;
(p1-p
2) +/- 1.96 x se(p
1-p
2)
If this confidence interval includes zero then theobserved difference is considered to be a result ofchance variation in the sample. If the interval doesnot include zero then it is unlikely (less than 5%probability) that the observed differences couldhave occurred by chance. The standard errors ofsurvey measures which are not presented in thefollowing tables for sample subgroups may beestimated by applying an appropriate value of deftto the sampling error. The choice of an appropriatevalue of deft will vary according to whether thebasic survey measure is included in the tables. Since
AppendixA
126 Psychiatric Morbidity among Adults living in Private Households, 2000
Appendix A Statistical terms and their interpretation
most deft values are relatively small (1.1 or less) theabsolute effect of adjusting sampling errors to takeaccount of the survey’s complex design will be small.In most cases it will result in an increase of less than10% over the standard error assuming simple randomsampling. However, for some regional estimates thedeft is greater and caution should be exercised whenconsidering the significance of apparent differencesbetween regions. Whether it is considered necessary touse deft or to use the basic estimates of standarderrors assuming a simple random sample is a matterof judgement and depends chiefly on how the surveyresults will be used.
Sampling errors have been calculated for otherestimates and have been used to test thestatistical significance of differences for this
report. In general only statistically significantdifferences are commented on in the reportunless specifically stated otherwise. Tables ofadditional sampling errors can be found in theTechnical Report of the survey.
A3 Significance
It is stated in the text of the report that somedifferences are ‘significant’. This indicates that it isunlikely that a difference of this magnitude wouldbe found due to chance alone. Specifically, thelikelihood that the difference would occur simplyby chance is less than 5%. This is conventionallyassumed to be in frequent enough to discountchance as an explanation for the finding.

127Psychiatric Morbidity among Adults living in Private Households, 2000
Appendix A Statistical terms and their interpretation
Table A.1 Standard errors and 95% confidence intervals for prevalence of CIS-R symptoms by sex
Base Characteristic % (p) (adj) Sample size True standard Deft 95% confidence intervalerror of p LL UL
All adults Fatigue 27.31 8580 0.67 1.38 26.01 28.62Sleep Problems 28.92 8580 0.61 1.25 27.73 30.12Irritability 20.12 8580 0.54 1.26 19.06 21.19Worry 19.04 8580 0.52 1.23 18.02 20.06Depression 10.97 8580 0.41 1.23 10.15 11.78Depressive ideas 9.47 8580 0.38 1.19 1.19 1.19Anxiety 8.57 8580 0.36 1.19 7.86 9.27Obsessions 5.59 8580 0.28 1.14 5.03 6.15Concentration and forgetfulness 9.79 8580 0.41 1.27 8.99 10.59Somatic symptoms 6.87 8580 0.30 1.09 6.28 7.45Compulsions 3.02 8580 0.20 1.08 2.63 3.41Phobia 4.68 8580 0.25 1.10 4.18 5.17Worry–Physical health 6.97 8580 0.30 1.07 6.39 7.55Panic 1.98 8580 0.16 1.06 1.67 2.30
Women Fatigue 32.11 4728 0.93 1.37 30.29 33.92Sleep Problems 34.20 4728 0.80 1.15 32.64 35.76Irritability 22.21 4728 0.70 1.16 20.83 23.58Worry 21.42 4728 0.78 1.31 19.89 22.96Depression 11.64 4728 0.59 1.27 10.47 12.80Depressive ideas 11.07 4728 0.54 1.19 10.01 12.14Anxiety 9.29 4728 0.46 1.09 8.39 10.19Obsessions 6.96 4728 0.43 1.18 6.10 7.81Concentration and forgetfulness 10.65 4728 0.55 1.23 9.57 11.73Somatic symptoms 8.29 4728 0.42 1.06 7.46 9.12Compulsions 3.62 4728 0.29 1.08 3.04 4.20Phobia 5.88 4728 0.36 1.06 5.17 6.59Worry–Physical health 7.30 4728 0.40 1.06 6.51 8.09Panic 2.04 4728 0.20 0.99 1.64 2.44
Men Fatigue 22.50 3852 0.74 1.10 21.05 23.96Sleep Problems 23.63 3852 0.79 1.15 22.09 25.18Irritability 18.04 3852 0.75 1.21 16.57 19.51Worry 16.65 3852 0.62 1.03 15.44 17.87Depression 10.29 3852 0.56 1.13 9.20 11.38Depressive ideas 7.86 3852 0.51 1.17 6.86 8.85Anxiety 7.85 3852 0.46 1.07 6.95 8.76Obsessions 4.22 3852 0.34 1.04 3.56 4.88Concentration and forgetfulness 8.93 3852 0.56 1.21 7.84 10.02Somatic symptoms 5.44 3852 0.41 1.12 4.63 6.24Compulsions 2.42 3852 0.24 0.98 1.94 2.89Phobia 3.47 3852 0.30 1.03 2.87 4.07Worry–Physical health 6.64 3852 0.42 1.05 5.81 7.47Panic 1.93 3852 0.24 1.08 1.46 2.40

128 Psychiatric Morbidity among Adults living in Private Households, 2000
Appendix A Statistical terms and their interpretation
Table A.2 Standard errors and 95% confidence intervals for prevalence of CIS-R symptoms by age
Base Characteristic % (p) (adj) Sample size True standard Deft 95% confidence interval error of p LL UL
16- to 19-year-olds Fatigue 24.04 334 2.31 0.99 19.50 28.57Sleep Problems 28.99 334 2.47 0.99 24.15 33.83Irritability 23.79 334 2.39 1.03 19.10 28.49Worry 18.86 334 2.19 1.02 14.57 23.15Depression 11.98 334 1.77 0.99 8.52 15.44Depressive ideas 12.74 334 1.78 0.97 9.25 16.23Anxiety 6.60 334 1.33 0.97 4.00 9.20Obsessions 5.91 334 1.26 0.97 3.45 8.38Concentration and forgetfulness 7.95 334 1.43 0.96 5.16 10.75Somatic symptoms 3.46 334 1.11 1.11 1.28 5.65Compulsions 4.07 334 1.13 1.04 1.86 6.27Phobias 6.39 334 1.31 0.98 3.82 8.95Worry–Physical health 5.85 334 1.30 1.01 3.31 8.40Panic 2.14 334 0.78 0.98 0.61 3.67
20- to 24-year-olds Fatigue 23.63 460 2.30 1.16 19.12 28.15Sleep Problems 28.03 460 2.00 0.95 24.11 31.96Irritability 23.22 460 2.17 1.10 18.98 27.47Worry 19.95 460 2.02 1.08 16.00 23.91Depression 9.58 460 1.47 1.07 6.69 12.47Depressive ideas 9.71 460 1.36 0.98 7.05 12.36Anxiety 6.17 460 1.08 0.96 4.05 8.29Obsessions 6.56 460 1.16 1.01 4.28 8.84Concentration and forgetfulness 8.36 460 1.43 1.11 5.56 11.16Somatic symptoms 5.42 460 1.04 0.98 3.39 7.46Compulsions 3.68 460 0.76 0.87 2.18 5.17Phobias 6.07 460 1.28 1.14 3.57 8.58Worry–Physical health 6.21 460 1.20 1.06 3.86 8.56Panic 0.89 460 0.39 0.90 0.12 1.66
25- to 29-year-olds Fatigue 29.64 730 1.76 1.04 26.19 33.08Sleep Problems 29.23 730 1.88 1.12 25.54 32.92Irritability 25.28 730 1.65 1.03 22.04 28.52Worry 22.05 730 1.63 1.06 18.86 25.24Depression 11.06 730 1.18 1.01 8.75 13.37Depressive ideas 11.01 730 1.29 1.11 8.48 13.53Anxiety 9.03 730 1.08 1.01 6.92 11.14Obsessions 7.47 730 1.11 1.14 5.29 9.65Concentration and forgetfulness 9.26 730 1.14 1.06 7.02 11.50Somatic symptoms 7.13 730 0.96 1.01 5.25 9.01Compulsions 3.17 730 0.67 1.03 1.87 4.48Phobias 5.12 730 0.75 0.92 3.65 6.59Worry–Physical health 5.50 730 0.84 1.00 3.85 7.15Panic 1.94 730 0.46 0.91 1.03 2.85
30- to 34-year-olds Fatigue 28.08 953 1.68 1.15 24.79 31.37Sleep Problems 26.32 953 1.49 1.05 23.40 29.25Irritability 23.83 953 1.43 1.04 21.02 26.64Worry 21.45 953 1.48 1.11 18.55 24.35Depression 10.87 953 1.05 1.04 8.82 12.92Depressive ideas 9.99 953 1.04 1.07 7.95 12.03Anxiety 9.28 953 0.99 1.05 7.34 11.21Obsessions 6.12 953 0.79 1.02 4.57 7.67Concentration and forgetfulness 11.27 953 1.09 1.07 9.13 13.42Somatic symptoms 7.20 953 0.93 1.11 5.38 9.03Compulsions 3.89 953 0.60 0.96 2.71 5.07Phobias 5.40 953 0.82 1.12 3.80 7.00Worry–Physical health 6.40 953 0.87 1.09 4.70 8.10Panic 2.25 953 0.59 1.23 1.09 3.41

129Psychiatric Morbidity among Adults living in Private Households, 2000
Appendix A Statistical terms and their interpretation
35- to 39-year-olds Fatigue 28.66 1006 1.56 1.10 25.60 31.73Sleep Problems 28.13 1006 1.47 1.03 25.26 31.01Irritability 25.37 1006 1.53 1.11 22.38 28.36Worry 20.84 1006 1.37 1.07 18.16 23.53Depression 12.65 1006 1.26 1.20 10.19 15.12Depressive ideas 11.24 1006 1.04 1.05 9.20 13.29Anxiety 8.50 1006 0.87 0.99 6.79 10.21Obsessions 6.48 1006 0.74 0.96 5.02 7.94Concentration and forgetfulness 10.57 1006 1.06 1.10 8.49 12.66Somatic symptoms 7.86 1006 0.90 1.06 6.09 9.62Compulsions 3.09 1006 0.53 0.97 2.05 4.13Phobias 5.39 1006 0.67 0.94 4.08 6.70Worry–Physical health 6.28 1006 0.82 1.07 4.67 7.88Panic 2.17 1006 0.47 1.02 1.25 3.08
40- to 44-year-olds Fatigue 30.53 842 1.69 1.06 27.22 33.84Sleep Problems 29.16 842 1.76 1.12 25.71 32.60Irritability 22.30 842 1.59 1.11 19.18 25.41Worry 21.66 842 1.55 1.09 18.63 24.69Depression 13.73 842 1.29 1.09 11.20 16.26Depressive ideas 11.25 842 1.14 1.05 9.02 13.49Anxiety 10.94 842 1.22 1.13 8.55 13.33Obsessions 5.99 842 0.91 1.11 4.21 7.77Concentration and forgetfulness 11.36 842 1.11 1.02 9.17 13.54Somatic symptoms 8.98 842 1.01 1.03 6.99 10.97Compulsions 3.13 842 0.64 1.06 1.89 4.38Phobias 4.99 842 0.70 0.93 3.61 6.36Worry–Physical health 8.12 842 1.00 1.06 6.17 10.08Panic 2.77 842 0.59 1.04 1.62 3.92
45- to 49-year-olds Fatigue 29.11 723 1.76 1.04 25.66 32.56Sleep Problems 31.42 723 1.75 1.01 28.00 34.84Irritability 21.03 723 1.65 1.09 17.79 24.27Worry 21.34 723 1.77 1.16 17.88 24.81Depression 12.27 723 1.41 1.15 9.51 15.04Depressive ideas 9.48 723 1.22 1.12 7.10 11.86Anxiety 10.69 723 1.21 1.05 8.32 13.06Obsessions 5.76 723 1.01 1.16 3.79 7.74Concentration and forgetfulness 10.61 723 1.32 1.15 8.03 13.19Somatic symptoms 9.90 723 1.31 1.18 7.34 12.46Compulsions 2.14 723 0.54 1.01 1.07 3.20Phobias 3.85 723 0.75 1.04 2.39 5.31Worry–Physical health 7.49 723 1.08 1.10 5.37 9.62Panic 3.11 723 0.70 1.08 1.74 4.47
50- to 54-year-olds Fatigue 31.70 822 1.85 1.14 28.07 35.33Sleep Problems 29.26 822 1.74 1.10 25.84 32.68Irritability 19.80 822 1.44 1.04 16.98 22.63Worry 21.80 822 1.58 1.09 18.71 24.88Depression 11.02 822 1.07 0.98 8.93 13.11Depressive ideas 10.17 822 1.03 0.98 8.14 12.20Anxiety 12.09 822 1.18 1.04 9.77 14.40Obsessions 4.32 822 0.79 1.12 2.77 5.88Concentration and forgetfulness 13.49 822 1.40 1.17 10.75 16.23Somatic symptoms 8.38 822 0.97 1.00 6.48 10.27Compulsions 2.68 822 0.52 0.92 1.66 3.69Phobias 5.66 822 0.91 1.13 3.88 7.44Worry–Physical health 8.46 822 1.06 1.09 6.39 10.53Panic 1.95 822 0.46 0.95 1.06 2.84
Table A.2 - continued Standard errors and 95% confidence intervals for prevalence of CIS-R symptoms by age
Base Characteristic % (p) (adj) Sample size True standard Deft 95% confidence interval error of p LL UL

130 Psychiatric Morbidity among Adults living in Private Households, 2000
Appendix A Statistical terms and their interpretation
Table A.2 - continued Standard errors and 95% confidence intervals for prevalence of CIS-R symptoms by age
Base Characteristic % (p) (adj) Sample size True standard Deft 95% confidence interval error of p LL UL
55- to 59-year-olds Fatigue 26.75 703 1.79 1.07 23.25 30.25Sleep Problems 31.61 703 1.69 0.96 28.31 34.92Irritability 16.32 703 1.46 1.05 13.46 19.18Worry 16.26 703 1.54 1.10 13.24 19.27Depression 10.45 703 1.10 0.96 8.29 12.62Depressive ideas 8.59 703 1.18 1.11 6.28 10.90Anxiety 8.77 703 1.19 1.11 6.44 11.09Obsessions 4.10 703 0.81 1.08 2.51 5.68Concentration and forgetfulness 9.17 703 1.12 1.03 6.97 11.37Somatic symptoms 6.39 703 0.93 1.01 4.56 8.22Compulsions 2.92 703 0.65 1.03 1.64 4.19Phobias 3.44 703 0.71 1.04 2.04 4.83Worry–Physical health 8.16 703 1.09 1.05 6.03 10.30Panic 2.42 703 0.53 0.91 1.39 3.45
60- to 64-year-olds Fatigue 25.61 739 1.61 1.00 22.45 28.77Sleep Problems 29.28 739 1.81 1.08 25.73 32.83Irritability 13.31 739 1.27 1.02 10.82 15.80Worry 15.52 739 1.32 0.99 12.92 18.11Depression 10.22 739 1.04 0.93 8.18 12.26Depressive ideas 7.41 739 0.87 0.90 5.71 9.11Anxiety 7.22 739 0.98 1.03 5.29 9.15Obsessions 5.38 739 0.82 0.99 3.77 7.00Concentration and forgetfulness 8.74 739 1.15 1.10 6.49 10.99Somatic symptoms 5.85 739 0.98 1.13 3.93 7.77Compulsions 2.83 739 0.66 1.07 1.54 4.11Phobias 2.76 739 0.60 0.99 1.59 3.93Worry–Physical health 8.38 739 0.98 0.96 6.45 10.30Panic 1.38 739 0.42 0.98 3.96 7.43
65- to 69-year-olds Fatigue 21.26 668 1.61 1.02 18.11 24.42Sleep Problems 28.18 668 1.91 1.09 24.44 31.92Irritability 8.38 668 1.18 1.10 6.07 10.68Worry 10.22 668 1.17 1.00 7.93 12.51Depression 8.30 668 1.14 1.06 6.08 10.53Depressive ideas 3.30 668 0.74 1.07 1.84 4.75Anxiety 4.48 668 0.81 1.02 2.88 6.07Obsessions 3.04 668 0.73 1.10 1.60 4.48Concentration and forgetfulness 6.15 668 1.04 1.12 4.11 8.18Somatic symptoms 4.06 668 0.78 1.02 2.52 5.59Compulsions 1.73 668 0.56 1.12 0.63 2.83Phobias 2.46 668 0.66 1.10 1.17 3.75Worry–Physical health 5.70 668 0.89 0.99 3.96 7.43Panic 0.79 668 0.32 0.92 0.17 1.42
70- to 74-year-olds Fatigue 21.81 600 1.93 1.15 18.02 25.60Sleep Problems 28.28 600 1.71 0.93 24.92 31.64Irritability 5.55 600 1.01 1.08 3.56 7.54Worry 8.74 600 1.11 0.96 6.57 10.91Depression 5.40 600 0.84 0.91 3.74 7.05Depressive ideas 3.79 600 0.81 1.04 2.19 5.38Anxiety 4.67 600 0.71 0.83 3.27 6.06Obsessions 3.97 600 0.77 0.97 2.46 5.49Concentration and forgetfulness 6.08 600 1.03 1.06 4.06 8.10Somatic symptoms 3.84 600 0.72 0.92 2.43 5.26Compulsions 2.19 600 0.59 0.98 1.04 3.35Phobias 2.39 600 0.63 1.01 1.15 3.63Worry–Physical health 7.28 600 1.14 1.07 5.05 9.52Panic 0.91 600 0.42 1.08 0.09 1.72

131Psychiatric Morbidity among Adults living in Private Households, 2000
Appendix A Statistical terms and their interpretation
Table A.3 Standard errors and 95% confidence intervals for the distribution of CIS-R scores by sex and ethnicity
Base Characteristic % (p) (adj) Sample size True standard Deft 95% confidence intervalerror of p LL UL
All adults 0–5 67.82 8580 0.68 1.35 66.48 69.156–11 16.95 8580 0.51 1.25 15.96 17.94Under 12 84.77 8580 0.49 1.26 83.81 85.7312–17 7.86 8580 0.35 1.19 7.18 8.5418 and over 7.37 8580 0.33 1.17 6.72 8.0112 and over 15.23 8580 0.49 1.26 14.27 16.19
Women 0–5 62.52 4728 0.91 1.30 60.73 64.326–11 19.38 4728 0.68 1.18 18.05 20.70Under 12 81.90 4728 0.73 1.30 80.47 83.3312–17 9.51 4728 0.53 1.24 8.47 10.5618 and over 8.58 4728 0.47 1.16 7.65 9.5112 and over 18.10 4728 0.73 1.30 16.67 19.53
Men 0–5 73.12 3852 0.83 1.17 71.48 74.756–11 14.52 3852 0.62 1.09 13.31 15.74Under 12 87.64 3852 0.60 1.14 86.46 88.8312–17 6.21 3852 0.43 1.10 5.37 7.0518 and over 6.15 3852 0.41 1.07 5.34 6.9612 and over 12.36 3852 0.60 1.14 11.17 13.54
White 0–5 67.92 8031 0.70 1.35 66.54 69.316–11 16.98 8031 0.53 1.27 15.94 18.02Under 12 84.90 8031 0.48 1.20 83.97 85.8412–17 7.92 8031 0.36 1.18 7.23 8.6218 and over 7.17 8031 0.32 1.12 6.54 7.8112 and over 15.10 8031 0.48 1.20 14.16 16.03
Black 0–5 69.25 185 3.94 1.16 61.53 76.976–11 16.97 185 2.81 1.02 11.46 22.48Under 12 86.22 185 2.74 1.08 80.85 91.5812–17 4.75 185 1.60 1.02 1.62 7.8818 and over 9.03 185 2.39 1.13 4.34 13.7312 and over 13.78 185 2.74 1.08 8.42 19.15
South Asian 0–5 67.23 142 4.67 1.18 58.07 76.396–11 13.55 142 3.04 1.05 7.60 19.51Under 12 80.78 142 4.28 1.29 72.38 89.1812–17 9.57 142 2.64 1.07 4.39 14.7518 and over 9.65 142 2.84 1.14 4.07 15.2212 and over 19.22 142 4.28 1.29 10.82 27.62
Other 0–5 58.30 156 4.47 1.13 49.53 67.076–11 22.69 156 3.88 1.15 15.08 30.30Under 12 80.99 156 3.57 1.13 73.99 87.9912–17 8.76 156 2.28 1.00 4.30 13.2218 and over 10.25 156 2.65 1.09 5.04 15.4512 and over 19.01 156 3.57 1.13 12.01 26.01

132 Psychiatric Morbidity among Adults living in Private Households, 2000
Appendix A Statistical terms and their interpretation
Table A.4 Standard errors and 95% confidence intervals for the distribution of CIS-R scores by age
Base Characteristic % (p) (adj) Sample size True standard Deft 95% confidence intervalerror of p LL UL
16- to 19-year-olds 0–5 67.79 334 2.51 0.98 62.88 72.706–11 18.90 334 2.16 1.01 14.66 23.13Under 12 86.69 334 1.96 1.05 82.85 90.5212–17 6.18 334 1.44 1.09 3.36 8.9918 and over 7.13 334 1.42 1.01 4.35 9.9212 and over 13.31 334 1.96 1.05 9.48 17.15
20- to 24-year-olds 0–5 67.89 460 2.25 1.03 63.47 72.316–11 17.24 460 1.78 1.01 13.76 20.72Under 12 85.13 460 1.80 1.08 81.61 88.6512–17 9.18 460 1.55 1.15 6.15 12.2218 and over 5.69 460 1.07 0.99 3.60 7.7812 and over 14.87 460 1.80 1.08 11.35 18.39
25- to 29-year-olds 0–5 63.55 730 1.94 1.09 59.74 67.366–11 19.10 730 1.53 1.05 16.10 22.10Under 12 82.66 730 1.48 1.06 79.75 85.5612–17 9.83 730 1.14 1.04 7.59 12.0718 and over 7.52 730 0.97 0.99 5.62 9.4112 and over 17.34 730 1.48 1.06 14.44 20.25
30- to 34-year-olds 0–5 65.87 953 1.72 1.12 62.50 69.256–11 18.42 953 1.42 1.13 15.63 21.21Under 12 84.30 953 1.35 1.15 81.64 86.9512–17 7.67 953 0.97 1.12 5.77 9.5718 and over 8.04 953 0.97 1.10 6.14 9.9312 and over 15.70 953 1.35 1.15 13.05 18.36
35- to 39-year-olds 0–5 66.37 1006 1.62 1.09 63.20 69.546–11 17.02 1006 1.31 1.11 14.44 19.59Under 12 83.39 1006 1.26 1.07 80.92 85.8512–17 7.76 1006 0.86 1.02 6.08 9.4518 and over 8.85 1006 0.93 1.04 7.02 10.6812 and over 16.61 1006 1.26 1.07 14.15 19.08
40- to 44-year-olds 0–5 63.78 842 1.90 1.15 60.07 67.506–11 18.24 842 1.51 1.13 15.29 21.19Under 12 82.02 842 1.35 1.02 79.37 84.6712–17 8.88 842 1.03 1.05 6.86 10.8918 and over 9.10 842 1.03 1.04 7.09 11.1212 and over 17.98 842 1.35 1.02 15.33 20.63
45- to 49-year-olds 0–5 65.95 723 2.02 1.14 62.00 69.916–11 16.68 723 1.51 1.09 13.73 19.63Under 12 82.63 723 1.49 1.06 79.71 85.5612–17 8.91 723 1.15 1.09 6.65 11.1618 and over 8.46 723 1.13 1.10 6.24 10.6812 and over 17.37 723 1.49 1.06 14.44 20.29
50- to 54-year-olds 0–5 64.18 822 1.99 1.19 60.28 68.086–11 17.56 822 1.59 1.19 14.45 20.67Under 12 81.74 822 1.44 1.07 78.92 84.5612–17 9.51 822 1.10 1.08 7.34 11.6718 and over 8.76 822 0.97 0.98 6.86 10.6512 and over 18.26 822 1.44 1.07 15.44 21.08

133Psychiatric Morbidity among Adults living in Private Households, 2000
Appendix A Statistical terms and their interpretation
55- to 59-year-olds 0–5 70.25 703 1.73 1.00 66.86 73.656–11 15.59 703 1.48 1.08 12.69 18.49Under 12 85.85 703 1.36 1.03 83.18 88.5112–17 6.75 703 0.94 1.00 4.90 8.6018 and over 7.40 703 1.02 1.03 5.41 9.4012 and over 14.15 703 1.36 1.03 11.49 16.82
60- to 64-year-olds 0–5 72.62 739 1.77 1.08 69.16 76.086–11 14.28 739 1.38 1.07 11.58 16.98Under 12 86.90 739 1.23 0.99 84.49 89.3112–17 6.42 739 0.91 1.01 4.63 8.2118 and over 6.68 739 0.91 0.99 4.90 8.4512 and over 13.10 739 1.23 0.99 10.69 15.51
65- to 69-year-olds 0–5 78.01 668 1.57 0.98 74.93 81.096–11 13.29 668 1.32 1.00 10.71 15.86Under 12 91.29 668 1.17 1.07 89.01 93.5812–17 5.04 668 0.89 1.05 3.30 6.7818 and over 3.66 668 0.80 1.10 2.09 5.2312 and over 8.71 668 1.17 1.07 6.42 10.99
70- to 70-year-olds 0–5 77.97 600 1.56 0.92 74.91 81.026–11 13.60 600 1.37 0.98 10.92 16.29Under 12 91.57 600 1.11 0.98 89.40 93.7412–17 5.42 600 0.96 1.04 3.53 7.3118 and over 3.01 600 0.66 0.95 1.72 4.3112 and over 8.43 600 1.11 0.98 6.26 10.60
Table A.4 - continued Standard errors and 95% confidence intervals for the distribution of CIS-R scores by age
Base Characteristic % (p) (adj) Sample size True standard Deft 95% confidence intervalerror of p LL UL
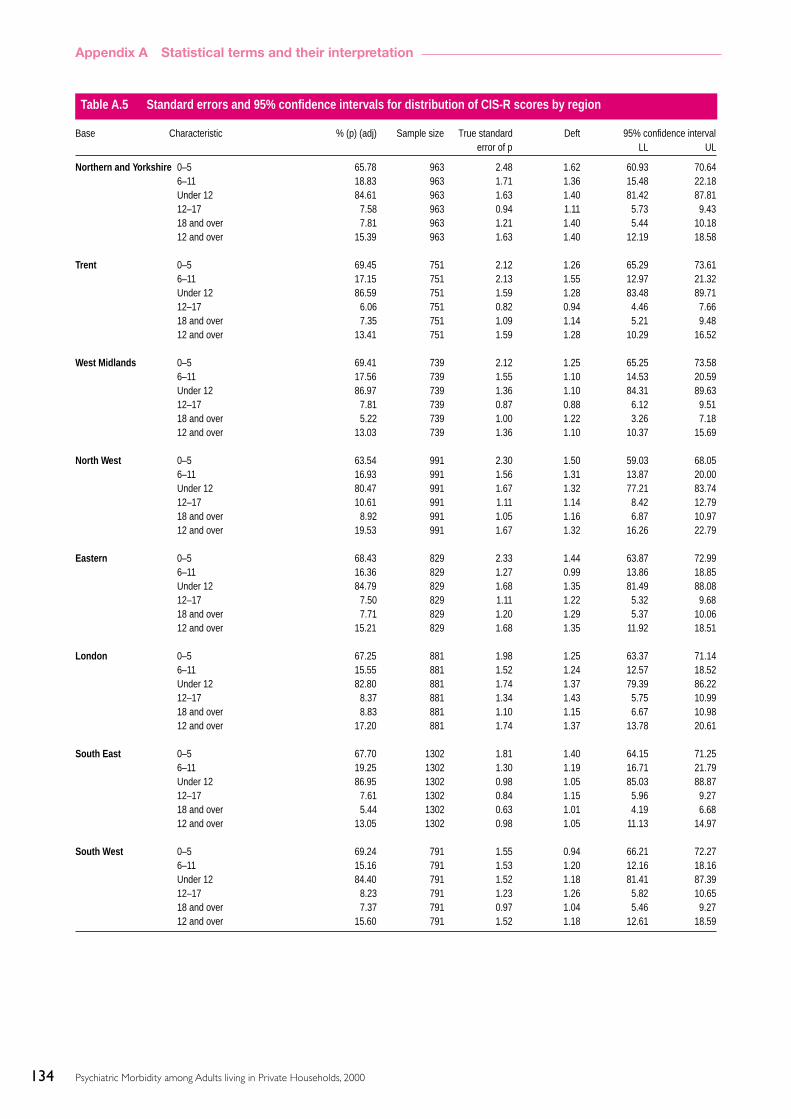
134 Psychiatric Morbidity among Adults living in Private Households, 2000
Appendix A Statistical terms and their interpretation
Table A.5 Standard errors and 95% confidence intervals for distribution of CIS-R scores by region
Base Characteristic % (p) (adj) Sample size True standard Deft 95% confidence intervalerror of p LL UL
Northern and Yorkshire 0–5 65.78 963 2.48 1.62 60.93 70.646–11 18.83 963 1.71 1.36 15.48 22.18Under 12 84.61 963 1.63 1.40 81.42 87.8112–17 7.58 963 0.94 1.11 5.73 9.4318 and over 7.81 963 1.21 1.40 5.44 10.1812 and over 15.39 963 1.63 1.40 12.19 18.58
Trent 0–5 69.45 751 2.12 1.26 65.29 73.616–11 17.15 751 2.13 1.55 12.97 21.32Under 12 86.59 751 1.59 1.28 83.48 89.7112–17 6.06 751 0.82 0.94 4.46 7.6618 and over 7.35 751 1.09 1.14 5.21 9.4812 and over 13.41 751 1.59 1.28 10.29 16.52
West Midlands 0–5 69.41 739 2.12 1.25 65.25 73.586–11 17.56 739 1.55 1.10 14.53 20.59Under 12 86.97 739 1.36 1.10 84.31 89.6312–17 7.81 739 0.87 0.88 6.12 9.5118 and over 5.22 739 1.00 1.22 3.26 7.1812 and over 13.03 739 1.36 1.10 10.37 15.69
North West 0–5 63.54 991 2.30 1.50 59.03 68.056–11 16.93 991 1.56 1.31 13.87 20.00Under 12 80.47 991 1.67 1.32 77.21 83.7412–17 10.61 991 1.11 1.14 8.42 12.7918 and over 8.92 991 1.05 1.16 6.87 10.9712 and over 19.53 991 1.67 1.32 16.26 22.79
Eastern 0–5 68.43 829 2.33 1.44 63.87 72.996–11 16.36 829 1.27 0.99 13.86 18.85Under 12 84.79 829 1.68 1.35 81.49 88.0812–17 7.50 829 1.11 1.22 5.32 9.6818 and over 7.71 829 1.20 1.29 5.37 10.0612 and over 15.21 829 1.68 1.35 11.92 18.51
London 0–5 67.25 881 1.98 1.25 63.37 71.146–11 15.55 881 1.52 1.24 12.57 18.52Under 12 82.80 881 1.74 1.37 79.39 86.2212–17 8.37 881 1.34 1.43 5.75 10.9918 and over 8.83 881 1.10 1.15 6.67 10.9812 and over 17.20 881 1.74 1.37 13.78 20.61
South East 0–5 67.70 1302 1.81 1.40 64.15 71.256–11 19.25 1302 1.30 1.19 16.71 21.79Under 12 86.95 1302 0.98 1.05 85.03 88.8712–17 7.61 1302 0.84 1.15 5.96 9.2718 and over 5.44 1302 0.63 1.01 4.19 6.6812 and over 13.05 1302 0.98 1.05 11.13 14.97
South West 0–5 69.24 791 1.55 0.94 66.21 72.276–11 15.16 791 1.53 1.20 12.16 18.16Under 12 84.40 791 1.52 1.18 81.41 87.3912–17 8.23 791 1.23 1.26 5.82 10.6518 and over 7.37 791 0.97 1.04 5.46 9.2712 and over 15.60 791 1.52 1.18 12.61 18.59

135Psychiatric Morbidity among Adults living in Private Households, 2000
Appendix A Statistical terms and their interpretation
England 0–5 67.45 7247 0.75 1.36 65.99 68.926–11 17.21 7247 0.56 1.25 16.12 18.30Under 12 84.66 7247 0.54 1.27 83.61 85.7212–17 8.02 7247 0.38 1.18 7.29 8.7618 and over 7.31 7247 0.36 1.18 6.60 8.0212 and over 15.34 7247 0.54 1.27 14.28 16.39
Wales 0–5 67.00 412 2.84 1.22 61.44 72.556–11 15.25 412 1.80 1.01 11.72 18.77Under 12 82.24 412 2.41 1.28 77.52 86.9712–17 7.53 412 1.91 1.47 3.79 11.2818 and over 10.23 412 1.65 1.10 7.00 13.4612 and over 17.76 412 2.41 1.28 13.03 22.48
Scotland 0–5 71.71 921 2.00 1.34 67.80 75.636–11 15.35 921 1.50 1.26 12.42 18.29Under 12 87.07 921 1.27 1.15 84.58 89.5512–17 6.50 921 0.97 1.19 4.60 8.4018 and over 6.43 921 0.82 1.01 4.83 8.0312 and over 12.93 921 1.27 1.15 10.45 15.42
Table A.5 - continued Standard errors and 95% confidence intervals for distribution of CIS-R scores by region
Base Characteristic % (p) (adj) Sample size True standard Deft 95% confidence intervalerror of p LL UL

136 Psychiatric Morbidity among Adults living in Private Households, 2000
Appendix A Statistical terms and their interpretation
Table A.6 Standard errors and 95% confidence intervals for prevalence of neurotic disorders by sex and ethnicity
Base Characteristic % (p) (adj) Sample size True standard Deft 95% confidence interval error of p LL UL
All adults Mixed anxiety and depressive disorder 8.77 8580 0.36 1.19 8.06 9.49Generalised anxiety disorder 4.44 8580 0.24 1.10 3.96 4.92Depressive episode 2.58 8580 0.18 1.03 2.23 2.92All Phobias 1.76 8580 0.14 0.99 1.48 2.03Obsessive compulsive disorder 1.11 8580 0.12 1.07 0.87 1.35Panic disorder 0.70 8580 0.09 1.02 0.52 0.88Any neurotic disorder 16.43 8580 0.51 1.27 15.44 17.43
Women Mixed anxiety and depressive disorder 10.75 4728 0.59 1.30 9.60 11.90Generalised anxiety disorder 4.60 4728 0.30 0.99 4.01 5.19Depressive episode 2.80 4728 0.24 0.98 2.34 3.26All Phobias 2.18 4728 0.21 1.00 1.77 2.60Obsessive compulsive disorder 1.35 4728 0.20 1.18 0.96 1.74Panic disorder 0.71 4728 0.12 0.97 0.48 0.95Any neurotic disorder 19.41 4728 0.75 1.31 17.93 20.88
Men Mixed anxiety and depressive disorder 6.79 3852 0.43 1.07 5.94 7.63Generalised anxiety disorder 4.28 3852 0.37 1.13 3.55 5.00Depressive episode 2.35 3852 0.26 1.05 1.85 2.85All Phobias 1.34 3852 0.18 0.98 0.98 1.69Obsessive compulsive disorder 0.87 3852 0.15 1.01 0.57 1.16Panic disorder 0.69 3852 0.14 1.01 0.43 0.96Any neurotic disorder 16.43 8580 0.51 1.27 15.44 17.43
White Mixed anxiety and depressive disorder 8.70 8031 0.37 1.19 7.97 9.43Generalised anxiety disorder 4.47 8031 0.25 1.10 3.97 4.96Depressive episode 2.50 8031 0.17 0.97 2.17 2.83All Phobias 1.77 8031 0.15 1.00 1.48 2.05Obsessive compulsive disorder 1.03 8031 0.11 1.00 0.81 1.25Panic disorder 0.71 8031 0.09 0.99 0.53 0.89Any neurotic disorder 16.34 8031 0.49 1.20 15.37 17.31
Black Mixed anxiety and depressive disorder 7.39 185 2.03 1.05 3.41 11.38Generalised anxiety disorder 3.76 185 1.59 1.13 0.65 6.87Depressive episode 2.70 185 1.13 0.95 0.48 4.92All Phobias 1.88 185 0.87 0.87 0.17 3.59Obsessive compulsive disorder 1.77 185 0.99 1.02 -0.18 3.71Panic disorder 0.28 185 0.30 0.77 -0.30 0.86Any neurotic disorder 14.13 185 2.73 1.06 8.79 19.48
South Asian Mixed anxiety and depressive disorder 10.02 142 2.69 1.07 4.74 15.30Generalised anxiety disorder 4.16 142 1.31 0.78 1.59 6.74Depressive episode 3.71 142 1.27 0.80 1.22 6.20All Phobias 1.87 142 1.07 0.94 -0.23 3.97Obsessive compulsive disorder 3.96 142 2.13 1.30 -0.22 8.14Panic disorder 0.00 142 0.00 - 0.00 0.00Any neurotic disorder 19.22 142 4.28 1.29 10.82 27.62
Other Mixed anxiety and depressive disorder 13.36 156 2.67 0.98 8.13 18.59Generalised anxiety disorder 3.99 156 1.75 1.11 0.56 7.42Depressive episode 3.23 156 1.61 1.14 0.07 6.40All Phobias 1.18 156 1.00 1.15 -0.77 3.13Obsessive compulsive disorder 0.00 156 0.00 - 0.00 0.00Panic disorder 1.65 156 1.21 1.18 -0.72 4.01Any neurotic disorder 20.41 156 3.64 1.12 13.28 27.54

137Psychiatric Morbidity among Adults living in Private Households, 2000
Appendix A Statistical terms and their interpretation

138 Psychiatric Morbidity among Adults living in Private Households, 2000
Appendix A Statistical terms and their interpretation
Table A.7 Standard errors and 95% confidence intervals for prevalence of neurotic disorders by age
Base Characteristic % (p) (adj) Sample size True standard Deft 95% confidence intervalerror of p LL UL
16- to 19-year-olds Mixed anxiety and depressive disorder 8.32 334 1.69 1.11 5.02 11.63Generalised anxiety disorder 1.36 334 0.58 0.92 0.22 2.50Depressive episode 1.68 334 0.69 0.97 0.34 3.03All Phobias 1.27 334 0.64 1.04 0.03 2.52Obsessive compulsive disorder 0.89 334 0.48 0.93 - 0.05 1.83Panic disorder 0.54 334 0.33 0.81 - 0.09 1.18Any neurotic disorder 13.31 334 1.96 1.05 9.48 17.15
20- to 24-year-olds Mixed anxiety and depressive disorder 9.38 460 1.48 1.09 6.48 12.29Generalised anxiety disorder 1.49 460 0.48 0.85 0.54 2.44Depressive episode 2.22 460 0.54 0.79 1.15 3.28All Phobias 1.64 460 0.55 0.93 0.56 2.72Obsessive compulsive disorder 1.90 460 0.72 1.13 0.49 3.32Panic disorder 0.37 460 0.32 1.13 - 0.26 0.99Any neurotic disorder 15.76 460 1.84 1.08 12.14 19.37
25- to 29-year-olds Mixed anxiety and depressive disorder 10.99 730 1.25 1.08 8.54 13.44Generalised anxiety disorder 3.89 730 0.70 0.98 2.51 5.26Depressive episode 2.40 730 0.54 0.96 1.34 3.47All Phobias 1.78 730 0.45 0.93 0.89 2.67Obsessive compulsive disorder 1.16 730 0.41 1.03 0.36 1.97Panic disorder 0.94 730 0.35 0.99 0.25 1.63Any neurotic disorder 18.12 730 1.51 1.06 15.15 21.08
30- to 34-year-olds Mixed anxiety and depressive disorder 8.81 953 0.98 1.07 6.89 10.74Generalised anxiety disorder 4.54 953 0.72 1.07 3.12 5.96Depressive episode 2.15 953 0.45 0.96 1.26 3.04All Phobias 1.99 953 0.49 1.07 1.04 2.94Obsessive compulsive disorder 1.07 953 0.30 0.89 0.49 1.65Panic disorder 0.73 953 0.31 1.11 0.13 1.33Any neurotic disorder 16.92 953 1.43 1.18 14.11 19.73
35- to 39-year-olds Mixed anxiety and depressive disorder 8.87 1006 0.93 1.03 7.05 10.68Generalised anxiety disorder 5.32 1006 0.71 1.00 3.94 6.71Depressive episode 3.74 1006 0.71 1.18 2.36 5.13All Phobias 2.57 1006 0.51 1.02 1.57 3.56Obsessive compulsive disorder 1.30 1006 0.35 0.98 0.61 1.98Panic disorder 0.57 1006 0.19 0.79 0.21 0.94Any neurotic disorder 17.24 1006 1.27 1.06 14.76 19.72
40- to 44-year-olds Mixed anxiety and depressive disorder 10.79 842 1.08 1.01 8.68 12.90Generalised anxiety disorder 6.08 842 0.93 1.13 4.25 7.91Depressive episode 2.79 842 0.60 1.06 1.61 3.97All Phobias 2.06 842 0.48 0.99 1.11 3.00Obsessive compulsive disorder 1.33 842 0.43 1.09 0.49 2.18Panic disorder 0.51 842 0.27 1.08 -0.01 1.03Any neurotic disorder 19.53 842 1.43 1.05 16.73 22.34
45- to 49-year-olds Mixed anxiety and depressive disorder 9.14 723 1.15 1.07 6.89 11.39Generalised anxiety disorder 7.07 723 1.00 1.05 5.10 9.04Depressive episode 3.60 723 0.72 1.04 2.18 5.02All Phobias 2.51 723 0.61 1.04 1.33 3.70Obsessive compulsive disorder 1.27 723 0.44 1.06 0.41 2.14Panic disorder 1.00 723 0.40 1.08 0.22 1.78Any neurotic disorder 19.63 723 1.63 1.10 16.44 22.82
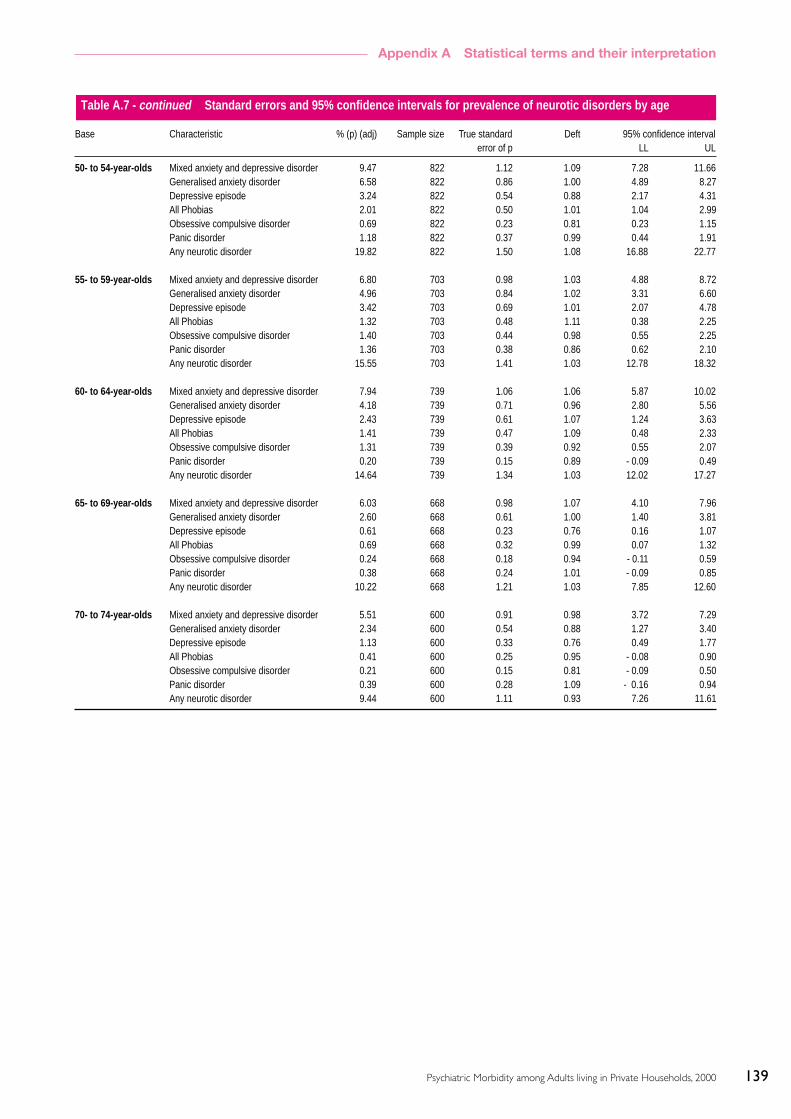
139Psychiatric Morbidity among Adults living in Private Households, 2000
Appendix A Statistical terms and their interpretation
50- to 54-year-olds Mixed anxiety and depressive disorder 9.47 822 1.12 1.09 7.28 11.66Generalised anxiety disorder 6.58 822 0.86 1.00 4.89 8.27Depressive episode 3.24 822 0.54 0.88 2.17 4.31All Phobias 2.01 822 0.50 1.01 1.04 2.99Obsessive compulsive disorder 0.69 822 0.23 0.81 0.23 1.15Panic disorder 1.18 822 0.37 0.99 0.44 1.91Any neurotic disorder 19.82 822 1.50 1.08 16.88 22.77
55- to 59-year-olds Mixed anxiety and depressive disorder 6.80 703 0.98 1.03 4.88 8.72Generalised anxiety disorder 4.96 703 0.84 1.02 3.31 6.60Depressive episode 3.42 703 0.69 1.01 2.07 4.78All Phobias 1.32 703 0.48 1.11 0.38 2.25Obsessive compulsive disorder 1.40 703 0.44 0.98 0.55 2.25Panic disorder 1.36 703 0.38 0.86 0.62 2.10Any neurotic disorder 15.55 703 1.41 1.03 12.78 18.32
60- to 64-year-olds Mixed anxiety and depressive disorder 7.94 739 1.06 1.06 5.87 10.02Generalised anxiety disorder 4.18 739 0.71 0.96 2.80 5.56Depressive episode 2.43 739 0.61 1.07 1.24 3.63All Phobias 1.41 739 0.47 1.09 0.48 2.33Obsessive compulsive disorder 1.31 739 0.39 0.92 0.55 2.07Panic disorder 0.20 739 0.15 0.89 - 0.09 0.49Any neurotic disorder 14.64 739 1.34 1.03 12.02 17.27
65- to 69-year-olds Mixed anxiety and depressive disorder 6.03 668 0.98 1.07 4.10 7.96Generalised anxiety disorder 2.60 668 0.61 1.00 1.40 3.81Depressive episode 0.61 668 0.23 0.76 0.16 1.07All Phobias 0.69 668 0.32 0.99 0.07 1.32Obsessive compulsive disorder 0.24 668 0.18 0.94 - 0.11 0.59Panic disorder 0.38 668 0.24 1.01 - 0.09 0.85Any neurotic disorder 10.22 668 1.21 1.03 7.85 12.60
70- to 74-year-olds Mixed anxiety and depressive disorder 5.51 600 0.91 0.98 3.72 7.29Generalised anxiety disorder 2.34 600 0.54 0.88 1.27 3.40Depressive episode 1.13 600 0.33 0.76 0.49 1.77All Phobias 0.41 600 0.25 0.95 - 0.08 0.90Obsessive compulsive disorder 0.21 600 0.15 0.81 - 0.09 0.50Panic disorder 0.39 600 0.28 1.09 - 0.16 0.94Any neurotic disorder 9.44 600 1.11 0.93 7.26 11.61
Table A.7 - continued Standard errors and 95% confidence intervals for prevalence of neurotic disorders by age
Base Characteristic % (p) (adj) Sample size True standard Deft 95% confidence intervalerror of p LL UL

140 Psychiatric Morbidity among Adults living in Private Households, 2000
Appendix A Statistical terms and their interpretation
Table A.8 Standard errors and 95% confidence intervals for prevalence of personality disorders by sex
Base Characteristic % (p) (adj) Sample size True standard Deft 95% confidence intervalerror of p LL UL
All adults Avoidant PD 0.84 626 0.30 0.83 0.25 1.43Dependent PD 0.11 626 0.08 0.65 -0.06 0.27Obsessive-Compulsive PD 1.92 626 0.65 1.18 0.65 3.19Paranoid PD 0.74 626 0.26 0.75 0.23 1.25Schizotypal PD 0.06 626 0.03 0.33 0.00 0.12Schizoid PD 0.84 626 0.37 1.03 0.10 1.57Histrionic PD 0.00 626 0.00 - 0.00 0.00Narcissistic PD 0.00 626 0.00 - 0.00 0.00Borderline PD 0.71 626 0.25 0.75 0.22 1.21Antisocial PD 0.58 626 0.20 0.65 0.19 0.97Any personality disorder 4.39 626 0.84 1.03 2.74 6.05
Women Avoidant PD 0.70 355 0.31 0.70 0.09 1.30Dependent PD 0.02 355 0.03 0.35 -0.03 0.07Obsessive-Compulsive PD 1.28 355 0.59 0.99 0.12 2.43Paranoid PD 0.31 355 0.17 0.59 -0.03 0.65Schizotypal PD 0.11 355 0.06 0.36 -0.02 0.23Schizoid PD 0.80 355 0.59 1.25 -0.36 1.95Histrionic PD 0.00 355 0.00 - 0.00 0.00Narcissistic PD 0.00 355 0.00 - 0.00 0.00Borderline PD 0.41 355 0.20 0.58 0.02 0.80Antisocial PD 0.19 355 0.14 0.60 -0.08 0.47Any personality disorder 3.36 355 0.91 0.95 1.57 5.15
Men Avoidant PD 0.98 271 0.51 0.84 -0.01 1.97Dependent PD 0.19 271 0.17 0.62 -0.13 0.52Obsessive-Compulsive PD 2.57 271 1.14 1.18 0.34 4.80Paranoid PD 1.17 271 0.61 0.92 -0.01 2.36Schizotypal PD 0.02 271 0.02 0.27 -0.03 0.06Schizoid PD 0.88 271 0.48 0.84 -0.06 1.81Histrionic PD 0.00 271 0.00 - 0.00 0.00Narcissistic PD 0.00 271 0.00 - 0.00 0.00Borderline PD 1.01 271 0.57 0.94 -0.11 2.13Antisocial PD 0.97 271 0.38 0.63 0.23 1.71Any personality disorder 5.43 271 1.41 1.02 2.67 8.19

141Psychiatric Morbidity among Adults living in Private Households, 2000
Appendix A Statistical terms and their interpretation
Table A.9 Standard errors and 95% confidence intervals for prevalence of personality disorders by age
Base Characteristic % (p) (adj) Sample size True standard Deft 95% confidence intervalerror of p LL UL
16- to 34-year-olds Avoidant PD 0.56 167 0.27 0.47 0.02 1.10Dependent PD 0.27 167 0.24 0.58 - 0.19 0.74Obsessive- to Compulsive PD 1.13 167 0.86 1.05 - 0.56 2.83Paranoid PD 0.61 167 0.29 0.48 0.04 1.19Schizotypal PD 0.06 167 0.06 0.31 - 0.06 0.17Schizoid PD 0.68 167 0.47 0.74 - 0.24 1.61Histrionic PD 0.00 167 0.00 - 0.00 0.00Narcissistic PD 0.00 167 0.00 - 0.00 0.00Borderline PD 0.32 167 0.17 0.39 - 0.02 0.66Antisocial PD 0.67 167 0.34 0.53 0.01 1.33Any personality disorder 3.43 167 1.23 0.87 1.02 5.84
35- to 54-year-olds Avoidant PD 1.59 284 0.73 0.98 0.17 3.02Dependent PD 0.00 284 0.00 - 0.00 0.00Obsessive- to Compulsive PD 1.68 284 0.94 1.23 - 0.17 3.53Paranoid PD 1.29 284 0.58 0.86 0.16 2.42Schizotypal PD 0.06 284 0.05 0.32 - 0.03 0.15Schizoid PD 0.09 284 0.07 0.40 - 0.05 0.22Histrionic PD 0.00 284 0.00 - 0.00 0.00Narcissistic PD 0.00 284 0.00 - 0.00 0.00Borderline PD 1.53 284 0.62 0.85 0.32 2.74Antisocial PD 0.88 284 0.42 0.76 0.06 1.70Any personality disorder 4.35 284 1.21 1.00 1.98 6.72
55- to 74-year-olds Avoidant PD 0.08 175 0.07 0.31 0.00 0.00Dependent PD 0.04 175 0.05 0.34 - 0.06 0.15Obsessive- to Compulsive PD 3.39 175 1.65 1.20 0.16 6.61Paranoid PD 0.08 175 0.10 0.45 - 0.11 0.27Schizotypal PD 0.07 175 0.08 0.38 - 0.08 0.23Schizoid PD 2.19 175 1.31 1.18 - 0.39 4.76Histrionic PD 0.00 175 0.00 - 0.00 0.00Narcissistic PD 0.00 175 0.00 - 0.00 0.00Borderline PD 0.00 175 0.00 - 0.00 0.00Antisocial PD 0.00 175 0.00 - 0.00 0.00Any personality disorder 5.79 175 2.11 1.19 1.66 9.92

142 Psychiatric Morbidity among Adults living in Private Households, 2000
Appendix A Statistical terms and their interpretation
Table A10 Standard errors and 95% confidence intervals for probable psychosis by sex, age and ethnicity
Base Characteristic % (p) (adj) Sample size True standard Deft 95% confidence intervalerror of p LL UL
All adults Probable psychosis 0.53 8580 0.08 1.00 0.38 0.68No probable psychosis 99.47 8580 0.08 1.00 99.32 99.62
Women Probable psychosis 0.49 4728 0.09 0.92 0.31 0.68No probable psychosis 99.51 4728 0.09 0.92 99.32 99.69
Men Probable psychosis 0.57 3852 0.11 0.94 0.34 0.79No probable psychosis 99.43 3852 0.11 0.94 99.21 99.66
16- to 19-year-olds Probable psychosis 0.21 334 0.21 0.83 - 0.20 0.62No probable psychosis 99.79 334 0.21 0.83 99.38 100.20
20- to 24-year-olds Probable psychosis 0.19 460 0.20 1.00 -0.21 0.58No probable psychosis 99.81 460 0.20 1.00 99.42 100.21
25- to 29-year-olds Probable psychosis 0.11 730 0.10 0.85 -0.09 0.32No probable psychosis 99.89 730 0.10 0.85 99.68 100.09
30- to 34-year-olds Probable psychosis 0.85 953 0.32 1.07 0.23 1.48No probable psychosis 99.15 953 0.32 1.07 98.52 99.77
35- to 39-year-olds Probable psychosis 0.80 1006 0.29 1.04 0.23 1.37No probable psychosis 99.20 1006 0.29 1.04 98.63 99.77
40- to 44-year-olds Probable psychosis 0.97 842 0.33 0.98 0.32 1.62No probable psychosis 99.03 842 0.33 0.98 98.38 99.68
45- to 49-year-olds Probable psychosis 0.57 723 0.20 0.71 0.18 0.96No probable psychosis 99.43 723 0.20 0.71 99.04 99.82
50- to 54-year-olds Probable psychosis 0.66 822 0.28 0.98 0.11 1.20No probable psychosis 99.34 822 0.28 0.98 98.80 99.89
55- to 59-year-olds Probable psychosis 0.50 703 0.26 0.99 -0.02 1.01No probable psychosis 99.50 703 0.26 0.99 98.99 100.02
60- to 64-year-olds Probable psychosis 0.40 739 0.22 0.95 - 0.03 0.84No probable psychosis 99.60 739 0.22 0.95 99.16 100.03
65- to 69-year-olds Probable psychosis 0.33 668 0.17 0.75 0.00 0.66No probable psychosis 99.67 668 0.17 0.75 99.34 100.00
70- to 74-year-olds Probable psychosis 0.28 600 0.21 0.99 -0.14 0.70No probable psychosis 99.72 600 0.21 0.99 99.30 100.14
White Probable psychosis 0.51 8031 0.08 1.01 0.35 0.67No probable psychosis 99.49 8031 0.08 1.01 99.33 99.65
Black Probable psychosis 1.77 185 0.92 0.95 -0.04 3.58No probable psychosis 98.23 185 0.92 0.95 96.42 100.04
South Asian Probable psychosis 0.00 142 0.00 - 0.00 0.00No probable psychosis 100.00 142 0.00 - 100.00 100.00
Other Probable psychosis 0.00 156 0.00 - 0.00 0.00No probable psychosis 100.00 156 0.00 - 100.00 100.00

143Psychiatric Morbidity among Adults living in Private Households, 2000
Appendix A Statistical terms and their interpretation
Table A.11 Standard errors and 95% confidence intervals for prevalence of hazardous drinking by sex and ethnicity
Base Characteristic % (p) (adj) Sample size True standard Deft 95% confidence interval error of p LL UL
All adults Score: 0–7 73.52 8538 0.52 1.08 72.51 74.54Score: 8–15 22.90 8538 0.49 1.08 21.93 23.86Score: 16–40 3.58 8538 0.24 1.17 3.12 4.04Hazardous drinking (Score 8+) 26.48 8538 0.52 1.08 25.46 27.49
Women Score: 0–7 84.53 4705 0.54 1.02 83.47 85.58Score: 8–15 13.96 4705 0.53 1.04 12.26 15.66Score: 16–40 1.52 4705 0.21 1.16 1.11 1.92Hazardous drinking (Score 8+) 15.47 4705 0.54 1.02 14.42 16.53
Men Score: 0–7 62.50 3833 0.87 1.11 60.80 64.20Score: 8–15 31.85 3833 0.83 1.11 30.22 33.49Score: 16–40 5.65 3833 0.41 1.10 4.84 6.46Hazardous drinking (Score 8+) 37.50 3833 0.87 1.11 35.80 39.20
White Score: 0–7 72.74 8003 0.53 1.06 71.71 73.78Score: 8–15 23.66 8003 0.49 1.04 22.69 24.63Score: 16–40 3.59 8003 0.24 1.17 3.11 4.07Hazardous drinking (Score 8+) 27.26 8003 0.53 1.06 26.22 28.29
Black Score: 0–7 82.09 185 2.98 1.05 76.25 87.93Score: 8–15 15.30 185 2.66 1.00 10.08 20.52Score: 16–40 2.61 185 1.20 1.02 0.26 4.97Hazardous drinking (Score 8+) 17.91 185 2.98 1.05 12.07 23.75
South Asian Score: 0–7 92.36 142 1.95 0.87 88.55 96.18Score: 8–15 5.94 142 1.82 0.91 2.38 9.51Score: 16–40 1.69 142 1.05 0.97 - 0.37 3.76Hazardous drinking (Score 8+) 7.64 142 1.95 0.87 3.82 11.45
Other Score: 0–7 79.68 156 3.66 1.13 72.50 86.85Score: 8–15 13.72 156 2.88 1.04 8.08 19.36Score: 16–40 6.60 156 2.37 1.19 1.95 11.26Hazardous drinking (Score 8+) 20.32 156 3.66 1.13 13.15 27.50

144 Psychiatric Morbidity among Adults living in Private Households, 2000
Appendix A Statistical terms and their interpretation
Table A.12 Standard errors and 95% confidence intervals for prevalence of hazardous drinking by age
Base Characteristic % (p) (adj) Sample size True standard Deft 95% confidence interval error of p LL UL
16- to 19-year-olds Score: 0–7 61.07 334 2.84 1.06 55.49 66.64Score: 8–15 32.48 334 2.75 1.07 27.09 37.87Score: 16–40 6.45 334 1.36 1.01 3.78 9.12Hazardous drinking (Score 8+) 38.93 334 2.84 1.06 33.36 44.51
20- to 24-year-olds Score: 0–7 55.46 458 2.55 1.10 50.46 60.45Score: 8–15 35.42 458 2.43 1.09 30.66 40.18Score: 16–40 9.13 458 1.40 1.04 6.38 11.88Hazardous drinking (Score 8+) 44.54 458 2.55 1.10 39.55 49.54
25- to 29-year-olds Score: 0–7 61.84 729 1.98 1.10 57.96 65.71Score: 8–15 31.69 729 1.89 1.10 27.99 35.40Score: 16–40 6.47 729 1.03 1.13 4.46 8.48Hazardous drinking (Score 8+) 38.16 729 1.98 1.10 34.29 42.04
30- to 34-year-olds Score: 0–7 71.58 949 1.54 1.05 68.56 74.61Score: 8–15 24.25 949 1.51 1.08 21.30 27.20Score: 16–40 4.17 949 0.78 1.20 2.64 5.69Hazardous drinking (Score 8+) 28.42 949 1.54 1.05 25.39 31.44
35- to 39-year-olds Score: 0–7 71.43 1003 1.51 1.06 68.47 74.40Score: 8–15 24.44 1003 1.43 1.05 21.64 27.23Score: 16–40 4.13 1003 0.75 1.20 2.65 5.60Hazardous drinking (Score 8+) 28.57 1003 1.51 1.06 25.60 31.53
40- to 44-year-olds Score: 0–7 75.17 837 1.55 1.03 72.14 78.20Score: 8–15 22.22 837 1.56 1.09 19.16 25.29Score: 16–40 2.60 837 0.57 1.03 1.50 3.71Hazardous drinking (Score 8+) 24.83 837 1.55 1.03 21.80 27.86
45- to 49-year-olds Score: 0–7 75.96 720 1.54 0.97 72.94 78.98Score: 8–15 22.19 720 1.46 0.94 19.32 25.06Score: 16–40 1.85 720 0.48 0.95 0.91 2.79Hazardous drinking (Score 8+) 24.04 720 1.54 0.97 21.02 27.06
50- to 54-year-olds Score: 0–7 78.78 821 1.48 1.03 75.88 81.67Score: 8–15 19.21 821 1.43 1.04 16.41 22.00Score: 16–40 2.01 821 0.49 1.01 1.04 2.98Hazardous drinking (Score 8+) 21.22 821 1.48 1.03 18.33 24.12
55- to 59-year-olds Score: 0–7 80.38 702 1.47 0.98 77.49 83.27Score: 8–15 18.06 702 1.49 1.02 15.14 20.97Score: 16–40 1.57 702 0.50 1.06 0.60 2.54Hazardous drinking (Score 8+) 19.62 702 1.47 0.98 16.73 22.51
60- to 64-year-olds Score: 0–7 85.94 734 1.36 1.06 83.27 88.62Score: 8–15 13.11 734 1.29 1.04 10.58 15.65Score: 16–40 0.94 734 0.36 1.01 0.23 1.65Hazardous drinking (Score 8+) 14.06 734 1.36 1.06 11.38 16.73
65- to 69-year-olds Score: 0–7 85.48 663 1.48 1.08 82.58 88.39Score: 8–15 13.45 663 1.40 1.05 10.71 16.19Score: 16–40 1.06 663 0.45 1.12 0.19 1.94Hazardous drinking (Score 8+) 14.52 663 1.48 1.08 11.61 17.42
70- to 74-year-olds Score: 0–7 90.75 588 1.22 1.02 88.36 93.14Score: 8–15 8.73 588 1.16 1.00 6.46 11.01Score: 16–40 0.52 588 0.31 1.06 - 0.10 1.13Hazardous drinking (Score 8+) 9.25 588 1.22 1.02 6.86 11.64

145Psychiatric Morbidity among Adults living in Private Households, 2000
Appendix A Statistical terms and their interpretation
Table A.13 Standard errors and 95% confidence intervals for prevalence of alcohol dependence by sex and ethnicity
Base Characteristic (SAD–Q score) % (p) (adj) Sample size True standard Deft 95% confidence interval error of p LL UL
All adults Score 0–3: No dependence 92.62 8536 0.32 1.13 92.00 93.25Score 4–19: Mild dependence 6.93 8536 0.32 1.15 6.31 7.55Score 20–34: Moderate dependence 0.37 8536 0.08 1.20 0.21 0.52Score 35–60: Severe dependence 0.08 8536 0.02 0.75 0.03 0.12
Women Score 0–3: No dependence 97.11 4705 0.27 1.09 96.59 97.63Score 4–19: Mild dependence 2.79 4705 0.26 1.10 2.28 3.31Score 20–34: Moderate dependence 0.06 4705 0.03 0.80 0.01 0.12Score 35–60: Severe dependence 0.03 4705 0.02 0.74 - 0.01 0.07
Men Score 0–3: No dependence 88.12 3831 0.59 1.12 86.97 89.27Score 4–19: Mild dependence 11.08 3831 0.57 1.13 9.96 12.20Score 20–34: Moderate dependence 0.67 3831 0.16 1.17 0.37 0.98Score 35–60: Severe dependence 0.12 3831 0.04 0.72 0.04 0.20
White Score 0–3: No dependence 92.46 8002 0.34 1.14 91.79 93.12Score 4–19: Mild dependence 7.10 8002 0.33 1.15 6.45 7.75Score 20–34: Moderate dependence 0.37 8002 0.08 1.22 0.21 0.53Score 35–60: Severe dependence 0.07 8002 0.02 0.76 0.03 0.12
Black Score 0–3: No dependence 94.03 185 1.89 1.08 90.33 97.72Score 4–19: Mild dependence 5.97 185 1.89 1.08 2.28 9.67Score 20–34: Moderate dependence 0.00 185 0.00 - 0.00 0.00Score 35–60: Severe dependence 0.00 185 0.00 - 0.00 0.00
South Asian Score 0–3: No dependence 97.48 142 1.37 1.04 94.80 100.16Score 4–19: Mild dependence 2.52 142 1.37 1.04 - 0.16 5.20Score 20–34: Moderate dependence 0.00 142 0.00 - 0.00 0.00Score 35–60: Severe dependence 0.00 142 0.00 - 0.00 0.00
Other Score 0–3: No dependence 91.81 156 2.61 1.18 86.70 96.92Score 4–19: Mild dependence 6.85 156 2.28 1.13 2.37 11.32Score 20–34: Moderate dependence 1.34 156 1.32 1.43 - 1.24 3.93Score 35–60: Severe dependence 0.00 156 0.00 - 0.00 0.00

146 Psychiatric Morbidity among Adults living in Private Households, 2000
Appendix A Statistical terms and their interpretation
Table A.14 Standard errors and 95% confidence intervals for prevalence of drug use in last year by sex
Base Characteristic % (p) (adj) Sample size True standard Deft 95% confidence intervalerror of p LL UL
All adults Cannabis 9.65 8542 0.37 1.17 8.92 10.38Amphetamines 1.91 8542 0.17 1.13 1.58 2.24Cocaine 1.92 8542 0.18 1.19 1.58 2.27Crack 0.18 8542 0.05 1.18 0.07 0.28Ecstasy 2.05 8542 0.17 1.12 1.71 2.38Heroin 0.16 8542 0.06 1.29 0.05 0.27LSD 0.42 8542 0.09 1.24 0.25 0.59Magic mushrooms 0.65 8542 0.11 1.31 0.42 0.87Methadone 0.10 8542 0.05 1.32 0.01 0.19Tranquillisers 0.57 8542 0.09 1.06 0.40 0.74Amyl nitrate 0.58 8542 0.09 1.08 0.40 0.75Anabolic steroids 0.12 8542 0.05 1.35 0.02 0.22Volatile substances 0.08 8542 0.04 1.36 0.00 0.16Any drug 10.54 8542 0.39 1.17 9.78 11.31
Women Cannabis 6.96 4704 0.48 1.29 6.02 7.90Amphetamines 1.12 4704 0.18 1.15 0.78 1.47Cocaine 1.01 4704 0.21 1.46 0.59 1.43Crack 0.10 4704 0.04 0.95 0.02 0.19Ecstasy 1.26 4704 0.25 1.52 0.77 1.74Heroin 0.10 4704 0.06 1.29 -0.01 0.22LSD 0.12 4704 0.05 1.01 0.02 0.21Magic mushrooms 0.42 4704 0.13 1.35 0.17 0.67Methadone 0.02 4704 0.02 0.75 -0.01 0.06Tranquillisers 0.45 4704 0.09 0.92 0.28 0.63Amyl nitrate 0.25 4704 0.08 1.04 0.10 0.40Anabolic steroids 0.00 4704 0.00 - 0.00 0.00Volatile substances 0.03 4704 0.02 0.80 -0.01 0.07Any drug 7.73 4704 0.50 1.29 6.75 8.72
Men Cannabis 12.34 3838 0.56 1.06 11.24 13.44Amphetamines 2.70 3838 0.29 1.10 2.14 3.27Cocaine 2.84 3838 0.30 1.11 2.26 3.42Crack 0.25 3838 0.10 1.22 0.06 0.44Ecstasy 2.84 3838 0.32 1.21 2.20 3.47Heroin 0.22 3838 0.09 1.24 0.03 0.40Acid 0.72 3838 0.16 1.17 0.41 1.03Magic mushrooms 0.87 3838 0.19 1.24 0.50 1.23Methadone 0.17 3838 0.09 1.31 0.00 0.35Tranquillisers 0.70 3838 0.15 1.08 0.41 0.98Amyl nitrate 0.90 3838 0.16 1.06 0.58 1.22Anabolic steroids 0.24 3838 0.10 1.28 0.04 0.44Volatile substances 0.13 3838 0.08 1.39 -0.03 0.29Any drug 13.35 3838 0.58 1.05 12.22 14.48

147Psychiatric Morbidity among Adults living in Private Households, 2000
Appendix A Statistical terms and their interpretation
Table A.15 Standard errors and 95% confidence intervals for prevalence of drug dependence by sex
Base Characteristic % (p) (adj) Sample size True standard Deft 95% confidence intervalerror of LL UL
All adults Cannabis 3.12 8541 0.21 1.14 2.70 3.54Amphetamines 0.38 8541 0.09 1.28 0.22 0.55Cocaine 0.24 8540 0.07 1.26 0.11 0.37Crack 0.11 8542 0.05 1.30 0.02 0.20Ecstasy 0.59 8540 0.11 1.34 0.37 0.81Heroin / Methadone 0.14 8541 0.05 1.29 0.04 0.24Tranquillisers 0.21 8542 0.05 0.99 0.11 0.30Volatile substances 0.01 8542 0.01 0.73 - 0.01 0.02No dependency 96.25 8541 0.24 1.17 95.78 96.72Dependent on cannabis only 2.53 8541 0.19 1.13 2.15 2.90Dependent on other drug with or
without cannabis dependency 1.22 8541 0.15 1.22 0.94 1.51Any drug dependence 3.75 8541 0.24 1.17 3.28 4.22
Women Cannabis 1.64 4703 0.22 1.20 1.21 2.08Amphetamines 0.26 4703 0.08 1.09 0.10 0.41Cocaine 0.11 4703 0.05 1.13 0.00 0.21Crack 0.06 4704 0.04 1.04 - 0.01 0.14Ecstasy 0.29 4703 0.09 1.17 0.11 0.47Heroin / Methadone 0.09 4703 0.05 1.16 - 0.01 0.19Tranquillisers 0.25 4704 0.07 0.91 0.12 0.38Volatile substances 0.00 4704 0.00 - 0.00 0.00No dependency 97.88 4703 0.25 1.19 97.39 98.37Dependent on cannabis only 1.37 4703 0.20 1.18 0.98 1.76Dependent on other drug with or
without cannabis dependency 0.75 4703 0.14 1.09 0.48 1.02Any drug dependence 2.12 4703 0.25 1.19 1.63 2.61
Men Cannabis 4.60 3838 0.39 1.15 3.84 5.36Amphetamines 0.51 3838 0.15 1.32 0.21 0.81Cocaine 0.37 3837 0.12 1.24 0.13 0.61Crack 0.15 3838 0.08 1.34 - 0.01 0.32Ecstasy 0.89 3837 0.20 1.30 0.51 1.28Heroin / Methadone 0.19 3838 0.09 1.28 0.01 0.36Tranquillisers 0.17 3838 0.07 1.09 0.03 0.31Volatile substances 0.01 3838 0.01 0.69 - 0.01 0.04No dependency 94.62 3838 0.42 1.15 93.80 95.44Dependent on cannabis only 3.68 3838 0.35 1.15 3.00 4.36Dependent on other drug with or
without cannabis dependency 1.70 3838 0.25 1.21 1.20 2.19Any drug dependence 5.38 3838 0.42 1.15 4.56 6.20
Table A.16 Standard errors and 95% confidence intervals for number of disorders by sex
Base Number of disorders % (p) (adj) Sample size True standard Deft 95% confidence intervalerror of p LL UL
All adults None 76.65 8580 0.58 1.27 75.51 77.791 19.33 8580 0.55 1.29 18.25 20.412 3.36 8580 0.22 1.16 2.92 3.803 0.66 8580 0.11 1.28 0.44 0.884 0.01 8580 0.01 0.82 -0.01 0.02
Women None 78.03 4728 0.78 1.30 76.50 79.561 19.45 4728 0.72 1.26 18.03 20.872 2.13 4728 0.23 1.12 1.67 2.593 0.39 4728 0.11 1.18 0.18 0.604 0.00 4728 0.00 . 0.00 0.00
Men None 75.27 3852 0.78 1.13 73.73 76.801 19.21 3852 0.73 1.16 17.77 20.652 4.58 3852 0.38 1.14 3.83 5.343 0.93 3852 0.20 1.28 0.54 1.314 0.02 3852 0.02 0.78 -0.02 0.05

148 Psychiatric Morbidity among Adults living in Private Households, 2000
Appendix B Estimating the prevalence of psychotic disorder
Estimating the prevalence of psychotic disorderAppendix
B
A two-stage approach was adopted to provide anassessment of psychotic disorder in the survey. Inthe first stage interviews, carried out by ONSinterviewers, screening questions were included toidentify people who might have a psychoticdisorder. The factors used to identify people whomight have a psychotic disorder had been found inthe 1993 survey of psychiatric morbidity amongprivate households and the 1997 survey ofpsychiatric morbidity among prisoners to be thebest predictors of the likelihood of receiving anassessment of psychotic disorder at a second stagesemi-structured clinical interview. These were:
• a self-reported diagnosis or symptoms (such asmood swings or hearing voices) indicative ofpsychotic disorder;
• receiving anti-psychotic medication;• a history of admission to a mental hospital; and• a positive answer to question 5a in the Psychosis
Screening Questionnaire which refers toauditory hallucinations.
The presence of any one of these criteria was sufficientfor a person to screen positive for psychosis.
Then a sub-sample of people were selected to takepart in a second stage interview carried out bypsychologists employed and supervised by theUniversity of Leicester, who received training andclinical experience with the SCAN interviewextending over a month. The people included in thesub-sample can be divided into 3 groups that wereselected using different sampling fractions as follows:
• all those who screened positive for psychoticdisorder;
• half of those who screened positive for antisocialor borderline personality disorder but notpsychosis; and
• 1 in 14 of those who screened positive for othertypes of personality disorder or screenednegative for both disorders.
The second stage interviews used the SCAN v2.1(Schedules for Clinical Interviews in
Neuropsychiatry), a semi-structured interviewwhich provides ICD-10 diagnoses of psychoticdisorder.
An assessment of the prevalence of psychoticdisorder could be obtained by simply weighting theresults from the sub-sample who had a second stageSCAN interviews to take account of varyingsampling fractions and non-response. However,there are problems with this approach:
1. The second stage sample design included aSCAN assessment of people who screenednegative for psychosis in the first stage interviewwhich allows some assessment of the prevalenceof psychotic disorder among this group who arelikely to be cases that are unknown to services.However, the bulk of the positive cases are likelyto be in the screen positive group and logisticregression analysis showed that the mostimportant predictor of a positive SCANassessment among the stage 2 sample was thepresence of one or more of the screeningcriteria, and that the odds of a positiveassessment increased dramatically the morecriteria were present. However, there were somepositive cases among those who screenednegative and because of the different samplingfractions used, these cases get a much higherweight than the majority of cases whichoccurred among the screen positives.
The effect of the wide range of weights is toproduce an estimate with a high coefficient ofvariation (the sampling error as a proportion ofthe estimate itself) with a very wide confidenceinterval around it, which is shown (estimate 1)in Table B1. Thus for all adults the prevalenceestimate is 1.1% with a 95% confidence intervalranging from 0.5% to 1.7% while for women theprevalence estimate is 1.6% with a 95%confidence interval ranging from 0.4% to 2.7%.Estimates which cover such a wide possiblerange are very difficult to use for policypurposes, eg for predicting the numbers ofpeople who might require services, or formonitoring trends over time.

149Psychiatric Morbidity among Adults living in Private Households, 2000
Appendix B Estimating the prevalence of psychotic disorder
2. The comparatively small size of the sub-samplewhich completed a 2nd stage interview limits theamount of additional analysis, such as co-occurrence of disorders and social andeconomic factors associated with disorders,which can be done using this second-stagesample only. Therefore there is a requirementfor some measure of probable/possible disorderfor the sample as a whole to be used for thesetypes of analysis and for the consideration ofvariations in prevalence of disorder amongdifferent sub-groups.
The results obtained from the second stageinterviews can be viewed as belonging to twogroups for whom the prevalence of psychoticdisorder can be obtained with different degrees ofprecision. The first group is people who screenpositive for psychotic disorder from which we haveSCAN assessments for all who agreed to a secondinterview. The prevalence of disorder iscomparatively high amongst this group and a highproportion were interviewed, so the confidenceinterval is relatively narrow as is shown in Table B1.The prevalence estimate for this group is 13.3%(95% CI 8.1%-18.6%) and the coefficient ofvariation (CV) is 20%.
The second group are those who screened negativefor psychotic disorder. Among this group psychoticdisorder is likely to be extremely rare and, sinceonly a small proportion could be included in thesecond stage of the survey, any estimate of theprevalence among this group will be extremelyimprecise. The sample of screen negatives takenwas small and alternative random samples ofscreen negatives would quite possibly have givenvery different estimates. The prevalence estimateobtained for this group is 0.6% (95% CI 0.0%-1.2%), which is very much lower than in the screenpositive group but is much less precise having a CVof 47%, double that of the screen positive estimate.In this sample all the false negatives on thepsychosis screen were found among women – a factwhich is reflected in the wide confidence intervalsaround the estimate for women shown in estimate1 in table B1. This might be due to true differencesin prevalence between men and women, differencesin responses to the screening questions, differencesin the way the SCAN interviewers interpretedsymptoms between men and women or a chancefinding resulting from the sampling for the second
stage. There was no difference between men andwomen in the proportion screening positive forpsychosis. However, women were more likely thanmen to receive a positive SCAN assessment whenother factors, such as the presence of differentscreening criteria, were controlled for and itappeared that the psychosis screen worked betterfor men than for women. Comparison between thedetailed responses in the SCAN interviews for thefalse negative cases and other positive cases showedno apparent differences, except that the screennegatives were not receiving services and did notshow evidence of significant disability or distress. Itmay be that men with psychotic disorder are morelikely than women to be known to services andreceiving treatment, but the difference between themen and women shown in estimate 1 is notstatistically significant indicating that it could justbe an artefact of the particular sample selected inthe survey.
The finding of some screen negatives does suggestthat a prevalence rate based solely on screenpositives (estimate 2) is likely to be anunderestimate. However, in view of the wideconfidence interval, it is also quite possible thatestimate 1, which includes the screen negatives,may be itself a substantial overestimate. Therefore,it was decided that it would not be useful to use theprevalence estimate which includes the SCAN datafrom screen negatives in the report because of theimprecision and uncertainty associated with it. It isrecognised that any estimate that does not takeaccount of false negatives on the screen will be anunderestimate, but the extent of that underestimateand the importance of it is uncertain. However, theestimate adopted is more stable and therefore moreuse for policy analysis and monitoring trends.
The problem of obtaining an assessment ofpsychotic disorder for those people who siftedpositive for psychosis but did not have a SCANinterview because they refused a second interviewor could not be contacted at that time was dealtwith slightly differently in the earlier 1993 survey ofadults in private households and the 1997 survey ofprisoners. In both cases the relationship betweenthe initial interview data and the SCAN assessmentdata for those who completed both stages wasconsidered to identify factors indicative of likelypsychotic disorder. In 1993, those takingantipsychotic medication and who reported that

150 Psychiatric Morbidity among Adults living in Private Households, 2000
Appendix B Estimating the prevalence of psychotic disorder
they had a psychotic illness or that their doctor toldthem they had such an illness were considered ashaving a functional psychosis. In the survey ofprisoners there was some additional informationavailable and it was found that the presence of anytwo of the sift criteria described above was a betterindicator of probable psychosis. In this survey data,there continued to be a good relationship betweenthe screening criteria and the likelihood of apositive SCAN assessment and it was decided to usethe same approach as adopted in the 1997 prisonsurvey for providing an assessment of probablepsychosis for those people who sifted positive forpsychosis but did not complete a SCAN interview.
In summary, the assessment of probable psychosisused in this survey was obtained for individualrespondents as follows:
• For those who sifted positive for psychosis andundertook a SCAN interview, the SCANassessment was used.
Table B1 Alternative estimates of psychosis prevalence
Assessment based on .... Sample Prevalence 95% CI* Sampling CV**size Estimate LL UL Error
1. SCAN interviews only - including screen negatives Men 272 0.65 0.32 0.98 0.17 26%Women 351 1.57 0.41 2.73 0.59 37%All adults 623 1.11 0.52 1.70 0.30 27%People who screened positive 203 13.31 8.06 18.56 2.68 20%People who screened negative 420 0.63 0.04 1.22 0.30 47%
2. SCAN or prisons algorithm for screen positives Men 3852 0.57 0.35 0.79 0.11 19%(screen negatives assumed negative) Women 4728 0.49 0.31 0.67 0.09 20%
All adults 8580 0.53 0.37 0.69 0.08 15%
* 95% confidence Interval; LL = lower limit, UL = upper limit.** Coefficient of Variation = Sampling Error/Estimate.
• For those who sifted positive for psychosis butdid not complete a SCAN interview, anassessment based on whether or not theyreported two or more of the screening criteria atthe initial interview was applied.
• All those who screened negative for psychosis atthe initial interview were designated psychosisnegative regardless of whether or not they hadundertaken a SCAN interview.
The prevalence estimates obtained in this way areshown as estimate 2 in Table B1 and were usedthroughout the survey report.

Glossary of survey definitions and terms
Glossary of survey definitions and termsGlossary
Adults
In this survey adults were defined as persons aged16 and over and less than 75.
Alcohol dependence
Alcohol misuse was measured using two differentinstruments. First the Alcohol Use DisordersIdentification Test (AUDIT) was used to assesshazardous drinking (see below). Then those whoscored 10 or above on the AUDIT were also askedthe Severity of Alcohol Dependence Questionnaire(SAD-Q). People who scored 4 or more on theSAD-Q were considered to be dependent on alcohol.
Analgesic, hypnotic and anxiolytic medication
Analgesics are drugs for relieving pain, whilehypnotic and anxiolytics are drugs used fortreating sleep problems and for reducing anxiety.
Depot injections
When antipsychotic medication is given byinjections on a monthly basis, these are sometimestermed depot injections.
Drug dependence
In the year prior to interview drug dependence wasmeasured by asking all those who had used drugsin the past year a series of five questions. Thesecovered: daily use of the drug for two weeks ormore; feelings of dependence; inability to cutdown; need for increasing quantities; withdrawalsymptoms. One positive response to any of thesequestions was considered to be evidence of drugdependence.
Drugs used in psychoses etc
Drugs used in psychoses and related conditionsinclude antipsychotic drugs, including depotinjections. These are also known as ‘neuroleptics’.In the short term they are used to quietendisturbed patients whatever the underlyingpsychopathology. See depot injections. Also
included in this group are antimanic drugs whichare used in mania to control acute attacks andprevent their recurrence.
Economic activity
Economically active persons are those over theminimum school-leaving age who were working orunemployed in the week before the week ofinterview. These persons constitute the labour force.
Working personsThis category includes persons aged 16 and overwho, in the week before the week of interview,worked for wages, salary or other form of cashpayment such as commission or tips, for anynumber of hours. It covers persons absent fromwork in the reference week because of holiday,sickness, strike or temporary lay-off, provided theyhad a job to return to with the same employer. Italso includes persons attending an educationalestablishment during the specified week if theywere paid by their employer while attending it,people who worked in Government trainingschemes and unpaid family workers.
Persons are excluded if they have worked in avoluntary capacity for expenses only, or only forpayment in kind, unless they worked for a business,firm or professional practice owned by a relative.Full-time students are classified as ‘working’,‘unemployed’ or ‘inactive’ according to their ownreports of what they were doing during thereference week.
Unemployed personsThis survey used the International LabourOrganisation (ILO) definition of unemployment.This classifies anyone as unemployed if he or shewas out of work in the four weeks beforeinterview, or would have been but for temporarysickness or injury, and was available to start workin the two weeks after the interview. Otherwise,anyone out of work is classified as economicallyinactive.
The treatment of all categories on this survey is inline with that used in the Labour Force Survey (LFS)
151Psychiactric Morbidity among Adults living in Private Households, 2000

152
Glossary of survey definitions and terms
Educational level
Educational level was based on the highesteducational qualification obtained and wasgrouped as follows:
Degree or higher degreeNVQ Level 5
Teaching qualificationHNC/HNDBEC/TEC HigherBTEC/SCOTVEC HigherCity and GuildsFull Technological CertificateNursing Qualifications (SRN, SCM, RGN,RM, RHV, Midwife)NVQ Level 4
GCE A levels and AS levelsSCE HigherONC/OND/BTEC/TEC/BTEC not higherCity and Guilds Advanced/Final LevelGNVQ (Advanced Level)NVQ Level 3
GCE O level passes (Grade A-C if after 1975)GCSE (Grades A-C)CSE Grade 1SCE Ordinary (Bands A-C)Standard Grade (Level 1-3)School Certificate or MatricCity and Guilds Craft/Ordinary LevelGNVQ (Intermediate level)NVQ Level 2
CSE Grades 2-5GCE O level Grades D & E after 1975GCSE (Grades D,E,F,G)SCE Ordinary (Bands D & E)Standard Grade (Level 4,5)Clerical or Commercial qualificationsApprenticeshipsNVQ Level 1 and GNVQ (Foundation Level)
CSE ungradedNo formal qualifications
Ethnicity
Household members were classified into ninegroups by the person selected for interview. For
Psychiatric Morbidity among Adults living in Private Households, 2000
analysis purpose these nine groups were subsumedunder 4 headings: White, Black, South Asian andOther.
White White
Black - CaribbeanBlack - African BlackBlack - Other
IndianPakistani South AsianBangladeshi
ChineseOther
Other
Family Unit
In order to classify the relationships of the subjectto other members of the households, the householdmembers were divided into family units.
Subjects were assigned to a family unit dependingon whether they were or had ever been married,and whether they (or their partners) had anychildren living with them.
A ‘child’ was defined for family unit purposes as anadult who lives with one or two parents, providedhe or she has never been married and has no childof his or her own in the household.
For example, a household containing three women,a grandmother, a mother and a child would containtwo family units with the mother and child beingin one unit, and the grandmother being in another.Hence family units can consist of:
- A married or cohabiting couple or a lone parentwith their children
- Other married or cohabiting couples- An adult who has previously been married. If the
adult is now living with parents, the parents aretreated as being in a separate family unit.
- An adult who does not live with either a spouse,partner, child or parent. This can include adultswho live with siblings or with other unrelatedpeople, eg flatmates.
}}}

Glossary of survey definitions and terms
Family unit type
Each informant’s family unit was classified into oneof six family unit types:
‘Couple no children’ included a married cohabitingcouple without children.
‘Couple with child’ comprised a married orcohabiting couple with at least one child from theirliaison or any previous relationship.
‘Lone parent’ describes both men and women (whomay be single, widowed, divorced or separated)living with at least one child. The subject in thiscase could be a divorced man looking after his 12year-old son or a 55-year-old widow looking after a35-year-old daughter who had never married andhad no children of her own.
‘One person’ describes the family unit type and doesnot necessarily mean living alone. It includes peopleliving alone but includes one person living with asister, or the grandmother who is living with herdaughter and her family. It also includes adults livingwith unrelated people in shared houses, e.g. flatmates.
‘Adult living with parents’ describes a family unitwhich has the same members as ‘couple with child’but in this case it is the adult son or daughter whois the subject. It includes a 20 year old unmarriedstudent living at home with married or cohabitingparents, and a 62 year old single woman caring forher elderly parents.
‘Adult living with one parent’ covers the samesituations as above except there is one and not twoparents in the household.
Hazardous alcohol use
Hazardous alcohol use is a pattern of drinkingcarrying with it a high risk of damage to health inthe future. The prevalence of alcohol misuse in theprevious year was assessed using the Alcohol UseDisorders Identification Test (AUDIT) at the initialinterview. An AUDIT score of eight or aboveindicates hazardous alcohol use.
Household
The standard definition used in most surveyscarried out by ONS Social Survey Division, and
comparable with the 1991 Census definition of ahousehold, was used in this survey. A household isdefined as single person or group of people who havethe accommodation as their only or main residenceand who either share one meal a day or share theliving accommodation. (See E McCrossan AHandbook for interviewers. HMSO: London 1991)
Intellectual functioning
Three tests were included in the survey to measuredifferent aspects of intellectual functioning. Allparticipants completed the National Adult ReadingTest (NART), a measure of crystallised intelligence,reflecting the extent of intellectual development byadulthood. Scores on the NART have then beenconverted into predicted verbal IQ scores on theWAIS-R using the algorithm recommended by thedevelopers of the NART.
Those aged 60 and over also completed two testslikely to be sensitive to cognitive decline associatedwith ageing or dementia. The modified TelephoneInterview for Cognitive Screening (TICS-m) wasdeveloped as a brief screening test for dementia.Those scoring below a cut-point have a highprobability of significant cognitive impairment,and of meeting criteria for a clinical diagnosis ofdementia. The animal naming test assesses verbalfluency, in this case the number of differentanimals a participant can name in one minute.
Locality
Interviewers coded their opinion of whether thesampled address was in urban, semi-rural or ruralarea.
Marital Status
Informants were categorised according to theirown perception of marital status. Married andcohabiting took priority over other categories.Cohabiting included anyone living together withtheir partner as a couple.
Neurotic disorders, depression or anxietydisorders
These are characterised by a variety of symptomssuch as fatigue and sleep problems, forgetfulnessand concentration difficulties, irritability, worry,panic, hopelessness, and obsessions and
153Psychiactric Morbidity among Adults living in Private Households, 2000

154
Glossary of survey definitions and terms
compulsions, which are present to such a degreethat they cause problems with daily activities anddistress. The prevalence of neurotic symptoms inthe week prior to interview was assessed using therevised version of the Clinical Interview Schedule(CIS-R). A score of 12 or more indicates thepresence of significant neurotic symptoms while ascore of 18 or more indicates symptoms of a levellikely to require treatment.
Psychiatric Morbidity
The expression psychiatric morbidity refers to thedegree or extent of the prevalence of mental healthproblems within a defined area.
Psychoses
These are disorders that produce disturbances inthinking and perception that are severe enough todistort the person’s perception of the world and therelationship of events within it. Psychoses arenormally divided into two groups: organicpsychoses, such as dementia and Alzheimer’sdisease, and functional psychoses, which mainlycover schizophrenia and manic depression.
Region
When the survey was carried out there were 8 NHSRegional Office Areas in England. These were thebasis for stratified sampling and have been retainedfor purposes of analysis. Scotland and Wales weretreated as two distinct areas.
Social Class
Based on the Registrars General’s 1991 StandardOccupational Classification, Volume 3 OPCS,HMSO: London social class was ascribed on thebasis of the informants own occupation. If theinformant was unemployed or economically
Psychiatric Morbidity among Adults living in Private Households, 2000
inactive at the time of interview but had previouslyworked, social class was based on the most recentprevious occupation.
The classification used in the tables are as follows:
Descriptive Definition Social Class
Professional IIntermediate occupations IISkilled occupations – non-manual III NMSkilled occupation – manual III MPartly-skilled IVUnskilled occupations VArmed Forces
Social class was not determined where the subjecthad never worked, or if the subject was a full-timestudent or where occupation was inadequatelydescribed.
Tenure
Four tenure categories were created:
‘Owned outright’ means bought without amortgage or loan or with a mortgage or loan whichhas been paid off.
‘Owned with mortgage’ includes co-ownership andshared ownership schemes.
‘Rent from LA/HA’ means rented from localauthorities, New Town corporations orcommissions or Scottish Homes, and housingassociations which include co-operatives andproperty owned by charitable trusts.
‘Rent from other source’ includes rent fromorganisations (property company, employer orother organisation) and from individuals (relative,friend, employer or other individual).

Psychiatric Morbidityamong Adults living inPrivate Households,2000: Summary Report
London: Office for National Statistics
Nicola SingletonRobert BumpsteadMaureen O’BrienAlison LeeHoward Meltzer
The report of a surveycarried out by SocialSurvey Division of theOffice for NationalStatistics on behalf ofthe Department ofHealth, the ScottishExecutive and theNational Assembly forWales

ContentsPage
Notes to tables and figures iv
1 Aims, concepts and methods 1Background 1Aims of the survey 1Topics covered 1Sample design 2
2 Prevalence of mental disorders and substance misuse 2Neurotic symptoms and disorders 2Personality disorder 3Psychotic disorder 4Alcohol misuse and dependence 4Drug use and dependence 5
3 Trends in prevalence of mental disorders and substance misuse 6
4 Characteristics of adults with psychiatric disorders 7Neurotic disorders 7Psychotic disorder 8Alcohol misuse and dependence 8Drug dependence 9
5 Treatment and service use 9
References 11
iii

iv
Notes to tables and figures
1 The percentages may not add to 100 because ofrounding
2 The percentages shown in the tables and figuresare those found among the respondents to thesurvey. However, where the bases (sample sizes)are quite small, the sampling error associatedwith these estimates will be quite large and couldresult in the appearance of differences betweengroups that are not present in the wholepopulation. Sampling errors were calculated forall the data presented in the report and thesewere used to test apparent differences betweengroups for statistical significance. All differencesmentioned in the text have been found to bestatistically significant at the 95% confidencelevel.

1
Psychiatric Morbidity among Adults living in Private Households, 2000: Summary Report
1. Aims, concepts and methods
Background
This survey of psychiatric morbidity among adultsin private households was carried out in 2000 by theOffice for National Statistics on behalf of theDepartment of Health, the Scottish Executive andthe National Assembly for Wales. It is part of a seriesof such surveys among different population groupsand is a repeat of the first survey in the series whichwas carried out in 1993 (Meltzer et al, 1995).
Aims of the survey
The main aim of the survey was to estimate theprevalence of psychiatric morbidity according todiagnostic category among the adult householdpopulation of Great Britain. The disorders coveredin the survey were neurotic disorders, such asanxiety and depression, psychotic disorder, alcoholand drug dependence, which were covered in thefirst survey in 1993. In the 2000 survey, personalitydisorder was assessed for the first time.
The second aim was to examine the varying use ofservices and receipt of care in relation to mentaldisorder and to identify the nature and extent ofdisability associated with mental disorder. Thirdly,the survey aimed to examine key current andlifetime factors which may be associated with mentaldisorder and, finally, to provide information on
changes in the prevalence of disorder and relatedfactors between 1993 and 2000.
Topics covered
Topics covered in the survey included:• assessments of neurotic symptoms and
disorders, psychoses, personality disorder, andsubstance misuse and dependence;
• general health and service use;• intellectual functioning;• suicidal thoughts and attempts and stressful life
events;• social networks and social support;• activities of daily living and the need for
informal care; and• socio-demographic and general background
data including employment, finances andaccommodation.
The instruments used to assess mental disorders inthe survey are shown in Table 1.1. A two-stageapproach to the assessment of disorder was used.Initial structured interviews were carried out byONS interviewers and lasted on average one and ahalf hours. These covered all the topics listed above.A sub-sample of people were also asked to take partin a second-stage, semi-structured, clinicalinterview, carried out by interviewers employedand supervised by the University of Leicester, whichfocussed on psychosis and personality disorder.(Table 1.1)
Table 1.1 Instruments used to assess mental disorder in the survey
Topic Lay/clinical Assessment instrument Referenceinterview
Personality Clinical interview Structured Clinical Interview for DSM-IV (SCID-II) First et al (1997)disorder
Psychotic Clinical and lay Schedules for Clinical Assessment in Neuropsychiatry (SCAN) World Health Oroganisationdisorder interview (version 2.1) and algorithm using lay interview data for non-responders (1999)
Neurotic Lay interview Clinical Interview Schedule – Revised (CIS-R) Lewis and Pelosi (1990);disorder Lewis et al (1992)
Alcohol Lay interview Alcohol Use Disorders Identification Test (AUDIT); Severity of Alcohol Babor et al (1992);misuse Dependence Questionnaire (SAD-Q) Stockwell et al (1983)
Drug dependence Lay interview Five questions taken from the ECA study and used in other ONS Robins and Regier (1991)(OPCS) psychiatric morbidity surveys

2
Psychiatric Morbidity among Adults living in Private Households, 2000: Summary Report
This report summarises, in Section 2, the keyfindings relating to the prevalence of the fivedisorders mentioned above. Section 3 examineschanges, between 1993 and 2000, in theprevalence of the disorders for which comparableassessment approaches were used in both surveys.Section 4 looks at the characteristics of peoplewith and without neurotic disorder, probablepsychosis, alcohol problems and drugdependence, while Section 5 considers theirtreatment and service use. People with personalitydisorder were not included in these last twosections because assessments of personalitydisorder were only available on the small sub-sample who had a clinical interview. A later reportwill consider the findings relating to personalitydisorder in more detail.
As this is a summary report, figures and tables areshown in support of some, but not all, of the dataprovided in the text. The full set of tables isavailable in the main report of the survey(Singleton et al, 2001).
Sample design
The survey covered people aged 16 to 74 yearsliving in private households in England, Walesand Scotland (including the Highlands andIslands).
The sample was drawn from the small-userPostcode Address File using a two stage approach.Initially postcode sectors were stratified on thebasis of socio-economic status within region and438 sectors selected with a probabilityproportional to size. Then, within each selectedsector, 36 addresses were randomly selected forinclusion in the survey. Interviewers visited eachaddress to identify private households with atleast one person aged 16 to 74 years and then oneperson per household was randomly selected forinterview.
Fieldwork took place between March andSeptember 2000. Initial interviews were completedwith over 8,800 individuals, a response rate of justunder 70%. The response rate at the second stagewas 73% with over 600 clinical interviews beingcompleted. (Table 1.2)
2. Prevalence of mental disorders andsubstance misuse
Neurotic symptoms and disorders
The most commonly reported neurotic symptomsamong both men and women were sleep problems,fatigue, irritability and worry (not including worryabout physical health). The proportions of alladults experiencing these symptoms ranged from29% for sleep problems to 19% for worry. The nextmost frequently occurring symptoms weredepression, poor concentration and forgetfulness,depressive ideas and anxiety, reported by about10% of respondents. The symptom with the lowestprevalence was panic (2%). (Table 2.1)
About 1 in 6 adults were assessed as having aneurotic disorder in the week before interview (164cases per 1,000 adults). The most prevalent neuroticdisorder among the population as a whole wasmixed anxiety and depressive disorder (88 cases per1,000). Generalised anxiety disorder was next mostcommonly found (44 adults per 1,000). Theremaining disorders (depressive episode, phobias,obsessive-compulsive disorder and panic) were lessprevalent, ranging from 26 to 7 cases per 1,000.
Prevalence rates were higher among women thanmen for all neurotic disorders except panic (7cases per 1,000 for both men and women). Thedisparity between the rates for women and menwas significant for phobias (22 and 13 cases per1,000 respectively) and mixed anxiety anddepressive disorder (108 and 68 cases per 1,000).(Figure 2.1)
Table 1.2 Response to the survey
Number %
Initial interview stageSet sample of households 12,792 100Refusals 3,009 24Non-contacts 782 6Incapable 115 1Co-operating adults 8,886 69
Second stage interviewsSet sample for second stage 874 100Refusals/non-contacts 236 27Interviews completed 638 73

3
Psychiatric Morbidity among Adults living in Private Households, 2000: Summary Report
The lowest prevalence rates of any neuroticdisorder were found among older people. Theprevalence among those aged 65 to 69 was 102cases per 1,000 and among those aged 70 to 74 was94 cases per 1,000.
The highest prevalence rates for any neuroticdisorder, around 200 cases per 1,000, occurred inthe three groups aged between 40 and 54. For menthe prevalence of any neurotic disorder peaked inthe 45 to 49 age group at 204 cases per 1,000. Thehighest prevalence rate for any neurotic disorderamong women was found in the 50 to 54 age group(246 cases per 1,000). (Figure 2.2)
Personality disorder
Personality disorder was assessed on the basis ofthe second-stage SCID-II clinical interviews.Overall, about 1 in 25 adults were assessed ashaving a personality disorder of some kind, 44 per1,000. The prevalence was slightly higher among
Table 2.1 Proportion of adults with a score of two ormore on each CIS-R symptom
by sex
Women Men All adults
Percentage of adults with a score of 2 or more on each symptom
Sleep Problems 34 24 29Fatigue 32 23 27Irritability 22 18 20Worry 21 17 19Depression 12 10 11Concentration and forgetfulness 11 9 10Depressive ideas 11 8 9Anxiety 9 8 9Somatic symptoms 8 5 7Worry-Physical health 7 7 7Obsessions 7 4 6Phobias 6 3 5Compulsions 4 2 3Panic 2 2 2
Base 4728 3852 8580
Mixed anxietyand depressive
disorder
Generalisedanxietydisorder
Depressiveepisode
All Phobias Obsessivecompulsive
disorder
Panic disorder Any neuroticdisorder
0
50
100
150
200
250
Pre
vale
nce
per
thou
sand
pop
ulat
ion
Neurotic disorders
Women Men All
Figure 2.1 Prevalence of neurotic disorders in the week before interview by sex

4
Psychiatric Morbidity among Adults living in Private Households, 2000: Summary Report
men than women: 54 per 1,000 men and 34 per1,000 women were assessed as having a personalitydisorder. The most prevalent type of personalitydisorder was obsessive compulsive personalitydisorder, which had a prevalence of 19 per 1,000adults. Avoidant, schizoid, paranoid, borderline andantisocial personality disorders each had aprevalence of less than 1% (ranging from 8 to 6 per1,000 adults). Other types of personality disorderwere very rare or not encountered at all. (Table 2.2)
Table 2.2 Prevalence of personality disorder fromclinical interviews
by sex
Women Men All
Rates per thousandType of personality disorderObsessive-Compulsive 13 26 19Avoidant 7 10 8Schizoid 8 9 8Paranoid 3 12 7Borderline 4 10 7Antisocial 2 10 6Dependent 0 2 1Schizotypal 1 0 1Histrionic - - -Narcissistic - - -
Any personality disorder 34 54 44
Base 355 271 626
Psychotic disorder
All people who had one or more indications ofpossible psychosis at the initial interview wereselected for a second stage clinical interview usingSCAN (Schedule for Clinical Assessment inNeuropsychiatry). An assessment of probablepsychotic disorder was given to those people who:
(a) sifted positive for psychosis and were assessed ashaving a psychotic disorder in the SCAN ininterviews; or
(b) if no second interview was carried out, topeople who had two or more indications ofpsychosis at the first interview.
The prevalence rate for probable psychotic disorderin the past year was 5 per 1,000 adults aged 16 to74. The rate among women was 5 per 1,000 andamong men, 6 per 1,000.
Alcohol misuse and dependence
One quarter of informants were assessed as havinga hazardous pattern of drinking during the yearbefore interview using the Alcohol Use DisorderIdentification Test (AUDIT) (i.e. they had anAUDIT score of 8 or above). The prevalence ofhazardous drinking was higher among men (38%)than among women (15%).
Prevalence of hazardous drinking decreasedmarkedly with increasing age, though there were
16–19 20–24 25–29 30–34 35–39 40–44 45–49 50–54 55–59 60–64 65–69 70–740
50
100
150
200
250
300
Pre
vale
nce
per
thou
sand
pop
ulat
ion
Age group
Women Men All
Figure 2.2 Prevalence of any neurotic disorder in the week before interview by age and sex

5
Psychiatric Morbidity among Adults living in Private Households, 2000: Summary Report
differences between sexes. For women, prevalencewas highest in the group aged from 16 to 19 years(32%), whereas for men the peak was found amongthose aged 20 to 24 (62%). (Figure 2.3)
The prevalence of alcohol dependence in the 6months before interview was assessed using theSeverity of Alcohol Dependence questionnaire(SAD-Q). The prevalence of alcohol dependence was74 per 1,000 among the overall population, 119 per1,000 among men and 29 per 1,000 among women.
Drug use and dependence
Overall, 13% of men and 8% of women aged 16 to74 reported using illegal drugs in the year prior to
interview. Cannabis was the drug mentioned mostcommonly by both men and women (10% overall),while amphetamines, cocaine and ecstasy were thenext most frequently mentioned by both groups(2% overall, for each drug).
Prevalence of illicit drug use decreased markedlywith increasing age. Prevalence of any illegal druguse in the year prior to interview was highest in the20 to 24 year age groups, both for men (37%) andwomen (29%). Drug use in the past year declinedmarkedly between the ages of 25 and 40, withprevalence roughly halving in each successive five-year age group. Beyond the age of 45 theproportion of adults who reported drug use in theprevious year tailed off to between 2% and 1%.(Table 2.3)
Table 2.3 Any illicit drug use in the year before interview
by age and sex
Age
All16–19 20–24 25–29 30–34 35–39 40–44 45–49 50–54 55–59 60–64 65–69 70–74 ages
Percentage reporting use in the past year
Women 22 29 15 9 7 3 3 1 2 1 1 1 8Men 32 37 34 18 9 7 6 3 2 1 1 1 13All adults 28 33 25 13 8 5 4 2 2 1 1 1 11
BaseWomen 151 258 396 572 563 457 363 435 387 403 367 352 4704Men 183 200 332 378 441 381 358 387 314 331 294 239 3838All adults 334 458 728 950 1004 838 721 822 701 734 661 591 8542
16–19 20–24 25–29 30–34 35–39 40–44 45–49 50–54 55–59 60–64 65–69 70–74 All0
10
20
30
40
50
60
70
Per
cent
age
Age group
Women Men All
Figure 2.3 Prevalence of hazardous drinking in the year before interview by age and sex

6
Psychiatric Morbidity among Adults living in Private Households, 2000: Summary Report
The London region stood out as the region withthe highest proportion of people reporting use ofillegal drugs in the previous year. The prevalenceof illegal drug use was 16% in London, comparedwith 11% in Great Britain as a whole. Amongwomen the prevalence of illegal drug use in thepast year was almost double the national average(15% compared with 8%), while among men thedifference was smaller (18% compared with 13%).(Figure 2.4).
For eight of the main drug types used (cannabis,amphetamines, crack, cocaine, ecstasy, opiates,tranquillisers and volatile substances, eg glue), aseries of five questions was asked to measuredrug dependence. A positive response to any ofthe five questions was used to indicate drugdependence; quite a low threshold. Thus peoplewho were habitual users (i.e. daily use for afortnight or more) or who had developed sometolerance to the drug, so require more to get thesame affect, were assessed as dependent.Amongst all respondents, the prevalence ofdependence on any of the drugs considered herewas 3.7%: that is to say, there were 37 cases ofdrug dependence per 1,000 in the populationaged 16 to 74.
As with the prevalence of drug use, the highestprevalence rates of any drug dependence werefound among those between 20 and 24 years of
age. Within this group nearly one in ten womenand two in ten men were assessed as drugdependent (94 and 199 cases per 1,000,respectively).
3. Trends in prevalence of mentaldisorders and substance misuse
The 2000 psychiatric morbidity survey is a repeatof a survey carried out in 1993 (Meltzer et al,1995). Both surveys were conducted among adultsliving in private households in Great Britain andused a similar sampling approach and covered asimilar range of disorders. However, there weresome changes in survey methods and coveragebetween the two. In 2000, the upper age limit forrespondents was extended from 64 to 74.Therefore, to permit comparison, only data relatingto those adults aged 16 to 64 in the 2000 survey areconsidered in this section.
The proportions of all adults aged 16 to 64experiencing various neurotic symptoms in 2000were similar to those found in 1993. There was nosignificant change in the overall rates for anyneurotic disorder for all adults: in 1993 theproportion of adults with at least one neuroticdisorder was 16% or 163 per 1,000, while in 2000 theproportion was 17% (173 per 1,000). However, therewas a slight but significant increase in the prevalence
London NorthWest
Eastern SouthEast
SouthWest
Northernand
Yorkshire
Trent WestMidlands
England Wales Scotland GreatBritain
0
2
4
6
8
10
12
14
16
18
20
Per
cent
age
NHS Regional Office area
Women Men
Figure 2.4 Prevalence of illicit drug use in the past year by region and sex

7
Psychiatric Morbidity among Adults living in Private Households, 2000: Summary Report
of any neurotic disorder among men, from 126 per1,000 in 1993 to 144 per 1,000 in 2000. (Figure 3.1)
The overall prevalence of psychotic disorder wasthe same in 1993 and 2000: 4 cases per 1,000 adultsaged 16 to 64 years.
In 1993 indications of any illicit drug dependencewere identified in 2% of the population. In 2000prevalence was considerably higher, drugdependence being identified in 4% of adults aged16 to 64. Both the proportions of men and womenexhibiting signs of drug dependence approximatelydoubled over the seven-year period, rising to 6%among men and 2% among women. This increaseroughly parallels the reported increase in drug useobserved between the 1993 and 2000 surveys.
4. Characteristics of adults withmental disorders
Neurotic disorders
Compared with people with no neurotic disorder,those assessed as having a neurotic disorder weremore likely to be:• women (59% compared with 48% of those
without a disorder);
• aged between 35 and 54 (45% compared with38%);
• separated or divorced (14% compared with7%); and
• living as a one person family unit (20%compared with 16%) or as a lone parent (9%compared with 4%).
Among those with neurotic disorders, 58% wereemployed and 39% were economically inactive,compared with 69% of those with no disorder whowere employed and 28% who were economicallyinactive. The proportion of unemployed wassimilar for both groups.
Having a neurotic disorder substantially increasedthe likelihood of reporting one or more physicalcomplaints. There was a clear relationship betweenthe number of neurotic disorders present and thereporting of a physical complaint. Just under twofifths of adults with no neurotic disorder (38%)reported having a physical complaint. This rose toover half (57%) of those with one neurotic disorderwhile among those with two or more neuroticdisorders, two thirds (67%) reported at least onephysical complaint. (Figure 4.1)
Women Men All adults0
50
100
150
200
250
Rat
e pe
r th
ousa
nd in
the
past
wee
k
1993 2000
Figure 3.1 Change in the prevalence ofneurotic disorder between 1993 and 2000(people aged 16 to 64 only)
None One 2 or more0
10
20
30
40
50
60
70
80
Per
cent
age
Number of neurotic disorders
Women Men All adults
Figure 4.1 Prevalence of self-reportedlongstanding physical complaints by numberof neurotic disorders present in the past weekand sex

8
Psychiatric Morbidity among Adults living in Private Households, 2000: Summary Report
Psychotic disorder
Compared with people who did not have apsychotic disorder those with a probable psychosiswere more likely to:• be separated or divorced (29% compared to
8% of those without disorder);• living in a one person family unit (43%
compared with 16%)• have low educational qualifications (84% had
qualifications no higher than GCSE levelcompared with 63% of those with nopsychotic disorder);
• be in Social Class IV or V (39% comparedwith 22%);
• be economically inactive (70% compared with30%);
• to live in accommodation rented from a localauthority or housing association (49%compared to 17% of those without psychoticdisorder); and
• to live in an urban area (88% compared with66%). (Figure 4.2)
People assessed as probably having a psychoticdisorder were also more likely than those withoutto report a longstanding physical health problem.Overall, 62% of those with probable psychosis
reported a physical complaint compared with only42% of those without this disorder.
Alcohol misuse and dependence
Men reported greater alcohol consumption thanwomen and as a result men made up two thirds ofthose with hazardous levels of alcoholconsumption (67%) and four-fifths (80%) of thosedependent on alcohol, compared with only 43% ofthose with no alcohol problem.
There was a clear inverse relationship between levelof alcohol problems and the age of the respondent.Among respondents who were dependent onalcohol, 29% were aged under 25, compared with21% of those with a hazardous pattern of drinkingbut no dependence and 12% of those with nopattern of hazardous alcohol use. (Figure 4.3)
Among those judged to be dependent on alcohol,fewer than half (45%) were married or cohabiting,compared with 60% of those with hazardous butnon-dependent levels of alcohol consumption and69% of those whose level of consumption was nothazardous. (This is likely to be linked to therelationship between age and level of alcoholconsumption described in section 2).
Separated ordivorced
One personfamily unit
Qualificationsof GCSEor below
Economicallyinactive
Renting from LAor HousingAssociation
Living inurban area
0
10
20
30
40
50
60
70
80
90
100
Per
cent
age
No psychotic disorder Probable psychotic disorder
Figure 4.2 Characteristics of people with and without probable psychotic disorder in the yearbefore interview

9
Psychiatric Morbidity among Adults living in Private Households, 2000: Summary Report
Drug dependence
Those dependent on drugs had a much youngerage profile than those not dependent – 46% ofthose with signs of dependence on cannabis onlyand 54% of those dependent on other drugs wereaged under 25, compared with only 14% of adultswho were not drug dependent. They were alsomore likely to be single, 57% of those assessed asdependent on cannabis and 65% of thosedependent on other drugs, compared with 21% ofthose not dependent on drugs. This would beexpected given the younger age profile of thosedependent on drugs.
Those dependent on drugs were more likely to beunemployed than people with no drugdependence, 11% of people with signs of cannabisdependence and 10% of those dependent on otherdrugs were unemployed, compared with 3% ofthose not dependent on drugs.
5. Treatment and service use
Just under a quarter (24%) of people assessed ashaving one or more neurotic disorders in the pastweek were receiving treatment of some kind for amental or emotional problem at the time ofinterview. A fifth (20%) were taking psychoactivemedication, while 9% were having counselling ortherapy. A small proportion, 4%, were receivingboth forms of treatment.
The proportion receiving treatment rose with thenumber of neurotic disorders present. Amongpeople with no neurotic disorder, 4% werereceiving treatment, compared with just under afifth (19%) of those with one neurotic disorder,and over half (54%) of those with two or moredisorders. The proportion of respondents receivingpsychoactive medication increased substantiallywith the number of disorders present, from 3%among people without neurotic disorder to 16% ofthose with one and 47% of those with two or moredisorders. (Figure 5.1)
Almost two-fifths of those with neurotic disorders(39%) had spoken to their GP about a mental oremotional problem in the year before interview,compared with 6% of those without a neuroticdisorder.
Among respondents assessed as having a neuroticdisorder, 16% had used one or more of thecommunity care services in the last year, comparedwith 4% of those with no neurotic disorder. In thethree months before interview, 8% of those with aneurotic disorder had used community care services,compared with 2% of those with no disorder.
Eighty-five per cent of those with a probablepsychotic disorder were having treatment at the timeof interview, compared with only 7% of those withno psychotic disorder. Over four-fifths of this group(84%) were receiving medication compared with 6%
No hazardous drinking Hazardous drinkingnot dependent
Alcohol dependent0
10
20
30
40
50
60
70
80
90
100
Per
cent
age
Level of alcohol consumption
16–24 25–34 35–44 45–54 55–64 65–74
Figure 4.3 Age group by level of alcohol problem
Age group:
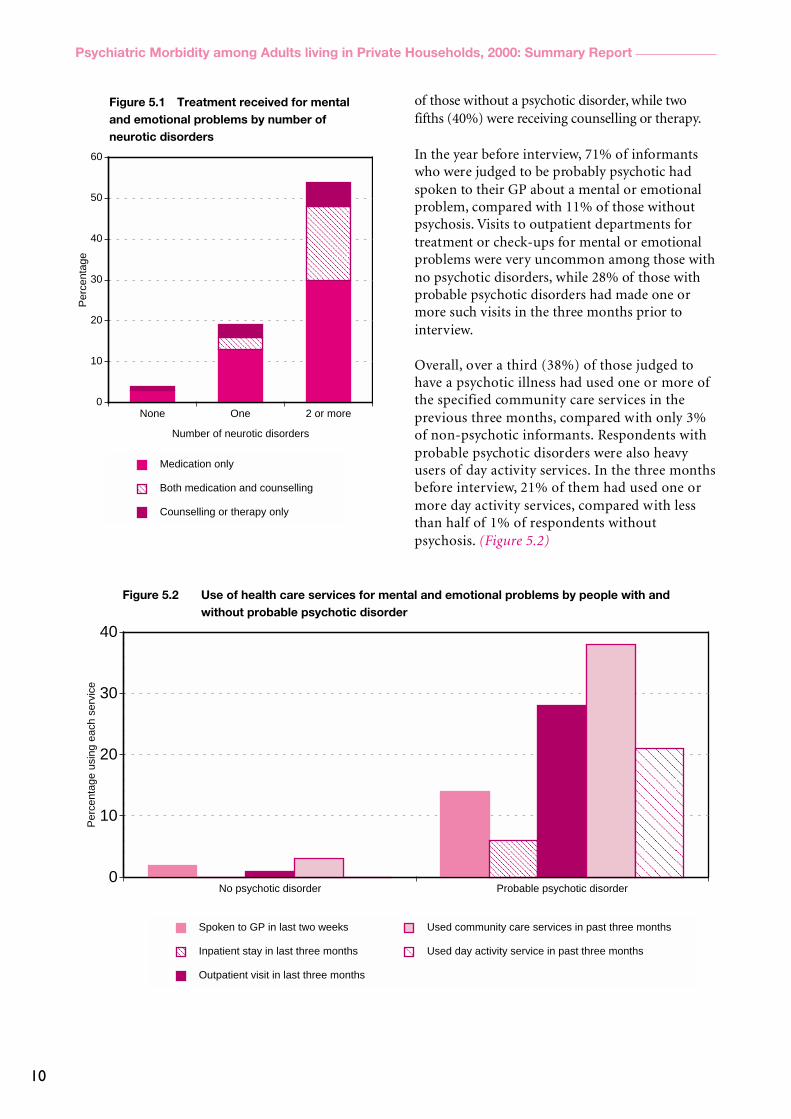
10
Psychiatric Morbidity among Adults living in Private Households, 2000: Summary Report
of those without a psychotic disorder, while twofifths (40%) were receiving counselling or therapy.
In the year before interview, 71% of informantswho were judged to be probably psychotic hadspoken to their GP about a mental or emotionalproblem, compared with 11% of those withoutpsychosis. Visits to outpatient departments fortreatment or check-ups for mental or emotionalproblems were very uncommon among those withno psychotic disorders, while 28% of those withprobable psychotic disorders had made one ormore such visits in the three months prior tointerview.
Overall, over a third (38%) of those judged tohave a psychotic illness had used one or more ofthe specified community care services in theprevious three months, compared with only 3%of non-psychotic informants. Respondents withprobable psychotic disorders were also heavyusers of day activity services. In the three monthsbefore interview, 21% of them had used one ormore day activity services, compared with lessthan half of 1% of respondents withoutpsychosis. (Figure 5.2)
No psychotic disorder Probable psychotic disorder0
10
20
30
40
Per
cent
age
usin
g ea
ch s
ervi
ce
Spoken to GP in last two weeks
Inpatient stay in last three months
Outpatient visit in last three months
Used community care services in past three months
Used day activity service in past three months
Figure 5.2 Use of health care services for mental and emotional problems by people with andwithout probable psychotic disorder
None One 2 or more0
10
20
30
40
50
60
Per
cent
age
Number of neurotic disorders
Medication only
Both medication and counselling
Counselling or therapy only
Figure 5.1 Treatment received for mentaland emotional problems by number ofneurotic disorders

11
Psychiatric Morbidity among Adults living in Private Households, 2000: Summary Report
References
Babor, T.F., de la Fuente, J.R., Saunders, J. and Grant, M. (1992)AUDIT The Alcohol Use Disorders Identification Test: Guidelinesfor use in Primary Health Care, World Health Organisation:Geneva.
First MB, Gibbon M, Spitzer RL, William JBW and BenjaminL (1997) Structured Clinical Interview for DSM-IV Axis IIPersonality Disorders, American Psychiatric Press:Washington.
Lewis G, and Pelosi AJ. (1990) Manual of the revised clinicalinterview schedule (CIS-R), Institute of Psychiatry: London.
Lewis, G, Pelosi, A., Araya, R C and Dunne, G. (1992)Measuring psychiatric disorder in the community: astandardized assessment for use by lay interviewers,Psychological Medicine, 22, 465–486.
Meltzer H, Gill B, Petticrew M and Hinds, K. (1995) OPCSSurveys of Psychiatric Morbidity in Great Britain, Report 1: theprevalence of psychiatric morbidity among adults living inprivate households. HMSO: London.
Robins LN and Regier DA (1991) Psychiatric disorders inAmerica: the Epidemiological Catchment Area Study. The FreePress (Macmillan Inc.), New York.
Singleton N, Bumpstead R, O’Brien M, Lee A and Meltzer H(2001) Psychiatric Morbidity among Adults living in PrivateHouseholds, 2000. TSO: London.
Stockwell T, Murphy D and Hogson R. (1983) The severity ofalcohol dependence questionnaire: its use, reliability andvalidity. British Journal of Addiction, 78, 145–155.
World Health Organization Division of Mental Health. (1999).SCAN Schedules for Clinical Assessment in NeuropsychiatryVersion 2.1. World Health Organization: Geneva.

12
Psychiatric Morbidity among Adults living in Private Households, 2000: Summary Report