Embed Size (px)
Citation preview

Przenoszeniesieci regulato-
rowychmiedzy
gatunkami
Błazej Osinski
Wstep
Przenoszeniesieci
NarzedziaFORCE
MoRAine
Przenoszenie sieci regulatorowychmiedzy gatunkami
i wykorzystywane narzedzia
Błazej Osinski
22.03.2012

Przenoszeniesieci regulato-
rowychmiedzy
gatunkami
Błazej Osinski
Wstep
Przenoszeniesieci
NarzedziaFORCE
MoRAine
Sieci regulatorowe genów
Składnikiczynniki transkrypcyjne (TF)miejsca wiazan czynników transkrypcyjnych (TFBS)regulowane geny (TG)
bazy danych, organizmy modelowe (E. coli,C. glutamicum)duze znaczenie, ograniczona wiedza:tysiace znanych genomów, tylko 6 modelowychorganizmów

Przenoszeniesieci regulato-
rowychmiedzy
gatunkami
Błazej Osinski
Wstep
Przenoszeniesieci
NarzedziaFORCE
MoRAine
Przenoszenie sieci regulatorowych genów
J. Baumbach, S. Rahmann, A. TauchReliable transfer of transcriptional gene regulatory networksbetween taxonomically related organismsBMC System Biology, Styczen 2009
Przenoszeniesieci regulato-
rowychmiedzy
gatunkami
Błazej Osinski
Wstep
Przenoszeniesieci
NarzedziaFORCE
MoRAine
Przenoszenie sieci regulatorowych genów
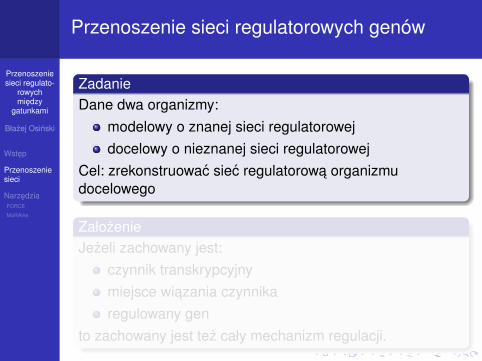
ZadanieDane dwa organizmy:
modelowy o znanej sieci regulatorowejdocelowy o nieznanej sieci regulatorowej
Cel: zrekonstruowac siec regulatorowa organizmudocelowego
ZałozenieJezeli zachowany jest:
czynnik transkrypcyjnymiejsce wiazania czynnikaregulowany gen
to zachowany jest tez cały mechanizm regulacji.

Przenoszeniesieci regulato-
rowychmiedzy
gatunkami
Błazej Osinski
Wstep
Przenoszeniesieci
NarzedziaFORCE
MoRAine
Przenoszenie sieci regulatorowych genów
Algorytm1 wykrywanie par homologów wsród TF i TG
klastrowanie białek – FORCEw przypadku niejednoznacznosci – rozstrzyga liczbahomologów w otoczeniu
2 dostosowanie TFBS dla TF organizmu modelowego iobliczenie PWM – MoRAine
3 skanowanie obszarów powyzej homologów TG,w poszukiwaniu TFBS
4 zwrócenie wszystkich zachowanych trójekTF, TG, TFBS
jezeli TG jest pierwszy w operonie, to uznajemy, ze TFreguluje wszystkie geny w operonie

Przenoszeniesieci regulato-
rowychmiedzy
gatunkami
Błazej Osinski
Wstep
Przenoszeniesieci
NarzedziaFORCE
MoRAine
Przenoszenie sieci regulatorowych genów
Eksperyment
przeniesiono siec regulatorowa z C. glutamicum doC. diphteriae, C. jeikeium (ludzkie patogeny),C. efficiens (wazna w biotechnologii)uzyskano 530 nowe regulacje genoweproblem z ocena jakosci, zwykle brak złotego standardu

Przenoszeniesieci regulato-
rowychmiedzy
gatunkami
Błazej Osinski
Wstep
Przenoszeniesieci
NarzedziaFORCE
MoRAine
Przenoszenie sieci regulatorowych genów
Walidacja
J. Baumbach, On the power and limits of evolutionaryconservation - unraveling bacterial gene regulatory networks

Przenoszeniesieci regulato-
rowychmiedzy
gatunkami
Błazej Osinski
Wstep
Przenoszeniesieci
NarzedziaFORCE
MoRAine
Przenoszenie sieci regulatorowych genów
Wynikipokazne zwiekszenie bazy danych CoryneRegNet

Przenoszeniesieci regulato-
rowychmiedzy
gatunkami
Błazej Osinski
Wstep
Przenoszeniesieci
NarzedziaFORCE
MoRAine
Przenoszenie sieci regulatorowych genów
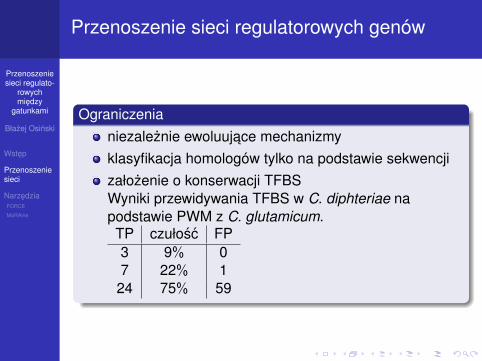
Ograniczenianiezaleznie ewoluujace mechanizmyklasyfikacja homologów tylko na podstawie sekwencjizałozenie o konserwacji TFBSWyniki przewidywania TFBS w C. diphteriae napodstawie PWM z C. glutamicum.TP czułosc FP3 9% 07 22% 1
24 75% 59
Przenoszeniesieci regulato-
rowychmiedzy
gatunkami
Błazej Osinski
Wstep
Przenoszeniesieci
NarzedziaFORCE
MoRAine
Przenoszenie sieci regulatorowych genów
Ograniczenianiezaleznie ewoluujace mechanizmyklasyfikacja homologów tylko na podstawie sekwencjizałozenie o konserwacji TFBSWyniki przewidywania TFBS w C. diphteriae napodstawie PWM z C. glutamicum.TP czułosc FP3 9% 07 22% 1
24 75% 59

Przenoszeniesieci regulato-
rowychmiedzy
gatunkami
Błazej Osinski
Wstep
Przenoszeniesieci
NarzedziaFORCE
MoRAine
FORCE
T. Wittkop, J. Baumbach, F. P. Lobo, S. RahmannLarge scale clustering of protein sequences with FORCE -A layout based heuristic for weighted cluster editingBMC Bioinformatics 2007

Przenoszeniesieci regulato-
rowychmiedzy
gatunkami
Błazej Osinski
Wstep
Przenoszeniesieci
NarzedziaFORCE
MoRAine
Weighted graph cluster editing problem
Problem edytowania grafu wazonego do postaci klastrowejDane:
graf prosty (V ,E)
funkcja podobienstwa s : V × V → RSzukany: graf przechodni (V ,E ′) o minimalnym koszcie:
Cost(E ,E ′) =∑
(u,v)∈(E\E ′)∪(E ′\E)
s(u, v)
PytaniaCzy nadaje sie do wykrywania grup homologów?Czy da sie uzyc w praktyce?

Przenoszeniesieci regulato-
rowychmiedzy
gatunkami
Błazej Osinski
Wstep
Przenoszeniesieci
NarzedziaFORCE
MoRAine
WGCEP heurystyka - FORCE
Rozwiazanie heurystyczne1 rozłozenie2 podział3 post-procesowanie

Przenoszeniesieci regulato-
rowychmiedzy
gatunkami
Błazej Osinski
Wstep
Przenoszeniesieci
NarzedziaFORCE
MoRAine
WGCEP heurystyka - FORCE
Rozwiazanie heurystyczne1 rozłozenie
ułozenie wierzchołków na okreguR-krotne symulowanie działania sił
Wraz z rosnaca odległoscia: przyciaganie siewzmacnia, odpychanie osłabia.
2 podział3 post-procesowanie

Przenoszeniesieci regulato-
rowychmiedzy
gatunkami
Błazej Osinski
Wstep
Przenoszeniesieci
NarzedziaFORCE
MoRAine
FORCE - przykład rozłozenia I

Przenoszeniesieci regulato-
rowychmiedzy
gatunkami
Błazej Osinski
Wstep
Przenoszeniesieci
NarzedziaFORCE
MoRAine
FORCE - przykład rozłozenia II
Przenoszeniesieci regulato-
rowychmiedzy
gatunkami
Błazej Osinski
Wstep
Przenoszeniesieci
NarzedziaFORCE
MoRAine
WGCEP heurystyka - FORCE
Rozwiazanie heurystyczne1 rozłozenie2 podział
dla róznych δ ∈ (0,300) obliczamy klastryv ∈ C jezeli istnieje x ∈ C taki, ze d(x , v) < δ
3 post-procesowanie

Przenoszeniesieci regulato-
rowychmiedzy
gatunkami
Błazej Osinski
Wstep
Przenoszeniesieci
NarzedziaFORCE
MoRAine
WGCEP heurystyka - FORCE
Rozwiazanie heurystyczne1 rozłozenie2 podział3 post-procesowanie - dwie heurystyki lokalne:
łaczenie klastrówprzekładanie pojedynczych wierzchołków miedzyklastrami

Przenoszeniesieci regulato-
rowychmiedzy
gatunkami
Błazej Osinski
Wstep
Przenoszeniesieci
NarzedziaFORCE
MoRAine
WGCEP heurystyka - FORCE
Dobór parametrówuczenie na przykładowym zbiorzeobliczenia ewolucyjne
EwaluacjaSCOP - (manualnie) stworzony podział białek
ASTRAL95 - 2 zbiory
COG - Cluster of Orthologous Groups
Funkcje podobienstwaOparte o HSP z BLASTa
Best hit (BeH)Sum of hits (SoH)Coverage (Cov)

Przenoszeniesieci regulato-
rowychmiedzy
gatunkami
Błazej Osinski
Wstep
Przenoszeniesieci
NarzedziaFORCE
MoRAine
WGCEP - weryfikacja modelu
F (K ,C) =1n
l∑j=1
|Cj |max1¬i¬m2|Ki ∩ Cj ||Ki |+ |Cj |

Przenoszeniesieci regulato-
rowychmiedzy
gatunkami
Błazej Osinski
Wstep
Przenoszeniesieci
NarzedziaFORCE
MoRAine
WGCEP - weryfikacja modelu
!"#$!%&%'(&)*+,%-.!"##$%!!&'() *++,&--.../012345647+89:/623-;<$;=";#>-?-'()
@9A4!)!2B!;"
/0+12$'3*42)$'&,$(&)$-%,+,%&'$03)0&.2.5
10-2. We use this threshold as penalty for every additionalHSP. This leads to the similarity function
Coverage (Cov)The third approach integrates the lengths of a HSP intothe similarity function. To determine the coverage, weneed the following indicator function:
The coverage can now be defined as
In order to obtain a good similarity function, we controlthe influence of the coverage on the overall similarityfunction by a user-defined factor f, and set
s(uv) : = s'(uv) + f ·coverage(uv).
Here s' : ! ! denotes one of the previously pre-
sented similarity functions, BeH or SoH.
Parameter choicesThe initial parameters obtained from the pre-processingtraining are R = 186, fatt = 1.245, frep = 1.687, M0 = 633, and" = 200 for the protein clustering problem. Furthermore,we apply evolutionary training to each problem instance,as described in the Algorithms section.
ResultsThis section contains three different types of results. Firstwe discuss the appropriateness of the WGCEP model forthe detection of clusters of homologous proteins using theASTRAL dataset described earlier. Next we show that theFORCE heuristic is fast in practice, and compares favora-bly against an exact (exponential-time) fixed-parameteralgorithm in terms of solution quality. We show thatFORCE is able to handle very large datasets efficiently, inparticular the COG dataset described previously. Finally,we have integrated the clustering results of FORCE intothe corynebacterial reference database CoryneRegNet[21,22].
Evaluation of the WGCEP modelTo show that the WGCEP model is adequate for proteinhomology clustering, we evaluate our algorithm in thesame way as Paccanaro et al. did in their article [7], using
the so-called F-measure to quantify the agreement ofFORCE's result with the reference clustering provided bythe ASTRAL dataset.
We first explain the F-measure, which equally combinesprecision and recall. Let K = (K1, ..., Km) be the clustering
obtained from the algorithm and C = (C1, ..., Cl) the refer-
ence clustering. Furthermore, we denote with n the totalnumber of proteins and with ni, nj the number of proteins
in the cluster Ki and Cj, respectively. Following this, is
the number of proteins in the intersection Ki # Cj. The F-
measure is defined as
As mentioned earlier, Paccanaro et al. previously com-pared the most popular protein clustering tools againsttheir own spectral clustering: GeneRAGE, TribeMCL, andHierarchical clustering. Since there is no need to replicateexisting results, we use the same data (ASTRAL95_1_161and ASTRAL95_2_161). Table 1 summarizes the results:Using FORCE, we obtain slightly better agreements thanwith spectral clustering. The best similarity functionparameters and score threshold for the ASTRAL95_1_161dataset were Cov-scoring using f = 20 and BeH as a sec-ondary scoring function, and t = -2.2. For the
s uv m u v mki
l
j( ) : log max ,( ) ( )= ! " #( )( ) "! ! ! !
=10
1 1
1E-value E-value
ll
ji
ku v$$ %( )( )&
'(
)(
*+(
,(
-
.
//
0
1
22=1.
!uv iu i u v
( ) :(
=#1 if in the position is covered by any HSP )) ( ) ,
.,..., ,...,n k m lu v= =%&
')
1 1
0 or
otherwise
coverage( ) : min ( ), ( ) .uvu
iv
iuvi
u
vui
v
=-
.//
0
122= =
3 31 1
1 1! !
V
2-./
012
nij
F K Cn
nn
n nj
j
l
i m
ij
ij
( , ) : max .= "+
-
.//
0
122= 4 4
31 2
1 1
Table 1: Evaluation of protein clustering tools. The F-measure (between 0 and 1) measures the agreement between a clustering resulting from a given algorithm and a reference clustering provided with the dataset. An F-measure of 1 indicates perfect agreement. ASTRAL95_1_161 and ASTRAL95_2_161 refer to the two datasets of SCOP v1.61 used by Paccanaro et al. for spectral clustering [7]. All reported values, except for our algorithm FORCE and for Affinity Propagation, are from the same reference.
Dataset Method F-measure
ASTRAL95_1_161 FORCE 0.85ASTRAL95_1_161 Spectral clustering 0.81ASTRAL95_1_161 Affinity Propagation 0.65ASTRAL95_1_161 GeneRAGE 0.47ASTRAL95_1_161 TribeMCL 0.32ASTRAL95_1_161 Hierarchical clustering 0.26
ASTRAL95_2_161 FORCE 0.89ASTRAL95_2_161 Spectral clustering 0.82ASTRAL95_2_161 Affinity Propagation 0.69ASTRAL95_2_161 GeneRAGE 0.54ASTRAL95_2_161 TribeMCL 0.52ASTRAL95_2_161 Hierarchical clustering 0.42

Przenoszeniesieci regulato-
rowychmiedzy
gatunkami
Błazej Osinski
Wstep
Przenoszeniesieci
NarzedziaFORCE
MoRAine
WGCEP - weryfikacja modelu
!"#$!%&%'(&)*+,%-.!"##$%!!&'() *++,&--.../012345647+89:/623-;<$;=";#>-?-'()
@9A4!?!2B!;"
/0+12$'3*42)$'&,$(&)$-%,+,%&'$03)0&.2.5
Graphical summary of the obtained clustering results of FORCE for the two similarity functions (A) BeH and (B) SoH, and dataset ASTRAL95_1_161Figure 1Graphical summary of the obtained clustering results of FORCE for the two similarity functions (A) BeH and (B) SoH, and dataset ASTRAL95_1_161. We used MATLAB scripts provided by Paccanaro to create images similar to those of Figure 3 in [7]. Each row corresponds to a cluster. Green bars represent a protein assignment to a cluster; each protein is present in only one of the clusters. Boundaries between superfamilies are shown by vertical red lines, and boundaries between families within each superfamily are shown by dotted blue lines.
Przenoszeniesieci regulato-
rowychmiedzy
gatunkami
Błazej Osinski
Wstep
Przenoszeniesieci
NarzedziaFORCE
MoRAine
FORCE - aplikowalnosc
!"#$!%&%'(&)*+,%-.!"##$%!!&'() *++,&--.../012345647+89:/623-;<$;=";#>-?-'()
@9A4!(!2B!;"
/0+12$'3*42)$'&,$(&)$-%,+,%&'$03)0&.2.5
b) here we have not optimized in any way the scoringfunction and threshold. We discuss this further below.
CoryneRegNetCoryneRegNet (online available at [26]) allows a perti-nent data management of regulatory interactions alongwith the genome-scale reconstruction of transcriptionalregulatory networks of corynebacteria relevant in humanmedicine and biotechnology, together with Escherichiacoli. CoryneRegNet is based on a multi-layered, hierarchi-cal and modular concept of transcriptional regulation and
was implemented with an ontology-based data structure.It integrates the fast and statistically sound method PoS-SuMsearch [27] to predict transcription factor bindingsites within and across species. Reconstructed regulatorynetworks can be visualized on a web interface and asgraphs. Special graph layout algorithms have been devel-oped to facilitate the comparison of gene regulatory net-works across species and to assist biologists with theevaluation of predicted and graphically visualized net-works in the context of experimental results. To extend thecomparative features, we need adequate data on gene andprotein clusters. The integration of this informationwould widen the scope of CoryneRegNet and assist theuser with the reconstruction of unknown regulatory inter-actions [21,22].
Relative cost deviations (y-axis in %) of the FORCE solutions from the optimal solutions found by the exact fixed-parame-ter algorithm described in [2]Figure 3Relative cost deviations (y-axis in %) of the FORCE solutions from the optimal solutions found by the exact fixed-parame-ter algorithm described in [2]. The x-axis is as in Figure 2 (logarithmically scaled).
Table 2: Evaluation of the WGCEP model. The best F-measures for each dataset and each similarity function. ASTRAL95_1_161 and ASTRAL95_2_161 are as in Table 1. ASTRAL95_1_171 and ASTRAL95_2_171 refer to the updated ASTRAL95 data of SCOP v1.71. BeH or SoH denote the similarity function, while the coverage factor f represents the influence of the coverage to the similarity.
Dataset Similarity Factor f Threshold F-measure
ASTRAL95_1_171 SoH 18 -3.0 0.91ASTRAL95_1_171 BeH 15 -3.4 0.90ASTRAL95_2_161 SoH 19 -1.6 0.89ASTRAL95_2_171 SoH 15 -3.2 0.88ASTRAL95_2_161 BeH 14 -2.4 0.87ASTRAL95_2_171 BeH 13 -2.6 0.85ASTRAL95_1_161 BeH 20 -2.2 0.85ASTRAL95_1_161 SoH 20 -1.8 0.83
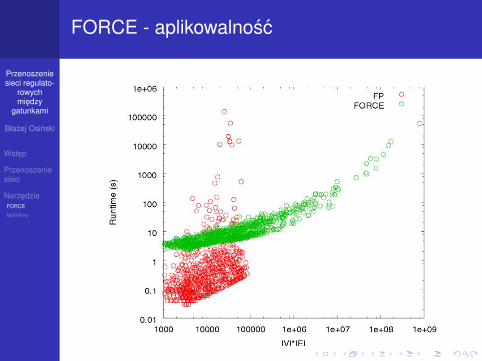
Comparison of the running times of FORCE against the exact fixed-parameter algorithm described in [2]Figure 2Comparison of the running times of FORCE against the exact fixed-parameter algorithm described in [2]. Plotted is the running time (y-axis in seconds) for different graph sizes (x-axis). Solely for visualization purposes, we describe the size of a graph on the x-axis as |V|·|E|. All graphs have been con-structed from prokaryotic COG protein sequence compari-sons using BeH as scoring function. Note that both axes are scaled logarithmically. The red points correspond to FORCE running times, and the blue points to the FP algorithm, respectively.

Przenoszeniesieci regulato-
rowychmiedzy
gatunkami
Błazej Osinski
Wstep
Przenoszeniesieci
NarzedziaFORCE
MoRAine
FORCE - aplikowalnosc
!"#$!%&%'(&)*+,%-.!"##$%!!&'() *++,&--.../012345647+89:/623-;<$;=";#>-?-'()
@9A4!(!2B!;"
/0+12$'3*42)$'&,$(&)$-%,+,%&'$03)0&.2.5
b) here we have not optimized in any way the scoringfunction and threshold. We discuss this further below.
CoryneRegNetCoryneRegNet (online available at [26]) allows a perti-nent data management of regulatory interactions alongwith the genome-scale reconstruction of transcriptionalregulatory networks of corynebacteria relevant in humanmedicine and biotechnology, together with Escherichiacoli. CoryneRegNet is based on a multi-layered, hierarchi-cal and modular concept of transcriptional regulation and
was implemented with an ontology-based data structure.It integrates the fast and statistically sound method PoS-SuMsearch [27] to predict transcription factor bindingsites within and across species. Reconstructed regulatorynetworks can be visualized on a web interface and asgraphs. Special graph layout algorithms have been devel-oped to facilitate the comparison of gene regulatory net-works across species and to assist biologists with theevaluation of predicted and graphically visualized net-works in the context of experimental results. To extend thecomparative features, we need adequate data on gene andprotein clusters. The integration of this informationwould widen the scope of CoryneRegNet and assist theuser with the reconstruction of unknown regulatory inter-actions [21,22].
Relative cost deviations (y-axis in %) of the FORCE solutions from the optimal solutions found by the exact fixed-parame-ter algorithm described in [2]Figure 3Relative cost deviations (y-axis in %) of the FORCE solutions from the optimal solutions found by the exact fixed-parame-ter algorithm described in [2]. The x-axis is as in Figure 2 (logarithmically scaled).
Table 2: Evaluation of the WGCEP model. The best F-measures for each dataset and each similarity function. ASTRAL95_1_161 and ASTRAL95_2_161 are as in Table 1. ASTRAL95_1_171 and ASTRAL95_2_171 refer to the updated ASTRAL95 data of SCOP v1.71. BeH or SoH denote the similarity function, while the coverage factor f represents the influence of the coverage to the similarity.
Dataset Similarity Factor f Threshold F-measure
ASTRAL95_1_171 SoH 18 -3.0 0.91ASTRAL95_1_171 BeH 15 -3.4 0.90ASTRAL95_2_161 SoH 19 -1.6 0.89ASTRAL95_2_171 SoH 15 -3.2 0.88ASTRAL95_2_161 BeH 14 -2.4 0.87ASTRAL95_2_171 BeH 13 -2.6 0.85ASTRAL95_1_161 BeH 20 -2.2 0.85ASTRAL95_1_161 SoH 20 -1.8 0.83
Comparison of the running times of FORCE against the exact fixed-parameter algorithm described in [2]Figure 2Comparison of the running times of FORCE against the exact fixed-parameter algorithm described in [2]. Plotted is the running time (y-axis in seconds) for different graph sizes (x-axis). Solely for visualization purposes, we describe the size of a graph on the x-axis as |V|·|E|. All graphs have been con-structed from prokaryotic COG protein sequence compari-sons using BeH as scoring function. Note that both axes are scaled logarithmically. The red points correspond to FORCE running times, and the blue points to the FP algorithm, respectively.

Przenoszeniesieci regulato-
rowychmiedzy
gatunkami
Błazej Osinski
Wstep
Przenoszeniesieci
NarzedziaFORCE
MoRAine
MoRAine
J. Baumbach, T. Wittkop, J. Weile, T. Kohl, S. RahmannMoRAine - A web server for fast computational transcriptionfactor binding motif re-annotationJournal of Integrative Bioinformatcis, 2008
T. Wittkop, S. Rahmann, J. BaumbachEfficient Online Transcription Factor Binding Site Adjustmentby Integrating Transitive Graph Projection with MoRAine 2.0Journal of Integrative Bioinformatcis, 2010

Przenoszeniesieci regulato-
rowychmiedzy
gatunkami
Błazej Osinski
Wstep
Przenoszeniesieci
NarzedziaFORCE
MoRAine
MoRAine
Motywacja
TFBS moga byc niedokładnerozdzielczosc eksperymentówwybór łancucha DNAAGGCATATGCCT
w konsekwencji słabsze PWM

Przenoszeniesieci regulato-
rowychmiedzy
gatunkami
Błazej Osinski
Wstep
Przenoszeniesieci
NarzedziaFORCE
MoRAine
MoRAine
Journal of Integrative Bioinformatics 2010 http://journal.imbio.de/
a bioinformatics workflow with adjusted position weight matrices for TFBS predictions.
We emphasize that the main advantage of MoRAine is it’s easy-to-use web interface. The usermay copy and paste binding sequences in FASTA format at the MoRAine web site to calculatethe adjusted motifs as well as the corresponding sequence logos by using the Berkeley weblogo software [15]. Just as MoRAine 1.0, the second release is an easy-to-use alternative forthe computation of sequence logos and the adjustment of transcription factor binding sites, butit now provides increased accuracy at decreased running times and an eased user-interface withless parameters to adjust.
3.2 Increased information content improvement with MoRAine 2.0
In Figure 1 we exemplarily illustrate the output of the MoRAine online service for the bind-ing sites of the transcription factor RamB of Corynebacterium glutamicum. The TFBSs havebeen taken from CoryneRegNet release 5.0. As in most databases, in CoryneRegNet [8], eachbinding site is annotated in 5! ! 3! direction relative to the regulated target gene. By us-ing MoRAine 2.0 we improved the average information content from 0.64 (original databaseTFBSs) to 1.15 (MoRAine-adjusted TFBSs) by switching the strands for 15 of the 38 inputsequences. The computation time was less than 2 seconds.
Figure 1: A screenshot from the MoRAine 2.0 web site. A comparison of the sequence logos con-structed from the original TFBSs (left side) for the transcription factor RamB of Corynebacteriumglutamicum and the adjusted TFBSs by using MoRAine 2.0 (right side).
To demonstrate the performance, i.e. decreased running time and increased information contentimprovement, of MoRAine 2.0, we used the same datasets as in [10]: 1165 binding sites of 85transcription factors of Escherichia coli. We compare the average runtime and the mean infor-mation content improvement of MoRAine 2.0 with the four methods implemented in MoRAine1.0 for different lengths of the flanking sequences (l and r, respectively). As shown in Table 1,with MoRAine 1.0 the combination (cg/simC) had the best runtime, but to gain the best in-formation content improvement, we used the combination (cg/simS) [10]. With the workpresented in this paper, we closed the gap between running time and accuracy. In Table 2,we compare MoRAine 2.0 with release 1.0 using the most accurate combination (cg/simS)and the fastest combination (cg/simC), respectively. For a fair running time comparison, were-evaluated MoRAine 1.0 (cg/simC) and MoRAine 2.0 on the same standard desktop PC. Ta-ble 2 shows that MoRAine 2.0 outperforms the previous release in terms of information contentimprovement with running times almost as fast as those of (cg/simC). Furthermore, MoRAine2.0 does not require the user to choose various input parameters to optimize its results.

Przenoszeniesieci regulato-
rowychmiedzy
gatunkami
Błazej Osinski
Wstep
Przenoszeniesieci
NarzedziaFORCE
MoRAine
MoRAine
Dane: n odnotowanych TFBS o długosci mMetoda: poprzesuwaj, lub zmien łancuch TFBSCel: optymalny PWM
Algorytm1 generowanie mozliwych motywów
poszerzamy okno i-te o l i r par zasad w lewo i prawozbiór Si - motywy m zasadowe, na obu łancuchach|Si | = 2(l + r + 1)
2 klasteryzacjaszukamy zbioru C zawierajacym po jednym motywie zkazdego Sidwa podejscia

Przenoszeniesieci regulato-
rowychmiedzy
gatunkami
Błazej Osinski
Wstep
Przenoszeniesieci
NarzedziaFORCE
MoRAine
Klasteryzacja - podejscie pierwsze
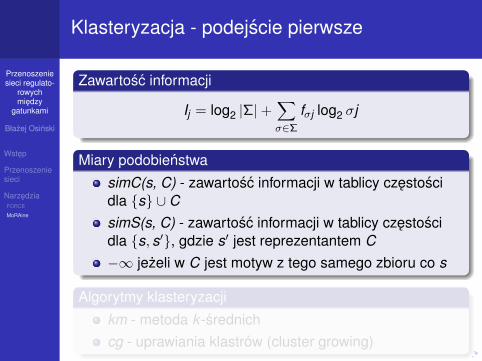
Zawartosc informacji
Ij = log2 |Σ|+∑σ∈Σ
fσj log2 σj
Miary podobienstwa
simC(s, C) - zawartosc informacji w tablicy czestoscidla {s} ∪ CsimS(s, C) - zawartosc informacji w tablicy czestoscidla {s, s′}, gdzie s′ jest reprezentantem C−∞ jezeli w C jest motyw z tego samego zbioru co s
Algorytmy klasteryzacji
km - metoda k -srednichcg - uprawiania klastrów (cluster growing)
Przenoszeniesieci regulato-
rowychmiedzy
gatunkami
Błazej Osinski
Wstep
Przenoszeniesieci
NarzedziaFORCE
MoRAine
Klasteryzacja - podejscie pierwsze
Zawartosc informacji
Ij = log2 |Σ|+∑σ∈Σ
fσj log2 σj
Miary podobienstwa
simC(s, C) - zawartosc informacji w tablicy czestoscidla {s} ∪ CsimS(s, C) - zawartosc informacji w tablicy czestoscidla {s, s′}, gdzie s′ jest reprezentantem C−∞ jezeli w C jest motyw z tego samego zbioru co s
Algorytmy klasteryzacji
km - metoda k -srednichcg - uprawiania klastrów (cluster growing)

Przenoszeniesieci regulato-
rowychmiedzy
gatunkami
Błazej Osinski
Wstep
Przenoszeniesieci
NarzedziaFORCE
MoRAine
Klasteryzacja - podejscie drugie
Mamy młotek, to go uzyjmy.FORCE
Odległosc
m − h(p,q)
−∞ jezeli p,q ∈ Si
t = 0

Przenoszeniesieci regulato-
rowychmiedzy
gatunkami
Błazej Osinski
Wstep
Przenoszeniesieci
NarzedziaFORCE
MoRAine
Klasteryzacja - podejscie drugie
Mamy młotek, to go uzyjmy.FORCE
Odległosc
m − h(p,q)
−∞ jezeli p,q ∈ Si
t = 0

Przenoszeniesieci regulato-
rowychmiedzy
gatunkami
Błazej Osinski
Wstep
Przenoszeniesieci
NarzedziaFORCE
MoRAine
Klasteryzacja - podejscie drugie
Mamy młotek, to go uzyjmy.FORCE
Odległosc
m − h(p,q)
−∞ jezeli p,q ∈ Si
t = 0

Przenoszeniesieci regulato-
rowychmiedzy
gatunkami
Błazej Osinski
Wstep
Przenoszeniesieci
NarzedziaFORCE
MoRAine
Klasteryzacja - podejscie drugie
Mamy młotek, to go uzyjmy.FORCE
Odległosc
m − h(p,q)
−∞ jezeli p,q ∈ Si
t = 0

Przenoszeniesieci regulato-
rowychmiedzy
gatunkami
Błazej Osinski
Wstep
Przenoszeniesieci
NarzedziaFORCE
MoRAine
MoRAine - ocenaJournal of Integrative Bioinformatics 2010 http://journal.imbio.de/
Difference (%) Time (s)l = r cg/simC cg/simS km/simC km/simS cg/simC cg/simS km/simC km/simS
0 26.1 27.0 26.5 26.8 0.6 0.7 1.2 1.11 50.9 54.4 50.1 52.3 0.7 2.3 7.2 4.02 57.5 63.6 57.6 62.4 0.8 4.2 45.9 8.33 60.0 69.5 64.6 64.7 1.0 8.4 128.0 12.84 65.3 70.1 65.0 69.3 1.1 11.9 198.3 19.55 66.3 73.0 68.8 73.3 1.3 16.8 298.3 30.56 66.6 73.1 74.3 74.9 1.8 23.9 427.0 34.47 68.0 78.7 73.5 78.4 2.0 30.1 505.4 42.6
Table 1: This table was taken from [10] and summarizes the average information content im-provements and the mean running times of MoRAine 1.0 for different l- and r-values and the foursearch method/similarity function combinations over all TFBSs of 85 transcriptional regulators ofE. coli.
Difference (%) Time (s)l = r MoRAine 1.0 (cg/simS) MoRAine 2.0 MoRAine 1.0 (cg/simC) MoRAine 2.0
0 27.0 27.2 0.21 0.231 54.4 54.7 0.26 0.292 63.6 66.5 0.32 0.363 69.5 72.2 0.38 0.424 70.1 75.5 0.46 0.505 73.0 75.7 0.55 0.596 73.1 77.8 0.60 0.667 78.7 79.1 0.71 0.77
Table 2: In this table we compare the average information content improvement and the meanrunning time of MoRAine 1.0 with MoRAine 2.0 for different l- and r-values over all TFBSsof 85 transcriptional regulators of E. coli. We compare MoRAine 2.0 with the most accuratecombination of similarity function and search method of MoRAine 1.0 (left side) and with thefastest combination (right side).
3.3 Improved binding site prediction performance with MoRAine-adjusted se-quences
As mentioned earlier, positions specific scoring matrices (PSSMs) are used for the predictionof TFBSs in sequences upstream of putatively regulated target genes or operons for a specificregulator. A PSSM allows us to assign a score to any length-m DNA sequence window. APSSM matches such a window if the score exceeds a user-given threshold. Such a matchingbinding site is considered to be a good candidate for a real TFBS if we properly choose thescore (generally as the log-odds score between the nucleotide distribution of true binding sitesand a background distribution) and the threshold (ideally based on statistical considerations; seee.g. [23]). As in [10], we use the PSSM-based DNA matching tool PoSSuMsearch [11] for theevaluation of the prediction performance of PSSMs computed from both the original TFBSs andthe MoRAine-adjusted PSSMs. The threshold is computed efficiently by PoSSuMsearch basedon the tolerable frequency of hits in random sequences (p-value) generated from a backgroundmodel (the nucleotide frequencies in the upstream sequences); for more details refer to [11].We show that by using MoRAine 2.0 as preprocessing for the TFBSs that are used for PSSMcalculation, the classification performance is significantly increased.
Journal of Integrative Bioinformatics 2010 http://journal.imbio.de/
Difference (%) Time (s)l = r cg/simC cg/simS km/simC km/simS cg/simC cg/simS km/simC km/simS
0 26.1 27.0 26.5 26.8 0.6 0.7 1.2 1.11 50.9 54.4 50.1 52.3 0.7 2.3 7.2 4.02 57.5 63.6 57.6 62.4 0.8 4.2 45.9 8.33 60.0 69.5 64.6 64.7 1.0 8.4 128.0 12.84 65.3 70.1 65.0 69.3 1.1 11.9 198.3 19.55 66.3 73.0 68.8 73.3 1.3 16.8 298.3 30.56 66.6 73.1 74.3 74.9 1.8 23.9 427.0 34.47 68.0 78.7 73.5 78.4 2.0 30.1 505.4 42.6
Table 1: This table was taken from [10] and summarizes the average information content im-provements and the mean running times of MoRAine 1.0 for different l- and r-values and the foursearch method/similarity function combinations over all TFBSs of 85 transcriptional regulators ofE. coli.
Difference (%) Time (s)l = r MoRAine 1.0 (cg/simS) MoRAine 2.0 MoRAine 1.0 (cg/simC) MoRAine 2.0
0 27.0 27.2 0.21 0.231 54.4 54.7 0.26 0.292 63.6 66.5 0.32 0.363 69.5 72.2 0.38 0.424 70.1 75.5 0.46 0.505 73.0 75.7 0.55 0.596 73.1 77.8 0.60 0.667 78.7 79.1 0.71 0.77
Table 2: In this table we compare the average information content improvement and the meanrunning time of MoRAine 1.0 with MoRAine 2.0 for different l- and r-values over all TFBSsof 85 transcriptional regulators of E. coli. We compare MoRAine 2.0 with the most accuratecombination of similarity function and search method of MoRAine 1.0 (left side) and with thefastest combination (right side).
3.3 Improved binding site prediction performance with MoRAine-adjusted se-quences
As mentioned earlier, positions specific scoring matrices (PSSMs) are used for the predictionof TFBSs in sequences upstream of putatively regulated target genes or operons for a specificregulator. A PSSM allows us to assign a score to any length-m DNA sequence window. APSSM matches such a window if the score exceeds a user-given threshold. Such a matchingbinding site is considered to be a good candidate for a real TFBS if we properly choose thescore (generally as the log-odds score between the nucleotide distribution of true binding sitesand a background distribution) and the threshold (ideally based on statistical considerations; seee.g. [23]). As in [10], we use the PSSM-based DNA matching tool PoSSuMsearch [11] for theevaluation of the prediction performance of PSSMs computed from both the original TFBSs andthe MoRAine-adjusted PSSMs. The threshold is computed efficiently by PoSSuMsearch basedon the tolerable frequency of hits in random sequences (p-value) generated from a backgroundmodel (the nucleotide frequencies in the upstream sequences); for more details refer to [11].We show that by using MoRAine 2.0 as preprocessing for the TFBSs that are used for PSSMcalculation, the classification performance is significantly increased.

Przenoszeniesieci regulato-
rowychmiedzy
gatunkami
Błazej Osinski
Wstep
Przenoszeniesieci
NarzedziaFORCE
MoRAine
MoRAine - walidacjaJournal of Integrative Bioinformatics 2010 http://journal.imbio.de/
Figure 2: Prediction performance comparison of PoSSuMsearch by means of precision and re-call. All values are measured for varying p-value thresholds based on PSSMs learned from theoriginal TFBSs (red line) compared to those of readjusted TFBSs with MoRAine 2.0 (blue line)and readjusted TFBSs with MoRAine 1.0 (green line).
the optimization performance is even better. Furthermore, MoRAine 2.0 does not require theuser to adjust various parameters to achieve these results. It only requires the necessary inputto solve the readjustment problem, i.e. the input sequences themselves and the length of theflanking sequences. However, we see the main advantage of MoRAine in its integrative webinterface, which runs on a non-dedicated web server. Biologists may visit the MoRAine website, copy and paste their TFBS sequences and obtain readjusted sequences for download alongwith the sequence logos.
In summary, this article introduces an improved version of MoRAine, an online tool that sup-ports the re-annotation of transcription factor binding sites. We provide a web server to fa-cilitate using MoRAine and to compute sequence logos. We further demonstrated that there-annotation of TFBSs may be necessary for some prokaryotic databases and helps to improvethe PSSM-based prediction performance. MoRAine may also be downloaded as stand-alonetool and integrated in any data processing pipeline.

Przenoszeniesieci regulato-
rowychmiedzy
gatunkami
Błazej Osinski
Wstep
Przenoszeniesieci
NarzedziaFORCE
MoRAine
MoRAine - walidacjaJournal of Integrative Bioinformatics 2010 http://journal.imbio.de/
Figure 3: Prediction performance comparison by means of plotting the F-measure for varyingPoSSuMsearch p-value thresholds for the original TFBSs (red line), the MoRAine 1.0-adjustedTFBSs (green line), and the MoRAine 2.0-adjusted TFBSs (blue line) allowing 4 shifts to the leftand right (l=r=4).
References
[1] Babu MM, Luscombe NM, Aravind L, Gerstein M, and Teichmann SA. Structure andevolution of transcriptional regulatory networks. Curr Opin Struct Biol, 14(3):283–291,Jun 2004.
[2] Babu MM, Teichmann SA, and Aravind L. Evolutionary dynamics of prokaryotic tran-scriptional regulatory networks. J Mol Biol, 358(2):614–633, Apr 2006.
[3] Baumbach J. CoryneRegNet 4.0 - A reference database for corynebacterial gene regula-tory networks. BMC Bioinformatics, 8:429, 2007.
[4] Baumbach J, Brinkrolf K, Czaja L, Rahmann S, and Tauch A. CoryneRegNet: Anontology-based data warehouse of corynebacterial transcription factors and regulatorynetworks. BMC Genomics, 7(1):24, Feb 2006.
[5] Baumbach J, Brinkrolf K, Wittkop T, Tauch A, and Rahmann S. CoryneRegNet 2: An In-tegrative Bioinformatics Approach for Reconstruction and Comparison of Transcriptional

Przenoszeniesieci regulato-
rowychmiedzy
gatunkami
Błazej Osinski
Wstep
Przenoszeniesieci
NarzedziaFORCE
MoRAine
Podsumowanie
Omówione tematyPrzenoszenie sieci regulatorowej genówFORCE - klasteryzacja (np. homologów)MoRAine - poprawianie motywów TFBS
Dziekuje za uwage!Pytania?
Przenoszeniesieci regulato-
rowychmiedzy
gatunkami
Błazej Osinski
Wstep
Przenoszeniesieci
NarzedziaFORCE
MoRAine
Podsumowanie
Omówione tematyPrzenoszenie sieci regulatorowej genówFORCE - klasteryzacja (np. homologów)MoRAine - poprawianie motywów TFBS
Dziekuje za uwage!Pytania?