Embed Size (px)
Citation preview

Company PresentationCable Conference
ABN AMRO - London, 10th January 2008

1
Agenda
Company Overview
Financials
Outlook
Appendix
•
•
•
•

2
A Global Cable Manufacturer
The Prysmian Group operates 54 plants, has subsidiaries in 34 countrieswith 12,599 employees (Sept 07) and sells its products worldwide
Production plant
Countries with physical presence
LTM 9M 2007 Sales% of Total SalesLTM 9M 2007 Adj. EBITDA1
% of Sales
Energy Cables & Systems Telecom Cables & Systems
€4,626m90%€451m9.7%
€533m10%€41m7.7%
1 EBITDA adjusted excluding non-recurring items.
Total
€5,159m
€492m9.5%

3
A Complete and Diversified Presence and Product Offering
¹ Other includes mainly Wire Rod business, closed at the end of 2006
By Business Area By Geography
Sales LTM 9M 2007 Euro Millions
Industrial
Trade &Installers
Other 1
Utilities
Latin America
APAC
EMEA
Total Energy: 4,626 Total Telecom: 533
NorthAmerica
37%
15%
3%
100% = 5,159 100% = 5,159
Telecom 10%
9%
13%
9%
Energy 90%
69%35%
• Largest single customer: <3% of total sales • Largest single country within EMEA: France, <12% of sales
By Customer By Country

4
• Focus onproducts andservice
• Limited productdiversificationwithin regions
• Regionalcompetition
VALUE ADDED
High
Medium
Low
Power Distribution
Businesses with a strongcontinental integration
Optical Cables & Fibre
Trade &Installers
Submarine
Global businessesNetworkComponents
Businesses with astrong local focus
TelecomCables
Copper
PROFITABILITY
High Voltage
Industrial
Clear Segmentation Strategy Focused on High Value-AddedProducts…
Manage for Cash High GROWTHLow Medium
• Focus onsolutions
• Diversificationand innovation
• Competition on aglobal basis
• Take selectiveM&Aopportunities
Look for ProfitableGrowth
Research Innovation &Product Development Operations Purchasing Logistics
• Product engineering drivenby customer needs
• Telecom: innovative fibresand products
• Continuous efficiencies onvariable costs: reducinglabour costs, minimizingwaste and reducing per unitraw material costs
• Tight centralized control onstrategic materials
• Excellence in customerservice: reliability and speed
Extra HV

5
275
248 26
025
325
3 259
268
206
205
195
193
198
195
19619
6205
050
100150200250300
1995
1996
1997
1998
1999
2000
2001
2002
2003
2004
2005
2006
2007
E
2008
E
2009
E
2010
E
110
103
989183
65545355
22 2941 45
6691 95
020406080
100120
1995
1996
1997
1998
1999
2000
2001
2002
2003
2004
2005
2006
2007
E
2008
E
2009
E
2010
E
6,5 6,7 6,9 7,1 7,48,2 8,6 9,1 9,4 9,8 10,1 10,5
7,7
0
2
4
6
8
10
12
1998 1999 2000 2001 2002 2003 2004 2005 2006 2007E 2008E 2009E 2010E
…To Benefit From Expected Solid Volume Growth Across End-Markets
Million Km Fibre Million Km Pair
Million Tons Conductor
Optical Cables Copper Cables
Energy Cables Reference Market
Telecom Cables Reference Market
CAGR: 3.6%
CAGR: 7.3%
• Historically low correlationwith economic cycle
• Growth driven by:• Investments in power grid
interconnections• Investments in power
transmission anddistribution
• Infrastructure investments
• Market growth driven by increased investment infibre access networks (FTTx) • Demand supported by investments in emerging markets
Source: CRU data, April 2007. Energy = Low Voltage and Power Cable; TLC = External Copper Tlc Cable, Singlemode Fibre Optic, Multimode Fibre Optic. For Optical cable producers
CAGR: 0.4%
CAGR: 4.3%
CAGR: 12.8%CAGR: (2.3)%

6
3.8773.407 3.725
5.1595.007
3.742
2004 2005 2006 LTM9M07
9M06 9M07
+8.2%*
9M07 Key Financials
Sales Adjusted EBITDA1
Net Working Capital
405
265
407
492
320
208
2004 2005 2006 LTM9M07
9M06 9M07
6.1% 7.1% 8.1%
442
680 676
490
2005 2006 9M06 9M07
13.1% 8.8%
Net Financial Position
Adjusted EBIT1
356
108
262
424
330
171
2004 2005 2006 LTM9M07
9M06 9M07
3.2% 4.6% 6.6%
892 8791.071
899
2005 2006 9M06 9M07
Euro Millions, % of Sales
¹ EBITDA and EBIT adjusted excluding non-recurring items.
* Organic Growth** Like for like excl. UK ROD business 10.5%8.6% 7.0% 9.2%
13.0% 13.1%
+9.3%*
9.5% 8.2%
3,475**

7
Agenda
Company Overview
Financials
Outlook
Appendix
•
•
•
•

8
Profit and Loss StatementEuro Millions
1 Adjusted for closing of UK ROD business in December 2006 (€250m of sales in 9M 2006)2 Defined as: Adjusted EBITDA + Fixed costs3 Including in Q2 €39m profit from Purchase Price Adjustment with Pirelli4 Including in Q2 2007 Bank Fees write-off equal to €59m
9M 2006 9M 2007 F Y 2006
Sales 3,725 3,877 5,007YoY total growth 4.1% 33.8%
YoY like for like growth 1 11.6% 33.8%YoY organic growth 8.2% 9.3%
Contribution Margin2 620 726 827% on sales 16.6% 18.7% 16.5%
Fixed Costs and Others (Excl.Nonrecurring items)
(300) (321) (420)
Non recurring items 3 (19) 34 (36)
EBITDA 302 439 371% on sales 8.1% 11.3% 7.4%
Adjusted EBITDA 320 405 407% on sales 8.6% 10.5% 8.1%
EBIT 228 390 258% on sales 6.1% 10.1% 5.2%Non recurring items (34) 34 (72)Adjusted EBIT 262 356 330% on sales 7.0% 9.2% 6.6%
Financial charges 4 (66) (76) (110)
EBT 162 314 147% on sales 4.4% 8.1% 2.9%
Taxes (66) (76) (56)% on EBT 40.7% 24.2% 38.2%
Net income 96 238 91
Net income attributable to the Group 94 236 89

9
3,457
3,082
3,332
9M 2006 Chg. Perimeter UKROD
9M 2006 L-for-L Organic Growth Metals Effect Exchange Rate 9M 2007
-250
125
-11261
Sales Drivers Vs Third Parties
3,877
3,475
3,725
9M 2006 Chg. Perimeter UKROD
9M 2006 L-for-L Organic Growth Metals Effect Exchange Rate 9M 2007
-250
134
-16
284
393 393
420
9M 2006 Chg. Perimeter 9M 2006 L-for-L Organic Growth Metals Effect Exchange Rate 9M 2007
23
-50
9
Euro Millions
Energy Cables & Systems Division
+8.5%
Telecom Cables & Systems Division
+5.9%
Total Consolidated
+8.2%

10
1.4221.351
1.924
1.199
1.445
1.853
2004 2005 2006 LTM9M07
9M06 9M07
Utilities
183156
224
108
143
197
2004 2005 2006 LTM9M07
9M06 9M07
Euro Millions, % of Sales
Sales Vs Third Parties Adjusted EBITDA Adjusted EBIT
161
127
191
157
107
76
2004 2005 2006 LTM9M07
9M06 9M07
POWER DISTRIBUTION
• Higher profitability due to a bettergeographical and product mix
• Introduction of New technologyP-Laser cable to further improveprofitability in the medium term
• Significant industrial efficiencies
HIGH VOLTAGE
• New contracts awarded in keymarkets (USA, UK, China)
• Double digit growth driven by 12Morder book
• New High and Extra-High Voltageproduction facility in the strategicUS market by H109
+4.6%*
10.6% 12.9%11.5%11.6% 8.4% 11.3%9.4%9.9%* Organic Growth 9.9%8.9% 7.4%6.3%
SUBMARINE
• Market outlook remain strong
• Major new projects awarded:Cometa, Transbay
• Growing demand in Off-shorewind farms
• Capacity increase completed
• High visibility thanks to growingorder book
Highlights

11
Trade & Installers
1.3811.236
1.790
1.0291.189
1.645
2004 2005 2006 LTM9M07
9M06 9M07
119
82
156
4162
119
2004 2005 2006 LTM9M07
9M06 9M07
Euro Millions, % of Sales
Sales Vs Third Parties Adjusted EBITDA Adjusted EBIT
107
69
139
101
38
17
2004 2005 2006 LTM9M07
9M06 9M07
Highlights
• Selective growth and strong focus on geographical and product mix improvement
• Significant improvement in profitability confirmed due to:
• Strong performance in high profitable European and Extra-European countries
• Double digit growth in LSOH, Fire Performance
• High geographical diversification
• Marginal exposure to US construction market
* Organic Growth
+6.4%*
7.2% 8.6%6.6%8.7% 6.1% 7.7%5.5%7.8%5.2%3.9% 3.2%1.7%
12
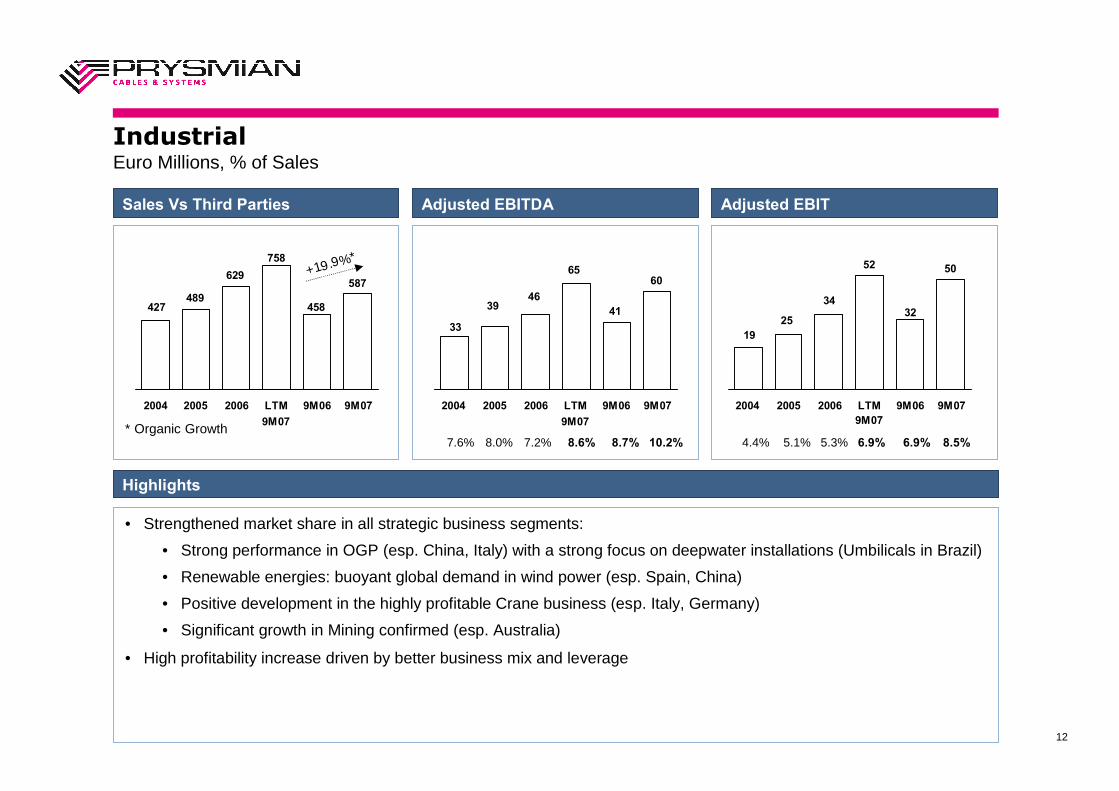
• Strengthened market share in all strategic business segments:
• Strong performance in OGP (esp. China, Italy) with a strong focus on deepwater installations (Umbilicals in Brazil)
• Renewable energies: buoyant global demand in wind power (esp. Spain, China)
• Positive development in the highly profitable Crane business (esp. Italy, Germany)
• Significant growth in Mining confirmed (esp. Australia)
• High profitability increase driven by better business mix and leverage
50
32
52
19
34
25
2004 2005 2006 LTM9M07
9M06 9M07
Industrial
587
458
758
489
629
427
2004 2005 2006 LTM9M07
9M06 9M07
60
41
65
3946
33
2004 2005 2006 LTM9M07
9M06 9M07
Euro Millions, % of Sales
Sales Vs Third Parties Adjusted EBITDA Adjusted EBIT
Highlights
+19.9%*
* Organic Growth7.2% 10.2%8.7%8.6% 5.3% 8.5%6.9%6.9%8.0%7.6% 5.1%4.4%

13
• Optical cables:
• Lower market demand in USA impacting sales growth and profitability
• Growing demand in EMEA confirmed
• Increasing presence in APAC
• Renewal of multi-year agreement with Telstra in Australia
• Strengthening leadership in aerial cables growing market (esp.emerging countries)
• Price still under pressure
Telecom Division
Sales Vs Third Parties
3634
41
1719
39
2004 2005 2006 LTM9M07
9M06 9M07
Adjusted EBITDA
3332
36
(9) 1
35
2004 2005 2006 LTM9M07
9M06 9M07
Adjusted EBIT
420393
533
424
506
463
2004 2005 2006 LTM9M07
9M06 9M07
Highlights
7.2% 8.4%8.4%7.7% 6.6% 7.8%7.8%6.8%
+5.9%*
* Organic Growth 4.4%3.6% 0.3%n.m.
Euro Millions, % of Sales
• Copper cables:
• Keep focus on product miximprovement (XDSL)
• Increase customer base inEmerging markets

14
Balance SheetEuro Millions
9M 2006 9M 2007 F Y 2006
Net fixed assets 874 872 875
Net working capital 680 676 442
NWC as % on sales 13.0% 13.1% 8.8%
Provisions (175) (138) (140)
Net Capital Employed 1,379 1,410 1,177
Employee provisions 129 115 128
Shareholders' equity 179 396 170
of which attributable to minority interest 19 22 19
Net financial position1 1,071 899 879
Debt Shareholders Loans 41 - 42
Bank Fees (73) (22) (63)
Net financial position vs Third Parties 1,103 921 900
Total Financing and Equity 1,379 1,410 1,177
15
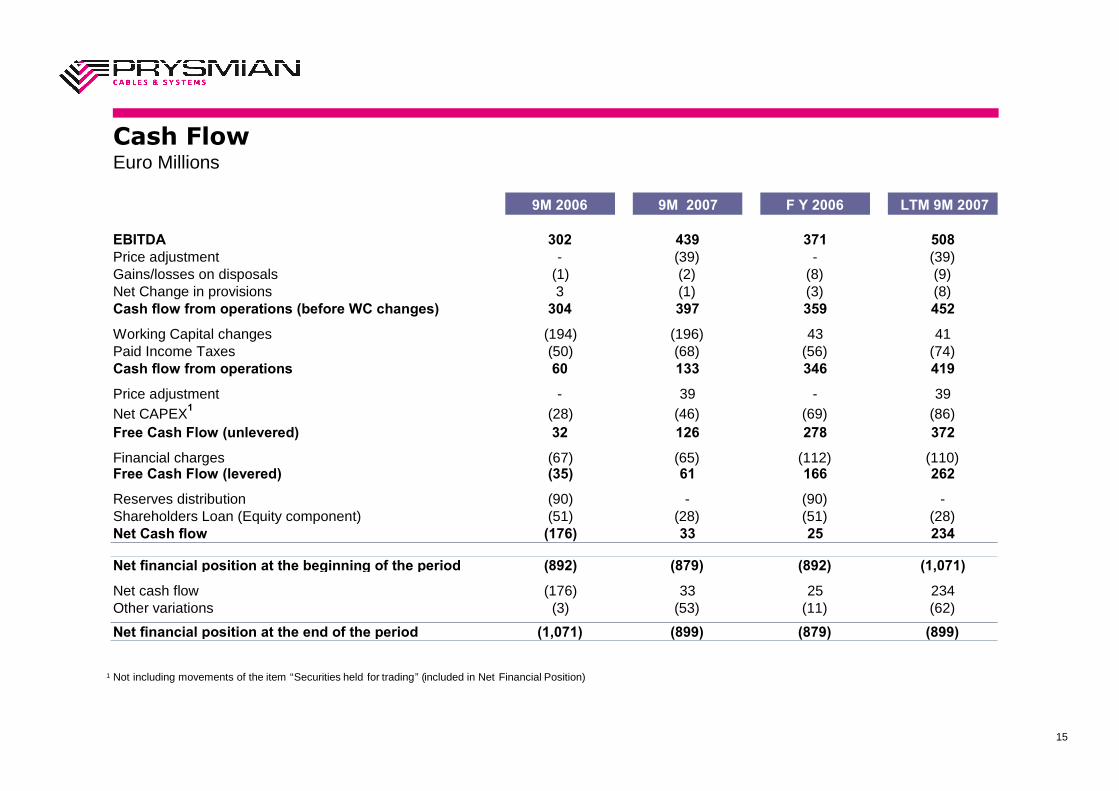
Cash FlowEuro Millions
1 Not including movements of the item “Securities held for trading” (included in Net Financial Position)
9M 2006 9M 2007 F Y 2006 LTM 9M 2007
EBITDA 302 439 371 508Price adjustment - (39) - (39)Gains/losses on disposals (1) (2) (8) (9)Net Change in provisions 3 (1) (3) (8)Cash flow from operations (before WC changes) 304 397 359 452
Working Capital changes (194) (196) 43 41Paid Income Taxes (50) (68) (56) (74)Cash flow from operations 60 133 346 419
Price adjustment - 39 - 39Net CAPEX1 (28) (46) (69) (86)Free Cash Flow (unlevered) 32 126 278 372
Financial charges (67) (65) (112) (110)Free Cash Flow (levered) (35) 61 166 262
Reserves distribution (90) - (90) -Shareholders Loan (Equity component) (51) (28) (51) (28)Net Cash flow (176) 33 25 234
Net financial position at the beginning of the period (892) (879) (892) (1,071)
Net cash flow (176) 33 25 234Other variations (3) (53) (11) (62)
Net financial position at the end of the period (1,071) (899) (879) (899)

16
Agenda
Company Overview
Financials
Outlook
Appendix
•
•
•
•

17
2007 Outlook
• Positive market outlook expected to continue
• Consolidate solid organic sales growth
• Maintain positive trends in Utilities and Industrial
• FY Adj.EBITDA: confirmed well in excess of €500m
• Continuous strong cash conversion