Embed Size (px)
Citation preview

Association for Financial Markets in Europe
www.afme.eu
Prudential data report
EU GSIBs prudential capital and liquidity
Q4: 2015
Contents
Prudential data report Page 2
Contents
Highlights ...................................................................................................................................................................................... 3 Fresh capital raised by EU banks (€bn) ..................................................................................................................................................................................................................... 3 EU GSIBs capital and liquidity ratios and fresh capital raised by EU banks ................................................................................................................................................ 3 Change in CET1 and RWAs by EUGSIB (YoY,%, end-point) ............................................................................................................................................................................... 4
Major upcoming regulatory, legislative and policy initiatives .................................................................................................. 4 1 Capital and liquidity ratios ........................................................................................................................................................................... 5
1.1 CET1 ratio: phased-in (weighted average) ................................................................................................................................................................................................... 5 1.2 Cumulative percentage change of CET1, RWAs and CET1 ratio (phased-in) .................................................................................................................................. 5 1.3 CET1: phased-in (EUR bn) ................................................................................................................................................................................................................................... 5 1.4 RWAs: phased-in (EUR bn) ................................................................................................................................................................................................................................. 6 1.5 CET1 ratio: end-point (weighted average) ................................................................................................................................................................................................... 6 1.6 Change in CET1 by components ........................................................................................................................................................................................................................ 6 1.7 Difference between current CET1 ratios and 2019 minimum requirement incl. G-SIB buffer by bank ............................................................................... 7 1.8 Weighted average of EU GSIBs’ CET1 ratios relative to end-point target assuming a 2.5% countercyclical buffer ........................................................ 7 1.9 Tier 1 ratio: phased-in (weighted average) .................................................................................................................................................................................................. 7 1.10 Cumulative percentage change of T1, RWAs and T1 ratio (phased-in) ............................................................................................................................................. 8 1.11 Tier 1 ratio: end-point (weighted average) .................................................................................................................................................................................................. 8 1.12 RWAs by risks........................................................................................................................................................................................................................................................... 8 1.13 RWAs by risks and EU GSIB ................................................................................................................................................................................................................................ 9 1.14 RWA densities (weighted average) .................................................................................................................................................................................................................. 9 1.15 Leverage ratio: end-point (simple average) ................................................................................................................................................................................................. 9 1.16 Liquidity Coverage Ratio (LCR) ...................................................................................................................................................................................................................... 10
2 Debt securities and contingent convertibles ............................................................................................................................................ 11 2.1 EU GSIBs simple average long-term credit rating ................................................................................................................................................................................... 11 2.2 EU GSIBs debt outstanding by seniority ..................................................................................................................................................................................................... 11 2.3 Maturity profile of EU 28 Banks’ outstanding debt securities (EUR bn, maturity in years)................................................................................................... 11 2.4 CoCos by capital tiering (EUR bn) ................................................................................................................................................................................................................. 12 2.5 CoCos by loss absorbing mechanism (quarterly, EUR bn) ................................................................................................................................................................... 12 2.6 CoCos by loss absorbing mechanism (annual, EUR bn) ........................................................................................................................................................................ 12 2.7 CoCos by credit rating at date of issuance (EUR bn) .............................................................................................................................................................................. 13 2.8 CoCos by trigger (EUR bn) ................................................................................................................................................................................................................................ 13 2.9 CoCos by maturity at date of issuance (EUR bn) ..................................................................................................................................................................................... 13 2.10 CoCo prices by capital tiering .......................................................................................................................................................................................................................... 14 2.11 CoCo prices by risk and location .................................................................................................................................................................................................................... 14 2.12 CoCo option adjusted spreads (OAS) ........................................................................................................................................................................................................... 14 2.13 Recently issued CoCos by European Banks ............................................................................................................................................................................................... 15
Summary of the methodologies adopted in this report........................................................................................................... 16
Annex ........................................................................................................................................................................................... 20

Highlights
Prudential data report Page 3
“EU GSIBs increased their Common Equity Tier 1 Capital ratio (CET1 ratio) from 10% in 4Q13 to 11.9% in 4Q15.”
Fresh capital raised by EU banks
(€bn)
Source: Dealogic
Highlights
European systemically important banks (or EU-GSIBs1.) improved their capital, leverage and liquidity positions during 2015, in compliance with CRDIV.
The CRDIV rules comprise minimum requirements on capital adequacy, liquidity and leverage positions, which seek to enhance the soundness of bank’s balance sheets.
This report collates timely information on EU GSIBs’ prudential capital, leverage and liquidity ratios with updated information as at 31 December 2015.
Among the main findings of this report are:
EU GSIBs increased their end-point Common Equity Tier 1 Capital ratio (CET1 ratio) to 11.9% at the end of 2015, from 11.0% in 2014 and 10.0% in 2013.
End-point Tier 1 ratios increased to 13.3% in 2015, from 11.9% in 2014 and 10.7% in 2013.
Leverage ratios also continued to improve in 2015, with a simple average ratio of 4.8% in 2015 calculated on an end-point basis, from 4.3% in 2014 and 3.8% in 2013.
Available information indicates the weighted average2 Liquidity Coverage Ratio (LCR) stood at 128.5% in 4Q15, above the minimum required by 1 January 2018 (100%).
EU GSIBs capital and liquidity ratios and fresh capital
raised by EU banks (as at 31 December 2015)3
Source: EU GSIBs balance sheets, EBA and Dealogic
The continued improvement in capital ratios is consistent with the increase in capital raising during 2015. In 2015, EU banks raised around €58.6bn in fresh capital from the markets, of which €31.3bn was in the form of equity and €27.3bn in CoCos and other convertible debt. This estimate adds to the total capital raised since the 2009 crisis of €372bn (see figure in left panel). This estimate, however, does not take into account capital raised through internal generation (retained earnings) and balance sheet restructuring.
1 . The Banks aggregated in this report are the 14 EU GSIBs as designated by the FSB in
2014, which was in force in 3Q15. In November 2015, the FSB updated the list of systemically important banks, changing the number of EU GSIBs from 14 to 13.The assignment of the GSIBs to the respective buckets will apply from 1 January 2017. 2 Weighted by end-point RWAs with information of 7 of the 14 EUGSIBs that have reported
LCRs as of 4 March. 3 2014 LCR is sourced from the EBA’s September 2015 Basel III monitoring exercise
95.6
27.9 21.712.7
41.633.9 31.3
8.4
1.4 12.0
6.1
10.8 32.127.3
4.1
1.21.0
0.7
2.1
0.10.0
0
20
40
60
80
100
120
2009 2010 2011 2012 2013 2014 2015
Convertibles
CoCos
Follow-ons
2013 2014 2015CET1 ratio (end-point) 10.0% 11.0% 11.9%
T1 ratio (end-point) 10.7% 11.9% 13.3%
Leverage ratio (end-point) 3.7% 4.3% 4.7%
LCR - 127.5% 128.5%
Fresh capital raised (€bn) 54.5 66.1 58.6
of which CoCos (€bn) 10.8 32.1 27.3
EU GSIBs
EU banks

Major upcoming regulatory, legislative and policy initiatives
Prudential data report Page 4
“Leverage ratios have improved across all EU GSIBs. The average end-point leverage ratio increased from 3.8% in 4Q13 to 4.8% in 4Q15”
Change in CET1 and RWAs by
EUGSIB (YoY,%, end-point)4
Source: EU GSIBs balance sheets
4 The quarterly changes are expressed in the original reporting
currencies
Highlights
Capital, leverage and liquidity ratios The annual increase in CET1 ratio (on a phased-in basis) was attributed to a 5.6% nominal increase in capital and a 1.0% reduction of Risk-Weighted Assets (RWAs).
By banks5, five of the fourteen EU GSIBs increased6 their RWAs and CET1 capital from the values reported in 4Q14; three reduced both RWAs and CET1 capital; three increased CET1 capital but reduced their RWAs; and one decreased CET1 capital and increased RWAs (see graph on left panel).
Leverage ratios have also improved across all EU GSIBs. The average end-point leverage ratio increased from 3.8% in 4Q13 to 4.8% in 4Q15. This ratio is above the minimum internationally required of 3% due to be in force by Jan’18.
Available information indicates that the average LCR stood above the minimum required ratio of 100% due to be in force by Jan’18. The average LCR stood at 128.5% in 4Q15.
Issuance: Contingent Convertibles (CoCo) European banks raised a total of €27.3bn in fresh capital in the form of CoCos during 2015, a decrease of 15% compared with the volume originated in 2014 (€32.1bn). Of these new issues, average coupons7 increased from 6.16% in 2014 to 6.47% in 2015 on a weighted average basis.
Prices: contingent convertibles CoCo prices had mixed performances during 2015. CoCo instruments contingent on Tier I performance rose 0.41% YoY, while Tier II CoCos fell by 1.2% YoY. CoCo prices fell during the first two months of 2016 (-10% YtD), possibly reflecting some (unfounded) general market concerns regarding the ability of some banks to service coupons on Tier 2 instruments.
Major upcoming regulatory, legislative and policy initiatives
There are several regulatory initiatives that are currently being considered at both the international level (BCBS) and at the European level (EBA). These will impact the basis of calculations for the metrics covered in this report when they enter into force. Some of the key initiatives are:
Review of the Leverage Ratio Fundamental Review of the Trading Book Credit Valuation Adjustment IRB models, revised Standardised Approaches & capital
floors Interest Rate Risk in the Banking Book
AFME is actively contributing on all of these fronts.
5 12 of the 14 banks that have reported end-point RWAs and capital levels as of 4 March.
6 Variations based on the values reported in the original currencies of the financial
statements. 7 Weighted average by EUR deal value, taking into account only fixed rate notes.
-8%
-6%
-4%
-2%
0%
2%
4%
6%
8%
10%
12%
-35% -25% -15% -5% 5% 15%Ch
an
ge
in
CE
T1
Change in RWAs

Capital and liquidity ratios
Prudential data report Page 5
1 Capital and liquidity ratios8
1.1 CET1 ratio: phased-in (weighted average)
Source: EU GSIBs balance sheets
1.2 Cumulative percentage change of CET1, RWAs
and CET1 ratio (phased-in)9
Source: EU GSIBs balance sheets
1.3 CET1: phased-in (EUR bn)
Source: EU GSIBs balance sheets
8 The Banks aggregated in this report are the 14 EU GSIBs as designated by the FSB in
2014 which was in force in 4Q15 9 The lines represent the cumulative percentage change of aggregate RWAs, CET1 capital
and the weighted average CET1 ratio.
CET 1 ratio: phased-in
EU GSIBs have complied with the CRDIV rules which entered into force on 1 January 2014.
The weighted average of EU GSIB’s Common Equity Tier 1 capital (CET1) ratios has increased10, on a phased-in approach, from 10.6% in December 2013 to 12.2% in December 2015.
During 4Q15, phased-in CET1 ratios increased by 30bps on a quarterly basis, standing above the minimum required in 2015 by the CRDIV regulation.
Progress towards increasing CET1
The improvement in the average CET1 phased-in ratio is explained by a cumulative nominal increase of 14% in CET1 capital in EUR terms from March 2014 to December 2015, which more than compensated the cumulative 1% increase of RWA during the same period.
The amount of CET1 capital of 13 of the 14 EU GSIBs on a phased-in basis has increased by €97bn, from €648bn in March 2014 to €745bn in September 2015.
The increase in CET1 capital in 1Q15 was partially explained by the abnormal depreciation of the EUR against non-EUR currencies in which some of the EU GSIBs report their financial statements (USD and GBP).
CET 1 capital in EUR grew 0.5% QoQ during 4Q15. Estimating the quarterly change in the original reporting currencies (isolating FX EUR effects), five EU GSIBs decreased their CET1 capital during the quarter, with a simple average change of +0.2% QoQ when taking into account all EU GSIBs. This would suggest that FX factors contributed, once again, to the increase in CET1 capital during 4Q15, although not to the same extent as it did in 1Q15.
10
CET1 ratios are the amount of CET1 capital that banks hold as proportion of risk-weighted assets (RWA). On a phased-in approach, certain transitional provisions are applied to the calculation of capital related to the treatment of deferred taxes, securitisation, and unrealised losses, amongst others.
10.6% 10.8% 11.1% 11.3% 11.5% 11.5% 11.8% 11.9%
12.2%
0%
2%
4%
6%
8%
10%
12%
14%
16%
4Q13 1Q14 2Q14 3Q14 4Q14 1Q15 2Q15 3Q15 4Q15
90%
95%
100%
105%
110%
115%
120%
1Q14 2Q14 3Q14 4Q14 1Q15 2Q15 3Q15 4Q15
CET1RWACET1 ratio
647.8
669.0
694.5705.4
748.2750.4
741.7 745.2
600
650
700
750
800
1Q14 2Q14 3Q14 4Q14 1Q15 2Q15 3Q15 4Q15

Capital and liquidity ratios
Prudential data report Page 6
1.4 RWAs: phased-in (EUR bn)
Source: EU GSIBs balance sheets
1.5 CET1 ratio: end-point (weighted average)
Source: EU GSIBs balance sheets
1.6 Change in CET1 by components
Source: EU GSIBs balance sheets
The amount of RWAs has marginally increased from €6.0tn in March 2014 to €6.1tn in December 2015, representing a cumulative change of 1.1% during the period.
During 4Q15, RWAs decreased from €6.2tn to €6.1tn, equivalent to a decrease of 2.2% QoQ.
As with CET1 capital, a significant increase in RWAs was observed in 1Q15, partly explained by the abnormal depreciation of the EUR against the USD and the GBP. However, during 4Q15, the continued balance sheet deleveraging more than compensated the positive impact of FX depreciation on RWAs growth. During the latest quarter, the simple average quarterly change of RWAs in the currencies in which banks report their financial statements stood at -2.8%, suggesting that factors beyond macroeconomic FX corrections may explain the decrease in RWAs.
CET1 end-point basis
On an end-point basis11, the average CET 1 ratio has increased from 10.0% in December 2013 to 11.9% in December 2015. These ratios are comparable with a minimum required CET1 ratio of 4.5% in 2015 and between 8%-12% required from 2019 onwards, depending on factors such as the size of the bank, the phased-in process of the capital conservation buffer, and the countercyclical buffer applied in the bank’s domicile12.
In 4Q15, the quarterly decrease in RWAs and the depreciation of the EUR (among other factors) contributed to improve CET1 end-point ratios by 29 bps and 21 bps respectively. Negative earnings reported during the quarter contributed to a decrease in the ratio by 11 bps in 4Q15.
11
Under the end-point approach, the proportion of CET 1 capital to risk weighted assets is calculated as if the rules due to apply at the end of the transition period were in force. 12
The minimum required ratio in 2019 depends on the bucket in which the GSIB is allocated to, which ranges from 1-2.5% (0% for non-GSIBs), and the Countercyclical Buffer implemented by the NCAs which ranges from 0-2.5%. See Annex for further details.
6,023 6,035 6,127 6,152
6,507 6,333
6,226 6,090
5,000
5,500
6,000
6,500
7,000
1Q14 2Q14 3Q14 4Q14 1Q15 2Q15 3Q15 4Q15
10.0% 10.2% 10.6% 10.9% 11.0% 11.1% 11.4% 11.5%
11.9%
0%
2%
4%
6%
8%
10%
12%
14%
16%
4Q13 1Q14 2Q14 3Q14 4Q14 1Q15 2Q15 3Q15 4Q15
11.47%0.29%
-0.11%
0.21% 11.86%
10.0%
10.5%
11.0%
11.5%
12.0%
12.5%
CET1Sep 15
RWAs 4Q15 retained earnings
FX and others CET1 Dec 15

Capital and liquidity ratios
Prudential data report Page 7
1.7 Difference between current CET1 ratios and
2019 minimum requirement incl. G-SIB buffer by
bank (4Q15, end-point, absolute difference in %)
Source: EU GSIBs balance sheets
1.8 Weighted average of EU GSIBs’ CET1 ratios
relative to end-point target assuming a 2.5%
countercyclical buffer (absolute difference in %)
Source: EU GSIBs balance sheets
1.9 Tier 1 ratio: phased-in (weighted average)
Source: EU GSIBs balance sheets
Surplus in minimum requirements13
Assuming that EU GSIBs maintain their current GSIB bucket allocation and assuming a 0% countercyclical buffer, data as of 4Q15 suggest that all banks have already complied with the 2019 ratios required due to their systemic importance (rows in 1.7).
Taking a step further, assuming that the maximum 2.5% Countercyclical Buffer (vertical line in Chart 1.7) is applied to all EU GSIBs in 2019, eight of the 14 banks are found to be above this requirement.
On an aggregate basis, the weighted-average14 of EU GSIB’s CET1 ratios stood in 4Q15 above the maximum Pillar I requirements due to be in force in 2019. This measure (Chart 1.8) assumes that banks are allocated in their current individual GSIB bucket, and the maximum countercyclical buffer is set at 2.5% to all EU GSIBs. This figure assumes the GSIB bucket allocation in 4Q15, which however was recently updated by the FSB, affecting in particular two EU GSIBs.
This figure represents a marked improvement on the aggregate shortfall observed in December 2013 of 1% relative to RWAs, and a balanced fulfilment of 2019 requirements in 4Q14.
Taking into account banks’ Pillar I and Pillar II requirements that have to be met with CET1 capital, estimations indicate a weighted average surplus on CET1 ratios in 4Q15 of 0.6% if the countercyclical buffer is set at 0% in all jurisdictions (or a shortfall of 1.9% assuming a stressed scenario if the buffer is set at 2.5%).
Tier 1 Capital
EU GSIBs have also complied with the requirements on Tier 1 capital ratios. T1 capital is a comprehensive measure of capital that encompasses CET1 capital
and Additional Tier 1 capital15.
13
EU GSIBs shall comply with minimum CET1 ratios of between 8% and 12% from January 2019. The required ratio will depend on the G-SIB bucket the bank is assigned to (additional capital buffer between 1% and 2.5%) and the Countercyclical Buffer approved by national authorities which can reach a maximum of 2.5%. 14
Weighted by RWAs value. 15
Contingent Convertible bonds, subject to conditions, are included in AT1 capital. This market is discussed in Section II of this report.
0% 2% 4% 6% 8% 10%
B14
B13
B12
B11
B10
B9
B8
B7
B6
B5
B4
B3
B2
B1
2.5% maximum countercyclical buffer
-1.0%
-0.8%
-0.4%
-0.1%
0.0% 0.1%
0.4%0.4%
0.8%
-1.5%
-1.0%
-0.5%
0.0%
0.5%
1.0%
4Q13 1Q14 2Q14 3Q14 4Q14 1Q15 2Q15 3Q15 4Q15
Surplus
Shortfall
12.0% 11.8% 12.3%12.6% 12.8% 12.8% 13.2% 13.4%
13.8%
0%2%4%6%8%
10%12%14%16%18%20%22%
4Q13 1Q14 2Q14 3Q14 4Q14 1Q15 2Q15 3Q15 4Q15

Capital and liquidity ratios
Prudential data report Page 8
1.10 Cumulative percentage change of T1, RWAs and
T1 ratio (phased-in)16
Source: EU GSIBs balance sheets
1.11 Tier 1 ratio: end-point (weighted average)
Source: EU GSIBs balance sheets
1.12 RWAs by risks
Source: EU GSIBs balance sheets
16
The lines represent the cumulative percentage change of aggregate RWAs, T1 capital and the weighted average T1 ratio.
The ratio is measured as proportion of RWAs.
On a phased-in basis, EU GSIBs have increased on average their T1 ratios to 13.8% in 4Q15 from 12.0% in 4Q13 and 13.4% in 3Q15, an improvement of 180 bps and 40 bps respectively.
By components (Chart 1.10), the cumulative increase in the Tier 1 ratio is explained by an increase of 17% in the amount of Tier 1 capital from March 2014 to December 2015, which more than compensated the increase in EUR terms in RWAs of 1% during the period.
During 4Q15, the amount of Tier 1 capital stood almost unchanged from 3Q15, while the amount of RWAs decreased 3% QoQ, supporting a quarterly increase in the T1 ratio from 13.4% to 13.8%.
On an end-point basis, Tier 1 capital ratios have improved on average from 10.7% in December 2013 to 13.3% in December 2015. This ratio is comparable with a minimum required ratio of 6% in 2015 and between 9.5% and 13.5% in 201917, taking into account only Pillar I requirements.
Risk-weighted assets
The breakdown of Risk-Weighted Assets (RWA) by risk components has maintained relatively unchanged since 2014. Around 82% of RWAs are comprised by credit-related risks, 11.8% by operational risks and 6.3% by market risks.
These proportions will however change following the implementation of the remainder of the Basel package with the final trading book proposals pushing up market risk assets to around 10% before other changes are taken into account.
17
As with CET1 capital ratios, the minimum required ratio in 2019 depends on the bucket in which the GSIB is allocated to, which ranges from 1-2.5% (0% for non-GSIBs), and the countercyclical buffer implemented by the NCAs which ranges from 0-2.5%. Further details of the implementation timetable are in the Annex.
90%
95%
100%
105%
110%
115%
120%
1Q14 2Q14 3Q14 4Q14 1Q15 2Q15 3Q15 4Q15
T1RWAT1 ratio
10.7% 11.0% 11.8% 12.2% 11.9% 12.1% 12.5% 12.7%
13.3%
0%
2%
4%
6%
8%
10%
12%
14%
16%
18%
20%
4Q13 1Q14 2Q14 3Q14 4Q14 1Q15 2Q15 3Q15 4Q15
78.8% 79.9% 81.0% 82.3% 82.0% 82.4% 82.0% 81.9%
10.0% 9.3% 8.1% 6.9% 7.4% 6.6% 6.6%6.3%
11.2%10.8% 10.8% 10.9%10.7% 11.0% 11.4%11.8%
0%
20%
40%
60%
80%
100%
1Q14 2Q14 3Q14 4Q14 1Q15 2Q15 3Q15 4Q15
Credit Market Operational

Capital and liquidity ratios
Prudential data report Page 9
1.13 RWAs by risks and EU GSIB18
Source: EU GSIBs balance sheets
1.14 RWA densities (weighted average)19
Source: EU GSIBs balance sheets
1.15 Leverage ratio: end-point (simple average)
Source: EU GSIBs balance sheets
18
Breakdown as of 4Q15 for 12 of the 14 EU GSIBS. Others are presented as of latest available 19
Phased-in RWAs as proportion of total assets.
The breakdown of RWAs by risk components has low variation between EU GSIBs. In the fourth quarter of 2015, 10 of the 14 EU GSIBs had an exposure to credit risks above 80% of RWAs (with a maximum of 90% and a minimum of 65%), while 4 of the 14 EU GSIBs reported an exposure above 10% to market risks (range between 14% and 1.8%). In relation to operational risks, 12 of the 14 EU GSIBs reported an exposure above 10% of RWAs to operational risks (range between 22.7% and 7.8%).
RWA densities
The ratio of RWAs as a proportion of total assets marginally increased in 4Q15 to 35.7%, from 35.3% observed in 3Q15. Total assets in EUR decreased 3.3% on a quarterly basis and 2.8% on an annual basis.
The 4Q15 figure is, however, below the density observed in 4Q13, when the weighted average RWA density stood at 38%.
Metrics of dispersion such as standard deviation and max-min differences between banks’ RWA densities indicate that the dispersion between EU GSIBs densities has decreased since the 4Q13.
Leverage ratio
EU GSIBs have progressively improved their leverage ratios since 2013. Leverage ratios are a measure of Tier 1 capital as proportion of the bank’s total exposure (on- and off-balance sheet assets.)
On an end-point basis, the simple average of EU GSIB leverage ratios has improved from 3.8% in December 2013 to 4.8% in December 2015. The leverage ratios have also improved compared to 3Q15, from 4.6% reported a quarter ago.
These ratios are comparable with a global minimum standard of 3% according to the Basel III accord.
81.9%
6.3%
11.8%
0%
20%
40%
60%
80%
100%
B1
B2
B3
B4
B5
B6
B7
B8
B9
B1
0
B1
1
B1
2
B1
3
B1
4
EU
GSI
Bs
Credit Market Operational
38.0% 36.7% 36.4% 35.3% 35.1% 33.8% 35.3% 35.3%
35.7%
0%
10%
20%
30%
40%
50%
60%
70%
4Q13 1Q14 2Q14 3Q14 4Q14 1Q15 2Q15 3Q15 4Q15
3.8%4.0%
4.2%4.3%
4.3% 4.4% 4.5% 4.6%
4.8%
0%
1%
2%
3%
4%
5%
6%
7%
4Q13 1Q14 2Q14 3Q14 4Q14 1Q15 2Q15 3Q15 4Q15

Capital and liquidity ratios
Prudential data report Page 10
1.16 Liquidity Coverage Ratio (LCR)
Source: EU GSIBs balance sheets
Liquidity Coverage Ratio (LCR)
CRD IV requires banks to have a sufficient level of High Quality Liquid Assets (HQLA) to withstand a stressed funding scenario of 30 days20. More specifically, it requires that HQLA relative to total net cash outflows over a 30 day time period are greater than or equal to 100%.
Banks must meet 60% of the LCR requirement from October 2015, 70% from 1 January 2016, 80% from 1 January 2017, and 100% from 1 January 2018 (timescale in Graph 1.16).
Available information21 indicates that the weighted LCR is already above the 2018 minimum required ratios (100%). The weighted average LCR stood at 128.5% in 4Q15, with a growing trend across EU GSIBs22.
20
See EBA Basel III monitoring exercise here. 21
Information was available for seven of the 14 EUGSIBs. Among the banks not included in this calculation, two reported that their LCRs stood above 110% while three banks reported that their ratios stood above 100%. 22
According to the latest EBA Basel III monitoring exercise, as of June 2015, Group 1 banks reported an LCR ratio of 121.1% of which GSIBs had a ratio of 118.1%. However, only 9 EU GSIBs were covered in the EBA report. In the 2014 Basel III monitoring exercise, the average LCR for GSIBs was reported by the EBA at 127% (see here).
128.5%
60%70%
80%
100%
0%
20%
40%
60%
80%
100%
120%
140%
160%
180%4
Q1
4
1Q
15
2Q
15
3Q
15
4Q
15
1Q
16
2Q
16
3Q
16
4Q
16
1Q
17
2Q
17
3Q
17
4Q
17
1Q
18
2Q
18
3Q
18
4Q
18
Weighted average
Timeline LCR implementation
Debt securities and contingent convertibles
Prudential data report Page 11
2 Debt securities and contingent convertibles
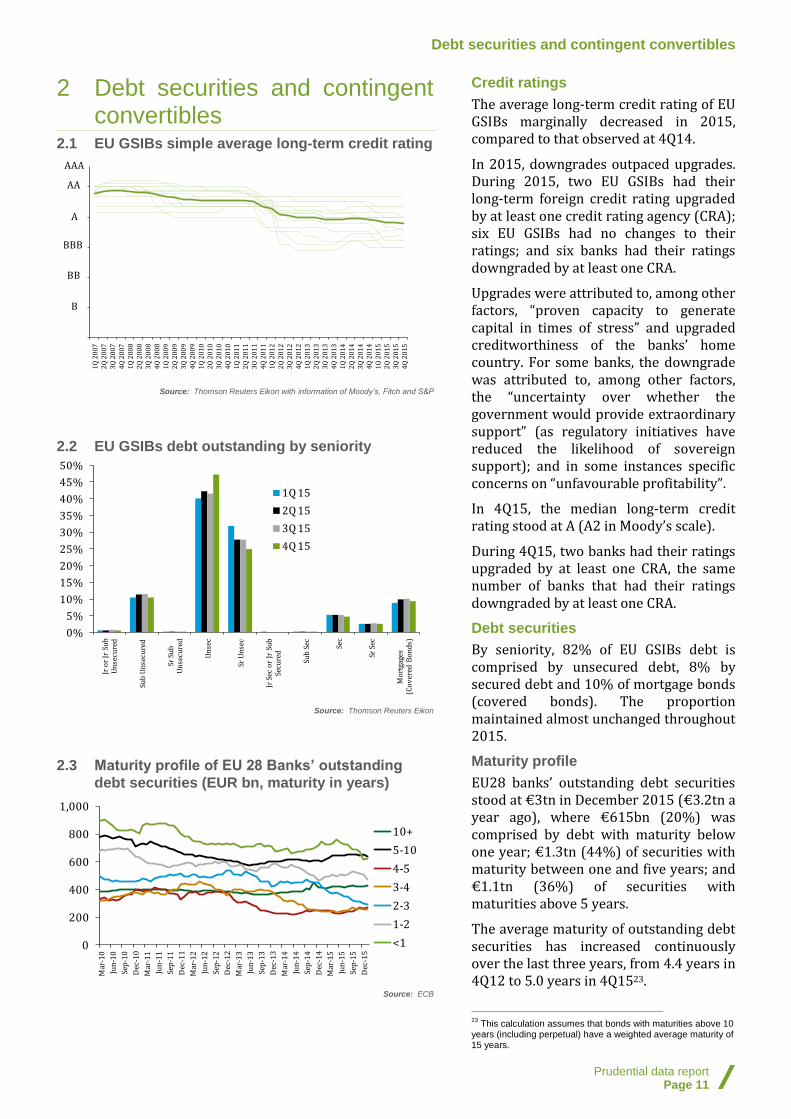
2.1 EU GSIBs simple average long-term credit rating
Source: Thomson Reuters Eikon with information of Moody’s, Fitch and S&P
2.2 EU GSIBs debt outstanding by seniority
Source: Thomson Reuters Eikon
2.3 Maturity profile of EU 28 Banks’ outstanding
debt securities (EUR bn, maturity in years)
Source: ECB
Credit ratings
The average long-term credit rating of EU GSIBs marginally decreased in 2015, compared to that observed at 4Q14.
In 2015, downgrades outpaced upgrades. During 2015, two EU GSIBs had their long-term foreign credit rating upgraded by at least one credit rating agency (CRA); six EU GSIBs had no changes to their ratings; and six banks had their ratings downgraded by at least one CRA.
Upgrades were attributed to, among other factors, “proven capacity to generate capital in times of stress” and upgraded creditworthiness of the banks’ home country. For some banks, the downgrade was attributed to, among other factors, the “uncertainty over whether the government would provide extraordinary support” (as regulatory initiatives have reduced the likelihood of sovereign support); and in some instances specific concerns on “unfavourable profitability”.
In 4Q15, the median long-term credit rating stood at A (A2 in Moody’s scale).
During 4Q15, two banks had their ratings upgraded by at least one CRA, the same number of banks that had their ratings downgraded by at least one CRA.
Debt securities
By seniority, 82% of EU GSIBs debt is comprised by unsecured debt, 8% by secured debt and 10% of mortgage bonds (covered bonds). The proportion maintained almost unchanged throughout 2015.
Maturity profile
EU28 banks’ outstanding debt securities stood at €3tn in December 2015 (€3.2tn a year ago), where €615bn (20%) was comprised by debt with maturity below one year; €1.3tn (44%) of securities with maturity between one and five years; and €1.1tn (36%) of securities with maturities above 5 years.
The average maturity of outstanding debt securities has increased continuously over the last three years, from 4.4 years in 4Q12 to 5.0 years in 4Q1523.
23
This calculation assumes that bonds with maturities above 10 years (including perpetual) have a weighted average maturity of 15 years.
0
3
6
9
12
15
1Q
20
07
2Q
20
07
3Q
20
07
4Q
20
07
1Q
20
08
2Q
20
08
3Q
20
08
4Q
20
08
1Q
20
09
2Q
20
09
3Q
20
09
4Q
20
09
1Q
20
10
2Q
20
10
3Q
20
10
4Q
20
10
1Q
20
11
2Q
20
11
3Q
20
11
4Q
20
11
1Q
20
12
2Q
20
12
3Q
20
12
4Q
20
12
1Q
20
13
2Q
20
13
3Q
20
13
4Q
20
13
1Q
20
14
2Q
20
14
3Q
20
14
4Q
20
14
1Q
20
15
2Q
20
15
3Q
20
15
4Q
20
15
AAA
BBB
AA
A
BB
B
0%
5%
10%
15%
20%
25%
30%
35%
40%
45%
50%
Jr o
r Jr
Su
b
Un
secu
red
Sub
Un
secu
red
Sr S
ub
U
nse
cure
d
Un
sec
Sr U
nse
c
Jr S
ec o
r Jr
Su
b
Secu
red
Sub
Sec Se
c
Sr S
ec
Mo
rtga
ges
(Co
ver
ed B
on
ds)
1Q 15
2Q 15
3Q 15
4Q 15
0
200
400
600
800
1,000
Mar
-10
Jun
-10
Sep
-10
Dec
-10
Mar
-11
Jun
-11
Sep
-11
Dec
-11
Mar
-12
Jun
-12
Sep
-12
Dec
-12
Mar
-13
Jun
-13
Sep
-13
Dec
-13
Mar
-14
Jun
-14
Sep
-14
Dec
-14
Mar
-15
Jun
-15
Sep
-15
Dec
-15
10+
5-10
4-5
3-4
2-3
1-2
<1

Debt securities and contingent convertibles
Prudential data report Page 12
2.4 CoCos by capital tiering (EUR bn)
Source: Dealogic
2.5 CoCos by loss absorbing mechanism (quarterly,
EUR bn)
Source: Dealogic and Thomson Reuters Eikon
2.6 CoCos by loss absorbing mechanism (annual,
EUR bn)24
Source: Dealogic and Thomson Reuters Eikon
24
Total figures may appear not to add up due to rounding. For example, 2013 issuance structured on the basis of principal write down totalled €5.65bn and CoCo issuance in the form of equity conversion totalled €5.14bn.
Contingent capital
Contingent Convertible (CoCo) bonds are hybrid capital securities that absorb losses when the capital of the issuing bank falls below a certain pre-determined threshold25.
European banks issued a total of €27.3bn in CoCo bonds during 2015, representing a decrease of 15% compared to the issuance volume in 2014 at €32.1bn. 74% of the volume underwritten in 2015 was issued in 1Q15 (or €20.3bn), while €0.8bn was issued in 4Q15.
Of these new issues, fixed rate coupons26 increased from 6.16% in 2014 to 6.47% in 2015 on a weighted average basis. In 2014 there were no issues structured with floting rate coupons, while in 2015 five issues (8% of the value originated in 2015) issued by Nordic banks were structured with floating coupons tied with benchmark rates (STIBOR and NIBOR).
By capital tiering, €26.9bn issued instruments in 2015 were structured contingent on Tier I performance and €0.3bn conditional on Tier II. The composition by capital tiering is similar to that observed during 2014, when the majority of issues (86%, or €27.6bn) were structured on the basis of Tier I performance.
On a quarterly basis, the issuance volume in 4Q15 stood significantly below the amount observed in the first quarter of 2015 (€20.3bn) and below the observed in 3Q15 (€2.3bn). All 4Q15 issues were structured contingent on Tier I performance on the basis of principal write down.
CoCos by absorbing mechanism
During 2015, the majority of CoCo instruments underwritten were structured on the basis of principal write down, with a total of €23.4bn issued (86% of the total), and €3.9bn in the form of equity conversion. The breakdown is above that observed in 2014 and 2013, when, for example, 45% of the 2014 volume was issued on the basis of principal write down.
25
BIS (2013) “CoCos: a primer”. BIS Quarterly Review, September 2013. 26
Weighted average by EUR deal value, taking into account only fixed rate coupon notes.
0
5
10
15
20
251
Q 2
01
1
2Q
20
11
3Q
20
11
4Q
20
11
1Q
20
12
2Q
20
12
3Q
20
12
4Q
20
12
1Q
20
13
2Q
20
13
3Q
20
13
4Q
20
13
1Q
20
14
2Q
20
14
3Q
20
14
4Q
20
14
1Q
20
15
2Q
20
15
3Q
20
15
4Q
20
15
Tier II
Tier I
0
5
10
15
20
25
1Q
20
11
2Q
20
11
3Q
20
11
4Q
20
11
1Q
20
12
2Q
20
12
3Q
20
12
4Q
20
12
1Q
20
13
2Q
20
13
3Q
20
13
4Q
20
13
1Q
20
14
2Q
20
14
3Q
20
14
4Q
20
14
1Q
20
15
2Q
20
15
3Q
20
15
4Q
20
15
Equity conversion
Principal Writedown
2010 2011 2012 2013 2014 2015
Writedown 1.3 0.0 5.5 5.6 14.3 23.4
Conversion to Equity 0.1 12.0 0.6 5.1 17.8 3.9
Writedown (%) 92% 0% 90% 52% 45% 86%
Conversion to Equity (%) 8% 100% 10% 48% 55% 14%
Total European 1.4 12.0 6.1 10.8 32.1 27.3

Debt securities and contingent convertibles
Prudential data report Page 13
2.7 CoCos by credit rating at date of issuance (EUR
bn) 27
Source: Dealogic
2.8 CoCos by trigger (EUR bn)
Source: Dealogic and Thomson Reuters Eikon. * 5.125% of the bank or 7.0% of the Group
2.9 CoCos by maturity at date of issuance (EUR bn)
Source: Dealogic
27
Total figures may appear not to add up due to rounding. For example, 2011 AA- issuance totalled €8.96bn, BBB+ issuance totalled €1.48bn and BBB- issuance totalled €1.60bn, a total of €12.04bn rounded to €12.0 bn.
CoCos by credit rating
CoCo securities issued in 2015 have been assessed at issuance date with ratings between BBB and B-. €7.3bn of the equivalent value of issued instruments were rated BBB (26% of the total issuance value), while €0.5bn were rated B- (one issued instrument). The breakdown is comparable with the ratings observed in 2014, when issued CoCos were rated between A- and BB-.
Regarding the 4Q15 issued instruments, one security with a face value of €0.3bn was rated BBB; and one security with €0.5bn in face value was rated B-.
Average trigger
Most CoCo instruments contingent on Tier I performance are typically structured with triggers of 5.125% and 7%. Two CoCo instruments issued in 2015 were structured contingent on the performance of two Tier I thresholds: the issuing bank and the group holding company.
In 2015, 65% of the issuance value was structured with a 5.125% trigger contingent on Tier I performance, while 31% was issued with a 7% trigger conditional on the same form of capital. The two instruments issued in 4Q15 issues were structured on the basis of Tier I performance, one of which was underwritten with a 7% trigger and the other with a trigger of 5.125% on the basis of the issuing bank’s capital performance and 7% on the holding group’s capital.
Average maturity
Most CoCo instruments issued in 2015 and in 2014 were structured in the form of perpetual bonds.
During 2015, 98% of issued CoCos corresponded to perpetual bond instruments. This figure is above the proportion of perpetual bonds issued in 2014 which represented 86% of the total issuance value. Although there has been an increase in the percentage of CoCos structured in the form of perpetual bonds, in 2015 the issuance volume declined on an annual basis (Figure 2.9).
All 4Q15 issues (two securities) were structured in the form of perpetual bonds.
2011 2012 2013 2014 2015
AAA
AA- 9.0
A- 0.8
BBB+ 1.5 4.1
BBB 3.0 9.9 7.3
BBB- 1.6 6.1 1.5 0.9 3.9
BB+ 1.0 5.8 13.2
BB 2.5 7.7 1.5
BB- 1.2 2.6 1.0
B- 0.5
Not rated 1.6 0.2
N/A 0.1
Total 12.0 6.1 10.8 32.1 27.3
0
5
10
15
20
5.1
25
%
6%
7%
8%
5.1
25
% o
r 7
%* 2
%
5%
7%
8.2
5% NA
Tier I capital Tier II capital
2011
2012
2013
2014
2015
0
5
10
15
20
25
30
0-5 6-10 11-20 21-30 Perpetual
2011 2012
2013 2014
2015

Debt securities and contingent convertibles
Prudential data report Page 14
2.10 CoCo prices by capital tiering
Source: Barclays
2.11 CoCo prices by risk and location
Source: Barclays
2.12 CoCo option adjusted spreads (OAS)
Source: Barclays
Valuations
European banks CoCo price indices fell by 0.86% YoY in December compared with the price levels of a year ago. CoCo instruments issued by European banks contingent on Tier I performance rose 0.41% YoY, while CoCo bonds structured on the basis of Tier II performance fell 1.24%. Global Investment Grade (IG) and High Yield (HY) price indices both registered losses in 2015 on a year-on-year basis of 0.14% and 0.61% respectively.
More recent information showed a substantial fall of CoCo prices during the first two months of 2016. The losses varied depending on the sub-asset class of the instrument. Tier I CoCos issued by European banks fell by 10% YtD as of 29 February 2016, while Tier II CoCos fell by 4.0% YtD during the same period.
The peak losses were observed in the first half of February, with a rapid, albeit partial, recovery in the second half of the month (see Figure 2.11)
From a risk perspective, Global IG CoCo instruments fell 5.0% YtD in the first months of 2016, while Global HY CoCo instruments fell 9.5% YtD in the same period.
Option adjusted spreads (OAS)
CoCo spreads rose in tandem with the losses registered in CoCo price indices. OAS of CoCo instruments issued by European banks rose 130 bps in the first two months of the year. Spreads of CoCo instruments issued by European banks and structured on the basis of Tier I performance rose 125 bps, while Tier II CoCo spreads rose 131 bps.
As with price indices, spreads have decreased over the second half of February, although the levels remain above the observed at the start of the year.
80
85
90
95
100
105Ju
n-1
4
Jul-
14
Au
g-1
4
Sep
-14
Oct
-14
No
v-1
4
Dec
-14
Jan
-15
Feb
-15
Mar
-15
Ap
r-1
5
May
-15
Jun
-15
Jul-
15
Au
g-1
5
Sep
-15
Oct
-15
No
v-1
5
Dec
-15
Jan
-16
Feb
-16
European Banks CoCo
European Banks Tier 1
European Banks Tier 2
75
80
85
90
95
100
105
Jun
-14
Jul-
14
Au
g-1
4
Sep
-14
Oct
-14
No
v-1
4
Dec
-14
Jan
-15
Feb
-15
Mar
-15
Ap
r-1
5
May
-15
Jun
-15
Jul-
15
Au
g-1
5
Sep
-15
Oct
-15
No
v-1
5
Dec
-15
Jan
-16
Feb
-16
Global CoCo banking
European Banks CoCo
Global CoCo IG
Global CoCo HY
0
1
2
3
4
5
6
7
8
9
Jun
-14
Jul-
14
Au
g-1
4
Sep
-14
Oct
-14
Nov
-14
Dec
-14
Jan
-15
Feb
-15
Mar
-15
Ap
r-1
5
Ma
y-1
5
Jun
-15
Jul-
15
Au
g-1
5
Sep
-15
Oct
-15
Nov
-15
De
c-1
5
Jan
-16
Feb
-16
Global CoCo banking European Banks CoCo
Global CoCo IG European Banks Tier 1
Global CoCo HY European Banks Tier 2

Debt securities and contingent convertibles
Prudential data report Page 15
2.13 Recently issued CoCos by European Banks
Source: Dealogic and Thomson Reuters Eikon
Pricing Date Issuer Tier Capital Deal Total Value Euro (Face) Trigger Conversion mechanism Issue Rate Effective Rating (Launch) Maturity Coupon
11-Nov-15 Julius Baer Group AG Tier I capital 294,792,008 7.0% Writedown Fixed rate BBB Perpetual 5.9
26-Nov-15 Allied Irish Banks plc Tier I capital 500,000,000 5.125% of the bank or 7.0% of the Group Writedown Fixed rate B- Perpetual 7.375

Summary of the methodologies adopted in this report
Prudential data report Page 16
Summary of the methodologies adopted in this report
1. Balance Sheets – Overview
In 2013 the European Union adopted the CRD IV legislation, implementing the Basel III accord in the EU. The CRD IV includes a number of transitional measures, which facilitate financial markets and the real economy in adjusting smoothly to the new regulatory landscape. The charts in the first part of the report illustrate the capital and leverage ratios under the phased-in (transitional) and the end-point (fully loaded) approaches, as reported by the EU GSIBs.
During the transition period (2014-2019), certain deductions are applied to the calculation of CET1 capital, Tier 1 capital and Tier 2 capital. For CET1 capital, the regulatory deductions vary by year from 20% in 2014 to 100% from 2018 onwards, with increases of 20% per year. These deductions are related to the treatment of deferred taxes, securitisation, and unrealised losses, among others.
In addition to the abovementioned deductions, the CRDIV also establishes a timetable for the compliance with the minimum capital requirements and buffers. The ratio of minimum regulatory capital to risk-weighted assets (RWA) is illustrated in the chart below.
Minimum Capital Requirements & Buffers Implementation
Timetable (% of RWAs)
Source: : AFME
The GSIB buffer ranges from 1% to 2.5% for GSIBs. The GSIB buffer varies by bank depending on the bucket where the firm is allocated to as per the FSB’s/BIS methodology, which takes into account features such as size; interconnectedness;
complexity; financial infrastructure; and cross-jurisdictional activity of the institution. The required countercyclical buffer ranges from 0%-2.5% depending on the assessment of each NCA.
1.1. – 1.5, 1.9 and 1.11. Capital Ratios
The Capital Ratios charts illustrate the implementation of the CRDIV requirements by the 14 EU GSIBs as designated by the FSB in 2014. Such banks are: HSBC; Barclays; BNP Paribas; Deutsche Bank; Royal Bank of Scotland; BBVA; Groupe BPCE; Group Crédit Agricole; ING Bank; Nordea; Santander; Société Générale; Standard Chartered; and UniCredit Group.
The number of reporting banks for each chart varies depending on the availability of information. The table below illustrates the number of banks that are included in each of the charts in Section 1. All figures were compiled on a best effort basis.
1.1
1.2, 1.3,
1.4, 1.10
1.5,
1.7,
1.8 1.9 1.11
1.12,
1.13 1.14 1.15
1.16
4Q13 14 14 7 9
10
1Q14 13 13 12 11 8 7 13 10
2Q14 13 13 13 12 9 10 13 11
3Q14 13 13 12 10 8 9 13 11
4Q14 13 13 14 13 13 14 13 14 6
1Q15 13 13 13 11 13 11 13 14 3
2Q15 13 13 14 13 13 12 13 14 3
3Q15 13 13 14 12 13 10 13 14 3
4Q15 13 13 14 12 11 12 13 14 8
Each dot in the charts represents a Bank in a given quarter. The line represents the weighted average of the figures compiled in each quarter (unless disclosed otherwise).
The CET1 Capital ratio is the share of Core Tier 1 (CET1) capital as percentage of Risk Weighted Assets (RWA); Tier 1 Ratio is the share of Tier 1 capital as percentage of RWAs. Each ratio is shown on a phased-in (transitional) and fully loaded (end-point) approach as per the CRDIV legislation and as reported by the EU GSIBs.
The capital ratios data are sourced from EU GSIBs balance sheets and publicly available information disclosed in periodic financial reports and prudential data reports published by the above mentioned banks (i.e. interim earnings reports, annual reports, results presentations, Pillar III disclosure reports or financial data disclosed as part of interim earnings results). When not
Phase-in of regulatory deductions (% of deductions to be applied)
20% 40% 60% 80% 100%
Phase-out of non-compliant non-common Tier 1 and Tier 2 capital (up to 100% in 2022) issued before 12-Sep-2010(% of ineligible)
10% 20% 30% 40% 50% 60% 70%
Phase-out of non-compliant public sector capital injections (% of ineligible)
0% 0% 100% 100%
2.0% 2.0%3.5% 4.0% 4.5% 4.5% 4.5% 4.5% 4.5%
0.6%1.3% 1.9% 2.5%
0-0.6%
0-1.3%0-1.9%
0-2.5%
0-0.6%
0-1.3%
0-1.9%
0-2.5%
2.0% 2.0%
1.0%1.5%
1.5%
1.5%
1.5%
1.5%
1.5%
4.0% 4.0% 3.5%2.5% 2.0%
2.0%
2.0%
2.0%
2.0%
Basel II 2012 2013 2014 2015 2016 2017 2018 2019
CET1 Capital Capital Conservation Buffer
Countercyclical Capital Buffer G-SIBs Buffer
AT1 Capital Tier 2 Capital
Common Equity Tier 1 Capital
8% 8% 8% 8% 8%
9.9%
11.8%
13.6%
15.5%

Summary of the methodologies adopted in this report
Prudential data report Page 17
available in the EU GSIBs’ financial results and publically available information, 4Q14 CET1 and RWAs were sourced from the EBA’s 2013 stress tests for the transitional approach.
For charts 1.3 and 1.4, for purposes of aggregation in EUR currency, the balance sheets items reported in USD and GBP were converted to EUR terms using the end-of-quarter exchange rate as certified by the ECB. The specific exchange rates are the following:
EUR/USD EUR/GBP
4Q13 1.3791 0.8337
1Q14 1.3788 0.8282
2Q14 1.3658 0.8015
3Q14 1.2583 0.7773
4Q14 1.2141 0.7789
1Q15 1.0759 0.7273
2Q15 1.1189 0.7114
3Q15 1.1203 0.7385
4Q15 1.0887 0.73395 Source: ECB
1.6. Change in CET1 by components
Chart 1.6 illustrates the contribution of RWAs, profits and other factors to the quarterly change of CET1 ratio on an end point approach. The figures are aggregated by banks on a weighted average basis. The individual contributions are sourced from banks’ presentations of the quarterly financial results and quarterly financial statements, when available in the granularity presented. When the figure is not available at the same level of granularity, a linear decomposition is performed: the quarterly percentage change of the CET1 ratio is approximated as the quarterly percentage change in CET1 capital, minus the quarterly percentage change in RWAs.
Accordingly, the contribution of RWAs to the change is calculated as the percentage change of RWAs multiplied by the CET1 ratio in the past quarter. The contribution of profits is calculated as the quarterly profits, divided by the amount of RWAs in the past quarter. The remaining “FX and other” factor is calculated as residual.
1.7. – 1.8. Difference between CET1 ratios and
2019 ratios on an end point basis
Chart 1.7 illustrates the difference between the individual EU GSIBs CET1 ratios on an end-point basis, and the regulatory ratio due to apply from 2019 assuming that banks are to comply with the GSIB buffer in which they are currently assigned in (between 1% and 2.5%). The additional countercyclical buffer is represented with a
horizontal line at 2.5%, to illustrate the maximum buffer that EU GSIBs would have to comply with, should all NCAs implement the maximum buffer at 2.5%. The countercyclical buffer is yet to be implemented by the European NCAs.
Chart 1.8 illustrates the difference between EUGSIBs weighted-average CET1 ratio on an end-point basis, and a stressed maximum regulatory ratio that banks would have to comply with assuming that NCAs implement the maximum countercyclical buffer at 2.5%. That is, a requirement of 4.5% (Minimum CET1 ratio) + 2.5% (Capital conservation buffer) + 1%-2.5% (according to the bucket where the GSIB is currently located) + 0%-2.5% (countercyclical buffer). To estimate the weighted-average CET1 ratio, individual RWAs were used.
One of the 14 EU GSIBs reports its financial results on a semi-annual basis. Chart 1.8 uses the latest CET1 ratio reported for this bank.
1.10. Cumulative change of T1, RWA and T1
ratio
This chart illustrates the cumulative percentage change of each of the components of the Tier 1 ratio on a phased-in basis. As with previous charts, T1 and RWAs are sourced from EU GSIBs’ financial reports and publicly available material (see reference to charts 1.1-1.4).
Data are aggregated for 12 of the 14 banks where information was available. In contrast to chart 1.8, the ratio and its subsequent cumulative percentage change, is calculated as total T1 capital as proportion of total RWAs (and not simple average of ratios).
1.12. – 1.13. Risk-Weighted Assets (RWAs)
The breakdown of RWAs by risk is sourced from financial reports published by the EU GSIBs as referenced in 1.1-1.4
Chart 1.12 illustrates the breakdown by risk component for each EU GSIB as of 4Q15 or the latest publically available breakdown.
The credit risk category represents other risks different from market and operational risk as disclosed by the EU GSIBs.
The figures are in EUR terms which are converted from the currencies used by banks to report their financial results, using the ECB’s official FX rate for the corresponding end of period.
1.14. RWA densities
The densities are calculated as the ratio of RWAs to total assets by bank. The amounts of RWAs are

Summary of the methodologies adopted in this report
Prudential data report Page 18
phased-in values as reported by banks and are consistent with the figures reported in chart 1.4.
Total assets are sourced from Thomson Reuters EIKON and Banks’ financial statements when not available in Reuters.
1.15. Leverage Ratios (fully loaded)
The leverage ratio represents the share of Tier 1 capital as a percentage of eligible assets under the fully loaded approach.
The leverage ratios are sourced from financial reports published by the EU GSIBs referenced in 1.1-1.5 (i.e. interim earnings reports, annual reports, results presentations, Pillar III disclosure reports, or other financial data disclosed as part of earnings results).
All figures were compiled on a best effort basis.
1.16. Liquidity Coverage Ratio (LCR)
The LCR represents the share of High Quality Liquid Assets (HQLA) relative to total net cash outflows over a 30 day time period.
LCRs are sourced from financial reports published by the EU GSIBs (i.e. interim earnings reports, annual reports, results presentations, Pillar III disclosure reports, and other financial data disclosed by banks).
Some banks disclosed in their reports that their LCR ratios were above a certain level without disclosing the actual ratio (e.g. “above 100%” or “above 110%). This information was not added in the graph.
All figures were compiled on a best effort basis.
2. Debt securities and Contingent
Convertibles
2.1. Average EU GSIBs credit rating
This chart presents the simple average of the EU GSIBs long-term foreign credit ratings. The rating of each bank is estimated as the simple average of the individual long-term foreign credit ratings assigned by Moody’s, Fitch and S&P. To calculate the average by bank, a value between 0 and 17 is assigned to each rating, where 0 represents DDD (or C in Moody’s scale and D in S&P scale) and 17 is equivalent to AAA (or Aaa in Moody’s scale). When a Credit Rating Agency (CRA) has not rated the long-term foreign performance of an EU GSIB, the average is calculated with the available credit ratings.
The information is sourced from Thomson Reuters EIKON.
2.2. Debt outstanding by seniority
The data is sourced from Thomson Reuters EIKON. The data corresponds to debt issued by the 14 EU GSIBs, which does not take account of holdings by subsidiaries/branches within the same group.
The “Mortgages” category includes mortgage covered bonds.
2.3. EU 28 bank’s debt outstanding by
maturity
The data is sourced from the ECB and Dealogic DCM. The figures correspond to the outstanding amounts of debt securities other than shares issued by European Union (EU28) banks at the end of reference period broken down by maturity in years.
All securities issued in all currencies are included and converted into EUR terms by the ECB.
2.4. CoCos by capital tiering
CoCo securities included are those issued by banks whose parent company is located in Europe. It does not include securities issued in Europe by banks whose parent company is non-European. Europe is defined as per Dealogic’s classification, which includes European Union nations, Eastern European countries (e.g. Russia, Azerbaijan, and Kazakhstan), EFTA countries, old Soviet Union countries, and Turkey.
All securities issued in all currencies are included and converted into EUR terms by Dealogic.
The capital tiering is sourced from Dealogic DCM for each of the securities covered.
2.5- 2.6. CoCos issued by absorbing
mechanism
CoCo securities included are those issued by banks whose parent company is located in Europe as defined by Dealogic, which encompasses European Union member states, Eastern European countries (e.g. Russia, Azerbaijan, and Kazakhstan), EFTA countries, old Soviet Union countries, and Turkey.
The absorbing mechanism is sourced from Thomson Reuters EIKON for each of the securities covered.
2.7 CoCos issued by credit rating
CoCo securities included are those issued by banks whose parent company is located in Europe as defined by Dealogic.
The credit rating is based on the classification by Dealogic of “Effective rating at launch”. This rating is calculated as an average of available ratings from S&P, Moody's and Fitch at the time of issuance. If

Summary of the methodologies adopted in this report
Prudential data report Page 19
an issue is rated by just one CRA, such rating is displayed.
2.8. CoCos issued by maturity
CoCo securities included are those issued by banks whose parent company is located in Europe as defined by Dealogic. All securities issued in all currencies are included and converted into EUR terms by Dealogic.
Maturity is classified on the basis of the number of years from settlement date to legal maturity date. Perpetual bonds are classified under their own category.
2.9. CoCos issued by trigger
The chart aggregates the value in billion Euros of CoCo instruments issued by European banks, classified by the underlying trigger and the capital tiering in which the instruments are contingent on (Tier I or Tier II capital performance).
The data are sourced from Dealogic.
2.10. - 2.11 CoCo prices
The indices in 2.10 and 2.11 are compiled by Barclays according to the capital tierage, location (Global vs. European) and risk of the security (High Yield vs. Investment Grade). All prices are unhedged and in nominal EUR terms.

Annex
Prudential data report Page 20
Annex
Disclaimer
Your receipt of this document is subject to paragraphs 3, 4, 5, 9, 10, 11 and 13 of the Terms of Use which are applicable to AFME’s website (available at http://www.afme.eu/Legal/Terms-of-Use.aspx) and, for the purposes of such Terms of Use, this document shall be considered a “Material” (regardless of whether you have received or accessed it via AFME’s website or otherwise).

Annex
Prudential data report Page 21

Prudential data report Page 22
London Office
39th Floor 25 Canada Square London E14 5LQ United Kingdom
Brussels Office
Rue de la Loi, 82 1040 Brussels Belgium
AFME
Julio Suarez - Manager, Research Michael Lever - Managing Director, Prudential Charlie Bannister - Manager, Prudential
Switchboard: +44 (0)20 3828 2700
Switchboard: +32 (0) 2 788 3971
www.afme.eu
AFME is registered on the EU Transparency Register, registration number 65110063986-76