Embed Size (px)
Citation preview
Università degli Studi di Milano
GRADUATE SCHOOL OF VETERINARY SCIENCES FOR ANIMAL HEALTH AND FOOD SAFETY
Director: Prof. Valentino Bontempo
Doctoral Program in Animal Nutrition and Food Safety
Academic Year: 2013-2014
Prudent use of fluoroquinolones in avian species: pharmacokinetics of flumequine and enrofloxacin
for PK/PD modelling in turkey.
Caterina Ferraresi
Tutor: Coordinator: Dr. Petra Cagnardi Prof. Giovanni Savoini
sAsA
Scuola di Dottorato in Scienze Veterinarie per la Salute Animale e la Sicurezza Alimentare

3

4

5
Index 1. Foreword ......................................................................................................................... 11
1.1 Antimicrobial use in veterinary medicine ......................................................................... 11
1.2 Overview of poultry production ...................................................................................... 12
1.3 Antimicrobial drug use in poultry industries .................................................................... 13
1.4 Antimicrobial resistance .................................................................................................. 15
1.4.1 Resistance mechanism .............................................................................................................. 16
1.4.2 Types of antimicrobial resistance .............................................................................................. 16
1.4.3 Transfer of antimicrobial resistance from animals to human ...................................................... 17
1.5 Judicious use of antimicrobial drugs ................................................................................ 18
1.6 Pharmacokinetic/pharmacodynamics approach to a rational dosage regimens ................ 20
1.7 Fluoroquinolones ............................................................................................................ 22
1.7.1 History of fluoroquinolones ...................................................................................................... 22
1.7.2 Mechanism of action ................................................................................................................ 23
1.7.3 Spectrum of activity ................................................................................................................. 24
1.7.4 Resistance mechanisms ............................................................................................................. 24
1.7.5 Pharmacokinetic properties ...................................................................................................... 25
1.7.6 Pharmacodynamic properties and PK/PD correlation .............................................................. 26
1.7.7 Adverse effects ......................................................................................................................... 27
1.7.8 Clinical applications ................................................................................................................ 27
1.8 References ....................................................................................................................... 29
2. Objectives ....................................................................................................................... 37
2.1 References ....................................................................................................................... 39
3.Development and validation of an LC-MS/MS/MS method for the quantification of
fluoroquinolones in several matrices from treated turkeys ............................................. 42
3.1 Abstract .......................................................................................................................... 42
3.2 Introduction .................................................................................................................... 43
3.3 Materials and methods .................................................................................................... 45
3.3.1.Animals and treatments .......................................................................................................... 45
3.3.2.Chemical and reagents ............................................................................................................. 45
3.3.3.Standards and stock solutions .................................................................................................. 46
3.3.4.Instrumentation ....................................................................................................................... 46
3.3.5. Sample preparation ................................................................................................................ 47
3.3.6. Method validation .................................................................................................................. 48
6
3.4 Results and discussion ..................................................................................................... 55
3.4.1. Method validation .................................................................................................................. 55
3.4.2. Analysis of samples from treated turkeys ................................................................................. 59
3.5. Conclusions .................................................................................................................... 60
3.6 Acknowledgments ........................................................................................................... 60
3.7 Appendix A. Supplementary data .................................................................................... 60
3.8 References ....................................................................................................................... 61
3.9 Supplementary data ......................................................................................................... 65
4.Pharmacokinetic/pharmacodynamic evaluation of the efficacy of flumequine in
treating colibacillosis in turkeys ....................................................................................... 68
4.1 Abstract .......................................................................................................................... 68
4.2 Introduction .................................................................................................................... 69
4.3 Materials and methods .................................................................................................... 70
4.3.1. Birds ...................................................................................................................................... 70
4.3.2. Experimental Design ............................................................................................................. 70
4.3.3. Liquid Chromatography–MassSpectrometry Analysis ............................................................. 71
4.3.4. Antimicrobial Susceptibility Testing........................................................................................ 73
4.3.5. Pharmacokinetics and Statistical Analysis .............................................................................. 73
4.4Results ............................................................................................................................. 75
4.4.5.Single Bolus Gavage Administration (Groups 1 and 2) ........................................................... 75
4.4.6 10-h Medicated Water Administration for 5Consecutive Days (Groups 3 and 4) .................... 76
4.4.7. MIC Determination and PK/PD Integration ....................................................................... 78
4.5.Discussion ....................................................................................................................... 79
4.6. Acknowledgments .......................................................................................................... 80
4.7. References ...................................................................................................................... 81
5. Enrofloxacin against Escherichia coli in turkeys: which treatment scheme is
effective? ............................................................................................................................. 86
5.1 Abstract .......................................................................................................................... 86
5.2 Introduction .................................................................................................................... 87
5.3 Materials and methods .................................................................................................... 88
5.3.1. Birds ...................................................................................................................................... 88
5.3.2 Experimental Design .............................................................................................................. 88
5.3.3 Liquid Chromatography–Mass Spectrometry Analysis and Method Validation ....................... 90
5.3.4 PK and Statistical Analysis .................................................................................................... 91
5.4 Results ............................................................................................................................ 92
7
5.4.1 Single Gavage Administration (Groups 1 and 2) .................................................................... 92
5.4.2 10-h Medicated Water Administration (Group 3)................................................................... 94
5.4.3 24-h Continuous Medicated Water Administration (Group 4) ................................................ 94
5.4.4 Single SC Administration (Group 5) ...................................................................................... 95
5.4.5 PK/PD Integration ................................................................................................................ 96
5.5 Discussion....................................................................................................................... 96
5.6 Acknowledgments ........................................................................................................... 99
5.7 References ....................................................................................................................... 99
6. General discussion ....................................................................................................... 103
7. Summary ....................................................................................................................... 108

8

9
Foreword
CHAPTER 1

10

11
1. Foreword
1.1 Antimicrobial use in veterinary medicine
The introduction of antimicrobial agents in human and veterinary medicine has been one of the most significant medical achievements of the 20th century. The first antimicrobial agents were introduced in the 1930’s, and a large number of new compounds were discovered in the following decades. However, shortly after the introduction, resistance began to emerge. Formerly the same Alexander Fleming, discoverer of penicillin, had seen the future of antibiotic resistance risk. “The time may come when penicillin can be bought by anyone in the shops”, he said in his Nobel lecture; “then there is the danger that ignorant man may easily underdose himself and by exposing his microbes to non-lethal quantities of the drug make them resistant” (Fleming, 1945). In all known cases emergence of antimicrobial resistance has eventually followed the introduction of a new antimicrobial compound (EMA, 2006). In veterinary medicine antibiotics are used in animals for therapeutic and prophylactic purposes in order to cure and prevent bacterial diseases. In these cases, antimicrobial are administered under veterinary control. Another use of antimicrobial agents in animals, although banned since 2006 in the European Union but still allowed in other non-European countries(USA, Japan, Australia, among others), is as growth promoters. In this case, drugs are added in sub-therapeutic doses and for long periods of time in the feed of healthy animals, conditions that could further contribute to the selection of resistant bacteria (McEwen and Fedorka-Cray, 2002). It is estimated that the volumes of antimicrobials used in animals exceeds the use in human medicine worldwide, and nearly all the classes of antimicrobials that are used for humans are also being used in food animals, including the newest classes of drugs such as third- and fourth-generation cephalosporins, fluoroquinolones, glycopeptides, and streptogramins (Aarestrup et al., 2008). In animal production systems with high density of animals or poor biosecurity, the spread of infectious diseases is favoured, which leads more frequently to antimicrobial treatment and increases the need for prevention of those diseases (EMA, 2006). Regarding the knowledge about veterinary antimicrobials use in Europe, huge improvement has been made through the activities of the European Surveillance of Veterinary Antimicrobial Consumption (ESVAC). The third ESVAC report presented the results on antimicrobial consumption in animals in 25 European Countries. In this report, the magnitude of the animal population is quantified by means of the population correction unit (PCU). This PCU is a technical unit of measurement based on the estimated weight at treatment of livestock and slaughtered animals; one PCU is the representation of 1 kg of different

12
categories of livestock and slaughtered animals. As reported by the ESVAC report in 2011, a total of 8,481 tonnes of active ingredient of antimicrobials have been sold for veterinary use in the 25 EU countries. The sales of tetracyclines, penicillins and sulfonamides, in mg/PCU, accounted for more than 71% of the total sales (range 53%–88%). Among the so-called CIA (Critically Important Antibiotics), designated by the WHO as the molecules critical to human health, the sales percentages of 3rd and 4th generation cephalosporins, fluoroquinolones and macrolides were, respectively, 0.2%, to 1.6% and 8% of total sales in the 25 countries in 2011. Another important finding was that the total sales, both in tonnes and in mg/PCU, of veterinary antimicrobial agents in the 25 EU/EEA countries were mainly accounted for pharmaceutical forms applicable for mass treatment (premixes, oral powder and oral solution) and this type of treatment is considered even more risky for the development of antimicrobial resistance. In Italy, a decline in antimicrobials sales (in mg/PCU) of 13% from 2010 to 2011 has been observed and the decline has been reported for almost all antibiotic classes (ESVAC, 2013).
1.2 Overview of poultry production
During the last 50 years, avian production increased enormously; the industry developed to be highly integrated, with fewer companies controlling most sources of birds, feed mills, farms, slaughter and processing facilities. Integration led to standardized management practices, including drug treatment policies and procedures and to many successes in the prevention and control of infectious diseases (McEwen and Fedorka-Cray, 2002). The European Union (EU) is one of the world's top producers in poultry meat and a net exporter of poultry products. Over the years the market organisation for poultry sector was improved to ensure the development of the sector, the quality of the products and consumers protection while harmonizing the entire market. In 2012, the total poultry meat production in the EU was 12.9 million tonnes, with an increase of 14% compared to 2007. Broilers meat is the main poultry meat with a total production of 9.9 million tonnes in 2012. In Europe, the leading producers of broilers meat, with a production above 0.7 million tonnes each, are the UK, Poland, Germany, France, Spain, Italy and the Netherlands. All these countries together are responsible for 76% of the EU's poultry meat production. Besides broilers, turkeys are also an important subsector. In 2012, total turkey meat production in the EU was 1.9 million tonnes. The main producing countries of turkey meat are France, Germany, Poland, Italy and the UK, with a common share of 81% of the EU total (AVEC annual report, 2014).

13
1.3 Antimicrobial drug use in poultry industries
In highly organized and intensive avian production, every disease outbreak has a major effect on health and welfare, leading to a decreased technical performance and profitability. Shorter production cycles, through improved genetics and diet, have led to the fact that there is little recovery time for animals after a disease outbreak. In case of endemic diseases, their outbreaks will predominantly result in economic losses for individual farmers, whereas in case of epidemic diseases, the entire poultry production sector may be involved through mandatory preventive measures such as quarantine or destruction of poultry (Gelaude et al., 2014). Since commercial poultry are food animals the choice of antimicrobials is affected by the issue of drugs residues in edible tissues. In Europe, only those antimicrobials for which a maximum residue level (MRL value) is set can be used in poultry flocks. The withdrawal period indicates the time which pass between the last dose given to the animals and the time when animals can enter in the food chain. The relatively short lifetime of the meat producing poultry species and the importance to guarantee the withdrawal time can significantly limit the availability of therapeutic options (Lohren et al., 2008). Another important aspect in determining the drug to use is the economical factor: in avian species the low economic value of individual birds makes single therapy cost-prohibitive. Therefore, due to the enormous number of animals bred, the oral mass therapy becomes a forced choice (Hofacre et al., 2013). The most important antimicrobial classes used in avian medicine are listed in the table below (Lohren et al., 2008):
Antimicrobial class Drug name Type of activity
Aminoglycosides
apramycin gentamicin neomycin spectinomycin streptomycin
Bactericidal
Sulfonamides sulfadiazine sulfadimethoxine
Bacteriostatic
Potentiated sulfonamides trimethoprim and sulfonamides Bactericidal
β-Lactames
benzylpenicillin potassium penicillin G ampicillin amoxicillin ceftiofur
Bactericidal
Fluoroquinolones enrofloxacin difloxacin flumequine
Bactericidal
Lincosamides lincomycin Bacteriostatic
Macrolides erythromycin Bacteriostatic

14
spiramycin tylosin tilmicosin
Pleuromutilines tiamulin Bacteriostatic
Polypeptides colistin sulfate Bactericidal
Tetracyclines
tetracycline chlortetracycline oxytetracycline doxycycline
Bacteriostatic
For poultry, the preferred method of treatment is oral medication, via drinking water or feed medication. This is because large numbers of birds can be medicated at the same time. However, in the case of acute disease with serious losses of animals, parenteral therapy offers a valuable alternative; the method of medication is often complicated by other factors such as animal welfare, avoidance of tissue damage and stress (Vermeulen et al., 2002). The major consideration in determining the method of administration to birds is ease of management. The formulation of a drug intended for use in avian species is frequently dictated by the need for a practical and economical method of administration. When a feed-based antimicrobial is prescribed, the time required for the manufacturing, transporting and delivering through the feeding system at the farm must be taken into account; whereas the administration of the antibiotic in drinking water allows faster treatment (Hofacre et al., 2013). Drinking water therapy offers several advantages and few disadvantages. Important advantages are the low cost of management, the low work load, the ease of administration and a quick change of drug and/or dose is possible. Besides, diseased birds usually tend to stop eating, but they will continue to drink. The main disadvantages are: drug uptake can vary dramatically as a function of the animal, unprofessional use and a wrong preparation of the medical solution by the farmer and possible solubility and stability problems (Vermeulen et al., 2002). At first sight, this technique seems simple but many more variables have to be taken into account, these include: the water quality, the individual water uptake, the influence of drinking water system and the lighting periods. Basically, the water should be clean, cool and neutral in taste. The water should be replaced daily and soiling of the drinking water should be avoided because of possible drug inactivation. Several water quality parameters which may influence the use of an oral medication are hardness, the pH values, dissolved solids and a high mineral content (Esmail, 1996). Medication use is mainly indicated as mg per kg body weight and this means that information on daily water intake as function of poultry species, flock size, weight and age on the moment of treatment must be available. The drinking water intake varies greatly depending upon different factors such as

15
environmental temperature, density and composition of the diet (Vermeulen et al., 2002). Finally, the treatments via drinking water can be conducted following two types of schemes: continuous administration during the entire light period or pulsed administration for a limited period between 4 and 10–12 h(Charleston et al., 1998).
1.4 Antimicrobial resistance
Overuse and misuse of antimicrobial drugs have favoured the growth of resistant organisms and resistance can spread to other microbial populations, jeopardizing human and animal health (Toutain et al., 2002). Antimicrobial resistance, defined as the ability of a microorganism to withstand the effect of a normally active concentration of an antimicrobial agent, is a global phenomenon and a well-recognised threat to public as well as animal health. The causal factors in the development of resistance are many and complex, but originate generally from exposure of microorganisms to antibiotics (Marshall and Levy, 2011). The development of resistance is a natural process which increases every time an antibiotic is used. The initial emergence of resistance is thought to be a random occurrence that arose during replication of bacteria. However, once resistance has occurred, the use of an antibiotic kills or inhibits competing bacteria present in the animal or human, thereby favouring the spread of those bacteria that have become resistant. This defensive mechanism whereby resistance genes are selected in the face of exposure to a particular antibiotic is known as selection pressure. The more often exposure occurs, the greater the risk that resistance will develop. As bacteria reproduce very rapidly, organisms with the resistant gene can rapidly become dominant in a bacterial population with an individual animal or human (Coates, 2012). In human medicine it is generally agreed that the improper use of antimicrobial agents is the most important factor in the selection of resistance in bacteria and that, in general, a close association exists between the rate of resistance development and the quantities of antimicrobial agents used (Aarestrup, 1999). Human infections caused by resistant bacteria are more frequently associated with higher morbidity and mortality than those caused by susceptible pathogens. In areas of concentrated use, such as hospitals, this has led to lengthened hospital stays, increased health care costs and, in extreme cases, to untreatable infections (Boerlin and White2006). Antimicrobial resistance mechanisms have been reported for all known antibiotics currently available for clinical use in human and veterinary medicine. Therefore, successful sustainable management of current antimicrobials and the continued development of new ones and of alternatives to antimicrobial drugs

16
are vital to protecting animal and human health against infectious microbial pathogens (Martinez and Silley, 2010).
1.4.1 Resistance mechanism
Antimicrobial resistance mechanisms can be classified into four major categories: 1) the antimicrobial agent can be prevented from reaching its target by reducing its penetration into the bacterial cell; 2) the antimicrobial agent can be expelled out of the cell by general or specific efflux pumps; 3) the antimicrobial agent can be inactivated by modification or degradation, either before or after penetrating the cell; and 4) the antimicrobial target can be modified or protected by another molecule preventing access of the antibiotic to its target, so that the antimicrobial cannot act on it anymore. Alternatively, the antimicrobial agent target can be rendered dispensable by the acquisition or activation of an alternate pathway by the microorganism (Boerlin and White, 2013).
1.4.2 Types of antimicrobial resistance
In the context of antimicrobial resistance, bacteria display three fundamental phenotypes (Boerlin and White2006):
susceptibility that implies that isolates are inhibited by the usually achievable concentrations of antimicrobial agent when the recommended dosage (dosage regimen) is used for that site of infection (CLSI, 2007)
intrinsic resistance, that is the innate ability of a bacterial species to resist the activity of a particular antimicrobial agent through its inherent structural or functional characteristics, which allow tolerance of a particular drug or antimicrobial class (Boerlin and White2006).
acquired resistance, it occurs when a particular microorganism obtains the ability to resist the activity of a particular antimicrobial agent to which it was previously susceptible. This can result from the mutation of genes involved in normal physiological processes and cellular structures, from the acquisition of foreign resistance genes or from a combination of these two mechanisms. Acquired resistance can be manifested as resistance to a single agent, to some but not all agents within a class of antimicrobial agents, to an entire class of antimicrobial agents, or even to agents of several different classes. (Boerlin and White2006).
In the great majority of cases, a single resistance determinant encodes resistance to one or several antimicrobial agents of a single class of antimicrobials or of a group of related classes of antimicrobials (Mayer, 2009).
17
1.4.3 Transfer of antimicrobial resistance from animals to human
The use of antibiotics in food producing animals contributes to the selection of resistant bacteria that can be transferred from animals to humans. The food chain is considered as a transmission vehicle of resistant bacteria to humans. The risk to transfer antimicrobial resistance arises via the consumption of product (milk, eggs, honey, meat) from treated animals, but also by the contact with treated animals, being they pets or food-producing animals, or their environment (Aarestrup, 1999). Nowadays, there is considerable evidence that antimicrobial use in animals selects for resistance in zoonotic enteropathogens and in commensals bacteria (Garcia-Migura et al., 2014).Antimicrobial resistance in zoonotic enteropathogens (e.g., Salmonella, Campylobacter, Yersinia, and some strains of pathogenic E. coli) and commensals (e.g., enterococci, mostly E. coli) is of special concern to human health and various European countries have implemented national monitoring programs [e.g. Denmark (DANMAP), France (FARM), Netherlands (MARAN), Norway (NORM-VET), Sweden (SVARM) and Spain (VAV)]to assess susceptibility to antibiotics among these bacteria isolated from healthy food animals (DANMAP report, 2013, FARM report, 2013, MARAN report, 2013, NORM-VET report, 2013, SVARM report, 2013, VAV report, 2005). If commensal bacteria, which are naturally occurring in the host, are exposed to antimicrobial agents, they may become resistant and be able to transfer resistance genes to pathogenic bacteria. Antimicrobial resistance in the commensal bacteria of humans and animals results largely from the selective pressure of antimicrobial agents use and reflects the genetic elements that may transfer to pathogens. The above cited zoonotic bacteria are considered responsible of important infections in food animal species; fluoroquinolones and cephalosporines are antimicrobials frequently used against these pathogens. An increase in resistant strains of E. Coli, Campylobacter and Salmonella has been reported in recent years. In particular high level of resistance was reported in bacteria strains isolated from poultry and turkeys (EFSA, 2010). In the United States in 2005, two fluoroquinolones that were approved for the control of colibacillosis in poultry were banned. The primary reason for this ban was exactly to allay concerns regarding rising fluoroquinolones resistance rates in human cases of camplylobacteriosis. (FDA, 2005). In Countries were fluoroquinolones are not use in poultry, such as Australia, the resistance phenomenon in Campylobacter, Salmonella and E. coli are rare and consequently resistance in human is also much lower than in most countries (Cheng et al., 2012).

18
1.5 Judicious use of antimicrobial drugs
In order to minimize the possible impact of animal antimicrobial usage on public and animal health, various international organizations such as WHO, OIE, FAO and EU Commission have, in recent years, emphasized the importance of prudent and rational use in veterinary medicine . This has been recognized by professional associations as well as by national and international authorities. All these institutions have underlined to a lesser or greater degree that prudent antimicrobial use is important, not only to safeguard the efficacy of antimicrobial drugs in veterinary medicine but, even more so, to prevent the emergence and spread of undesirable resistance phenotypes in zoonotic pathogens as well as in commensal bacteria that can be transmitted between animals and humans (Teale and Moulin, 2012). There are no finite definitions of “prudent” and “rational” in relation to antimicrobial use. Both terms are frequently used to suggest a responsible attitude to antimicrobial use, aimed at minimizing the development and spread of antimicrobial resistance while maximizing therapeutic efficacy. This attitude, and its objectives, apply both to human and veterinary medicine. Sometimes the terms prudent and rational are used more or less synonymously. However, they refer to slightly different aspects. prudent use has the overall goal of reducing antibiotic usage, with particular emphasis on the relative use of broad spectrum and critically important drugs. Rational use refers to rational administration of antimicrobials to the individual with the purpose of optimizing clinical efficacy while minimizing development of resistance. Judicious use of antibiotics, both in humans and in animals, is a key factor to minimize the risk of selecting resistant bacteria and help keep antibiotics effective for future generations (Guardabassi and Kruse, 2008). The best way to reduce the need for and use of antimicrobials and thereby aiding the containment of resistance phenomenon, is by preventing disease. Prevention is better than cure, not only in relation to antimicrobial resistance, but also from an animal welfare prospective and from economic viewpoint. In this regard several management techniques including good biosecurity rules and specific vaccination programs are routinely used in intensive farming in order to limit as much as possible the need for antibiotics (Laanen et al., 2014). In veterinary medicine, prudent use of antibiotics is an integral part of good veterinary practices. Prudent use principles should not be interpreted so restrictively as to replace professional judgment of practitioners or to compromise animal health or welfare. In all cases, animals should receive prompt and effective treatment as deemed necessary by the prescribing or supervising veterinarian (FVE, 1999). General prudent use guidelines have been developed in recent years by most national and international veterinary organizations, mostly providing statements
19
of principles of judicious antimicrobial use. For example the Food and Drug Administration, Center for Veterinary Medicine, in cooperation with the American Veterinary Medical Association has drafted a list of points to consider in order to optimize the use of antibiotics in poultry farms (FDA, CVM):
Preventive strategies, such as appropriate husbandry and hygiene, routine health monitoring, and immunization, should be emphasized. The foundation of the success in the poultry industry is through disease prevention management. Farms utilizing all-in-all-out production minimize the presence of multiple ages of flocks on farms to help in disease prevention. Biosecurity programs in place on poultry farms prevent the introduction of diseases.
Other therapeutic options should be considered prior to antimicrobial therapy. The poultry industry approaches the treatment of diseases with antimicrobial agents very seriously. Because of the cost of disease treatment with antimicrobials, therapeutic antimicrobial intervention is used only as a tool to treat active disease.
Judicious use of antimicrobials, when under the direction of a veterinarian, should meet all requirements of a valid veterinarian-client-patient relationship. Poultry veterinarians, in integrated companies, closely monitor antimicrobial use in their poultry flocks. They maintain close contact with service technicians and managers related to the use of antimicrobials. Veterinarians should be involved in the training of all individuals that will ultimately be following veterinary directions for antimicrobial use. Antimicrobials should be used always under the direction and knowledge of the company veterinarian or veterinary consultant.
Regimens for therapeutic antimicrobial use should be optimized using current pharmacological information and principles. For the purpose of correct use a precise diagnosis and antimicrobial susceptibility testing are essential. The choice of an appropriate drug product and the administration route should also be considered when you have to treat diseased animals. Likewise an appropriate dosage regimen (dose level, dose interval and treatment duration) is of fundamental importance to minimize therapy failures, exploit the efficacy potential of the drug and comply with the regulated withdrawal times. Low doses, increased intervals and reduced treatment periods can lead to redevelopment of the infection and may increase the risk of selecting resistant organisms.

20
Therapeutic exposure to antimicrobials should be minimized by treating only for as long as needed for the desired clinical response and therapy should be limited to ill or at risk animals. In population medicine involving flocks, it is recognized that in a disease outbreak, all birds are not infected at the same time with the disease to which antimicrobial therapy is warranted. However, birds in the same house are “at risk” to the same primary disease that often results in secondary bacterial infections. Only birds within the same house ill or at risk are treated.
Minimize environmental contamination with antimicrobials whenever possible.
Even more importance and attention is now given to the prudent use of medically important antimicrobial drugs, a term that refers to those drugs for human therapeutic use. In recent years the European Medicines Agency (EMA), acting at the request of the European Commission, has reviewed the indications and conditions under which a number of the more modern antibiotic classes (fluoroquinolones, macrolides and cephalosporins) are used in veterinary medicine. These reviews have resulted in the elaboration of more precise recommendations for use and new warnings which must be taken into account by vets when prescribing these antibiotics (EMA, 2011). In some marketing authorizations in the EU, special precautions for use have been added to the Summary of Product Characteristic (SPCs) of fluoroquinolone products. For the fluoroquinolones, at EU level, the risk evaluation is still ongoing and it has been decided that risk management measures has to be implemented to maintain their efficacy for veterinary use. These include the following: fluoroquinolones should be reserved for the treatment of clinical conditions which have responded poorly, or are expected to respond poorly, to other classes of antimicrobials; their dosage regimens should be carefully determined on the basis of and pharmacodynamic properties to ensure optimal efficacy and reduce selection of resistance (EMA, 2006).
1.6 Pharmacokinetic/pharmacodynamics approach to a rational dosage regimens
There are several possibilities to limit the development of antimicrobial resistance phenomenon. They include research into the mechanisms and diffusion of resistance; the search of new drugs and alternative to antibiotic use; proper attention to preventive measures and commitment to prudent use (Wise, 2003). For a rational and judicious antibiotic therapy, dosage regimens have to be optimized, both to guarantee clinical efficacy and to minimize the selection of
21
resistant pathogens. In veterinary practice, one of the most important risk factor for emergence of resistance is repeated exposure of bacteria to sub optimal concentrations of antibiotics (Toutain and Lees, 2006). This event is even more frequently when considering the mass treatment with feed or water medication often adopted in animal husbandry (Wise, 2003). In humans many studies have been carried out to define precise dosages, to improve drug activity and reduce selection of resistance in antimicrobial therapy (Rybak, 2006). Many of these studies use “so called” models (PK/PD) that correlate the antimicrobial pharmacokinetics (PK) with the action on pathogens by pharmacodynamics (PD). PK, is the study of time course of absorption, distribution, metabolism and elimination of drugs, while PD is the study of the efficacy of the drug on causative bacteria determining the minimum inhibitory concentration (MIC) (Toutain et al., 2002). PK/PD modelling provides surrogate markers for clinical and bacteriological efficacy based on the relationship between serum/tissue concentrations of antimicrobial agents and MIC and has great potential for optimal dosage regimen determination (Toutain and Lees, 2006). The use of PK/PD principles for evaluation of antimicrobial compounds has become common also in the veterinary literature. Most papers published in the last few years in veterinary journals discuss the features of PK in light of the PD of the drug and how this relates to rational dosage regimens; the results confirm the high potential of PK/PD modeling to define more rational dosages and the significant variable to consider is the plasma concentration time profile (Papich, 2014). The differences in pharmacokinetics between different species exist and are well documented. Studies to define the dosage are often made in the species considered major, but to optimize the effectiveness and avoid underdosing precise studies should be carried out in the target species of the drug (Toutain et al., 2010). One mechanism to reduce the risk of emergence of resistant bacteria is to use the agents currently available to veterinarians more effectively. This means administration of sufficient dosages and appropriate regiments that meet the PK/PD targets for each antimicrobial drug class. In veterinary therapy the efficacy confirmation of dosage schemes is necessary, correlating the kinetic profile of both authorized doses and higher doses, often used in practice, with the in vitro efficacy evaluation of field isolated strains, known as more resistant (Mc Kellar et al., 2004). To determine bacteriostatic or bactericidal effects, main PK/PD indices result from combination of blood concentration parameters, as maximum or minimum concentrations, (Cmax and Cmin, respectively), half-life, area under the curve (AUC) with PD characteristics, as sensitivity, MIC, minimum bactericidal
22
concentration (MBC). The indices that best correlate kinetics and efficacy are the ratio between AUC calculated from 0 to 24 h (AUC0-24) and MIC (AUC0-
24/MIC), between Cmax and MIC (Cmax/MIC) and the time during which blood concentrations exceed the MIC (T>MIC). All these indices (breakpoints) are particularly useful to optimize efficacy and minimize resistance of antimicrobials used in therapy (Toutain and Lees, 2006). The PK/PD indices are also now used to derive breakpoints by the Clinical and Laboratory Standards Institute (CLSI; formerly NCCLS) subcommittee on Veterinary Antimicrobial Susceptibility Testing (VAST) (Papich, 2014).
1.7 Fluoroquinolones
1.7.1 History of fluoroquinolones
The fluoroquinolones, also known as quinolones, 4- quinolones and quinolone carboxylic acids, are a large and expanding group of synthetic antimicrobial agents. The history of quinolone agents began with the discovery of nalidixic acid in 1962 as an accidental byproduct during the synthesis of antimalarial compound, chloroquine (Lesher and Froelich, 1962). The nalidixic acid was the first 4-quinolone marketed for clinical use. However, the effectiveness of nalidixic acid was limited due to poor absorption and distribution, narrow spectrum of activity including the tendency to select for resistant organisms during the course of therapy, and its toxic effect on the host. Over the next two decades hundreds of analogues of nalidixic acid were synthesized but only a few (such as pipemidic acid, oxolinic acid and flumequine) were used clinically. Despite chemical modifications to the basic 4-quinolone molecule, these products had many of the same limitations that affected the clinical use of nalidixic acid, restricting their use principally to the treatment of urinary infections. The success for this class of antibacterial agents came when a fluorine atom and a piperazine ring were attached to the 6- and 7- positions, respectively, of the basic quinolone nucleus. These substitutions increased absorption, increased antibacterial activity and reduced toxicities (Ball, 2000). The first of these newer agents used clinically was norfloxacin that exhibited activity against many common bacterial pathogens but was less active against more troublesome organisms such as Pseudomonas aeruginosa (Koga et al., 1980). Structurally, norfloxacin differed from nalidixic acid and the substitutions performed increased the activity against Gram-positive and Gram-negative bacteria (Schentag and Scully, 1999). Compared to original quinolones, these compounds possess superior pharmacokinetic characteristics, such as good bioavailability when given orally, greater tissue penetration, and a longer half-life. Since then, a large number of new molecules, many of them polifluorate derivatives, have been synthesized (Escribano et al., 1997).

23
The fluoroquinolones are classified into different groups or generations based on their chemical structure or their biological activities. The biological classification places fluoroquinolones in three groups of generations; the first-generation molecules are those with antibacterial activity restricted to the Enterobacteriaceae. Second-generation quinolones have an extended spectrum of activity whereas the third-generation exhibited considerable improving of activity also against streptococci and obligate anaerobes(Martinez et al., 2006). Just at the beginning of the 1980’s,the first older generation quinolones (e.g. oxolinic acid and flumequine) were licensed for use in food animals and during the late1980’s and early 1990’s, also the first fluoroquinolones. To date there have been eight fluoroquinolones approved for use in veterinary medicine: danofloxacin, difloxacin, enrofloxacin, ibafloxacin (Europe only at this time), marbofloxacin, orbifloxacin, pradofloxacin and sarafloxacin (Giguère and Dowling, 2013).
1.7.2 Mechanism of action
Fluoroquinolones act by inhibiting two enzymes involved in bacterial DNA synthesis, both of which are DNA topoisomerases that human cells lack and that are essential for bacterial DNA replication, thereby enabling these agents to be both specific and bactericidal. DNA topoisomerases are responsible for separating the strands of duplex bacterial DNA, inserting another strand of DNA through the break, and then resealing the originally separated strands. Specifically, fluoroquinolones inhibit DNA gyrase (topoisomerase II) and topoisomerase IV. DNA gyrase introduces negative superhelical twists in the bacterial DNA doublehelix ahead of the replication fork, thereby catalyzing the separation of daughter chromosomes (Blondeau, 2004). This activity is essential for initiation of DNA replication and allows for binding of initiation proteins. The topoisomerase IV enzyme is a secondary fluoroquinolone target and it is responsible for decatenation that is, removing the interlinking of daughter chromosomes thereby allowing segregation into two daughter cells at the end of a round of replication. Fluoroquinolones interact with the enzyme-bound DNA complex (i.e., DNA gyrase with bacterial DNA or topoisomerase IV with bacterial DNA) to create conformational changes that result in the inhibition of normal enzyme activity (Martinez et al., 2006). As a result, the new drug– enzyme–DNA complex blocks progression of the replication fork, thereby inhibiting normal bacterial DNA synthesis and ultimately resulting in rapid bacterial cell death (Blondeau, 2004). A peculiarity of these antimicrobials is their biphasic concentration-response curve (paradoxical effect). Survival curves show that when the fluoroquinolone concentration is near the minimal inhibitory concentration (MIC) of bacterium, the drug has a static effect on bacterial growth (bacteriostatic). As the

24
concentration increases relative to the MIC, bacterial killing increases up to a certain drug concentration termed the optimum bactericidal concentration. As concentration exceed the optimum bactericidal concentration, further increases in drug concentration can lead to a decrease in bacterial killing. Initially these concentration-related differences in drug effect may be associated with the difference between concentrations needed to inhibit DNA supercoiling versus those needed to inhibit bacterial growth. In general, it appears that the supercoiling reaction of gyrase is less sensitive to the drugs than is bacterial growth by one or two orders of magnitude (Martinez et al., 2006).
1.7.3 Spectrum of activity
The fluoroquinolones have excellent activity in vitro against a wide range of aerobic Gram-negative bacteria, including the Enterobacteriaceae, Actinobacilluspleuropneumoniae, Histophilussomni, Mannheimiahaemolytica, and Pasteurella spp. including P. multocida. They are also active against Bordetellabronchiseptica, Brucella spp., and Chlamydia/Chlamydophila spp. (Giguère and Dowling, 2013).Fluoroquinolones also have significant activity against veterinary mycoplasmas (Govendir et al., 2011). Activity against Pseudomonasaeruginosa is dependent on the compound, with ciprofloxacin being the most potent agent against this bacterium (Van Bambeke et al., 2005). Generally, the first- and second-generation fluoroquinolones are less active against Gram-positive bacteria, especially enterococci, and have poor activity against anaerobic bacteria. The third-generation of fluoroquinolones target this deficiency. For example, trovafloxacin, moxifloxacin, and gatifloxacin are newer fluoroquinolones with good in vitro activity against obligate anaerobes (Stein and Goldstein, 2006). Most fluoroquinolones approved for use in veterinary medicine should be considered to be ineffective against obligate anaerobes. The only exception is pradofloxacin, which is active against anaerobic bacteria from dogs and cats including Clostridium spp., Bacteroides spp., Fusobacterium spp., and Prevotella spp. (Silley et al., 2007).
1.7.4 Resistance mechanisms
Resistance to the fluoroquinolones occurs by target modification, decreased permeability, efflux and/or target protection. Each of these fluoroquinolones resistance mechanisms can occur simultaneously within the same cell, thereby leading to very high resistance levels (Giguère and Dowling, 2013). The major mechanism of quinolone resistance is alteration of the target enzymes of fluoroquinolones, DNA gyrase and topoisomerase IV.Both enzymes are composed of 2 pairs of subunits: GyrA and GyrB in DNA gyrase, ParC and ParE in DNA topoisomerase IV. Resistance to fluoroquinolones occurs as a result of changes in amino acid composition, particularly in the Quinolone-Resistance-

25
Determining Regions (QRDRs) within GyrA and ParC, making the target enzymes less susceptible to fluoroquinolones (Fàbrega et al., 2008). Among Gram-negative organisms, quinolone resistance typically develops in a stepwise manner. A single QRDR mutation, usually at serine 83 (Ser83), confers resistance to nalidixic acid and decreases susceptibility to fluoroquinolones; secondary mutations in the GyrA QRDR lead to overt fluoroquinolone resistance. However, this does not apply to all Gram-negative bacteria. In Campylobacter, which lacks topoisomerase IV, a single mutation in GyrA is sufficient to impart high-level of MICs (Wang et al., 1993). This feature helps explain the higher prevalence of resistance in Campylobacter, compared with E. coli, from food animals exposed to fluoroquinolones (Van Boven et al., 2003). While mutations in the quinolone target genes are required to achieve a clinical level of resistance, several other mechanisms may also contribute to resistance, including decreased intake of the drug due to the loss of a membrane-bound porin; drug extrusion via efflux pumps, some of which may have a broad substrate specificity; or one of the more recently described plasmid-mediated quinolone resistance (PMQR) mechanisms (Karczmarczyk et al., 2011).
1.7.5 Pharmacokinetic properties
Generally these compounds are characterized by a high volume of distribution, long biological half-life, low serum protein binding, elimination by renal and extrarenal mechanisms with high total and renal clearances, limited biotransformation and moderate to excellent bioavailability after oral administration (Giguère and Dowling, 2013). The fluoroquinolones used in veterinary medicine are primarily administered orally although parental formulations are available for administration to dogs, cats, horses and food animals. Although there is considerable individual variation among the different compounds and in the different animal species, the fluoroquinolones are rapidly absorbed following oral administration in monogastric species; bioavailability is rather low in ruminants although the reason for has not been determined (Brown, 1996). When fluoroquinolones are co-ingested with food the time to reach peak concentration (Tmax) may be delayed but the maximum concentration (Cmax) is unaffected. However, concomitant administration with products that contain metal cations (such as Fe, Ca, Mg), will adversely affect the Cmax. Parenteral bioavailability of most quinolones is approximately complete in pre-ruminants and ruminants cattle (Thomas et al., 1994a). Following absorption, fluoroquinolones exhibit rapid and extensive tissue distribution because of their physicochemical properties; moreover they have the capacity to penetrate nearly all organs and cells. Their apparent volumes of distribution exceed total body water (> 1 L/kg).As with other antibiotics which
26
exhibit intracellular accumulation (e.g. tetracyclines, macrolides), the concentrations of fluoroquinolones in different tissues are often higher than the concurrent serum levels. Fluoroquinolones are able to concentrate within phagocytic and non-phagocytic cells and remain active against different facultative, obligate, intracellular pathogens (Brown, 1996). In most species, this distribution volume over 3 times greater than that of most ß-lactam antibiotics and aminoglycoside, and probably represents intracellular sequestration of the drug in various tissues. The very good distribution of these drugs is also due to their low plasma protein binding (<50%) (Giguère and Dowling, 2013). Fluoroquinolones undergo a partial hepatic metabolism and give rise to active metabolites that are excreted in bile and urine. Fluoroquinolone metabolic pathways include glucuronidation, N-oxidation and desmethylation. Generally, metabolism involves the CYP 450 system (Martinez et al., 2006). For example, the major metabolite of enrofloxacin is ciprofloxacin; the amount of ciprofloxacin produced varies with different species, with some producing ciprofloxacin concentrations that exceed the MIC of some pathogens (Kung et al., 1993). Elimination may be via liver or kidneys or both depending on the compound. The fluoroquinolones are predominantly excreted as unchanged drug in the urine by glomerular filtration and active tubular secretion. The exception is difloxacin, where 80% is excreted in the feces. The elimination half-life of the fluoroquinolones is dependent on the drug and the animal species, and may also be dose dependent. The long elimination half-lives make these compounds ideal for every 24 or 48 hour dosing regimens (Giguère and Dowling, 2013).
1.7.6 Pharmacodynamic properties and PK/PD correlation
With ideal pharmacokinetic characteristics but a potential to select for resistant bacteria, optimal therapeutic dosage regimens for fluoroquinolones requires, as previously described, the PK/PD integration (Giguère and Dowling, 2013). The universally recognized variable, which provides a quantitative index of drug efficacy and potency, is MIC and it is defined as the lowest concentration which completely inhibits bacterial growth. MBC is an alternative, but less frequently used, measure of potency. It is the drug concentration that produces a 99.9% reduction in bacterial count. Another PD variable, used specifically in relation to antimicrobial resistance acquired by mutation (e.g. quinolone resistance), is mutant prevention concentration(MPC), which is defined as the concentration that does not allow any mutant to be recovered from a population of more than 1010 microorganisms (Lees et al., 2008). The best parameters associated with fluoroquinolones efficacy are AUC0-24/MIC or Cmax/MIC ratios (Toutain and Lees, 2006). For fluoroquinolones, several authors reported that resistance selection may be reduced by achieving an

27
AUC0-24/MIC ratio > 100 h or a Cmax/MIC ratio > 8 for concentration-dependent antimicrobial drugs. Other authors recommended, ratios > 125 h for AUC0-24/MIC or a Cmax/MIC > 10 to achieve high efficacy (McKellar et al., 2004).Furthermore, differences result if efficacy is determined against Gram-negative or Gram-positive strains. For the former microorganisms the ratio to ensure bacterial cure and prevent the selection of resistant bacteria should be approximately 125, while with the latter the ratio can be as low as 30-50 (Martinez et al., 2006). The exact AUC/MIC ratio that would predict outcome of infection in domestic animals would likely vary according to animal species, infectious agent, site of infection, immune status of the host, and specific fluoroquinolones selected (Giguère and Dowling, 2013).
1.7.7 Adverse effects
Fluoroquinolones are relatively safe antimicrobial drugs. When administered at therapeutic doses, toxic effects are mild and generally limited to gastrointestinal disturbances such as nausea, vomiting, and diarrhea. Chronic, high-dose fluoroquinolone therapy causes articular cartilage lesions in juvenile dogs, particularly in weight bearing joints (Burkhardt et al., 1992). Retinal degeneration has been reported in cats treated with high doses (20 mg/kg every 24 hours) of enrofloxacin (Wiebe and Hamilton, 2002). Neurotoxic effects causing central nervous system disturbances (seizures, dizziness, ataxia, insomnia, restlessness, somnolence, tremors) are common adverse effects of fluoroquinolones in humans and have been reported in horses, dogs and cats treated with enrofloxacin (Papich and Riviere, 2009). Photosensitivity and Achilles tendon rupture has been associated with the use of fluoroquinolones in humans but has not been reported in animals (Brown, 1996).
1.7.8 Clinical applications
Quinolones are indicated for the treatment of local and systemic infections caused by susceptible microorganisms, particularly against deep-seated infections and intracellular pathogens. Therapeutic success has been obtained in respiratory, intestinal, urinary, and skin infections, as well as in bacterial prostatitis, meningoencephalitis, osteomyelitis, and arthritis. In horses they are useful for the treatment of a variety of Gram-negative infections caused by susceptible bacteria resistant to alternative, first-choice drugs. Several fluoroquinolone products are approved for use in swine to treat respiratory disease and Metritis-Mastitis-Agalactia syndrome (Papich and Riviere, 2009). In companion animals these drugs can be used to treat a large number of diseases such as prostatitis and mastitis caused by susceptible bacteria; urinary tract
28
infections; respiratory infections including rhinitis and pneumonia and osteomyelitis and soft tissue infection (Giguère and Dowling, 2013). In avian species respiratory and systemic infections caused by avian pathogenic Escherichiacoli (APEC) constitute the most prevalent and economically most important primary or secondary bacterial diseases (Lutful Kabir, 2010). Fluoroquinolones are considered potentially useful drugs in the treatment of colibacillosis and other infections caused by E. coli in chickens and turkeys, in particular when first and second choice drugs had failed.
29
1.8 References
Aarestrup, F. M. (1999). Association between the consumption of antimicrobial agents in
animal husbandry and the occurrence of resistant bacteria among food animals. International
journal of antimicrobial agents. 12(4), 279-285.
Aarestrup. F.M., Wegener, H.C. and Collignon, P. (2008). Resistance in bacteria of the
food chain: epidemiology and control strategies. Expert Rev. Anti. Infect. Ther. 6(5), 733–750.
AVEC Association of Poultry Processors and Poultry Trade in the EU countries, Annual
Report, 2014 http://www.avec-poultry.eu (16 December, date last accessed).
Ball, P. (2000). Quinolone generations: natural history or natural selection. J Antimicrob
Chemother. 46, 1-17.
Blondeau, J.M. (2004). Fluoroquinolones: mechanism of action, classification and
development of resistance. Survey of ophthalmology. 49(2), S73-S78.
Boerlin, P. and White, D.G. (2013). Antimicrobial resistance and its epidemiology In
Giguère, S., Prescott, J.F. and Dowling, P.M., editors. Antimicrobial therapy in veterinary medicine.
Fifth editions. Wiley-Blackwell.
Brown, S.A., (1996). Fluoroquinolones in animal health. J Vet Phatmacol Therap. 19, 1-14.
Burkhardt, J.E., Hill, M.A., Turek, J.J. and Carlton, W.W. (1992). Ultrastructural changes
in articular cartilages of immature beagle dogs dosed with difloxacin, a fluoroquinolone.
Veterinary Pathology Online. 29(3), 230-238.
Charleston, B., Gate, J.J., Aitken, I.A., Stephan, B. and Froyman, R. (1998). Comparison
of the efficacies of three fluoroquinolone antimicrobial agents, given as continuous or pulsed-
water medication, against Escherichia coli infection in chickens. Antimicrobial agents and
chemotherapy. 42(1), 83-87.
Cheng A.C., Turnidge J., Collignon P., Looke D., Barton M. and Gottlieb, T. (2012).
Control of fluoroquinolone resistance through successful regulation, Australia. Emerging
Infectious Diseases. 18,1453-1460.
CLSI. (2007). Performance standards for antimicrobial susceptibility testing; 16th
informational supplement. CLSI document M100-S17. CLSI, Wayne, PA.
CLSI. (2013). Performance Standards for Antimicrobial Disk and Dilution Susceptibility
Tests for Bacteria Isolated From Animals; Approved Standard—Fourth Edition. CLSI
Document VET01-A4. Clinical and Laboratory Standards Institute, Wayne, PA (and
Performance Standards for Antimicrobial Disk and Dilution Susceptibility Tests for Bacteria
Isolated From Animals; Second Informational Supplement. CLSI document VET01-S2.
Clinical and Laboratory Standards Institute, Wayne, PA).
Coates, A.R.M. (2012) Antibiotic Resistance in Handbook of Experimental Pharmacology.
Springer Berlin Heidelberg.

30
DANMAP. Use of Antimicrobial Agents and Occurrence of Antimicrobial Resistance in
Bacteria from Food Animals, Foods and Humans in Denmark 2013
http://www.danmap.org/ (12 December 2014, date last accessed).
EMA. (2006). The European Agency for Evaluation of Medicinal Products. Reflection paper
on the use of fluoroquinolones in food-producing animals in the European union:
Development of resistance and impact on human and animal health.
EMEA/CVMP/SAGAM/184651/2005.
EMA. (2011). The European Agency for Evaluation of Medicinal Products. Committee for
Medicinal Products for Veterinary Use (CVMP) CVMP strategy on antimicrobials 2011-2015.
EMA/CVMP/287420/2010.
Escribano, E., Calpena, A.C., Garrigues, T. M., Freixas, J., Domenech, J. and Moreno,
J. (1997). Structure-absorption relationships of a series of 6-fluoroquinolones. Antimicrobial
agents and chemotherapy. 41(9), 1996-2000.
Esmail, S.H. (1996). Water: The vital nutrient. Poultry International. 35(14), 72-77.
ESVAC (2013). European Medicines Agency, Sales of veterinary antimicrobial agents in 25
EU/EEA countries in 2011. www.ema.europa.eu/docs/en_GB/document_library/
Report/2013/10/WC500152311.pdf (16 December, date last accessed).
European Food Safety Authority (2010) The Community Summary Report on antimicrobial
resistance in zoonotic and indicator bacteria from animals and food in the European Union in
2004-2007. EFSA Journal, 8: 1309.
Fàbrega, A., Sánchez-Céspedes, J., Soto, S. and Vila, J. (2008). Quinolone resistance in
the food chain. International journal of antimicrobial agents. 31(4), 307-315.
FARM. French Antimicrobial Resistance Monitoring Program in Bacteria of Animal
Origin.2013.http://www.anses.fr (30 November 2014, date last accessed)
FDA.(2005). U.S. Food and Drug Administration. Withdrawal of approval of the new animal
drug application for enrofloxacin in poultry; Docket No. 2000N–1571.http://
www.fda.gov/AnimalVeterinary/SafetyHealth/RecallsWithdrawals/ucm042004.htm(13
September 2014, date last accessed).
Fleming, A. (1945). Penicillin. Nobel Lecture, December 11, 1945. Nobel e-museum.
FVE, (1999) Federation of veterinarians of Europe. antibiotic resistance and prudent use of
antibiotics in veterinary medicine. http://www.fve.org/news/publications/pdf/antibioen.pdf.
(15 November 2014, date last accessed)
Garcia-Migura, L., Hendriksen, R.S., Fraile, L. and Aarestrup, F.M. (2014).
Antimicrobial resistance of zoonotic and commensal bacteria in Europe: The missing link
between consumption and resistance in veterinary medicine. Veterinary microbiology. 170(1), 1-9.
31
Gelaude, P., Schlepers, M., Verlinden, M., Laanen, M. and Dewulf, J. (2014). Biocheck.
UGent: A quantitative tool to measure biosecurity at broiler farms and the relationship with
technical performances and antimicrobial use. Poultry science. 93(11), 2740-2751.
Giguère, S. and Dowling, P.M. (2013) Fluoroquinolones In Giguère, S., Prescott, J.F. and
Dowling, P.M., editors. Antimicrobial therapy in veterinary medicine. Fifth editions. Wiley-Blackwell.
295-315.
Govendir, M., Hansen, T., Kimble, B., Norris, J. M., Baral, R. M., Wigney, D. I. and
Malik, R. (2011). Susceptibility of rapidly growing mycobacteria isolated from cats and dogs,
to ciprofloxacin, enrofloxacin and moxifloxacin. Veterinary microbiology. 147(1), 113-118.
Guardabassi, L., Kruse, H., Jensen, L. B., Angulo, F. J., Mølbak, K., Wegener, H.C.
and Corsin, F. (2008). Principles of prudent and rational use of antimicrobials in animals. In:
Guardabassi L, Jensen LB, Kruse H, editors. Guide to Antimicrobial use in Animals. Oxford, UK:
Blackwell Publishing, 1-12.
Hofacre, C.L., Fricke, J.A., Inglis, T. (2013). Antimicrobial drug use in poultry In Giguère,
S., Prescott, J.F. and Dowling, P.M., editors. Antimicrobial therapy in veterinary medicine. Fifth
editions. Wiley-Blackwell. 569-588.
Karczmarczyk, M., Martins, M., Quinn, T., Leonard, N. and Fanning, S. (2011).
Mechanisms of fluoroquinolone resistance in Escherichia coli isolates from food-producing
animals. Applied and environmental microbiology. 77(20), 7113-7120.
Koga, H., Itoh, A., Murayama, S., Suzue, S. and Irikura, T. (1980). Structure-activity
relationships of antibacterial 6, 7-and 7, 8-disubstituted 1-alkyl-1, 4-dihydro-4-oxoquinoline-3-
carboxylic acids. Journal of medicinal chemistry. 23(12), 1358-1363.
Küng, K., Riond, J.L. and Wanner, M. (1993). Pharmacokinetics of enrofloxacin and its
metabolite ciprofloxacin after intravenous and oral administration of enrofloxacin in dogs. J
Vet Pharmacol therap. 16(4), 462-468.
Laanen, M., Maes, D., Hendriksen, C., Gelaude, P., De Vliegher, S., Rosseel, Y., and
Dewulf, J. (2014). Pig, cattle and poultry farmers with a known interest in research have
comparable perspectives on disease prevention and on-farm biosecurity. Preventive veterinary
medicine.115(1), 1-9.
Lees, P. and Shojaee Aliabadi, F. (2002). Rational dosing of antimicrobial drugs: animals
versus humans. International journal of antimicrobial agents. 19(4), 269-284.
Lees, P., Svendsen, O., and Wiuff, C. (2008) Strategies to minimise the impact of
antimicrobial treatment on the selection of resistance bacteria. In: Guardabassi L, Jensen LB,
Kruse H, editors. Guide to Antimicrobial use in Animals. Oxford, UK: Blackwell Publishing; 77-
101.
Lohren, U., Ricci, A. and Cummings, T.S. (2008) Guidelines for antimicrobial use in
poultry. In: Guardabassi L, Jensen LB, Kruse H, editors. Guide to Antimicrobial use in Animals.
Oxford, UK: Blackwell Publishing; 126–142.
32
Lutful Kabir, S.M. (2010). Avian colibacillosis and salmonellosis: A closer look at
epidemiology, pathogenesis, diagnosis, control and public health concerns. Int. J. Environ. Res.
Public Health. 7, 89–114.
MARAN. Monitoring of Antimicrobial Resistance and Antibiotic Usage in Animals in the
Netherlands in 2013 http://www.wageningenur.nl (15 December 2014, date last accessed)
Marshall, B.M. and Levy, S.B. (2011). Food animals and antimicrobials: impacts on human
health. Clinical microbiology reviews. 24(4), 718-733.
Martinez, M., McDermott, P. and Walker, R. (2006). Pharmacology of the
fluoroquinolones: a perspective for the use in domestic animals. The Veterinary Journal, 172(1),
10-28.
Martinez, M. and Silley, P. (2010). Antimicrobial drug resistance. In Comparative and
Veterinary Pharmacology. Springer Berlin Heidelberg. 227-264.
Mayer, D. (2009). Antimicrobial Drug Resistance: Mechanisms of Drug Resistance. Springer
Berlin Heidelberg.
McEwen, S.A. and Fedorka-Cray, P.J. (2002). Antimicrobial use and resistance in animals.
Clinical Infectious Diseases, 34(Supplement 3), S93-S106.
McKellar, Q., Sanchez Bruni, S.F. and Jones, D.G. (2004) Pharmacokinetics and
pharmacodynamics relationship of antimicrobial drugs in veterinary medicine. J Vet Pharmacol
therap, 27, 503-514.
NORM-VET. Usage of Antimicrobial Agents and Occurrence of Antimicrobial Resistance in
Norway.2013 http://www.vetinst.no (15 December 2014, date last accessed).
Papich, M.G and Riviere, J.E., (2013). Fluoroquinolone antimicrobial drugs In Riviere, J.E.,
and Papich, M.G. Veterinary pharmacology and therapeutics. Ninth Edition John Wiley & Sons.
985-1005.
Papich, M.G. (2014). Pharmacokinetic–pharmacodynamic (PK–PD) modeling and the
rational selection of dosage regimes for the prudent use of antimicrobial drugs. Veterinary
microbiology. 171, 480-486.
Rybak, M.J. (2006). Pharmacodynamics: relation to antimicrobial resistance. American journal
of infection control. 34(5), S38-S45.
Sarkozy, G. (2001). Quinolones: a class of antimicrobial agents. Veterinarni Medicina-Praha.
46(9/10), 257-274.
Schentag, JJ. and Scully, B.E. (1999). Quinolones. In: Yu, V.L., Merigan, T.C. and Barriere,
S.L. Antimicrobial therapy and vaccines. Williams and Wilkins, New York. 875-901.
Silley, P., Stephan, B., Greife, H. A. and Pridmore, A. (2007). Comparative activity of
pradofloxacin against anaerobic bacteria isolated from dogs and cats. Journal of antimicrobial
chemotherapy. 60(5), 999-1003.
33
Stein, G.E. and Goldstein, E.J. (2006). Fluoroquinolones and anaerobes. Clinical infectious
diseases. 42(11), 1598-1607.
SVARM. Use of antimicrobials and occurrence of antimicrobial resistance in Sweden. 2013
http://www.sva.se (28 November 2014, date last accessed)
Teale, C. J. and Moulin, G. (2012). Prudent use guidelines: a review of existing veterinary
guidelines. Revue scientifique et technique (International Office of Epizootics). 31(1), 343-
354.
Tenover, F. C. (2006). Mechanisms of antimicrobial resistance in bacteria. The American
journal of medicine. 119(6), S3-S10.
Thomas, V., Deleforge, J. and Bolsramé, B. (1994a): Pharmacokinetics of marbofloxacin in
preruminant and ruminant cattle. In: Proceedings of the Sixth Congress of the European
Association for Veterinary Pharmacology and Toxicology, Edinburgh, Scotland. 60–61.
Toutain, P.L., DelCastillo, J.R., and Bousquet-Melou, A. (2002). Pharmacokinetics/
pharmacodynamics approach to a rationale dose regimen for antibiotics. Res Vet Science, 73,
105-114.
Toutain, P.L. and Lees, P. (2006) The population PK/PD approach for a rationale use of
antinfective drugs to minimize resistance. J Vet Pharmacol Ther, 29 (1), 26-28.
Toutain, P.L., Ferran, A. and Bousquet-Mélou, A. (2010). Species differences in
pharmacokinetics and pharmacodynamics. In Cunningham, F., Elliott, J., Lees, P.,
Comparative and Veterinary Pharmacology.Springer Berlin Heidelberg. 19-48.
United States Department of Health and Human Services Food and Drug
Administration, Center for Veterinary Medicine (CVM) (2010). The judicious use of
antimicrobials for poultry veterinarians, draft guidance. CVM, Rockville, Maryland. Available
at:
http://www.fda.gov/downloads/AnimalVeterinary/SafetyHealth/AntimicrobialResistance/J
udiciousUseofAntimicrobials/UCM095575.pdf (accessed on 25 November 2014).
Van Bambeke, F., Michot, J.M., Van Eldere, J. and Tulkens, P.M. (2005). Quinolones in
2005: an update. Clinical Microbiology and infection. 11(4), 256-280.
Van Boven, M., Veldman, K.T., De Jong, M.C. and Mevius, D.J. (2003). Rapid selection
of quinolone resistance in Campylobacter jejuni but not in Escherichiacoli in individually housed
broilers. Journal of Antimicrobial Chemotherapy. 52, 719–723.
VAV. Veterinary Monitoring of Antimicrobial Resistance in Spain.2005
https://www.visavet.es (10 December 2014, date last accessed).
Vermeulen, B., De Backer, P. and Remon, J.P. (2002). Drug administration to poultry.
Advanced drug delivery reviews. 54(6), 795-803.

34
Wang, Y., Huang, W.M. and Taylor, D.E. (1993). Cloning and nucleotide sequence of the
Campylobacter jejuni gyrA gene and characterization of quinolone resistance mutations.
Antimicrobial Agents and Chemotherapy. 37, 457–463.
Wiebe, V. and Hamilton, P. (2002). Fluoroquinolone-induced retinal degeneration in cats. J
Am Vet Med Assoc. 221(11), 1568-1571.
Wise, R. (2003). Maximizing efficacy and reducing the emergence of resistance. Journal of
Antimicrobial Chemotherapy. 51(1), 37-42.

35
Objectives
CHAPTER 2

36

37
2. Objectives
Due to a wide understanding of the effects of antibiotics and the increase of the phenomena of microbial resistance to these drugs, a particular attention has been devoted, during the last years, to antibacterial use in humans and animals and in particular to the methods oriented to a correct evaluation of efficacious dosages for a more prudent and targeted use of antimicrobials in veterinary species. The PK/PD approach gives tools to improve efficacy in field through the relationship between the efficacy values of the antimicrobial drug studied in vitro ( PD) with the main kinetic parameters obtained by studying the fate of a drug in a target specie (PK). Therefore the PK/PD relationship can serve to obtain estimates of doses that may be needed to achieve a desired clinical response or to modify a dosing regimen based upon susceptibility information on the considered pathogen. The present study was focused on a particular avian species, turkeys that is considered a “minor species”, but important in the livestock production of Northern Italy. Scarce data exist about the usage of antimicrobial drugs in turkey and even less is known about their efficacy. As the limited number of medicinal products authorized in this species, antimicrobial therapy is frequently carried out with the few products authorized or with drugs “extra-label” used with the consequence of increases of selective pressure and also with the possibility of cross-resistance within the same pharmacological group of compounds. In this regard, the aim of the study is the revision of dosages and schemes of treatment of two fluoroquinolones. The first step was to optimize and validate a fast, sensitive, and specific liquid chromatography-mass spectrometry (LC-MS) method suitable for the detection of a wide range of concentrations of different fluoroquinolones from several biological matrices as those occurring in pharmacokinetic and residue depletion studies (first trial). The developed method was then used for the quantification of fluoroquinolones in plasma and tissue samples of turkeys derived from pharmacokinetic studies (second and third trials). In the pharmacokinetic trials, three types of oral treatment were considered: single oral gavage, that is considered ideal for the pharmacokinetic profiles, but is not feasible infield conditions, five days of 10 hours pulsed water medication and five days of 24 hours continuous water medication, which are commonly used in farms. Pulse administration can be a viable choice for concentration-dependent antimicrobials, as fluoroquinolones, because it allows to reach higher concentration levels in systemic circulation in a shorter time compared to continuous water medication.
38
In order to evaluate and eventually recommend a different route of administration than the oral one, the subcutaneous administration was also carried out. To revise the recommended dosage, the EU authorized dose and the doubled dose were examined. The double dose was chosen to assess if better results can be achieved with the dosage schemes considered. The kinetic parameters obtained from the above described trials were correlated
with MIC of E.Coli field strains, in order to obtain the PK/PD parameters for
doses optimization. E.Coli is a Gram-negative bacterium responsible of different
local and systemic diseases of poultry, such as colibacillosis. Mostly, it acquires
resistance quite easily, in fact it is now resistant to many antibiotics that are used
as the first line treatment of colibacillosis. The fluoroquinolones are among the
most effective antimicrobial compounds for poultry pathogens and for
colibacillosis, in particular, but being the drug of choice for many human
bacterial diseases, these antimicrobial agents must be considered as last choice
product in avian medicine.
The drugs under consideration were flumequine and enrofloxacin.
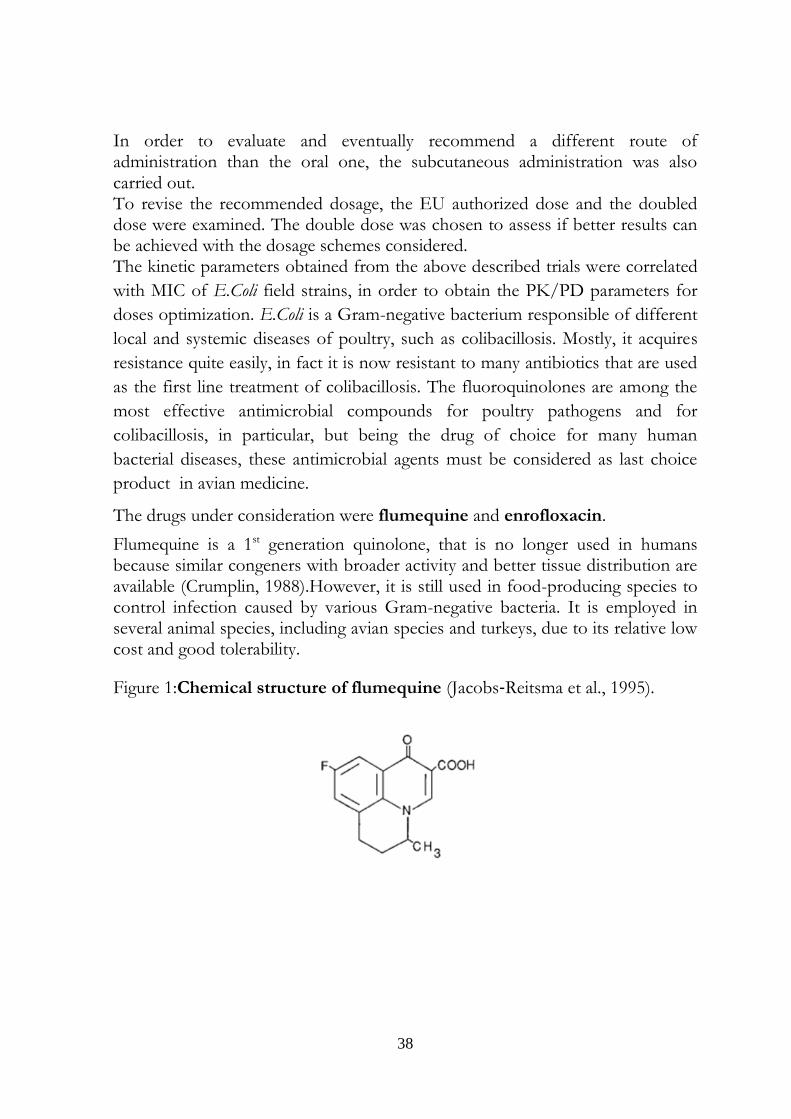
Flumequine is a 1st generation quinolone, that is no longer used in humans because similar congeners with broader activity and better tissue distribution are available (Crumplin, 1988).However, it is still used in food-producing species to control infection caused by various Gram-negative bacteria. It is employed in several animal species, including avian species and turkeys, due to its relative low cost and good tolerability.
Figure 1:Chemical structure of flumequine (Jacobs‐Reitsma et al., 1995).

39
Enrofloxacin is a 2nd generation quinolones, approved only in veterinary medicine, with an extended spectrum of antibacterial activity and used in food and companion animals to control infection caused by various Gram-negative bacteria. Ciprofloxacin, its primary active metabolite is also a very potent antibacterial used mainly in human medicine. In European Countries, enrofloxacin was approved in the 1990s and is still extensively used in poultry for colibacillosis treatment, due to its unique effectiveness against multidrug-resistant avian pathogenic Escherichia coli (Lutful Kabir, 2010).
Figure 2: Chemical structure of enrofloxacin (Jacobs‐Reitsma et al., 1995).
2.1 References
Crumplin, G.C. (1988). Aspects of Chemistry in the Development of 4-Quinolone Anti-S2
bacterial Agents. Review of Infectious Diseases. 10(Supplement 1), S2-S9.
Jacobs‐Reitsma, W.F., Kan, C.A. and Bolder, NM. (1994). The induction of quinolone
resistance in Campylobacter bacteria in broilers by quinolone treatment. Letters in Applied
Microbiology. 19(4), 228-231.
Lutful Kabir, S.M. (2010). Avian colibacillosis and salmonellosis: A closer look at
epidemiology, pathogenesis, diagnosis, control and public health concerns. Int. J. Environ. Res.
Public Health. 7, 89–114.

40
Development and validation of an LC-MS/MS/MS method for the
quantification of fluoroquinolones in several matrices from treated
turkeys
Published in: Food Control, 48; 2-11, 2015.
CHAPTER 3

41
42
3.Development and validation of an LC-MS/MS/MS method for the quantification of fluoroquinolones in several matrices from treated turkeys
AUTHORS: L. Lucatello a, P. Cagnardi b, F. Capolongo a, C. Ferraresi b,F. Bernardi a, C. Montesissa a. aDepartment of Comparative Biomedicine and Food Science, Università degli Studi di Padova, Viale dell’Università 16, Legnaro, PD, Italy. bDepartment of Health, Animal Sciences and Food Safety, Università degli Studi di Milano, Milano, Italy.
3.1 Abstract
The study presents a sensitive and reliable confirmatory method for the extraction, identification, quantification of five fluoroquinolones (FQ) namely enrofloxacin, ciprofloxacin, difloxacin, sarafloxacin and flumequine, in plasma, liver, kidney, muscle, skin þ fat, lung and intestinal content from turkeys. For the extraction and matrix clean-up of FQ residues from all biological matrices, the Quick EasyCheap Effective Rugged Safe (QuEChERS) methodology was adopted; only for plasma samples acetonitrile was used. The analyses were performed by liquid chromatography with mass spectrometry detection (LC-MS). LC separation was performed on a C18 Kinetex column (100x2.1 mm, 2.6 µm, Phenomenex, CA, USA)with gradient elution using ammonium acetate solution (10 mM, pH 2.5) and methanol containing 0.1%formic acid. Mass spectrometric identification was done using an LTQ XL ion trap (Thermo Fisher Scientific,CA, USA), with a heated electrospray ionization probe, in positive ion mode. The method was validated according to the European Legislation (decision 2002/657/EC) and EMA guideline (EMA/CVMP/VICH/463202/2009); selectivity, linearity response, trueness (in terms of recovery),precision (within-day repeatability and within-laboratory reproducibility), limit of detection, limit of quantification, decision limits, detection capability, absolute recovery and robustness were evaluated using turkey blank matrices. All data were within the required limits established for confirmatory methods except for flumequine which presented a recovery value slightly higher than 110% in muscle and intestinal content. For all FQs, all the extraction rates were greater than 70% and limits of quantification ranged from 1.2 µg kg-1 to 118.8 µg kg-1. This fast and robust method was suitable for the identification and quantification of FQ residues in tissues, plasma and intestinal content as confirmed by data

43
obtained from incurred samples of turkeys treated at farm for therapeutic purposes.
3.2 Introduction
In EU, fluoroquinolones (FQs) have been authorized for several veterinary species for the treatment of gastrointestinal and respiratory infections caused by gram positive and negative bacteria(Barnes, Nolan, & Vaillancourt, 2008; Riviere & Papich, 2009;Webber & Piddock, 2001). In USA, in 2005, ENRO was banned in poultry due to the wide spread of resistance in Campylobacter spp., a commensal microorganism or poultry but a pathogen for human (FDA, 2005). In EU, the drug is still authorized and largely used in poultry (EMA, 2006),despite monitoring plans indicate the increase of resistant microorganisms in poultry farms (EFSA, 2010; Piccirillo Dotto, Salata, &Giacomelli, 2013; Russo et al., 2012; Walsh & Fanning, 2008).Recently, in the North East of Italy, from the surveillance of medication protocols in poultry farms, resulted that pulsed water medication was more frequently used than the authorized continuous water medication to treat the birds in the sheds. Whendifferent dosage, treatment interval or administration route are adopted, the residue monitoring on animal carcasses becomes determinant to guarantee food safety and high through-put analytical methods are required to process large numbers of samples. Moreover, to ensure a prudent use of antimicrobial drugs in veterinary medicine, the restriction on drug usage in food producing animals cannot be sufficient and the optimal dosage regimen to minimize bacterial resistance should always be assessed for an effective treatment (AliAbadi & Lees, 2000; Martinez,McDermott, & Walzer, 2006; McKellar, Sanchez Bruni, & Jones,2004). In this context, it is very important to have a selective, sensitive and rapid method for the determination of FQ concentrations in food-producing animals. An important and fundamental step for all analytical procedures is the sample preparation, especially when complex matrix as animal tissues composed of lipids, carbohydrates, proteins, vitamins, phenolic compounds and organic acids are used. Several extraction strategies were described in the literature for FQs detection in food of animal origin: solid phase extraction (SPE)(Garcés, Zerzanová, Kucera, Barrón, & Barbosa, 2006; Hermo,Barrón, & Barbosa, 2006; Toussaint, Chedin, Bordin, & Rodriguez,2005; Verdon, Couedor, Roudaut, & Sandérs, 2005), liquid to liquid extraction (LLE) (García, Sarabia, Ortiz, & Aldama, 2005),solid-phase micro-extraction (SPME) (Huang, Lin, Yu, & Feng, 2006)and supercritical fluid extraction (SFE) (Shim, Lee, Kim, Lee, & Kim,2003), mostly laborious and time consuming techniques with poor extraction efficiency and relatively low recoveries (Huan et al.,2012).Recently, more innovative FQ extraction technique from different matrices, were applied:
44
pressurized liquid extraction(PLE) from enfant food product (Rodríguez, Navarro-Villoslada, Moreno-Bondi, & Marazuela, 2010), microwave assisted extraction(MAE) with in situ LLE clean-up from chicken breast muscle (Xuet al., 2011), accelerated solvent extraction (ASE) from muscle, liver, kidney of swine, bovine, chicken and fish (Huan et al., 2012),dispersive liquid-liquid micro-extraction (DLLME) from chicken liver (Moema, Nindi, & Dube, 2012) or fish muscle (Tsai et al., 2009)and molecularly imprinted polymers (MIP) from chicken muscle or eggs (Blasco & Picò, 2012; Qiao & Sun, 2010) and QuEChERS technology. The QuEChERS (QUick, Easy, CHeap, Effective, Rugged and Safe)extraction and clean-up approach, attracted great interest in the last few years because it allowed to reduce and simplify the time needed to complete the processes; initially applied to the analysis of pesticides (Anastassiades, Lehotay, Stajnbaher, & Schenck, 2003)was subsequently extended to veterinary drug residues extraction from different biological matrices (Lopes, Reyes, Romero-González,Frenich, & Vidal, 2012; Stubbings & Bigwood, 2009).QuEChERS technique was adopted for the extraction of FQs from milk (Karageorgou, Myridakis, Stephanou, & Samanidou, 2013;Lombardo-Agüí, Gámiz-Gracia, Cruces-Blanco, & García-Campaña,2011), eggs (Capriotti, Cavaliere, Piovesana, Samperi, & Laganà,2012; Garrido Frenich, Aguilera-Luiz Mdel, Martínez Vidal, &Romero-González, 2010), honey (Lombardo-Agüí, García-Campaña,Gámiz-Gracia, & Cruces-Blanco, 2012; Wang & Leung, 2012), chicken muscle (Lopes et al., 2012), bovine muscle and swine muscle (Nakajima et al., 2012).The objective of the study was to optimize and validate a fast, simple, sensitive, and specific LC-MS/MS/MS method suitable for the detection of a wide range of concentrations of FQs as those occurring in pharmacokinetic and residue depletion studies from several matrices. In the present study, five FQs (enrofloxacin, ENRO;ciprofloxacin, CIPRO; difloxacin, DIFLO; sarafloxacin, SARA; flumequine,FLUME) were extracted from plasma, lung, intestinal content, muscle, liver, kidney, skin þ fat from turkeys, applying one single LLE to plasma samples and QuEChERS clean-up procedure to the other matrices. For the validation purposes, all the five FQs above reported were used and the biological matrices were obtained from healthy never treated turkeys; all the incurred samples were obtained from turkeys experimentally administered with ENRO and FLUME via pulsed medicated water as reported in previous studies by Ferraresi et al. (2013) and Cagnardi et al. (2014).
45
3.3 Materials and methods
3.3.1.Animals and treatments
The study was conducted according to Italian law(D.L.116/1992)and was ethically approved by the Italian Health Ministry (Animal Welfare Unit, 2009R4KM4F_002).Thirty-two female turkeys (breed B.U.T.6) 63e79 days old, weighing about 4e6 kg and determined to be healthy by a thorough physical examination, were used. Turkeys were randomly assigned to 4 groups of 8 animals to be subjected to treatments with the FQs: groups 1 and 3 were repeatedly treated for 5 days via drinking water in a 10-h pulsed scheme administration with ENRO (Baytril oral solution 10%, BAYER, Milano, Italy) at the dose of20 mg kg-1 b.w. while groups 2 and 4 were treated for 5 days via drinking water in a 10-h pulsed scheme administration with FLUME(Flumechina 40% DOXAL) at the dose of 30 mg kg-1 b.w. (Cagnardi et al., 2014; Ferraresi et al., 2013). The doses selected were double the recommended doses of ENRO (10 mg kg-1 b.w.) and FLUME(15 mg kg-1 b.w.) in poultry. Plasma and tissue samples used as blank matrices were collected from healthy, never treated animals from an organic farm. For groups 1 (ENRO) and 2 (FLUME), blood samples were collected on days 1 and 5, immediately before the treatment, at 1, 3,6, 9 h during the 10-h treatment, and at 1, 2, 4, 8, 14 h after the withdrawal of medicated water. Plasma was separated by centrifugation at 2000 rpm for 10 min and stored at -20 °C pending analysis. Three and 5 days after the last treatment, turkeys of group1 and 2 respectively, were sacrificed and liver, kidney, muscle(breast), skin þ fat, were collected and stored at -80 °C before analysis. Animals of groups 3 and 4 were sacrificed 24 h after the last treatment and lung and intestinal content were collected and stored at -80 °C before analysis.
3.3.2.Chemical and reagents
Enrofloxacin (ENRO, purity: 99.0%), ciprofloxacin (CIPRO, purity:99.9%), difloxacin (DIFLO, purity: 99.8%), sarafloxacin (SARA, purity:97.2%) flumequine (FLUME, purity: 99.7%) and norfloxacin (internal standard, NOR, purity: 99.7%) were obtained from Sigma-Aldrich(Steinheim, Germany).Acetonitrile (ACN) and methanol (MeOH) were from Carlo Erba Reagents. Formic acid (FA, 98%), ammonium acetate (98%), potassium phosphate monobasic KH2PO4 were from Sigma-Aldrich(Steinheim, Germany). All reagents were of analytical grade. Ultrapure water generated by the Milli-Q system (Millipore) was used. SampliQ Quick Easy Cheap Effective Rugged Safe (QuEChERS) EN buffered extraction kits and SampliQ QuEChERS dispersive-SPE2 ml tube for drug residue in meat (containing 25 mg of C18 and150 mg of anhydrous MgSO4) were used for the analysis of FQs in turkey matrices (liver,
46
kidney, muscle, skin þ fat, lung, intestinal content) and were purchased by Agilent (Santa Clara, CA, USA).Phenex-RC (Regenerated Cellulose) syringe filters 0.22 µm(Phenomenex, Torrance, CA, USA) were used to filter the extracts before the injection in the LC-MS system.
3.3.3.Standards and stock solutions
Individual stock solutions of ENRO, CIPRO, DIFLO, SARA, FLUME,NOR (IS) were prepared at a concentration of 1000 µg ml-1 by dissolving the proper quantity of each compound, exactly weighted, in methanol with 10% (v/v) of NaOH into volumetric flasks. These solutions were stored at 4 °C in amber glass and prepared fresh every 6 months. Working solutions (containing all FQs except of the IS) used to spike blank samples of turkey, were prepared by appropriate dilutions of the concentrated stock standard solutions with mobile phase (10 mM ammonium acetate pH 2.5:0.1% formic acid in methanol, 80:20).From IS stock solution, different dilutions were prepared to spike matrices: IS at 3 µg ml-1 for plasma, IS at 160 µg ml-1 for kidney and liver, IS at 100 µg ml-1 for muscle, lung, skin þ fat and intestinal content.
3.3.4.Instrumentation
All analyses were performed by liquid chromatography with mass spectrometry detection (LC-MS).The chromatographic separation was achieved using an Accela600 HPLC pump with CTC automatic injector (Thermo Fischer Scientific, San Jose, CA, USA) equipped with a C-18 Kinetex (100x2.1 mm, 2.6 µm) analytical column by Phenomenex (Torrance,CA, USA).The mass detection was achieved with an LTQ XL ion trap(Thermo Fischer Scientific, San Jose, CA, USA), equipped with a heated electrospray ionization (HESI-II) probe. The system was controlled by the X-calibur software (version 2.1), that was also used for the data acquisition and analysis.
Chromatographic and mass spectrometric conditions
Gradient elution was applied using a 10 mM ammonium acetate adjusted at pH 2.5 with formic acid as solvent A and methanol with0.1% formic acid (v/v) as solvent B. The mobile phase composition(A:B, v/v) was: 80:20 at 0 min, 50:50 at 10 min, 10:90 at 13 min and kept unchanged until 14 min, 0:100 from 14.50 min to 16 min and80:20 from 17 min to 20 min to re-equilibrate the system. The sample trays were maintained at 4°C and the flow rate was set on200 µl min-1. Standard solutions at 1 µgml-1 of each FQ were infused directly via syringe pump with 20 µl min-1 flow rate to the mass spectrometer in order to find fragmentation patterns, tuning parameters and MS3 parameters for each analyte. Precursor ions, product ions, collision energies and retention times are shown in Table 1.
47
Due to the presence of the amino group in most FQs that is easily protonated in acidic medium, the ESI source was used in positive mode. The mass analyzer was set on the full scan monitoring mode. The following optimum tuning parameters were common for all FQs: sheath gas flow 40 arbitrary units, auxiliary gas flow 5 arbitrary units; ion spray voltage 3.5 kV; capillary temperature 300 °C; capillary voltage 26 V; tube lens 80 V. Retention time windows for each analyte were checked daily with a mixture of the five FQs in mobile phase. Confirmation was achieved by examination of the relative ion intensities of two majorMS3product ions.
Table 1: Instrument acquisition data for the analysis of FQs by LC-MS/MS/MS; a product ion used for quantification; Rt: retention time.
Analyte Precursor ion (m/z)
Fragmentation pattern
Collision energy (%)
Rt (min)
Enrofloxacin 360
360 > 316 316 > 288, 245a
46 23 5.6
Ciprofloxacin 332
332 > 288 288 >268a, 245
22 30 5.3
Difloxacin 400
400 > 356 356 > 336, 299a
30 20 6.2
Sarafloxacin 386
386 > 342 342 >322a, 299
30 30 6.6
Flumequine 262
262 > 244 244 >202a, 176
40 25 12.5
Norfloxacin (IS) 320
320 > 276 276 >256a, 233
36 30 4.9
3.3.5. Sample preparation
The plasma samples purification was performed as reported by Ferraresi et al. (2013) whereas QuEChERS technology, which consists of two steps, a salting-out extraction and a dispersive SPE clean-up, was adopted and used for the extraction of FQs from all turkey tissues (Núñez, Gallart-Ayala, Martins, & Lucci, 2012; Stubbings& Bigwood, 2009). Before proceeding with the extraction, IS solution (10 µl) was added to plasma samples to obtain IS at 150 µg l-1 final concentration. Turkey matrices (liver, muscle, kidney, skin + fat, lung, intestinal content) were first chopped into small pieces and homogenized;2 g of samples (1 g for intestinal content) were placed into 50 ml centrifuge tubes and added with 50 ml of the different IS solutions reported above (see Section 3.3.3.), to obtain IS final concentration at4 µg g-1 in liver and kidney and at 2.5 µg g-1in muscle, lung, skin + fat, and intestinal content, respectively. An 8 ml volume of 30 mM of KH2PO4 buffer pH 7.0 were added and the tubes were agitated for 1 min. To each tube, a 10ml volume of 5% formic acid in ACN was added and the tubes were shaken for other 1 min. Then, an Agilent SampliQ

48
QuEChERS EN extraction salt packet was added to each tube and the sample tubes were capped tightly and shaken vigorously for 3 min. After centrifugation at4000 rpm for 5 min, a 1 ml aliquot of the upper ACN layer was transferred into an Agilent SampliQ QuEChERS dispersive-SPE 2 ml tube and the samples were vortexed for 1 min and centrifuged at13,000 rpm for 5 min with a micro-centrifuge. The supernatant (700 µl) was transferred to a 15 ml tube and evaporated to dryness under a stream of air at 50C with a TurboVap evaporator (Zymarck, Hopkinton, MA, USA). The residue obtained was dissolved in 700 µl of mobile phase (10 mM ammoniumacetate pH 2.5:0.1% formic acid in methanol, 80:20), vortex, mixed, sonicated for 10 min and filtered through a Phenex-RC(Regenerated Cellulose) syringe filter 0.22 µm (Phenomenex, Torrance,CA, USA) before LC-MS/MS/MS analysis. Fluoroquinolone concentrations of all incurred and spiked sample were quantified with a daily calibration curve prepared in matrix.
3.3.6. Method validation
Prior to application to incurred samples, the method was validated according to the European Commission Decision 2002/657/EC for the residue depletion study in liver, kidney, skin + fat and muscle, and to the EMA guidelines (EMA/CVMP/VICH/463202/2009) for the pharmacokinetic and distribution study in plasma, lung and intestinal content. Blank biological matrices from different untreated turkeys were used. Aliquots of blank samples (200 µl for plasma, 2 g for liver, kidney, lung, muscle, skin + fat and 1 g for intestinal content) were transferred into a polypropylene tubes and spiked with 50 µl of IS and with proper amounts of working solutions of FQs to obtain fortified samples at different concentrations (for intestinal content, working solutions containing only ENRO, CIPRO and FLUME were used). The mixtures were shaken and then the samples were allowed to stand in the dark for 30 min at room temperature to permit the interaction between FQs and tissues before proceeding with the extraction described in Section 3.3.5 The following analytical performance parameters were assessed: specificity, linearity response, trueness, precision(within-day repeatability and within-laboratory reproducibility),limit of detection and quantification, decision limits, detection capability, matrix effect, absolute recovery and robustness. Confirmation of the identities of the FQs was carried out by comparison of the chromatographic peak area of two prominent product ions in MS3, with the calibration standard at comparable concentrations. Identification was considered reliable if the ratio was within the criteria laid down in the European Commission Decision.
49
Specificity
To verify specificity, a representative number of blank biological matrix samples of different origin (n = 10-20) were analyzed to check the absence of potential matrix interference peaks at the retention time of the target FQs.
Linearity
Method linearity was evaluated by preparing six different calibration curves on six different days by spiking each of the seven biological matrices from untreated turkeys (blank samples) with different FQ mixed standard solutions, before proceeding with the extraction. Final concentrations of FQs were different in plasma, lung and intestinal content: 2.5, 5, 10, 25, 50, 100, 200 µg l-1, 6.2,12.5, 25, 50, 125, 250, 500, 1000 µg kg-1 and 12.5, 25, 50, 100, 250,500, 1000, 2000 µg kg-1, respectively. For each FQ, a different range of concentrations in liver, kidney, muscle and skin þ fat, was adopted and final concentrations were reported in Table S1 (see Supplementary data).Calibration lines were constructed by plotting the ratio of the standard area to internal standard area versus the added concentrations and carrying out linear regression analysis. The linearity was considered acceptable when the coefficient of correlation was above 0.990 and the evaluation of residual was lower than 20%.
Limit of detection (LOD) and limit of quantification (LOQ)
For plasma, lung and intestinal content, limit of detection (LOD)and limit of quantification (LOQ) were determined as follows: LOD = 3.3 × SD/S; LOQ = 10 × SD/S, where SD is the standard deviation of y-intercepts and S is the average slope obtained from the different calibration curves prepared for each matrix (Ribani, Collins, & Bottoli, 2007). For kidney, muscle, liver and skin + fat LOD values were determined as described above, whereas LOQ for each FQ was defined as the smallest measured content of the identified analyte that can be quantified with an acceptable precision and trueness (EMA/CVMP/VICH/463202/2009) in agreement with the limits reported by European Commission Decision.
Decision limit (CCα) and detection capability (CCβ)
The Commission of the European Communities, to ensure food safety, has established MRLs legally permitted and accepted in liver, kidney, muscle, skin + fat for ENRO, CIPRO, DIFLO, FLUME (Council Regulation 2377/90/EEC). For these FQs, the decision limit (CCα)and detection capability (CCβ) were calculated. As no MRL has been set for SARA in muscle and kidney, CCα and CCβ for this FQ were calculated only for liver and skin + fat.

50
These values were determined by analyzing blank samples fortified around the permitted limit in equidistant steps (the calibration curve procedure). CCα was calculated as the mean measured concentration at the MRL of each compound plus 1.64 times the standard deviation of the within-laboratory reproducibility at this concentration; CCβwas calculated as CCα plus 1.64 times the standard deviation of the within-laboratory reproducibility at CCα (Verdon, Hurtaud-Pessel, & Sanders, 2006).
Table 2: Linearity evaluation and sensitivity data for the FQs detected in this study in the different biological matrices (plasma, liver, kidney, muscle, skin + fat, lung and intestinal content): linear determination coefficient (R2), limit of detection (LOD) and limit of quantification (LOQ).
Plasma Liver
analyte R2 LOD (g l-1) LOQ (g l-1) analyte R2 LOD (g kg-1) LOQ (g kg-1)
ENRO 0.9999 0.8 2.5 ENRO 0.9999 2.6 12.5
CIPRO 0.9998 0.5 1.4 CIPRO 0.9998 5.7 12.5
DIFLO 0.9995 1.5 4.6 DIFLO 0.9993 43.8 118.8
SARA 0.9998 0.6 1.8 SARA 0.9997 3.3 6.3
FLUME 0.9996 0.9 2.5 FLUME 0.9997 29.3 50.0
Kidney Muscle
analyte R2 LOD (g kg-1) LOQ (g kg-1) analyte R2 LOD (g kg-1) LOQ (g kg-1)
ENRO 0.9999 9.8 18.8 ENRO 0.9995 5.2 12.5
CIPRO 0.9999 4.1 18.8 CIPRO 0.9995 2.0 12.5
DIFLO 0.9999 9.7 37.5 DIFLO 0.9990 13.0 37.5
SARA 0.9998 1.7 6.3 SARA 0.9992 0.5 1.3
FLUME 0.9996 25.1 62.5 FLUME 0.9988 8.3 50.0
Skin + fat Lung
analyte R2 LOD (g kg-1) LOQ (g kg-1) analyte R2 LOD (g kg-1) LOQ (g kg-1)
ENRO 0.9942 4.8 12.5 ENRO 0.9998 2.7 8.2
CIPRO 0.9998 8.8 12.5 CIPRO 0.9996 2.9 8.9
DIFLO 0.9969 16.7 50.0 DIFLO 0.9997 2.2 6.8
SARA 0.9972 0.9 1.2 SARA 0.9998 0.9 2.7
FLUME 0.9978 22.7 31.2 FLUME 0.9997 1.8 5.4
Intestinal content
analyte R2 LOD (g kg-1) LOQ (g kg-1)
ENRO 0.9997 3.1 9.5
CIPRO 0.9997 1.1 3.4
FLUME 0.9994 4.5 13.8

51
Table 3: Validation results obtained from plasma and lung (CN: Nominal Concentration; CV=Coefficient of Variation; REC: absolute recovery; ME: matrix effect).
PLASMA
analyte CN
g l-1
TRUENESS
(%)
Within-day
Repeatability
(CV %)
Within-Laboratory
Reproducibility
(CV %)
REC% ± SD ME
ENRO 2.5 96.0 3.4 10.6 101.6 ± 5.9 1.5 ± 4.0 x 10⁻²
10 99.0 3.9 5.5 108.5 ± 6.1 0.9 ± 2.0 x 10⁻²
50 103.8 5.5 7.1 97.3 ± 2.6 0.9 ± 5.0 x 10⁻²
CIPRO 2.5 92.0 8.8 12.6 99.5 ± 7.9 1.0 ± 1.0 x 10⁻²
10 98.0 6.6 7.2 103.7 ± 14.3 1.0 ± 3.0 x 10⁻²
50 100.6 6.7 5.7 110.1 ± 11.2 0.9 ± 3.0 x 10⁻²
DIFLO 2.5 96.0 2.2 10.3 105.6 ± 10.9 1.2 ± 5.0 x 10⁻²
10 101.0 10.5 9.8 101.7 ± 11.0 0.9 ± 3.0 x 10⁻²
50 103.4 2.9 10.1 102.9 ± 10.9 0.9 ± 2.0 x 10⁻²
SARA 2.5 100.0 8.7 8.0 101.0 ± 9.2 1.0 ± 1.0 x 10⁻²
10 99.0 7.1 7.2 102.0 ± 5.6 0.9 ± 6.0 x 10⁻²
50 96.6 3.6 5.3 99.0 ± 10.0 0.9 ± 5.0 x 10⁻²
FLUME 2.5 104.0 4.7 12.2 112.8 ± 1.9 1.2 ± 5.0 x 10⁻²
10 104.0 2.7 5.9 105.6 ± 14.4 0.9 ± 2.0 x 10⁻²
50 96.8 3.0 6.2 112.2 ± 10.9 0.9 ± 3.0 x 10⁻²
LUNG
analyte CN
g kg-1
TRUENESS
(%)
Within-day
Repeatability
(CV %)
Within-Laboratory
Reproducibility
(CV %)
REC% ± SD ME
ENRO 12.5 96.8 7.9 12.9 95.2 ± 10.5 1.3 ± 9.0 x 10⁻²
50 100.4 4.4 7.1 87.9 ± 5.2 1.0 ± 1.2 x 10⁻¹
500 96.2 7.9 5.6 87.4 ± 6.6 1.3 ± 5.0 x 10⁻²
CIPRO 12.5 94.4 2.7 10.2 70.6 ± 5.4 1.3 ± 2.1 x 10⁻¹
50 97.6 5.6 5.5 69.1 ± 3.7 1.1 ± 1.5 x 10⁻¹
500 98.2 2.6 3.4 77.9 ± 11.8 1.4 ± 7.0 x 10⁻²
DIFLO 12.5 103.2 4.7 13.1 102.4 ± 9.5 1.3 ± 5.0 x 10⁻²
50 104.2 5.1 5.5 88.8 ± 6.6 1.0 ± 1.0 x 10⁻¹
500 95.8 3.6 5.2 95.7 ± 10.5 1.1 ± 6.0 x 10⁻²
SARA 12.5 93.6 5.9 6.6 92.3 ± 5.8 1.2 ± 3.0 x 10⁻²
50 99.4 3.9 7.3 86.6 ± 6.2 1.1 ± 1.3 x 10⁻¹
500 99.5 4.5 4.9 91.4 ± 9.4 1.1 ± 5.0 x 10⁻²
FLUME 12.5 104.8 6.3 9.7 89.4 ± 9.0 1.1 ± 6.0 x 10⁻²
50 101.6 8.5 11.2 78.9 ± 6.2 1.0 ± 1.3 x 10⁻²
500 96.5 5.1 6.0 89.8 ± 8.9 1.0 ± 3.0 x 10⁻²
Precision and trueness
Precision and trueness of the method were determined by performing tests on three sets of blank samples fortified with FQs at three different concentrations (six replicates each): for plasma, lung and intestinal content, the levels considered were 2.5, 10,50 µg l-1, 12.5, 50, 500 µg kg-1and 25, 100, 1000 µg kg-1 respectively. The matrices liver, kidney, muscle and skin + fat, for which an MRL has been set (see Table S2, Supplementary data), were fortified with FQ concentrations at 0.5, 1, 1.5 times each respective MRLs. Blank samples of muscle and kidney were fortified with SARA at 5, 10, 15 µg kg-1and 50, 100, 150 µg kg-1respectively.
For each matrix, samples were analyzed on three different days in the same laboratory, with the same instrument but by three different operators,
52
corresponding to a total number of 54 samples. The precision of the method has been calculated either in terms of within-day repeatability, the variability of independent test results obtained on the same day, with the same method on identical test items in the same laboratory by the same operator using the same equipment, or in terms of within-laboratory reproducibility, the variability of independent test results obtained by different operators in different times as unique difference from above (Karageorgouet al., 2013; Muscarella, Lo Magro, Palermo, & Centonze, 2007). For the matrix intestinal content, due to the limited availability of blank material, only within-day repeatability was evaluated. Precision was expressed in terms of imprecision and calculated as the variation coefficient (CV %) of measured concentrations at each level: CV % = (standard deviation/mean measured concentration) × 100. The CV % values for repeatability are acceptable if they are below two third of the value calculated from the Horwitz equation, whereas for reproducibility, they are acceptable if they are below the values calculated from the Horwitz equation (23% if concentration is between 100 and 1000 µg kg-1and 16% if the concentrations are higher than 1000 µg kg-1). The Horwitz equation is not applicable to concentrations below120 µg kg-1, and the values of repeatability and within-laboratory reproducibility are considered acceptable if they are below 14.7%and 22% respectively, as suggested by Thompson (2000). The trueness, as no certified reference materials for FQs in the turkey tissues are available, was evaluated by the recovery of the known amount of FQs added to the blank matrices. It was calculated by dividing the mean measured value by the fortification level and multiply by 100 to express the result as a percentage. According to 2002/657/EC, the trueness should be between 70 and 100% for fortification levels between 1.0 and 10.0 µg kg-1, and between 80and 110% for fortification levels ≥ 10.0 µg kg-1.
Absolute recovery and matrix effect
The absolute recovery of all analytes from all biological matrices was determined by comparing the analytical results of extracted FQs from fortified samples (FQs and IS were added before the extraction procedure) with unextracted standards added at the same concentrations in blank extracts representing100% recovery. Matrix effects were evaluated by calculating the peak area of the analytes in the presence of matrix (analytes added to blank matrix after extraction), to the peak area in absence of matrix (pure solution of the analyte at the same concentration). Absolute recovery and matrix effect for each analyte were evaluated at three different levels (the same concentrations considered for the evaluation of precision and trueness), depending on the target biological matrix and FQ (n= 6). Three sets of samples were used for determination, one consisting of neat
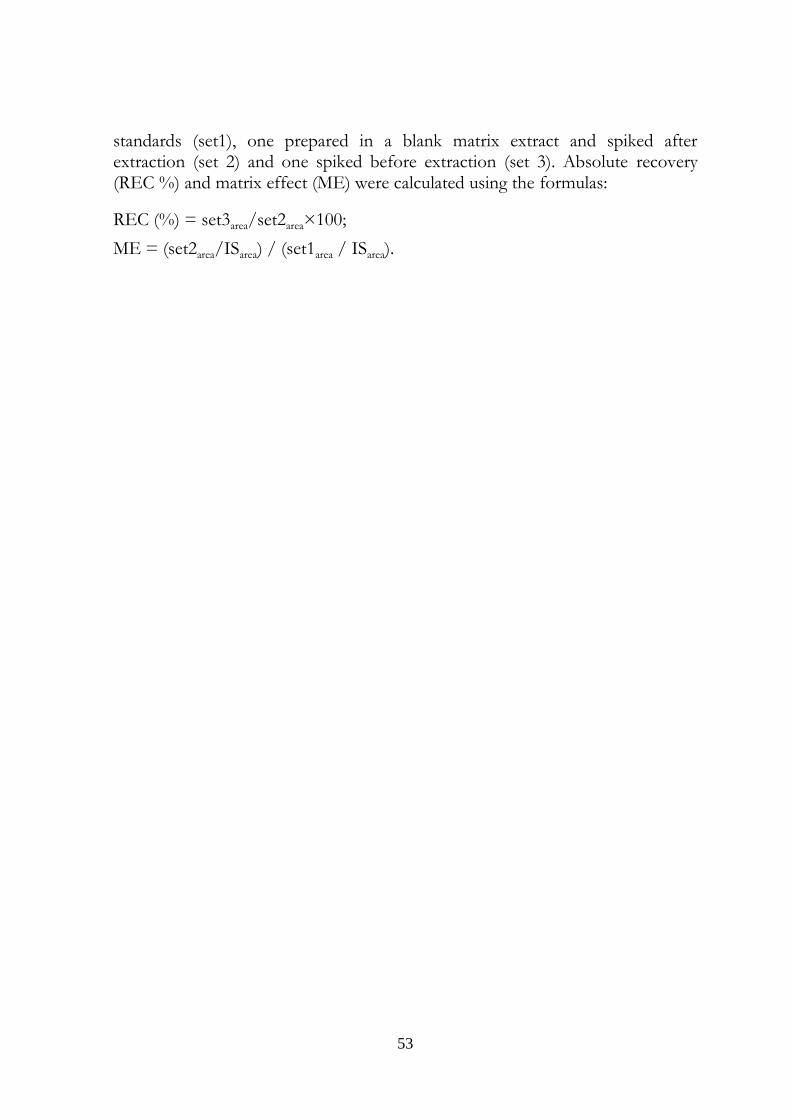
53
standards (set1), one prepared in a blank matrix extract and spiked after extraction (set 2) and one spiked before extraction (set 3). Absolute recovery (REC %) and matrix effect (ME) were calculated using the formulas:
REC (%) = set3area/set2area×100;
ME = (set2area/ISarea) / (set1area / ISarea).
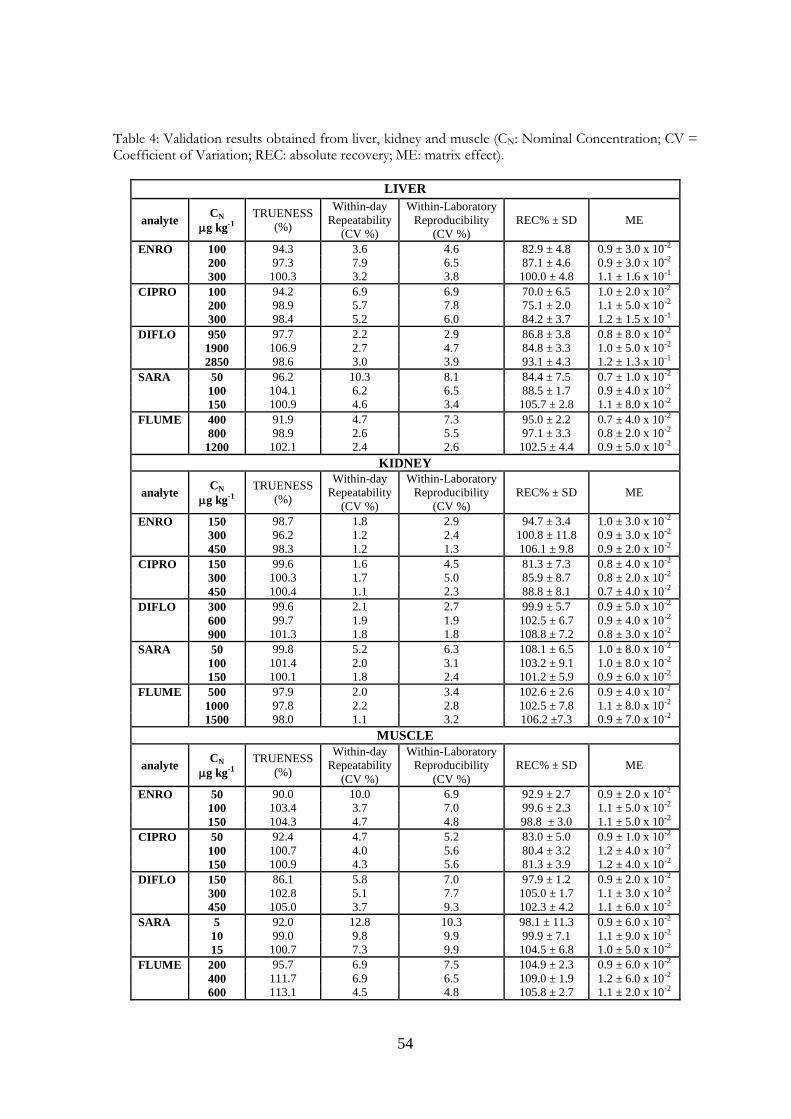
54
Table 4: Validation results obtained from liver, kidney and muscle (CN: Nominal Concentration; CV = Coefficient of Variation; REC: absolute recovery; ME: matrix effect).
LIVER
analyte CN
g kg-1
TRUENESS
(%)
Within-day
Repeatability
(CV %)
Within-Laboratory
Reproducibility
(CV %)
REC% ± SD ME
ENRO 100 94.3 3.6 4.6 82.9 ± 4.8 0.9 ± 3.0 x 10⁻²
200 97.3 7.9 6.5 87.1 ± 4.6 0.9 ± 3.0 x 10⁻²
300 100.3 3.2 3.8 100.0 ± 4.8 1.1 ± 1.6 x 10⁻¹
CIPRO 100 94.2 6.9 6.9 70.0 ± 6.5 1.0 ± 2.0 x 10⁻²
200 98.9 5.7 7.8 75.1 ± 2.0 1.1 ± 5.0 x 10⁻²
300 98.4 5.2 6.0 84.2 ± 3.7 1.2 ± 1.5 x 10⁻¹
DIFLO 950 97.7 2.2 2.9 86.8 ± 3.8 0.8 ± 8.0 x 10⁻²
1900 106.9 2.7 4.7 84.8 ± 3.3 1.0 ± 5.0 x 10⁻²
2850 98.6 3.0 3.9 93.1 ± 4.3 1.2 ± 1.3 x 10⁻¹
SARA 50 96.2 10.3 8.1 84.4 ± 7.5 0.7 ± 1.0 x 10⁻²
100 104.1 6.2 6.5 88.5 ± 1.7 0.9 ± 4.0 x 10⁻²
150 100.9 4.6 3.4 105.7 ± 2.8 1.1 ± 8.0 x 10⁻²
FLUME 400 91.9 4.7 7.3 95.0 ± 2.2 0.7 ± 4.0 x 10⁻²
800 98.9 2.6 5.5 97.1 ± 3.3 0.8 ± 2.0 x 10⁻²
1200 102.1 2.4 2.6 102.5 ± 4.4 0.9 ± 5.0 x 10⁻²
KIDNEY
analyte CN
g kg-1
TRUENESS
(%)
Within-day
Repeatability
(CV %)
Within-Laboratory
Reproducibility
(CV %)
REC% ± SD ME
ENRO 150 98.7 1.8 2.9 94.7 ± 3.4 1.0 ± 3.0 x 10⁻²
300 96.2 1.2 2.4 100.8 ± 11.8 0.9 ± 3.0 x 10⁻²
450 98.3 1.2 1.3 106.1 ± 9.8 0.9 ± 2.0 x 10⁻²
CIPRO 150 99.6 1.6 4.5 81.3 ± 7.3 0.8 ± 4.0 x 10⁻²
300 100.3 1.7 5.0 85.9 ± 8.7 0.8 ± 2.0 x 10⁻²
450 100.4 1.1 2.3 88.8 ± 8.1 0.7 ± 4.0 x 10⁻²
DIFLO 300 99.6 2.1 2.7 99.9 ± 5.7 0.9 ± 5.0 x 10⁻²
600 99.7 1.9 1.9 102.5 ± 6.7 0.9 ± 4.0 x 10⁻²
900 101.3 1.8 1.8 108.8 ± 7.2 0.8 ± 3.0 x 10⁻²
SARA 50 99.8 5.2 6.3 108.1 ± 6.5 1.0 ± 8.0 x 10⁻²
100 101.4 2.0 3.1 103.2 ± 9.1 1.0 ± 8.0 x 10⁻²
150 100.1 1.8 2.4 101.2 ± 5.9 0.9 ± 6.0 x 10⁻²
FLUME 500 97.9 2.0 3.4 102.6 ± 2.6 0.9 ± 4.0 x 10⁻²
1000 97.8 2.2 2.8 102.5 ± 7.8 1.1 ± 8.0 x 10⁻²
1500 98.0 1.1 3.2 106.2 ±7.3 0.9 ± 7.0 x 10⁻²
MUSCLE
analyte CN
g kg-1
TRUENESS
(%)
Within-day
Repeatability
(CV %)
Within-Laboratory
Reproducibility
(CV %)
REC% ± SD ME
ENRO 50 90.0 10.0 6.9 92.9 ± 2.7 0.9 ± 2.0 x 10⁻²
100 103.4 3.7 7.0 99.6 ± 2.3 1.1 ± 5.0 x 10⁻²
150 104.3 4.7 4.8 98.8 ± 3.0 1.1 ± 5.0 x 10⁻²
CIPRO 50 92.4 4.7 5.2 83.0 ± 5.0 0.9 ± 1.0 x 10⁻²
100 100.7 4.0 5.6 80.4 ± 3.2 1.2 ± 4.0 x 10⁻²
150 100.9 4.3 5.6 81.3 ± 3.9 1.2 ± 4.0 x 10⁻²
DIFLO 150 86.1 5.8 7.0 97.9 ± 1.2 0.9 ± 2.0 x 10⁻²
300 102.8 5.1 7.7 105.0 ± 1.7 1.1 ± 3.0 x 10⁻²
450 105.0 3.7 9.3 102.3 ± 4.2 1.1 ± 6.0 x 10⁻²
SARA 5 92.0 12.8 10.3 98.1 ± 11.3 0.9 ± 6.0 x 10⁻²
10 99.0 9.8 9.9 99.9 ± 7.1 1.1 ± 9.0 x 10⁻²
15 100.7 7.3 9.9 104.5 ± 6.8 1.0 ± 5.0 x 10⁻²
FLUME 200 95.7 6.9 7.5 104.9 ± 2.3 0.9 ± 6.0 x 10⁻²
400 111.7 6.9 6.5 109.0 ± 1.9 1.2 ± 6.0 x 10⁻²
600 113.1 4.5 4.8 105.8 ± 2.7 1.1 ± 2.0 x 10⁻²

55
Robustness
The robustness of the method was assessed according to the Youden and Steiner approach (Youden & Steiner, 1975). For this purpose, seven reasonable variables were chosen in the sample preparation procedure (volume and pH of dilution buffer; shaking, centrifugation and sonication time; formic acid percentage in acetonitrile and evaporation temperature of the final extract) and slightly modified with respect to the standard procedure. For each factor two different conditions were adopted. Eight experiments were carried out for the evaluation of the seven selected factors by using eight spiked turkey liver samples at the MRL. The effect of each factor was calculated by subtracting the mean result obtained with the variable at high level and the mean result achieved with the factor at low level. The standard deviation of the differences has been calculated and compared with the values obtained under within-laboratory reproducibility conditions.
3.4 Results and discussion
3.4.1. Method validation
The specificity was assessed by comparing the chromatograms of blank samples with those of the corresponding spiked samples to test for endogenous interference; no significant endogenous interferent peaks were evident at the retention time of the five FQs. The linearity of the calibrations curves in matrix was checked at 6different days after calculating slopes and intercepts of each individual curve. Good linearity was observed within the concentrations range for all FQs in all matrices since the calculated determination coefficients R2 was always >0.99 (Table 2) and residual in the range10-20%. The slopes of the different calibration curves did not vary considerably and the intercepts were near to theoretical zero value, demonstrating good constancy of the measuring system.
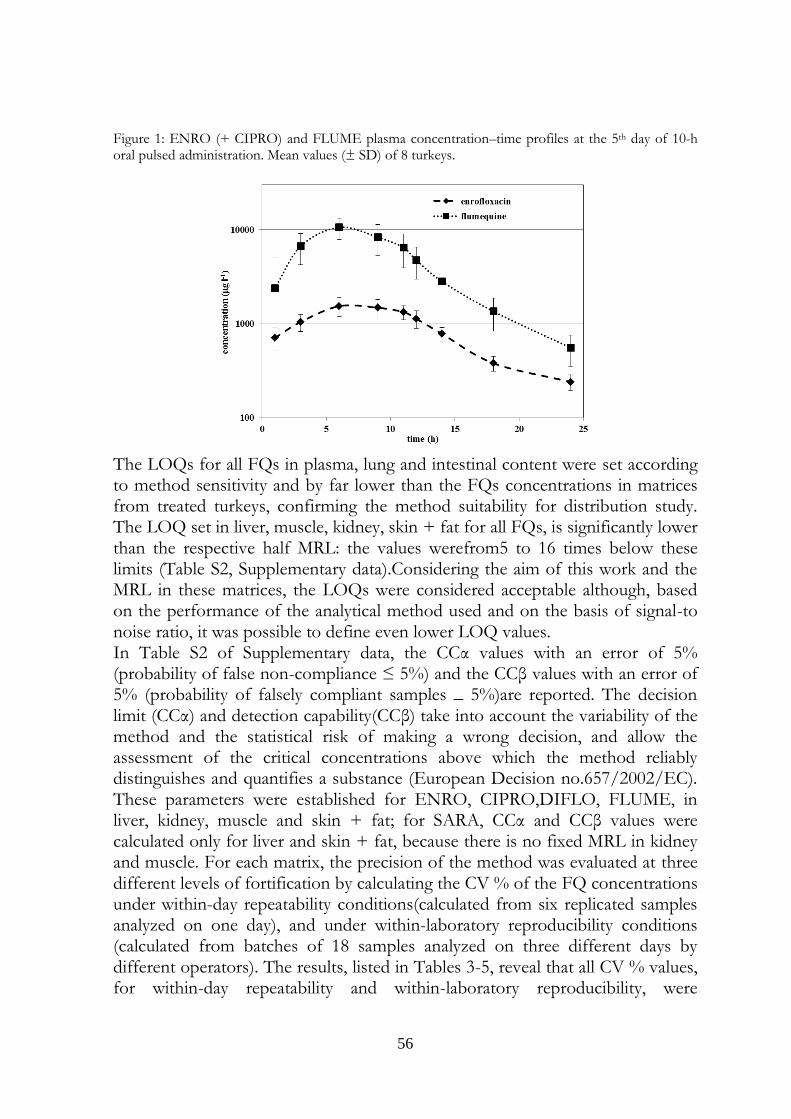
56
Figure 1: ENRO (+ CIPRO) and FLUME plasma concentration–time profiles at the 5th day of 10-h oral pulsed administration. Mean values (± SD) of 8 turkeys.
The LOQs for all FQs in plasma, lung and intestinal content were set according to method sensitivity and by far lower than the FQs concentrations in matrices from treated turkeys, confirming the method suitability for distribution study. The LOQ set in liver, muscle, kidney, skin + fat for all FQs, is significantly lower than the respective half MRL: the values werefrom5 to 16 times below these limits (Table S2, Supplementary data).Considering the aim of this work and the MRL in these matrices, the LOQs were considered acceptable although, based on the performance of the analytical method used and on the basis of signal-to noise ratio, it was possible to define even lower LOQ values. In Table S2 of Supplementary data, the CCα values with an error of 5% (probability of false non-compliance ≤ 5%) and the CCβ values with an error of 5% (probability of falsely compliant samples _ 5%)are reported. The decision limit (CCα) and detection capability(CCβ) take into account the variability of the method and the statistical risk of making a wrong decision, and allow the assessment of the critical concentrations above which the method reliably distinguishes and quantifies a substance (European Decision no.657/2002/EC). These parameters were established for ENRO, CIPRO,DIFLO, FLUME, in liver, kidney, muscle and skin + fat; for SARA, CCα and CCβ values were calculated only for liver and skin + fat, because there is no fixed MRL in kidney and muscle. For each matrix, the precision of the method was evaluated at three different levels of fortification by calculating the CV % of the FQ concentrations under within-day repeatability conditions(calculated from six replicated samples analyzed on one day), and under within-laboratory reproducibility conditions (calculated from batches of 18 samples analyzed on three different days by different operators). The results, listed in Tables 3-5, reveal that all CV % values, for within-day repeatability and within-laboratory reproducibility, were
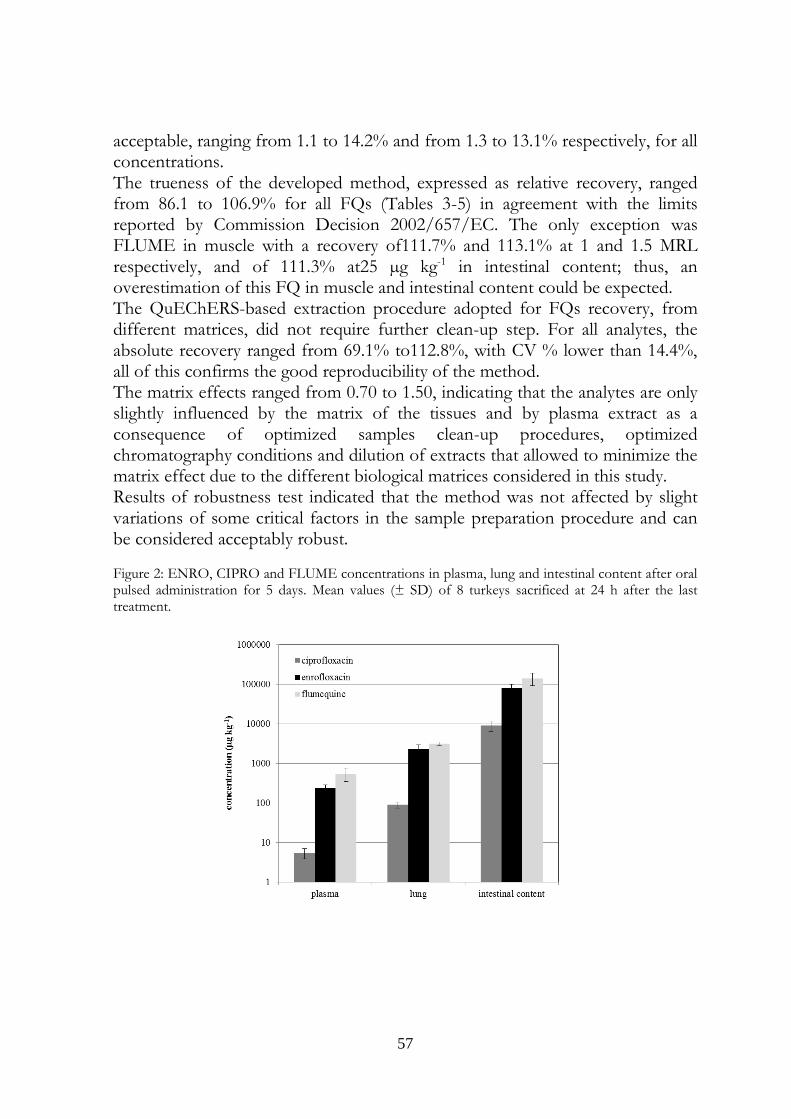
57
acceptable, ranging from 1.1 to 14.2% and from 1.3 to 13.1% respectively, for all concentrations. The trueness of the developed method, expressed as relative recovery, ranged from 86.1 to 106.9% for all FQs (Tables 3-5) in agreement with the limits reported by Commission Decision 2002/657/EC. The only exception was FLUME in muscle with a recovery of111.7% and 113.1% at 1 and 1.5 MRL respectively, and of 111.3% at25 µg kg-1 in intestinal content; thus, an overestimation of this FQ in muscle and intestinal content could be expected.
The QuEChERS-based extraction procedure adopted for FQs recovery, from different matrices, did not require further clean-up step. For all analytes, the absolute recovery ranged from 69.1% to112.8%, with CV % lower than 14.4%, all of this confirms the good reproducibility of the method. The matrix effects ranged from 0.70 to 1.50, indicating that the analytes are only slightly influenced by the matrix of the tissues and by plasma extract as a consequence of optimized samples clean-up procedures, optimized chromatography conditions and dilution of extracts that allowed to minimize the matrix effect due to the different biological matrices considered in this study. Results of robustness test indicated that the method was not affected by slight variations of some critical factors in the sample preparation procedure and can be considered acceptably robust.
Figure 2: ENRO, CIPRO and FLUME concentrations in plasma, lung and intestinal content after oral pulsed administration for 5 days. Mean values (± SD) of 8 turkeys sacrificed at 24 h after the last treatment.
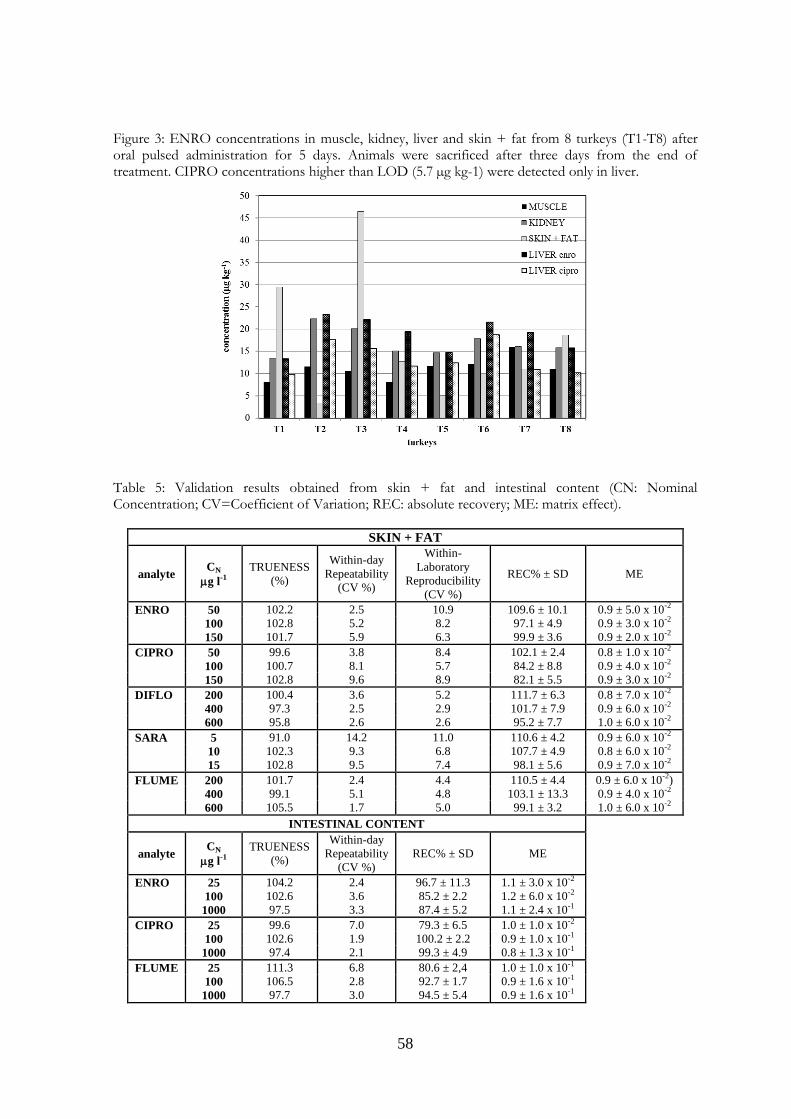
58
Figure 3: ENRO concentrations in muscle, kidney, liver and skin + fat from 8 turkeys (T1-T8) after oral pulsed administration for 5 days. Animals were sacrificed after three days from the end of treatment. CIPRO concentrations higher than LOD (5.7 µg kg-1) were detected only in liver.
Table 5: Validation results obtained from skin + fat and intestinal content (CN: Nominal Concentration; CV=Coefficient of Variation; REC: absolute recovery; ME: matrix effect).
SKIN + FAT
analyte CN
g l-1
TRUENESS
(%)
Within-day
Repeatability
(CV %)
Within-
Laboratory
Reproducibility
(CV %)
REC% ± SD ME
ENRO 50 102.2 2.5 10.9 109.6 ± 10.1 0.9 ± 5.0 x 10⁻²
100 102.8 5.2 8.2 97.1 ± 4.9 0.9 ± 3.0 x 10⁻²
150 101.7 5.9 6.3 99.9 ± 3.6 0.9 ± 2.0 x 10⁻²
CIPRO 50 99.6 3.8 8.4 102.1 ± 2.4 0.8 ± 1.0 x 10⁻²
100 100.7 8.1 5.7 84.2 ± 8.8 0.9 ± 4.0 x 10⁻²
150 102.8 9.6 8.9 82.1 ± 5.5 0.9 ± 3.0 x 10⁻²
DIFLO 200 100.4 3.6 5.2 111.7 ± 6.3 0.8 ± 7.0 x 10⁻²
400 97.3 2.5 2.9 101.7 ± 7.9 0.9 ± 6.0 x 10⁻²
600 95.8 2.6 2.6 95.2 ± 7.7 1.0 ± 6.0 x 10⁻²
SARA 5 91.0 14.2 11.0 110.6 ± 4.2 0.9 ± 6.0 x 10⁻²
10 102.3 9.3 6.8 107.7 ± 4.9 0.8 ± 6.0 x 10⁻²
15 102.8 9.5 7.4 98.1 ± 5.6 0.9 ± 7.0 x 10⁻²
FLUME 200 101.7 2.4 4.4 110.5 ± 4.4 0.9 ± 6.0 x 10⁻²
)
400 99.1 5.1 4.8 103.1 ± 13.3 0.9 ± 4.0 x 10⁻²
600 105.5 1.7 5.0 99.1 ± 3.2 1.0 ± 6.0 x 10⁻²
INTESTINAL CONTENT
analyte CN
g l-1
TRUENESS
(%)
Within-day
Repeatability
(CV %)
REC% ± SD ME
ENRO 25 104.2 2.4 96.7 ± 11.3 1.1 ± 3.0 x 10⁻²
100 102.6 3.6 85.2 ± 2.2 1.2 ± 6.0 x 10⁻²
1000 97.5 3.3 87.4 ± 5.2 1.1 ± 2.4 x 10⁻¹
CIPRO 25 99.6 7.0 79.3 ± 6.5 1.0 ± 1.0 x 10⁻²
100 102.6 1.9 100.2 ± 2.2 0.9 ± 1.0 x 10⁻¹
1000 97.4 2.1 99.3 ± 4.9 0.8 ± 1.3 x 10⁻¹
FLUME 25 111.3 6.8 80.6 ± 2,4 1.0 ± 1.0 x 10⁻¹
100 106.5 2.8 92.7 ± 1.7 0.9 ± 1.6 x 10⁻¹
1000 97.7 3.0 94.5 ± 5.4 0.9 ± 1.6 x 10⁻¹
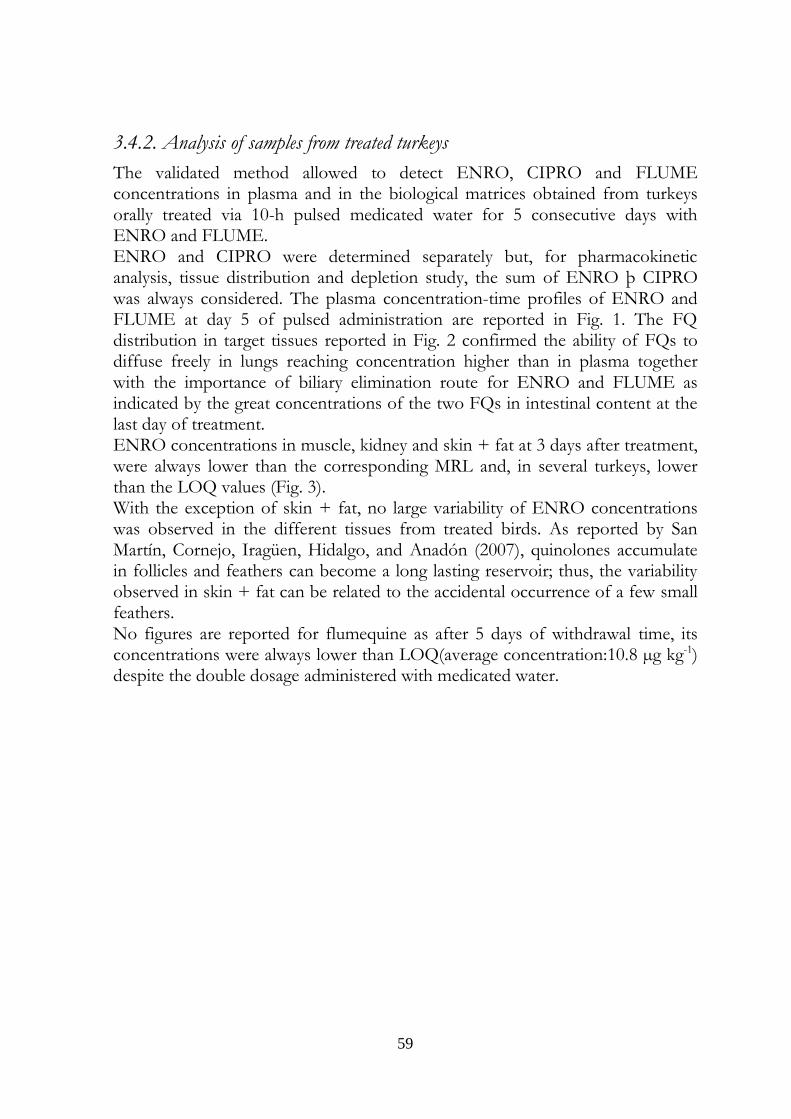
59
3.4.2. Analysis of samples from treated turkeys
The validated method allowed to detect ENRO, CIPRO and FLUME concentrations in plasma and in the biological matrices obtained from turkeys orally treated via 10-h pulsed medicated water for 5 consecutive days with ENRO and FLUME. ENRO and CIPRO were determined separately but, for pharmacokinetic analysis, tissue distribution and depletion study, the sum of ENRO þ CIPRO was always considered. The plasma concentration-time profiles of ENRO and FLUME at day 5 of pulsed administration are reported in Fig. 1. The FQ distribution in target tissues reported in Fig. 2 confirmed the ability of FQs to diffuse freely in lungs reaching concentration higher than in plasma together with the importance of biliary elimination route for ENRO and FLUME as indicated by the great concentrations of the two FQs in intestinal content at the last day of treatment. ENRO concentrations in muscle, kidney and skin + fat at 3 days after treatment, were always lower than the corresponding MRL and, in several turkeys, lower than the LOQ values (Fig. 3). With the exception of skin + fat, no large variability of ENRO concentrations was observed in the different tissues from treated birds. As reported by San Martín, Cornejo, Iragüen, Hidalgo, and Anadón (2007), quinolones accumulate in follicles and feathers can become a long lasting reservoir; thus, the variability observed in skin + fat can be related to the accidental occurrence of a few small feathers. No figures are reported for flumequine as after 5 days of withdrawal time, its concentrations were always lower than LOQ(average concentration:10.8 µg kg-1) despite the double dosage administered with medicated water.
60
3.5. Conclusions
An LC-MS/MS/MS method was developed and validated for rapid and simultaneous determination of the five FQs ENRO, CIPRO,DIFLO, SARA and FLUME in incurred plasma, liver, kidney, muscle, skin + fat, lung and intestinal content from treated turkeys. For the first time, the QuEChERS technology was successfully applied for the extraction of FQs from matrices such as the lung, skin + fat, kidney and intestinal content. The method proved to be simple, fast, efficient, stable, precise, accurate and robust, providing good validation parameters, such as linearity, limits of quantification, precision, trueness and recovery in all the matrices considered. The applicability of the method and its good performances were confirmed in all the different approach of the study, plasma kinetics, target tissue distribution and residue depletion in liver, kidney, muscle, skin + fat, thus making an effective and reliable determination of the target FQs in real samples.
3.6 Acknowledgments
The study was supported by MIUR PRIN 2009 R4KM4F grant to CM.
3.7 Appendix A. Supplementary data
Supplementary data related to this article are placed after references
61
3.8 References
AliAbadi, F. S., & Lees, P. (2000). Antibiotic treatment for animals: effect on bacterial population and dosage regimen optimization. International Journal of Antimicrobial Agents, 14(4), 307-313.
Anastassiades, M., Lehotay, S. J., Stajnbaher, D., & Schenck, F.J. (2003). Fast and easy multiresidue method employing acetonitrile extraction/partitioning and "dispersive solid-phase extraction" for the determination of pesticide residues in produce. Journal of AOAC International, 86(2), 412-431.
Barnes, H. J., Nolan, L.K., & Vaillancourt, J. P. (2008). Colibacillosis. In: Saif, Y.M. (12th ed.), Diseases of Poultry (pp. 691-738). Ames, USA: Blackwell Publishing.
Blasco, C., & Picò, Y. (2012). Development of an improved method for trace analysis of quinolones in eggs of laying hens and wildlife species using molecularly imprinted polymers, Journal of agricultural and food chemistry, 60, 11005-11014.
Cagnardi, P., Ferraresi, C., Lucatello, L., Meucci, V., Intorre, L., Grilli, G., Piccirillo, A., Giacomelli, M., & Montesissa, C. (2014). Enrofloxacin against E. coli in turkeys: which treatment scheme is effective?. Poultry Science, accepted.
Capriotti, A.L., Cavaliere, C., Piovesana, S., Samperi, R., & Laganà, A. (2012). Multiclass screening method based on solvent extraction and liquid chromatography-tandem mass spectrometry for the determination of antimicrobials and mycotoxins in egg. Journal of Chromatography A, 1268, 84-90.
Council Regulation (2377/90/EEC) of 26 June 1990 laying down a Community procedure for the establishment of maximum residue limits of veterinary medicinal products in foodstuffs of animal origin. Official Journal of European Union, L224.
European Commission (2002). Commission decision 2002/657/EC of 12 August 2002: implementing council directive 96/23/EC concerning the performance of analytical methods and the interpretation of results. Official Journal of European Communities, L 221/8, 8-36.
European Food Safety Authority (2010). The Community Summary Report on antimicrobial resistance in zoonotic and indicator bacteria from animals and food in the European Union in 2004–2007. EFSA Journal 8, 1309.
European Medicines Agency (2006). Reflection paper on the use of fluoroquinolones in food-producing animals in the European union: development of resistance and impact on human and animal health. EMEA/CVMP/SAGAM/184651/2005.
European Medicines Agency (2011). VICH GL49: Studies to evaluate the metabolism and residue kinetics of veterinary drugs in food-producing animals: validation of analytical methods used in residue depletion studies. EMA/CVMP/VICH/463202/2009.
FDA 2005 U.S. Food and Drug Administration. Withdrawal of approval of the new animal drug application for enrofloxacin in poultry; Docket No .2000N-1571. www.fda.gov/AnimalVeterinary/SafetyHealth/RecallsWithdrawals/ucm042004.htm.(accessed 18.04.13).
62
Ferraresi, C., Lucatello, L., Meucci, V., Intorre, L., Grilli, G., Piccirillo, A., Russo, E., Villa, R., Montesissa, C., & Cagnardi, P. (2013). Pharmacokinetic/pharmacodynamic evaluation of the efficacy of flumequine in treating colibacillosis in turkeys. Poultry Science, 92, 3158-3165.
Garcés, A., Zerzanová, A., Kucera, R., Barrón, D., & Barbosa, J. (2006). Determination of a series of quinolones in pig plasma using solid-phase extraction and liquid chromatography coupled with mass spectrometric detection Application to pharmacokinetic studies. Journal of Chromatography A, 1137(1),22-29.
García, I., Sarabia, L., Ortiz, M. C., &Aldama, J. M. (2005). Usefulness of D-optimal designs and multicriteria optimization in laborious analytical procedures. Application to the extraction of quinolones from eggs. Journal of Chromatography A, 1085, 190.
Garrido Frenich, A., Aguilera-Luiz Mdel, M., Martínez Vidal, J. L., & Romero-González, R. (2010). Comparison of several extraction techniques for multiclass analysis of veterinary drugs in eggs using ultra-high pressure liquid chromatography-tandem mass spectrometry. Analytica Chimica Acta, 661(2), 150-60.
Hermo, M. P., Barrón, D., & Barbosa, J. (2006). Development of analytical methods for multiresidue determination of quinolones in pig muscle samples by liquid chromatography with ultraviolet detection, liquid chromatography-mass spectrometry and liquid chromatography-tandem mass spectrometry. Journal of Chromatography A, 1104(1-2),132-139.
Huan, Y., Yanfei, T., Dongmei, C., Yuanhu, P., Zhenli, L., Yulian, W., Lingli, H., Menghong, D., Dapeng, P., Xu, W., & Zonghui, Y. (2012). Simultaneous determination of fluoroquinolones in foods of animal origin by a high performance liquid chromatography and a liquid chromatography tandem mass spectrometry with accelerated solvent extraction. Journal of Chromatography B, 885 -886, 150-159.
Huang, J. F., Lin, B., Yu, Q. W., & Feng, Y. Q. (2006). Determination of fluoroquinolones in eggs using in-tube solid-phase microextraction coupled to high-performance liquid chromatography. Analytical and Bioanalytical Chemistry, 384, 1228.
Karageorgou, E., Myridakis, A., Stephanou, E.G., & Samanidou, V. (2013). Multiresidue LC-MS/MS analysis of cephalosporins and quinolones in milk following ultrasound-assisted matrix solid-phase dispersive extraction combined with the quick, easy, cheap, effective, rugged, and safe methodology. Journal of Separation Science, 36, 2020-2027.
Lombardo-Agüí, M., Gámiz-Gracia, L., Cruces-Blanco, C., & García-Campaña, A. M. (2011). Comparison of different sample treatments for the analysis of quinolones in milk by capillary-liquid chromatography with laser induced fluorescence detection. Journal of Chromatography A, 1218, 4966-4971.
Lombardo-Agüí, M., García-Campaña, A. M., Gámiz-Gracia, L., & Cruces-Blanco, C. (2012). Determination of quinolones of veterinary use in bee products by ultra-high performance liquid chromatography-tandem mass spectrometry using a QuEChERS extraction procedure. Talanta, 93, 193-199.
Lopes, R. P., Reyes, R. C., Romero-González, R., Frenich, A. G., & Vidal, J. L. (2012). Development and validation of a multiclass method for the determination of veterinary drug residues in chicken by ultra-high performance liquid chromatography-tandem mass spectrometry. Talanta, 30, 201-208.

63
Martinez, M., McDermott, P., & Walzer, R. (2006). Pharmacology of the fluoroquinolones: a perspective for the use in domestic animals. Veterinary Journal, 172, 10–28.
McKellar, Q.A., Sanchez Bruni, S.F., & Jones, D.G.(2004). Pharmacokinetic/pharmacodynamic relationships of antimicrobial drugs used in veterinary medicine. Journal of Veterinary Pharmacology and Therapeutics, 27, 503-514.
Moema, D., Nindi, M. M., & Dube, S. (2012). Development of a dispersive liquid-liquid microextraction method for the determination of fluoroquinolones in chicken liver by high performance liquid chromatography, Analytica Chimica Acta, 730, 80-86.
Muscarella, M., Lo Magro, S., Palermo, C., & Centonze, D. (2007). Validation according to European Commission Decision 2002/657/EC of confirmatory method for aflatoxin M1 in milk based on immunoaffinity columns and high performance liquid chromatography with fluorescence detection. Analytica Chimica Acta, 594, 257-264.
Nakajima, T., Nagano, C., Sasamoto, T., Hayashi, H., Kanda, M., Kanai, S., Takeba, K., Matsushima, Y., & Takano, I. (2012). Development and validation of rapid analysis method for multi-class veterinary drugs in livestock products by LC-MS/MS. Food Hygiene and Safety Science, 53(5), 243-253.
Núñez, O., Gallart-Ayala, H., Martins, C. P., & Lucci, P. (2012). New trends in fast liquid chromatography for food and environmental analysis. Journal of Chromatography A, 1228, 298-323.
Piccirillo, A., Dotto, G., Salata, C., & Giacomelli, M. (2013). Absence of class 1 and class 2 integrons among Campylobacter jejuni and Campylobacter coli isolated from poultry in Italy. Journal of Antimicrobial Chemotherapy, 68(11), 2683-2685.
Qiao, F., & Sun, H. (2010). Simultaneous extraction of enrofloxacin and ciprofloxacin from chicken tissue by molecularly imprinted matrix solid-phase dispersion. Journal of Pharmaceutical and Biomedical Analysis, 53, 795-798.
Ribani, M., Collins, C. H., & Bottoli, C. B. G. (2007). Validation of Chromatographic Methods: Evaluation of Detection and Quantification Limits in the Determination of Impurities in Omeprazole. Journal of Chromatography A, 1156, 201–205. Riviere J. E., Papich M. G. (2009). Veterinary Pharmacology & Therapeutics. (IXa ed.), Ames, U.S.A: Iowa State University Press.
Rodríguez, E., Navarro-Villoslada, F., Moreno-Bondi, M.C., & Marazuela, M.D. (2010). Optimization of a pressurized liquid extraction method by experimental design methodologies for the determination of fluoroquinolone residues in infant foods by liquid chromatography. Journal of Chromatography A, 1217, 605–613.
Russo, E., Lucatello, L., Giovanardi, D., Cagnardi, P., Ortali, G., Di Leva, V., & Montesissa, C. (2012). Approved medication of water with enrofloxacin to treat turkey colibacillosis: assessment of efficacy using a PK/PD approach. Veterinary Microbiology 161(1-2), 206-212.
San Martín, B., Cornejo, J., Iragüen, D., Hidalgo, H., & Anadón, A.(2007). Depletion study of enrofloxacin and its metabolite ciprofloxacin in edible tissues and feathers of white leghorn hens by liquid chromatography coupled with tandem mass spectrometry. Journal of Food Protection,70(8), 1952-1957.
64
Shim, J. H., Lee, M. H., Kim, M. R., Lee, C. J., & Kim, I. S. (2003). Simultaneous measurement of fluoroquinolones in eggs by a combination of supercritical fluid extraction and high pressure liquid chromatography. Bioscience, Biotechnology, and Biochemistry, 67(6), 1342-1348.
Stubbings, G., & Bigwood, T. (2009). The development and validation of a multiclass liquid chromatography tandem mass spectrometry (LC-MS/MS) procedure for the determination of veterinary drug residues in animal tissue using a QuEChERS (Quick, Easy, CHeap, Effective, Rugged and Safe) approach. Analytica Chimica Acta, 637, 68-78.
Thompson, M., (2000). Recent trends in inter-laboratory precision at ppb and sub-ppb concentrations in relation to fitness for purpose criteria in proficiency testing. The Analyst Communication, 125, 385-386.
Toussaint, B., Chedin, M., Bordin, G., & Rodriguez, A. R. (2005). Determination of (fluoro)quinolone antibiotic residues in pig kidney using liquid chromatography-tandem mass spectrometry. I. Laboratory-validated method. Journal of Chromatography A, 1088, 32-39.
Tsai, W., Chuang, H., Chen, H., Huang, J., Chen, H., Cheng, S., & Huang, T., (2009). Application of dispersive liquid-liquid microextraction and dispersive micro-solid-phase extraction for the determination of quinolones in swine muscle by high-performance liquid chromatography with diode-array detection. Analytica Chimica Acta, 656, 56–62.
Verdon, E., Couedor, P., Roudaut, B., & Sandérs, P. (2005). Multiresidue method for simultaneous determination of ten quinolone antibacterial residues in multimatrix/multispecies animal tissues by liquid chromatography with fluorescence detection: single laboratory validation study. Journal of the Association of Official Analytical Chemists International, 88, 1179-1192.
Verdon, E., Hurtaud-Pessel, D., & Sanders, P. (2006). Evaluation of the limit of performance of an analytical method based on a statistical calculation of its critical concentrations according to ISO Standard 11843 – Application to Routine Control of Banned Veterinary Drug Residues in Food According to European Decision 657/2002/EC, Accreditation and Quality Assurance. Journal for Quality, Comparability and Reliability in Chemical Measurement, 11, 58-62.
Walsh, C., & Fanning, S. (2008). Antimicrobial resistance in foodborne pathogens - a cause for concern?. Current Drug Targets, 9, 808-815.
Wang, J., & Leung, D. (2012). The challenges of developing a generic extraction procedure to analyze multi-class veterinary drug residues in milk and honey using ultra-high pressure liquid chromatography quadrupole time-of-flight mass spectrometry. Drug Testing and Analysis, 4, 103-111.
Webber, M., & Piddock, L.J.V. (2001). Quinolone resistance in Escherichia coli. Veterinary Research32, 275–284.
Xu, H., Chen, L., Sun, L., Du, X., Wang, J., Wang, T., Zeng, Q., Wang, H., Xu, Y., &
Zhang, X. (2011). Microwave-assisted extraction and in situ clean-up for the determination of
fluoroquinolone antibiotics in chicken breast muscle by LC-MS/MS. Journal of Separation Science
34, 142–149.
Youden, W. J., & Steiner, E. H. (1975). Statistical manual of AOAC – Association of
Official Analytical Chemistry. Washington. AOAC, p 88.
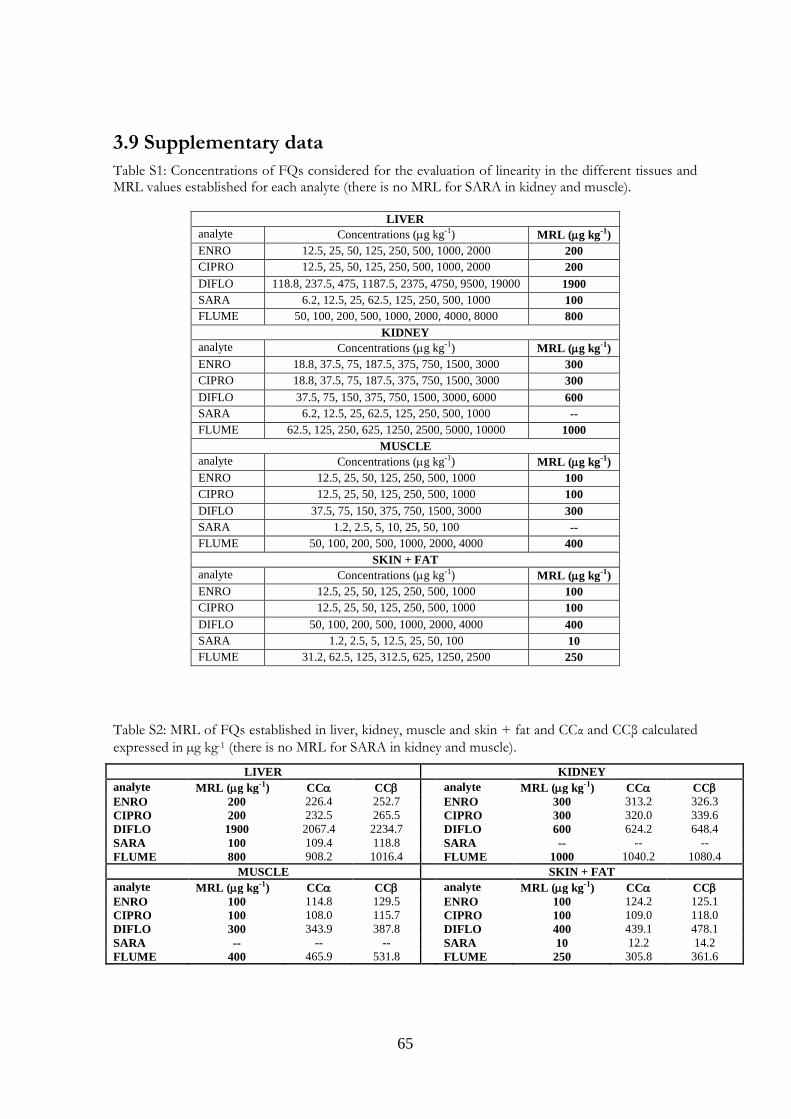
65
3.9 Supplementary data
Table S1: Concentrations of FQs considered for the evaluation of linearity in the different tissues and MRL values established for each analyte (there is no MRL for SARA in kidney and muscle).
LIVER
analyte Concentrations (g kg-1) MRL (g kg-1)
ENRO 12.5, 25, 50, 125, 250, 500, 1000, 2000 200
CIPRO 12.5, 25, 50, 125, 250, 500, 1000, 2000 200
DIFLO 118.8, 237.5, 475, 1187.5, 2375, 4750, 9500, 19000 1900
SARA 6.2, 12.5, 25, 62.5, 125, 250, 500, 1000 100
FLUME 50, 100, 200, 500, 1000, 2000, 4000, 8000 800
KIDNEY
analyte Concentrations (g kg-1) MRL (g kg-1)
ENRO 18.8, 37.5, 75, 187.5, 375, 750, 1500, 3000 300
CIPRO 18.8, 37.5, 75, 187.5, 375, 750, 1500, 3000 300
DIFLO 37.5, 75, 150, 375, 750, 1500, 3000, 6000 600
SARA 6.2, 12.5, 25, 62.5, 125, 250, 500, 1000 --
FLUME 62.5, 125, 250, 625, 1250, 2500, 5000, 10000 1000
MUSCLE
analyte Concentrations (g kg-1) MRL (g kg-1)
ENRO 12.5, 25, 50, 125, 250, 500, 1000 100
CIPRO 12.5, 25, 50, 125, 250, 500, 1000 100
DIFLO 37.5, 75, 150, 375, 750, 1500, 3000 300
SARA 1.2, 2.5, 5, 10, 25, 50, 100 --
FLUME 50, 100, 200, 500, 1000, 2000, 4000 400
SKIN + FAT
analyte Concentrations (g kg-1) MRL (g kg-1)
ENRO 12.5, 25, 50, 125, 250, 500, 1000 100
CIPRO 12.5, 25, 50, 125, 250, 500, 1000 100
DIFLO 50, 100, 200, 500, 1000, 2000, 4000 400
SARA 1.2, 2.5, 5, 12.5, 25, 50, 100 10
FLUME 31.2, 62.5, 125, 312.5, 625, 1250, 2500 250
Table S2: MRL of FQs established in liver, kidney, muscle and skin + fat and CCα and CCβ calculated
expressed in µg kg-1 (there is no MRL for SARA in kidney and muscle).
LIVER KIDNEY
analyte MRL (g kg-1) CC CC analyte MRL (g kg-1) CC CC
ENRO 200 226.4 252.7 ENRO 300 313.2 326.3
CIPRO 200 232.5 265.5 CIPRO 300 320.0 339.6
DIFLO 1900 2067.4 2234.7 DIFLO 600 624.2 648.4
SARA 100 109.4 118.8 SARA -- -- --
FLUME 800 908.2 1016.4 FLUME 1000 1040.2 1080.4
MUSCLE SKIN + FAT
analyte MRL (g kg-1) CC CC analyte MRL (g kg-1) CC CC
ENRO 100 114.8 129.5 ENRO 100 124.2 125.1
CIPRO 100 108.0 115.7 CIPRO 100 109.0 118.0
DIFLO 300 343.9 387.8 DIFLO 400 439.1 478.1
SARA -- -- -- SARA 10 12.2 14.2
FLUME 400 465.9 531.8 FLUME 250 305.8 361.6

66
Pharmacokinetic/pharmacodynamic evaluation of the efficacy of
flumequine in treating colibacillosis in turkeys
Published in: Poultry Science, 92(12); 3158-3165, 2013
CHAPTER 4

67

68
4.Pharmacokinetic/pharmacodynamic evaluation of the efficacy of flumequine in treating colibacillosis in turkeys AUTHORS: C. Ferraresia, L. Lucatello b, V. Meucci c, L. Intorre c, G. Grilli d,A. Piccirillo b, E. Russo b, R. Villa a, C. Montesissa band P. Cagnardi a
a Department of Health, Animal Sciences and Food Safety, Università degli Studi di Milano, Milano, Italyb Department of Comparative Biomedicine and Food Science, Università degli Studi di Padova, Viale dell’Università 16, Legnaro, PD, Italy c Department of Veterinary Sciences, Università di Pisa, 56122 San Piero a Grado PI, Italy; and d Department of Veterinary Science and Public Health, Università degli Studi di Milano, Milano, Italy.
4.1 Abstract
Flumequine (FLU) is used in the treatment of systemic bacterial infections in poultry, including colibacillosis, which is a common disease in turkeys. The pharmacokinetic (PK) behavior of FLU administered to 32 healthy turkeys as an oral bolus via gavage or as 10-h pulsed administration in drinking water were compared, using the authorized dose of 15 mg/kg and the double dose of 30 mg/kg. The minimum inhibitory concentrations (MIC) of 235 Escherichia coli field strains isolated from poultry were determined for pharmacodynamics (PD) to develop a PK/PD model. Blood samples were collected at established times over24 h, and the obtained plasma was analyzed using a liquid chromatography tandem mass spectrometry method that was validated in-house. A monocompartmental model and a noncompartmental model were applied to the data to obtain the PK results. For both types of administration and both dosages, the ratios of the maximum concentration (Cmax)/MIC50 and the area under the plasma concentration-time curve (AUC)/MIC50achieved were considerably lower than the fluoroquinolone breakpoints usually adopted for efficacy. The Cmax/MIC50and AUC0–24/MIC50ratios were, respectively,0.67 ± 0.09 and 4.76 ± 0.48 and 1.18 ± 0.35and 7.05 ± 2.40 for the 15 and 30 mg/kg bolus doses, respectively. After 10-h pulsed administration of 15mg/kg, values of Cmax/MIC50, 0.19 ± 0.02 on d 1 and0.30 ± 0.08 on d 5 of therapy were obtained, the AUC/MIC50ratios were 2.09 ± 0.29 and 3.22 ± 0.93 on d 1and 5, respectively. Higher values were obtained with the doubled dose of 30 mg/kg: the Cmax/MIC50ratioswere 0.49 ± 0.11 on d 1 and 0.69 ± 0.18 on d 5; the AUC/ MIC50ratios were 5.15 ± 1.15 and 6.57 ± 1.92 on d 1 and 5, respectively. Based on these results, FLU administration should be adopted when specific diagnostic findings indicate its efficacy, and revising the dosage scheme to comply with the prudent and responsible use of antimicrobials in veterinary medicine is advisable.

69
4.2 Introduction
The turkey (Meleagris gallopavo), although generally considered a minor species, is an extremely important livestock in northern Italy. Scarce data exist about the usage of antimicrobial drugs in this species, and even less is known about their efficacy in this species (Sanders, 2001; Bywater, 2005). Because of the limited number of authorized medicinal products for turkeys, antimicrobial therapy is frequently performed using a few authorized products. A frequent drawback of this approach is the onset of resistant bacterial strains that often exhibit cross-resistance for pharmacological groups of compounds. Fluoroquinolones (FQ) are widely used to treat pulmonary and enteric diseases in poultry (Papich and Riviere, 2009); among these, colibacillosis is considered the main cause of economic loss for turkey breeding (Webber and Piddock, 2001; Barnes et al., 2008). Flumequine (FLU), a second-generation fluoroquinolone drug, is useful in the treatment of systemic Escherichia coli infections and possibly other infections that are caused by gram-negative bacteria in poultry. Despite the availability of newer FQ, FLU is still employed because of its relatively low cost and good tolerability, especially in minor species such as turkey, for which the cost of therapy is relevant. In avian species, drinking water is the most common route of administering mass medication; the treatments can be conducted following 2 schemes: continuous administration during the entire light period or pulsed administration for a limited period between 4 and 10–12 h (Charleston et al., 1998). Individual therapy is reserved for valuable animals and breeders for practical reasons, although it represents a prudent use of antimicrobials for the limitation of antibiotic resistance in bacteria. Mass therapy is reportedly one of the main causes of the development of microbial resistance in veterinary species (EMA, 2006; Lohren et al., 2008); an increase in the number of FQ-resistant strains of E. coli, Campylobacter, and Salmonella spp. has been frequently reported in recent years (Walsh and Fanning, 2008; EFSA, 2010). Several scientific and health institutions have expressed serious concern over the emergence of FQ resistance, manifesting the need for risk management intervention regarding the use of FQ in humans and animals. Due to the development of FQ resistance in Campylobacter strains of poultry origin, the Food and Drug Administration has banned the use of FQ for the treatment of poultry infections since 2005 (FDA, 2005). In the European Union (EU), risk evaluation is ongoing, and according to the guidelines for risk management, FQ should be reserved for the treatment of clinical conditions that have responded poorly to other classes of antimicrobials (EMA, 2006). In addition, better dosage regimens

70
should be determined based on pharmacokinetic/pharmacodynamic (PK/PD) integration (Martinez et al., 2006). The available data on FLU have mainly concerned species other than turkeys and generally involved intravenous, intramuscular, or oral-bolus administration(Mevius et al., 1990; Villa et al., 2005). Therefore, pharmacokinetic parameters specific for turkeys given medicated water are still lacking, which may result infrequent improper dosages. To improve the availability of PK data about FLU in turkeys, the present study first aimed to evaluate 2different oral treatments (a single oral gavage and 5 d of repeated 10-h pulsed water medication) and 2 different doses of FLU (the EU authorized dose, 15 mg/kg, and double the EU authorized dose, 30 mg/kg).Oral administration by gavage allows precise control of the predetermined dose intake, and 10-h pulsed water medication is a frequent dosage scheme in avian clinical practice that is easily handled by farmers. Finally, to evaluate the effectiveness of FLU against E. coli, the most common zoonotic avian pathogen, a PK/PD approach was implemented, correlating the PK results after gavage or 10 h-pulsed administration with the MIC determined for the 235 E. coli strains isolated from poultry in Italy.
4.3 Materials and methods
4.3.1. Birds
Thirty-two female turkeys (breed B.U.T. 6) that were63 to 79 d old, weighed approximately 4 to 6 kg, and were determined to be healthy by a thorough physical examination were selected from a farm belonging to an industrial group. The birds were housed according to the requirements of the European Union (Council of Europe, 2007) and were kept in 4 groups of 8 individuals, housed in 4 boxes of 5 m2 on wood shavings at 20°C and 65% RH and receiving 16 h of light/day. Commercial diets and water were provided ad libitum. Before the experiments, the birds did not receive any pharmacological treatment. After an acclimatization period of 8 d, the birds were weighed and individually marked for identification. The study was conducted according to Italian law(D.L. 116/1992) and received ethical approval by the Italian Health Ministry (Animal Welfare Unit,2009R4KM4F_002).
4.3.2. Experimental Design
Flumequine was orally administered to turkeys via gavage as a single bolus or via 10-h pulsed medicated water for 5 consecutive days at the target dose of 15mg/kg of BW and at the doubled dose of 30 mg/kg of BW.
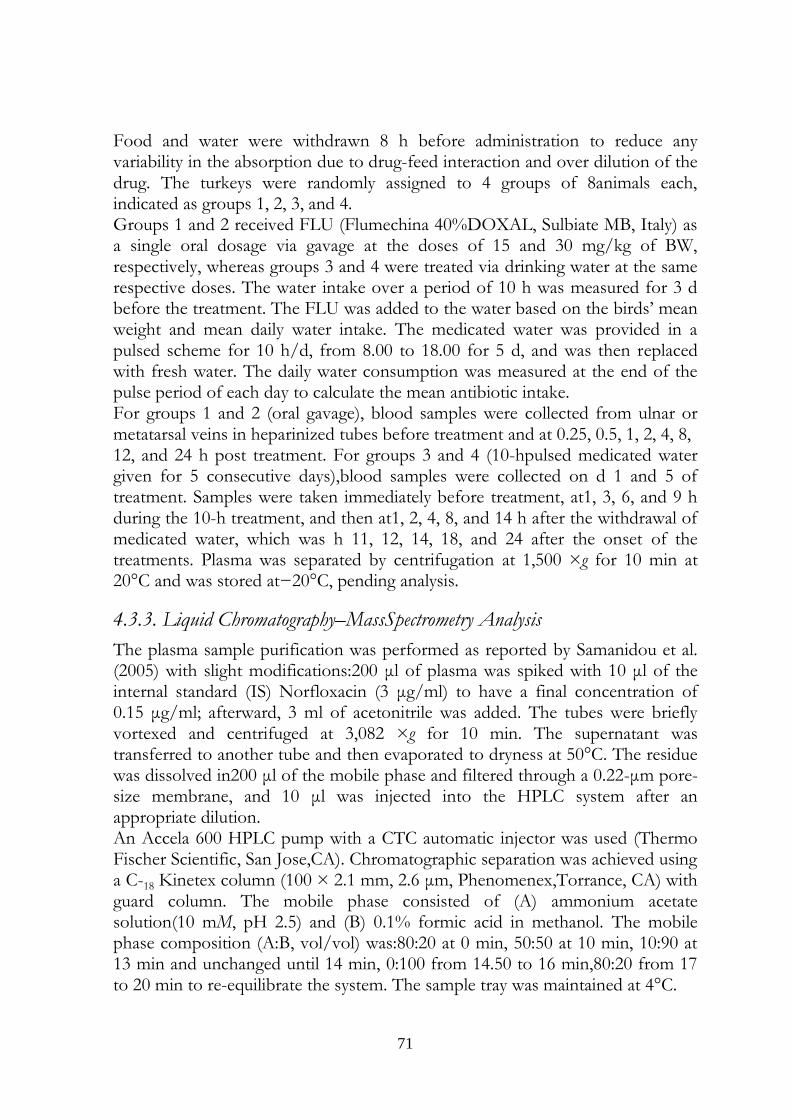
71
Food and water were withdrawn 8 h before administration to reduce any variability in the absorption due to drug-feed interaction and over dilution of the drug. The turkeys were randomly assigned to 4 groups of 8animals each, indicated as groups 1, 2, 3, and 4. Groups 1 and 2 received FLU (Flumechina 40%DOXAL, Sulbiate MB, Italy) as a single oral dosage via gavage at the doses of 15 and 30 mg/kg of BW, respectively, whereas groups 3 and 4 were treated via drinking water at the same respective doses. The water intake over a period of 10 h was measured for 3 d before the treatment. The FLU was added to the water based on the birds’ mean weight and mean daily water intake. The medicated water was provided in a pulsed scheme for 10 h/d, from 8.00 to 18.00 for 5 d, and was then replaced with fresh water. The daily water consumption was measured at the end of the pulse period of each day to calculate the mean antibiotic intake. For groups 1 and 2 (oral gavage), blood samples were collected from ulnar or metatarsal veins in heparinized tubes before treatment and at 0.25, 0.5, 1, 2, 4, 8, 12, and 24 h post treatment. For groups 3 and 4 (10-hpulsed medicated water given for 5 consecutive days),blood samples were collected on d 1 and 5 of treatment. Samples were taken immediately before treatment, at1, 3, 6, and 9 h during the 10-h treatment, and then at1, 2, 4, 8, and 14 h after the withdrawal of medicated water, which was h 11, 12, 14, 18, and 24 after the onset of the treatments. Plasma was separated by centrifugation at 1,500 ×g for 10 min at 20°C and was stored at−20°C, pending analysis.
4.3.3. Liquid Chromatography–MassSpectrometry Analysis
The plasma sample purification was performed as reported by Samanidou et al. (2005) with slight modifications:200 μl of plasma was spiked with 10 μl of the internal standard (IS) Norfloxacin (3 μg/ml) to have a final concentration of 0.15 μg/ml; afterward, 3 ml of acetonitrile was added. The tubes were briefly vortexed and centrifuged at 3,082 ×g for 10 min. The supernatant was transferred to another tube and then evaporated to dryness at 50°C. The residue was dissolved in200 μl of the mobile phase and filtered through a 0.22-μm pore-size membrane, and 10 μl was injected into the HPLC system after an appropriate dilution. An Accela 600 HPLC pump with a CTC automatic injector was used (Thermo Fischer Scientific, San Jose,CA). Chromatographic separation was achieved using a C-18 Kinetex column (100 × 2.1 mm, 2.6 μm, Phenomenex,Torrance, CA) with guard column. The mobile phase consisted of (A) ammonium acetate solution(10 mM, pH 2.5) and (B) 0.1% formic acid in methanol. The mobile phase composition (A:B, vol/vol) was:80:20 at 0 min, 50:50 at 10 min, 10:90 at 13 min and unchanged until 14 min, 0:100 from 14.50 to 16 min,80:20 from 17 to 20 min to re-equilibrate the system. The sample tray was maintained at 4°C.

72
Mass spectrometric analysis (Garces et al., 2006) was performed using a LTQ XL ion trap (Thermo FisherScientific, San Jose, CA) equipped with a heated electrospray ionization probe (HESI-II) operating in the positive-ion mode under the following conditions: sheath and auxiliary gas flow: 40 and 5 arbitrary units, respectively; ion spray voltage: 3.5 kV; capillary temperature:300°C; capillary voltage: 26 V; and tube lens:80 V. The collision energies that were determined to be necessary for fragmentation in MS2 and MS3 of the molecules of interest, precursor ions, product ions, and collision energies are shown in Table 1. The Xcalibur(version 2.1) data acquisition software from ThermoFisher Scientific was used. Calibration curves were constructed using pooled turkey plasma obtained from untreated animals. The blank plasma was spiked with 10 μL of IS and with FLU to obtain a concentration range of 2.5 to 200 ng/ml. Quantification was based on the ratios of the peak areas of the analyte to that of IS, and a least-squares linear regression analysis was performed to calculate the calibration curves. Flumequine (>99% pure) and norfloxacin (>99% pure) were purchased from SigmaAldrich (Steinheim, Germany). Other reagents and solvents were purchased from Carlo Erba-Reagenti (Milano,Italy). Prior to being routinely applied, the method was validated in-house using a set of parameters [linearity, within-run and between-run accuracy and precision, limit of quantification (LOQ), limit of detection(LOD), and selectivity] that were in compliance with the recommendations defined by the European Community(Commission Decision 2002/657/EC, 2002) and with the reference guidelines defined in other EU and FDA documents (VICH GL 49, 2011). The calibration curves were constructed using matrix-matched calibrator samples (concentration range: 2.5–200 ng/ml), and the correlation coefficient was always r > 0.99 for 6replicates. The within-day precision (repeatability) and accuracy were determined by analyzing blank samples that were spiked with 2.5 (n = 6), 10 (n = 6), or 50 (n =6) ng/ml on the same day. The between-day precision and accuracy were determined by analyzing quality control samples [concentration levels: 2.5 (n = 18),10 (n = 18), and 50 (n = 18) ng/ml] with each batch of analytical samples on 3 different days. The following mean values were obtained: within-run accuracy 2.10 ±0.12, 9.8 ± 0.6, and 52.5 ± 2.6 ng/ml and between-run accuracy 2.5, 10.2, and 50.5 ng/ml. The results fell within the accepted ranges for precision(within-run precision: 5.9, 6.03, and 4.9% for 2.5,10, and 50 ng/ml, respectively; between-run precision:12.2, 5.9, and 6.2% for 2.5, 10, and 50 ng/ml, respectively). An LOQ value of 2.5 ng/ml was obtained. None of the values below the LOQ were included in the plasma concentration-time curves or in the pharmacokinetic analysis. The LOD was defined as the concentration corresponding to a signal-
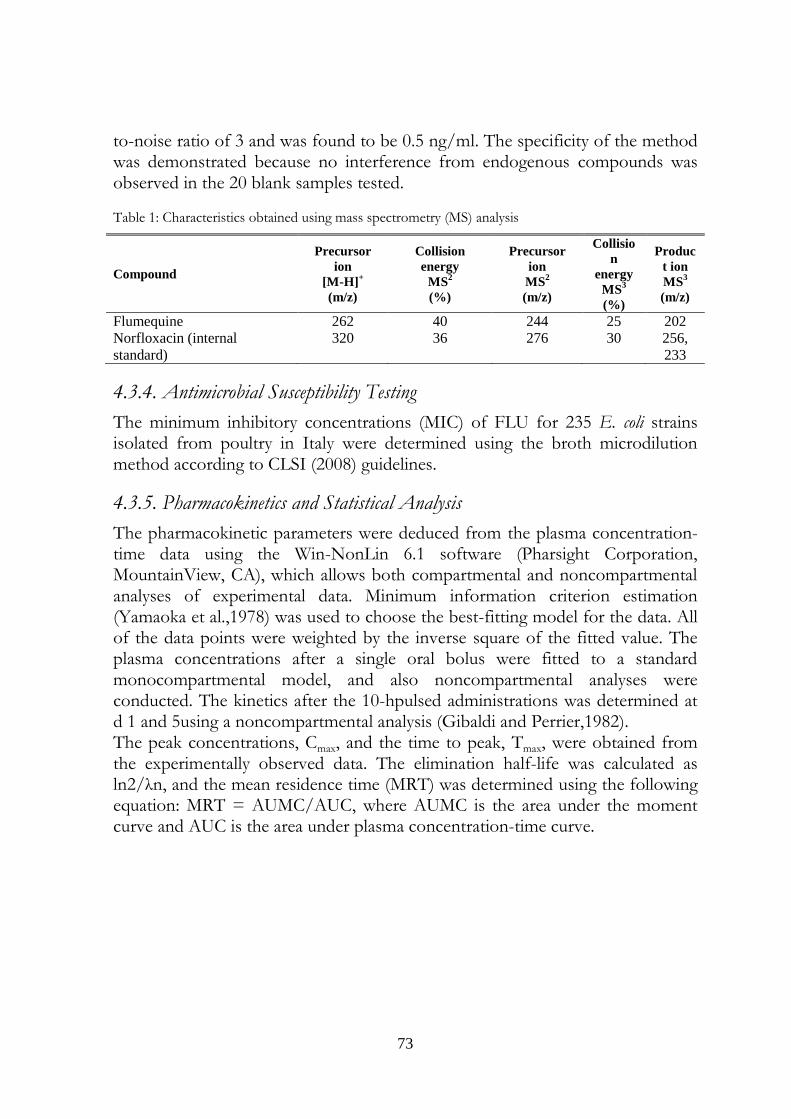
73
to-noise ratio of 3 and was found to be 0.5 ng/ml. The specificity of the method was demonstrated because no interference from endogenous compounds was observed in the 20 blank samples tested.
Table 1: Characteristics obtained using mass spectrometry (MS) analysis
Compound
Precursor
ion
[M-H]+
(m/z)
Collision
energy
MS2
(%)
Precursor
ion
MS2
(m/z)
Collisio
n
energy
MS3
(%)
Produc
t ion
MS3
(m/z)
Flumequine 262 40 244 25 202 Norfloxacin (internal
standard) 320 36 276 30 256,
233
4.3.4. Antimicrobial Susceptibility Testing
The minimum inhibitory concentrations (MIC) of FLU for 235 E. coli strains isolated from poultry in Italy were determined using the broth microdilution method according to CLSI (2008) guidelines.
4.3.5. Pharmacokinetics and Statistical Analysis
The pharmacokinetic parameters were deduced from the plasma concentration-time data using the Win-NonLin 6.1 software (Pharsight Corporation, MountainView, CA), which allows both compartmental and noncompartmental analyses of experimental data. Minimum information criterion estimation (Yamaoka et al.,1978) was used to choose the best-fitting model for the data. All of the data points were weighted by the inverse square of the fitted value. The plasma concentrations after a single oral bolus were fitted to a standard monocompartmental model, and also noncompartmental analyses were conducted. The kinetics after the 10-hpulsed administrations was determined at d 1 and 5using a noncompartmental analysis (Gibaldi and Perrier,1982). The peak concentrations, Cmax, and the time to peak, Tmax, were obtained from the experimentally observed data. The elimination half-life was calculated as ln2/λn, and the mean residence time (MRT) was determined using the following equation: MRT = AUMC/AUC, where AUMC is the area under the moment curve and AUC is the area under plasma concentration-time curve.
74
The pharmacokinetic parameters are reported as the mean values (±SD). The harmonic mean values and pseudo-SD were calculated for the half-lives using a jack-knife technique (Lam et al., 1985). The normality of the kinetics data was assessed using the Kolmogorov–Smirnov test. The differences between the 2 bolus gavage doses (group 1 vs. 2), the two 10-h pulsed doses (group 3 vs. 4) and the 2 administrations methods(groups 1 vs. 3 and 2 vs. 4) were compared using a 2-tailed unpaired t-test; P < 0.05 was considered statistically significant (GraphPad Prism version 4.00software, San Diego, CA). The following PK/PD indices were calculated as predictors of the success or failure of the therapy: the Cmax/MIC and AUC/MIC ratios (Toutain et al., 2002;McKellar et al., 2004). The breakpoint values of Cmax/MIC50 = 8–10 and AUC/MIC5= 100 h were considered representative of the therapeutic efficacy of this antimicrobial class to prevent the development of resistant bacterial strains in poultry (Anadon et al., 2001;Dimitrova et al., 2007; Ozawa et al., 2010).
75
4.4Results
4.4.5.Single Bolus Gavage Administration (Groups 1 and 2)
The mean plasma concentrations +SD of FLU at the various sampling times after oral gavage administration of both doses adopted are shown in Figure1. The individual plasma concentration-time profiles were similar, and a low inter individual variability was observed, particularly in group 1, whereas a larger inter individual variability was observed when the double dose was administered (group 2). The maximum concentrations were reached at approximately 2 h in both groups; the drug concentrations rapidly decreased, but the drug was still detectable at 24 h after administration, with mean concentrations of 0.26 ± 0.11 μg/ml (group 1) and 0.72 ± 0.74 μg/ml (group 2).The pharmacokinetic parameters obtained from the mono- and noncompartmental analyses are presented in Table 2.
Figure 1. Mean values + SD in the plasma concentration–time profiles of flumequine in group 1 (filled triangles) and group 2 (filled squares), which were given the dosages of 15 mg/kg b.w. or 30 mg/kg b.w., respectively, via gavage.
76
Table 2: Pharmacokinetics parameters in turkeys1
Parameter
Group 1
(oral gavage
15 mg/kg)
Group 2
(oral gavage
30 mg/kg)
Group 3
(oral pulsed
15 mg/kg; d 1)
Group 3
(oral pulsed
15 mg/kg;d 5)
Group 4
(oral pulsed
30 mg/kg;d 1)
Group 4
(oral pulsed
30 mg/kg;d 5)
Tmax (h) 1.88±0.35‡,§ 1.75±0.46#,$ 5.75±2.71€ 6.00±1.60€ 6.75±2.12† 6.38±1.92†
Cmax
(µg/ml) 10.76±1.50‡,§,
† 18.93±5.65#,$ 3.05±0.36€,# 4.81±1.30€,$ 7.89±1.73‡,†,$
10.84±2.92†,§,
#
AUC0-∞
(h*µg/ml) 74.10±7.98† 123.07±48.72€ ― ― ― ―
AUC0-24
(h*µg/ml) 76.14±7.69‡,§,
† 112.73±38.40€ 33.46±4.65€,§,#
51.54±14.87‡,€
,$ 82.33±18.40‡ 105.18±30.71§
AUMC0-24
(h*h*µg/ml) 418.04±64.65
‡ 545.94±275.35
# 257.60±39.23€,
§,# 418.88±100.6‡
,$ 676.31±153.6‡
,† 878.45±309.29
§
t ½ elim (h) 4.01±0.57* 4.25±1.60
* ― ― ― ―
MRT 0-24 (h) 5.48±0.48
‡,§ 4.62±1.26#,$ 7.69±0.34€ 8.28±0.64€ 8.23±0.62† 8.27±1.00†
MIC50 (µg/ml) for Escherichia coli 16 (0.015 to >256)
Cmax/MIC50 0.67±0.09† 1.18±0.35#,$ 0.19±0.02#) 0.30±0.08$ 0.49±0.11‡,†,$ 0.68±0.18†,§,#
AUC/MIC50 4.76±0.48‡,§,† 7.05±2.40€ 2.09±0.29§,# 3.22±0.93‡,€,$ 5.15±1.15‡ 6.57±1.92§
1Tmax = observed time for Cmax; Cmax = maximum concentration; AUC0-∞ = area under the concentration versus time curve from 0 to infinity; AUC0–24 = area under the concentration versus time curve from 0 to 24 h; AUMC0–24 = area under moment curve; t1/2 elim. = elimination half-life; MRT0–24 = mean residence time; MIC50 = minimum inhibitory concentration 50%; *harmonic mean ± pseudo SD. ‡Significantly different (P < 0.05) from group 3, d 1. §Significantly different (P < 0.05) from group 3, d 5. †Significantly different (P < 0.05) from group 2. #Significantly different (P < 0.05) from group 4, d 1. $Significantly different (P < 0.05) from group 4, d 5. €Significantly different (P < 0.05) from group 1.
4.4.6 10-h Medicated Water Administration for 5Consecutive Days (Groups 3 and 4)
In groups 3 and 4, the medicated water concentration was adjusted daily based on water intake; nevertheless, the daily measurements of water intake showed that the mean dose received by the turkeys was lower than the targeted doses of 15 and 30 mg/kg of BW (Table3). The mean FLU concentration-time profiles following repeated oral administrations of medicated water at the 2 dosages are shown in Figures 2 and 3, respectively; the data refer to d 1 and 5 of therapy. In both trials, the highest concentrations were achieved on d 5of treatment. The pharmacokinetic parameters obtained in the noncompartmental analysis are summarized in Table 2.
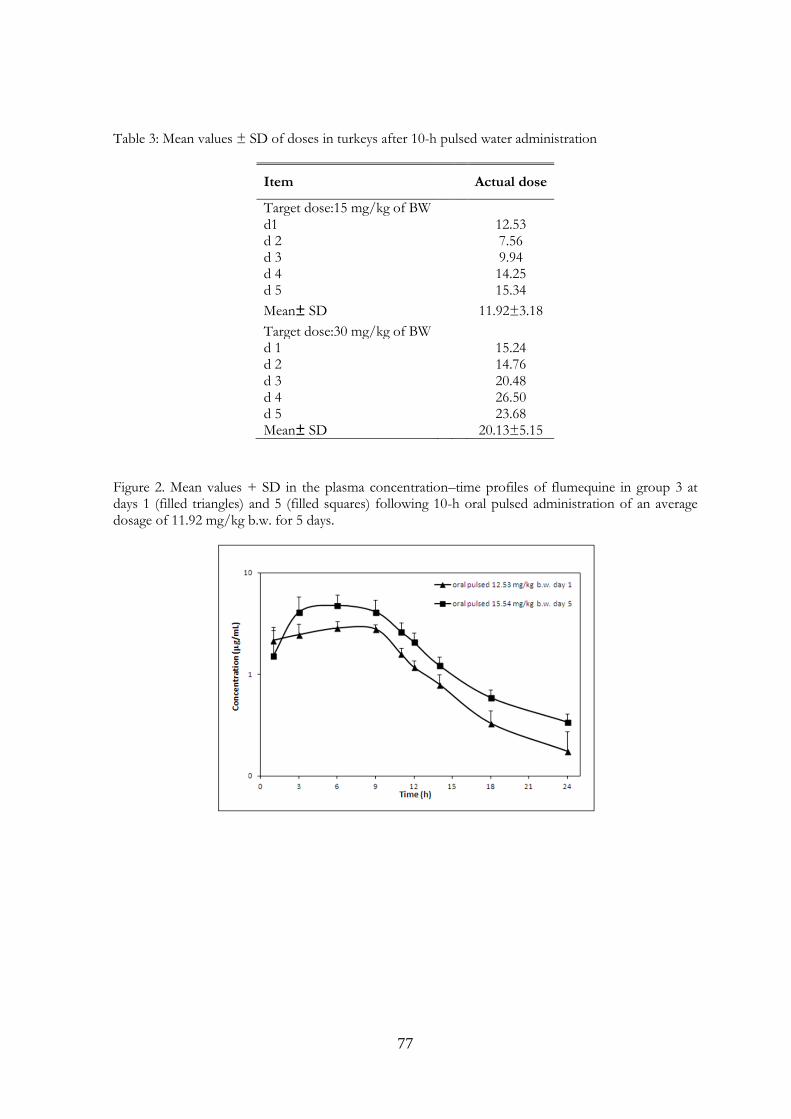
77
Table 3: Mean values ± SD of doses in turkeys after 10-h pulsed water administration
Item
Actual dose
Target dose:15 mg/kg of BW d1 12.53 d 2 7.56 d 3 9.94 d 4 14.25 d 5 15.34
Mean± SD 11.92±3.18
Target dose:30 mg/kg of BW d 1 15.24 d 2 14.76 d 3 20.48 d 4 26.50 d 5 23.68 Mean± SD 20.13±5.15
Figure 2. Mean values + SD in the plasma concentration–time profiles of flumequine in group 3 at days 1 (filled triangles) and 5 (filled squares) following 10-h oral pulsed administration of an average dosage of 11.92 mg/kg b.w. for 5 days.
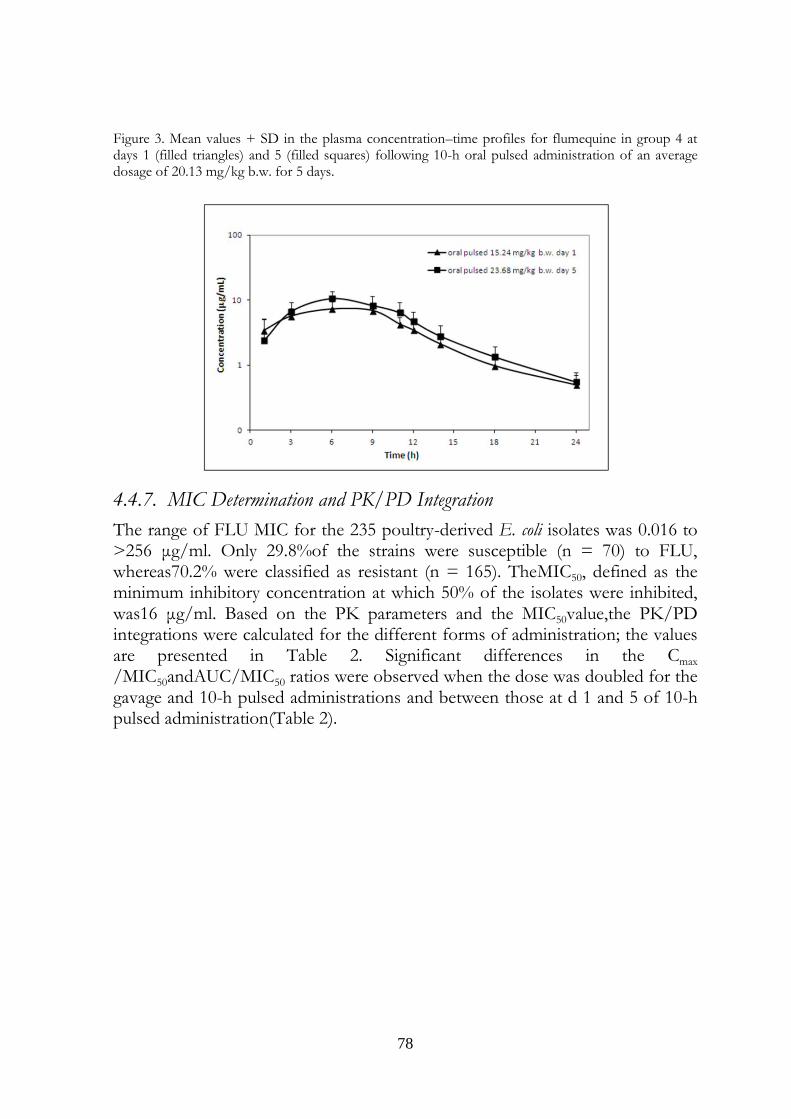
78
Figure 3. Mean values + SD in the plasma concentration–time profiles for flumequine in group 4 at days 1 (filled triangles) and 5 (filled squares) following 10-h oral pulsed administration of an average dosage of 20.13 mg/kg b.w. for 5 days.
4.4.7. MIC Determination and PK/PD Integration
The range of FLU MIC for the 235 poultry-derived E. coli isolates was 0.016 to >256 μg/ml. Only 29.8%of the strains were susceptible (n = 70) to FLU, whereas70.2% were classified as resistant (n = 165). TheMIC50, defined as the minimum inhibitory concentration at which 50% of the isolates were inhibited, was16 μg/ml. Based on the PK parameters and the MIC50value,the PK/PD integrations were calculated for the different forms of administration; the values are presented in Table 2. Significant differences in the Cmax /MIC50andAUC/MIC50 ratios were observed when the dose was doubled for the gavage and 10-h pulsed administrations and between those at d 1 and 5 of 10-h pulsed administration(Table 2).

79
4.5.Discussion
When given by oral gavage, FLU was very rapidly absorbed, presenting a Tmax of approximately 2 h, in contrast to those reported for other FQ, such as enrofloxacin and danofloxacin, for which higher values have been recorded (Tmax: 6.33 ± 2.5 h for enrofloxacinand 6.0 ± 3.29 h for danofloxacin; Haritova et al.,2006; Dimitrova et al., 2007). In our birds, the half-life proved to be rather short (t1/2 elim: 4.01 ± 0.57 and4.25 ± 1.60 h), and as expected, was not dependent on the dose given. After gavage administration of the 2 different doses of FLU, the increase in the Cmax and AUC values was related to the increase in the dose, whereas the concentration-time profiles were similar (Figure 1). Oral administration by gavage is not easily practicable in intensive turkey farming due to the high population density in the sheds, the need for trained farmers to individually handle the birds, and the occurrence of bird stress, despite the higher Cmax and AUC0–24 values obtained compared with those obtained using medicated water, for which a prolonged intake of lower drug concentrations occurs (Table 2). The pulsed administration trials showed that theAUC0–24 was increased from d 1 to d 5 in group 3(AUC0–24 : 33.46 ± 4.65 to 51.54 ± 14.87 h*μg/ml);and that the Cmaxin group 4 likewise increased (Cmax:7.89 ± 1.7 to 10.84 ± 2.92 μg/ml). This slight increase can be explained by the different intakes of medicated water and do not support an accumulation of the drug. Lower intake of the drug was observed at the first day of the trial, and medicated water concentrations were thus adjusted based on the water intake of the previous administrations. Most likely due to the poor palatability of the medicinal veterinary product, the targeted doses were never reached using a 10-h pulsed administration. It is likely that the availability of unmedicated water during the remaining 6 h of the light period affected the animals behavior and that the birds drank less medicated water while waiting for the unmedicated water. It is known that increasing the concentration of a drug can affect the intake of an adequate amount of the drug due to its limited solubility in water and alteration of the water’s palatability; moreover, the photoperiod is also a very important parameter that can have repercussions for the water uptake and thus on the amount of drug intake (Vermeulen et al., 2002). Administering the 2 different doses as medicated water allowed a significant increase in the Cmax, AUC0–24,and AUC0–24, but not in the Tmax and MRT witht he higher dosage; thus a correlation with the increased dosage was observed, although the targeted dose of 30mg/kg was not reached. In agreement with many previous studies on E. coli resistance to FQ (EFSA, 2010; Ozawa et al., 2010; Russo et al., 2012), a very high percentage of the isolated strains proved to be resistant to FLU. According to our MIC results,
80
70.2% of the E. coli strains tested were resistant. This result suggests that FQ should be used in turkeys only when a susceptibility test clearly indicates the efficacy of the drug, as proscribed by EMA (2006)and WHO (2011) in the last sets of guidelines on the prudent use of antimicrobials. Although specific breakpoints have not been defined for avian colibacillosis, several studies on FQ in poultry(Anadon et al., 2001; Dimitrova et al., 2007; Ozawa et al., 2010) adopted a Cmax /MIC ratio of 8 or 10 and an AUC/MIC ratio of 100 as the minimal dose required to prevent the selection of resistant bacteria. As reported in Table 2, after gavage administration, the mean Cmax/MIC50 and AUC0–24/MIC50 ratios were, respectively,0.67 ± 0.09 and 4.76 ± 0.48 and 1.18 ± 0.35 and 7.05 ±2.40 for the 15 and 30 mg/kg doses, respectively. After the administration of 10-h pulsed medicated water with the dosage regimen of 15 mg/kg, lower values of Cmax/MIC50, 0.19 ± 0.02 on d 1 and 0.30 ± 0.08 on d 5 of therapy were obtained; the AUC0–24/MIC50 ratios were2.09 ± 0.29 and 3.22 ± 0.93 on d 1 and 5, respectively. The following slightly higher values were obtained with the doubled dose: the Cmax/MIC50 ratios were 0.49 ±0.11 on d 1 and 0.69 ± 0.18 on d 5; the AUC0–24/MIC50 ratios were 5.15 ± 1.15 and 6.57 ± 1.92 on d 1 and 5,respectively. The breakpoints values were not reached with either type of administration or dosages, and the PK/PD correlation yielded very unsatisfactory results. These findings are discouraging but not completely surprising, as FLU was licensed for use in food animals at the beginning of the 1980s and has been widely used for the mass medication of poultry and because the adoption of 10-h pulsed medication is conflicting with its rapid clearance from the blood. Based on these results, the EU-authorized dosage of15 mg/kg may be ineffective to achieve adequate drug plasma concentrations. Furthermore, the 10-h pulsed doses of medicated water did not allow reaching plasma concentrations that were efficacious in controlling E. coli, due to the long periods with unmedicated water. Medicated water should always be provided continuously, as reported in the leaflets of the commercial products. To improve treatment efficacy and comply with the prudent and responsible use of antimicrobials in food-producing species, our results suggest that FLU administration should be adopted when specific diagnostic results indicate its efficacy and that a revision of the dosage scheme is advisable.
4.6. Acknowledgments
This study was supported by grants from the Italian Ministry of Higher Education and Research [PRIN2009 (2009R4KM4F_002)].

81
4.7. References
Anadon, A., M. R. Martinez-Larranaga, J. Iturbe, M. A. Martinez, M. J. Diaz, M. T. Frejo, and M. Martinez. (2001). Pharmacokinetics and residues of ciprofloxacin and its metabolites in broiler chickens. Res. Vet. Sci. 71:101–109.
Barnes, H. J., L. K. Nolan, and J. P. Vaillancourt. (2008). Colibacillosis. Pages 691–738 in Diseases of Poultry. 12th ed. Y. M. Saif, ed. Blackwell Publishing, Ames, IA.
Bywater, R. J.(2005). Identification and surveillance of antimicrobial resistance dissemination in animal production. Poult. Sci. 84:644–648.
Charleston, B., J. J. Gate, I. A. Aitken, B. Stephan, and R. Froyman. (1998). Comparison of the efficacies of three fluoroquinolone antimicrobial agents, given as continuous or pulsed-water medication, against Escherichia coli infection in chickens. Antimicrob. Agents Chemother. 42:83–87.
CLSI (Clinical and Laboratory Standards Institute). (2008). Performance Standards for Antimicrobial Disk and Dilution Susceptibility Test for Bacteria Isolated from Animals; Approved Standard- Third Edition M31–A3. CLSI, Wayne, PA.
Commission Decision 2002/657/EC. (2002). Implementing Council Directive 96/23/EC Concerning the Performances of Analytical Methods and the Interpretation of Results. Official Journal of the European Communities, No. L221, 17/08/2002, European Commission, Directorate General for Public Health and Consumers Protection.
Council of Europe. (2007). Appendix A to the European Conventions for the Protection of Vertebrate Animals used for Experimental and Other Scientific Purposes (ETS No. 123). Guidelines for Accommodation and Care of Animals (Art. 5 of the Convention). Accessed Nov. 2011. http://conventions.coe.int/Treaty/en/Treaties/Html/123.htm#Article5.
Dimitrova, D. J., L. D. Lashev, S. G. Yanev, and B. Pandova. (2007). Pharmacokinetics of enrofloxacin in turkeys. Res. Vet. Sci. 82:392–397.
EFSA. (2010). European Food Safety Authority. The Community Summary Report on antimicrobial resistance in zoonotic and indicator bacteria from animals and food in the European Union in 2004–2007. EFSA Journal 8:1309.
EMA. (2006). The European Agency for Evaluation of Medicinal Products. Reflection paper on the use of fluoroquinolones in food-producing animals in the European union: Development of resistance and impact on human and animal health. EMEA/CVMP/SAGAM/184651/2005.
FDA. (2005). U.S. Food and Drug Administration. Withdrawal of approval of the new animal drug application for enrofloxacin in poultry;Docket No. 2000N–1571. Accessed Apr. 18, 2013. http://www.fda.gov/AnimalVeterinary/SafetyHealth/RecallsWithdrawals/ucm042004.htm.
Garces, A., A. Zerzaňova, R. Kučera, D. Barron, and J. Barbosa. (2006). Determination of a series of quinolones in pig plasma using solid-phase extraction and liquid chromatography coupled with mass spectrometric detection: Application to pharmacokinetic studies. J. Chromatogr. A. 1137:22–29.

82
Gibaldi, M., and D. Perrier. (1982). Pharmacokinetics. Marcel Dekker Inc., New York, NY.
Haritova, A. M., N. V. Rusenova, P. R. Parvanov, L. D. Lashev, and J. Fink-Gremmels. (2006). Pharmacokinetic-pharmacodynamic modelling of danofloxacin in turkeys. Vet. Res. Commun. 30:775–789.
Lam, F. C., C. T. Hung, and D. G. Perrier. (1985). Estimation of variance for harmonic mean half-lives. J. Pharm. Sci. 74:229–231.
Lohren, U., A. Ricci, and T. S. Cummings. (2008). Guidelines for antimicrobial use in poultry. Pages 126–142 in Guide to Antimicrobial Use in Animals. L. Guardabassi, L. B. Jensen, H. Kruse, ed. Blackwell Publishing, Oxford, UK.
Martinez, M., P. McDermott, and R. Walzer. (2006). Pharmacology of the fluoroquinolones: A perspective for the use in domestic animals. Vet. J. 172:10–28.
McKellar, Q. A., S. F. Sanchez Bruni, and D. G. Jones. (2004). Pharmacokinetic/pharmacodynamic relationships of antimicrobial drugs used in veterinary medicine. J. Vet. Pharmacol. Ther. 27:503–514.
Mevius, D. J., H. J. Breukink, P. J. M. Guelen, T. Janset, and B. De Greve. (1990). Pharmacokinetics metabolism and renal clearance of flumequine in veal calves. J. Vet. Pharmacol. Ther. 13:159–169.
Ozawa, M., K. Baba, Y. Shimizu, and T. Asai. (2010). Comparison of in vitro activities and pharmacokinetics/pharmacodynamics estimations of veterinary fluoroquinolones against avian pathogenic Escherichia coli isolates. Microb. Drug Resist. 16:327–332.
Papich, M. G., and J. E. Riviere. (2009). Fluoroquinolone antimicrobial drugs. Pages 983–1011 in Veterinary Pharmacology and Therapeutics. 9th ed. J. E. Riviere and M. G. Papich, ed. Wiley Blackwell, Ames, IA.
Russo, E., L. Lucatello, D. Giovanardi, P. Cagnardi, G. Ortali, V. Di Leva, and C. Montesissa. (2012). Approved medication of water with enrofloxacin to treat turkey colibacillosis: Assessment of efficacy using a PK/PD approach. Vet. Microbiol. 161:206–212.
Samanidou, V. F., E. A. Christodoulou, and I. N. Papadoyannis. (2005). Direct determination of five fluoroquinolones in chicken whole blood and veterinary drugs by HPLC. J. Sep. Sci. 28:325–331.
Sanders, C. C.(2001). Mechanisms responsible for cross-resistance and dichotomous resistance among the quinolones. Clin. Infect. Dis. 32:S1–S8.
Toutain, P. L., J. R. E. Del Castillo, and A. Bousquet-Melou. (2002). The pharmacokinetic–pharmacodynamic approach to a rational dosage regimen for antibiotics. Res. Vet. Sci. 73:105–114.
Vermeulen, B., P. De Backer, and J. P. Remon. (2002). Drug administration to poultry. Adv. Drug Deliv. Rev. 54:795–803.
VICH GL 49. (2011), (2012-Final), Guidance for Industry, Studies to evaluate the metabolism and residue kinetics of veterinary drugs in food producing animals: Validation of analytical methods used in residue depletion studies, February 2011. Accessed Feb. 2012. http://www.vichsec.org/en/guidelines2.htm.

83
Villa, R., P. Cagnardi, F. Acocella, P. Massi, P. Anfossi, F. Asta, and S. Carli. (2005). Pharmacodynamics and pharmacokinetics of flumequine in pigs after single intravenous and intramuscular administration. Vet. J. 170:101–107.
Walsh, C., and S. Fanning. (2008). Antimicrobial resistance in foodborne pathogens—A cause for concern? Curr. Drug Targets 9:808–815.
Webber, M., and L. J. V. Piddock. (2001). Quinolone resistance in Escherichia coli. Vet. Res. 32:275–284.
World Health Organization. (2011). World health day 2011. In Urgent Action Necessary to Safeguard Drug Treatments, WHO, Geneva. Accessed Apr. 18, 2013. http://www.who.int/mediacentre/news/releases/2011/whd_20110406/en/index.html.
Yamaoka, K., T. Nakagawa, and T. Uno. (1978). Application of Akaike’s information criterion (AIC) in the evaluation of linear pharmacokinetic equations. J. Pharmacokinet. Biopharm. 6:165–175.
84
Enrofloxacin against Escherichia
coli in turkeys: which treatment scheme is
effective?
Published in: Poultry Science, 93(7); 1667-1674, 2014.
CHAPTER 5

85

86
5. Enrofloxacin against Escherichia coli in turkeys: which treatment scheme is effective? AUTHORS: P. Cagnardi ,a C. Ferraresi , a L. Lucatello , b V. Meucci , c L. Intorre , c G. Grilli , d A. Piccirillo , b M. Giacomelli , b and C. Montesissa b
a Department of Health, Animal Sciences and Food Safety, Università degli Studi di Milano, Milano, Italy b Department of Comparative Biomedicine and Food Science, Università degli Studi di Padova, Viale dell’Università 16, Legnaro, PD, Italy c Department of Veterinary Sciences, Università di Pisa, 56122 San Piero a Grado PI, Italy and d Department of Veterinary Science and Public Health, Università degli Studi di Milano, Milano, Italy.
5.1 Abstract
The efficacy of enrofloxacin (ENRO) was evaluated against multidrug-resistant avian pathogenic Escherichia coli correlating the minimum inhibitory concentrations (MIC) of 235 E. coli field strains with its pharmacokinetics (PK) in 50 healthy turkeys (5 groups) with a PK/pharmacodynamic approach. The treatments were as follows: a) single oral gavage and b) single subcutaneous (SC) treatment at the recommended dose of 10 mg/kg; c) single oral gavage, d) 5 d of 10-h pulsed water medication, and e) 5 d of 24-h continuous water medication at the doubled dose of 20 mg/kg. Blood samples were collected at established times over 24 h. Plasma was analyzed using a liquid chromatography tandem mass spectrometry method that was validated in house. A monocompartmental and a noncompartmental model were applied to the data to obtain the PK results. After gavage administration, the mean maximum concentration Cmax/MIC50 and area under the curve AUC0–24/MIC50 ratios were, respectively, 3.07•± 0.62 and 7.01•± 1.03 and 25.48•± 3.04 and 57.2•± 3.73 for the 10 and 20 mg/kg doses, respectively. After SC administration of 10 mg/kg, Cmax/MIC50 and AUC0–24/ MIC50 ratios were 3.45•± 0.75 and 33.96•± 7.46, respectively. After the administration of 10-h pulsed or 24-h continuous medicated water at 20 mg/kg, lower values of Cmax/MIC50 (10-h pulsed: 3.45•± 0.7; 24-h continuous: 3.05•± 0.48) and AUC0–24/MIC50 (10-h pulsed: 42.42•± 6.17; 24-h continuous: 53.32•± 5.55) were obtained. Based on these results, the European Union-recommended dosage of 10 mg/kg seems ineffective to achieve adequate drug plasma concentrations and even the 20 mg/kg by 10 h pulsed or continuous medicated water administration did not reach completely efficacious concentrations in plasma against colibacillosis. Although the results obtained were not completely encouraging, the medicated water should preferably be provided continuously. To conclude about the efficacy of ENRO treatment against colibacillosis, target tissue concentration should be extensively considered.
87
5.2 Introduction
Enrofloxacin (ENRO) is an antimicrobial agent of the fluoroquinolone group approved only in veterinary medicine, with a broad antimicrobial spectrum and high bactericidal activity (Walker et al., 1992). In European Countries, ENRO was approved in the 1990s and is still extensively used in poultry for colibacillosis treatment, due to its unique effectiveness against multidrug-resistant avian pathogenic Escherichia coli (Bass et al., 1999; Lutful Kabir, 2010). In avian species, the low economic value of individual birds makes single therapy cost-prohibitive and drinking water is the most common route of administering mass medication because sick birds continue to drink. For practical reasons, individual therapy by oral or parenteral route is reserved for high value breeders or small flocks. In commercial turkeys, colibacillosis requires a prompt and efficacious antimicrobial treatment, preferably via the drinking water. The treatments can be conducted following 2 schemes: continuous administration during the entire light period or pulse administration for a limited period between a minimum of 4 and a maximum of 12 h (Charleston et al., 1998). In Europe, turkeys are considered a minor species and the cost of the therapy influences strongly the choice of the drug. In recent years, notwithstanding the scarce information on pharmacokinetics (PK) of antimicrobial drugs in turkeys, the ENRO use was increased in this species as a result of its effectiveness and the availability of generic products. However, an indiscriminate use of these drugs may both select for a resistant bacterial population and reduces their clinical efficacy. Mass therapy, frequently adopted to cure large numbers of animals, is one of the main causes for the development of microbial resistance in veterinary food producing species (EMA, 2007; Lohren et al., 2008). In poultry, an increase in the number of fluoroquinolone resistant strains of E. coli, Campylobacter spp., and Salmonella spp. has been frequently reported in recent years (Walsh and Fanning, 2008; EFSA, 2010). Several scientific and health institutions have serious concern over the emergence of fluoroquinolone-resistance, manifesting the need for risk management intervention regarding the use of fluoroquinolones in humans and animals (EFSA, 2010). During the last 10 years, particular attention has been devoted to a correct evaluation of efficacious dosages for a more prudent and targeted use of antimicrobials in animal species. The correlation between minimum inhibitory concentrations (MIC) in field isolates and the PK behavior of antimicrobials in target species, known as PK/pharmacodynamic (PD) model is the best tool for a prudent and targeted use of antimicrobials (Martinez et al., 2006).
88
The aims of the present study were to evaluate 3 different oral treatments (a single oral gavage, 5 d of 10-h pulsed water medication, and 5 d of 24-h continuous water medication) and single parenteral (subcutaneous; SC) treatment using 2 different doses of ENRO (i.e., the EU authorized dose, 10 mg/kg, and double the EU recommended dose, 20 mg/kg). The effectiveness of different treatment schemes against E. coli was evaluated by a PK/PD approach, correlating the PK results with the MIC determined for 235 E. coli strains isolated from poultry in Italy reported by Vanni et al. (2014).
5.3 Materials and methods
5.3.1. Birds
Fifty female turkeys (commercial breed, British United Turkeys, B.U.T.6, Aviagen Turkeys, Cremona, Italy) 62 to 83 d old, weighed between 3.4 and 6.9 kg and determined to be healthy by a thorough physical examination, were selected from a commercial farm. The turkeys were housed according to the requirements of the European Union (Council of Europe, 2007) and were divided into 5 groups of 10 individuals kept into 5 pens of 5 m2 on wood shavings. The birds were housed at 20°C and 65% RH and received 16 h of light/day. Standard commercial diet and water were supplied ad libitum in feeders and drinkers. After an acclimatization period of 8 d, the turkeys were weighed and individually marked for identification. The study was conducted by the Animal Production Research and Teaching Centre of the University of Milan (Lodi, Italy) according to Italian law (D.L. 116/1992) and was ethically approved by the Ethical Committee of University of Milan (Opinion n. 31/11).
5.3.2 Experimental Design
Enrofloxacin was orally administered to turkeys via gavage as a single bolus at the dose of 10 mg/kg of BW or at the doubled dose of 20 mg/kg of BW, or via 10-h pulsed medicated water, or via continuous administration for 5 consecutive days at the doubled dose of 20 mg/kg of BW. Parenteral administration was a single SC injection at 10 mg/kg of BW. Food and water were withdrawn 8 h before administrations to reduce any variability in the absorption due to drug-feed interaction and over dilution of the drug and treatments were carried out at the beginning of the light period. One hour after single treatments (oral and SC), fresh water and feed were supplied, whereas for repeated water medications only feed was supplied after 1 h. The turkeys were randomly assigned to 5 groups of 10 birds each, indicated as groups 1, 2, 3, 4, and 5.
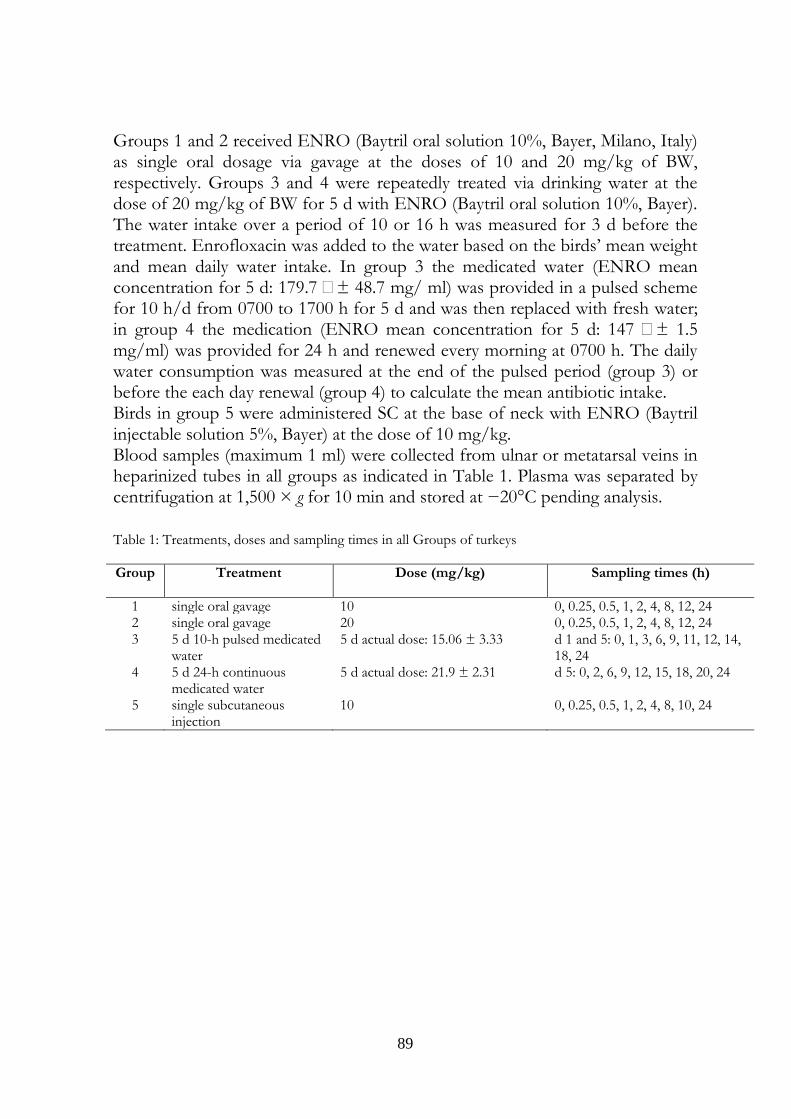
89
Groups 1 and 2 received ENRO (Baytril oral solution 10%, Bayer, Milano, Italy) as single oral dosage via gavage at the doses of 10 and 20 mg/kg of BW, respectively. Groups 3 and 4 were repeatedly treated via drinking water at the dose of 20 mg/kg of BW for 5 d with ENRO (Baytril oral solution 10%, Bayer). The water intake over a period of 10 or 16 h was measured for 3 d before the treatment. Enrofloxacin was added to the water based on the birds’ mean weight and mean daily water intake. In group 3 the medicated water (ENRO mean concentration for 5 d: 179.7 •± 48.7 mg/ ml) was provided in a pulsed scheme for 10 h/d from 0700 to 1700 h for 5 d and was then replaced with fresh water; in group 4 the medication (ENRO mean concentration for 5 d: 147 •± 1.5 mg/ml) was provided for 24 h and renewed every morning at 0700 h. The daily water consumption was measured at the end of the pulsed period (group 3) or before the each day renewal (group 4) to calculate the mean antibiotic intake. Birds in group 5 were administered SC at the base of neck with ENRO (Baytril injectable solution 5%, Bayer) at the dose of 10 mg/kg. Blood samples (maximum 1 ml) were collected from ulnar or metatarsal veins in heparinized tubes in all groups as indicated in Table 1. Plasma was separated by centrifugation at 1,500 × g for 10 min and stored at −20°C pending analysis.
Table 1: Treatments, doses and sampling times in all Groups of turkeys
Group Treatment Dose (mg/kg) Sampling times (h)
1 single oral gavage 10 0, 0.25, 0.5, 1, 2, 4, 8, 12, 24 2 single oral gavage 20 0, 0.25, 0.5, 1, 2, 4, 8, 12, 24 3 5 d 10-h pulsed medicated
water 5 d actual dose: 15.06 ± 3.33 d 1 and 5: 0, 1, 3, 6, 9, 11, 12, 14,
18, 24 4 5 d 24-h continuous
medicated water 5 d actual dose: 21.9 ± 2.31 d 5: 0, 2, 6, 9, 12, 15, 18, 20, 24
5 single subcutaneous injection
10 0, 0.25, 0.5, 1, 2, 4, 8, 10, 24
90
5.3.3 Liquid Chromatography–Mass Spectrometry Analysis and Method Validation
The plasma samples purification was performed as reported by Lucatello et al. (2013, 2014). Mass spectrometric (MS) analysis was performed on a LTQ XL ion trap (Thermo Fischer Scientific, San Jose, CA), equipped as indicated by Lucatello et al. (2013, 2014). The collision energies that were necessary for fragmentation of the parent compounds (ENRO and ciprofloxacin, CIPRO) into precursor ions (MS/MS) and product ions (MS/MS/MS) are shown in Table 2. Calibration curves were constructed using pooled turkey plasma obtained from untreated birds. Blank plasma was spiked with 10 μl of internal standard (IS) norfloxacin (3 μg/ml) and with ENRO and CIPRO to obtain a concentration range of 2.5 to 200 ng/ml. Quantification was based on the ratios of the peak areas of the analyte to that of IS and a least squares linear regression analysis was performed to calculate calibration curves. The method was in-house validated using a set of parameters [linearity, within-run and between-run accuracy and precision, limit of quantification (LOQ), limit of detection (LOD), and selectivity] that were in compliance with the recommendations defined by the European Community (European Commission, 2002) and with the reference guidelines defined in other European Union and FDA documents (VICH GL 49, 2012). The calibration curves were constructed using matrix matched calibrator samples (concentration range: 2.5– 200 ng/ml) and the correlation coefficients was always r > 0.99 for 6 replicates. Within-day precision (repeatability) and accuracy were determined by analyzing blank samples that were spiked with both compounds at 2.5 (n = 6), 10 (n = 6), and 50 (n = 6) ng/ml on the same day. The between-day precision and accuracy were determined by analyzing quality control samples, concentration level: 2.5 (n = 18), 10 (n = 18), and 50 (n = 18) ng/mL, with each batch of analytical samples on 3 different days. The validation results are reported in Table 2 and fell within the accepted ranges for validation. All values below the LOQ were not included in the plasma concentration-time curves and the pharmacokinetic analysis.

91
Table 2: Characteristics obtained using mass spectrometry analysis and validation results1
COMPOUND Precursor ion
[M-H]+ (m/z)
Collision energy MS/MS
(%)
Precursor ion
MS/MS (m/z)
Collision energy
MS/MS/MS
(%)
Product ion MS/MS/MS
(m/z)
Enrofloxacin 360 46 316 23 245 Ciprofloxacin 332 22 288 30 245, 268 Norfloxacin (IS)
320 36 276 30 256, 233
VALIDATION
Concentrationg/mL
Within-run precision(n. 6) Between-run precision(n. 18)
2.5 ENRO: 7.2%; CIPRO: 11.9 % ENRO: 10.6%; CIPRO: 12.6 10 ng/mL ENRO: 6.1%; CIPRO: 5 % ENRO: 5.5%; CIPRO:7.2 50 ng/mL ENRO: 5.5%;CIPRO: 4.7% ENRO: 7.1%; CIPRO:5.7 LOQ LOD ENRO: 2.47 ng/mL; CIPRO: 1.4 ng/mL ENRO: 0.82 ng/mL; CIPRO: 0.46 ng/mL
1MS= mass spectrometry; ENRO= enrofloxacin; CIPRO= ciprofloxacin; IS= internal standard;
LOQ=limit of quantification; LOD= limit of detection.
5.3.4 PK and Statistical Analysis
The PK parameters were deduced from plasma concentration-time data using the WinNonLin Prof 6.1 software (Pharsight Corporation, Mountain View, CA), which allows both compartmental and noncompartmental analyses of experimental data. Minimum information criterion estimation (Yamaoka et al., 1978) was used to choose the best fitting model for the data. All of the data points were weighted by the inverse square of the fitted value. Plasma concentrations after single oral bolus, SC, and continuous administration were fitted to a standard monocompartmental model and also a noncompartmental analysis was carried out. The kinetics after the 10-h pulsed administrations was determined at d 1 and 5 using a noncompartmental analysis (Gibaldi and Perrier, 1982). The peak concentrations, Cmax, and time to peak Tmax were obtained from the experimentally observed data. The elimination half-life was calculated as ln2/λn; mean residence time (MRT) was determined from the following equation: MRT = AUMC/AUC, where AUMC is the area under the moment curve and AUC is the area under plasma concentration-time curve. Pharmacokinetic parameters are reported as the mean values (±SD). The harmonic means and pseudostandard deviations were calculated for half-lives using a jack-knife technique (Lam et al., 1985). The normality of the kinetics data was assessed using the Kolmogorov–Smirnov test. The differences between the 2 gavage doses (group 1 vs. 2), and between the 10 mg/kg gavage and the 10 mg/kg SC (group 1 vs. 5) were compared by a 2-tailed unpaired t-test. The water
92
medication by 10-h pulsed scheme at d 1 and 5 were compared by a 2-tailed unpaired t-test; the same test was used to compare the d 5 of 10-h pulsed and continuous administration. A P-value < 0.05 was considered statistically significant (GraphPad Prism version 4.00, San Diego, CA). The following PK/PD indices were calculated as predictors of the success or failure of the therapy: Cmax/MIC and AUC/MIC ratios. MIC50, defined as minimum inhibitory concentration at which 50% of isolates tested are inhibited, is generally used for PK/PD correlation (Toutain et al., 2002; McKellar et al., 2004). The breakpoint values of Cmax/MIC50 = 8–10 and AUC/MIC50 = 100 h were considered representative of the therapeutic efficacy of fluoroquinolones to prevent the development of resistant bacterial strains in poultry.
5.4 Results
The CIPRO concentrations were low in all samples from all birds reaching approximately 3 to 4% of the parent compound. Therefore, the mean plasma concentration-time profiles and PK parameters were reported as the sum of ENRO and its metabolite.
5.4.1 Single Gavage Administration (Groups 1 and 2)
Mean plasma concentrations ±SD of ENRO of both doses are shown in Figure 1. Following oral gavage at the dose of 10 mg/kg (group 1) or 20 mg/kg (group 2), ENRO reached the maximum concentrations at approximately 2 h; subsequently, drug levels decreased rapidly, but were still detectable at 24 h after administration with a mean concentration of 0.09 ± 0.02 μg/ml (group 1) and 0.16 ± 0.03 μg/ml (group 2). The pharmacokinetic parameters obtained by monocompartmental and noncompartmental analysis are presented in Table 3. The Cmax for ENRO after gavage (1.53 ± 0.31 μg/ml and 3.51 ± 0.55 μg/ml in group 1 and 2, respectively) were attained at 1.88 ± 0.33 (group 1) and 1.88 ± 0.99 h (Tmax; group 2). The mean AUC0–24 and half-lives were 12.74 ± 1.52 h∙μg/ml and 5.27 ± 0.67 h in group 1 and 28.60 ± 2.00 h∙μg/ml and 4.99 ± 0.32 h in group 2.
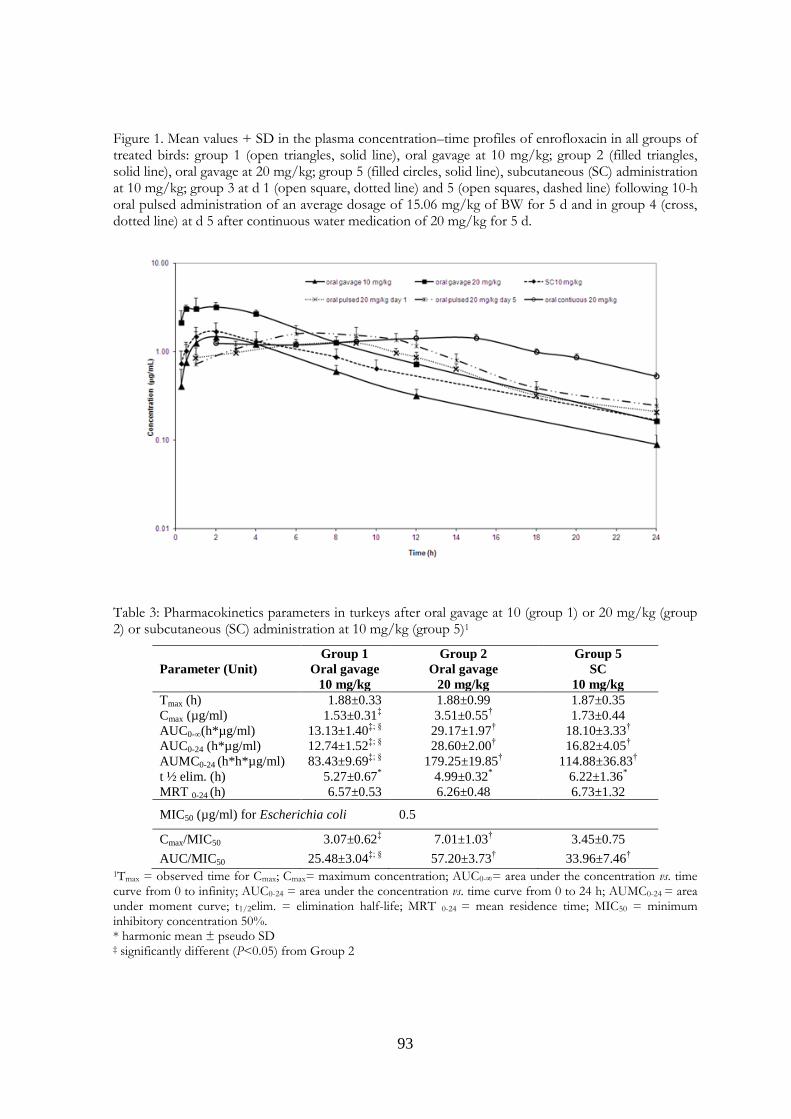
93
Figure 1. Mean values + SD in the plasma concentration–time profiles of enrofloxacin in all groups of treated birds: group 1 (open triangles, solid line), oral gavage at 10 mg/kg; group 2 (filled triangles, solid line), oral gavage at 20 mg/kg; group 5 (filled circles, solid line), subcutaneous (SC) administration at 10 mg/kg; group 3 at d 1 (open square, dotted line) and 5 (open squares, dashed line) following 10-h oral pulsed administration of an average dosage of 15.06 mg/kg of BW for 5 d and in group 4 (cross, dotted line) at d 5 after continuous water medication of 20 mg/kg for 5 d.
Table 3: Pharmacokinetics parameters in turkeys after oral gavage at 10 (group 1) or 20 mg/kg (group 2) or subcutaneous (SC) administration at 10 mg/kg (group 5)1
Parameter (Unit)
Group 1
Oral gavage
10 mg/kg
Group 2
Oral gavage
20 mg/kg
Group 5
SC
10 mg/kg
Tmax (h) 1.88±0.33 1.88±0.99 1.87±0.35
Cmax (µg/ml) 1.53±0.31‡ 3.51±0.55
† 1.73±0.44
AUC0-∞(h*µg/ml) 13.13±1.40‡; §
29.17±1.97† 18.10±3.33
†
AUC0-24 (h*µg/ml) 12.74±1.52‡; §
28.60±2.00† 16.82±4.05
†
AUMC0-24 (h*h*µg/ml) 83.43±9.69‡; §
179.25±19.85† 114.88±36.83
†
t ½ elim. (h) 5.27±0.67* 4.99±0.32
* 6.22±1.36
*
MRT 0-24 (h) 6.57±0.53 6.26±0.48 6.73±1.32
MIC50 (µg/ml) for Escherichia coli 0.5
Cmax/MIC50 3.07±0.62‡ 7.01±1.03
† 3.45±0.75
AUC/MIC50 25.48±3.04‡; §
57.20±3.73† 33.96±7.46
†
1Tmax = observed time for Cmax; Cmax= maximum concentration; AUC0-∞= area under the concentration vs. time curve from 0 to infinity; AUC0-24 = area under the concentration vs. time curve from 0 to 24 h; AUMC0-24 = area under moment curve; t1/2elim. = elimination half-life; MRT 0-24 = mean residence time; MIC50 = minimum inhibitory concentration 50%. * harmonic mean ± pseudo SD ‡ significantly different (P<0.05) from Group 2

94
5.4.2 10-h Medicated Water Administration (Group 3)
During pulse scheme trials the drug water concentration was adjusted daily based on water intake, the measurement of water at the end of 10-h treatment indicated that the dose received by turkeys was lower than the targeted 20 mg/kg of BW, reaching a value of 14.18 and 16.67 mg/kg at d 1 and 5, respectively; the mean dose received by the group was 15.06 ± 3.33 mg/kg. The ENRO mean concentration–time profiles following 10-h administration of medicated water are shown in Figure 1, the data refer to d 1 and 5 of therapy. The mean kinetic parameters obtained by noncompartmental analysis are resumed in Table 4; Cmax were attained at about 8 h and the highest concentrations were achieved on d 5 of treatment (1.28 ± 0.14 µg/ml and 1.72 ± 0.37 µg/ml at d 1 and 5, respectively). The mean AUC0–24 at d 1 and 5 were 17.28 ± 2.03 and 21.21 ± 3.30 h∙µg/ml (P < 0.05), respectively.
5.4.3 24-h Continuous Medicated Water Administration (Group 4)
During continuous treatment the drug water concentration was adjusted daily based on water intake. The measurement of water at the end of 24-h treatment indicated that the dose received by turkeys was between 24.73 and 18.39 mg/kg at d 1 and 5, respectively; the mean dose received by the group was 21.9 ± 2.31 mg/kg. The ENRO mean concentration–time profile at d 5 following 24-h administration of medicated water for 5 consecutive days is shown in Figure 1, together with the data from all the other scheme of administration. The mean kinetic parameters obtained by mono- and noncompartmental analysis are resumed in Table 4; Cmax was attained at about 12 h with a mean value of 1.53 ± 0.24. The mean AUC0–24 and elimination half-life were 26.66 ± 2.77 h∙µg/ml and 9.78 ± 1.40 h, respectively.

95
Table 4: Pharmacokinetics parameters in turkeys after oral water medication following 10-h (group 3) or continuous administration (group 4) at 20 mg/kg
Parameter
(Unit)
Group 3
Oral pulsed
20 mg/kg (d 1)
Group 3
Oral pulsed
20 mg/kg (d 5)
Group 4
Oral continuous
20 mg/kg (d 5)
Tmax (h) 7.88±1.55 8.50±2.33§ 12.02±2.67‡
Cmax (µg/ml) 1.28±0.14‡ 1.72±0.37† 1.53±0.24
AUC0-
∞(h*µg/ml) - - 37.37±3
AUC0-24
(h*µg/ml) 17.28±2.03
‡ 21.21±.3.3†; § 26.66±2.77
‡
AUMC0-24
(h*h*µg/ml) 160.07±17.87
‡ 201.72±28.92†; § 309.32±31.33
‡
t ½ elim. (h) - - 9.78±1.40*
MRT 0-24 (h) 9.27±0.22 9.53±0.44§ 11.61±0.23‡
MIC50 (µg/ml) for Escherichia coli 0.5
Cmax/MIC50 3.07±0.62‡ 3.45±0.70† 3.05±0.48
‡
AUC/MIC50 25.48±3.04‡ 42.42±6.71†; § 53.32±5.55
‡
1Tmax = observed time for Cmax; Cmax= maximum concentration; AUC0-∞= area under the concentration vs. time curve from 0 to infinity; AUC0-24 = area under the concentration vs. time curve from 0 to 24 h; AUMC0-24 = area under moment curve; t1/2elim. = elimination half-life; MRT 0-24 = mean residence time; MIC50 = minimum inhibitory concentration 50 * harmonic mean ± pseudo SD. ‡ significantly different (P<0.05) from Group 3 day 5 § significantly different (P<0.05) from Group 4 † significantly different (P<0.05) from Group 3 day 1
5.4.4 Single SC Administration (Group 5)
Mean plasma concentrations + SD of ENRO after single SC administration at 10 mg/kg are shown in Figure 1. A low inter individual variability was observed in all birds. The ENRO reached the maximum concentrations at approximately 2 h; subsequently, drug levels decreased rapidly, but were still detectable at 24 h after administration with a mean concentration of 0.17 ± 0.03 µg/ml. The pharmacokinetic parameters obtained by mono and noncompartmental analysis are presented in Table 3. The Cmax of 1.73 ± 0.44 µg/ml for ENRO after SC administration was attained at 1.87 ± 0.35 h (Tmax). The mean AUC0–24 and half-life were 16.82 ± 4.05 h∙µg/ml and 6.22 ± 1.36 h, respectively.

96
5.4.5 PK/PD Integration
The PK/PD integrations were calculated for the different trials, based on PK parameters and MIC50 value; the values are presented in Tables 3 and 4. The MIC50, defined by the broth microdilution method for 235 avian E. coli strains isolated in Italy and reported by Vanni et al. (2014), resulted in 0.5 μg/ml, and this value was used for PK/PD correlation. Statistical differences (P< 0.05) in the Cmax/MIC50 and AUC/MIC50 ratio were observed when the dose was doubled for the gavage and only in the AUC/MIC50 ratio between oral gavage and SC administration. For the 10-h pulsed administrations, the Cmax/MIC50 and AUC/MIC50 ratio were significantly different at d 1 and 5, whereas comparisons with continuous administration reported differences for AUC/MIC50 between 10-h pulsed at d 5 and continuous administration (Table 4).
5.5 Discussion
Unlike in other animal species, biotransformation of ENRO into its active metabolite CIPRO is low in poultry (Carreras et al., 2004; Dimitrova et al., 2007), as also confirmed by the very low amounts of CIPRO recovered (approximately 3–4% of ENRO) in this study. After gavage administration of 2 different doses of ENRO, the increase of Cmax and AUC was related to the dose increase and the concentration-time profiles were similar (Figure 1). Enrofloxacin was rapidly absorbed, Tmax approximately 2 h, in contrast to what was reported for ENRO by Dimitrova et al. (2007) and for danofloxacin by Haritova et al. (2006), where higher values were recorded (Tmax: 6.33 ± 2.5 h for enrofloxacin and 6.0 ± 3.29 h for danofloxacin). Conversely, similar results were obtained for flumequine by the same group of authors (Tmax: 2 h; Ferraresi et al., 2013). The half-life proved to be rather short (t 1/2 elim: 5.27 ± 0.67 and 4.99 ± 0.32 h, groups 1 and 2, respectively), and as expected, was not dependent on the dose given. After SC treatment similar results were obtained, Tmax approximately 2 h and t 1/2 elim 6.22 ± 1.36 h, the maximum concentrations were also comparable, Cmax 1.73 ± 0.44 μg/ml (group 5) versus 1.53 ± 0.31 μg/ml (group 1). The Cmax and AUC0–24 obtained, which were higher compared with those with medicated water (Tables 3 and 4), may indicate that individual treatments by oral gavage or SC administration are suitable for efficacious therapy. However, they are not easily practicable in intensive turkey farming due to the high bird density in the sheds, the need for a high number of trained personnel to individually handle the birds, and the stress caused to the birds. This administration route should be preferably adopted in small groups of birds or for breeders because these have an important genetic impact on the progeny, are expected to live longer, and have an high economic value in the flock. In group 3, the pulsed administration trial showed an AUC0–24 and Cmax increase at d 5 (AUC0–24: from
97
17.28 ± 2.03 to 21.21 ± 3.30 h∙μg/ml; Cmax: from 1.28 ± 0.14 to 1.72 ± 0.37 μg/ml, respectively). These results can be explained by an increase in ENRO concentrations in medicated water due to the low intake of the drug observed at the first day of the trial. In fact, medicated water concentrations were adjusted based on the water intake of previous administrations. The achievement of the targeted dose of 20 mg/kg was never obtained, likely due to the poor palatability of the product and due to the availability of unmedicated water in the remaining 6 h of light period. It is know that drug intake can vary dramatically due to both bird factors (hierarchy, flock size, sex, age, weight, species, breed, health status, and so on) and environmental factors (temperature, humidity, feed and water availability, photoperiod, and so on; Vermeulen et al., 2002). Comparing these results with those by Russo et al. (2012), who assessed the PK of ENRO at the 10 mg/kg via medicated water in healthy and colisepticemic turkeys, a dose proportional increase of Cmax and AUC was observed, whereas Tmax was not affected by dosage. In group 4, the drug concentration in water was adjusted according to water intake and the dose received by the turkeys (21.90 ± 2.31 mg/kg) was close to the targeted dose of 20 mg/kg. Notwithstanding the likely poor palatability of the water, the lack of fresh water forced the birds to drink all the available water and take the targeted dose of ENRO. Compared with pulsed administration at d 5, the 24-h continuous administration of ENRO for 5 d resulted in a longer Tmax 12.2 ± 2.67 h and MRT of 11.61 ± 0.23 h and higher AUC0–24, whereas Cmax was similar. In agreement with several studies on E. coli strains isolated from food-producing animals, a high percentage of strains has proved to be resistant to ENRO (EFSA, 2010; Ozawa et al., 2010). As reported in the co-authored paper by Vanni et al. (2014), 38.7% of E. coli tested was resistant, a percentage lower than that observed with old generation fluoroquinolones (70.2% with flumequine), but confirming an increasing trend since the introduction of fluoroquinolones in poultry. The increase in the prevalence of antimicrobial-resistant pathogenic bacteria in farm animals requires reevaluation of treatment options. As prescribed by EMA (2007) and WHO (2011) in the last sets of guidelines on the prudent use of antimicrobials, fluoroquinolones should be used in turkeys only when a susceptibility test clearly indicates the efficacy of the drug. It was widely accepted that fluoroquinolone dosage regimens that lead to high PK/PD indices as AUC/MIC >125 and Cmax/MIC >8 resulted in less frequent selection of resistant mutants (McKellar et al., 2004). Although specific breakpoints have not been defined for avian colibacillosis, several studies on fluoroquinolones in poultry (Anadon et al., 2001; Dimitrova et al., 2007; Ozawa et al., 2010; Ferraresi et al., 2013) adopted a Cmax/MIC ratio of 8 or 10 and an AUC/MIC ratio of 100 as the minimal values required to prevent the selection of resistant bacteria. As reported in Tables 3 and 4, neither type of administration reached the breakpoint
98
values and the PK/PD correlation yielded unsatisfactory results. After gavage administration, the mean Cmax/MIC50 and AUC0–24/MIC50 ratios were, respectively, 3.07 ± 0.62 and 7.01 ± 1.03, and 25.48 ± 3.04 and 57.2 ± 3.73 for the 10 and 20 mg/kg doses, respectively. After SC administration Cmax/MIC50and AUC0–24/MIC50 ratios were 3.45 ± 0.75 and 33.96 ± 7.46, respectively. After the administration of 10-h pulsed (group 3) or 24-h continuous (group 4) medicated water with the dosage regimen of 20 mg/kg lower values of Cmax/MIC50 (group 3: 3.45 ± 0.70; group 4: 3.05 ± 0.48) and AUC0–24/MIC50 (group 3: 42.42 ± 6.17; group 4: 53.32± 5.55) were obtained. These results were similar to those obtained by Russo et al. (2012). Conversely, data published by Dimitrova et al. (2007) supported the efficacy of 10 mg/kg administered via drinking water to turkeys, but PK/PD results were obtained correlating the kinetic parameters with a value of MIC first reported in 1996 and significantly lower than those adopted in the present study (0.06 versus 0.5 μg/ml). Based on the present results, the EU-recommended dosage of 10 mg/kg might be ineffective to achieve adequate drug plasma concentrations. Also the 20 mg/kg by 10-h pulsed doses of medicated water did not reach plasma concentrations that were completely efficacious in controlling E. coli, the scenario could be even worse when considering the long period with unmedicated water. Indeed, Santos et al. (1997) showed the influence of the photoperiod on the PK of drugs during drinking water administration in turkeys. The eating and drinking patterns can be altered by the light scheme (Classen et al., 1994; Watteyn et al., 2013), which could have a huge influence on the uptake of drinking water medication. Although the results obtained were not completely encouraging, the medicated water should always be provided continuously, as an increase of PK/PD indices was achieved for AUC/MIC. Escherichia coli is generally located in the intestine and active ENRO concentrations undergo a biliary excretion; thus, plasma concentration does not reflect the same magnitude order of intestinal environment. A similar scenario should be foreseen for pulmonary infections, against which ENRO is frequently used. Indeed, plasma concentrations might not be a good predictor of efficacy, as ENRO concentrations and AUC are reported to be higher in lungs than in plasma (Tang et al., 2007). In addition, interesting results were obtained during the validation process of the LC-MS analytical method by detecting ENRO and CIPRO in lung tissue and intestinal content from turkey treated with ENRO (Lucatello et al., 2014). Both CIPRO and ENRO concentration in lung and intestinal content were much higher than in plasma in turkeys killed after ENRO treatment. Therefore, target tissue concentrations need to be evaluated to define the efficacy of ENRO treatment against colibacillosis. All the treatment scheme evaluated in this study, based on plasma concentration, were not completely
99
satisfactory against E. coli, supporting the unsuitability of the ENRO-recommended dosage scheme. Thus, to improve treatment efficacy and comply with the prudent and responsible use of fluoroquinolones in poultry species, a revision of the ENRO dosage scheme, which includes an extensive distribution study in the target tissues (i.e., intestine and lung), is advisable for a real efficacy evaluation against colibacillosis.
5.6 Acknowledgments
This work was supported by the grant from the Italian Ministry of Higher Education and Research (PRIN 2009, 2009R4KM4F_002).
5.7 References
Anadon, A., M. R. Martinez-Larranaga, J. Iturbe, M. A. Martinez, M. J. Diaz, M. T. Frejo, and M. Martinez. (2001). Pharmacokinetics and residues of ciprofloxacin and its metabolites in broiler chickens. Res. Vet. Sci. 71:101–109.
Bass, L., C. A. Liebert, M. D. Lee, A. O. Summers, D. G. White, S. G. Thayer, and J. J. Maurer. (1999). Incidence and characterization of integrons, genetic elements mediating multiple-drug resistance, in avian Escherichia coli. Antimicrob. Agents Chemother. 43:2925–2929.
Carreras, I., M. Castellari, J. A. Garcıa Regueiro, L. Guerrero, E. Esteve-Garcia, and C. Sarraga. (2004). Influence of enrofloxacin administration and α-tocopheryl acetate supplemented diets on oxidative stability of broiler tissues. Poult. Sci. 83:796–802.
Charleston, B., J. J. Gate, I. A. Aitken, B. Stephan, and R. Froyman. (1998). Comparison of the efficacies of three fluoroquinolone antimicrobial agents, given as continuous or pulsed-water medication, against Escherichia coli infection in chickens. Antimicrob. Agents Chemother. 42:83–87.
Classen, H. L., C. Riddell, F. E. Robinson, P. J. Shand, and A. R. McCurdy. (1994). Effect of lighting treatment on the productivity, health, behaviour and sexual maturity of heavy male turkeys. Br. Poult. Sci. 35:215–225.
Council of Europe. (2007).Appendix A to the European Conventions for the Protection of Vertebrate Animals used for Experimental and Other Scientific Purposes (ETS No. 123). Guidelines for Accommodation and Care of Animals (Art. 5 of the Convention).
Dimitrova, D. J., L. D. Lashev, S. G. Yanev, and B. Pandova. (2007). Pharmacokinetics of enrofloxacin in turkeys. Res. Vet. Sci. 82:392–397.
EMA (European Medicines Agency). (2006). Public statement on the use of (fluoro)quinolones in food-producing animals in the European Union: Development of resistance and impact on human and animal health. EMEA/CVMP/SAGAM/184651/2005- CONSULTATION. Accessed Apr. 28, 2013. http://www.ema.europa.eu/docs/en_GB/document_library /Public_statement/2009/10/WC500005152.pdf.
100
European Commission. (2002). European Commission Decision 2002/657. Off. J. Eur. Commun., L 221 (2002) 8. Accessed Mar. 25, 2013. http://eur-lex.europa.eu/LexUriServ/LexUriServ.do?uri=OJ:L:2002:221:0008:0036:EN:PDF.
European Food Safety Authority. (2010). The Community Summary Report on antimicrobial resistance in zoonotic and indicator bacteria from animals and food in the European Union in 2004–2007. Accessed Mar. 25, 2013. http://www.efsa.europa.eu/en/efsajournal/doc/1309.pdf.
Ferraresi, C., L. Lucatello, V. Meucci, L. Intorre, G. Grilli, A. Piccirillo, E. Russo, R. Villa, C. Montesissa, and P. Cagnardi. (2013). Pharmacokinetic/pharmacodynamic evaluation of the efficacy of flumequine in treating colibacillosis in turkeys. Poult. Sci. 92:3158–3165.
Gibaldi, M., and D. Perrier. (1982). Pharmacokinetics. Marcel Dekker Inc., New York, NY.
Haritova, A. M., N. V. Rusenova, P. R. Parvanov, L. D. Lashev,and J. Fink-Gremmels. (2006). Pharmacokinetic-pharmacodynamic modelling of danofloxacin in turkeys. Vet. Res. Commun. 30:775–789.
Lam, F. C., C. T. Hung, and D. G. Perrier. (1985). Estimation of variance for harmonic mean half-lives. J. Pharm. Sci. 74:229–231.
Lohren, U., A. Ricci, and T. S. Cummings. (2008). Guidelines for antimicrobial use in poultry. L. Guardabassi, L. B. Jensen, and H. Kruse, ed. Pages 126–142 in Guide to Antimicrobial Use in Animals. Blackwell Publishing, Oxford, UK.
Lucatello, L., P. Cagnardi, F. Capolongo, C. Ferraresi, F. Bernardi, and C. Montesissa. (2014). Development and validation of a LC/MS/MS/MS method for the quantification of fluoroquinolones in several matrices from treated turkeys. Food Contr. http://dx.doi.org/10.1016/j.foodcont.2014.04.011.
Lucatello, L., P. Cagnardi, F. Capolongo, and C. Montesissa. (2013). Fluoroquinolone residue detection by LC-MS/MS/MS in treated turkeys. Page 452 in Sixth International Symposium on Recent Advances in Food Analysis (RAFA), Prague, Czech Republic, 5–8 November 2013. Book of Abstracts.
Lutful Kabir, S. M. (2010). Avian colibacillosis and salmonellosis: A closer look at epidemiology, pathogenesis, diagnosis, control and public health concerns. Int. J. Environ. Res. Public Health 7:89–114.
Martinez, M., P. McDermott, and R. Walzer. (2006). Pharmacology of the fluoroquinolones: A perspective for the use in domestic animals. Vet. J. 172:10–28.
McKellar, Q. A., S. F. Sanchez Bruni, and D. G. Jones. (2004). Pharmacokinetic/pharmacodynamic relationships of antimicrobial drugs used in veterinary medicine. J. Vet. Pharmacol. Ther. 27:503–514.
Ozawa, M., K. Baba, Y. Shimizu, and T. Asai. (2010). Comparison of in vitro activities and pharmacokinetics/pharmacodynamics estimations of veterinary fluoroquinolones against avian pathogenic Escherichia coli isolates. Microb. Drug Resist. 16:327–332.
Russo, E., L. Lucatello, D. Giovanardi, P. Cagnardi, G. Ortali, V. Di Leva, and C. Montesissa. (2012). Approved medication of water with enrofloxacin to treat turkey colibacillosis: Assessment of efficacy using a PK/PD approach. Vet. Microbiol. 161:206–212.
101
Santos, M. D., H. Vermeersch, J. P. Remon, M. Schelkens, P. De Backer, R. Ducatelle, and F. Haesebrouck. (1997). Administration of doxycycline hydrochloride via drinking water to turkeys under laboratory and field conditions. Poult. Sci. 76:1342–1348.
Tang, S., Y. Zhou, R. Li, Q. Chen, and X. Xiao. (2007). Pharmacokinetics and lung-targeting characterization of a newly formulated enrofloxacin preparation. J. Vet. Pharmacol. Ther. 30:443–450.
Toutain, P. L., J. R. E. Del Castillo, and A. Bousquet-Melou. (2002). The pharmacokinetic–pharmacodynamic approach to a rational dosage regimen for antibiotics. Res. Vet. Sci. 73:105–114.
Vanni, M., V. Meucci, R. Tognetti, P. Cagnardi, C. Montesissa, A. Piccirillo, A. M. Rossi, D. Di Bello, and L. Intorre. (2014). Fluoroquinolone resistance and molecular characterization of gyrA and parC quinolone resistance-determining regions in Escherichia coli isolated from poultry. Poult. Sci. 93:856–863.
Vermeulen, B., P. De Backer, and J. P. Remon. (2002). Drug administration to poultry. Adv. Drug Deliv. Rev. 54:795–803.
VICH GL 49. (2012-Final), Guidance for Industry, Studies to evaluate the metabolism and residue kinetics of veterinary drugs in food producing animals: Validation of analytical methods used in residue depletion studies, February 2011. Accessed Feb. 20, 2012. http://www.vichsec.org/en/guidelines2.htm.
Walker, R. D., G. E. Stein, J. G. Hauptman, and K. MacDonald. (1992). Pharmacokinetic evaluation of enrofloxacin administered to healthy dogs. Am. J. Vet. Res. 53:2315–2319.
Walsh, C., and S. Fanning. (2008). Antimicrobial resistance in foodborne pathogens—A cause for concern? Curr. Drug Targets 9:808–815.
Watteyn, A., E. Russo, A. Garmyn, S. De Baere, F. Pasmans, A. Martel, F. Haesebrouck, C. Montesissa, P. De Backer, and S. Croubels. (2013). Clinical efficacy of florfenicol administered in the drinking water against Ornithobacterium rhinotracheale in turkeys housed in different environmental conditions: A pharmacokinetic/pharmacodynamic approach. Avian Pathol. 42:474–481. http://dx.doi.org/10.1080/03079457.2013.823144.
World Health Organization. (2011). World health day 2011. In UrgentAction to Safeguard Drug Treatments, WHO, Geneva. Accessed Mar. 20, 2013. http://www.who.int/mediacentre/news/releases/2011/whd_20110406/en/index.html.
Yamaoka, K., T. Nakagawa, and T. Uno. (1978). Application of Akaike’s information criterion (AIC) in the evaluation of linear pharmacokinetic equations. J. Pharmacokinet. Biopharm. 6:165–175.

102
General Discussion
CHAPTER 6
103
6. General discussion
The emergence of antimicrobial resistance in commensal and pathogenic bacteria is a growing concern in both human and veterinary medicine and it is primarily correlated with the use of antimicrobials in humans and animals. In human and veterinary medicine the use of antimicrobial agents is often correlated and many antimicrobials used in humans are often authorized for companion and farm animals. This correlation is worrying for the repercussions on resistance phenomenon. The deep comprehension of antimicrobial effects and the rise of antimicrobial resistance in food producing species and in humans, encouraged international agencies to review the use of authorized antimicrobial drugs in veterinary and human practice. In human and veterinary medicine many studies have been carried out to define precise dosages, to improve drug activity and reduce selection of resistance in antimicrobial therapy. Although considered ideal, the individual administration is not a viable treatment in poultry breeding due to the high number of animals bred and the low cost of individual animals compared to the high management cost of individual therapy. Therefore oral mass medication is still used and preferred. In poultry the preferred method of oral mass treatment is drinking water medication, because ill birds usually tend to stop feeding but not drinking. Drinking water therapy can vary dramatically in response of efficacy as a function of several factors, such as photoperiod schema, chemical characteristics of water and preparation of medical solution. Consequently, the underdosing of the drug is likely, and such risk must be considered and limited as much as possible (i.e. accurate weighting of the animals to determine the correct drug dosage, correct consideration of water intake, etc.). Another important aspect to consider in order to optimize antimicrobial therapy, is the assessment of the bacterial susceptibility (MIC or antibiogram) aimed at knowing whether the selected drug will be effective or not. The potential for rapid spread of disease in avian species often needs empirical and rapid treatment prior to the results of bacterial culture and susceptibility testing. The studies reported in this thesis aimed to evaluate the use of fluoroquinolones in turkey to maintain the efficacy and reduce the spread of resistance against E.Coli, in accordance with a prudent use of this drugs as suggested by the European Guidelines (EMA, 2011). In the trials, the pulsed water medication has highlighted the failure to achieve the target dose intake by animals, likely due to the poor palatability of the products and due to the availability of “clean water” in the remaining light period. This is certainly an important aspect that can promote the underdosing with consequent increase of selective pressure leading to an increase in the

104
antimicrobial resistance. Therefore the medicated water should always be provided continuously during the entire light period. The data obtained by oral treatments at two different doses (15 mg/kg and 30 mg/kg) with flumequine showed how the breakpoints values (Cmax/MIC ratio and AUC/MIC ratio) were not reached. Despite its use suggests that clinical efficacy is still achievable, the PK/PD correlation yielded very unsatisfactory results, especially considering the high MIC values that indicate a widespread of antimicrobial resistance. These findings are not totally unexpected, since flumequine was licensed for use in food animals over 20 years ago and has been widely used for the mass medication of poultry. Following these results, the continuous administration with flumequine was not tested. .In tissue samples higher concentrations were achieved and this result are more encouraging and can justify the repeated use of this antimicrobial in breeding. It would be desirable, since the low sensitivity and the possibility of cross-resistance against other fluoroquinolones, that flumequine would be used more prudently in farms. The oral treatments and the single parenteral treatment using two different doses of enrofloxacin (10 mg/kg and 20 mg/kg) were not completely satisfactory against E. coli. To improve the efficacy of the treatment and to comply with the prudent and responsible use of fluoroquinolones in poultry species, a revision of the enrofloxacin dosage scheme is advisable for a real efficacy evaluation against colibacillosis. Fluoroquinolones concentrate in the some tissues, as lung and intestine, as confirmed by the results of this thesis. These tissues are target tissue of the antimicrobial effects of fluoroquinolones. So as for flumequine, also for enrofloxacin this account for the efficacy of the treatment, notwithstanding the unsatisfactory results of the PK/PD correlation with plasma results. Based on these aspects, further studies on the drug concentrations profile in liver, lung and intestinal content would be helpful to allow the integration of PK/PD data, in order to evaluate the real efficacy of flumequine and enrofloxacin against colibacillosis. It should be underlined that the determination of bacterial susceptibility is one of the two mainstay for the PK/PD correlation for the evaluation of antimicrobial efficacy. Thus the re-examination of susceptibility of bacteria with specific values of MIC that become breakpoints for determining “susceptibility”, “intermediate” or “resistance” of specific bacteria can help to set realistic values for decision making of the correct choice of antimicrobial therapy. The CLSI-VAST subcommittee has been setting breakpoints for the new and old veterinary drugs, this is an important step forward in the evaluation of antimicrobial therapy, as realistic breakpoints are necessary in order to avoid ineffective administration of antibiotics that only serve to select for other resistant bacteria and contaminate the environment (CLSI, 2013).

105
Finally, the reported studies allowed to highlight important aspects about the usage and efficacy of antimicrobial drugs in turkey, that were still lacking. A further diffusion of this type of studies is even more relevant for the so called “minor species”. It is possible to conclude that fluoroquinolones, and enrofloxacin in particular, represent an useful tools for the treatment of various infections in turkey, but their efficacy should be accurately monitored due to the spreading of resistance in zoonotic bacteria. Moreover, any lack of efficacy should be reported by pharmacovigilance and, if possible, the causes should be deeply investigated. This can represent an important instrument for monitoring drug resistance in the target species and to retain the potential efficacy of fluoroquinolones for critically dangerous bacteria.

106
Summary
CHAPTER 7

107
108
7. Summary
The importance of prudent and rational use of antimicrobial is important, not only to safeguard the efficacy of these drugs in humans and veterinary medicine but, even more so, to prevent the emergence and spread of undesirable resistance phenotypes in zoonotic pathogens as well as in commensal bacteria that can be transmitted between animals and humans. Even more importance and attention is now given to the prudent use of medically important antimicrobial drugs, referring to those drugs for human therapeutic use. The fluoroquinolones belong to this category. These are very potent antimicrobials and active against a wide range of pathogenic organisms and are well distributed in the body after administration. This class of antimicrobials has a therapeutic effect on most infections in different organs or tissues. Although it is rare that fluoroquinolones are the only available agent for treatment of a specific infectious disease, fluoroquinolones are important alternative medicinal products for a veterinarian to have as option for treatment. Fluoroquinolones have a unique mechanism of action not related to conventional antimicrobials, and therefore their efficacy should be retained as long as possible. The avian production increased enormously in the last 50 years and the European Union (EU) is one of the world's top producers in poultry meat and a net exporter of poultry products. In this production, turkeys that is considered a “minor species”, but it is important in the livestock production of Italy. Scarce data exist about the usage of antimicrobial drugs in turkey and even less is known about their efficacy. As the limited number of medicinal products authorized in this species, antimicrobial therapy is frequently carried out with the few products authorized or with drugs “extra-label” used with the consequence of increases of selective pressure and also with the possibility of cross-resistance within the same pharmacological group of compounds. The studies reported in this thesis aimed to revise the use of fluoroquinolones in turkey to maintain the efficacy and reduce the spread of resistance against E.Coli, the most common zoonotic avian pathogen. Pharmacokinetic(PK)/pharmacodynamics (PD) models are the best tool in order to select optimal dosage regimen. To confirm dosages used at farms and allow the integration of PK/PD data, the plasma concentrations in blood from healthy animals collected during treatment with flumequine and enrofloxacin, were determined. The first step was to optimize and validate a fast, simple, sensitive, and specific liquid chromatography-mass spectrometry (LC-MS)/MS/MS method suitable for the detection of a wide range of concentrations of fluoroquinolones as those occurring in pharmacokinetic and residue depletion studies from several

109
matrices. The first trial presents a sensitive and reliable confirmatory method for the extraction, identification, quantification of five fluoroquinolones . For the extraction and matrix clean-up of fluoroquinolones residues from all biological matrices, the Quick Easy Cheap Effective Rugged Safe (QuEChERS) methodology was adopted; only for plasma samples acetonitrile was used. The analyses were performed by (LC-MS. LC separation was performed on a C18 Kinetex column (100x2.1 mm, 2.6 µm, Phenomenex, CA, USA) with gradient elution using ammonium acetate solution (10 mM, pH 2.5) and methanol containing 0.1% formic acid. Mass spectrometric identification was done using an LTQ XL ion trap (Thermo Fisher Scientific, CA, USA), with a heated electrospray ionization probe, in positive ion mode. The method was validated according to the European Legislation (decision 2002/657/EC) and EMA guideline (EMA/CVMP/VICH/463202/2009); selectivity, linearity response, trueness (in terms of recovery), precision (within-day repeatability and within-laboratory reproducibility), limit of detection, limit of quantification, decision limits, detection capability, absolute recovery and robustness were evaluated using turkey blank matrices. All data were within the required limits established for confirmatory methods except for flumequine which presented a recovery value slightly higher than 110% in muscle and intestinal content. For all fluoroquinolones, all the extraction rates were greater than 70% and limits of quantification ranged from 1.2 µg/kg to 118.8 µg/kg. This method was suitable for the identification and quantification of fluoroquinolones in plasma samples of turkeys treated for the purpose of second and third trials. In the second trial, the PK behavior of flumequine administered to 32 healthy turkeys as an oral bolus via gavage or as 5 days of 10-hours pulsed administration in drinking water were compared, using the EU authorized dose of 15 mg/kg and the double dose of 30 mg/kg. The MIC of 235 Escherichia coli field strains isolated from poultry were determined for PD to develop a PK/PD model. Blood samples were collected at established times over 24 h, and the obtained plasma was analyzed using the LC-MS/MS/MS method previously described. A monocompartmental model and a noncompartmental model were applied to the data to obtain the PK results. The maximum concentration (Cmax)/MIC50 and the plasma concentration-time curve from 0 to 24 hours (AUC0–24)/MIC50 ratios were, respectively, 0.67 ± 0.09 and 4.76 ± 0.48 and 1.18 ± 0.35 and 7.05 ± 2.40 for the 15 and 30 mg/kg bolus doses, respectively. After 10-hours pulsed administration of 15 mg/kg, values of Cmax/MIC50, 0.19 ± 0.02 on day 1 and 0.30 ± 0.08 on day 5 of therapy were obtained, the AUC/MIC50 ratios were 2.09 ± 0.29 and 3.22 ± 0.93 on d 1 and 5, respectively. Higher values were obtained with the doubled dose of 30 mg/kg: the Cmax/MIC50 ratios were 0.49 ± 0.11 on day 1 and 0.69 ± 0.18 on day 5; the AUC/MIC50 ratios were 5.15 ± 1.15 and 6.57 ± 1.92 on d 1 and 5, respectively. For both types of administration and both

110
dosages, the Cmax/MIC50 and the AUC/MIC50 ratios achieved were significantly lower than the fluoroquinolones breakpoints usually considered for efficacy. The last trial involving 50 healthy turkeys, was conducted to evaluate the efficacy of enrofloxacin. As in the previous study, the effectiveness of different treatment schemes against E. coli was evaluated by a PK/PD approach, correlating the PK results with the MIC determined for 235 E. coli strains. In this study, 3 different oral treatments (a single oral gavage, 5 days of 10-hours pulsed water medication, and 5 days of 24-hours continuous water medication) and single parenteral (subcutaneous; SC) treatment using 2 different doses of enrofloxacin (i.e., the EU authorized dose, 10 mg/kg, and double the EU recommended dose, 20 mg/kg) were evaluated. Blood samples were collected at established times over 24 h. Plasma was analyzed using a LC-MS/MS/MS that was validated in house. A monocompartmental and a noncompartmental model were applied to the data to obtain the PK results. After gavage administration, the mean maximum concentration Cmax/MIC50 and area under the curve AUC0–
24/MIC50 ratios were, respectively, 3.07 ± 0.62 and 7.01 ± 1.03 and 25.48± 3.04 and 57.2 ± 3.73 for the 10 and 20 mg/kg doses, respectively. After SC administration of 10 mg/kg, Cmax/MIC50 and AUC0–24/MIC50 ratios were 3.45 ± 0.75 and 33.96 ± 7.46, respectively. After the administration of 10-h pulsed or 24-h continuous medicated water at 20 mg/kg, lower values of Cmax/MIC50 (10-h pulsed: 3.45 ± 0.7; 24-h continuous: 3.05 ±0.48) and AUC0–24/MIC50 (10-h pulsed: 42.42 ± 6.17; 24-h continuous: 53.32 ± 5.55) were obtained. Based on these results, the European Union-recommended dosage of 10 mg/kg seems ineffective to achieve adequate drug plasma concentrations and even the 20 mg/kg by 10 h pulsed or continuous medicated water administration did not reach completely efficacious concentrations in plasma against colibacillosis. Although the results obtained were not completely encouraging, the medicated water should preferably be provided continuously. To conclude about the efficacy of enrofloxacin treatment against colibacillosis, target tissue concentration should be extensively considered.

111