Embed Size (px)
Citation preview

1
Province of the Eastern Cape
DEPARTMENT OF EDUCATION
ISEBE LEZEMFUNDO
DEPARTMENT VAN ONDERWYS
MATHEMATICS
TERM 3
SENIOR PHASE LESSON PLAN EXEMPLARS
JUNE 2009

2
INTRODUCTION The Eastern Cape Department of Education, Curriculum Chief Directorate in collaboration with the District curriculum personnel developed this document to support teachers’ planning, teaching and assessment for effective implementation of the National Curriculum Statement in the GET Band. The document contains exemplars of lesson plans with activities on each assessment standard in all learning outcomes. It is prepared with the intention to give necessary guidance for lesson planning for Term 3 in accordance with the provincial work schedule. This document must be used as a guide in collaboration with the following documents: National Curriculum Statement. NCS Teacher’s Guide for the development of Learning Programmes, National Assessment Policy, Provincial Assessment Guidelines, Provincial Planning Document. This can be adapted to suite the teacher’s condition and contextual demands of the school.. It is a guide to assist teachers in lesson planning. An exemplar is an illustration of how planning could be done, it is not cast on stone. Critical engagement with the document is encouraged.

3
NOTE TO THE TEACHER
Ensure that Mathematics is taught daily for 1 Hour as according to policy. Daily classwork and homework should be given, marked and feedback be given to learners in order to ensure effective remedial work is done. Informal assessment tasks that culminate into Formal assessment tasks should be given at regular intervals. Consult as many text books as possible as well as other support material including internet, where possible when developing lessons. Please do not rely on one textbook only when planning lesson activities. Whenever possible, learners should be encouraged to get messy, in order to formulate their own meaningful concepts. . The teacher should assist learners in formalising their crude formulations as meaningful learning is the construction of the learner embedded in his previous experience .Learners misconceptions should be attended to before they become solidified. The teacher should challenge misconceptions with engaging discourse Some of the lesson plans encourage investigative approach to learning whenever possible. Activities in the lesson plan exemplars are a guide that helps to scaffold the teacher in developing other related activities. This guide is not cast on stone as context and other critical factors might have an influence. Critical engagement with the document is encouraged.
4
TABLE OF CONTENTS
1 INTRODUCTION 2 2 NOTE TO THE TEACHER 3 3 GRADE 7
3.1 Content Overview 5 3.2 Lesson plan Exemplars 7 3.3 Assessment Task Exemplar 32
4 GRADE 8 4.1 Content Overview 36
4.2 Lesson Plan Exemplars 38
4.3 Assessment Task Exemplar 59
5 GRADE 9 5.1 Content Overview 61
5.2 Lesson Plan Exemplars 62
5.3 Assessment Task Exemplar 79

5
TERM 3
GRADE 7 MATHEMATICS LESSON PLAN EXEMPLARS: CONTENT OVERVIEW
TERM 1 TERM 2 TERM 3 TERM 4
LO1 Counting backwards and forwards in decimal intervals and integers Description and illustration of historical development of numbers (e.g integers, common fractions) Recognition, classification and representation of numbers (integers, decimals to at least 3 dec place) fractions and percentages in order to describe and compare them. Factors including prime factors of 3 digit numbers Recognition and use of equivalent forms of rational numbers. Recognition, description and use of: equivalent fractions including common fractions, decimals and percentages LO2 Investigation and extension of numeric and geometric patterns
LO 1 Profit & loss, budgets, accounts, loans, simple interest, higher purchase, exchange rates, ratio and rates. LO2 Draw tables , flow diagrams to describe relationships, Look for pattern, describe in own words the relationship and make conjectures Mathematical Modelling in various context Problem solving LO3 Transformation (rotation, reflection, and translation) and symmetry to investigate properties of geometric figures Recognition and description of and differentiation between congruent and similar figures
LO1 Rounding off numbers to at least 1 decimal place. Multiple operations with integers Addition, subtraction and multiplication of decimal fractions and common fractions. Division of positive decimals by whole numbers Percentages Exponents. Mental calculations involving squares to at least 122 and cubes to at least 53
LO2 Determination, analysis and interpretation of the equivalence of the same rule in different ways (verbally, in flow diagrams, in tables and by equations or expressions).
LO1 Calculations using a range of techniques involving the commutative , associative and distributive properties with positive rational numbers and zero; also a calculator. Use of algorithms to find equivalent fractions LO 2 Description of a situation by interpreting graphs Drawing of graphs LO 3 Consolidation Drawing and interpretation of sketches of solids in different perspective. Location of positions on co-ordinate systems and maps using compass direction

6
to find relationships and to formulate rules, not limited to sequences involving constant difference or ratio; ( In the natural and cultural contexts or learners’ own creation) Learners justify their conjectures LO3 Naming and exploring geometric shapes Similarities and differences between different polyhedra,and all quadrilaterals. Classification of geometric figures and solids in terms of properties. Construction of geometric figures and designing of nets to make models LO4 Problem solving including : Time , distance, speed , length , Perimeter of polygons LO5 Selection and use of appropriate methods to collect data. Designing and using of questionnaires to collect data, record using tables and stem-and leaf displays Samples and populations
LO4 Calculations on perimeter, of various polygons Area of a square and surface area rectangle square triangle . Volume of the following right prisms: Triangular and Rectangular and cube LO 5 Determination and identification of measures of central tendency viz.: Median, mode, range and mean Drawing of graphs viz.: bar graphs histograms pie charts line and broken line graphs Critical reading and interpretation of data to draw conclusions and make predictions.
LO3 Drawing and interpretation of sketches of solids in different perspective. Location of positions on co-ordinate systems and maps using Cartesian plane and compass directions LO 4 Interrelationship between perimeter, area, surface area and volume in geometric solids LO5 Theory of probability - listing possible outcomes and determine relative frequency.
LO4 Classification of different angles into acute, right, obtuse, straight, reflex and revolution Estimation, comparison, measurement and drawing of angles accurate to one degree using protractors. LO5 Consolidation: Theory of probability -listing possible outcomes and determine relative frequency

7
LESSON PLAN EXEMPLARS
WEEK LO’s & AS’s CONTENT ACTIVITIES
1 – 4
Cluster 4:LO 1 7.1.7 Estimates and calculates by selecting and using operations appropriate to solving problems that involve:
• Rounding off numbers to at least one decimal place; • Multiple operations with integers • Addition, subtraction and multiplication of common
fractions; • Addition, subtraction and multiplication of positive
decimals to at least 2 decimal places; • Division of positive decimals with at least 3 decimal
places by whole numbers; • Finding percentages; • Exponents
7.1.8 Performs mental calculations involving squares of natural numbers to at least 102 and cubes of natural numbers to at least 53. 7.1.10 Uses a range of strategies to check solutions and judges the reasonableness of solutions.
Rounding off numbers to at least one decimal place. Multiple operations with integers Addition, subtraction and multiplication of common fractions. Addition, subtraction and multiplication positive decimals to at least 2dec places Division of positive decimals (at least 3 dec places) by whole numbers Percentages Exponents. Mental calculations involving squares to at least 102 and cubes to at least 53
.Activity 1 Rounding off to at least one decimal place. Activity 2 Introduction to addition of integers Activity 3 Introduction of multiplication and division of integers Activity 4 Addition , subtraction and multiplication of common fractions
Activity 5 Addition, subtraction and multiplication of positive integers (at least 2dec places). Division of 3 dec place numbers by a whole number Activity 6 Percentages Activity 7 Exponents

8
Activity 1 a)Teacher does revision on the rounding off to the nearest 5, 10, 100 and 1000 as this was done in Grade 6. The teacher recaps on place value from two decimal places to 9 digit numbers as done in grade 6 by using the table below. The teacher may also use an abacus.
For example: 6 743,21; 2 347 580, 78; 549 201, 06
M HTH TTH TH H T U , t h th
6 7 4 3 2 6 8 2 3 4 7 5 8 0 7 5 0 5 4 9 2 0 7 0 6 3
Abacus demonstration of place value b)The teacher uses the table drawn by the learners to extend the concept of rounding off to 1st decimal place. For example: i.6 743,268 becomes 6743, 3 ii. 2 347 580,756 becomes 2 347 580, 8 iii. 549 207,063 becomes 549 207,1 Correct to the 2nd dec place iv. 0,146 becomes 0,15 v.5 492,071 becomes 5 492,07
9
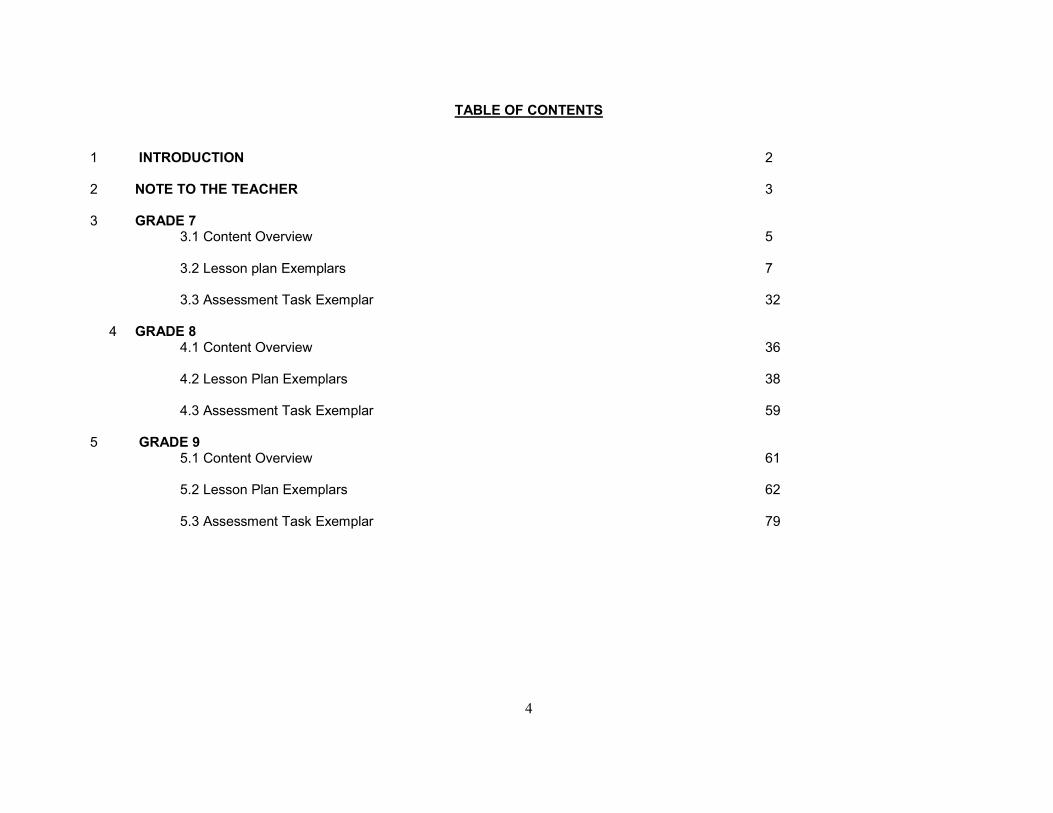
The rule: Whenever you a
numbers with the same sign
you only add the numbers
and keep the sign.
The teacher gives more examples to the learners. Activity 2 a) Multiple operations with whole numbers for example (180 ÷ 15) x (9 – 7) = 24. The teacher gives more examples to the learners. The
teacher extends this activity to include negative numbers b) The teacher gives an activity on addition of positive integers. For example 1682 + 570 =? Teacher recaps on the values of integers e.g. -5 is bigger than -10. Give other examples by using representation on a number line. The teacher sets a scenario such as an overdraft facility to introduce addition of negative integers. Example: Mr. Oliver owes the bank R5 220. He further borrows R2 370. How much does he owe the bank? Thus Mr Oliver owes R5 220.00 and owes R2 370.00 totalling R5 590.00. In Mathematical Language it means - R5 220 + (-R2 370.00)= - R5 590.00. The teacher can use any other scenarios to bring forth the meaning of addition of negative numbers. Alternatively the teacher uses a number line to introduce the concept of adding numbers with same sign Example:
-4+(-2)= -6 Give more examples are given using number line and later without using the number line Examples:
-5 + (- 16) = - 21 -2a + (-34a) = -36a -8z + (-21z) + (-13z) = - 42z
Teacher asks learners to present own observation to formulate a rule. The teacher consolidates and gives more activities.
10
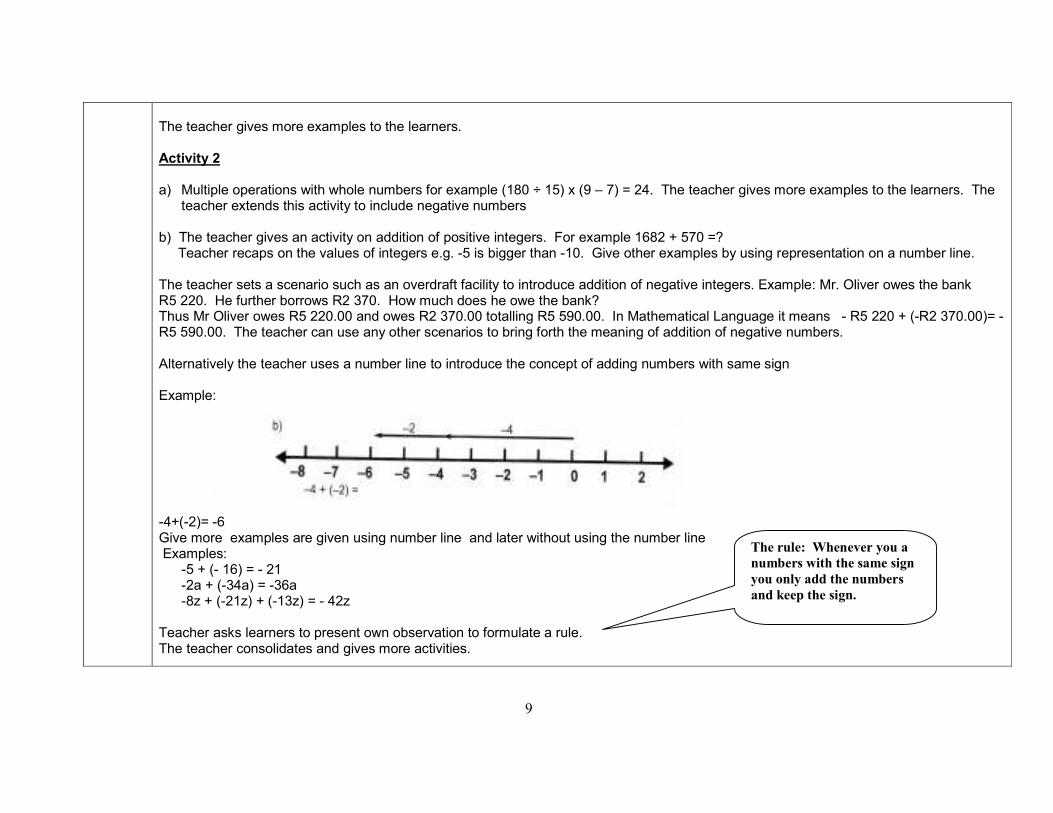
Rule: Whenever you add numbers with
different signs you subtract the smaller
number from the bigger number and take
the sign of the bigger number.
a. The teacher introduces addition of positive and negative numbers by using number lines. In the example above, 5 + (-3) = 2 In this example 3+(-8)= -5 The teachers gives more examples of this nature. Learners make their observations and come up with the rule. The teacher consolidates and gives more activities. Activity 3 Introduction of multiplication of integers: The teacher draws the following on the board for learners to complete:
11
+ × + = +
+ × – = –
– × – = +
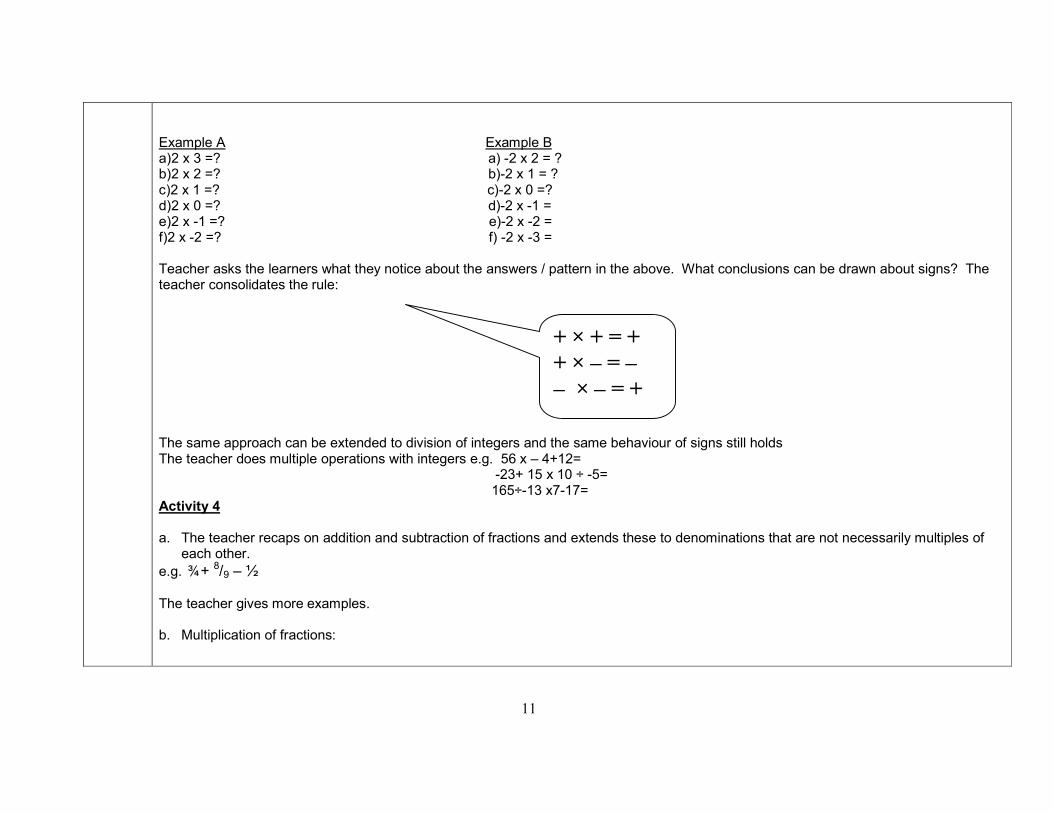
Example A Example B a)2 x 3 =? a) -2 x 2 = ? b)2 x 2 =? b)-2 x 1 = ? c)2 x 1 =? c)-2 x 0 =? d)2 x 0 =? d)-2 x -1 = e)2 x -1 =? e)-2 x -2 = f)2 x -2 =? f) -2 x -3 = Teacher asks the learners what they notice about the answers / pattern in the above. What conclusions can be drawn about signs? The teacher consolidates the rule: The same approach can be extended to division of integers and the same behaviour of signs still holds The teacher does multiple operations with integers e.g. 56 x – 4+12= -23+ 15 x 10 ÷ -5= 165÷-13 x7-17= Activity 4 a. The teacher recaps on addition and subtraction of fractions and extends these to denominations that are not necessarily multiples of
each other. e.g. ¾+ 8/9 – ½ The teacher gives more examples. b. Multiplication of fractions:

12
The teacher uses a number line to explain the concepts e.g. ¾ = ¼ + ¼ + ¼ = 3 x ¼ 4/5= 1/5+
1/5 +1/5+
1/5= 4 x1/5 Note: 3 x ¼=3/4= 3x1 and 4 x1/5=
4/5 = 4x1 1x4 5x1 Thus 3/4x
4/5= 3x4 =12=3 4x5 20 5 Alternatively learners investigate the following by folding A4 papers and shade e.g
1/2 of 1= 1/2 of 2 = 1/2 of 1/2 = 1/3 of 1/2 = 1/2 of 2/3 = 3/4 of 2/5 = Learners share their observations and generate a rule. The teacher gives more activities, extends the concept of “of” to multiplication and consolidates the rule Activity 5 a)Recap on addition and subtraction of positive decimals done in Grade 6 b) Teacher recaps on division of whole numbers done in Grade 6 c)The teacher introduces multiplication of positive decimals (2 decimal places) and division of positive decimals (3 decimal places) by whole numbers: i)1,39 x 5 1,39 = 139 ÷ 100
When multiplying fractions, multiply numerators and denominators separately and if there is a common factor then
simplify.
13
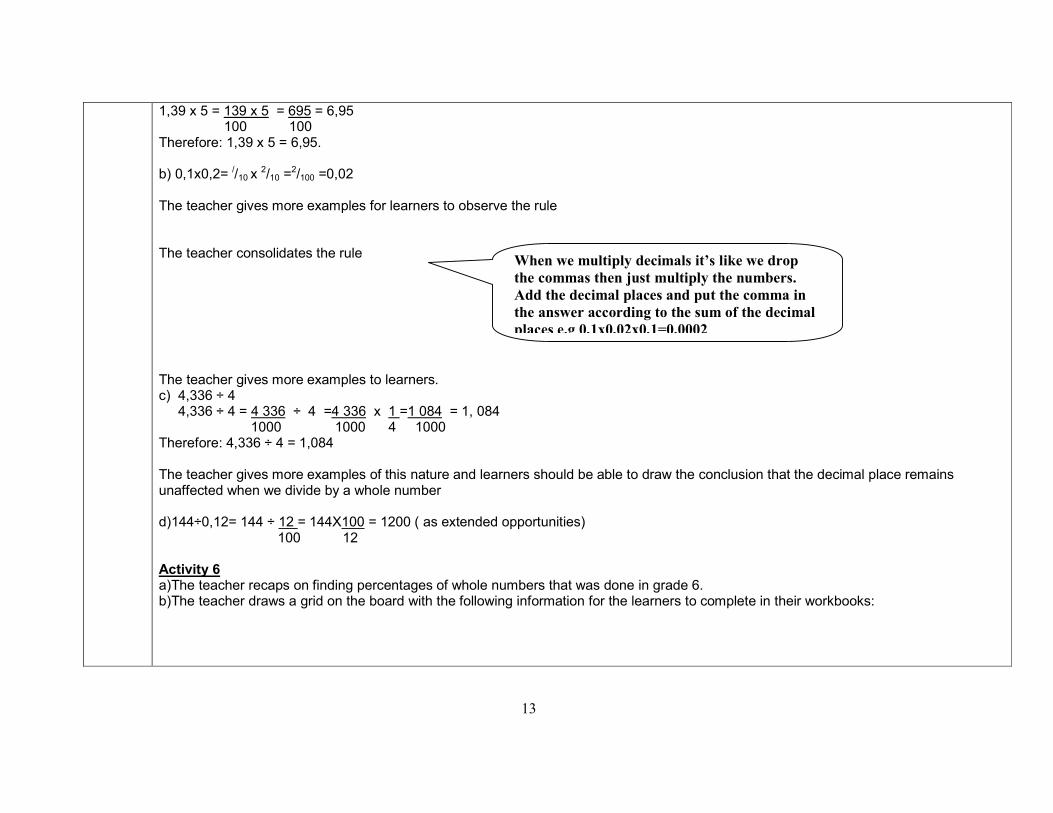
1,39 x 5 = 139 x 5 = 695 = 6,95 100 100 Therefore: 1,39 x 5 = 6,95. b) 0,1x0,2= //10 x 2/10 =
2/100 =0,02 The teacher gives more examples for learners to observe the rule The teacher consolidates the rule The teacher gives more examples to learners. c) 4,336 ÷ 4 4,336 ÷ 4 = 4 336 ÷ 4 =4 336 x 1 =1 084 = 1, 084 1000 1000 4 1000 Therefore: 4,336 ÷ 4 = 1,084 The teacher gives more examples of this nature and learners should be able to draw the conclusion that the decimal place remains unaffected when we divide by a whole number d)144÷0,12= 144 ÷ 12 = 144X100 = 1200 ( as extended opportunities) 100 12 Activity 6 a)The teacher recaps on finding percentages of whole numbers that was done in grade 6. b)The teacher draws a grid on the board with the following information for the learners to complete in their workbooks:
When we multiply decimals it’s like we drop
the commas then just multiply the numbers.
Add the decimal places and put the comma in
the answer according to the sum of the decimal
places e.g 0,1x0,02x0,1=0,0002
14
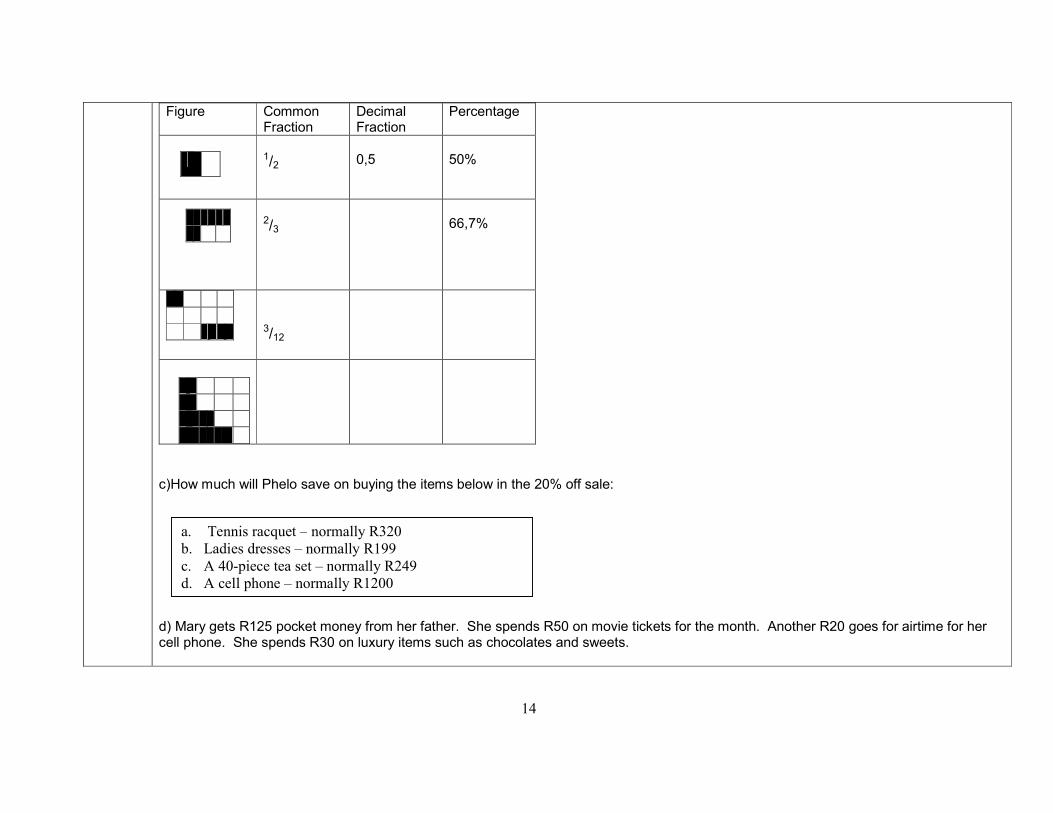
a. Tennis racquet – normally R320
b. Ladies dresses – normally R199
c. A 40-piece tea set – normally R249
d. A cell phone – normally R1200
Figure Common Fraction
Decimal Fraction
Percentage
1/2
0,5
50%
2/3
66,7%
3/12
c)How much will Phelo save on buying the items below in the 20% off sale: d) Mary gets R125 pocket money from her father. She spends R50 on movie tickets for the month. Another R20 goes for airtime for her cell phone. She spends R30 on luxury items such as chocolates and sweets.

15
i)What percentage did she use for the movie tickets? ii)What percentage did she use to buy airtime? Iii) What percentage of her money is she left with at the end of the month? iv) Draw a pie chart to represent the above-mentioned information. The teacher gives more examples. Activity 8 The teacher introduces the concept of exponents: We already know that repeated addition is multiplication e.g. 5 + 5 = 2 x 5 5 + 5 + 5 = 3 x 5 5 + 5 + 5 + 5 = 4 x 5 Now let’s look at repeated multiplication: e.g. 5 x 5 = 52
5 x 5 x 5 = 53
5 x 5 x 5 x 5 = 54
Repeated multiplication is called powers. Note: 5 x 3 = 15 and 53 = 5x 5 x 5 = 125. So 15 ≠ 125. Ensure that learners do not get confused here! Let learners define the concept of powers in their own words as they observe these examples, the teacher then crystallises definition of the concept: An exponent is a number of times a certain number is multiplied by itself. Generally speaking: mn = m x m x m ... (n times)
Note: Learners need to convert
percentages/fractions to
degrees in order to draw
accurate pie chart.

16
52 exponent
base power
The teacher gives the following for the learners to calculate: Simplify 1. 21 x 32= 2. 53÷ 23= 3. 73- 52= 4. 102 x 52= 5. 43 ÷ 25=
Add more activities Write out as exponents a)10x10x10x2x2= b) 7x7x5x5x5x5x5= c) 11x11x11x11x3x3x3= The teacher ensures that learners know mental calculations of squares from 22 up to 102 and cubes from 23 up to 53
Teacher also does square roots and cube roots (In introducing the concept can use the concept of area of a square for square and the side of a square for a square root and volume of a cube for a cube and a side of a cube for the cube root )

17
RESOURCES: Abacus, bank statements, worksheets, fraction strips INTEGRATION: Within 7.5.10 Across EMS LO4: Designs posters or other material to advertise own business venture ASSESSMENT: Class work & home work; investigation; assignment; test.
BARRIERS TO LEARNING: Use concrete material e.g. fraction strips.
EXPANDED OPPORTUNITIES: Teacher can add to the next decimal places when calculating decimal fractions. Use more complicated percentages that include fractions.
TEACHER REFLECTIONS:

18
?
WEEK LO’s & AS’s
CONTENT ACTIVITIES
5
Cluster 3: LO 2 7.2.7 Determines, analyses and interprets the equivalence of different descriptions of the same relationship or rule presented:
• Verbally • In flow diagrams • In tables • By equations or expressions
In order to select the most useful representation for a given situation.
Determination, analysis and interpretation of the equivalence of the same rule in different ways (verbally, in flow diagrams, in tables and by equations or expressions).
Activity 1 Activity 2
Activity 1 In manageable groups, the learners are given matches to build the following patterns:
The learners must construct the next pattern with their match sticks. They then discuss what they notice from their patterns. Learners draw the following flow diagram of the pattern and fill it in: 1 4
7
3
13
5
19
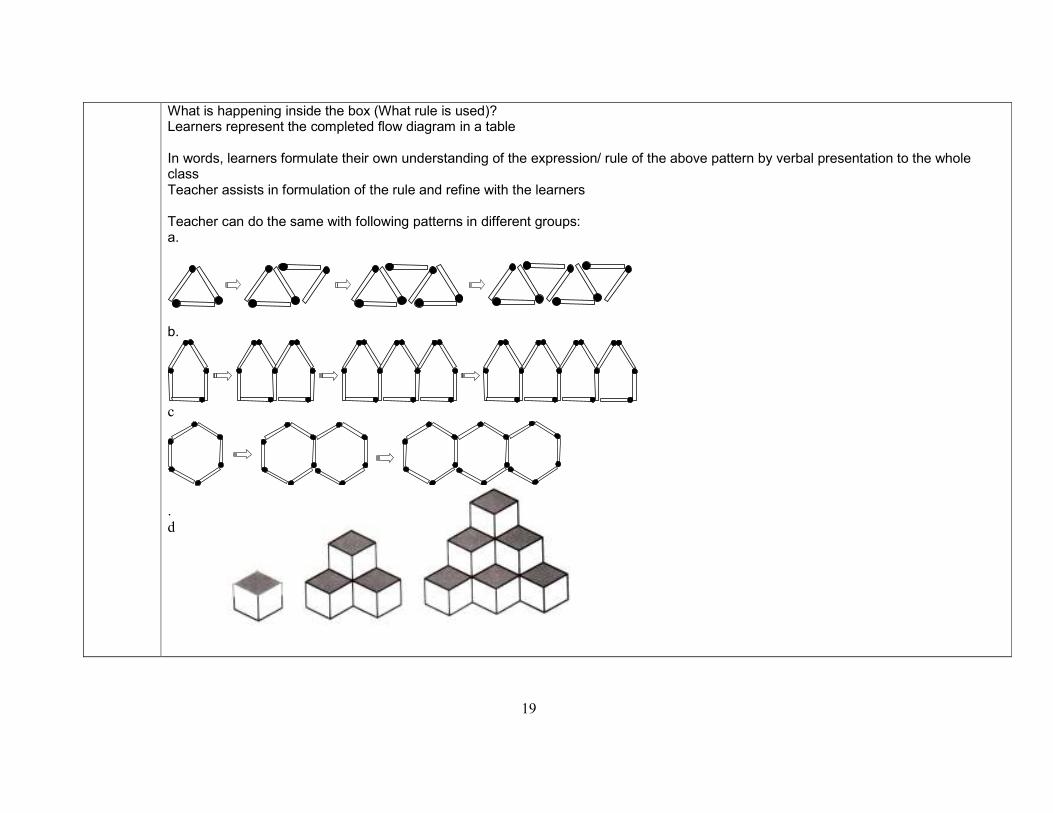
What is happening inside the box (What rule is used)? Learners represent the completed flow diagram in a table In words, learners formulate their own understanding of the expression/ rule of the above pattern by verbal presentation to the whole class Teacher assists in formulation of the rule and refine with the learners Teacher can do the same with following patterns in different groups: a.
b.
c
. d

20
Note: Teacher should assist learners to see what is common that is happening all the time in the pattern. Encourage learners to come up with their own simple rules (conjectures) and ensure the validity of
the conjecture before coming with a generalization
Activity 2 Number patterns can also be given e.g a) 4;7;10;13 b)3; 8; 13;18;... c)4; 11; 18; 25... d) Fold an A4 paper halfway lengthwise fold it again and again and again in the same dimension etc Draw a table to generate a pattern by counting the number of folds vs number of creases make a rule in your own words
RESOURCES: Match sticks; glue or prestik; work sheets. NTEGRATION: Within 7.1.1 ASSESSMENT: Investigation, homework, class work. BARRIERS TO LEARNING: Allow learners who are struggling with language to code switch during verbal presentations. EXPANDED OPPORTUNITY: Give more challenging patterns that lead to quadratic expressions, e.g. squares. TEACHER REFLECTION

21
A B F
WEEK LO’s & AS’s CONTENT ACTIVITIES
6
CLUSTER 3: LO 3 7.3.7 Draws and interprets sketches of solids from different perspectives 7.3.8 Locates positions on co-ordinate systems (ordered grids) and maps using:
• Horizontal and vertical change • Compass
Directions
Drawing and interpretation of sketches of solids in different perspective. Location of positions on co-ordinate systems and maps using Cartesian plane and compass directions
Acitivty 1 Learners work on a real-life situation to find the co-ordinates of positions. Activity 2 Learners bring real life objects to the class and draw them.
Activity 1 B C D C D B Position 1 Position 2 Position 3 In the cube above, put in different positions and marked with the letters A, B, C, D, E & F on each the six faces . Study them carefully and write down which face is opposite to i) A ii) B iii) C Learners do this mentally, then for those who struggle they can do it practically. The teacher can do more activities that further enhance spatial visualization by using other solids Activity 2 a) Learners bring real-life objects from home like milk boxes, cans and cereal boxes. Teacher provides learners with isometric grid paper, and learners draw these objects in three-dimensional form from different perspectives. For example:

22
b)Teacher gives different measurement for solids for learners to draw on the isometric paper. They can enlarge or reduce in a certain ratio and give different positions by translation and rotation c) Learners identify the number of cubes in the figures below and then redraw the figures from the side and from the top.
Activity 3 a.The teacher recaps on locating positions on a coded grid as was done in grade 6.
23
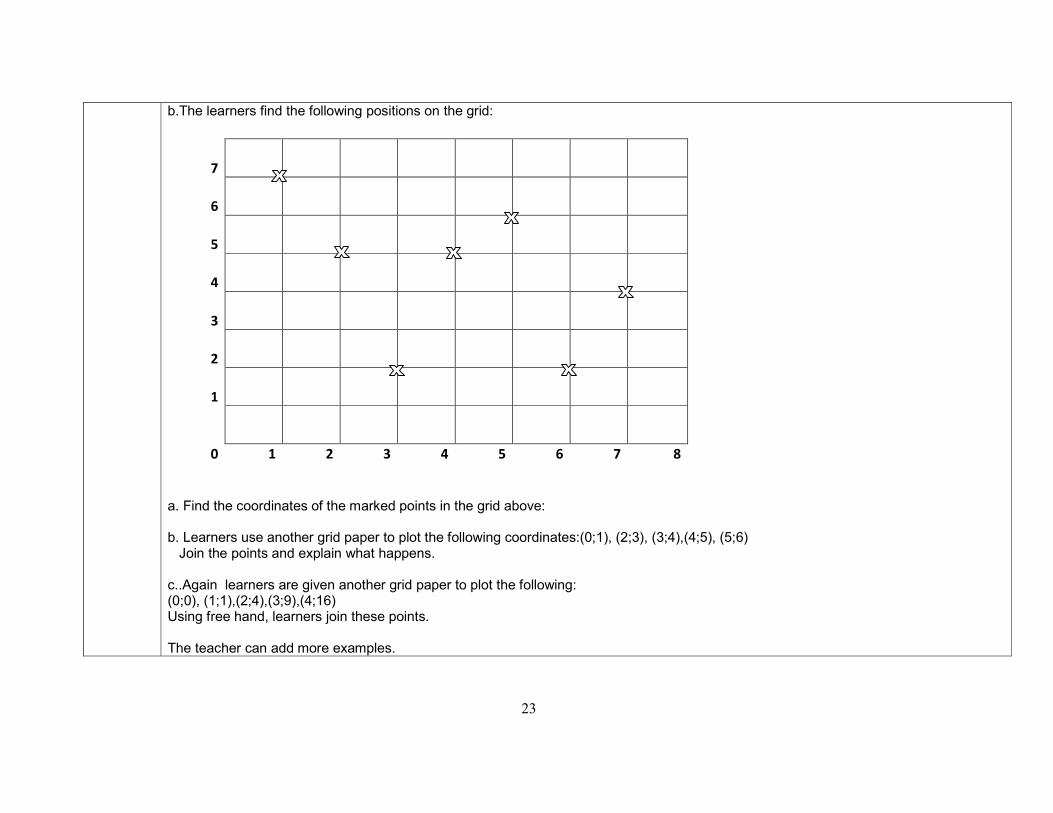
b.The learners find the following positions on the grid:
7
6
5
4
3
2
1
0 1 2 3 4 5 6 7 8
a. Find the coordinates of the marked points in the grid above: b. Learners use another grid paper to plot the following coordinates:(0;1), (2;3), (3;4),(4;5), (5;6) Join the points and explain what happens. c..Again learners are given another grid paper to plot the following: (0;0), (1;1),(2;4),(3;9),(4;16) Using free hand, learners join these points. The teacher can add more examples.
24
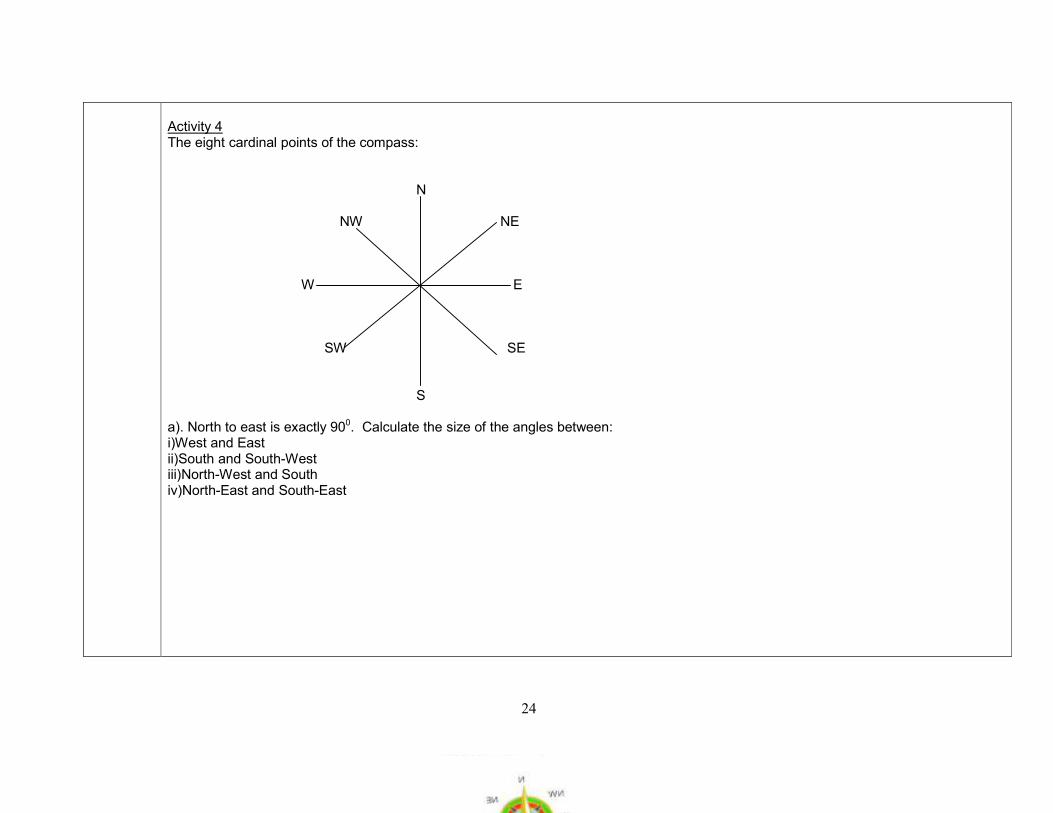
Activity 4 The eight cardinal points of the compass: N NW NE W E SW SE S a). North to east is exactly 900. Calculate the size of the angles between: i)West and East ii)South and South-West iii)North-West and South iv)North-East and South-East

25
b)Refer to the map of the Eastern Cape above to answer the following: i)Thembisa lives in Grahamstown (D4). She wants to visit her aunt in Bisho (E3) , in which direction would she travel?

26
ii) If the scale on the map is 1cm: 50km, how far is Bisho from Grahamstown by road? iii) If she decides to proceed to Cofimvaba using the shortest route by road, which directions would she use? iv) Using the scale above, how far is the shortest route to Cofimvaba from Bisho by road? v) If Thembisa uses air transport from East Lodon to Port Elizabeth, how far will that be and in which direction will she have travelled? vi) Find the coordinates of the following towns and cities: Port Elizabeth: Sterkspruit: Humansdorp: Port St. Johns: Burgersdorp:
RESOURCES: Maps, compass, grid paper INTEGRATION: Social Sciences LO1, Geography (AS – Uses maps to locate issues in context) ASSESSMENT: Classwork, homework Test, BARRIERS TO LEARNING: Teacher assists learners in using maps EXPANDED OPPORTUNITY:
TEACHER REFLECTIONS:
27
WEEK LO’s & AS’s CONTENT ACTIVITIES
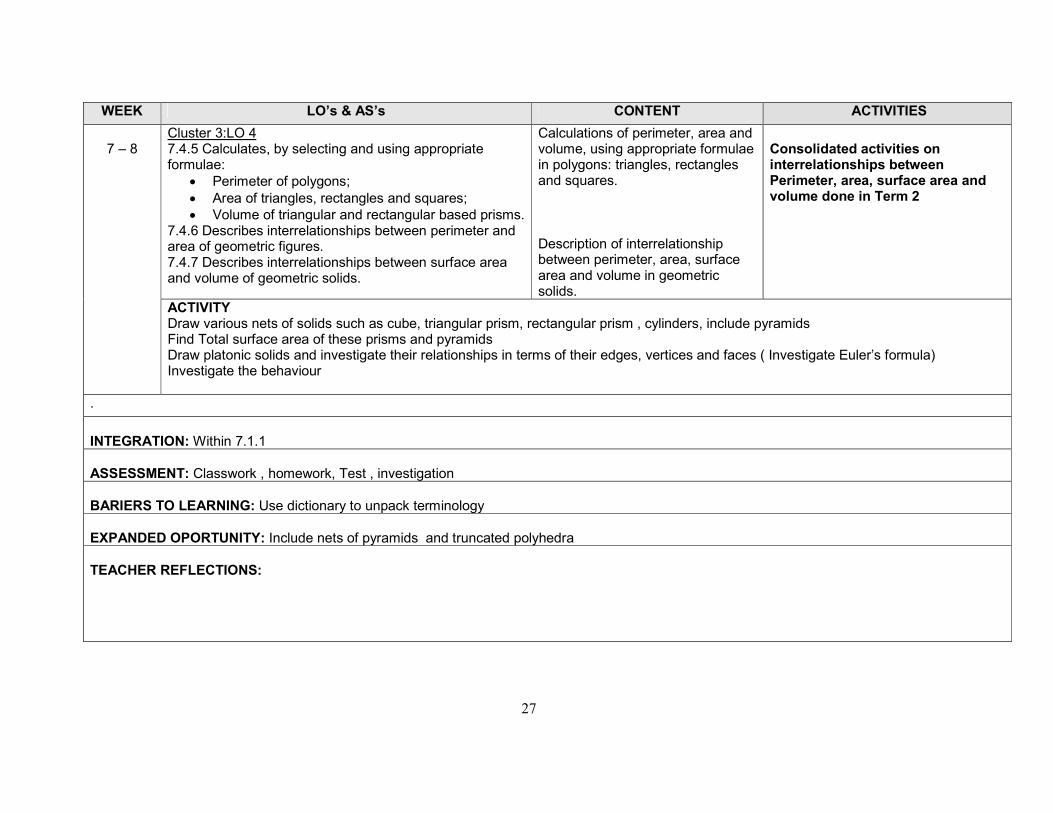
7 – 8
Cluster 3:LO 4 7.4.5 Calculates, by selecting and using appropriate formulae:
• Perimeter of polygons; • Area of triangles, rectangles and squares; • Volume of triangular and rectangular based prisms.
7.4.6 Describes interrelationships between perimeter and area of geometric figures. 7.4.7 Describes interrelationships between surface area and volume of geometric solids.
Calculations of perimeter, area and volume, using appropriate formulae in polygons: triangles, rectangles and squares. Description of interrelationship between perimeter, area, surface area and volume in geometric solids.
Consolidated activities on interrelationships between Perimeter, area, surface area and volume done in Term 2
ACTIVITY Draw various nets of solids such as cube, triangular prism, rectangular prism , cylinders, include pyramids Find Total surface area of these prisms and pyramids Draw platonic solids and investigate their relationships in terms of their edges, vertices and faces ( Investigate Euler’s formula) Investigate the behaviour
.
INTEGRATION: Within 7.1.1 ASSESSMENT: Classwork , homework, Test , investigation
BARIERS TO LEARNING: Use dictionary to unpack terminology
EXPANDED OPORTUNITY: Include nets of pyramids and truncated polyhedra
TEACHER REFLECTIONS:

28
WEEK LO’s & AS’s CONTENT ACTIVITIES
9-10
CLUSTER 3: LO 5 7.5.10 Performs simple experiments where the possible outcomes are equally likely and: • Lists the possible outcomes based on the conditions
of the activity; • Determines the frequency of actual outcomes for a
series of trials; Determines the relative frequency (see Mathematics Learning Area Statement Glossary)
Theory of probability - listing possible outcomes and determine relative frequency.
Activity 1 The teacher does a couple experiments using a coin, a die etc. to find possible outcomes, determine frequency and relative frequency.
Activity 1 The teacher does a couple experiments using a coin, die etc. to find possible outcomes, determine frequency and relative frequency. Examples:
a) Tossing a coin: • There are only two possible outcomes—the coin will land with the head facing up or with the tail facing up • If a coin is tossed 60 times and lands on heads 35 times (we say the frequency of heads is 35) and tails 25 times (the frequency of
tails is 25) then the relative frequency of heads is 35 out of 60 or 58% and the relative frequency of tails 25 out of 60 or 42
b) Rolling a die:
• In groups of three’s, each leaner is given a chance to throw a fair die ten times that is 30 chances (trials) in total. • Record the throws in tallies as shown in the example below.

29
Die Face Tallies Frequency Relative frequency
1 ||||
4
30
4
2 |||| ||||
9
30
9
• Let them complete the table below to show frequency and relative frequency as well;-
Die Face Tallies Frequency Relative
frequency 1
2
3
4
5
6
c) Drawing a card at random:
• Supply/ask learners to bring packs of playing cards to the class. • Give them a chance of randomly draw a card from the pack. • The teacher may ask the following questions;-
i) What is the possibility of drawing e.g an ace, a 4, a 10 etc.? ii) What is the possibility of drawing an ace that is a spade? iii) What is the possibility of drawing a heart? etc.
• Let the learners conduct an experiment of actually drawing the cards from the pack a limited number of times. They must record the results in a tally table as in (b) above.

30
d) Spinning a spinner Faith was playing with a spinner. She recorded the frequencies with which she got the various possible outcomes in the table below:-
i) Find the relative frequency for the following outcomes: 1. red 2. Green 3. White 4. Blue
ii) If the outcomes red and green are taken as an event, what is the relative frequency with which this event occurred?
Outcome Frequency
Red 12
Green 8
White 9
Blue 7
The teacher gives more activities on this concept and consolidates

31
RESOURCES: Dice, Playing Cards, Coins, Spinner INTEGRATION: NS LO 1 As. : Evaluates data and communicates findings: Generalises in terms of a relevant aspect and describe how the data support the generalisation. ASSESSMENT: Assignment, Test BARRIERS TO LEARNING: Learners may out of excitement concentrate more on playing the games instead of learning the concept. The teacher then should have clear rules to guide learning. EXPANDED OPORTUNITY: Performing experiments where the possible outcomes are unequally likely e.g The possibility of selecting a 12 year old girl from the class. TEACHER REFLECTIONS:

32
GRADE 7 FORMAL ASSESSSMENT TASK
MATHEMATICS PROJECT LO 3: AS: 7 & 8 MARKS: 60
This project can be done in groups of 2, 3, 4 or more learners, depending on the teacher as well as the size of the class. The title of the project should be clearly stated. A rubric is included for assessment purposes. Drawing a map You are required to draw a map of the area in which your school is situated. The following scale should be used: 1cm = 100m. You are also required to draw compass directions to help you to answer the questions. Use a legend for your map and include the following: Your school,Streets or different routes if in a rural area, Houses, Other buildings in the area, Any other important structures that are in your area, e.g. monuments, church building , clinic, sports grounds, dams etc. For Example
8
7
6
5
4
3
2
1
0
A B C D E F G H I J

33
Draw a grid on the map with 1cm blocks, as shown in the example above, and add the following to it: • Positions of coordinate systems, for example y-axis and y-axis.
Using the scale above, do the following: • Choose at least three streets/ other routes and determine the length of these streets. • Determine the length (in meters) between the main buildings on your map. • Using the positions of coordinate systems, determine the positions of main attractions in your area.
Drawing an object Choose any building or object that you have represented on the map and draw it in 3-D in at least five different views:
• Left view • Front view • Back view • Top view • Side view
You are required to use a chart to represent these objects. Presenting your project Each group shall have the chance to present their project to the rest of the class and the educator for assessment. The assessment will be based on neatness, originality and accuracy of your drawings, as well as your presentations.

34
MARKING RUBRIC
Names of Group Members: ______________________________________________________________________
Title of Work: _____________________________ Date:
______________________________
CRITERIA
9-10 6-8 3-5 0-2 Points obtained
CONTENT
Labels – Accuracy:
• X & Y axis
• Title
• Legend
• Compass directions
At least 90% of the labels are labeled correctly and corresponds with the content.
80-89% of the labels is labeled and located correctly and corresponds with the content.
70-79% of the labels is labeled and located correctly and corresponds with the content.
Less than 70% of the X and Y axis are labeled and located correctly.
_____________
Neatness and Attractiveness
Exceptionally well designed, neat, and attractive. Colours that go well together are used to enhance the readability of the graph. A ruler is used to make the graph more readable.
Neat and relatively attractive. Colour is used on the graph. A ruler is used to make the graph more readable.
Lines are neatly drawn but the graph appears quite plain.
Appears messy and “thrown together” in a hurry. Lines are visibly crooked.
_______________
Accuracy of Grid and Scale
The grid is plotted correctly and is easy to see. All features on the map are clearly
The grid is clearly drawn and easy to see. Most features on the map are clearly drawn to
The grid is clearly drawn. Many features on the map are NOT drawn to scale
There is no grid visible on the map. Many features on the map are NOT drawn to scale
______________

35
drawn to scale and the scale used is clearly indicated.
scale and the scale used is clearly indicated.
even though the scale used is clearly indicated.
and/or there is no scale marker on the map.
Drawings
Accurately reproduces 3-D shape/s in different positions on a chart. Colour is used to enhance the aesthetics of the shape.
Reproduces 3-D shape/s in different positions on a chart. Colour is used.
3-D shapes are drawn on a chart, but fails to reproduce in different positions. Colour is absent.
Shapes are not drawn in 3-D or different positions, and appear messy on the chart. No colour is used.
_______________
PRESENTATION
Content Demonstrates full knowledge (more than required) with explanations and elaboration.
Show ease with content, but fails to elaborate.
Uncomfortable with information and only points out to rudimentary knowledge.
Do not have grasp of information. Cannot answer question on subject.
_______________
Organization
Present information in logical, interesting sequence which audience can follow.
Present information in logical sequence which audience can follow.
Audience has difficulty following presentation because student/s jumps around.
Audience cannot understand presentation because there is no sequence of information.
_______________
TOTAL →
_______________
36
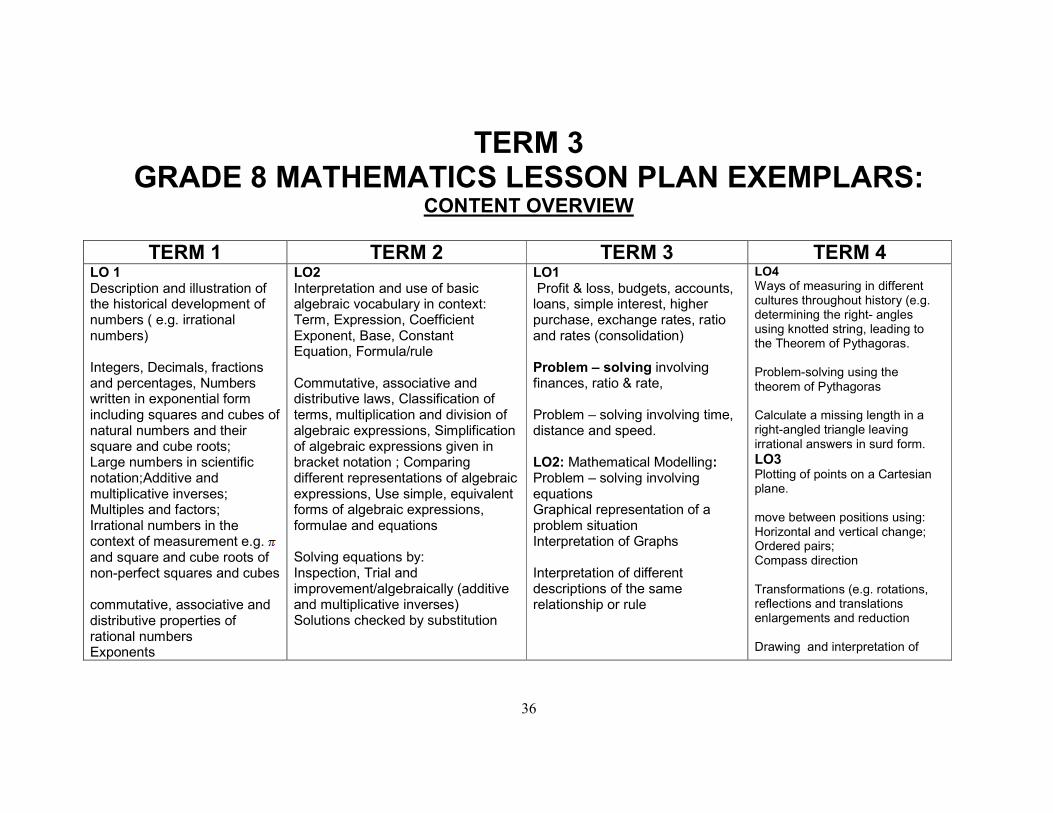
TERM 3 GRADE 8 MATHEMATICS LESSON PLAN EXEMPLARS:
CONTENT OVERVIEW
TERM 1 TERM 2 TERM 3 TERM 4 LO 1 Description and illustration of the historical development of numbers ( e.g. irrational numbers) Integers, Decimals, fractions and percentages, Numbers written in exponential form including squares and cubes of natural numbers and their square and cube roots; Large numbers in scientific notation;Additive and multiplicative inverses; Multiples and factors; Irrational numbers in the context of measurement e.g. and square and cube roots of non-perfect squares and cubes commutative, associative and distributive properties of rational numbers Exponents
LO2 Interpretation and use of basic algebraic vocabulary in context: Term, Expression, Coefficient Exponent, Base, Constant Equation, Formula/rule Commutative, associative and distributive laws, Classification of terms, multiplication and division of algebraic expressions, Simplification of algebraic expressions given in bracket notation ; Comparing different representations of algebraic expressions, Use simple, equivalent forms of algebraic expressions, formulae and equations Solving equations by: Inspection, Trial and improvement/algebraically (additive and multiplicative inverses) Solutions checked by substitution
LO1 Profit & loss, budgets, accounts, loans, simple interest, higher purchase, exchange rates, ratio and rates (consolidation) Problem – solving involving finances, ratio & rate, Problem – solving involving time, distance and speed.
LO2: Mathematical Modelling: Problem – solving involving equations Graphical representation of a problem situation Interpretation of Graphs Interpretation of different descriptions of the same relationship or rule
LO4 Ways of measuring in different cultures throughout history (e.g. determining the right- angles using knotted string, leading to the Theorem of Pythagoras. Problem-solving using the theorem of Pythagoras Calculate a missing length in a right-angled triangle leaving irrational answers in surd form. LO3 Plotting of points on a Cartesian plane. move between positions using: Horizontal and vertical change; Ordered pairs; Compass direction Transformations (e.g. rotations, reflections and translations enlargements and reduction Drawing and interpretation of

37
Properties of Geometric shapes in natural and cultural forms. regular and irregular polygons and polyhedron :The platonic solids (tetrahedron, cube, octahedron, dodecahedron, icosahedrons) t Designing and of use nets to make models of geometric of solids and Accurate constructions LO 2: Investigation of numeric and geometric patterns: (natural and cultural contexts) represented in physical and diagrammatic form. not limited to sequences involving constant difference or ratio, learner’s own creation. represented in tables. algebraically
LO3: Vocabulary based on parallel lines cut by a transversal. Different angles emanating from parallel lines cut by a transversal. Angle relationships of triangles made from parallel lines cut by two or more transversals. LO 4: Estimating angles Comparing angles Measuring angles Drawing angles Constructing lines and angles Classification of angles
LO 4: Problem – solving involving measurement of geometric figures (perimeter, area & volumes) Meaning and use of pi and its historical development in measurement Conversion between SI units LO 5: Critical reading and interpretation of the graphs : -Bar graphs and double bar graphs • Histograms with given and own intervals; • Pie charts • Line and broken-line graphs • Scatter plots;-
sketches of geometric solids from different perspectives with attention to the preservation of properties LO 5 Probability Relative frequency of actual outcomes for a series of trials;
38
LESSON PLAN EXEMPLARS
WEEK LO’s & AS’s CONTENT ACTIVITIES 1 – 3
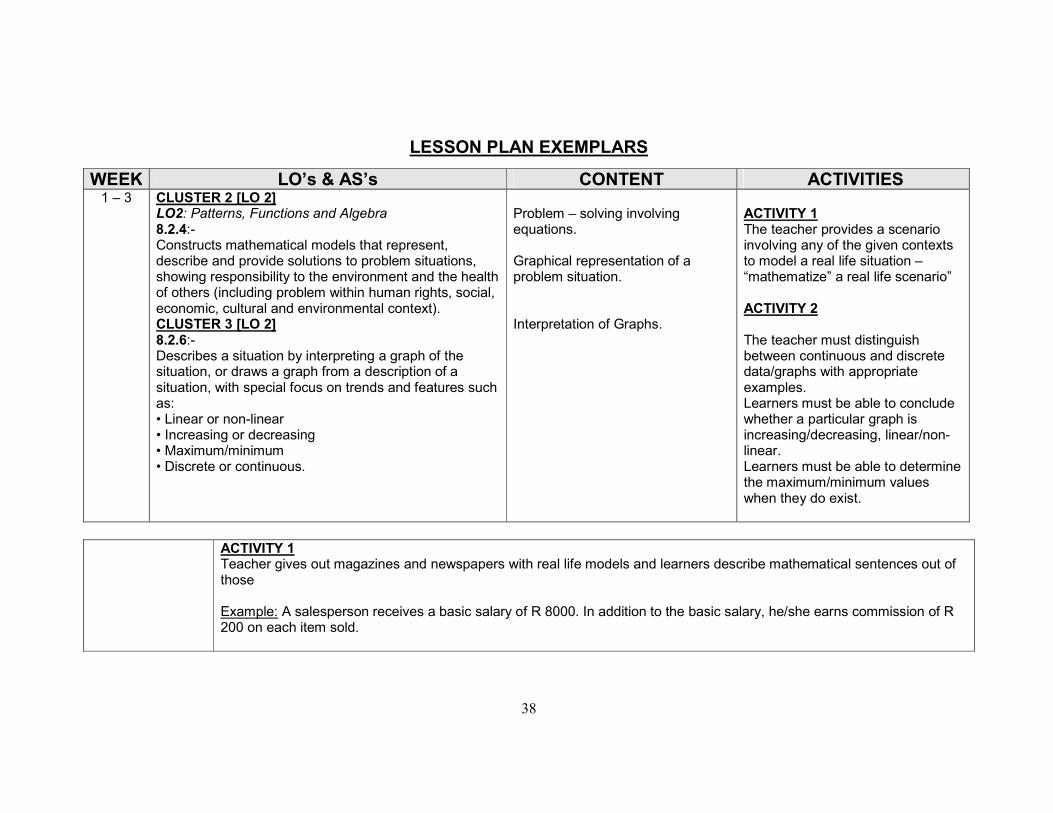
CLUSTER 2 [LO 2] LO2: Patterns, Functions and Algebra 8.2.4:- Constructs mathematical models that represent, describe and provide solutions to problem situations, showing responsibility to the environment and the health of others (including problem within human rights, social, economic, cultural and environmental context). CLUSTER 3 [LO 2] 8.2.6:- Describes a situation by interpreting a graph of the situation, or draws a graph from a description of a situation, with special focus on trends and features such as: • Linear or non-linear • Increasing or decreasing • Maximum/minimum • Discrete or continuous.
Problem – solving involving
equations. Graphical representation of a problem situation. Interpretation of Graphs.
ACTIVITY 1 The teacher provides a scenario involving any of the given contexts to model a real life situation –“mathematize” a real life scenario” ACTIVITY 2 The teacher must distinguish between continuous and discrete data/graphs with appropriate examples. Learners must be able to conclude whether a particular graph is increasing/decreasing, linear/non-linear. Learners must be able to determine the maximum/minimum values when they do exist.
ACTIVITY 1 Teacher gives out magazines and newspapers with real life models and learners describe mathematical sentences out of those Example: A salesperson receives a basic salary of R 8000. In addition to the basic salary, he/she earns commission of R 200 on each item sold.

39
1.1 Complete the following table: Number of items sold (x) Total income of salesperson (y)
1 8000 + (200)(1) 2 8000 + (200)(2) 3 ……. 4 …….
1.2 Give an equation/formula that represents the above situation. 1.3 Use the formula to calculate the total income of the salesperson if he/she sold 12 items. 1.4 How many items did the salesperson sell if his/her total income was R 9200 1.5 Plot a line graph of Number of items sold vs.Total income of salesperson. 1.6 Use the graph to determine the total income of the salesperson if he/she sells 7 items. Comment: The above example is in the economic context. The teacher can design further activities in other contexts. Teacher gives an investigation to model a real life scenario ACTIVITY 2 2.1 Determine which of the following data will be discrete or continuous. a) The number of goals scored in each of 20 consecutive soccer matches. b) The heights of learners with varying masses. c) The number of spoilt votes at each polling station for the 2009 elections. Comment: Discrete variables can be counted and continuous variables can assume any value between any two given values. Teacher gives more activities to consolidate the concepts
RESOURCES: Magazines , newspapers, dictionary, graph paper, grid paper, INTEGRATION: Within LO5.5.8 ASSESSMENT: Classwork homework, investigation, test BARRIERS TO LEARNING Unpack difficult terms for learners struggling with language
EXPANDED OPPORTUNITIES: Include real life models that involve quadratic functions e.g non repeating handshakes among a group of people as well as triangular numbers TEACHER REFLECTION:

40
WEEK LO’s & AS’s CONTENT ACTIVITIES 4 – 6
CLUSTER 4 [LO 2] 8.2.7:- Determines, analyses and interprets the equivalence of different descriptions of the same relationship or rule presented: • Verbally • In flow diagrams • In tables • By equations or expressions in order to select the most useful representation for the given situation.
Interpretation of different descriptions of the same relationship or rule. Problem – solving.
ACTIVITY 1 Revision of equivalent forms of different descriptions of the same rule/relationship. ACTIVITY 2 The teacher provides learners with multiple opportunities to translate information from one equivalent form to another.
ACTIVITY 1 The teacher gives and consolidates activities on previously dealt with concepts such as numeric patterns, verbal descriptions, flow diagrams, tables in preparation for analysis and interpretation of the equivalence of the different descriptions above. ACTIVITY 2 The teacher provides learners with worksheets various descriptions of a relationship/rule e.g. an equation or formula. The learners are then expected to translate this information to other equivalent forms. The equation gives the relationship between the number of passengers in a taxi and the profit made by the taxi organisation. P represents the profit made per trip and n represents the number of passengers in the taxi. It costs the taxi organisation R 50 for fuel for this trip. The taxi has a maximum seating for 13 passengers. 3.1 Use the formula for profit above to complete the table below: Number of passengers per trip (n) 4 6 9 10 13 The profit in rands made per trip.(P) 20 60
a) State the above rule in words. b) What is the maximum profit that the taxi-driver can make per trip assuming that he does not overload the taxi. c) How many passengers will ensure a minimum profit. d) Will the taxi-driver make a profit or a loss if 3 passengers. Explain.
3.2 Complete the flow diagram below:
X10 - 50 80 input
41
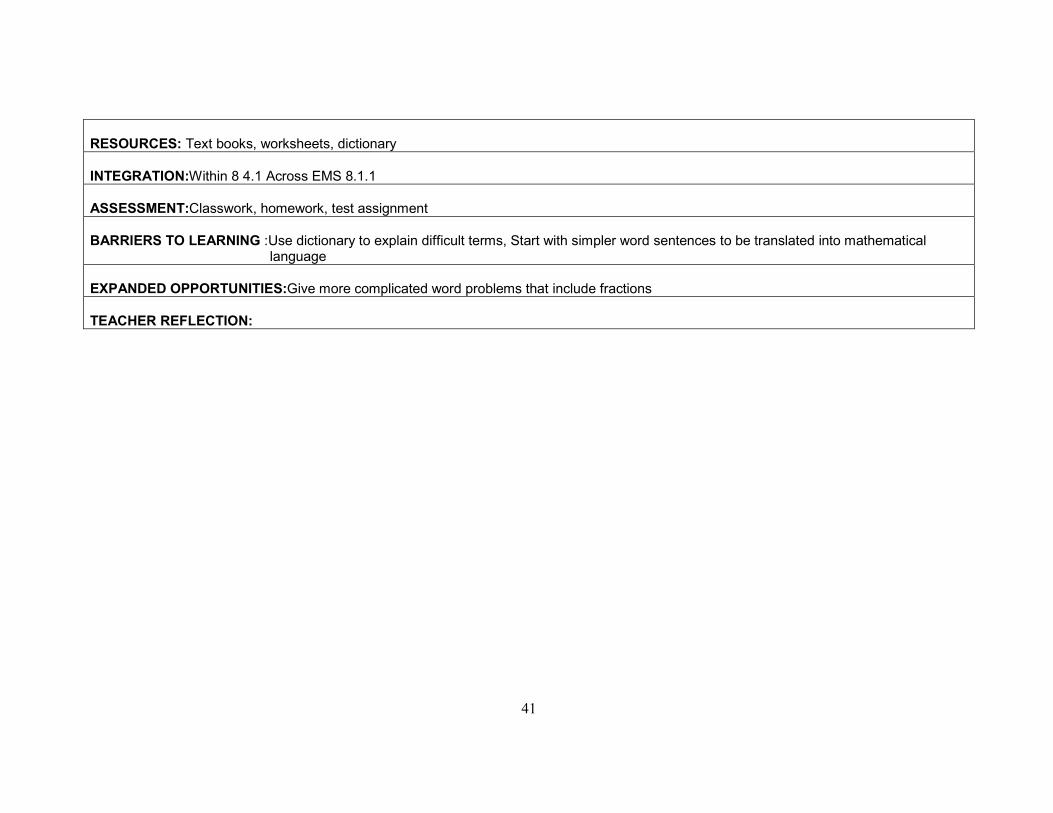
RESOURCES: Text books, worksheets, dictionary
INTEGRATION:Within 8 4.1 Across EMS 8.1.1
ASSESSMENT:Classwork, homework, test assignment BARRIERS TO LEARNING :Use dictionary to explain difficult terms, Start with simpler word sentences to be translated into mathematical language
EXPANDED OPPORTUNITIES:Give more complicated word problems that include fractions
TEACHER REFLECTION:

42
WEEK LO’s & AS’s CONTENT ACTIVITIES
7-9
CLUSTER 2 [LO 1] LO1: Numbers, operations and relationships. 8.1.4:- Solves problems in context including context that may be used to build awareness of other Learning Areas, as well as human rights, social, economic and environmental issues such as: • Financial (including profit and loss, budget, accounts, loans, simple interest, hire purchase, exchange rates. • Measurements in Natural Sciences and Technology contexts. 8.1.5:- Solves problems that involve ratio and rate.
Problem – solving involving finances, ratio & rate, measurement. Problem – solving involving measurement of geometric figures (perimeter, area & volumes)
ACTIVITY 1 Teacher does recap on solving problems in various contexts including social, economic and environmental ACTIVITY 2 Teacher recaps on problems that involve ratio and rate problems on a more advanced level.
ACTIVITY 1 Teacher gives ample revision exercises involving problems including profit and loss, budget, accounts, loans, simple interest, hire purchase, exchange rates, measurements in Natural Science and Technology. Example Teacher gives activities that involve fractions to 2nd and 3rd dec places in measurement as well as big numbers such as millions and billions for profit and loss, budgets, accounts loans for big companies. For simple interest include percentage (rate) and time with fractions, ACTIVITY 2
Note that rate is the comparison by division
of two quantities of different kinds e.g. In
2.1 below, distance and capacity are
compared.
Note that ratio is the comparison by division
of two quantities of the same kind. In 2.2
below, length is compared to length.
43
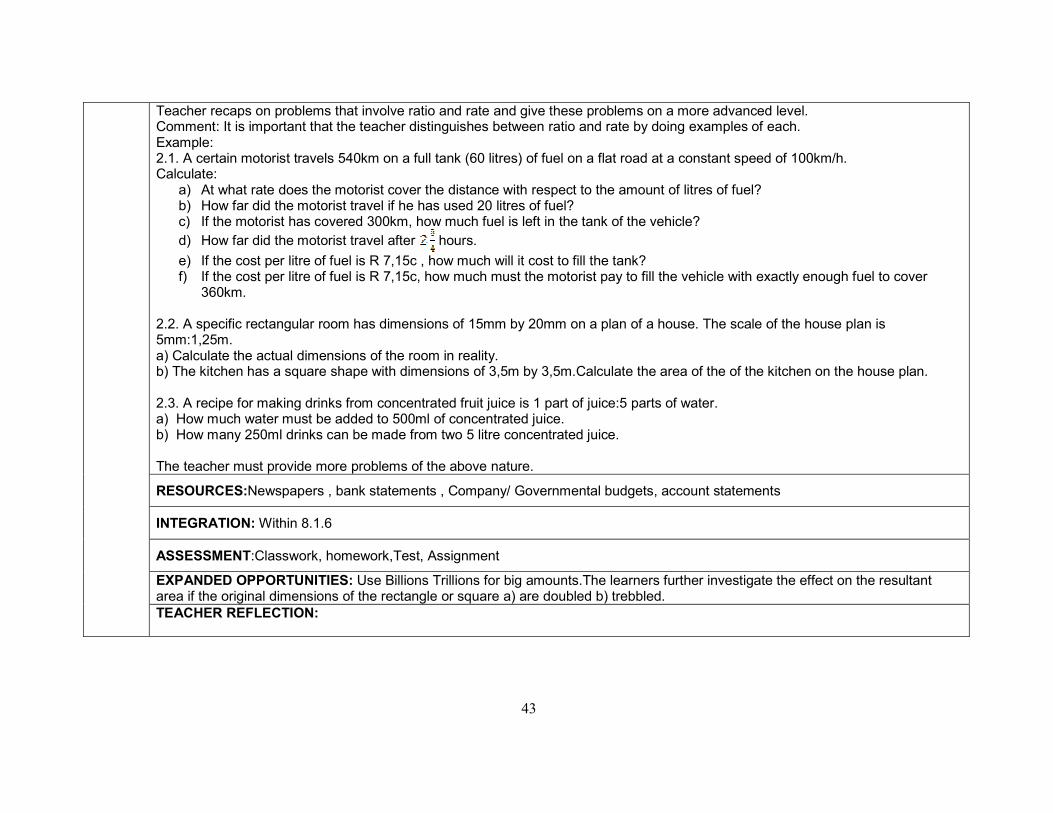
Teacher recaps on problems that involve ratio and rate and give these problems on a more advanced level. Comment: It is important that the teacher distinguishes between ratio and rate by doing examples of each. Example: 2.1. A certain motorist travels 540km on a full tank (60 litres) of fuel on a flat road at a constant speed of 100km/h. Calculate:
a) At what rate does the motorist cover the distance with respect to the amount of litres of fuel? b) How far did the motorist travel if he has used 20 litres of fuel? c) If the motorist has covered 300km, how much fuel is left in the tank of the vehicle? d) How far did the motorist travel after hours.
e) If the cost per litre of fuel is R 7,15c , how much will it cost to fill the tank? f) If the cost per litre of fuel is R 7,15c, how much must the motorist pay to fill the vehicle with exactly enough fuel to cover
360km.
2.2. A specific rectangular room has dimensions of 15mm by 20mm on a plan of a house. The scale of the house plan is 5mm:1,25m. a) Calculate the actual dimensions of the room in reality. b) The kitchen has a square shape with dimensions of 3,5m by 3,5m.Calculate the area of the of the kitchen on the house plan. 2.3. A recipe for making drinks from concentrated fruit juice is 1 part of juice:5 parts of water. a) How much water must be added to 500ml of concentrated juice. b) How many 250ml drinks can be made from two 5 litre concentrated juice. The teacher must provide more problems of the above nature.
RESOURCES:Newspapers , bank statements , Company/ Governmental budgets, account statements
INTEGRATION: Within 8.1.6
ASSESSMENT:Classwork, homework,Test, Assignment
EXPANDED OPPORTUNITIES: Use Billions Trillions for big amounts.The learners further investigate the effect on the resultant area if the original dimensions of the rectangle or square a) are doubled b) trebbled. TEACHER REFLECTION:
44
7-9 LO’s & AS’s CONTENT ACTIVITIES
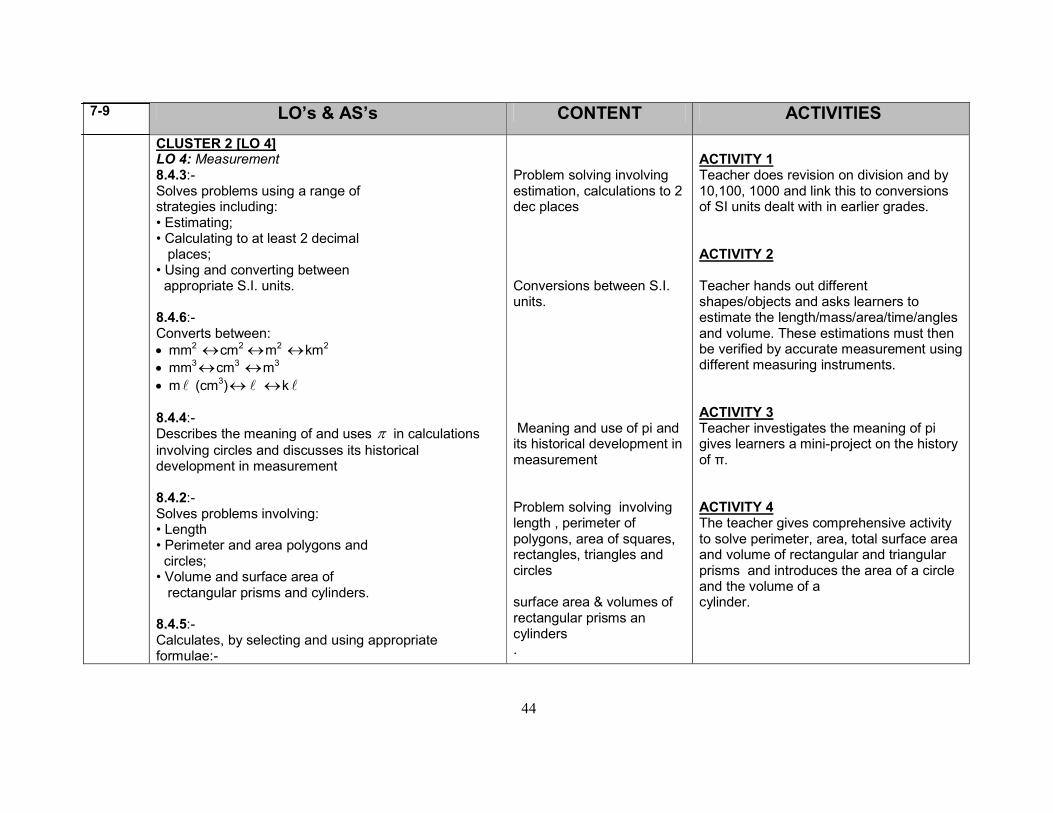
CLUSTER 2 [LO 4] LO 4: Measurement 8.4.3:- Solves problems using a range of strategies including: • Estimating; • Calculating to at least 2 decimal places; • Using and converting between appropriate S.I. units. 8.4.6:- Converts between: • mm2 ↔cm2
↔m2 ↔km2 • mm3
↔cm3 ↔m3 • ml (cm3)↔ l ↔k l 8.4.4:- Describes the meaning of and uses π in calculations involving circles and discusses its historical development in measurement 8.4.2:- Solves problems involving: • Length • Perimeter and area polygons and circles; • Volume and surface area of rectangular prisms and cylinders. 8.4.5:- Calculates, by selecting and using appropriate formulae:-
Problem solving involving estimation, calculations to 2 dec places Conversions between S.I. units. Meaning and use of pi and its historical development in measurement Problem solving involving length , perimeter of polygons, area of squares, rectangles, triangles and circles surface area & volumes of rectangular prisms an cylinders .
ACTIVITY 1 Teacher does revision on division and by 10,100, 1000 and link this to conversions of SI units dealt with in earlier grades. ACTIVITY 2 Teacher hands out different shapes/objects and asks learners to estimate the length/mass/area/time/angles and volume. These estimations must then be verified by accurate measurement using different measuring instruments. ACTIVITY 3 Teacher investigates the meaning of pi gives learners a mini-project on the history of π. ACTIVITY 4 The teacher gives comprehensive activity to solve perimeter, area, total surface area and volume of rectangular and triangular prisms and introduces the area of a circle and the volume of a cylinder.
45
• Perimeter of polygons and circles; • Area of triangles, rectangles, circles & polygons by decomposition into triangles and rectangular-based prisms and cylinders. 8.4.1:- Solves more complex problems involving time, including relating time distance and speed.
Problem – solving involving time, distance and speed.
ACTIVITY 5 The teacher gives activities to calculate and solve problems involving more complex problems on speed, distance and time.
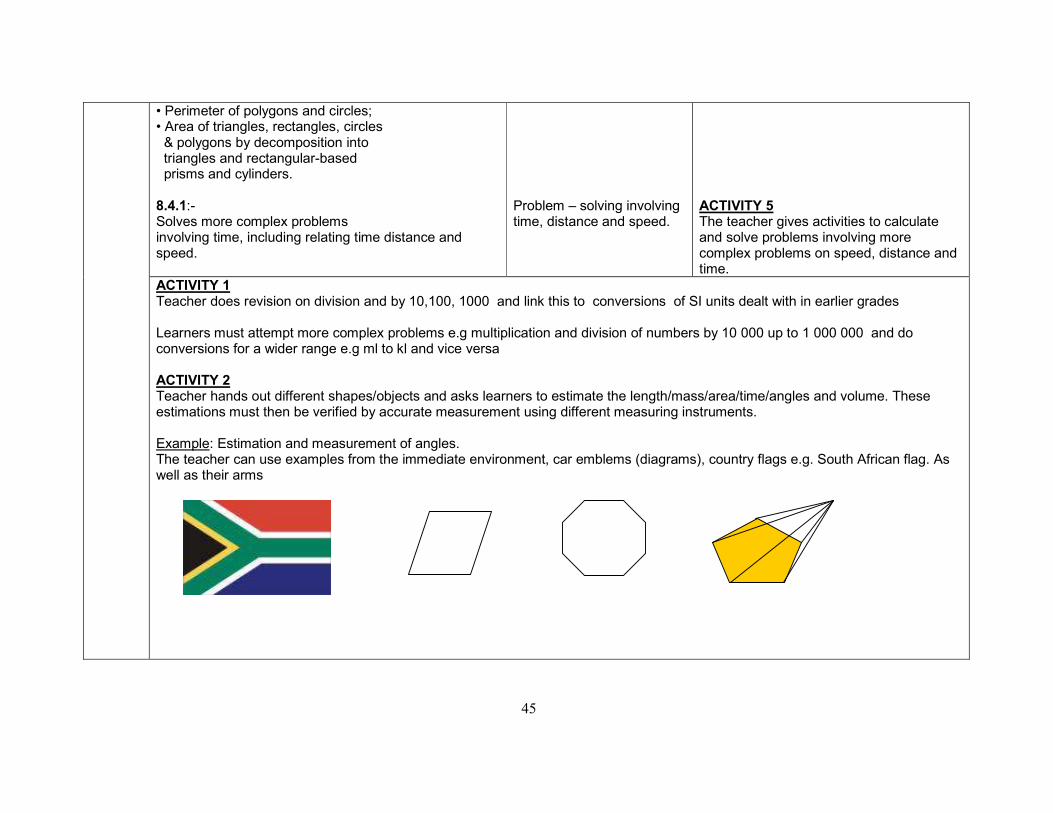
ACTIVITY 1 Teacher does revision on division and by 10,100, 1000 and link this to conversions of SI units dealt with in earlier grades Learners must attempt more complex problems e.g multiplication and division of numbers by 10 000 up to 1 000 000 and do conversions for a wider range e.g ml to kl and vice versa ACTIVITY 2 Teacher hands out different shapes/objects and asks learners to estimate the length/mass/area/time/angles and volume. These estimations must then be verified by accurate measurement using different measuring instruments. Example: Estimation and measurement of angles. The teacher can use examples from the immediate environment, car emblems (diagrams), country flags e.g. South African flag. As well as their arms
46
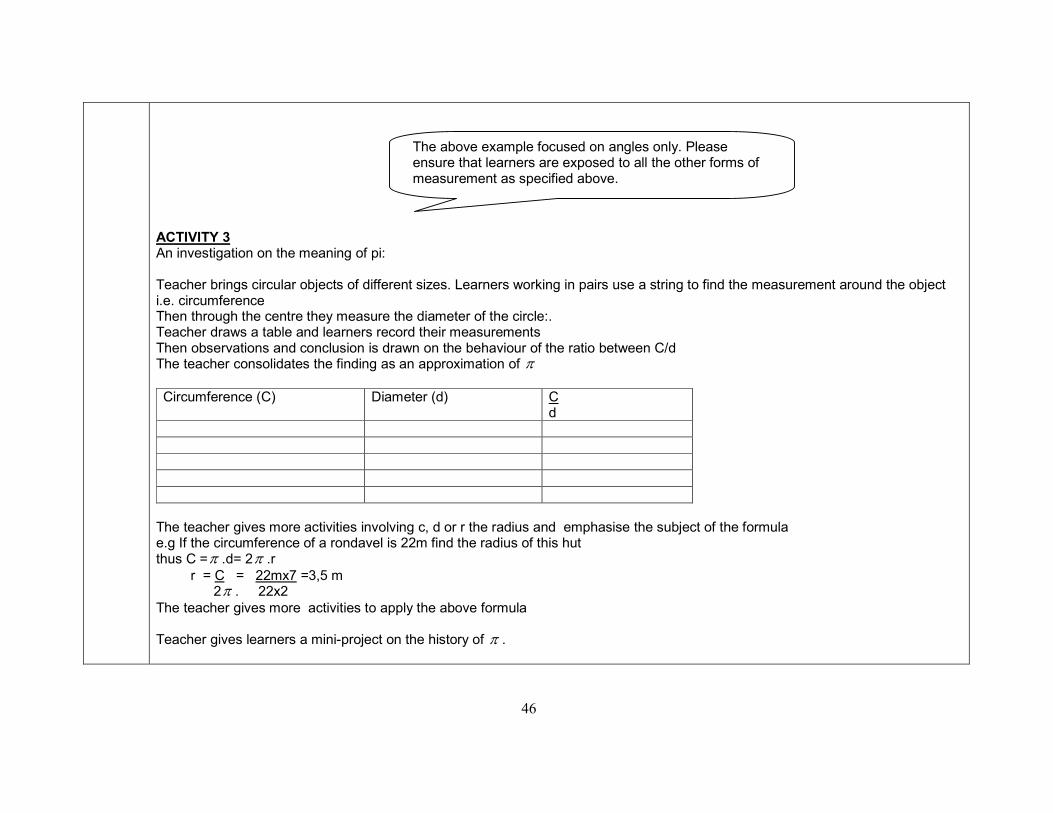
ACTIVITY 3 An investigation on the meaning of pi: Teacher brings circular objects of different sizes. Learners working in pairs use a string to find the measurement around the object i.e. circumference Then through the centre they measure the diameter of the circle:. Teacher draws a table and learners record their measurements Then observations and conclusion is drawn on the behaviour of the ratio between C/d The teacher consolidates the finding as an approximation of π Circumference (C) Diameter (d) C
d
The teacher gives more activities involving c, d or r the radius and emphasise the subject of the formula e.g If the circumference of a rondavel is 22m find the radius of this hut thus C =π .d= 2π .r r = C = 22mx7 =3,5 m 2π . 22x2 The teacher gives more activities to apply the above formula Teacher gives learners a mini-project on the history of π .
The above example focused on angles only. Please ensure that learners are exposed to all the other forms of measurement as specified above.
47
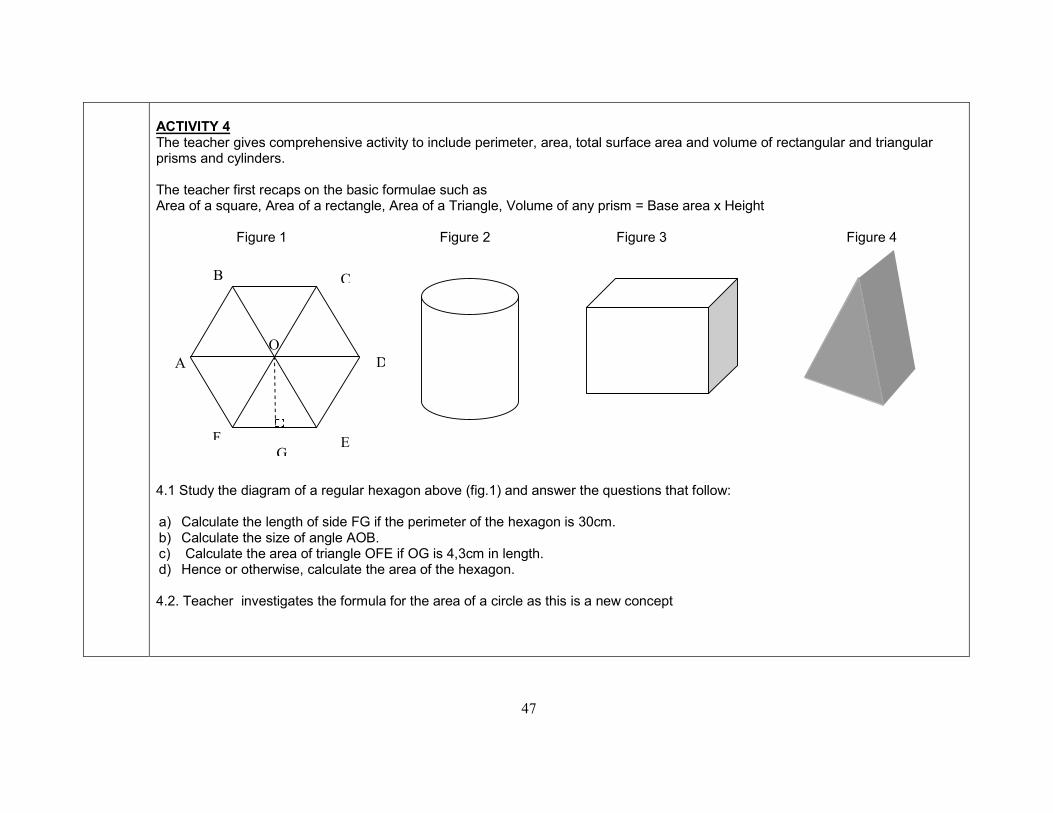
ACTIVITY 4 The teacher gives comprehensive activity to include perimeter, area, total surface area and volume of rectangular and triangular prisms and cylinders. The teacher first recaps on the basic formulae such as Area of a square, Area of a rectangle, Area of a Triangle, Volume of any prism = Base area x Height Figure 1 Figure 2 Figure 3 Figure 4 4.1 Study the diagram of a regular hexagon above (fig.1) and answer the questions that follow: a) Calculate the length of side FG if the perimeter of the hexagon is 30cm. b) Calculate the size of angle AOB. c) Calculate the area of triangle OFE if OG is 4,3cm in length. d) Hence or otherwise, calculate the area of the hexagon.
4.2. Teacher investigates the formula for the area of a circle as this is a new concept
G F
D
C B
A
E
O

48
Learners are given worksheets with circles of various radii as shown in the figure above They colour the circle and then cut out all sectors and arrange them upside down (as shown below) on a paper using glue Note that if these sector s are small enough they would form a rectangle Then Area of a rectangle = LxB =½C x r (Note full circumference makes both lengths) = ½x 2π rxr =π r2
But the figure was originally a circle Thus Area of a circle =π r2
Then the teacher gives activities to apply the formula Example How much floor carpet would be needed for the rondavel above? More activities of this nature are given 4.3 Figure 2 above represents a coffee can. If the radius of the lid is 5cm, calculate: a) the area of the circular base. b) the total surface area of the cylinder if the height of the cylinder is 25cm. c) Draw the net of the cylinder if it is reduced to th its original size. (The ratio of its radius to its height must remain the same)
4.4 Teacher does recap on volume of triangular and rectangular based prisms as this was done in Gr7

49
The volume of the rectangular prism in figure 3 is 27,825 , calculate: a) The height if the length is 5,3cm and the breadth is 2,3cm. b) Draw the net of the rectangular prism above and fill in all the dimensions. c) Hence, calculate the total surface area of the above rectangular prism. 4.4 In figure 4, the triangular base of the prism is an equilateral triangle with sides of length (2x)cm. a) Find the area of the equilateral triangle in terms of x. b) If the height of the prism is (50-x)cm, determine the volume of the prism. 4.5 The teacher introduces the volume of a cylinder as this is a new concept Note Volume of any prism = Base area x Height The same is applicable here Volume of a cylinder r= base area x height =π r2 x height Teacher applies the formula by giving activities e.g How much water would fill a tank whose diameter is 2,1 m and height is 250cm 4.6 The teacher recaps on nets of the above and investigates the net of a cylinder its surface area then apply the formula TSA of a cylinder =Area of a rectangle + 2 Area of the circle =2π r h+ 2π r2 =2π r(r+h) ACTIVITY 5 The teacher recaps on problems involving time ,distance and speed as this was done in Gr7 Activities on solving problems involving more complex problems on speed, distance and time are given. Emphasise the formula speed=distance and make use of the subject of the formula time Example Sipho normally travels 5km an hour on the average on a relatively level ground, but 2km an hour on a steep mountain. On a certain weekend he plans to board a taxi to visit his uncle who lives 10km away. Unfortunately that weekend there was a taxi strike. Because it was critical for him to visit the uncle he had to walk that distance. On the way to the uncle the first 6km is level and the remaining distance as rather steep as the uncle’s house is on top of the mountain. How long will he take to reach his uncle’s home.? Teacher gives more problems of this nature as well as reversed problems that seek to calculate the distance when given time and speed
50
RESOURCES: Circular objects of different sizes, pair of scissors, glue, 2D and 3D shapes, cylinders, string, tape measure calculator, worksheets
INTEGRATION: Within 8.3.2
ASSESSMENT:Classwork, homework test, investigation
BARRIERS TO LEARNING: Use concrete material and practical activities to derive difficult concepts
EXPANDED OPPORTUNITIES:
TEACHER REFLECTION

51
LO’s & AS’s CONTENT ACTIVITIES 10
CLUSTER 2 [LO 5] LO5: Data handling. 8.5.8:- Draws a variety of graphs by hand or technology to display and interpret data including:- • Bar graphs and double bar graphs • Histograms with given and own intervals; • Pie charts • Line and broken-line graphs; • Scatter plots 8.5.9:- Critically reads and interprets data presented in a variety of ways in order to draw conclusions and make predictions sensitive to the role of: • Context (e.g. rural or urban, national or provincial); • Categories within the data (e.g. age, gender, race); • Data manipulation (e.g. grouping, scale, choice of summary statistics) for different purposes; • The role of outliers on data distribution; • Any other human right.
Critical reading and interpretation of these Graphs in order to draw conclusions and make predictions;- Bar graphs and double bar graphs • Histograms with given and own intervals; • Pie charts • Line and broken-line graphs • Scatter plots
ACTIVITY 1 The teacher does Grade 7 revision on graphs. (See Appendix 1) ACTIVITY 2 Introduce concept of a scatter plot. ACTIVITY 3 Teacher designs an activity that leads to critically reading and interpretation of data presented in a variety of contexts as specified in the assessment standard in order to draw conclusions and make predictions. ACTIVITY 4 Teacher gives a project that consolidates the above concepts.

52
ACTIVITY 1 The teacher does revision on the concepts of data and data sources as well as drawing and interpretation of the following graphs done in Gr. 7: • Bar graphs and double bar graphs • Pie charts • Line and broken-line graphs (See Appendix 1) Learners may also collect newspaper cuttings displaying the above graphs. ACTIVITY 2 2.1 Study the two graphs below and answer the questions that follow GRAPH A GRAPH B
Re-emphasize the difference between discrete and continuous data, as this effects the labelling of the horizontal axis Discrete data – able to count the number of items eg shoe size Continuous data – is to do with measurement eg shoe length

53
a) What do you notice about the horizontal numbering of the two graphs? b) Which of the two graphs represents continuous data? c)Justify your answer in b)
c) Explain the difference between a bar graph and a histogram d) The above two graphs are classified as histograms. What do you notice about the different histograms? e) If the midpoints of each bar was connected what shape do you expect to see?
Comment: More activities involving the different types of histograms (eg shoe sizes, ages, etc) is required as this forms the foundation for FET phase for frequency polygons, ogives and skewness of data ACTIVITY 3 3.1 Learners must use their dictionaries/maths dictionaries to find the meaning of the following words:
a) independent/dependent variable b) strong/weak correlation c) scatter plots
The teacher consolidates the above definitions.
3.2 Give an example of each of the following: A scatter-plot showing:
a) No correlation (e.g. height of learner vs their pocket money) b) Weak correlation (e.g. number of lines in a paragraph versus the number of vowels in the paragraph) c) Strong correlation (learners’ height and their length of arm span ( arms wide open))
ACTIVITY 4
Teacher designs an activity that leads to critically reading and interpretation of data presented in a variety of contexts as specified in the assessment standard in order to draw conclusions and make predictions.
Example
1. How many boys passed in 2004? 2. In which year(s) did more girls pass than boys?

54
0
20
40
60
80
100
120
140
PASSES Boys Pass Girls Pass
3. What percentage of girls passed out of the total passes in 2001? In which year did the same number of boys as girls pass? 4. Do you expect more boys or girls to pass in 2006? Give a reason for 5. What is the total number of passes in 2000?
ACTIVITY 5
The teacher gives a project that consolidates the concepts below:
• Design and use of questionnaires
• Organisation and recording of data
• Calculations involving measures of central tendency (mean, median, mode)
• Draws a variety of graphs
• Critically reads and interprets data
RESOURCES: Newspaper cuttings, Graph paper,Grid paper,Maths set INTEGRATION: Within 8.2.6
ASSESSMENT:Classwork, homework test, project BARRIERS TO LEARNING: Unpack difficult terminology, pay individual attention to learners with a problem of plotting and drawing
EXPANDED OPPORTUNITIES:Use computer, excel, if available
TEACHER REFLECTION

55
APPENDIX 1
DIFFERENT TYPES OF GRAPH
ANNUAL PASSES FOR BOYS AND GIRLS
0
2
4
6
8
100
120
140
2000 2001 2002 2003 2004 2005
YEAR
PASSES
Boys Pass
Girls Pass
BROKEN LINE GRAPH REPRESENTING ANNUAL PASSES FOR BOYS AND GIRLS
0
2
4
6
8
10
12
14
2000 2001 2002 2003 2004 2005
YEAR
PASS
Boys Pass
Girls Pass 2000
2001
2002
2003
2004
2005
Slice 7
Example 3
0
2
4
6
8
100
120
140
2000 2001 2002 2003 2004 2005
YEAR
PASSES FOR BOYS IN YEARS 2000-2005
Boys Pass
Girls Pass

56
GRADE 8 FORMAL ASSESSMENT TASK Time: 1Hour Total: 30 Marks QUESTION 1 LO 3 Describe the following transformations: 1.1 (x ; y) (x – 3 ; y + 2) (1) 1.2 (x ; y) (-y ; -x) (2)
1.3
(1)
1.4
(2)
1.5
(2)
[8]

57
QUESTION 2 LO 2 An athlete prepares for the Olympic Games by running around a rugby field with his performance improving each week. During the first week of his training he covers only one round of the field. In the second week he covers three rounds and in the third week he does five rounds of the field. 2.1 Represent the information above in a table. (2) 2.2 Extend the table by including the fourth and fifth week. (2) 2.3 Determine the general formula for the number of rounds covered by the athlete (2) 2.4 What will the number of rounds the athlete would cover in the 32nd week (2) [8] QUESTION 3 3.1 At Forbes Grant High School there are five different sporting codes namely : Soccer, Rugby, Cricket, Tennis and Hockey. The number of Grade 8 learners who participate in each code is as follows: Soccer – 15; Rugby -- 9;Cricket – 3;Tennis -- 2; Hockey – 1
3.1.1 What percentage of Grade 8 players participate in soccer? (1) 3.1.2 What percentage of Grade 8 players participate in Tennis and Hockey? (2) 3.1.3 Accurately draw a pie chart to represent the information of Grade 8 learners who plays port as indicated above (3)
[6]. 3.2

58
1.5 1.2 0.8 0.7 0.6 0.5 0.2
5.5
0
1
2
3
4
5
6
Pe
rce
nta
ge
Disability
Percentage of the SA Population with each
type of disability
3.2.1 Give the number of people with multiple disabilities. (1)
3.2.2i If the total population of South Africa is 47394 102, how many people do not have disabilities? (2)
3.2.3 What percentage constitutes people with disabilities? (Answer correct to two decimal places) (2)
3.2.4 Which disability is least common? (1)
3.2.5 Calculate the percentage constituted by the most prevalent disability? (2)
[8]

59
GRADE 8
ASSESSMENT TASK MEMORANDUM MARKS : 30
Question 1
1.1 Translation 3units left and 2 units up √
1.2 180º Rotation Clockwise √√
1.3 Reflection √
1.4 90º Rotation √√
1.5 Enlargement of 1:3 √√
[8]
Question 2
2.1
Week√ 1 2 3 4 5
Rounds√ 1 3 5 7 9
√ √ 2.2 Refer to 2.1 above
2.3 No. of rounds = 2n – 1 (where n represents the week number) √√
2.4 2n – 1 = 2(32) – 1 √
= 64 – 1
= 63 √
[8]
Question 3
3.1.1 % of Gr. 8 soccer players = x 100 = 50% √
3.1.2 Tennis + Hockey players = 2 + 1
= 3 √
% of Tennis and Hockey players = x 100 = 10% √

60
3.1.3 – Accurate drawing √
Labelling √
Calculations √ [6]
3.2.1 600 000 √
3.2.2 47 394 102 – 5 500 000 = 41 894 102 √√
3.2.3 x 100 = 11,60% √√
3.2.4 Communication √
3.2.5 x 100 = 27,27% √√ [8]

61
TERM 3 GRADE 9 MATHEMATICS LESSON PLAN EXEMPLARS
CONTENT OVERVIEW
TERM 1 TERM 2 TERM 3 TERM 4
LO 1 Description and illustration of historical development of numbers. Recognition, uses and representation of rational numbers. Calculations using various techniques: including laws and meaning of exponents LO 2 Investigation of Patterns and justification of rules. Identify patterns in the environment. Learners design their own patterns Determination and representation of input and out-put values: verbally, in Flow diagrams, and in tables in order to formulate rules. Construction of mathematical Models that represent, describes and provide solutions to problem situations.
LO 1 Calculations using various techniques: including laws and meaning of exponents. LO2 Simplify and solve expressions / equations using exponential laws Different types of expressions. Product of two binomials. Factorization of algebraic expressions. Simplification and solution of equations LO3 Drawing solids in perspective Description and representation of position in a Cartesian plane LO 4 Solving problems involving measurement Development of measuring instruments from different cultures LO 5
LO 1 Problem solving including profit and loss, budgets, hire purchase, accounts, loans, exchange rate, compound and simple interest, commission, rentals and banking Problem solving on ratio, rate and proportion, time, distance and speed LO3 Problem – solving using Pythagoras Theorem Investigation and application of straight line Geometry and triangles to solve problems LO5 Probability using two way tables and tree diagrams. Represent and uses relationships between variables.
Revision and CTA (EAT) administration
62
Problem solving equations and multiplicative inverse, factorisation Drawing of graphs and use of tables Interprete relationships LO3 Recognition of geometric shapes in natural and cultural forms. Construction and drawing of geometric figures. Making of models to investigate their properties Transformation Congruency, similarity Application of Pythagoras theorem Problem solving using the geometry of straight lines and triangles. LO 5 Selection and use of appropriate methods to collect data, Organisation of numerical data Measure of central tendency
Drawing bar graphs, histograms, pie charts line and broken line graph as well as scatter plots Interpretation of data

63
LESSON PLAN EXEMPLARS
WEEK LO’s & AS’s CONTENT ACTIVITIES
1 – 2
CLUSTER 1 [LO 1] LO1: Number recognition 9.1.3:- Solves problems in context including context that may be used to build awareness of other Learning Areas, as well as human rights, social, economic and environmental issues such as:- • Financial ( including profit and loss, budget, accounts, loans, simple and compound interest, hire purchase, exchange rates, commission, rentals and banking); • Measurements in Natural Sciences and Technology contexts.
9.1.4:- Solves problems that involve ratio, rate and proportion (direct and indirect).
Problem solving including profit and loss, budgets, hire purchase, accounts, loans, exchange rate, compound and simple interest, commission, rentals and banking.
Problem solving on ratio, rate and proportion.
Activity 1 The teacher does revision on problem – solving in financial context and in Natural Sciences and Technology measurements contexts done in grades 7 & 8. Activity 2 The teacher introduces the concept of commission, rentals and banking.
Activity 3 The teacher does revision on problem solving that involves ratio and rate in Grades 7 & 8 then introduces direct and indirect proportion.
Activity 1 The teacher does revision on financial context including profit and loss, budget, accounts, loans, simple and compound interest, hire purchase and exchange rates. Examples:- a) Simple interest If an amount of R500,00 is deposited with a bank at an interest rate of 10% p.a., the simple interest received would be 10% of R500,00 which is R50,00. Calculate the interest earned after a period of 7years.

64
Hint ; i = 100
Pr t
b) Compound Interest i) Kuhle and Mfundo are friends they decide to invest their saved pocket money of R1 000.00 each differently. Kuhle decides to save his at 8% simple interest for 3 years while Mfundo does the same but at a compound interest account. Show who will have more interest. The teacher here needs to draw the attention of learners to the difference between these two types of accounts. Since compound interest is introduced for the first time, the teacher needs to explain that the amount at end of each year is re-invested and becomes the new
principal for each following year. Each year should be done separately and add the interest [Do not use formula A = P( 1 + i ) n ] at this stage ii) Bongi invests R12 000,00 for 3 years at 13% p.a. compound interest. How much interest will she accumulate after 3 years?
Teacher can inductively introduce the formula A = P( 1 + i ) n
Activity 2 The teacher familiarise the learners with the concept of commission; rentals and banking. Learners are requested to find the meaning of commission, rentals and banking from the dictionary. The teacher then consolidates the meanings of these terms and gives more examples on real life experiences in a variety of contexts.
Examples:- a) Commission A car salesman has a basic salary of R10 000,00 per month. If he earns 6% commission, calculate the total amount earned if he sells two cars with a marked price of R70 000,00 and R88 000,00 respectively.
The teacher should give more examples on profit and loss, budget, accounts, loans, hire purchase and exchange rates.

65
b) Rentals A man buys a big tent and chairs for R33 000,00. The man rents out the tent and chairs to the public every weekend. If he charges R900,00 per weekend:
1. After how many months will he make up the cost price of the tent and chairs? Show all your calculations. 2. How much money will he have made after 3 years of renting out? 3. If he decides to rent out per day at the same price, how much will be made in a year?
c) Banking If the cost of a withdrawal from Sizabantu Bank is R01,50 for the first R100,00 and the R0,50 for every additional R100,00 or part thereof. The maximum cost is R10,00. Calculate;-
1. the cost of withdrawing R300,00. 2. the cost of withdrawing R2000,00.
Activity 3 The teacher revises problem – solving in ratio and rate then familiarises the learners with the concepts of direct & indirect proportion. Examples:-
a) A certain fruit drink is made by adding 200mℓ of concentrated juice to 1 ℓ of water. How much concentrated juice is there in 250mℓ of the fruit drink?
b) A school hires a bus for an educational trip to Shamwari Game reserve. The total cost for hiring the bus for the 10 days is R14 800,00. The arrangement is that learners who go on the trip contribute equally to the cost of hiring the bus. Complete the following table to show how much each learner has to pay, for different numbers of participants in the trip.
Number of passengers
10
20
30
40
50
60
Cost per passenger
The teacher must explore various types of rentals like car and property rentals.

66
c) A cellphone company, Masithethe Mobile charges a monthly rental of R50,00 and R01,25 per minute of airtime.
i. Siphosethu uses 124 minutes of airtime during a month. What does he actually pay, for each minute of airtime that he uses? ii. He then uses 300 minutes of airtime during the next month. What is now his actual cost per minute of airtime? iii. Make a table that will illustrate the relationship between the number of minutes of airtime used during a month, and the actual
cost per minute.
d) If it takes 3 men to finish digging a trench in 4 days how long will it take 6 men to do the same job ? The teacher gives more activities
RESOURCES: Newspapers; Bank statements; Magazines; Deposit Slips etc. INTEGRATION: Maths LO 4 As’s 1 & 2 ASSESSMENT: Homework, classwork, Test EXPANDED OPORTUNITY: Explore more house bond repayments. BARRIERS TO LEARNING:Unpack difficult terminology
TEACHER REFLECTIONS:
Note that in Direct Proportion; if x increases at a constant rate, y also increases as much. In indirect Proportion; if x increases at a constant rate, y decreases as much.
67
WEEK LO’s & AS’s CONTENT ACTIVITIES 4
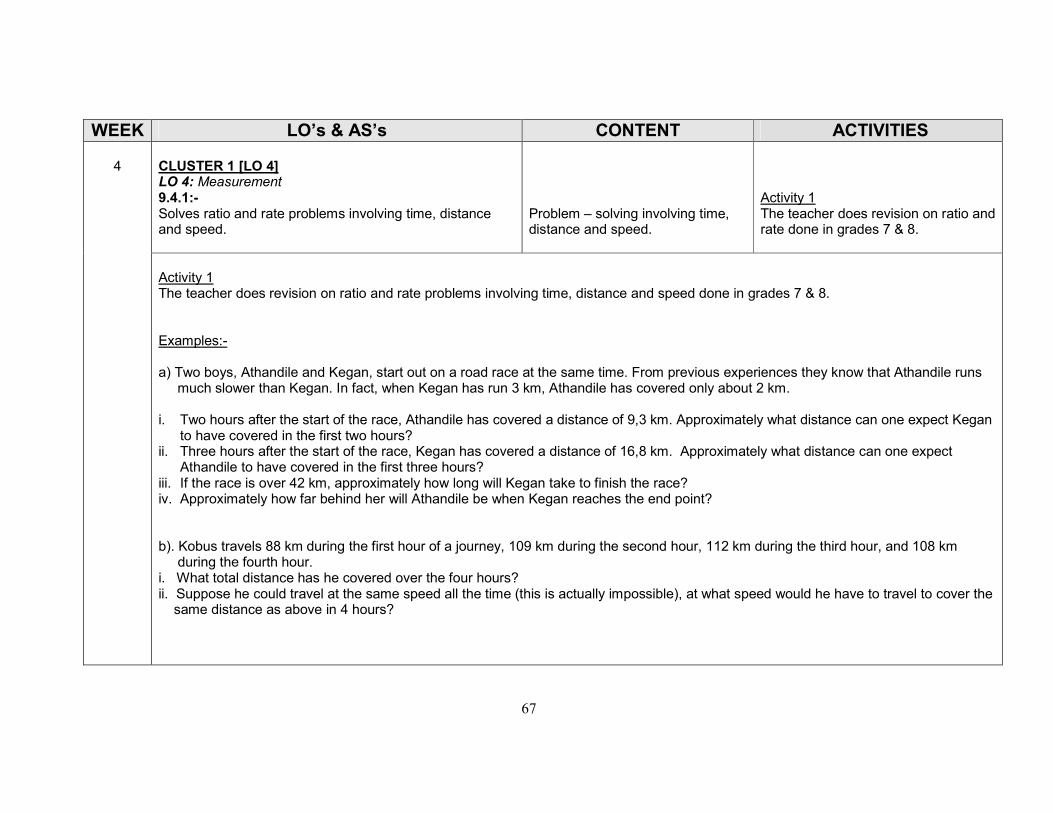
CLUSTER 1 [LO 4] LO 4: Measurement 9.4.1:- Solves ratio and rate problems involving time, distance and speed.
Problem – solving involving time, distance and speed.
Activity 1 The teacher does revision on ratio and rate done in grades 7 & 8.
Activity 1 The teacher does revision on ratio and rate problems involving time, distance and speed done in grades 7 & 8. Examples:- a) Two boys, Athandile and Kegan, start out on a road race at the same time. From previous experiences they know that Athandile runs much slower than Kegan. In fact, when Kegan has run 3 km, Athandile has covered only about 2 km. i. Two hours after the start of the race, Athandile has covered a distance of 9,3 km. Approximately what distance can one expect Kegan
to have covered in the first two hours? ii. Three hours after the start of the race, Kegan has covered a distance of 16,8 km. Approximately what distance can one expect
Athandile to have covered in the first three hours? iii. If the race is over 42 km, approximately how long will Kegan take to finish the race? iv. Approximately how far behind her will Athandile be when Kegan reaches the end point? b). Kobus travels 88 km during the first hour of a journey, 109 km during the second hour, 112 km during the third hour, and 108 km during the fourth hour. i. What total distance has he covered over the four hours? ii. Suppose he could travel at the same speed all the time (this is actually impossible), at what speed would he have to travel to cover the same distance as above in 4 hours?

68
RESOURCES: Meter stick, ruler, pencil, watch/ stop watch etc. INTEGRATION: Maths LO 1 As 5 ASSESSMENT: Classwork, Homework, assignment
BARRIERS TO LEARNING:
: EXPANDED OPPORTUNITY: Explore more on home recipes using more complex ratios showing the importance and application of ratio among the ingredients quantities.
TEACHER REFLECTIONS:
The teacher must note that Speed is just a specific instance of rate. Speed is the rate at which distance is covered. In reality there is no way that the actual speed at which an object moves at a given point in time can be calculated. We can only calculate the effective (mean, “average”) speed over a period of time. For example, if a motorist has covered 360 km in three hours, we can say that his effective speed over that period of time is 360 ÷ 3 = 120 km per hour. However, this does not mean that he travels at 120 km/hr all the time. In fact, to cover 360 km in 3 hours one only needs to travel at 120 km/hr for two moments during the journey, once while speeding up and later when slowing down.

69
WEEK LO’s & AS’s CONTENT ACTIVITIES
5 – 6
CLUSTER 3 [LO 4] 9.4.4:- Uses the Theorem of Pythagoras to solve problems involving missing lengths in known geometric figures and solids.
Problem – solving using Pythagoras Theorem.
Activity 1 Recap on Pythagoras Theorem as it was done in Grade 8. Activity 2 Problem – solving using Pythagoras Theorem.
Activity 1 Recap on Pythagoras Theorem as it was done in Grade 8 to find the length of one of the sides in a right – angled triangle when you have the lengths of the other two sides. Example:- Find the length of the side marked with an x of the square shape below: 500cm x 500cm Activity 2 Recap on the properties of rectangular prisms and a cube. Use those properties with the aid of Pythagoras theorem to find the unknown
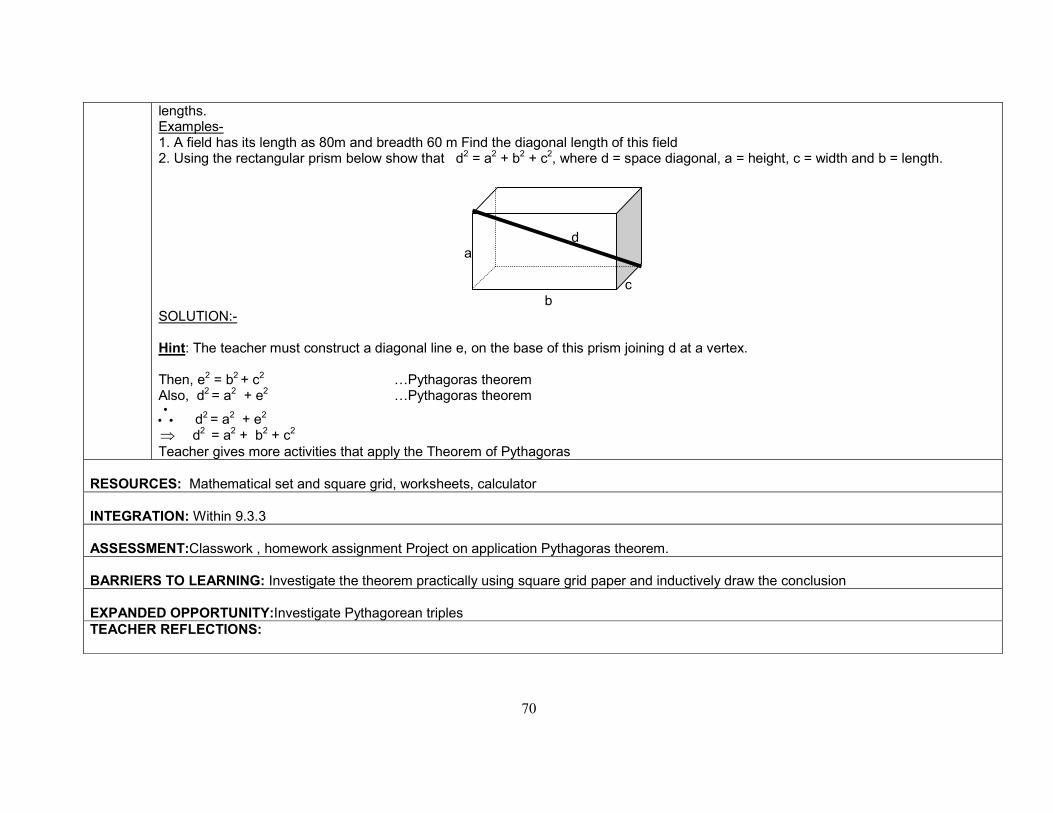
70
lengths. Examples- 1. A field has its length as 80m and breadth 60 m Find the diagonal length of this field 2. Using the rectangular prism below show that d2 = a2 + b2 + c2, where d = space diagonal, a = height, c = width and b = length. d a c b SOLUTION:- Hint: The teacher must construct a diagonal line e, on the base of this prism joining d at a vertex. Then, e2 = b2 + c2 …Pythagoras theorem Also, d2 = a2 + e2 …Pythagoras theorem
∴ d2 = a2 + e2 ⇒ d2 = a2 + b2 + c2 Teacher gives more activities that apply the Theorem of Pythagoras
RESOURCES: Mathematical set and square grid, worksheets, calculator INTEGRATION: Within 9.3.3 ASSESSMENT:Classwork , homework assignment Project on application Pythagoras theorem. BARRIERS TO LEARNING: Investigate the theorem practically using square grid paper and inductively draw the conclusion EXPANDED OPPORTUNITY:Investigate Pythagorean triples
TEACHER REFLECTIONS:
71
WEEK LO’s & AS’s CONTENT ACTIVITIES
7 – 8
CLUSTER 4 [LO 3] LO3: Space and shape. 9.3.3:- Uses geometry of straight lines and triangles to solve problems and to justify relationships in geometric figures.
Investigation and application of straight line Geometry and triangles to solve problems
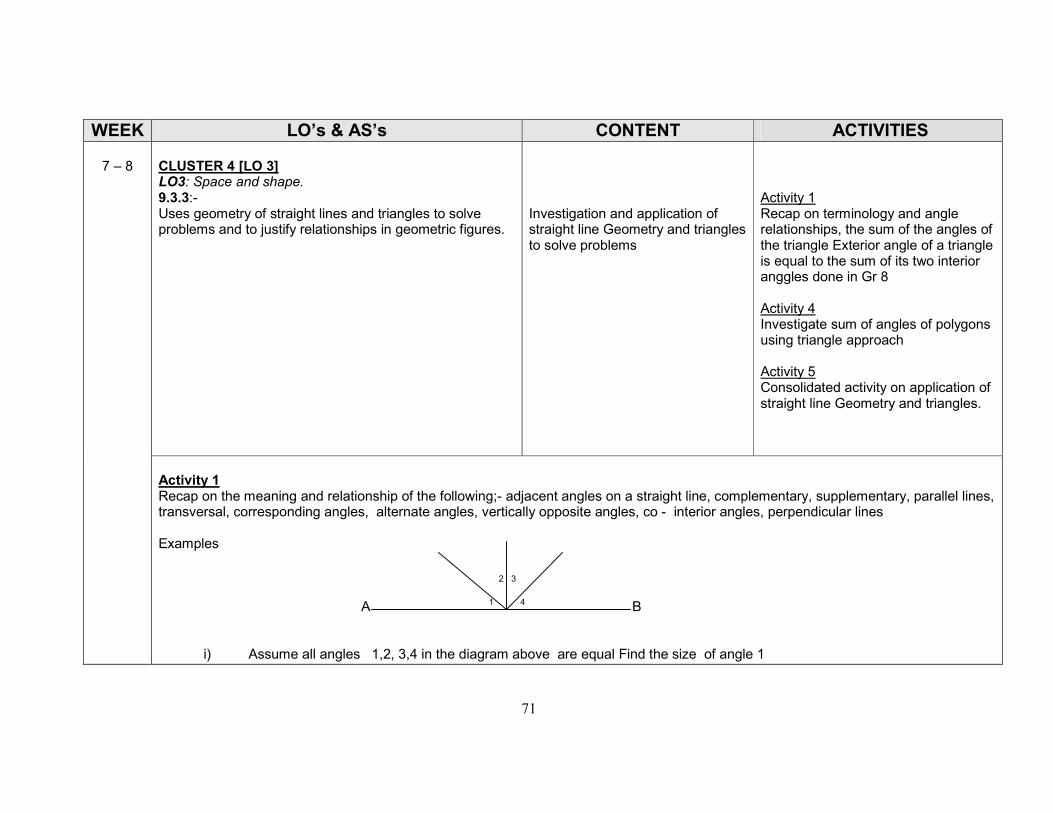
Activity 1 Recap on terminology and angle relationships, the sum of the angles of the triangle Exterior angle of a triangle is equal to the sum of its two interior anggles done in Gr 8 Activity 4 Investigate sum of angles of polygons using triangle approach Activity 5 Consolidated activity on application of straight line Geometry and triangles.
Activity 1 Recap on the meaning and relationship of the following;- adjacent angles on a straight line, complementary, supplementary, parallel lines, transversal, corresponding angles, alternate angles, vertically opposite angles, co - interior angles, perpendicular lines Examples 2 3 A 1 4 B
i) Assume all angles 1,2, 3,4 in the diagram above are equal Find the size of angle 1

72
b a c
ii) If ∠ b = 25°. Find ∠ a and∠ c.
iii)
M 1 T2 N 4 3
R 5 P6 S 8
7
c) If . ∠T2 = 112º find ∠ s T1, T4, T3, ,P5, P6, P7 and P8v) 3x-10º k 2x+20º
e) Solve for x and find the value of ∠K

73
m p 55° 48° n Consider the figure above;- Find the value of angles n; p and m.
f) P 110º Q R Find all the interior angles of PQR Teacher gives more activities for recapping Activity 2
The teacher recaps on axioms of congruency and their application i.e AAS, SSS, SAS, RHS Activity 3 Learners draw maximum number of diagonals in a polygon without intersecting to investigate the following :

74
eg. Polygon No. of diagonals Number of Triangles Sum of angles of the polygon
Triangle 0 1 1x180°= 180° Quadrilateral 1 2 2x 180°=360° Pentagon Hexagon Septagon Octagon Nonagon Decagon Any polygon
b) Find ∠K if ∠N2 = 102° K J 117°
55 ° 1 2
M N c)Draw a regular hexagon with diagonals intersecting at a common point and cut all edges without repeating What shapes are formed and how do they relate Give reasons What is the measure of each angle in the shape s formed More activities to recap on Gr 8 work are given

75
ACTIVITY 4
a) More consolidative activities to solve problems are given
M N 32º 48º
72º
Y K P
a) Find the following ∠Y; ∠MKY; ∠NKP; ∠NMK from the figure above
b) From the figure PQRS find the following:
∠ s T1, S , P1 , Q1 , T2, T3 , R
P Q 1 60º 1
20º
2
S 1 3 R T
RESOURCES: a sharp pencil, ruler, .
INTEGRATION: Maths LO 1 As 4 & LO 2 As 2
ASSESSMENT: Class – work, Homework, Investigation, Test.
BARRIERS TO LEARNING: Learners should not given clear instructions in a simple language EXPANDED OPPORTUNITY: Let learners express probability values (relative frequency) in terms of ratios and percentages. TEACHER REFLECTIONS:

76
WEEK LO’s & AS’s CONTENT ACTIVITIES
9 – 10
CLUSTER 3 [LO 5] 9.5.6:- Considers situations with equally probable outcomes, and: • Determines the probabilities for outcomes of events and predicts their relative frequency in simple experiments; • Discusses the differences between the probability of outcomes and their relative frequency; • Determines probabilities for compound events using two – way tables and tree diagrams.
Probability using two way tables and tree diagrams. Represent and uses relationships between variables.
Activity 1 Recap on relative frequency as done in Grades 7 & 8 and extend to the cognitive level of child. Activity 2 The teacher unpacks the terminology on compound events using two – way tables and tree diagrams by designing activities and exemplars for application.
Activity 1 Recap on relative frequency as done in Grades 7 & 8 to predict with reasons the possible outcomes for a series of trials. Examples:- a) A fair die is thrown, which of the following outcomes are certain, uncertain or impossible;-
i. that a number between 1 and 6 will come up? ii. for a number 7 to be obtained? iii. for an odd number to come up?
b) Place in a cup 1 three discs/buttons; cup 2 two red and two blue discs/buttons and cup 3 four blue discs/buttons. Which of the following outcomes are certain, uncertain or impossible;-
i. drawing a blue disc/button from cup 1? ii. drawing a red disc/button from cup2? iii. drawing a blue disc/button from cup3?

77
c) A fair die is rolled, what are the possible outcomes if a die is rolled once?
d) Suppose the following sequence was rolled;- 3, 2, 6, 2, 3, 1, 2, 5, 6 & 1. Complete;-
i 1 has a frequency of _____ ii 4 has a frequency of _____ iii 6 has a frequency of _____ iv frequency of 3 is 2 ∴ relative frequency is _____ v frequency of 5 is 1 ∴ relative frequency is _____
e) Suppose a fair dice is tossed once. Find the probability of ;- i. Obtaining a 6. ii. Obtaining a 1. iii. Obtaining a 6 or a 1. iv. Obtaining an odd number. v. Obtaining a number greater than 3. vi. Obtaining a number greater than 3 that is odd. vii. Obtaining a multiple of 2. viii. Obtaining a factor of 6. ix. Obtaining a prime number.
Activity 2 Calculating probability using tree diagrams, by determining both the numerator and denominator in the classical definition of probability Example:
The die is rolled a number of times (say 10) then the frequency of each possible outcome is how often that number of dots appeared on the die in the ten times that the die was rolled.

78
a) Suppose a fair die is rolled. Let O denote an odd number and E denote an even number i. Represent the outcome using a tree diagram. ii. List the possible outcomes after the 2nd roll. iii. Suppose that the die is rolled 3 times what are the possible outcomes now?
b) A cup contains 1 red and 1 blue disc. i. Represent all possible outcomes using a tree diagram if a disc is drawn, the colour noted and replaced and drawn again until
we have made 3 draws. ii. List all possible outcomes. c) Place 2 red and 1 blue disc in a cup, draw 3 times but this time you do not replace the discs that was drawn/ i. Represent the outcomes by using a tree diagram ii. Use the classical definition to determine the probability of getting one red disc iii. Use the classical definition to determine the probability of getting at least one red disc.
RESOURCES: a pair of dice, discs/buttons, cups and a pencil. INTEGRATION: Maths LO As ASSESSMENT:
BARIERS TO LEARNING:
EXPANDED OPORTUNITY:
TEACHER REFLECTIONS:

79
A
B
C Ball
Goal Posts
5m
2,5m
Mathematics Grade 9 Duration: 50 min Formal Assessment: Test Total : 30 marks LO 1 AS 3, 4,LO 4 AS 1, 4,LO 5 AS 6 1. Thabo is one of the biggest soccer fans and he can’t wait for the Soccer World Cup in
2010. Thabo’s two favourite sides are South Africa and Brazil. He knows that ticket prices for the final could cost up to R6000. Thabo also knows that money can make more money when it is invested by banking it. He invested R3000 at the beginning of 2006 at a bank where the interest rate is 12% compound interest per year.
1.1. How many years has the money been invested if he wants to withdraw it at the end of 2009? (2)
1.2. Calculate how much money will be available when he withdraws it. (5) 1.3. Calculate whether he will have enough to pay for a final match in the Soccer World Cup.
If not, how much will he still need? (3)
2. Look at the diagram below and answer the following questions:

80
In a match between Brazil and New Zealand, Kaka, a Brazilian striker planned to kick the ball at position C to the goal post at position A.
2.1. Calculate the length in metres of AC (correct to one decimal place), if AB=5m and
BC=3,5m and AB is perpendicular to BC. (4) 2.2. Calculate the time (rounded off to TWO decimal places) that the ball will take to reach
point A from point C given that the ball is traveling at a constant speed of 12m/s after Kaka strikes it. (3)
2.3. If the length of AC was 5 times longer, at what speed should the ball travel in order to reach position A in the same time as in (2.2.) above? (3)
3. The 2009 Confederations Cup is hosted by South Africa. Eight teams have qualified.
These 8 qualifiers are split into 2 groups of 4. Please study the groups below and answer the questions that follow:
Group A Group B
South Africa United States of America
Iraq Italy
New Zealand Brazil
Spain Egypt
3.1. What is the probability of South Africa being the winner of Group A. (2) 3.2. Assume that South Africa has won Group A. What is the probability of South Africa
being in the final with Italy? (4)
3.3. What is the probability of Egypt being kicked out of the group stages? (4)

81
MEMORANDUM Total :30 Question 1
1.1 4 years√√ Correct answer
1.2 √
Formula
√√√ Substitution
√ Correct answer
1.3 No, it is not enough√ 6000-4720,56=2279,44√√
Correct answer Subtraction
Question 2
2.1 √ Formula √ Substitution
√ Simplification
5.6 √ Taking the square root
2.2
√ Changing the subject of the formula
√ substitution
√ Correct answer

82
2.3 √
formula
√ Cross multiplication
√ Divide by AC
Question 3
3.1
√√ Correct fraction
3.2 √
Correct fraction
Correct answer
3.3
Complement used
Substitution Correct answer