Embed Size (px)
Citation preview

PROVED DISCOVERIES
AND
PRODUCTIVE CAPACITY
OF
CRUDE OIL, NATURAL GAS,
AND NATURAL GAS LIQUIDS
IN THE
UNITED STATES
A REPORT OF
THE NATIONAL PETROLEUM COUNCIL
1965

REPORT OF THENATIONAL PETROLEUM COUNCIL CO~~ITTEE
ON PROVED PETROLEUM AND NATURAL GASRESERVES AND AVAILABILITY (1964)
MARCH 25, 1965
CHAIRMAN OF THE COMMITTEE: L. F. McCOLLUM
NATIONAL PETROLEUM COUNCIL
OFFICERS
JAKE L. HAMON, CHAIRMAN
J. C. Donnell IIVice Chairman
HEADQUARTERS OFFICE
601 Commonwealth Building1625 K Street, N. W.Washington, D. C. 20006
Vincent M. BrownSecretary-Treasurer
Telephone:
EXecutive 3-5167

CONTENTS
MEMBERSHIP OF CO~~ITTEE . • • . . • . .
ME~ffiERSHIP OF COORDINATING SUBCOMMITTEE(Crude Oil) .
MEMBERSHIP OF COORDINATING SUBCOMMITTEE(Natural Gas and Natural Gas Liquids)
SUMMARY
. . ~'. . . . . .
PAGE--
i
iii
iv
1
HISTORICAL DISCOVERY TABULATIONS • .
HISTORICAl.. D.ISCOVERY RECORD FOR CRUDE OIL
HISTORICAL DISCOVERY RECORD FOR NATURAL GASAND NATURAL GAS LIQUIDS . • • • • . .
CRUDE pIL PRODUCTIVE CAPACITY
PRODUCTIVE CAPACITY OF NATURAL GAS
PRODUCTIVE CAPACITY OF NATURAL GAS LIQUIDS
INDEX TO TABLES . . • . . • . •
3
6
8
12
15 .
21
23
, I

·NATIONAL PETROLEUM COUNCIL(Established by the Secretary of fhe Inlerior)
Jake L.HarnonChairman
J. C. Donnell IIVice· Chairman
Vincent M. Brown'.S"ccreLa'Y - Treasurer
March 25, 1965 1625 K Street, T. W.
Washington, D. C. 20006
Mr. Jake L. Hamon., ChairmanNational Petroleum Council1625 K street, N. W.Washington, D. C. 20006
Dear Mr. Hamon:
A report on Proved Reserves and Productive Capacity ofCrude Oil, Natural Gas, and Natural Gas Liquids in the UnitedStates, as of January 1, 1964, is presented herewith. Thisreport was prepar~d at the request of Hon. JohnM. Kelly,Assistant Secretary of the Interior. In his letter of March 19,1964, addressed to the Chairman of the National PetroleumCouncil, Mr. Kelly stated:
"In response to a request from the Secretaryof'the Interior, the National Petroleum Councilprepared a report in 1961 entitled 'Proved Discove~ies and Productive Capacity of Crude Oil,Natural Gas and Natural Gas Liquids in the unitedStates. I The data contained in this report havebeen of value to the Government in its efforts toappraise the domestic long-term petroleum supply~
"It is requested that the National PetroleumCouncil prepare a report which will update as ofJanuary 1, 1964, the information presented in theearlier report. The report should be in a formsimilar to that of the earlier one, except thatprojections of productive capacity will not berequired."
The Committee on Proved Petroleum and. Natural Gas Reserves and Availability (1964) was appointed pursuant to the recommendation of the Agenda Committee, at its meeting on March 19,1964, that a committee or committees be established to make the

Mr. Jake L. HamonPage 2
study as requested by ~ecretary Kelly. To develop the requestedinformation, tvlO coordina-ting subcommittees were also appointed,one responsible for the data on crude oil and the other fornatural gas and natural gas liquids. These groups were comprised of engineers and geologists with many years experience intheir respective fields, many of whom took part, directly orindirectly, in the preceding study .
. The Committee's studies are presented in the followingpages. As was the case with the information in the 1961 report,the data presented herein should not be taken out of contextwith the accompanying con~ents and explanations concerning thesignificance and limitations of the .data and th~ir proper interpr~tation.
Respectfully submitted,
L. F. McCollum, ChairmanNPC Committee on Proved Petroleumand Natural Gas Reserves andAvailability (1964)

NATIONAL PETROLEUM COUNCILCOMMITTEE ON
PROVED PETROLEUM ANDNATURAL GAS RESERVES AND AVAILABILITY (1964)
CHAIRMAN
L. F. McCollumChajrman of the Board
Continental Oil Company
GOVERNMENT CO-CHAIRMANr.
U. S.
VICE CHAIRI'1AN(Crude Oil)
Frederick S. LottOffice of Oil and GasDepartment of the Interior
VICE CHAIRI'1AN(Natural Gas and NGL)
Carl E. Reistle, Jr.Chairman of the BoardHumble Oil & Refining Company
ASSISTANT TO CHAIRMAN(Crude Oil)
Stuart E. BuckleyConsultant-r )resentingHumble Oil & Refining Company
ASSISTANT TO CHAIRMAN
'.J. W. FergusonDirector of Planning and
Special ProjectsContinental Oil Company
i
Ed Parkes, PresidentUnited Gas Corporation
ASSISTANT TO CHAIRI'1AN(Natural Gas and NGL)
B. B. GibbsUnion Producing Company
SECRETARY
Vincent M. BrownSecretary-TreasurerNational Petroleum Council
Henry H. Beeson, PresidentNatural Gas Processors
Association
Howard BoydChairman of the BoardEl Paso Natural Gas Company
E. D. Brockett, PresidentGulf oil Corporation
Geo. H. Bruce, PresidentNational Stripper Well
Association
Orville S. CarpenterTexas Eastern Transmission
Corporation
J. C. Donnell II, PresidentMarathon Oil Company
Paul EndacottVice Chairman of the BoardPhillips Petroleum Company
R. G. FollisChairman of the BoardStandard oil Company of
California
Alvin C. HopeSan Antonio, Texas
A. JacobsenChainnan OL the BoardAmerada Petroleum Corporation
D. A. McGee, PresidentKerr-McGee oil Industries, Inc.
E. Clyde McGraw, PresidentIndependent Natural Gas
Association of America
R. L. Milligan, PresidentThe Pure oil Company
ii
A. L. NickersonChairman of the BoardSocony Mobil Oil Company, Inc.
L. T. Potter, PresidentLone Star Gas Company
J. Howard Rambin, Jr.Chairman of the Board'l'exaco Inc.
C. Pratt Rather, PresidentSouthern Natural Gas Company
A. C. RubelChairman of the BoardUnion Oil Company of
California
Monroe E. SpaghtPresidentShell Oil 'Company
John E. SwearingenPresidentStandard Oil Company (Indiana)
Paul E. TaliaferroChairman of the BeardSunray DX Oil Compomy
E. H. TollefsonChairman of the BoardConsolidated Natural Gi
Company
H. A. True, Jr., Pr8sidentIndependent Petroleu~
Association of America
J. Ed Warren, PresidentCities Service Company
S. D. WhitemanChairman of the BoardKansas-Nebraska Natural Gas
Company, Inc.

COORDINATING SUBCOMMITTEEfor
PROVED CRUDE OIL RESERVES AND AVAILABILITYof the
NATIONAL PETROLEUM COUNCIL'SCOMMITTEE ON
PROVED PETROLEUM AND NATURAL GAS RESERVES AND AVAILABILITY (1964)
<;::HAIRMAN
Stuart E. BuckleyConsultant representing
Humble Oil & Refining Company
GOVERNMENT CO-CHAIRMAN
Charles L. MooreOffice of Oil and Gas
U. S. Department of the Interior
S. A. BerthiaumeTexaco Inc.
D. V. CarterMobil Oil ~ompany
A. G. CopelandShell Oil Company
T. A. DawsonIndiana Geological Survey
George H. GallowayPan American Petroleum
Corporation
Merrill W. HaasHumble Oil & Refining Company
SECRETARY
J. Paul JonesPennsylvania Grade Crude
Oil Association
R. R. LindslyPhillips Petroleum Company
D. D. LittleStandard Oil Company of
California
Kenneth E. MontagueSun Oil Company
Dr. Morris MuskatGulf Oil Corporation
RaYmond H. RantalaThe Pure Oil Company
\
Vincent M. BrownNational Petroleum Council
iii

COORDINATING SUBCOMMITTEEfor
NATURAL GAS AND NATURAL GAS LIQUIDS RESERVES AND· AVAILABILITYof the
NATIONAL PETROLEUM COUNCIL'SCOMMITTEE ON
PROVED PETROLEUM AND NATURAL GAS RESERVES AND AVAILABILI'ry (1964)
CHAIRMAN
B. B. GibbsUnion Producing Company
GOVERNMENT CO-CHAIRMAN
J. J. Simmons, IIIOffice of Oil and GasU.S. Department of the Interior
ASSISTANT TO CHAIRMAN
Wm. F. BurkeLone Star Gas Company
* * * *
C. C. BarnettUnited Gas Pipe Line Company
Preston A.. ColeCities Service Gas Company
R. O. GarrettTexas Gas Exploration
Corporation
J. V. GoodmanEquitable Gas Company
Theodore I. GradinAmerican Gas Association
SECRETARY
E. D. PresslerHumble Oil & Refining Company
Donald R. SchererSouthern Natural Gas Company
C. E. TurnerPhillips Petroleum Company
M. T. WhitakerMobil Oil Company
A. H. v-7iederShell Oil Company
Vincent M. BrownNational Petroleum Council
iv

SUM.I'v'lARY
This report combines, in a series of sepa~ate sections, the results of studies made during the latter part of 1964 and early 1965 bythe Coordinating Subcommittee for Proved Crude Oil Reserves and Availabili ty and the Coordinating Subconuni ttee for Natural Gas and NaturalGas Liquids Reserves and Availability in response to a request by theU. S. Department of the Interior to the National Petroleum Council. Twomain subjects are dealt with: first, historical tabulations of discoveries of crude oil, natural gas, and natural gas liquids in theUnited states and, second, estimates of the productive capacities ofthese materials as of January 1,1964.
Discoveries
The historical tabulations of proved discoveries of crude oil,natural gas, and natural gas liquids are summarized for the Unitedstates and by PAD districts in Tables I, II, and III. These tabulationsdo not represent new and original findings by this Committee with respect to reserves in the United states, but are a recasting of alreadyknown reserves estimates as of December 31, 1963. United states reserveshave been reported annually for some time by the American PetroleumInstitute and the Ameri"can Gas Association. Contrary, however, to theusual API and AGA practice, the estimates preseJ:lted in this report havebeen arranged at the request of the Department of the Int~rior accordingto the discovery years of the fields* to which the reserves are attribu"ted and the tabulations are carried only through the year 1958.
* Because of the large number of individual reservoirs now recognizedin many fields, there is always a question as to whether a new reservoir in an old field should be considered an extension of the oldfield and "~e given the discovery year of the old field, or whether,conversely, the new reservoir should be considered a later discovery.In this report, therefore, some new reservoir"s have been treated asif discovered in earlier years and significant ones have been givenlater discovery dates. A check of the results assures this Committeethat the treatment in individual cases has resulted in a sound answer.In general, reservoirs recognized at the time the 1961 report wasprepared were assigned the same discovery dates as before unless laterinformation showed the need to change. Reservoirs recognized afterthe 1961 study were assigned discovery dates on the basis of the bestinformation currently available.

The·discovery estimates given in this report represent the totalexpected recoveries, including both past production and remaining proyedreserves, based upon field size and past performance as such factorswere known on December .31, 1963. The usual practice of the industry inthe determination of reserves is quite different; the interest normallylies in the remaining reserves.
In subsequent sections of this report, it is shown by comparisons of the present estimates of discoveries with prior estimates madeby the NPC and others that the estimated recovery from the average fieldusually increases several fold over the estimate made at the end of thediscovery year and continues to increase from various causes for a greatmany years. The tabulations presented are useful, therefore, in providing through such comparisons insight into the magnitude and rate ofincrease of recovery estimates. The available data show that thefields already discovered in the United states represent an enormousbase for possible future additions to reserves through further extensionsand revisions. It is evident, therefore, that studies of the long termfuture supply of oil and gas in the United states must give cognizancenot only to the possible future discoveries of new fields but also tothe future additions to reserves from eXisting fields.
Because of the growth in estimated recovery, as more is knownabo~t a field and technology improves, a proper analysis of discoverytrends would require comparison of annual discoveries estimated by comparable methods at equal time intervals after discovery. It is important to recognize that the historical discovery tabulations presented inthis report are not so constructed but represent, instead, a single setof estimates, all based on data available at the end of 1963. The fieldsdiscovered in. 1958 have been credited with only five years' revisions,whereas those discovered in earlier years have been credited with revisions for progressively longer intervals ranging back to over 44 yearsfor fields discovered prior to 1919. The resultant distortion is fartoo great to permit sound deductions with respect to discovery trendsfrom this set of tabulations alone. The COIT@ittee wishes to emphasize,therefore, that the historical tabulations presented in Tables I, II,and III of this report do not by themselves provide a valid measure ofeither the amount discovered in prior years or of discovery trends.'
Productive capacity
The productive capacities of crude oil, natural gas liquids, andnatural gas on January I, 1964, were estimated to be:
Crude Oil:Natural Gas Liquids:Natural Gas:
11,590,000 barrels daily2,802,700 barrels daily
97,584,100 thousand cubic feet daily
2

Details with respect to the estimates of productive capacityare reported in Tables IV, V and VI. The estimated productive capacity.of crude oil is comparable with prior studies prepared for the NationalPetroleum Council. The estimated productive capacities of natural gasand natural gas liquids are comparable with those in the 1961 NationalPetroleum Council report. The estimate of the productive capacity ofnatural gas liquids is not comparable with estimates prepared for theNational Petroleum Council prior to the 1961 report. It represents thenatural gas liquids that would have been potentially recoverable if theproduction of crude oil and of natural gas on January 1, 1964, had beenat the capacity rates shown.
It should be noted that the productive capacity of crude oilcannot properly be compared with the production of crude oil and leasecondensate as reported by the United states Bureau of Mines under thename "crude pe"troleum". Lease condensate, which occurs in gaseous formin the reservoir but is recovered at the surface by separation fromnatural gas, is included herein with natural gas liquids. Productionof such condensate is becoming of increasing importance, particularlyon the Gulf Coast.
The estimates given in the report for productive capacities represent the rates at which oil, gas, and natural gas liquids could beproduced from existing fields and wells without regard to such limitations as lack of mechanical equipment or of surface facilities used inconjunction with producing, handling, processing, storage, or transportation. Also, governmental regulations under normal peacetime conditions, whether by agencies of the Federal Government or individualstates, are another limitation. The productive capacity is therefore ameasure of potential rather than actual availability. The differencebetween productive capacity as used in this report and actual availability may be quite large for crude oil, and even greater in the caseof natural gas and natural gas liquids.
Because of the many qualifications and limitations pointed outj,n this report with respect to all of the attached tables, the Committeewishes to emphasize that a complete reading of the text is required fortheir proper understanding and use. It is requested, therefore, thatthese tables not be separated from or used independently of the text.
HISTORICAL DISCOVERY TABULATIONS
"Basis of the Tabulations
In the 1961 Council report, estimates of discoveries based onpast production and estimated remaining proved reserves as of December31, 1959, were tabulated by years according to the discovery dates ofthe individual fields to which the reserves were attributed. Thetabulations therein terminated with the year 1954.
3 Il."

In the present report, the tabulations have been brought forward on the same basis through the year 1958, the assigned discoveriesbeing based on cumulative production and estimated remaining provedreserves as of December 31, 1963. The tabulations of discoveries donot represent new and original findings by this Con~ittee, but aremerely a recasting of discoveries based on estimates of proved reservespreviously reported by.the American Petroleum Institute and the AmericanGas Association.
Conversion from Remaining Reserves to Total Discoveries
In adherence to the well defined concepts of proved reservesused by the American Petroleum Institute and the ~nerican Gas Association,the Committee has included in its estimates only those quanti·ties of oil,gas, and natural gas liquids known as of December 31, 1963, to be recoverable from existing fields. However, since ·the present study isconcerned with past discoveries rather than an inventory of remainingreserves, the estimates have been expressed in terms of the total quantities now estimated to be recoverable from existing fields, includingboth past production and remaining reserves.
Growth in Recovery Estimates
When a new field is discovered it is customary to make a preliminary estimate of its expected recovery. At the end of the discoveryyear, the amount of oil or gas known to be recoverable may be only asmall fraction of the amount that will ultimately be recovered. Asdrilling proceeds in subiequent years and as more information is gained,the estimates of recovery will usually increase until deveiopment iscomplete. Thereafter, the estimates may continue to change from time totime. Disappointing performance may cause a downward revision. Moreoften, however, later appraisal will lead to upward revision. Furtheraddit i-on s---to- he estimate may be made as a result of improved recoverymeasures, such as inauguration of pressure maintenance or secondaryrecovery in an oil field. still further increases may result at anytime through enlargement of a field by exploratory drilling, which maymerely extend the field beyond its previously knmVD limits or may findnew pools. T~us each new field becomes the origin of a continuingstream of additions to reserves.
Through the reports issued annually since 1936 by the APIReserves Committee and since 1945 by the AGA Reserves Con~ittee, theindustry has grown accustomed to recognition of the aforementioned estimates of recoveries as an important factor in the continued growth ofoil and gas reserves in the United states.
4

I
'Limitations of Discovery-Year Tabulations
The method of tabulating the results in this report differsdrastically from that' used by the API and the AGA. As was done in t11e1961 report, the total quanti'ty of oil,. gas, or gas liquids now considered to be proved recoverable from each field is assigned in thisreport to that field as if that amount had been proved recoverable atthe time the field was discovered. The discoveries so attributed tothe individual fields are then arranged according to the years in whichthe fields were discovered, instead of according to the API-AGA methodby which additions to reserves are credited in the y~ars in which theoil, gas, and gas liquids were proved to be recoverable. The method oftabulation employed in this report would indicate that the quantitiesshown were discovered in the years listed, ,which is not true.
Interpretation of Tabulation of Discoveries
It should be noted, in particular, that the quantities of hydrocarbons shown for the fields discovered in a listed year do not represent the amounts that were originally believed to have been discoveredin that yeari because of subsequent extensions and revisions the amountsnow considered to be recoverable are much greater than the originalestimates. For example, and with respect particularly to fj,elds discovered in earlier years , quantities are now credited as recoverable byapplication of techniques that were not even known or in use at the time,of discovery of the fields.
Correspondingly, future extensions and revisions may bring aboutfurther increases in the illTIOunt of recoverable hydrocarbons assigned tothe fields listed in a given year. In fact, the full extent of theamounts that will ultimately be recovered from these fields will not beknown until many years in the future when each of the fields will havebeen fully explored and finally depleted.
For those reasons, it is evident that caution must be used ininterpreting the dj.scovery tabulations included in this report. Aseries of such tabulations made over a period of years may provide usefulinformation as to the growth in estimates of recovery. However, a singletabulation, standing alone, would not yield a complete and proper pictureof the trend in discoveries. '
5

HISTORICAL DISCOVERY RECORD FOR CRUDE OIL
The tabulation of crude oil discoveries presented in Table Iwas prepared by taking, for each individual oil field* in the UnitedStates (including abandoned fields), the total past production plus theremaining proved reserves of crude oil as estimated by the API ReservesCommittee on December 31, 1963, to arrive at a total considered to represent the crude oil "dj.scovered" in each field. These totals were thentabulated according -to the years in which the individual fields were_discovered.
As stated earlier, in this type of tabulation the total quan-ti tyof oil now considered to be proved recoverable from each field is assigned to tha-t field as if that amount had been proved recoverable atthe time the field was discovered, which was not true. Furthermore,when the quantities so at.tributed in hindsight 'co individual fields arearranged by years according to the initial discovery dates of the fields,instead of according to the years in which -the oil was determined to berecoverable, the tabula-tion tends to indica-te thaI: the quanti ties ofoil shown were discovered in the years listed, which is also not true.
Comparison with Prior Estimates
It is customary when a new field or pool is discovered to makea preliminary estimate of its expected recovery. Such estimates havebeen reported annually by the API since 1936 for proved reserves discovered in new fields and in new pools in old fields. As such newfields and pools undergo subsequent development and reappraisal thequantity of oil recognized as proved will usually increase. The quantityof oil recognized as proved subsequent -1:0 the discovery year is qdded tothe total proved reserves as extensions and revisions. Over the period1936 through 1963, the total additions to proved reserves by the APIwere about sixfold the amount assigned to new fields and new pools. Itis evident, therefore, that the estimates of recoverable oil from newfields and new pools at the end-of the discovery year represent only asm~ll fraction of the oil that will ultimately be recovered from thosefields.
* See footnote on Page 1.
6

Some insight as to the growth in estimates of recovery frompreviously discovered fields is afforded by the following comparisonbetween estimates reported by the API at the end of the discovery yearfor additions to reserves in new fields and new pools and the amount ofoil now assigned to the fields discover~d in those same years as reportedin Table I.
COMPARISON OF PRESENT ESTIMATES OFDISCOVERIES WITH INITIAL API ESTIMATES
FOR NEWFIELDS I~D NEW POOLS(Millions of Barrels)
FIELDS DISCOVERED INITIAL API EST. PRESENT EST. RATIO: PRESENTDURING PERIOD OF DISCOVERIES OF DISCOVElUES TO INITIAL EST.
1939 thru 1943 1,600 9,686 6.11944 thru 1948 2,017 9,888 4.91949 thru 1953 2,933 9,525 3.21954 thru 1958 2,261 5,859 2.6
Further appreciation of the importance of the growth in estimates of recovery may be obtained from a comparison of the presentestimates of discoveries with previous estimates prepared on a similarbasis. 'l'he following tabula-tion compares the discoveries as listed inTillJle I of this report with those of the 1961 report and a similartabulation prepared by the PAW in 1945:
COMPARISON WITH PREVIOUS ESTIMATESOF DISCOVERIES OF CRUDE OIL TABULATED
ON SIMILAR BASIS(Millions of Barrels)
FIELDS DISCOVEREDDURING PERIOD
Total thru 19191920 thru 19441945 thru 1954
PAW ESTIMATEMADE IN 1945
14,64037,482
7
NPC ES'rrMATEMADE IN 1960
17,36756,24417 ,815
NPC ESTIMATEMADE IN 1964
18,59160,21918,949

It may be noted in the preceding comparison that the growth inestimated recovery is not confined to recent years. There has been anincrease of 1.2 billion barrels during the last four years in the estimated recovery assigned to fields discovered prior to 1920. Thesefields were already 40 years old at the time of the priorNPC study.The comparison provides further support for the conclusions of the 1961report that the aggregate of all fields heretofore discovered representsan enormous base for future additions to reserves through further extensions and revisions and that studies of the long term future supply Ofcrude oil in the United states must recognize this source.
The temptation to consider the results of this study as indicating that additions to reserves of crude oil represent a simple timeseries should be avoided. Additions to reserves do not resul"t simplyfrom the passage of time. They result, instead, from a number of otherfactors, including exploration and development and the application ofimproved technolo9Y, all of which depend on economic incentives and areinfluenced by prevailing government policies and regulations at bothstate and federal levels.
HISTORICAL DISCOVERY RECORD FOR NATURAL GAS N~D"
NATURAL GAS LIQUIDS
The same methods as were employed in obtaining the historicalrecord of discoveries of crude oil were used in preparing the similarrecords for natural gas and natural gas liquids shown in Tables II andIII. The proved reserves of these substances as e"stimated by theAmerican Gas Association Committee on Reserves on December 31, 1963,were converted to total discoveries rather than remaining reserves andhave been tabulated by years through 1958 according to the discoveryyears of the individual fields*.
Comparison with AGA Estimates for Gas
Insofar as the Committee is aware, the only previous study forgas and natural gas liquids in which estimated recoveries were tabulatedaccording to discovery years of the individual fields and reservoirs wasmade by the NPC in 1960. Some insight into the growth in recovery estimates for these materials may be obtained by comparison of the presentestimates with estimated recoveries assigned by the AGA to new fieldsand new pools. Some of the factors that have contributed to the continued large upward revisions of estimated recoveries of crude oil, suchas secondary recovery methods, are not applicable to natural gas. Also,the natural expulsion forces are, in general, more efficient in recovery
* See footnote on Page 1.
8
r'

of gas than oil. Tl1US the theoretical limit of gas-in-place would bereached sooner than in oil and would tend to restrict the magnitude offuture upward revisions.
In spite of these limitations, upward revisions of recoveryestimates for both natural gas and natural gas liquids have resultedfrom technological improvements. Such factors, for ex~nple, as wellstimulation and well fr<lcturing have contributed materially to greaterrecovery of natural gas, and advances are continuously being made inthe recovery of natural gas liquids from the gas processed. Upwardrevisions stemming from extens:Lon. drilling and more complete productionhistory are equall.y applicable to gas ·and oil.
In addition to revisions of the reserve estimates due to additional production history or additional drilling, the discovery datesof fields or reservoirs may also chalige as a result of drilling. Twoexamples of a change in discovery dates as a result of drilling are:
1. Two fields discovered at different dates and later found,as a result of additional drilling, to be connected to form onefield, would result in the reallocation of the reserves in the secondfield to the date of discovery of the older field.
2. Subsequen·t drilling which proved a major reserve in what wasoriginally thought -to be an insignificant rescrvo.ir discovered late inthe life of an old field ~ould result in the reallocation of reservespreviously credited to the original discovery date of ~he field tothe later date of dj_scovery of the reservoir.
- --Es"tiT tes reported annually by the American Gas Associationbeginning in 1947 show that the amount added to reserves of natural gasthrough ex-tensions and revisions has, on the average, exc.eeded by slightly more than twofold the reserves credited annually to discoveries innew fields and new pools as estimated at the end of the discovery years.For the 17-ye~r period 1947-63, inclusive, 92.8 trillion cubic feet ofgas were credited to newly discovered fields and pools whereas, duringthe same interval, 193.3 trillion cubic feet were added to reservesthrough extensions and revisions. Although the amount added by extenstions and revisions relative to the additions from new fields and newpools is not as great in the case of gas as in the case of crude oil, ithas nevertheless been appreciable. For the years 1947-58, inclusive,the AGA showed a total of 61.5 trillion cubic feet of gas assigned tonewly discovered fields and pools. The present NPC report, based ondata available at the end of 1963, assigns 148.6 trj_llion cubic feet tothe fields discovered in those years, an increase of 2.4 fold. It mustbe concluded, therefore, that the growth in estimated recovery from afield as heretofore described in detail for oil fields is applicable to
9

g'as fields also, though perhaps not to so great a degree. A comparisonof present estimates of discoveries with AGA estimates and the 1960 NPCestimate is sun~arized in the following tabulation:
COMPARISON OF ESTIMATES OF NATURAL GAS RESERVESDISCOVERED FOR PERIODS SHOWN
(Trillions of Cubic Feet @ 14.65 psia and 600 F)
NPC NPCAGA ESTIMATE ESTIMATE 1960 1964
NEW FIELDS MADE MADE RII.TIO RATIO& RESERVOIRS IN 1960 IN 1964 NPC TO AGA NPC TO AGA
1947-54 35.5 95.8 103.5 2.7 2.91955-58 26.0 45.1 1.71947-58 61.5 148.6 2.4
The importance of the growth in estimates of recovery is emphasized by comparing the present estimates of discoveries with the previous estimate prepared on a similar basis. The following tabulationshows the comparison,of discoveries as listed in Table II of this reportwith those of the 1961 report:
COMPARISON WITH PREVIOUS ESTIMATESOF DISCOVERIES OF NATURAL GAS TABULATED
ON SIMILAR BASIS(Trillions of Cubic Feet @ 14.65 psia and 600 F)
FIELDS DISCOVERED NPC ES'rIMATE NPC ESTIMATEDlJRING PERIOD MADE IN 1960 MADE IN 1964
Total thru 1919 75.8 83.01920 thru 1944 227.6 242.51945 thru 1954 115.7 127.0
It is to be noted that, as in the case of crude oil, the growthin estimated recovery is not confined to recent years. During the pastfour years, a grow~h of 7.2 trillion cubic feet has occurred in theestimated recovery assigned to fields discovered prior to 1920, despitethe fact that these fields were not less than 40 years old at the timeof the prior NPC study.
Comparison with AGA Estimates for Natural Gas Liquids
In the case of natural gas liquids, the annual reports of theAmerican Gas Association show a total of 1.68 billion barrels added toreserves through discoveries in new fields and new pools over the
10

interval from 1947-63, inclusive. During the same interval, 8.28billion barrels were added to reserves through extensions and revisions.The ratio of the amount odded through extensions and revisions to thequantity attributed to new fields and new pools was 4.93. For theperiod 1947-58, the AGA showed a tot,al of 1.01 billion barrels discovered in new fields and new pools. The present NPC report assigns4.35 billion barrels to the fields discovered in tllOse years, anincrease of 4.3 fold. It may be concluded, therefore, that in the caseof natural gas liquids, the magnitude and duration of the increase inestimated recoveries as a result of extensions ond revisions are comparable to the experience for crude oil. The large increase undoubtedlyreflects additional extraction plants, increased efficiency of existingplants, emphasis in recent years on pressure maintenance and cycling ofgas condensate reservoirs, and increases in the estimated reserves ofnatural gas from vJhich the liquids are extracted. A comparj.son of present estimates of dj.scoveries with AGl-, estimates and the 1960 NPC estimate issurrrrnarized in the following tabulation:
COMPN~ISON OF ESTIMATES OF NATURAL GAS LIQUIDSRESERVES DISCOVERED FOR PERIODS SHO~~
(Millions of Barrels)
NPC NPCAGA ESTIMATE ESTH1ATE 1960 1964
NEV'l FIELDS MADE MADE RATIO RATIO& RESERVOIRS IN 1960 IN 1964 NPC TO AGJ1, NPC TO AGA
1947-54 614.3 2,579.8 3,126.4 4.2 5.11955-58 398.2 1,222.0 3.11947-58 1,012.5 4,348.4 4.3
The growth in estjmated recovery of natural gas liquids is notconfined to recent years any more than is the case for crude oil, asthe following tabulation shows:
COMPARISON WITH PREVIOUS ESTIMATESOF DISCOVERIES OF NATURAL GAS LIQUIDS TABULATED
ON SIMILAR BASIS(Millions of Barrels)
, FIELDS DISCOVERED NPC ESTIMATE NPC ESTIMATE,.DURING PERIOD MADE IN 1960 MADE IN 1964
Total thru 1919 1,230.5 1,651.01920 thru 1944 6,046.4 7,331.41945 thru 1954 3,132.0 3,878.5
11

Historical Tabulations Do Not Show Discovery Trend~
It may be 'concluded from the preceding considerations thatfuture additions to estimated recoveries nf natural gas and of naturalgas liquids may be expected from fields already discovered. As in thecase of crude oil, therefore, the historical tabulations presented inTables II and III should not be construed as representing an accuraterecord of discovery trends. Furthermore, the conclusions heretoforereached with respect to crude oil may be considered applicable also tonatural gas and natural gas liquids.
CRUDE OIL PRODUCTIVE CAPACITY
The productive capacity of crude oil in the United States onJanuary 1, 1964, is estimated to have been 11,590,000 barrels a day,including 175,000 barrels a day in the Elk Hills field in Californiaof which all but 8,000 barrels a day were shut -in. Estimate's by PADDistricts were as follows:
PAD DISTRICT
1. East Coast2. Mid-Continent3. Gulf Coast4. Rocky MountainS. West Coast
CRUDE OIL PRODUCTIVE CAPACITY(THOUSAND BARRELS DAILY)
301,4738,399
6781',010
Total United States 11,590
•The present study indicates an increase in productive capacity
since January 1, 1960, of one million barrels a daYr substantially all ofwhich occurred in District 3. Changes in other districts were not significant. A comparison of the present estimate by PAD districts with priores'timates by the National Petroleum Council is shown in Table IV.
As in prior NPC reports, it must be emphasized that the estimatesof productive capacity deal only with the quantities that could be produced from known fields through existing wells without regard to possiblelilnitations ot transportation or other facilities. The known limitationsof such additional facilities make it evident that the full amount ofoil producible in the United States could not be made available on shortnotice.
12

Basis of Estimate
The producti ve capacity of crudc oi 1 estimated by this Conuni tteeis believed to be consistent both conce~tually and numerically withestima·tes prepared by prior committees 0.£ tl1c NZltional Petroleum Council.However, there appC'ars to exist some lack of understanding of the meaningof productive capacity and its conceptual basis. Accordingly, the matteris discussed more fully in this report than has heretofore been customary.
Productive capacity as. used in this report represents an estimate of the aggregate capability of the various fields and reservoirsin the United States within the limitations of generally accepted produd:ion practices, b'ut viewed primarily from the, tandpoint of thephysical capabilities of the fields and reservoirs and not, in general,from the standpoint o£ the limitations that might be imposed by lack ofmarkets, lack of transportation, inadequacy of mechanical equipment,lack of facilities for proper handling of gas or water produced withcrude oil, or any other correctible impediments to production. It represents potential availability rather than immcdia1:e or actual availability. The purpose in making an estimate on thi.s basis is to provideinformation on what might be produced should the need ever arise. It ispresumed that deficiencies in equipment, related facilities, etc., couldbe corrected if necessary. On the other hand, if the estimate of productive capacity wer~ limited to what could be produced currently underpre.vuiling condi t.i.ons wi t11 respect to equipment und related f acili ties,such an estimate could reflect,. for some fields, primarily the capacityof mechanical equipment and would fail to reveal the additional amountof oil that could be made available by full utilization of the capabilities of the fields and reservoirs.
The difference between productive capacity and current availability j_s especially important in Louj_siana and 'I'exas. In both of thesestates, production of crude oil is restricted to market demand underregulations administered by state regulatory agencies. The drilling,completion, and production of wells is subject also, to many otherregulations designed to promote conservation. For eXillople, to preventwas'Le of natural gas, limitations may be imposed on the amount of gasthat may be produced from an oil well, or regulations may require thatall gas produced with oil in certain fields be gathered and put to anapproved use. In order to prevent surface pOllution, or to supportreservoir pressure, water produced with crude oil may be collected andinjected into un erground reser airs.
In both Louisiana and Texas, the prevailing levels of permittedproduction of crude oil have been, for a number of years, far less thanthe productive capacity. As a consequence, in many fields, the facilities and equipment for gathering and handling gas and water producedwith crude oil are sized to conform with the prevailing or anticipatedrates of oil production and not the productive capacity. The same may
13

be. true in many wells with respect to the size of tubing or of pumpingequipment. It is quite evident, therefore, that there is at present asubstantial difference between productive capacity and immediate availability of crude oil.
On the other hand, it must be recognized that should a nationalemergency arise of such nature as to require extreme measures to attainmaximum production of crude oil, some of the limitations discussed inthis report could be set aside, particularly for the short term. Forexample, restrictions related to the conservation of gas produced \'lithcrude oil or to the concern for surface pollution from produced watercould be waived in time of emergency.
Estimate is Based on Informed Judgment
Many of the oil fields in the United States are already producing at capacity. In such fields, the productive capacity is simplythe actual production and there is no difference between productivecapacity and current availability.
In other fields, however, production is restricted because oflack of sufficient markets to require production at capacity, or because state regulatory authorities restrict production to prevent waste.In such fields, the productive capacity or potential availability mayfar exceed the actual production.
In short, then, the estimated productive capacity as reportedrepresents the total production of crude oil in the United states plusan estimate of the total additional quantity of oil which could ~3ve
been produced from the existing fields on January 1, 1964, under generally accepted production practices, had the requirements for crude oilmade such production necessary, and had there been no limitations resulting from the preViously described lack of related facilites.
The number of oil fields and reservoirs in the United stateshas grown,to such a large total as to preclude individual appraisalbased on geologic and engineering analysis of each oil reservoir. ThisCommittee makes no representation that such analysis has been made.Rather, the estimate of productive capacity has been based on the performance of fields and wells under prevailing conditions and throughcomparison, where possible, with the behavior of the same or similarfi~lds or wells under other conditions that might have prevailed previously. The figures reported represent estimates based on informedand experienced judgment.
14

Productive Capacity Continuously Changes
The productive capacity is in a continual state of flux. Production of old wells declines continuously, and capacity in restrictedfields declines as oil reserves are depleted. On the other hand, thecapacity is augmented by the completion of new wells, by inaugurationof secondary recovery projects in old fields, or by pressure maintenanceor stimulation procedures.
The productive capacity in this report represents an estimateof the capacity as of January 1, 1964. This estimate contains noassumptions as to future rates of drilling, or of the decline in capacity that might result should drilling cease. It should be noted thatthis estimate of productive capacity relates to crude oil only, and doesnot include condensate. For this reason, the estimate is not directlycomparable with the statistics on production of crude petroleum, including lease condensate, published by the United states Bureau of Mines.Productive capacity of condensate, which is produced from gas wellsrather than oil wells, is included with natural gas liquids.
PRODUCTIVE CAPACITY OJ. NATUR~~ GAS
The productive capacity of natural gas in the United states onJanuary 1, 1964, is estimated to have been 97,584 million cubic feetper day. A summary by PAD districts is shown below:
DIS'I'RICT
1. East Coast2. Mid-Continent3. Gulf Coast4. Rocky Mountain5. West COilSt
NATURAL GAS PRODUCTIVE CAPACITY(THOUSANDS OF CUBIC FEET DAILY
@ 14.65 PSIA AND 600 F)
930,20014,708,00077,324,000
2,228,9002,393,000
Total United states
15
97,584,100

Na·tural gas commonly occurs in solution in crude oil or associated with crude oil as well as in reservoirs that contain no oil. Theabove estimate of productive capacity is the total of the individuallyestimated productive capacities of non-associated, .associated, anddissolvcd gas. * Productive capacities by PAD distric·ts by type of gasare shown in Table V.
The present study indicates an increase in productive capacitysince January 1, 1960, of 26,080 million cubic feet per day, nearly allof which occurred in the Mid-Continent and Gulf Coast states, withrespective increases of 6,504 and 19,203 million cubic feet. Table Vshows t.he 1960 estimates, in total, by PAD districts.
* The Subcommittee has adopted the definiU.ons used by the .Col11Initteeon Nu·tural Gas Reserves of the American Gas Associ ation, as follows:
(a) Non-associated gas: free gas not in contact with crude oil inthe reservoir; and free gas in contact with oil where the production of such gas is not significantly affected by the production of crude oil.
(b) Associated gas:reservoir whereaffected by the
free gas in contact with crude oi~ in thethe production of such gas is significantlyproduction of crude oil.
(c) __I?i..§..solved gas: gas j.n solution with crude oil in the reservoir.
16
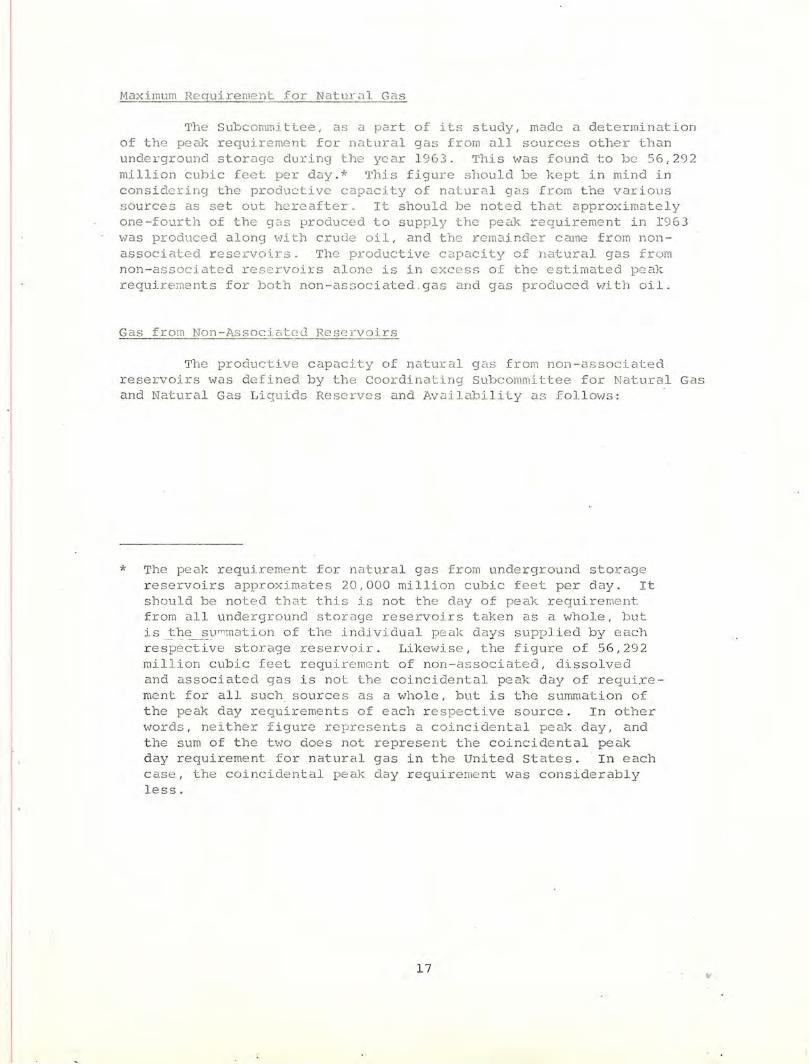
Maximum Requirement for Natural Gas
The SUbCOlThllittee, as a part of its study, made a determinationof the peak requj.rement for natural gas from all sources other thanunderground storage during the ycar 1963. This was found to be 56,292million cubic feet per day.* This figure should be kept in mind inconsidering the productive capacity of natural gas from the varioussources as set out hereafter. It should be noted that approximatelyone-fourth of the gas produced to supply the peak requirement in 1963was produced along with crude oil, and the remainder came from nonassociated reservoirs. The productive capacity of natural gas fromnon-associated reservoirs alone is in excess of the estimated peakrequirements for both non-associated gas and gas produced with oil.
Gas from Non-Associated Reservoirs
The productive capacity of na-tural gas from non-associatedreservoirs was defined by the Coordinating Subcommittee for Natural Gasand Natural Gas Liquids Reserves and Availability as follows: -
r .
* The peak requirement for natural gas from underground storagereservoirs approximates 20,000 million cubic feet per day. Itshould be noted that this is not the day of peak requirementfrom all underground storage reservoirs taken as a whole, butis_~~~~~mation of the individual peak days supplied by eachrespective storage reservoir. Likewise, the figure of 56,292million cubic feet requirement of non-associated, dissolvedand associ a-ted gas is not the coincidental peak day of requixement for all such sources as a whole, but is the summation ofthe peak day requirements of each respective source. In otherwords, neither figure represents a coincidental peak day, andthe sum of the two does not represent the coincidental peakday requirement for natural gas in the United states. In eachcase, the coincidental peak day requirement was considerablyless.
17

"The maximum sustainable rate at which a field can beproduced under present conditions without specificregard to production equipment, pipe line capacities,or es-tablished allowables."
The productive capacity of all gas wells completed in non-associated reservoirs in -the United states on January 1, 1964, was
_estimated to be 74,930 million cubic feet per day. This was greaterthan the peak requi rement in 1963, estimated by the Subcommi-t-tee-to total 56,292 million cubic feet from all sources. In the prior NPCreport, the comparable productive capacity was estimated at 50,791million cubic fee-t per day.
Gas Produced With Oil
The productive capacity of natural gas produced with oil dependson ~che rate of oil production. The Subcommittee has estimated -that -ifcrude oil were produced at the estimated January 1, 1964, capacity rateof 11/590,000 barrels a day, the quantity of gas produced with that oilwould have been 22,655 million cubic feet per day, of which 15/899million cubic feet would have been gas dissolved in the oil. - The remaining 6,756 million cubic feet represents gas that would have beenproduced from associated gas reservoirs. It should be particularlynoted that the rate of production of dissolved and associated gas dependson the rate of oil production. In Table V, which shows the- productivecapacity for the three types of gas, all estimates of productive capacityfor associated and dissolved gas are based on the supposition that oilis being produced at the capacity rates shown in Table IV.
The present estimates of productive capacity of natural gasproduced with oil reflect the growth in crude oil productive capacity.In the prior--: C report, it was estima-ted that if crude oil had beenproduced at the estimated January 1, 1960/ capacity rate of 10,585,000
- barrels a day, the quantity of natural gas produced with that oil wouldhave been 20,713 million cubic feet per day. Thus, t_he present e-stimatesrepresent an increase of 1,942 million cubic feet, in total, consistingof increases ot 493 million cubic feet of gas dissolved in the oil andof 1,449 million cubic feet of gas that would have been produced fromassociated gas reservoirs.
Gas in Cycled, Shut-In, and Storage Reservoirs
The estimated productive capacity includes gas from fields whichare now being cycled, as well as gas from fields which are not at present producing but are capable of production. The estimated productivecapacity does not, however, include any gas which may be available fromstorage reservoirs.
18

Productive Capacity is Not rwailabj.lit-y
The productive capacity of natural" gas was estimated on the saIneconceptual basic as was used to estim~te the productive capacity ofcrude oil. That is, it reflects the capacity of the gas and oil reservoirs and is a measure of the amount that could be produced from existing wells without regard to limitations of markets, transportation,and processing facilities.
It is evident from the foregoing considerations that the productive capacity of natural gas, as used in this report, is in no sense ameasure of the current av"j.lahility of gas for consumption, and itshould not be so construed. Presently available facioli ties limit theuse of gas that could be produced. Any increase in daily productionwould require adequate markets and the installation of additional pipeline, compressor, and other facilities, with allowance for the time andmaterial required for such installation.
The productive capacity of natural gas must be viewed in anentirely different light from the productive capacity of crude oil.Oil can be stored in tanks ncar the area of production and can then bemoved to refinery or market when needed. On the other hand, gas afterleaving the well can only be carried through pipeU.nes to °tlJe market.The storage of gas is quite expensive illld requires much advance planningand construction since the principal containers are underground reservoirs. In actual practice, the storage of gas ha3 been largely corifinedto the storage of limited quantities in natural underground reservoirsnear the market to improve the load factor of the pipelines. This basicdifference must be kept in mind in evaluating the estimate of productivecapacity contained herein.
As pointed out above, part of the total productive capacity ofnatural gas is gas that would be produced with oil if oil were beingproduced at capacity. If oil were ever to be produced a·t such rates,additional facilities and markets would have to be provided to avoidventing part of this gas.
Another limitation on the full use of the daily volumes ofnatural gas estimated as producible is the load factor of the existingor additional markets to be served. In otlJer words, one cannot multiplythe estimated capacity of 97,584 million cubic feet as of January 1, 1964,by 365 and thereby obtain the annual amount that could be produced fromthis daily quantity. Such a quantity must be miltiplied by the loadfactor of the market to obtain the annual amount. The Subcommitteefound that the overall load factor (the ratio of the average daily production to the peak day production) of gas production in the UnitedStates is about 70%.
19

The producibility of gas from a reservoir is not directly proportional to the volume of gas contained in the reservoir, but dependson the underground physical characteristics.· Gas could not be producedindefinitely at the maximum rates estimated in this report because thosereservoirs thnt have higher productive capacities per unit of gas reservewould be rapidly depleted.
* * * * * *
In surrunation, the Subcommittee finds tl:at while the productivecapacity of natural gas from non-associated reservoirs appears to besufficient to supply the current demand, there is available in additiona large quantity of gas produced with crude oil. At 1963 rates of oilproduction, there was produced along with the oil some 12,923 millioncubic feet per day of gas. The difference between this value (12,923)and the value of 22,655 for January 1, 1964, consists of gas which canonly be produced by increasing the rate of oil production throughoutthe United states to the maximums set out in 'rable IV. Under thesecircumstances, no value of productive capacity of natural gas shouldbe taken from or deduced from this report, unless the quantity of gasproduced with oil is separately determined and related to the contemporaneous rate of oil production.
A further aspect of the productive capacity of natural gasshould be kept in mind. 'The fact that this report shows that ·totalproductive capacity exceeds the current demand does not mean that thisexcess is distributed uniformly throughout the United states or isuniformly available to all gas companies and customers or that nosection of the United states will experience any shortage. To illustrate, on January 1, 1964, the productive capacity from non-assoctatedreservoirs in District 3 was 58,828 million cubic feet. When there isadded to this 9,743 million cubic feet currently being produced withoil, the total current capacity is found to be 68,571 million cubicfeet per day. The peak day production in District 3 for 1963 wasapproximately 43,697 million cubic feet. This indicates an excess, inDistrict 3, as of January 1, 1964, of 24,874 million cubic feet per daywith the oil wells being produced at 1963 rates. The comparable excessfor the United states is 31,561 million cubic feet per day. This indicates that substantially all of the current excess capacity is locatedin District 3.
Such excess, to supply increased demands or to offset anticipateddecline in other areas, would have to be transported to such areas bypipelines either existing or to be provided.
20

PRODUCTIVE CAPACITY OF NATURAL G~S LIQUTDS
Natural gas liquids are those hydrocarbon liquids that, in thereservoir, are either in gaseous form or. in s01ut,ion in crude oil. Atthe surfi1ce, they cl.re recovered as liquids by separation from naturalgas by such processes as condensation or absorption, in field separators,scrubbers, gasoline plants, or cycling plants. Natural gasoline, condensate, and liquefied petroleuIn gases fall in this category. Sincenatural gas liquids are not produced as such from underground reservoirs but become available solely by separation from natural gas, theiravailability depends directly on the rate of production of gas and oiland requires the eXis1:~flce of etdeguate separation or extraction equipment to effect their' removal from the produced gas.
In reports prepared prior to the 1960 study for the NationalPetroleum Council, the estimated availabili-ty of naturill gas liquidswas restricted to the volumes that could be recovered through existingplants and o-ther equipment fro the gas actually being produced. Suchwas not the case in the 1961 report nor in the present study. In aneffort to appraise more fully the total potential productive capacityof petroleum liquids in the Unit.ed States, t11e Coromi 1..tee has estimatedthe capacity of natural gas liquids on the basis of he volumes thatcould be recovered Lf both cr~lcle oil and natural gas "Jere being producedat :the full capacity l."ates shown elsewhere in this report. On -thisbasis, the maximum productive ci;\pacity of natural gas liquids has beenestimated as shown in the following tabulation, which also includes theestimates from the prior NPC study:
MAXlMU1 PRODUCTIVE CIPACITY OF NATL~AL GAS LIQUIDS(Barrels Daily)
January 1, 1964January 1, 1960
FROM GAS FROMNON-ASSOCIATED
RESERVOIRS
1,697,900938,800
FROM DISSOLVED GASAND GAS FRQl\1
ASSOCIATED RESERVOIRSPRODUCED WITH CRUDE OIL
1,104,800860,800
TOTAL
2,802,7001,799,600
The present estimates of productive capacities are shown inTable VI by PAD districts and by types of gas from whi.ch separated. Thedistrict totals from the prior NPC study are also shown.
21 IE

Productive Capacity is Not Availability
It must be recognized that the preceding estimate is not anactual availability, for. the plants do not now exist that would berequired to recover these liquids, and neither gas nor oil is beingproduced at rates even closely approachin. capacity production. However,as a measure of the volume that could be made available under all-outconditions, the estimate should be useful in appraisal of this country'stotal hydrocarbon resources. The actual future quantity of naturalgas liquids producible at any given time will depend on the volumes ofgas and oil being produced and on the installation of the necessaryextraction facilities. The remarks previously made with respect tonatural gas productive capacity concerning market, load factor, and theinterrelation of a large part of the capacity to the rate of oil production are also applicable to natural gas liquids.
22

TABLE
TABLE
I
II
TfI..BLES
Estimated Discoveries of Crude Oil Now Assignedto Fields and Reservoirs Discovered in VariousYears
Estimated Discoveries of Natural Gas Now Assignedto Fields and Reservoirs Di covered in Vario~s
Years
TABLE III
TABLE IV
TABLE V
TABLE VI
Estimated Discoveries of Natural Gas Liquids NowAssigned to Fields and Reservoirs Discovered inVarious Years
Crude Oil Productive Capacity in the Unitedstates (1951-1964)
Maximum Productive Capacity of Natural Gas inthe United states (1960, 1964)
Maximum Productive Capacity of Natural GasLiquids in the United states (1960, 1964)
NOTE: These six tables should be used only after a reviewand full understanding of the text on discoveries andproductive capacity of crude oil, natural gas, andnatural gas liquids.
23

TABLE JSUMMARY OF ESTINATED DISCOVERIES
OF CRUDE OIL NOW ASSIGI~D TOFIELDS DISCOVERED IN YEARS SHOWN
(Thousands of Barrels)
FIELDS Al'IDRESERVOIRSDISCOVERED DISTRIC'J' 1 DISTRICT 2 DISTRICT 3 DISTRICT 4 DISTRICT 5 TOTAL U. S.
Through 1919 2,006,106 6,232,032 3,922,944 787,435 5,642,781 18,591,298
In J.920 3,654 701,225 203,147 41,270 1,5J.4,350 2,163,9461921 3,327 435,103 1,633,717 85,050 879,000 3,036,1971922 2,756 169,606 937,022 190,592 188,600 1,488,5761923 1,858 588,551 329,109 43,073 279,000 1,241,5911924 2,223 314,719 264,640 53,063 306,600 941,2451925 2,368 76,1194 735,509 61,141 IS!:'. 700 1,031,2121926 3,376 748,858 2,116,271 7,306 363,250 3,239,6611927 4,000 578,889 508,018 206,148 169,496 1,466,551J.928 2,361 873,520 830,341 95,768 632,061 2,434,0511929 4,500 525,675 2,245,285 ]4,650 66,435 2,856,545
1930 2,195 272,756 6,653,876 157,344 21,100 7,107,2711931 730 270,357 1,619,602 6,300 537,404 2,434,3931932 460 81,535 3J.2,773 197,056 115,630 707,4541933 740 304,780 375,306 602,254 86,040 1,369,1201934 1,000 278,264 1,709,435 720 238,300 2,227,7191935 1,500 674,669 2,692,781 25,830 44,610 3,439,3901936 2,119 108,579 1,071,294 6,351 1,481,911 2,670,2541937 8,900 1,006,185 3,477,135 54,450 284,016 4,830,6861938 1,360 797,862 1,658,732 73,339 922,296 3,453,5891939 990 325,138 975,135 0 111,614 1,412,877
1940 1,120 567,260 2,534,446 9,200 36,.643 3,148,6691941··- -- _,230 592,153 1,101,859 0 487,561 2,182,8"031942 1,210 180,588 903,570 338,822 30,268 1,454,4581943 13,769 304,675 907,142 167,053 49,340 1,441,9791944 700 241,623 1,302,700 355,845 162,87.5 2,063,7431945 2,365 129,741 1,567,300 16,100 206,941 1,922,4471946 910 630,538 662,282 174,416 68,968 1,537,1141947 -2,262 258,438 599,328 37,466 265,835 1,163,3291948 1,440 145,831 2,703,799 184,457 171,966 3,207,4931949 900 198,702 2,054,073 191,924 .279,039 2,724,638
1950 1,400 159,612 1,905,651 120,278 50,395 2,237,3361951 860 236,095 785,928 187,802 69,758 1,280,4431952 870 418,823 808,231 214,269 98,066 1,540,2591953 740 163,446 1,262,014 243,833 56,692 1,726,7251954 913 231,572 1,17 0,680 169,638 68,236 1,641,0391955 980 193,258 848,527 81,162 88,969 1,212,8961956 1,445 199,141 609,838 199,055 28,615 1,038,0941957 1,340 268,669 623,612 169,913 196,951 1,260,4851958 1,750 222,459 389,351 66,570 78,397 758,527
Total 2,092,727 20,707,421 57,012,703 5,636,943 16,536,309 101,986,103

TABLE IISU -1f.1ARY OF ESTIMATED DISCOVl':RIES
OF NA'I'URl\.L GAS NOh' ASSIGNED TOFIf,LDS DISCOVERED IN YEl\J'S_.~IIOWN
(Millions of Cubic Fnct @ 14.65 psia and 600F)
FIELDS ANDRESERVOIRSDISCOVERSD DISTRICT 1 DISTRICT 2 DISTRICT 3 DISTRICT 4 DIS'l'RICT 5 TOTAL U.S .._------
Through 1920 ]5,238,385 13,300,936 4'7,252,408 1,307,925 5,868,245 82,967,899
In 1920 365,421 1,445,23] 87, ,~6/. 37,567 1,095,818 3;031,4991921 17'7,877 895,59S 2,783,021 44,799 1,084,S09 4,986,1041922 98,322 28,373,183 5,3G1,S3:l 239,887 131,370 34,204,29')1923 125,108 1,417,991 407,136 20,844 393,265 2,364,3441924 74,288 653,245 664,978 41,656 313 ,800 1,747,9671925 152,540 521,78'1 850,102 64,271 38,708 1,627,4051926 396,515 1, 368, 5!IU 2,324,582 681,105 264,400 5,035,1421927 137,564 1,539,868 12,631,681 242,065 108,381 14,659,5591928 755,015 2,405,712 1,207,825 240,109 2,011,692 6,620,3531929 32,784 568,545 10,424,6?1 27,845 64,324 11,118,159
'1930 228,835 600,1/.J 5,936,368 18<t, 355 60,332 7,015,0111931 71,149 320 / 994 2,555,703 93,127 1,217,427 4,258,4001932 106,924 237,042 3,183,276 133,02') 470, Ull 4,130,4521933 206,462 572,242 2,838,958 755, (J30 193,943 4,566,6351934 57,180 526,166 6,015,224 .175 4')5,496 7,094,5411935 136,983 677,457 13,939,956 155,945 52,826 14,963,1671936 ~06, 722 244,653 17,525,286 1,823 4,401,502 23,07';),9861937 87,747 783,15] 15,043,029 61,301 1,684,294 17,659,5221938 51,368 591,6117 12,328,673 911,723 1,166,063 15,049,4741939 69,707 431,511 13,445,353 0 1,218,571 15,165,144
1940 65,196 792,894 10,851,760 2,127 103,583 11,815,5601941 101,324 947,915 6,887,855 21,779 596,937 8,555,8101942 115,868 442,338 6,328,416 86,919 119,987 7,093,5281943 129,515 842,551 6,636,001 43,491 244,919 7,896,4801944 133,570 411 ,8]] 7,674! 735 223,431 298,973 8,742,5201945 650,005 ] ,512,621 12,839,746 62,878 328,186 15,393,4361946 155,137 2,109,884 5,028,005 597,380 192,932 8,083,3381947 149,125 1,473,119 9,134,369 119,738 207,202 11,083,5531948 158,099 252,075 7,802,3115 427,521 191,210 8,831,2501949 163,864 1,106,012 20,157,890 345,684 310,289 22,083,739
1950 208,143 466,111 7,331,874 501,209 267,082 8,774,4191951 328,464 1,614,764 7,516,392 809,277 216,449 10,485,3461952 118,174 4,555,908 10,546,440 172,631 381,868 15,775,0211953 189,212 468,893 10,716,730 717,711 388,975 12,481,5211954 165,148 2,002,93] 11,210,288 '432,551 184,034 13,994,9521955 160,671 948,155 7,269,9'J7 696,594 257,340 9,332,7571956 134,222 1,606,402 7,528,548 595,831 347,675 10,212,6781957 191,848 1,268,092 11,691,871 1,039,079 182,559 14,373,4491958 247,064 979,917 8,776,286 653,398 526,137 11,182,802
Total 23,041,545 81,278,315 352,736,763 12,798,810 27,681,784 497,537,217

TABLE ITISU~~ARY OF ESTIMATED DISCOVERIES
OF NATURAL GAS LIQUIDS NOW ASSIGNED TOFIELDS DISCOVERED IN YEARS SHO~~
(Thousands of Barrels)
FIELDS AND
RESERVOIRSDISCOVERED DISTRICT 1. DISTRIC'I' 2 DISTRICf 3 DIs'rRTCT 4 DISTR1CT 5 TOTllL U.S.
Through 1920 III ,073 408,796 778,347 42,726 310,082 1,651,024
In 1920 3,659 62,176 424 0 65,581 131,8401921 1,667 34,278 151,087 0 76,210 263,2421922 558 451,862 96,552 0 4,509 553,4811923 879 47,685 10,427 980 18,486 78,4571924 391 23,986 6,827 0 15,043 46,2471925 1,260 5,769 8,221 0 1,489 16,7391926 502 57,909 56,694 6,840 9,971 131,9161927 1,258 %,733 307,765 283 5,303 371,3421928 7,760 89,555 29,386 0 82,702 209,4031929 228 11,646 247,636 0 1,509 261,019
1930 1,839 14,875 720,549 481 2,144 739,8881931 160 3,080 100,568 1,200 61,891 166,8991932 999 8,027 80,l1tl 8,000 17,418 114,5581933 152 20,996 28,207 19,100 2,552 71,0071934 195 11,574 132,057 0 18,598 162,4241935 975 19,276 475,148 10,688 573 506,6601936 10,322 4,885 440,570 0 66,002 521,7791937 184 29,720 427,060 0 81,569 538,5331938 156 38,395 :324,962 25,643 78,551 467,7071939 546 16,356 392,127 0 113,923 522,952•1940 189 30,263 414,189 0 6,018 450,6891941 439 45,652 189,747 0 13,959 249,7971942 63J. 15,772 239,054 22,662 3,284 281,4031943 641 33,920 171,911 0 3,200 209,6721944 800 17,647 239,530 80 5,656 263,713
·1945 8,356 27,738 432,524 8 11,341 479,9671946 862 79,647 170,879 11,462 8,469 271,3191947 1,687 39,650 274,742 120 2,492 318,6911948 1,430 8,897 496,609 5,129 11,048 523,1131949 981 29,497 527,275 3,994 22,065 583,812
1950 860 16,521 221,809 21,948 4,007 265,1451951 777 40,978 255,617 22,924 2,055 322,3511952 822 73,881 254,222 5,482 5,482 339,8891953 762 18,383 393,536 22,631 2,231 437,5431954 1,700 38,469 283,126 7,336 6,083 336,7141955 1,353 36,430 209,283 3,423 8,770 259,2591956 851 34,550 168,286 25,535 8,577 237,7991957 956 29,508 348,170 24,042 1,742 404,4181958 39,989 19,281 252,196 6,116 2,634 320,216
Total 208,849 2,054,263 10,357,433 298,833 1,163,249 14,082,627
II'

q
TABLE IVCRUDE OIL PRODUCTIVE CAPACITY IN THE UNITED STATES
(Thousand Barrels Daily)
JAN. 1 J.A...N. 1 JULY 1 JAN. 1 JAl'J . 1 JAN. 1DISTRICT 1951 1953 1954 1957 1960 196----
East Coast 54 49 43 37 29 30
Mid-Continent 1,083 1,238 1,380 1,591 1,555 1,473
Gulf Coast 4,161 4,686 5,224 6,613 7,331 8,399
Rocky Mountain 350 394 561 615 664 678
West Coast * ·1,079 1,098 1.1..-1 23 1,011 1,006 1,010
Total 6,727 7,46~ 8,331 9,867 10,585 11,590
* Including Elk Hills. The estimates for January 1, 1960, and January 1,1964, included Elk Hills at a total of 175,000 barrels daily. Seeprior reports for previous estimates for Elk Hills.

TABLE VMAXIMUM PRODUCTIVE CAPACITY OF NATURAL GAS
IN THE UNITED STp,TES _(Thousand Cubj_c Feet Daily @l 14.65· psia and 60 0 F)
JANUARY I, 1964 JANUARY I, 1960DISTRICT NON-ASSOCIATED ASSOCIATED DISSOLVED TOTAL TOTAL
East Coast 919,000 0 11,200 930,200 990,300
Mid-Continent 12,176,300 1,083,600 1,448,100 14,708,000 8,203,600
Gulf Coast 58,828,3.00 5,532,000 12,963,700 77,324,000 58,121,200
Rocky Mountain 1,789,000 140,400 299,500 2,228,900 2,327,000
West Coast 1,217,000 0 1,176,000 2,393,000 -L 862 ,OOO
Total 74,929,_600 6,756,000 15,898,500 97,584,100 71,504,100
NOTES: 1. This statement does not include any gas available from storage reservoirs.
2. This statement does include gas available from reservoirs being cycled.
3. In some cases, associated-gas production cannot be distinguished fromdissolved gas production. In these cases, all such gas is tabulated asdissolved.
'I

TABLE VIMAXIMu~ PRODUCTIVE CAPACITY OF NATURAL GAS LIQUIDS
IN THE UNI'T'ED STAT ES. _(Thousand Barreis Daily)
JANUARY 1, 1964 JANUARY 1, 1960DISTRICT NON-ASSOCIATED L~SOCIATED DISSOLVED TOTL\[, TOTAL----- ------
East Coast 22.3 0 0 22.3 10.2
Mid-Continent 92.4 23.1 53.7 169.2 162.6
Gulf Coast 1,564.2 219.2 701.8 2,485.2 1,501.8
Rocky Mountain 16.0 1.3 26.7 44.0 37.0
West Coast 3.0 0 79.0 82.0 88.0-
Total 1,697.9 243.6 861.2 ~ , 8 0;2--=.2 1 ~ 79J .6----

De a_r. Mr. F 011 is:
UNITED STATESDEPARTMENT OF THE INTERIOR
OFFICE OF THE SECRETARYWASHINGTON, D. C. 20240
EXHIBIT
C
oP
Y
March 19, 1964
In response to a request from the Secretary of the Interior,the National Petroleum Council prepared a report in 1961enti-tled "Proved Discoveries and Productive Capacity of CrudeOil, Natural Gas and Natural Gas Liquids in the United States".The data contained in this report have been of value to -tl1eGovernment in its efforts to appraise the domestic long-termpetroleum supply.
It ,is requested that the National Petroleum Council prepare areport \\Thich will update as of January 1, 1964 the informationpresented in the earlier report. The report should be in aform similar to tha-t of the earlier one, excep-t that projectionsof productive capacity will not be required.
The Office of Oil and Gas will supply further information asdesired on the scope and details of the study. I am gratefulfor the Council's consideration of this request and I willappreciate receiving such a report together with appropriatecormnenJcs and recommendations of -the Council.
S-incerely yours,
/S/ JOHN M. KELLY
Assistant Secretary of theInterior
Mr. R. G. FollisChairmanNational Petroleum Council1625 K Street, N. W.Washington, D. C. 20006