Embed Size (px)
Citation preview

Faculty of Science PROTOCOL DEVELOPMENT FOR THE USE OF MATRIX ASSISTED LASER DESORPTION/IONISATION TIME-OF-FLIGHT MASS SPECTROMETRY (MALDI-TOF-MS) FOR DETECTION OF CLOSTRIDIUM DIFFICILE TOXIN A AND B FROM STOOL SAMPLES 2015 | CINDY LAM
B.Sc. Honours thesis

PROTOCOL DEVELOPMENT FOR THE USE OF MATRIX ASSISTED LASER
DESORPTION/IONISATION TIME-OF-FLIGHT MASS SPECTROMETRY
(MALDI-TOF-MS) FOR DETECTION OF CLOSTRIDIUM DIFFICILE TOXIN A
AND B FROM STOOL SAMPLES
by
CINDY LAM
A THESIS SUBMITTED IN PARTIAL FULFILLMENT
OF THE REQUIREMENTS FOR THE DEGREE OF
BACHELOR OF SCIENCE (HONS.)
in the
DEPARTMENT OF BIOLOGICAL SCIENCES
(CELLULAR, MOLECULAR, AND MICROBIOLOGY)
This thesis has been accepted as conforming to the required standards by:
Naowarat Cheeptham (Ph.D.), Thesis Supervisor, Dept. Biological Sciences,
Thompson Rivers University
Kingsley Donkor (Ph.D.), Co-supervisor, Dept. Physical Sciences, Thompson
Rivers University
Ken Wagner (MD, FRCP), Co-supervisor, Dept. Biological Sciences, Thompson
Rivers University
Lei Ang (MD, FRCPath), Co-supervisor, Microbiology Laboratory, Royal
University Hospital
Prenilla Naidu (MD, FRCPC), Co-supervisor, Provincial Laboratory for Public
Health, University of Alberta
Joanna Urban (MSc, Ph.D. candidate), Thesis committee, Dept. Biological
Sciences, Thompson Rivers University
Dated this 1st day of May, 2015, in Kamloops, British Columbia, Canada

ii
ABSTRACT
Background: Clostridium difficile is an anaerobic, Gram-positive, spore-forming bacillus. C.
difficile is important in the medical community because it is the most common cause of
antibiotic-associated diarrhea and infections can lead to serious complications such as toxic
megacolon and pseudomembranous colitis. Infection is mediated by toxins A and B, both of
which are proteins that undergo processing within the target cell to yield a 63 kDa active
domain.
Objective: This study investigates the use of MALDI-TOF-MS to detect the active domains
of C. difficile toxins A and B from stool samples to explore the possibility of using MALDI
as a diagnositc tool for C. difficile infections.
Methods: Known toxin and antigen positive and negative stool samples sent from Royal
Inland Hospital were diluted 10-fold in deionized water or phosphate buffered saline (PBS)
and vortexed to create a relatively homogeneous suspension. Samples were then centrifuged
and the pellet removed. Proteins in the supernatant were precipitated with acetonitrile or
ammonium sulfate and the solution was centrifuged again. The pellet was resuspended in
deionized water or TA30 and spotted on a MALDI plate with a sinnapinic acid (SA), SDHB
(a mixture of 2,5-dihydroxybenzoic acid (2,5-DHB) and 2-hydroxy-5-methoxybenzoic acid),
or CHCA (α-Cyano-4-hydroxycinnamic acid) matrix co-crystalized.
Results and Discussion: MALDI analysis showed no difference between samples diluted in
deionized water and those diluted in PBS. Protein precipitation with acetonitrile produced
higher quality spectra than protein precipitation with ammonium sulfate. Sample co-
crystalization with a SA matrix provided higher quality spectra than sample co-crystalization
with a SDHB or CHCA matrix. MALDI analysis showed no peaks in the 63 kDa range in
any of the samples. Because stool is a complex combination of materials, MALDI mass
spectra were expected to be complicated and show vast differences between samples.
Surprisingly, all ten MALDI spectra acquired were relatively similar. Similar individual ion
signals were seen between 20 and 60 kDa and above 70 kDa. No individual ion signals were
seen in the 63 kDa range in any of the samples, regardless of their being toxin and antigen
positive or negative. This suggests that there is an open mass window for unambiguous
detection of the 63 kDa active domain.

iii
Conclusion: We were unable to use MALDI to detect the 63 kDa active domains of C.
difficile toxins A and B from crude stool protein extracts. Further studies would be required
to ascertain the possibility of using this technological tool to detect C. difficile toxins as an
alternative method of diagnosis to the tests currently available. Although inconclusive, this
study is a starting point for the investigation of MALDI as a diagnostic tool in a clinical
setting.
Thesis supervisor: Associate Professor Naowarat Cheeptham

iv
ACKNOWLEDGMENTS
I would like to gratefully acknowledge the Kamloops Pathologist Group, the Western
Economic Diversification Canada, the Undergraduate Research Experience Award Program
(UREAP), Dr. Ken Wagner’s donation, and Dr. Cheeptham's research innovation and PD
fund for the financial backing that made my project possible.
I would like to offer my sincerest thanks to all my supervisors, Erika Koeck, Alison
McClean, Sue Whitehead, Cheryl Millar, and the RIH laboratory staff for their patience and
continued support.
v
TABLE OF CONTENTS
Title……………………………….……………………………………………….i
Abstract…………………………..……………………………………………….ii
Acknowledgements…………………………...………………………………..…iv
List of Figures…………………………………………….………..……………...vi
List of Tables…………………………………………….………….…………….viii
Introduction
Background……………………………………………….………………1
Clostridium difficile toxins A and B………………………………………1
Current diagnostic tools…………………………………………..…….…4
MALDI as a diagnostic tool…………………………………………....….5
Objective……………………………….………………………………….8
Materials and Methods
Induction of autocleavage in commercially purchased toxin A………..….9
Clinical stool sample preparation…………………………………….……10
MALDI parameters and matrix selection…………………………....….…11
PNPG as a toxin-specific substrate……………………………………...…11
Results
Induction of autocleavage in commercially purchased toxin A……….…...12
Clinical stool samples…………………………………..……………......…13
PNPG as a toxin-specific substrate………………………………………....16
Discussion…………………………………………………………………………...17
Literature cited………………………………………………………………….......20
Appendix A ……………………………………………………………..…….…....23

vi
LIST OF FIGURES
Figure 1. Figure 1. Molecular protein structure of C. difficile toxins A (TxA) and B (TxB),
showing homologous catalytic domains with glucosyltransferase activity (black),
autocleavage domains (circles), hydrophobic regions which allow the toxins to be inserted
into the target cell’s endosomal membrane during processing (triangles), and COOH-terminal
repeats with receptor binding domains (white). (Taken from Pruitt et al. 2012) ………....3
Figure 2. Model for the uptake of toxins A and B into the host cell for the release of the 63
kDa active domain. The toxin is first brought into the cell and into endosomes through
receptor mediated endocytosis. As the endosome acidifies, the toxin refolds to expose
hydrophobic surfaces. This allows for the toxin to insert itself through the endosome
membrane. The “cutting” and “activity” domains of the toxin are translocated outside of the
endosome while the rest of the toxin remains inside. Cytosolic Ins6P is then able to cleave the
toxin at the “cutting” domain, releasing the 63 kDa active domain into the host cells. (Taken
from Giesemann et al. 2008) ……………………………………………………………...3
Figure 3. Diagram showing current diagnostic steps used by The Interior Health Authority to
diagnose CDIs. Stool samples with suspected CDIs are screened with C.DIFF QUIK CHEK
from TechLab, which screens for both GDH and C. difficile toxins A and B. If the sample
tests negative for both, there is no CDI diagnosis. If the sample tests positive for both, a CDI
is diagnosed. If the test is inconclusive, samples are sent for PCR testing for PaLoc. If
negative, no CDI is diagnosed. If positive, a CDI is diagnosed. ………………………….5
Figure 4. C. difficile toxins A and B cleaving the O-glycosidic bond of PNPG to produce 4-
nitrophenol. This autocleavage event can be monitored with a spectrophotometer at 410 nm
(Taken from Darkoh 2012)………………………………………………………………….8
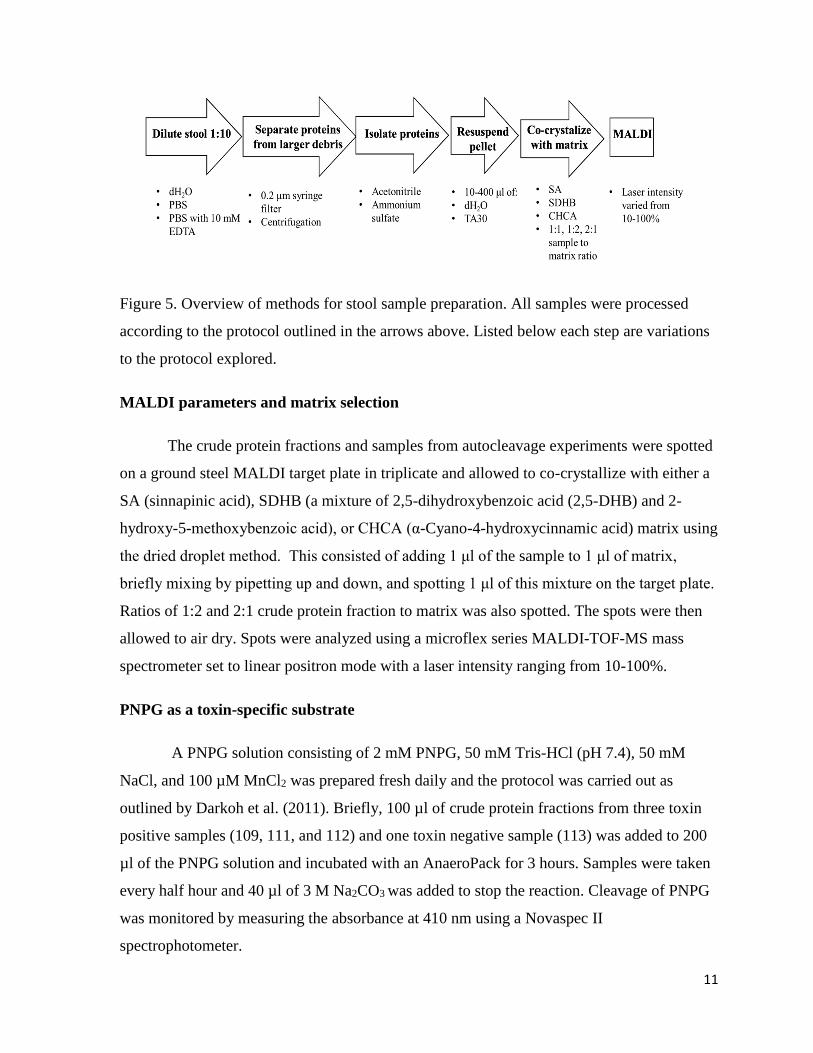
Figure 5. Overview of methods for stool sample preparation. All samples were processed
according to the protocol outlined in the arrows above. Listed below each step are variations
to the protocol explored. ……………………………………………………………………11

vii
Figure 6. Unintelligible MALDI spectra produced from attempts to view the whole 300 kDa
C. difficile toxin A protein. Although a few individual ion signals can be seen, they were not
reproducible between trials. MALDI is not well suited for the detection of proteins above 100
kDa (van Remoortere et al. 2010). …………………………………………………………12
Figure 7. MALDI mass spectra of stool samples 107 (pink), 108 (green), and 111 (black).
Samples 107 and 108 tested EIA negative for C. difficile toxins and PCR positive for PaLoc.
Sample 111 tested EIA positive for C. difficile toxins. All spectra show a hump containing an
unresolved complex mixture in the mass range 20- 60 kDa and individual ion signals at
approximately 22, 24, 27, 28, 34, 39, 48, and 56 kDa. All samples co-crystallized in a 1:1
ratio with SA matrix. ……………………………………………………………………….14
Figure 8. Figure 7. MALDI spectra comparing a C. difficile toxin positive stool sample
protein precipitated with (a) acetonitrile and (b) ammonium sulfate. Sample co-crystalized in
1:1 ratio with SA matrix. Acetonitrile protein precipitation produced intelligible MALDI
spectra while ammonium sulfate did not. ………………………………………………….16
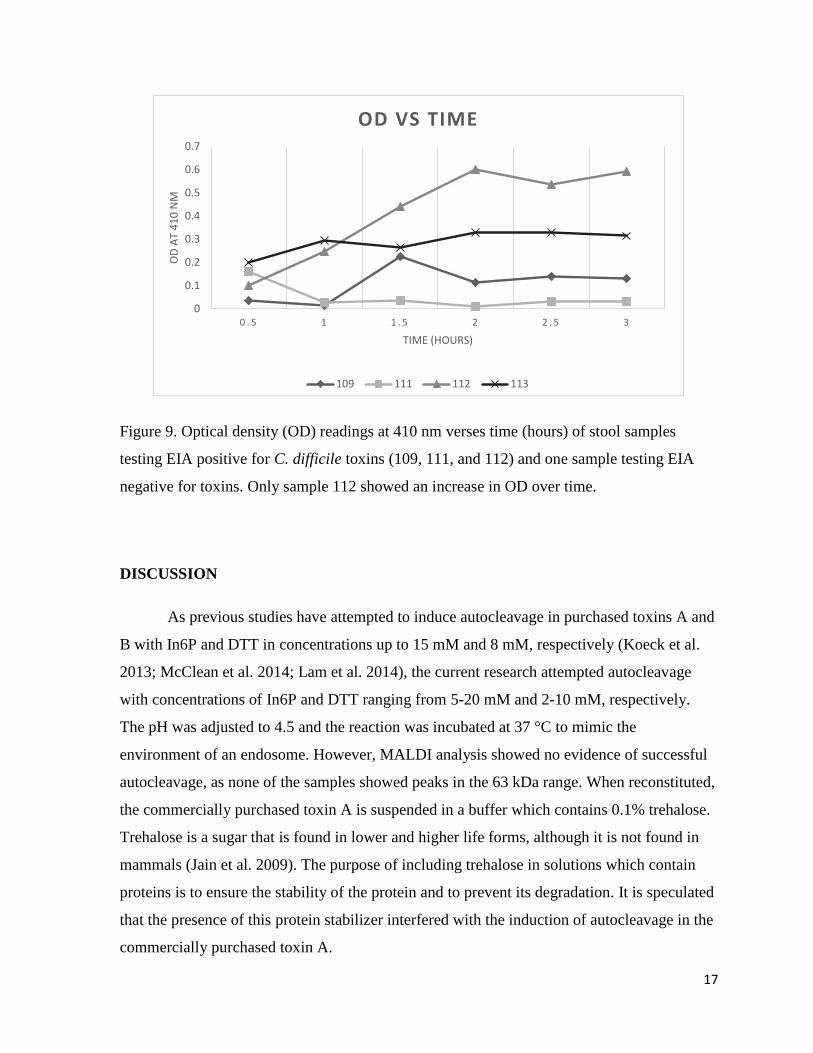
Figure 9. Optical density (OD) readings at 410 nm verses time (hours) of stool samples
testing EIA positive for C. difficile toxins (109, 111, and 112) and one sample testing EIA
negative for toxins. Only sample 112 showed an increase in OD over time. ………………17

viii
LIST OF TABLES
Table 1. Concentrations and volumes of DTT and InsP6 used to induce autocleavage in 1 μg
of toxin A. Samples were incubated at room temperature or 37 °C for 0.5 to 72 hours.
Reactions adjusted to 4.5 and volumes adjusted to 26 μl with deionized water. …………...9
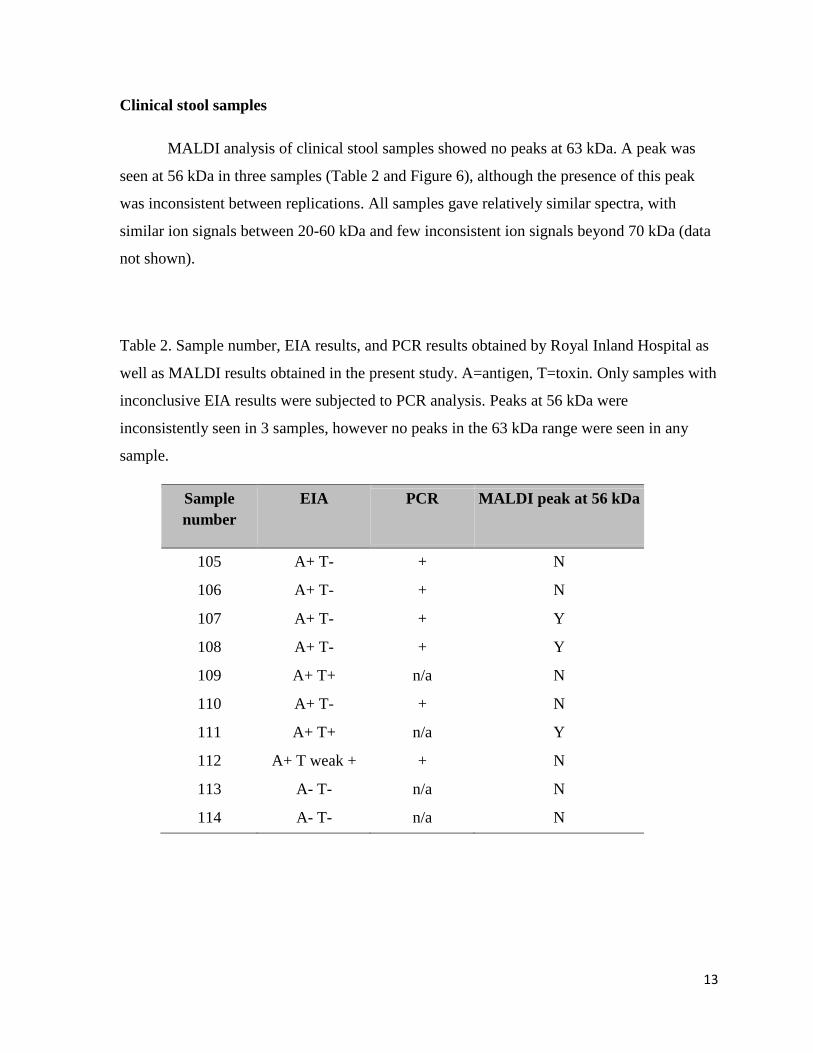
Table 2. Sample number, EIA results, and PCR results obtained by Royal Inland Hospital as
well as MALDI results obtained in the present study. A=antigen, T=toxin. Only samples with
inconclusive EIA results were subjected to PCR analysis. Peaks at 56 kDa were
inconsistently seen in 3 samples, however no peaks in the 63 kDa range were seen in any
sample. …………………………………………………………………………………….13

1
INTRODUCTION
Background
Clostridium difficile is an anaerobic, Gram-positive, spore-forming bacillus that is
commonly the causative agent of antibiotic-associated diarrhea (CDC 2012; Hookman et al.
2009). It is found as part of the normal intestinal flora of 5% of adults and up to 70% of
infants (Vaishnavi 2010). It was first described by Hall and O’Toole in 1935 during their
experiments involving the intestinal flora of new born infants. In 1978, Bartlett et al. found
C. difficile to be the causative agent of antibiotic-associated pseudomembranous colitis
through tissue culture experiments using stool samples from affected patients.
These early studies contributed to our understanding of the importance of the
indigenous microflora of the intestine (Johnson et al. 1998). Antimicrobial therapies can
result in the disruption of normal intestinal flora and cause subsequent overgrowth of
opportunistic C. difficile. These infections are of great concern due to the risk of resulting
complications such as toxic megacolon and pseudomembranous colitis. Additionally, a new,
hypervirulent strain, NAP1/BI/027, was described by McDonald et al (2005). This new strain
showed increased resistance to flouroquinolone antibiotics as well as various sized deletions
and point mutations in the tcdC gene that encodes a protein thought to function as a negative
regulator for toxin A and B production. The result is a new, hypervirulent C. difficile strain
that is capable of increased toxin production. In 2002, it was estimated that each case of C.
difficile infection (CDI) in the United States resulted in more than $3600 in additional health
care costs and these costs are estimated to exceed $1.1 billion per year (Kyne et al. 2002). In
2011 there was an estimated half a million CDIs in the United States and 29,000 people died
within 30 days of diagnosis (CDC 2015).
Clostridium difficile toxins A and B
Pathogenicity is mediated by toxin A and B production, encoded by the tcdA and tcdB
genes, respectively (Cohen et al. 2000). These genes are part of a 19.6 kb pathogenicity locus
(PaLoc) that is only present in toxigenic strains. Early studies looking into the mechanisms of
action of toxin A and B found that both inhibit ADP-ribosylation of the GTP-binding protein

2
Rho, rendering it inactive and unable to regulate the microfilament cytoskeleton (Just et al.
1994; Just et al. 1995). These toxins produce their effects by inactivating Rho proteins,
resulting in depolymerization of actin fibers, cytoskeleton instability, and cell death. Binary
toxin is also produced by certain strains of C. difficile. Although its role in pathogenicity
remains unknown, it has been found that hypervirulent strains of C. difficile produce this
toxin in addition to toxin A and B (Papatheodorou et al. 2013).
Both toxins A and B, 308 and 269 kDa in size, respectively, must undergo processing
within the target cell before a 63 kDa active domain is released and able to produce its
toxigenic effects (Figures 1 and 2) (Pruitt et al. 2012; Giesemann et al. 2008). The whole 308
or 269 kDa toxin is first taken into the target cell through receptor mediated endocytosis
(Figure 2). This brings the toxin into the cell and inside endosomes, which become acidic,
causing the toxin to refold. Toxin refolding exposes hydrophobic domains within the toxin,
allowing it to penetrate and insert itself into the membrane of the endosome. This results in
the active domain being translocated outside of the endosome while still attached to the rest
of the toxin located inside the endosome. Cytosolic inositol hexakisphosphate (Ins6P)
induces autocleavage at the “cutting domain”, releasing the active domain into the target cell.
The free 63 kDa active domain possesses glucosyltransferase activity and inactivate Rho,
Rac, and Cdc42 within the target cell (Voth et al. 2005). The target cell becomes unable to
regulate the microfilament cytoskeleton, causing subsequent depolymerization of actin fibers,
cytoskeleton instability, and cell death (Just et al. 1994; Just et al. 1995). The presence of this
63 kDa active domain in stool therefore indicates CDI.

3
Figure 1. Molecular protein structure of C. difficile toxins A (TxA) and B (TxB), showing
homologous catalytic domains with glucosyltransferase activity (black), autocleavage
domains (circles), hydrophobic regions which allow the toxins to be inserted into the target
cell’s endosomal membrane during processing (triangles), and COOH-terminal repeats with
receptor binding domains (white). (Taken from Pruitt et al. 2012)
Figure 2. Model for the uptake of toxins A and B into the host cell for the release of the 63
kDa active domain. The toxin is first brought into the cell and into endosomes through
receptor mediated endocytosis. As the endosome acidifies, the toxin refolds to expose
hydrophobic surfaces. This allows for the toxin to insert itself through the endosome
membrane. The “cutting” and “activity” domains of the toxin are translocated outside of the
endosome while the rest of the toxin remains inside. Cytosolic Ins6P is then able to cleave
the toxin at the “cutting” domain, releasing the 63 kDa active domain into the host cells.
(Taken from Giesemann et al. 2008)

4
Current diagnostic tools
As in any bacterial infection, early diagnosis enables early treatment and prevention
of complications. Current methods for the diagnosis of CDI are less than ideal for clinical use
as they are either time consuming, relatively insensitive, or require expensive and specialized
equipment (CDC 2012; Kelly et al. 1998). Stool cultures are slow to yield results and only
confirm the presence of the bacteria, not necessarily infectious toxin producing bacteria. PCR
assays can confirm the potential for disease but does not confirm the expression of the genes
responsible for toxin production. Tissue culture cytotoxicity assay detects toxin B only, is
difficult to perform, is costly, and requires up to two days for results. Enzyme immunoassay,
although easy to perform, are relatively insensitive and may give false results. The glutamate
dehydrogenase (GDH) detection assay tests for the presence of the enzyme glutamate
dehydrogenase and is relatively sensitive and specific for C. difficile (Eastwood et al. 2014).
However, GDH detection assay is only able to confirm the presence of C. difficile and does
not indicate toxin production. In combination, these methods allow for more reliable results,
however the time sensitive nature of CDI treatment remains unaddressed. To add to these
difficulties, toxins A and B are very unstable, degrading at room temperature and becoming
difficult to detect only a few hours after stool sample collection (CDC 2012).
Currently, the Interior Health Authority uses a combination of toxin and antigen
screening with TechLab C. DIFF QUIK CHEK COMPLETE, which screens for GDH as
well as C. difficile toxins A and B (Dr. Prenilla Naidu, Sue Whitehead, and Dr. Cheryl Millar
personal communication, 2015). If screening yields inconclusive results (e.g., antigen
positive but toxin negative), subsequent PCR analysis is performed to confirm the presence
of the PaLoc (Figure 3). Again, these methods are flawed in that the presence of the PaLoc
does not confirm toxin production, only the potential for disease. Many clinical laboratories
in Canada have seen that a shocking 40% of toxin and antigen screenings yield inconclusive
results (Dr. Prenilla Naidu, personal communication, 2015). Of this 40%, 20-50% are PCR
positive for PaLoc.

5
Figure 3. Diagram showing current diagnostic steps used by The Interior Health Authority to
diagnose CDIs. Stool samples with suspected CDIs are screened with C.DIFF QUIK CHEK
from TechLab, which screens for both GDH and C. difficile toxins A and B. If the sample
tests negative for both, there is no CDI diagnosis. If the sample tests positive for both, a CDI
is diagnosed. If the test is inconclusive, samples are sent for PCR testing for PaLoc. If
negative, no CDI is diagnosed. If positive, a CDI is diagnosed.
MALDI as a diagnostic tool
C. difficile is frequently a nosocomial pathogen that is difficult to control due to its
ability to produce spores (CDC 2012). Therefore, it is critical that a more clinically useful
method of diagnosis is available for reliable and early detection of CDIs. Many recent studies
EIA testing with TechLab
C.DIFF QUIK CHEK
COMPLETE
GDH and toxin
A and B negative
GDH and toxin
A and/or B positive
GDH positive, toxin
A and B negative
Stool with suspected CDI
No CDI CDI PCR testing for PaLoc
PacLoc negative PacLoc positive
No CDI CDI
6
have involved the identification of bacteria with the use of matrix assisted laser
desorption/ionisation time-of-flight mass spectrometry (MALDI-TOF MS or MALDI), as it
has been shown to be a fast, accurate, and cost-effective technique (Bohme et al. 2010).
During MALDI analysis, the analyte is co-crystalized with an organic matrix and the
analyte-matrix mixture is subjected to laser irradiation (Lewis et al. 2000). The laser light
energy is absorbed by the matrix, which is vapourized and indirectly causes the analyte to
vapourize as well. MALDI-TOF refers to the time-of-flight mass analyzer used with the
MALDI ionization source. TOF analysis propels ions towards a detector plate and the size of
the ion is determined based on the time it takes to reach the detector plate. Since ions have
the same energy but different masses, smaller ions reach the detector plate faster than larger
ions. In MALDI-TOF-MS results are given in the form of a mass spectrum, a plot of the
intensity of the ion signal as a function of the mass-to-charge ratio.
MALDI has many advantages over other analytical tools used in proteomics as it is
easy to operate and can be automated to allow for easy screening of large sample numbers
(Cho et al. 2013). It is also able to tolerate much higher salt concentrations than liquid
chromatography/mass spectrometry, meaning proteins can be detected directly from
biological samples without the need to desalt the sample first. MALDI is highly sensitive, has
a fast turnaround time, and tests are relatively inexpensive to run, all of which are
characteristics highly sought after in a diagnostic tool (Lin et al. 2007). The toxin and antigen
screenings currently in use by the Interior Health Authority costs $13 per run with an
additional $45 for PCR analysis if the results are inconclusive B (Dr. Prenilla Naidu personal
communication, 2015). Because extensive sample preparation is normally not necessary with
MALDI, the cost to diagnose C. difficile infections with MALDI would be cents per
specimen. Furthermore, our 63 kDa protein of interest falls within the mass range MALDI is
capable detecting, as proteins larger than 100 kDa do not ionize as efficiently (van
Remoortere et al. 2010). Because of these advantages, we believe MALDI to be a viable
diagnostic tool for identifying CDIs using the 63 kDa active domain as a biomarker.
Previous studies in our laboratory have explored the possibility of using MALDI to
detect the active domains of C. difficile toxins A and B in stool samples with no success
(Koeck et al. 2013; McClean et al. 2014, Lam et al. 2014). This research will explore

7
different protein extraction methods as well as different MALDI matrices to optimize C.
difficile toxin detection.
The concern that the 63 kDa active domain may not be present in stool in high
enough concentrations for detection with MALDI to be successful should be addressed.
Although MALDI is sensitive enough to detect femtomoles of analyte (Lin et al. 2007), our
analyte will not consist of purified C. difficile toxins. Because we aim to reduce laborious
sample preparation in the interest of creating a protocol that will be quick to yield results, our
analyte will consist of the 63 kDa protein of interest as well as a mixture of proteins found in
stool. The ion suppression effect, where the ion signals from high abundance ions suppress
the signals from low abundance ions, is of concern in this situation (Wu et al. 2007).
Additionally, C. difficile toxins are relatively unstable and degrade easily at room
temperature (CDC 2012). As a method of detecting the 63 kDa protein of interest that may be
present in concentrations undetectable to MALDI, we explored the idea of exploiting a toxin-
specific substrate (Boyer et al. 2011). 4-Nitrophenyl β-D-glucopyranoside (PNPG) is a
substrate of C. difficile toxins (Darkoh 2012). Toxins A and B cleave the O-glycosidic bond
of PNPG, producing 4-nitrophenol as a product (Figure 4). Although this product is too small
to be detected with MALDI, the cleavage event can be monitored with a spectrophotometer
at 410 nm. This method of toxin detection also allows for toxin quantitation, as under optimal
conditions (temperature 35-40°C, pH 8) and unlimited PNPG, the amount of 4-nitrophenol is
directly proportional to the amount of toxin present. Therefore, this method of confirming the
presence of the 63 kDa active domain can help us determine the limits of detection for C.
difficile toxins in minimally processed stool samples using MALDI.

8
Figure 4. C. difficile toxins A and B cleaving the O-glycosidic bond of PNPG to produce 4-
nitrophenol. This autocleavage event can be monitored with a spectrophotometer at 410 nm
(Taken from Darkoh 2012)
Objective
The goal of this research is to design a protocol which allows for the detection of C.
difficile toxins A and B in stool samples with minimal sample preparation. The protocol
relies on the detection of the 63 kDa active domain in clinical stool samples with MALDI.
Such a protocol would allow for the possibility of MALDI to be used as a clinical diagnostic
tool for the diagnosis of CDIs, as it would be a fast and direct method of confirming the
presence of C. difficile toxins in stool. The use of toxin-specific substrates will also be
explored as a possible alternative toxin detection method.

9
MATERIALS AND METHODS
Induction of autocleavage in commercially purchased toxin A
Toxin A was purchased from List Biologicals (Campbell, California, USA) and
attempts were made to induce autocleavage in order to show that the 63 kDa active domain
can be detected with MALDI and to investigate the limits of detection by spiking the toxin
into weighed stool. Toxin A was purchased in lyophilized form and reconstituted in
deionized water according to the specification sheet provided by the manufacturer. As the
toxin had been lyophilized with resuspension buffer, reconstitution of the toxin gave a
resuspension buffer consisting of 50 mM Tris, pH 7.5, 50 mM NaCI, and 0.1 % trehalose.
Autocleavage of the toxin was attempted using varying concentrations of
dithiothreitol (DTT) and inositol hexakisphosphate (InsP6). These concentrations were much
higher than those attempted in previous studies (Koeck et al. 2013; McClean et al. 2014; Lam
et al. 2014), ranging from 4 to 10 mM and 8 to 20 mM, respectively. Each reaction was
adjusted to pH 4.5 with sodium acetate to mimic the environment of an endosome.
Incubation times ranged from 0.5 to 72 hours both at room temperature and at 37°C (Table
1).
Table 1. Concentrations and volumes of DTT and InsP6 used to induce autocleavage in 1 μg
of toxin A. Samples were incubated at room temperature or 37 °C for 0.5 to 72 hours.
Reactions adjusted to 4.5 and volumes adjusted to 26 μl with deionized water.
Toxin A (μg) DTT InsP6 Total volume (μl)
1 4 mM 8 mM 26
1 6 mM 12 mM 26
1
1
8 mM
10 mM
15 mM
20 mM
26
26

10
Samples were taken before and after incubation and analyzed using MALDI in an
attempt to view the 63 kDa active domain known to be released through autocleavage
(Giesemann et al. 2008). Samples were taken after 0.5, 4, 8, 12, 24, 48, and 72 hours of
incubation.
Clinical stool sample preparation
Known toxin and antigen positive and negative stool samples from Royal Inland
Hospital were stored at -80°C and transported to Thompson Rivers University, where they
were stored at 4°C. Samples were confirmed toxin and antigen positive or negative by Royal
Inland through enzymatic immunoassay (EIA). Those testing negative for C. difficile toxins
but positive for the antigen were subjected to PCR testing for PaLoc.
Approximately 10 μl of each sample was diluted in 100 μl deionized water, phosphate
buffered saline (PBS), or PBS with 10 mM EDTA as a protease inhibitor. Diluted samples
were then vortexed for up to 5 minutes until a relatively homogeneous mixture was achieved.
Samples were then centrifuged at 1000 xg for 20 seconds and the pellet removed or filter
sterilization with 0.22 micron syringe filters. An equal volume of acetonitrile was added and
the solution incubated for 30 minutes at room temperature to precipitate the proteins from
solution. Protein precipitation was also attempted by adding equal volumes of ammonium
sulfate to the supernatant and incubating at 4°C overnight. After incubation, all samples
were centrifuged at 18,000 xg for 10 minutes at room temperature and the supernatant
removed.
The pellet was then suspended in 10, 25, 50, 200, 300, 400 μl of deionized water or
TA30 (3:7 HPLC grade acetonitrile: 0.1% trifluoroacetic acid in deionized water). This
solution was designated as the crude protein fraction.
11
Figure 5. Overview of methods for stool sample preparation. All samples were processed
according to the protocol outlined in the arrows above. Listed below each step are variations
to the protocol explored.
MALDI parameters and matrix selection
The crude protein fractions and samples from autocleavage experiments were spotted
on a ground steel MALDI target plate in triplicate and allowed to co-crystallize with either a
SA (sinnapinic acid), SDHB (a mixture of 2,5-dihydroxybenzoic acid (2,5-DHB) and 2-
hydroxy-5-methoxybenzoic acid), or CHCA (α-Cyano-4-hydroxycinnamic acid) matrix using
the dried droplet method. This consisted of adding 1 μl of the sample to 1 μl of matrix,
briefly mixing by pipetting up and down, and spotting 1 μl of this mixture on the target plate.
Ratios of 1:2 and 2:1 crude protein fraction to matrix was also spotted. The spots were then
allowed to air dry. Spots were analyzed using a microflex series MALDI-TOF-MS mass
spectrometer set to linear positron mode with a laser intensity ranging from 10-100%.
PNPG as a toxin-specific substrate
A PNPG solution consisting of 2 mM PNPG, 50 mM Tris-HCl (pH 7.4), 50 mM
NaCl, and 100 µM MnCl2 was prepared fresh daily and the protocol was carried out as
outlined by Darkoh et al. (2011). Briefly, 100 µl of crude protein fractions from three toxin
positive samples (109, 111, and 112) and one toxin negative sample (113) was added to 200
µl of the PNPG solution and incubated with an AnaeroPack for 3 hours. Samples were taken
every half hour and 40 µl of 3 M Na2CO3 was added to stop the reaction. Cleavage of PNPG
was monitored by measuring the absorbance at 410 nm using a Novaspec II
spectrophotometer.

12
RESULTS
Induction of autocleavage in commercially purchased toxin A
MALDI analysis was unable to detect the presence of proteins in the 63 kDa range,
suggesting that the attempts to induce autocleavage had failed (data not shown). Furthermore,
MALDI was also unable to detect the whole uncleavaged toxin at 300 kDa, since MALDI is
not well suited for detecting proteins above 100 kDa (van Remoortere et al. 2010) (Figure 5).
Figure 6. Unintelligible MALDI spectra produced from attempts to view the whole 300 kDa
C. difficile toxin A protein. Although some individual ion signals can be seen, they were not
reproducible between trials. MALDI is not well suited for the detection of proteins above 100
kDa (van Remoortere et al. 2010).
13
Clinical stool samples
MALDI analysis of clinical stool samples showed no peaks at 63 kDa. A peak was
seen at 56 kDa in three samples (Table 2 and Figure 6), although the presence of this peak
was inconsistent between replications. All samples gave relatively similar spectra, with
similar ion signals between 20-60 kDa and few inconsistent ion signals beyond 70 kDa (data
not shown).
Table 2. Sample number, EIA results, and PCR results obtained by Royal Inland Hospital as
well as MALDI results obtained in the present study. A=antigen, T=toxin. Only samples with
inconclusive EIA results were subjected to PCR analysis. Peaks at 56 kDa were
inconsistently seen in 3 samples, however no peaks in the 63 kDa range were seen in any
sample.
Sample
number
EIA PCR MALDI peak at 56 kDa
105 A+ T- + N
106 A+ T- + N
107 A+ T- + Y
108 A+ T- + Y
109 A+ T+ n/a N
110 A+ T- + N
111 A+ T+ n/a Y
112 A+ T weak + + N
113 A- T- n/a N
114 A- T- n/a N

14
Figure 7. MALDI mass spectra of stool samples 107 (pink), 108 (green), and 111 (black).
Samples 107 and 108 tested EIA negative for C. difficile toxins and PCR positive for PaLoc.
Sample 111 tested EIA positive for C. difficile toxins. All spectra show a hump containing an
unresolved complex mixture in the mass range 20- 60 kDa and individual ion signals at
approximately 22, 24, 27, 28, 34, 39, 48, and 56 kDa. All samples co-crystallized in a 1:1
ratio with SA matrix.
No differences in MALDI spectrum quality were seen between samples diluted in
deionized water and samples diluted in PBS or PBS with 10 mM EDTA. Replacing the filter

15
sterilization step with a centrifugation step proved to be time and effort saving, while still
providing the same quality spectra. Protein precipitation with acetonitrile produced
intelligible spectra showing individual ion signals while protein precipitation with
ammonium sulfate did not (Figure 7).
No difference in MALDI spectra was seen between pellets resuspended in deionized
water compared to those resuspended in TA30. Sample pellets resuspended in 10, 25, 300, or
400 μl of deionized water or TA30 provided lower quality spectra than pellets resuspended in
50 or 200 μl of solvent. No difference in spectra quality was seen between sample pellets
resuspended in 50 μl of deionized water or TA30 compared to those resuspended in 200 μl of
deionized water or TA30.
Sample co-crystallization with a SA matrix produced intelligible spectra, while
samples co-crystallized with a SDHB matrix or CHCA did not. Samples spotted in a 1:1 ratio
with SA matrix showed the highest quality spectra.

16
Figure 8. MALDI spectra comparing a C. difficile toxin positive stool sample protein
precipitated with (a) acetonitrile and (b) ammonium sulfate. Sample co-crystalized in 1:1
ratio with SA matrix. Acetonitrile protein precipitation produced intelligible MALDI spectra
while ammonium sulfate did not.
PNPG as a toxin-specific substrate
Spectrophotometer readings taken every half hour showed a continuous increase in
absorbance in only one sample testing EIA positive for C. difficile toxin (Figure 8).
(a) (b)
17
Figure 9. Optical density (OD) readings at 410 nm verses time (hours) of stool samples
testing EIA positive for C. difficile toxins (109, 111, and 112) and one sample testing EIA
negative for toxins. Only sample 112 showed an increase in OD over time.
DISCUSSION
As previous studies have attempted to induce autocleavage in purchased toxins A and
B with In6P and DTT in concentrations up to 15 mM and 8 mM, respectively (Koeck et al.
2013; McClean et al. 2014; Lam et al. 2014), the current research attempted autocleavage
with concentrations of In6P and DTT ranging from 5-20 mM and 2-10 mM, respectively.
The pH was adjusted to 4.5 and the reaction was incubated at 37 °C to mimic the
environment of an endosome. However, MALDI analysis showed no evidence of successful
autocleavage, as none of the samples showed peaks in the 63 kDa range. When reconstituted,
the commercially purchased toxin A is suspended in a buffer which contains 0.1% trehalose.
Trehalose is a sugar that is found in lower and higher life forms, although it is not found in
mammals (Jain et al. 2009). The purpose of including trehalose in solutions which contain
proteins is to ensure the stability of the protein and to prevent its degradation. It is speculated
that the presence of this protein stabilizer interfered with the induction of autocleavage in the
commercially purchased toxin A.
0
0.1
0.2
0.3
0.4
0.5
0.6
0.7
0 . 5 1 1 . 5 2 2 . 5 3
OD
AT
41
0 N
M
TIME (HOURS)
OD VS TIME
109 111 112 113

18
A peak was seen at 56 kDa in three samples (107, 108, 111), although this result
could not be consistently replicated. The identity of this peak was briefly considered to be a
metabolite of C. difficile toxins. However, failure to reproduce this peak in other toxin
positive samples led to the conclusion that this 56 kDa peak would not serve well as a
biomarker for CDIs, regardless of its identity.
Failure to consistently detect the 56 kDa peak between trials of same sample shows
one of the flaws inherent to MALDI: only a very small amount of sample can be analysed at
a time. Although the necessity for small sample volumes can be an advantage in instances
where limited sample is available, it is a disadvantage when analysing heterogeneous
samples such as stool. Depending on the protocol used, only 0.5 – 1 μl of a sample-matrix
solution can be deposited on each spot on a MALDI target plate. Although all samples are
spotted in triplicate and efforts were made to form a homogeneous solution after diluting
samples in deionized water or TA30, it is difficult obtain a representative sample with such
small volumes. This is evident from the inconsistency of the 56 kDa peak between trials.
In general, stool is a complex combination of 75% water and 25% solid matter (Wu et
al. 2007). The solid matter is composed of dead intestinal, blood, and bacterial cells,
undigested food, steroids, bile acids, lipids, inorganic matter, and proteins. Given the
complex composition of stool, MALDI mass spectra were expected to be complicated and
show vast differences between samples. Surprisingly, all MALDI spectra acquired were
relatively similar (Figure 3), barring a few individual ion signals such as the 56 kDa signal.
All individual ion signals were seen between 20 and 60 kDa and above 70 kDa (data of the
latter not shown). No individual ion signals were seen in the 63 kDa range in any of the
samples, regardless of their being toxin and antigen positive or negative. This suggests that
there is an open mass window for unambiguous detection of the 63 kDa active domain.
Although further work is necessary to create a protocol for processing C. difficile toxin
positive stool in such a way that the 63 kDa active domain can be detected with MALDI, this
open mass window is encouraging for the idea of using the 63 kDa active domain as a
biomarker detected by MALDI to diagnose CDIs.
Unfortunately, further research into the relevant scientific literature proved the results
of the PNPG tests to be insignificant, as the beta-glucuronidase activity of Escerishia coli
19
enzymes cleave PNPG in much the same way as the 63 kDa active domain of C. difficile
toxins A and B (Aich et al. 2001). The notion of utilizing a toxin-specific substrate is still
viable however, as it may help to overcome some of the disadvantages of working with the
63 kDa active domain of C. difficile toxins. Because C. difficile toxins are unstable proteins,
degrading at room temperature within a few hours (CDC 2012), there is concern that stool
samples may not contain high enough concentrations of intact toxin for MALDI detection.
Although MALDI has been shown to be a very sensitive tool that is able to detect
femtomoles (10-15) of protein, MALDI analysis of more complex samples will not allow for
that level of sensitivity (Lin et al. 2007). As discussed in the Introduction, MALDI analysis
of a complex sample such as the crude protein fraction analysed here allows for the
possibility of the ion signal from the protein of interest to be supressed by the ion signals of
other components in the sample. This ion suppression effect is of particular concern in the
present research, given the unstable nature of C. difficile toxins. If a substrate truly specific to
C. difficile toxins can be found, one which results in products easily detectable with MALDI,
it may be coupled with MALDI analysis to indirectly verify the presence of the toxin.
Although this study was unsuccessful in using MALDI to detect the 63 kDa active
domain, improvements can be made to the present protocol to better target the recovery and
detection of the 63 kDa active domain from stool samples. Filters with a molecular-weight
cutoff at 40 kDa would allow for the reduction of the size distribution of proteins present and
reduce the ion suppression effect. Improvements can also be made to the matrix solution
preparation, as certain matrix preparation procedures have been found to better target
proteins of certain size ranges (Cohen et al. 1996). Immunoglobulins specific to the 63 kDa
active domain may also be useful in amplifying the MALDI signal (Joanna Urban personal
communication, 2015). In addition, protein purification techniques such as dialysis can be
utilized to remove the trehalose protein stabilizer from the purchased toxin to allow for
autocleavage to occur.

20
LITERATURE CITED
Aich, S., L. Delbaere, and R. Chen (2001). Continuous Spectrophotometric Assay for β-
Glucuronidase. BioTechniques. 30(4): 846-850.
Bohme, K., I. Fernández-No, J. Barros-Velázquez, J. Gallardo, B. Cañas, and P. Calo-Mata
(2010). Comparative analysis of protein extraction methods for the identification of seafood-
borne pathogenic and spoilage bacteria by MALDI-TOF mass spectrometry. Analytical
Methods. 2: 1941-1947.
Boyer, A., M. Gallego-Candela, R. Lins, Z. Kuklenyik, A. Woolfitt, H. Moura, S. Kalb, C.
Quinn, and J. Barr (2011). Quantitative mass spectrometry for bacterial protein toxins- a
sensitive, specific, high-throμghput, tool for detection and diagnosis. Molecules. 16: 2391-
2413.
CDC (2012). “Frequently asked questions about Clostridium difficile for healthcare
providers.” Centers for Disease Control and Prevention.
http://www.cdc.gov/HAI/organisms/cdiff/Cdiff_faqs_HCP.html#a2 March 1, 2014.
CDC (2015). “Healthcare-associated Infections (HAIs).” Centers for Disease Control and
Prevention.
Cho, Y., H. Su, T. Huang, H. Chen, W. Wu, P. Wu, D. Wu, and J. Shiea (2013). Matrix-
assisted laser desorption ionization/time-of-flight mass spectrometry for clinical diagnosis.
Clinica Chimica Acta. 415: 266-275.
Cohen, H., J. Tang, and J. Silva (2000). Analysis of the pathogenicity locus in Clostridium
difficile strains. Journal of Infectious Diseases. 181(2): 659-63.
Cohen, S. and B. Chait (1996). Influence of Matrix Solution Conditions on the MALDI-MS
Analysis of Peptides and Proteins. Analytical Chemistry. 68: 31-37.
Darkoh C. 2012. Regulation of toxin synthesis by Clostridium difficile [dissertation].
[Houston (TX)]: Graduate School of Biomedical Sciences.
Darkoh, C., H. Kaplan, and H. DuPont (2011). Harnessing the Glucosyltransferase Activities
of Clostridium difficile for Functional Studies of Toxins A and B. Journal of Clinical
Microbiology. 49(8): 2933–2941.
Eastwood, K., P. Else, A. Charlett, and M. Wilcox (2014). Comparison of nine commercially
available Clostridium difficile toxin detection assays, a real-time PCR assay for C. difficile
tcdB, and a glutamate dehydrogenase detection assay to cytotoxin testing and cytotoxigenic
culture methods Journal of Clinical Microbiology. 47(10): 3211-7.
Giesemann, T., M. Egerer, T. Jank, and K. Aktories (2008). Processing of Clostridium
difficile toxins. Journal of Medical Microbiology. 57(6): 690-696.
Hookman, P. and S. Barkin (2009). Clostridium difficile associated infection, diarrhea and
colitis. World Journal of Gastroenterology. 15(13): 1554-1580.
Jain, N. and I. Roy (2009). Effect of trehalose on protein structure. Protein Science. 18(1):
24-36.

21
Johnson, S. and D. Gerding (1998). Clostridium difficile–Associated Diarrhea. Clinical
Infectious Diseases. 26: 1027–36.
Just, I., G. Fritz, K. Aktories, M. Giry, R. Popoff, P. Boquet, S. Hegenbarth, and C. von
Eichel-Streiber (1994). Clostridium difficile toxin B acts on the GTP-binding protein Rho.
Journal of Biological Chemistry. 269: 10706-10712.
Just, I., J. Selzer, C. von Eichel-Streiber, and K. Aktories (1995). The low molecular mass
GTP-binding protein Rho is affected by toxin A from Clostridium difficile. Journal of
Clinical Investigation. 95(3): 1026–1031.
Kelly, C. and T. Lamont (1998). Clostridium difficile infection. Annual Review of Medicine.
49: 375-390.
Koeck E. 2013. Matrix Assisted Laser Desorption/Ionization Time-Of-Flight Mass
Spectrometry as a Novel Assay for the Detection of Clostridium Difficile Toxins A and B
[thesis]. [Kamloops (BC)]: Thompson Rivers University
Lam, C., N. Cheeptham, K. Donkor, K. Wagner, P. Naidu, L., and Ang (2014). Protocol
development for the use of Matrix Assisted Laser Desorption/Ionisation Time-of-Flight Mass
Spectrometry (MALDI-TOF-MS) for detection of Clostridium difficile toxin A from stool
samples [UREAP report]. [Kamloops (BC)]: Thompson Rivers University.
Lewis, J., J. Wei, and G. Siuzdak (2000). Matrix-assisted Laser Desorption/Ionization Mass
Spectrometry in Peptide and Protein Aanalysis. In Encyclopedia of Analytical Chemistry.
Chichester: John Wiley & Sons Ltd.Kyne L, Hamel B, Polavaram R, Kelly P. 2002. Health
care costs and mortality associated with nosocomial diarrhea due to Clostridium difficile.
Clinical Infectious Diseases. 34: 346-353.
Lin, S., S. Shih, D. Wu, Y. Lee, C. Wu, L. Lo, and J. Shiea (2007). Matrix-assisted laser
desorption/ionization time-of-flight mass spectrometry for the detection of hemoglobins as
the protein biomarkers for fecal occult blood. Rapid Communications in Mass Spectrometry.
21(20): 3311-3316.
McDonald, C., E. Killgore, A. Thompson, C. Owens, V. Kazakova, P. Sambol, S. Johnson,
and N. Gerding (2005). An epidemic, toxin gene-variant strain of Clostridium difficile. New
England Journal of Medicine. 353:2433–2441.
McClean A. 2014. The Detection of Clostridium Difficile Toxin A and B Using Matrix
Assisted Laser Desorption/Ionization Time-Of-Flight Mass Spectrometry [thesis]. [Kamloops
(BC)]: Thompson Rivers University.
Papatheodorou, P., D. Hornuss, T. Nölke, S. Hemmasi, J. Castonguay, M. Picchianti, and K.
Aktories (2013). Clostridium difficile binary toxin CDT induces clustering of the lipolysis-
stimulated lipoprotein receptor into lipid rafts. MBio. 4(3): e00244-13.
Pruitt, R. and Lacy D (2012). Toward a structural understanding of Clostridium difficile
toxins A and B. Frontiers in Cellular and Infection Microbiology. 2(28): 1-14.
Vaishnavi, C. (2010). Clincial spectrum & pathogenesis of Clostridium difficile associated
diseases. Indian Journal of Medical Research. 131: 487-499.
22
van Remoorte, A., R. van Zeijl, N. van den Oever, J. Franck, R. Longuespee, M. Wisztorski,
M. Salzet, A. Deelder, I. Fournier, and L. McDonnell (2010). MALDI imaging and profiling
MS of higher mass protein from tissue. Journal of the American Society for Mass
Spectrometry. 21(11): 1922-1929.
Voth, D. and J.Ballard (2005). Clostridium difficile toxins: mechanisms of action and role in
disease. Clinical Microbiology Reviews. 18(2):247-263.
Wu, C., C. Tsai, C. Lu, P. Wu, D. Wu, S. Lin, and J. Shiea (2007). Diagnosis of occult blood
in human feces using matrix-assisted laser desorption ionization/time-of-flight mass
spectrometry. Clinica Chimica Acta. 384: 86-92.

23
APPENDIX A
The certificate of analysis for toxin A from C. difficile from List Biological Laboratories, Inc.


![Matrix-Assisted Laser Desorption/Ionization-Mass ... · Matrix-Assisted Laser Desorption/Ionization-Mass Spectrometry Imaging of Metabolites during Sorghum Germination1[OPEN] Lucia](https://img.dokumen.tips/doc/110x75/5f958aecb811e8653e378b93/matrix-assisted-laser-desorptionionization-mass-matrix-assisted-laser-desorptionionization-mass.jpg)