Embed Size (px)
Citation preview

THE
PROTEROZOIC
APPLICATION
UNIVERSITY OF. ADELAIDE
TECTONIC MODELS WITH
TO THE MOUNT PAINTER INLIER.
by J. TEASDALE
November, 1993
J

THE UNIVERSITY OF ADELAIDE
Department of Geology and Geophysics
Proterozoic tectonic models with applicationto the Mount Painter Inlier
Jonathan Teasdale, B.Sc.
Thesis submitted as partial fulfilment for theHonours Degree of Batchelor of Science
November, 1993
Supervisor: M Sandiford

Table of Contents
ABSTRACT
TABLE OF CONTENTS
PREAMBLE
PART ONE
Chapter 1
Chapter 2
Chapter 3
Chapter 4
PART TWO
Chapter 5
Chapter 6
Chapter 7
Geological Investigations in theMount Painter Inlier
A geological overview of the Mount Painter Inlier
Lithologies of a section of the Mount Painter Inlier:The Paralana Hot Springs - Mount Adams Valley area
Structural and metamorphic evolution
Tectonic evolution of the Paralana Hot Springs -Mount Adams Valley area
Tectonics of Proterozoic Orogenic Belts
Orogenic aspects of Proterozoic tectonics-
On the mechanical plausibility of ensialic orogenesis
Discussion
ACKNOWLEDGMENTS
REFERENCES
APPENDICES
Appendix 1 Lithospheric strength calculations
Appendix 2 Delamination program - Matheinatica™ code
Appendix 3 Selected microprobe data and geothermometry
Appendix 4 Sample data
Appendix 5 Geological map and block diagram:Paralana Hot Springs - Mount Adams Valley area
1
2
3
8
23
31
38
43
58
61
62
67
73
86
101
103
2

Abstract
Since many features of Proterozoic orogenic belts are difficult to reconcilewith classical plate tectonic theory, alternative mechanisms have beendeveloped to explain phenomena such as high-temperature-low-pressuremetamorphism and distinctive intracratonic geochemistry, as seen in theMount Painter Inlier and other Proterozoic orogenic belts. Delamination ofpart or all of the mantle lithosphere may play an important role in initiating,localising or terminating convergent deformation in ensialic (intracratonic)settings. The 'thin sheet' model presented here investigates the mechanicalplausibility and consequences of ensialic mantle lithosphere delamination.Results indicate that mantle lithosphere delamination will initiate and localiseconvergent deformation given sufficient tectonic driving forces. Mantlelithosphere delamination from a thickened lithosphere may lead toextensional collapse.
Two discrete Proterozoic tectonothermal events were recognised in theMount Painter Inlier. Syn-post kinematic, high-temperature metamorphismand plutonism indicates heating may have post-dated deformation and thatmantle lithosphere delamination may have occurred in response tothickening.

Preamble
Many features of Proterozoic orogenic belts are difficult to reconcile with
classical plate tectonic theory. These features include their supposed 'ensialic'
(intracratonic) setting, the abundance of high-temperature-low-pressure
metamorphism, evidence for vertical crustal accretion, and distinctive
geochemistry, together with an absence of modern Wilson Cycle tectonic
signatures such as obducted oceanic crust (ophiolites), calc-alkaline
magmatism (andesites) and high-pressure (paired) metamorphic belts [e.g.
Kroner, 1983; Etheridge et al., 1987]. In recent years the idea that thermal
evolution of the continental lithosphere may involve decoupling of strain
between the crust and mantle lithosphere [Houseman et al., 1981] has had an
important impact on models for the evolution of a number of Proterozoic
high-temperature-low-pressure metamorphic terrains [e.g. Sandiford, 1989b;
Sandiford & Powell, 1990; Loosveld & Etheridge, 1990]. Several scenarios
have been proposed to explain such features in terms of mantle lithosphere
delamination [e.g. Kroner, 1981; 1983; Etheridge et al., 1987; Loosveld &
Etheridge, 1990].
Despite the popularity of such scenarios, very little work has been done to (1)
rigorously evaluate the structural and metamorphic evolution of many
Proterozoic mobile belts in an 'ensialic' context, and (2) quantitatively
examine their mechanical plausibility. The aim of this project is to accomplish
this work using geological evidence from the Mount Painter Inlier.
The first part of this thesis comprises an investigation of the structural and
metamorphic evolution of the Mount Painter Inlier. In the second part of this
thesis the mechanical plausibility of proposed Proterozoic orogenic scenarios
is quantitatively examined and applied to the Proterozoic record of the Mount
Painter Inlier.

PART ONE
Geological investigations inthe Mount Painter Inlier

Chapter 1Geological overview of the Mount Painter Inlier
1 Introduction
The Mount Painter Inlier in the Northern Flinders Ranges, South Australia is
an exhumed antiformal section of pre-Adelaidean crystalline basement,
which is unconformably overlain by Adelaidean sediments (see figure 1.1).
Despite mineral exploration over the last fifty years very little is known about
the geology of the inlier.
Coats & Blissett [1971] briefly outline a simple pre-Adelaidean stratigraphy
comprising a thick basal metasedimentary sequence (the 'Radium Creek
Metamorphics') intruded by a suite of Mesoproterozoic felsic intrusives (the
'Older Granite Suite') and extrusives. Deformation and metamorphism was
ascribed to younger (Palaeozoic) events. Differences in structural style were
attributed to strain partitioning between rock types of varying competency
during a Palaeozoic orogeny. Recent work by Teale [in press] and Sheard
[pers. comm.] suggests that the geological history of the Mount Painter Inlier
is longer and more complex than previously thought, necessitating major
stratigraphic modifications and a more detailed structural and metamorphic
evaluation.
To accomplish this, an area encompassing the Paralana Hot Springs and
Mount Adams Valley was mapped during April, May and July 1993 (see
figure 1.1 & Appendix 5), in conjunction with Bruce Schaefer . Of particular
interest is the supposed Adelaidean outlier forming Mount Adams Valley,
colloquially known as Hidden Valley (Appendix 5).
Coats & Blissett [1971] mapped four basic units in the Paralana Hot Springs -
Mount Adams Valley area: the basal Radium Creek Metamorphics,
Mesoproterozoic intrusives, an Adelaidean outlier and the early Palaeozoic
British Empire Granite. Mapping revealed a basal suite of highly deformed
gneisses (Four Mile Creek Gneiss Suite) unconformably overlain by a

Chapter 1: Geological overview of the Mount Painter Province
sequence of moderately deformed metasediments (Freeling Heights
Metasediments, Yagdlin Phyllite and Mount Adams Quartzite). Both units
have been intruded by the Mount Neill Granite Porphyry and the British
Empire Granite. Lithological descriptions for these units are provided in
Chapter 2.
A structural and metamorphic evaluation of the Paralana Hot Springs -
Mount Adams Valley area is presented in Chapter 3. Chapter 4 contains a
discussion of the possible tectonic evolution of the Mount Painter Inker.
2 Previous work
Extensive copper mining around the turn of the century and uranium mining
spanning the first half of this century, together with numerous smaller
ventures earned the Mount Painter region a reputation of great mineral
wealth. Subsequent extensive mineral exploration (uranium, gold, base
metals, rare earths) of the Mount Painter Inlier by Exoil (later Transoil), North
Flinders Mines, Anaconda and CRA has failed to reveal any significant ore
concentrations despite numerous tantalising assays. Very little exploratory
work has been published for the Paralana Hot Springs - Mount Adams Valley
area. SADME Open File data contains a few large scale maps and passing
references to Mount Adams Valley (named 'Carthew Valley' in North
Flinders Mines reports). Drilling by Anaconda in the north-west of the area
and North Flinders in the south was of no economic significance and no
interpretations were made of the brief drill logs. Recent work by CRA has not
been released.
Blight [1977] mapped a southern portion of the area as part of an honours
project. His thesis contains some petrological and geochemical data. Coats &
Blissett [1971] is the only significant published reference and only briefly
outlines the pre-Adelaidean geology. Geological maps are large-scale only
(1:132000).

Chapter 1: Geological overview of the Mount Painter Province
MOUNT PAINTER INLIER
Quaternary & Tertiary sediments
Mt Adams Valley Melange
British Empire Granite (Permian?)
Adelaidean sediments (late Proterozoic)
Early-mid Proterozoic crystalline basement(Mount Painter Inlier)
Boundary/unconformity
Major Fault
Mapped area
129° 133° 137" 141°
<£-4 ——I—'
-SOUTH AUSTRAUA-I I
Figure 1.1Location map and regional geology ofthe Mount Painter Inlier [alter Coats&Blissett,1971].

Chapter 2Lithologies of a section of the Mount Painter Inlier:The Paralana Hot Springs - Mount Adams Valley area
1 Introduction
Mapped lithologies of the Paralana Hot Springs - Mount Adams Valley area
differ from previous data and are summarised in table 2.1. Colour plates
illustrating these lithologies can be found at the end of the chapter.
Name
Four Mile Creek GneissSuite
Freeling HeightsMetasediments
Yagdlin Phyllite andMount Adams Quartzite
Mount Neill GranitePorphyry
British Empire Granite
Mount Adams ValleyMelange
Lake Frome plainssediments
Age
2.4-2.0Ga#
>1565Ma
>1565Ma
1565±4Ma+
270Ma*
Mesozoic -Recent
Previous name*
Lower Radium CreekMetamorphics(unnamed member ofFreeling HeightsQuartzite)
Upper Radium CreekMetamorphics (FreelingHeights Quartzite)
Unchanged
Unchanged
Unchanged
Adelaidean WywyanaFormation
Various
Brief description
Highly deformed andmetamorphosed sequence ofortho- and paragneisses
Moderately deformedsequence of feldspathicquartzites and mica schists
Relatively undeformed lowgrade laminated grey-greenphyllites and pinkreldspathic quartzite
Relatively undeformedheterogeneous sequence ofintrusive to sub-volcanicfelsic granites, rhyolites andamphibolites
Undeformed leucocraticquartz-feldspar-muscovitegranites and pegmatites
Chaotic mass of softcalcareous pale greenquartzose grits and clayscontaining numerous exoticrafts (<lmm to 500m)
Flatlying, low grade marineand alluvial sediments
Table 2.1 Brief stratigraphic summary of the Paralana Hot Springs - MountAdams Valley area.
* Previous names are taken from Coats & Blissett [1971].* Sm/Nd model age derived by Schaefer [1993].+ Model age [SADME unpublished data, 1993].* Rb/Sr age derived by Schaefer [1993].

Chapter 2: Lithologies of the Paralana Hot Springs - Mount Adams Valley area
I interpret the Freeling Heights Metasediments to unconformably overlie the
basal Four Mile Creek Gneisses. Evidence for this unconformity is discussed
in §3 (this chapter). The Yagdlin Phyllite and Mount Adams Quartzite appear
synchronous with the Freeling Heights Metasediments. The Mount Neill
Granite Porphyry and British Empire Granite intrude all gneisses and
metasediments. The enigmatic Mount Adams Valley Melange cannot be
related structurally or stratigraphically with any other mapped units and
intriguingly contains a variety of unusual, apparently exotic units as rafts (see
§2.6).
In the following sections I provide a lithological overview of the Paralana Hot
Springs - Mount Adams Valley area as illustrated in Appendix 5 (map).
2 Lithological descriptions
2.1 Four Mile Creek Gneiss Suite
The Four Mile Creek Gneiss Suite is a highly deformed, aerially extensive
sequence of ortho- and paragneisses, previously mapped as the lower
unnamed member of the Freeling Heights Quartzite [Coats & Blissett, 1971].
The Four Mile Creek Gneisses appear to be substantially older than the
Freeling Heights Metasediments (see §3 this chapter). All sedimentary
structures have been obliterated by intense deformation and metamorphism.
The Four Mile Creek Gneisses consist of migmatites, paragneisses and
orthogneisses. Complex cross-cutting relationships and isotopic data suggest
several phases of sedimentation and magmatism.
2.1.1 MigmatitesQuartzofeldspathic biotite-rich migmatites (probably orthogneissic) form
large partially anatectic rafts in the orthogneisses described below. They also
outcrop in the core of the F3 anticlinorium (see Chapter 3).
2.1.2 OrthogneissesThe oldest orthogneiss consists of a coarse grained, heterogeneous,
quartzofeldspathic, biotite rich, layered granite gneiss which is highly
deformed and migmatitic in part. A suite of less deformed orthogneisses
intrudes the migmatites and underlies the paragneisses. This suite includes

Chapter 2: Lithologies of the Paralana Hot Springs - Mount Adams Valley area 10
an early 'black and white' augen gneiss and various medium grained red
feldspathic granite gneisses. A late stage fine grained, white leucocratic
granite gneiss crosscuts all para- and orthogneisses. Schaefer [1993] provides
a more comprehensive petrological, geochemical and geochronological
assessment of these orthogneisses.
2.1.3 Paragneisses
A highly deformed paragneiss comprising alternating (~2-3mm) leucocratic
quartzofeldspathic layers and melanocratic biotite - muscovite ± ilmenite ±
apatite layers outcrops in the core of the anticlinorium described in Chapter 3
(see plate 3a). Prograde fibrous sillimanite has formed at the leuco-
melanocratic interfaces. This unit appears to predate other paragneisses due
to its deformational and metamorphic character.
A sequence of high grade metasediments including highly recrystallised
medium-coarse grained quartzites (often micaceous) and sillimanite bearing
gneisses (see plate la&b) appears to overlie the abovementioned paragneiss
and orthogneisses. Interbeds include:
(i) medium grained, black, thin foliated and crenulated biotite - quartz +
garnet ± cordierite ± muscovite schists (plate 4c);
(ii) coarse grained, weakly foliated, grey-green phlogopite - quartz -
corundum ± muscovite rocks;
(iii) coarse grained cordierite - orthoamphibole - anorthite - ilmenite rocks
containing abundant acicular anthophyllite (plate If);
(iv) layered quartz - epidote ± plagioclase rocks (plate le);
(v) soft, fibrous, white sillimanite - tourmaline - biotite - (quartz) schists
containing 75% fibrous sillimanite and large hexagonal tourmaline
porphyroblasts (plate 1c);
(vi) green, medium grained tremolite - quartz - anorthite - ilmenite ±
clinopyroxene calc-silicates (plate lg&h);
(vii) coarse grained, grey epidote - garnet - anorthite - albite - sphene calc-
silicates yielding retrograde amphiboles.
Bedding (So, defined by large scale lithological variation) is parallel to the
major pervasive foliation and any primary sedimentary structures have been
totally obliterated by intense isoclinal folding, upper amphibolite facies
metamorphism and partial anatexis.

Cltapter 2: Lithologies of the Paralana Hot Springs - Mount Adams Valley area 11
2.2 Freeling Heights Metasediments
The Freeling Heights Metasediments comprise an interbedded sequence of
micaceous massive crossbedded quartzites and various mica schists. They
were previously mapped as younger Freeling Heights group sediments by
Coats & Blissett [1971]. The metasediments are highly fractured and anatectic
in part with abundant pegmatitic quartz - feldspar - muscovite 'sweating'
veins which appear related to the British Empire Granite. Schistose units
include coarse grained muscovite ± corundum and biotite - plagioclase ±
quartz ± corundum ± garnet ± cordierite* rocks (plate 2a). While distinctly
different in metamorphic grade from the basement paragneisses, field
discrimination between these two units proved difficult due to similar
weathering patterns and their highly fractured nature. Since Freeling Heights
Metasediments unconformably overlie the Four Mile Creek Gneisses (see §3)
and are intruded by the Mount Neill Granite Porphyry, their age is
constrained to the Mesoproterozoic.
2.3 Metasediments east of the Paralana fault
The metasediments occurring to the east of the Paralana Fault were originally
mapped as the oldest sediments of the Mount Painter Inlier# [Coats & Blissett,
1971]. They are lithologically distinct from any other mapped units and
comprise:
(i) Yagdlin Phyllite: A fine grained sequence of grey-green, micaceous
schists and phyllites with garnet and talc bearing interbeds (plate 2f);
(ii) Mount Adams Quartzite: A fine grained, feldspathic, cross-bedded
quartzite which gradationally overlies the Yagdlin Phyllite (plate 4h).
A well preserved contact metamorphic/metasomatic aureole adjacent to the
Mount Neill Granite contains abundant phlogopite - corundum ± sillimanite
± tourmaline ± cordierite units1" (plate 3e).
* All cordierite in the Freeling Heights Metasediments has retrograded to quartz, corundum orchlorite.# Coats & Blissett [1971] placed these units at the base of the Radium Creek Metamorphics due totheir apparent intrusion by small pods of Pepegoona Porphyry. Field evidence suggests that thesepods are in fact Mount Neill Granite Porphyry. Recent geochronological work has dated thePepegoona Porphyry as being cogenetic with the Mount Neill Granite Porphyry [Sheard pers. comm.,1993], thus rendering this age constraint invalid anyway.+ Coats & Blissett [1971] mapped this as a thrusted contact.

Gtapter 2: Lithologies of the Paralana Hot Springs - Mount Adams Valley area 12
2.4 Mount Neill Granite Porphyry
The Mount Neill Granite Porphyry comprises a heterogeneous sequence of
relatively undeformed intrusive to sub-volcanic Mesoproterozoic (1565 ±
4Ma) granites, rhyolites and amphibolites. Abundant red, potassic, quartz-
undersaturated high level granites form the bulk of the unit, although coarser
grained Rapakivi textured granites with ovoid white feldspars outcrop in the
north of the area. Large outcrops of coarse grained green phlogopite -
chlorite - corundum ± sillimanite schist yielding spectacular blue sapphire are
interpreted as rafts or roof pendants of older sediments, probably Yagdlin
Phyllite. More detailed descriptions together with isotopic data are provided
by Schaefer [1993].
2.5 British Empire Granite and associated pegmatites
The British Empire Granite comprises an undeformed, heterogeneous, coarse
grained, quartzofeldspathic leucocratic, muscovite rich, S-type granite.
Originally thought to be post-Delamerian (Ordovician) in age, recent work by
Foden [pers. comm.] and Schaefer [1993] suggests it may be considerably
younger - possibly Permian. Schaefer [1993] has suggests an emplacement
age of 270Ma (Permian).
2.6 Mount Adams Valley Melange
The Mount Adams Valley Melange consists of a poorly sorted and
consolidated pale green, carbonaceous, quartzose matrix of grits and clays
containing numerous exotic clasts and rafts ranging from a few millimetres to
over 500m in size (see plate 3f). It was previously mapped as
breccia ted/ diapiric Adelaidean Wywyana and Opaminda Formation* [Coats
& Blissett, 1971]. The material is conglomeratic in part and vague planar
differentiation may be interpreted as bedding. Small (2-3mm) phlogopite and
tourmaline crystals which occur in the matrix probably have metamorphic
origins [Sandiford pers. comm., 1993].
Abundant British Empire pegmatites outcrop in Mount Adams Valley. Large
* The Mount Adams Valley fill resembles diapiric calc-silicates of the lower Burra group found at theNeedles, west of Arkaroola Village [Sandiford pers. comm., 1993].
Oiapter 2: Lithologies of the Paralana Hot Springs - Mount Adams Valley area 13
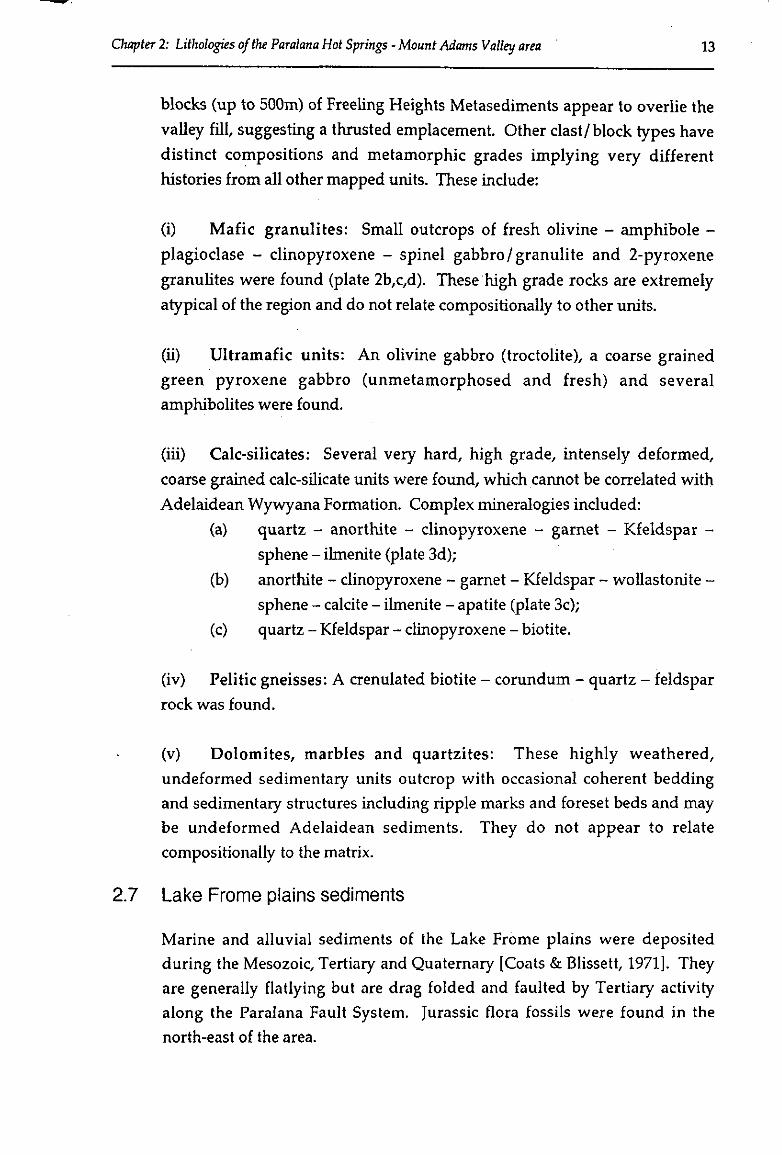
blocks (up to 500m) of Freeling Heights Metasediments appear to overlie the
valley fill, suggesting a thrusted emplacement. Other clast/ block types have
distinct compositions and metamorphic grades implying very different
histories from all other mapped units. These include:
(i) Mafic granulites: Small outcrops of fresh olivine - amphibole -
plagioclase - clinopyroxene - spinel gabbro/granulite and 2-pyroxene
granulites were found (plate 2b,c,d). These high grade rocks are extremely
atypical of the region and do not relate compositionally to other units.
(ii) Ultramafic units: An olivine gabbro (troctolite), a coarse grained
green pyroxene gabbro (unmetamorphosed and fresh) and several
amphibolites were found.
(iii) Calc-silicates: Several very hard, high grade, intensely deformed,
coarse grained calc-silicate units were found, which cannot be correlated with
Adelaidean Wywyana Formation. Complex mineralogies included:
(a) quartz - anorthite - clinopyroxene - garnet - Kfeldspar -
sphene - ilmenite (plate 3d);
(b) anorthite - clinopyroxene - garnet - Kfeldspar - wollastonite -
sphene - calcite - ilmenite - apatite (plate 3c);
(c) quartz - Kfeldspar - clinopyroxene - biotite.
(iv) Pelitic gneisses: A crenulated biotite - corundum - quartz - feldspar
rock was found.
(v) Dolomites, marbles and quartzites: These highly weathered,
undeformed sedimentary units outcrop with occasional coherent bedding
and sedimentary structures including ripple marks and foreset beds and may
be undeformed Adelaidean sediments. They do not appear to relate
compositionally to the matrix.
2.7 Lake Frome plains sediments
Marine and alluvial sediments of the Lake Frome plains were deposited
during the Mesozoic, Tertiary and Quaternary [Coats & Blissett, 1971]. They
are generally flatlying but are drag folded and faulted by Tertiary activity
along the Paralana Fault System. Jurassic flora fossils were found in the
north-east of the area.

Chapter 2: Lithologies of the Paralana Hot Springs - Mount Adams Valley area 14
Evidence for disparity between the Four Mile CreekGneiss Suite and the Freeling Heights Metasediments
I interpret the Four Mile Creek Gneiss Suite to be older than the Freeling
Heights Metasediments based on the following evidence:
(i) the Four Mile Creek Gneisses are of significantly higher
metamorphic grade (see Chapter 3);
(ii) the Four Mile Creek Gneisses are more intensely deformed (see
Chapter 3);
(iii) sudden orientation changes across the gneiss-metasediment
boundary cannot be reconciled structurally and must be
attributed to a fault or an unconformity.
Field recognition of this discontinuity is difficult in the mapped area, due to
the weathered nature of critical outcrops. The contact between the Four Mile
Creek Gneiss Suite and the Freeling Heights Metasediments in both the south
and north of the area appears unconformable (see Appendix 5).

15
Plate 1Photomicrographs from the Four Mile Creek Gneiss Suite
Field of view = 1.8 x 1.4mm
(a) Fibrous sillimanite - Kfeldspar - quartz - muscovite gneiss (A1017-
JPT027) showing the prograde reaction q + mus = ksp + sill (q=quartz,
mus=muscovite, ksp=Kfeldspar, sill=sillimanite). Sillimanite growth
has postdated major foliation development.
(b) Mylonitised sillimanite-bearing paragneiss (A1017-JFT070b) from the
Paralana shear zone. Sillimanite needles are now sub-parallel.
(c) Fibrous sillimanite - tourmaline rock (A1017-JPT029d) in plane
polarised light (sill=sillimanite, tour=tourmaline).
(d) Sillimanite - quartz - biotite gneiss (A1017-JPT026), showing
coexisting prismatic sillimanite and biotite, aligned forming the S2
foliation (bi=biotite, sill=sillimanite, q=quartz).
(e) Highly recrystallised epidote quartzite (A1017-JPT096) showing dark
green scapolite (e=epidote, sc=scapolite, q=quartz).
(f) Cordierite - orthoamphibole rock (A1017-JPT115) with opaque
ilmenite and plagioclase (cd=cordierite/ oa=orthoamphibole
[anthophyllite], p^plagioclase [anorthite]). Random alignment of
crystals indicates post-kinematic metamorphism or metasomatism.
(g) Orthoamphibole - anorthite calc-silicate (A1017-JPT081) showing
prismatic cummingtonite and ilmenite, aligned forming the S2 foliation
(an=anorthite, ilm=ilmenite, oa=orthoamphibole).
(h) Prograde example of (g) showing large green diopside crystals have
replaced orthoamphibole (i.e. granulite facies metamorphism).
Random alignment of crystals indicates post-kinematic metamorphism
associated with later plutonism. Sample number A1017-JPT078.


17
Plate 2Miscellaneous photomicrographs
Field of view = 1.4 x 1.8mm
(a) Garnet - biotite - (relict) cordierite schist (A1017-JPT010) from the
Freeling Heights Metasediments (g=garnet, bi=biotite). Sample used
for geothermometry (see Appendix 3).
(b) Two-pyroxene granulite (A1017-JPT108) from the Mount Adams
Valley Melange (opx=orthopyroxene, cpx=clinopyroxene/ p=plagio-
clase). Sample used for geothermometry (see Appendix 3).
(c) Green spinel - clinopyroxene (augite) symplectites growing from
olivine (forsterite) and plagioclase (anorthite) in a meta-gabbro from
the Mount Adams Valley Melange (A1017-JPT033, sp=spinel,
cpx=clinopyroxene, ol=olivine, p=plagioclase).
(d) As above, with crossed polars. Note high relief, blue clinopyroxene.
(e) Coarse grained clinopyroxene (diopside) - garnet (andradite) - sphene
- plagioclase (anorthite) - Kfeldspar calc-silicate from the Mount
Adams Valley Melange (A1017-JPT084, cpx=clinopyroxene, g=garnet,
sph=sphene, p=plagioclase, ksp=Kfeldspar).
(f) Relict ?cordierite porphyroblast in the Yagdlin Phyllite (A1017-JPT002),
showing metamorphism postdated deformation (i.e. S3 mica foliation
development).


19
Plate 3Hand specimen photographs
(a) Sillimanite - Kfeldspar - quartz - biotite - magnetite gneiss from the
oldest paragneisses in the Four Mile Creek Gneiss Suite (A1017-
JPT066). Note distinct Si gneissic segregation of orange Kfeldspar,
mica, quartz and sillimanite and the sillimanite elongation lineation,
Li.
(b) Sillimanite - biotite - Kfeldspar - muscovite schist from the Four Mile
Creek Gneiss Suite (A1017-JPT029a).
(c) Coarse grained wollastonite - clinopyroxene (diopside) - garnet
(andradite) - anorthite - sphene - Kfeldspar - calcite - ilmenite calc-
silicate from the Mount Adams Valley Melange (A1017-JPT092). All
white material is wollastonite.
(d) Highly strained Kfeldspar (pink) - diopside (green) - garnet calc-
silicate from the Mount Adams Valley Melange (A1017-JPT086).
(e) Contact metamorphosed and metasomatised Yagdlin Phyllite showing
prismatic, white sillimanite needles reacting to bright blue sapphire
(A1017-JPT107). Random nature of sillimanite prisms indicates post-
kinematic metamorphism and metasomatism.
(f) Well consolidated sample of the Mount Adams Valley Melange,
showing chaotic nature of both matrix and clasts (A1017-JPT040).


21
Plate 4Structural photographs and photomicrographs
(a) Chaotic folding and partial anatexis in the basal migmatites of the Four
Mile Creek Gneiss Suite, Hot Springs Creek.
(b) F2 isoclinal/elasticas folding of Di quartz veins in a Four Mile Creek
orthogneiss, Paralana Plateau.
(c) F4 crenulations of the S2 foliation in a biotite schist from the Four Mile
Creek Gneiss Suite, Four Mile Creek (A1017-JPT083).
(d) F3 parallel folds and small scale growth faults in the Yagdlin Phyllite
showing S3 axial planar foliation (lens cap gives scale).
(e) Mylonitised Mount Neill Granite Porphyry (A1017-JPT110) showing
characteristic blue quartz phenocrysts, Mount Adams Valley Melange.
(f) Photomicrograph of (e).
(g) F6 kink folds in mylonitised Mount Neill Granite Porphyry, Mount
Adams Valley Melange, same outcrop as (e) & (f).
(h) F6 kink folds in the Mount Adams Quartzite (A1017-JPT018).


Chapter 3Structural and metamorphic evolution
1 Introduction
In this chapter I outline the structural and metamorphic evolution of theParalana Hot Springs - Mount Adams Valley area. An integrated discussionof these results is presented in Chapter 4.
In this chapter I abbreviate discrete deformation phases to Dj, planar featuresto Sj, folding events to Fj, metamorphic events to M,- and linear features to L,-(where i denotes the order of the event/ feature).
Di
D2
D3
D4
-
D6
-
D 7
Mi
M2
M3
-
M4
-
-
M5
-
Si
s2
S3
-
-
s5
s6
-
-
-F2
F3
F4
-
-
F6
-
-
L2
L3
-
-
L5
u-
-
Gneissic foliation
Tight isoclinal folding, upperamphibolite fades metamorphism,strong gneissic foliation, intersectionlineation
Open upright folding, low-midamphibolite fades metamorphism
E-W trending crenulations
Contact metamorphism caused byintrusion of Mt Neill Granite Porphyry
Shearing and mylonitisation alongParalana Fault System
Kink folding of mylonites and sediments
Regional retrogression of some high-Tassemblages
Exhumation via major thrusting
Table 3.1 Summary of deformation and metamorphism.
23

Chapter 3: Structural and metamorphic evolution 24
2 Structural observations
Six ductile deformation phases have been recognised in the Paralana Hot
Springs - Mount Adams Valley area. The seventh phase involved
exhumation via thrust faulting. Di and D2 are only seen in the Four Mile
Creek Gneiss Suite, therefore predate other units. D3 and D4 effected the
Four Mile Creek Gneisses, Freeling Heights Metasediments, Yagdlin Phyllite
and Mount Adams Quartzite but predate M4 metamorphism. D5 and D6
affected all previously mentioned units as well as the Mount Neill Granite
Porphyry, but not the British Empire Granite. D7 exhumation affected all
mapped units except for recent alluvium.
2.1 D1 and D2
Di and D2 are only seen in the Four Mile Creek Gneisses. Di is characterised
by a layer parallel gneissic foliation, Si and abundant quartz veining (plate
4b). Fibrous acicular sillimanite on the leuco-melanocratic interfaces of the
older paragneisses suggests the gneissic segregation (Si) preceded peak
metamorphism (plate 3a). A strong Li elongation lineation occurs in the
older paragneiss sequence.
D2 is characterised by tight isoclinal folding (F2) of the entire Four Mile
Gneiss Suite forming a pervasive layer-parallel axial planar foliation, S2 (plate
4b). S2 has largely overprinted Di structures. Fi fold axes trend north-east
and are doubly plunging due to later ?F4 folding. Field recognition of F2
hinges is difficult although the following may occur:
(i) partially transposed bedding;
(ii) axial planar foliation at some finite angle to bedding (even
perpendicular);
(iii) migmatization and boudinage involving mica selvedges;
(iv) thick (^2m) quartz veins;
(v) excessive anatexis;
(vi) a bedding-foliation intersection lineation, L2.
Boudinage has occurred at all scales as a result of the high strain exploiting
rheological inheterogeneities, especially in softer, micaceous units which
accommodate much more strain than harder more competent units.

Chapter 3: Structural and metamorphic evolution 25
2.2 D3
D3 is characterised by the upright large scale open refolding (F3) of the FourMile Creek Gneisses, and upright tight folding in the Freeling HeightsMetasediments, Yagdlin Phyllite and Mount Adams Quartzite (plate 4d). TheS3 axial planar foliation is weak in the gneisses, but strong in themetasediments especially in micaceous units. The intersection of S3 withbedding defines the L3 lineation. Boudinage associated with D3 has exploitedrheological weaknesses in micaceous units. F3 fold axes generally trendnorth-east and follow the large scale sinusoidal warping of the entire MountPainter Inlier and are doubly plunging due to D4 north-south compression.
N N
(a) ^^^^~^^ (b)
fold axis = 5°-»225
(C)
fold axis =
N
(d)
fold axis = 21 °-220 fold axis = 51°-*179
Figure 5.1 Contoured, equal area stereographic projections showing F3 foldaxes for (a) the Yagdlin Phyllite and Mount Adams Quartzite {37 samples},(b) the Four Mile Creek Gneiss Suite {102 samples), and Freeling HeightsMetasediments in (c) the north {42 samples), and (d) the south {12 samples}of the mapped area.

Chapter 3: Structural and metamorphic evolution 26
2.3 D4
D4 is characterised by east-west trending crenulations (F4) within micaceous
units in the Four Mile Creek Gneisses and the Freeling Heights
Metasediments (plate 4c). Warping of F3 fold axes can also be attributed to
D4.
2.4 D5
D5 is represented by north-east trending mylonites associated with the
Paralana Fault System forming an S5 foliation (plate 4e,f,g). Mylonitisation of
Mount Neill Granite Porphyry and various gneisses formed L-S tectonites
with a strong, down-dip L5 lineation oriented 40-70° to the north-west and
west-side-up vergence. The S2 foliation merges into this shear zone which
forms the eastern edge of the Four Mile Creek Gneiss Suite (plate lb). Strain
partitioning in the Mount Neill Granite Porphyry causes localised north-east
trending shearing in more micaceous units. Synchronous brittle deformation
(faulting, shearing) throughout the area is also associated with D5.
2.5 D6
D6 is characterised by chevron-style kink folding of D5 mylonites, the Yagdlin
Phyllite and the Mount Adams Quartzite (plate 4a,h). An S6 kink band
foliation can be seen in some outcrops.
3 Metamorphism
Five discrete phases of metamorphism have been recognised in the Paralana
Hot Springs - Mount Adams Valley area. Peak metamorphism in the Four
Mile Creek Gneisses occurred during M2- High grade metamorphism of
exotic rafts in Mount Adams Valley cannot be correlated with the five main
phases and is discussed in §3.5.
3.1 i
is inferred from the Di gneissic segregation of the Four Mile Creek

diopter 3: Structural and metamorphic evolution 27
Gneisses and has been overprinted by peak M2 metamorphism (plate 3a).
M2 is characterised by the growth of fibrous sillimanite and K-feldsparparallel to the S2 foliation in the paragneisses (plate la.b^d). Pelitic interbedscontain peak assemblages of biotite - quartz - ilmenite ± cordierite ± garnetand phlogopite ± corundum - quartz. Calc-silicate interbeds contain peak M2assemblages of (i) tremolite - anorthite - quartz - ilmenite grading up toclinopyroxene bearing units adjacent to the leucogneiss (plate lg^), and (ii)anorthite - Fe-garnet - epidote - sphene. A cordierite - orthoamphibole (-ilmenite - anorthite) rock (plate If) may represent a metamorphosed maficvolcanic or metasomatised pelitic sediments [Arnold & Sandiford, 1990;Yardley, 1991] . Aluminous layers containing sillimanite and tourmaline(plate lc) also reflect M2.
500 550 600 650T-| 700 J 2
T(°C)
Figure 3.2 Petrogenetic grid for the system KFMASH + H2O as calculatedby Xu ot al. [1993] and Yardley [1991]. Pressure-temperature estimates of Tl-T2 and P1-P2 were derived from this grid (see text). A and B represent theinvariant points in the KFMASH system for biotite-cordierite-muscovite-garnet-staurolite-sillimanite-quart-fluid and biotite-cordierite-muscovice-Kieldspar-sillimanite-quartz-fluid.

Chapter 3: Structural and metamorphic evolution 28
Pressure-Temperature conditions for the Four Mile Creek Gneisses of 665-
720°C at 3.9-6.0 kilobars (upper amphibolite facies) were obtained from
univariant reactions in the KFMASH system (see figure 3.2). Textural
relationships for the reaction muscovite + quartz <-> K-feldspar + sillimanite
are well preserved (plate la), constraining PT conditions to the univariant
curve shown in figure 3.2. The stability of the biotite - sillimanite - quartz -
muscovite assemblage provides a minimum pressure constraint (plate 3b).
The slight partial anatexis of the muscovite - K-feldspar - quartz assemblage
in granite gneisses suggests temperatures in the upper limits of the specified
range. Amphiboles are generally stable implying temperatures less than
approximately 750°C, although the transition of cummingtonite to diopside
adjacent to the leucogneiss may suggest localised granulite facies
metamorphism (plate lg,h).
3.2 M3
M3 is characterised by the primary metamorphism of the deforming Freeling
Heights Metasediments, Yagdlin Phyllite and Mount Adams Quartzite, and
retrograde metamorphism of the Four Mile Creek Gneisses. Pelitic interbeds
in the Freeling Heights Metasediments show peak assemblages of biotite-
muscovite ± cordierite ± garnet ± corundum (plate 2a). No sillimanite was
found in quartz-muscovite bearing units. Relict andalusite porphyroblasts
were found in a muscovite rich unit. M3 metamorphism of the Yagdlin
Phyllite was low grade and yielded biotite and manganese-rich garnet
forming the axial planar foliation. In the Four Mile Creek Gneisses, M3
retrogression of garnet to epidote, cordierite and corundum to quartz, and
tourmaline to various micas occurred within the older paragneissic sequence.
Further chloritisation of orthoamphibole in the cordierite-orthoamphibole
bearing unit may also be attributed to M3.
A mean temperature of 485°C was obtained for the Freeling Heights
Metasediments using the garnet-biotite geothermometer of Holland & Powell
[1990]. Relict andalusite constrains pressure to less than -3.5 kilobars.

Chapter 3: Structural and metamorphic evolution 29
3.3 M4
M4 comprises a contact metamorphic aureole adjacent to the Mount NeillGranite Porphyry. M4 is characterised by the growth of randomly orientedcrystals of phlogopite, biotite, muscovite, prismatic sillimanite, corundum(sapphire), tourmaline, chlorite and cordierite in the Yagdlin Phyllite (plate3e). Corundum - phlogopite growth in the Freeling Heights Metasedimentscan be attributed to M4 although subsequent structural juxtaposition with theMount Neill Granite Porphyry must be considered.
Hence contact metamorphism/metasomatism was of upper hornfels facieswith temperatures greater than 550°C causing sillimanite growth. The highalumina content of contact metamorphosed phyllites is due to either (1) silica-undersaturated magmatic fluids causing leeching of silica (i.e. contactmetasomatism), or (2) contact metamorphism of highly aluminous sediments(possibly laterites since intrusion was very shallow - sub-aerial).
3.4 M5
M5 was a retrograde event which is characterised by the breakdown ofcordierite and andalusite to quartz ± mica in the Freeling HeightsMetasediments and the Yagdlin Phyllite. Chloritisation and sericitisationassociated with fault activity may also be attributed to M5. The progradeformation of clinopyroxene from tremolite adjacent to an undeformed granitewithin the paragneiss sequence could also be caused by M5.
3.5 Metamorphism of Mount Adams Valley rafts
3.5.1 Calc-silicatesWollastonite-bearing calc-silicates suggest a temperature window of -600-700°C (plate 3c,d), although the Xco2 is unconstrained due to the isolatedstructural setting of these units. The absence of amphiboles supports thistemperature constraint.
3.5.2 Mafic granulitesTwo-pyroxene (enstatite-augite) granulites (plate 2b) yielded a peaktemperature of 856°C using the clinopyroxene - orthopyroxenegeothermometer of Wells [1977] (see Appendix 5). Clinopyroxene - spinel

Qtapter 3: Structural and metamorphic evolution 30
symplectites growing from forsterite and anorthite in an olivine - plagioclase
- kaersutite (high grade amphibole) gabbro (plate 2c,d) indicate a minimum
pressure of 8.5kb* [Green & Hibberson, 1970].
4 D7 Faulting
The Lady Buxton Fault* forms major north-east trending thrust fault which
dissects the Paralana - Mount Adams Valley area. It dips west at 30-70° and
shows evidence for west-side-up brittle thrusting (D7) which has partially
reactivated and brecciated D6 mylonites. The Lady Buxton Fault forms the
western edge of Mount Adams Valley and the eastern edge of the Four Mile
Creek Gneiss Suite. Anastomosing splinter faults associated with the
Paralana Fault System further dissect the area. The eastern edge of Mount
Adams Valley is defined by a shallow (-30°) west dipping fault; the Mount
Adams Fault. The vergence of this fault is unknown but may be normal (see
Appendix 5 - Block Diagram).
Hematite- and copper-bearing breccias occur along D7 faults throughout the
area, indicating significant fluid flow. Intense drag folding of low grade
(Tertiary, Mesozoic) sediments along the eastern edge of the range can also be
attributed to D7. The similarity of these deformed sediments with the Mount
Adams Valley Melange must be considered.
* Experimental data shows that the forsterite - anorthite assemblage is stable up to 9.9kb at 1250°Cunder isothermal compression, before yielding pyroxenes + spinel, while garnets are produced at14kb [Green & Hibberson, 1970]. Sandiford fpers. comm., 1993] suggests the observed reactiontextures are due to the instability of olivine and anorthite in a crystallising (sub-solidus) mafic magmaat high pressure.#The Lady Buxton Fault forms the northerly extension of the Paralana Fault System [Coats & Blissett,1971].

Chapter 4Tectonic evolution of the Paralana Hot SpringsMount Adams Valley area
1 Introduction
Correlation of geochronological data [Schaefer, 1993; Teale, 1993; in press;Sheard pers. comrn., 1993] with observed lithologies, structures andmetamorphic assemblages indicates at least three orogenic events haveaffected the Mount Painter Inlier. This contrasts with the previousassumption that the structural and metamorphic evolution of the MountPainter Inlier was only due to the lower Palaeozoic Delamerian Orogeny[Coats & Blissett, 1971]. A major finding of this study is the recognition of astratigraphic break between the Four Mile Creek Gneiss Suite and theFreeling Heights Metasediments (see Chapter 2, §3), implying at least twotectonothermal events prior to the emplacement of the Mount Neill GranitePorphyry and Adelaidean sedimentation.
Schaefer [1993] proposes a major episode of Palaeoproterozoic crustal growthfor the Mount Painter Inlier and suggests that peak deformation andmetamorphism in the Four Mile Creek Gneiss Suite also occurred during thePalaeoproterozoic. Deformation and metamorphism of the Freeling HeightsMetasediments, Yagdlin Phyllite and Mount Adams Quartzite, andsynchronous refolding and retrograde metamorphism of the Four Mile CreekGneisses can be attributed to a Mesoproterozoic* orogenic event.
The post-Proterozoic evolution of the Paralana Hot Springs - Mount AdamsValley area emphasises the ongoing role of the Paralana Fault System incontrolling sedimentation, exhumation, fluid flow and deformation. Activeseismicity and hydrothermal activity associated with the Paralana HotSprings indicates the current active state of this system [Sprigg pers. comm.,1993]. I interpret the Delamerian overprint to be minimal and isolated to
* Since the Mount Neill Granite Porphyry is relatively undeformed, deformation of adjacent unitsmust predate its intrusion (dated at 1565±4Ma).
31

Qwpter4: Tectonic evolution 32
major compressional shearing along the Paralana Fault System andretrograde metamorphism. Major exhumation via thrusting occurred duringthe Tertiary [Coats & Blissett, 1971].
In this chapter I discuss Proterozoic and post-Proterozoic tectonismseparately and outline possible regional correlations with other AustralianProterozoic orogens.
2 Proterozoic tectonic history
Schaefer [1993] has identified a period of major crustal growth betweenapproximately 2.4 and 2.0Ga* from the Four Mile Creek orthogneisses, andsuggests the Four Mile Creek paragneisses were sourced from theseorthogneisses prior to deformation. The notion of a major Palaeoproterozoicorogeny is supported in part by the Rb/Sr resetting age of 1700Ma obtainedfor the Four Mile Creek Gneiss Suite [Schaefer, 1993]. The first twodeformation events, Di and D2 are attributed to a Palaeoproterozoic orogenysince formation of the gneissic foliation, isoclinal folding and upperamphibolite facies metamorphism are not seen in younger units. Mi and M2low-pressure-high-temperature metamorphism generally predatesorthogneiss intrusion and is synchronous with Di and D2 deformation.Sandiford [1989a] interprets such recumbent structures in high-temperaturemetamorphic belts as due to the extensional collapse of overthickened crust.
The resetting age of 1700Ma may actually date crustal extension precedingdeposition of the Freeling Heights Metasediments (see below). HencePalaeoproterozoic tectonism may be correlated with the Nullaginian eventrecognised in many other Australian Proterozoic orogens around 1.8-1.9Ga(see §3) [Etheridge et al., 1987].
Deformation and mid-amphibolite facies metamorphism of the FreelingHeights Metasediments, Yagdlin Phyllite and Mount Adams Quartzitepreceded the intrusion of the Mount Neill Granite Porphyry around 1565Ma.Deposition of the Freeling Heights Metasediments after deformation of theFour Mile Creek Gneisses (~1700Ma) further constrains this Mesoproterozoicevent which may correlate with Carpentarian tectonism recognised in many
A Sm/Nd depleted mantle model age [Schaefcr, 1993].

Chapter 4: Tectonic evolution 33
other Australian orogens around 1600Ma [Etheridge et alv 1987].
The Four Mile Creek Gneisses are refolded about an axis perpendicular to Di
and D2 structures. Hence those structures must have been sub-horizontal
prior to Mesoproterozoic F2 folding. Two different mechanisms may explain
this; (1) F2 isoclinal folds and the S2 foliation formed horizontally due to
extension [e.g. Sandiford, 1989a], and (2) F2 isoclinal folds and the S2 foliation
were compressional and underwent later extension via simple shear, which
rotated them into sub-horizontality. The second mechanism is favoured here
since extension must have preceded deposition of the Freeling Heights
Metasediments. Hence the resetting age of ~1700Ma for the Four Mile Creek
Gneisses may be a manifestation of this extension.
The growth of corundum (sapphire) and other aluminous minerals in mica
rich beds of the Freeling Heights Metasediments and the Yagdlin Phyllite
occurred as a result of granite emplacement and may represent sub-surface
contact metamorphism of laterite horizons due to their anomalous alumina
content. The non-aligned nature of metamorphic minerals on the contact
aureole suggests M3 metamorphism post-dated all deformation in the
Freeling Heights Metasediments and Yagdlin Phyllite, questioning the role of
Delamerian deformation in the evolution of the Mount Painter basement (see
Chapter 4).
3 Proterozoic tectonism in Australia
Two essentially isochronous tectonothermal events have been recognised in
the northern Australian Palaeo-Mesoproterozoic record (see figure 5.1) which
are characterised by orogenesis of the Nullaginian (Barramundi Orogeny)
around 1900-1830Ma and Carpentarian basinal sedimentary cycles around
1600-1500Ma [Etheridge et alv 1987]. The Nullaginian sedimentary cycle in
the Hall's Creek and Pine Creek domains corresponds to rift and sag phase
clastic sequences followed by a turbiditic ?flysch facies which may have been
syn-orogenic [Etheridge et al., 1987]. Subsequent Carpentarian sedimentation
and tectonic style seems to vary between terrains [Etheridge et al., 1987].
Other domains in which the Nullaginian and Carpentarian have been
recognised include the Arunta Block, the Mount Isa Block, the King Leopold
Block and (at least in part) the Gawler Block. Two major Proterozoic

Chapter 4: Tectonic evolution 34
tectonothermal events observed in the Mount Painter Inlier can be related to
Nullaginian and Carpentarian tectonism.
Major igneous rock associations correlate remarkably well between domains
and show extensive geochemical homogeneity, requiring a widespread
homogeneous source #; a fact that cannot be easily reconciled with subduction
complexes. Syn-sedimentary mafic magmatism is correlated with rifting (as
in modern terrains). The geochemistry of syn- and post-orogenic I- and A-
type felsic plutonism cannot be associated with modern subduction
complexes due to the lack of intermediate-mafic components, the narrow
spread of chemical components between and within domains and the high
levels of potassium and light rare earth elements [Wyborn, 1985; Etheridge et
al., 1987]. Schaefer [1993] has correlated igneous rock associations of the
Mount Painter Inlier with geochemical data from other Australian Proterozoic
orogens.
Low-pressure-high-temperature (andalusite-sillimanite) metamorphism dist-
inguishes northern Australian Proterozoic terrains from modern collisional
orogens. The metamorphic record shows evidence for isobaric cooling rather
than adiabatic decompression. [Etheridge et al., 1987; Sandiford, 1989b;
Loos veld & Etheridge, 1990]. Upper amphibolite facies metamorphism in the
Palaeoproterozoic of the Mount Painter Inlier is consistent with these notions.
The Proterozoic tectonic evolution of the Mount Painter Inlier cannot be
correlated with a convergent plate boundary, as illustrated by its present
intracratonic setting. Low-pressure metamorphism, 'ensialic' magmatism
[Schaefer, 1993] and the absence of oceanic crustal material indicates an
alternative tectonic setting. Alternative tectonic scenarios are discussed in
Part 2 of this thesis.
Post-Proterozoic tectonism
The western edge of the Mount Neill Granite Porphyry is defined by a west-
dipping mylonite zone with reverse sense possibly indicating Delamerian
# This widespread homogeneous source may have accreted by ?plume related underplating at about2000Ma. Little evidence for recycling of preexisting Archaean crust into the source or the magmasexists. Similar processes have been documented in Scotland, Greenland and Antarctica [Etheridge etal., 1987].

Qiapter4: Tectonic evolution 35
activity (D5) along the Paralana Fault. Lineations trending 70-800-* 325 on
northeast trending foliations were recorded at the entrance to Mylonite Creek,
and kinematic indicators showed a west-side-up reverse vergence. Large
outcrops of mylonite at the northern end of Mount Adams Valley showed the
same vergence on a similar lineation (40°-* 300).
Subsequent chevron style, small scale kink folding (F4) of these sediments
may also be attributed to D5 Delamerian deformation. The Yagdlin Phyllite
and Mount Adams Quartzite also experienced F ^ and an S5 kink band
foliation may be defined.
An M4 metamorphic event caused retrogression of cordierite and sillimanite
in the Yagdlin Phyllite, although the timing of M4 is uncertain and may be
related to similar post-Delamerian retrograde metamorphism in Adelaidean
sediments further south.
5 Tectonic significance of Mount Adams Valley
Major brittle thrusting along the Paralana Fault System is attributed to late-
Tertiary exhumation of the Flinders Ranges due to drag folding of Tertiary
and Mesozoic sediments along the edge of the range in the south of the area*.
The Mount Adams Valley Fill is interpreted as a post-Delamerian tectonic
melange. Major Tertiary overthrusting may explain many unusual features of
Mount Adams Valley. Valley floor sediments may be as young as Tertiary,
possibly flysch conglomerates, although Teale [pers. comm., 1993] suggested
a pyroclastic diatreme-volcanogenic (possibly carbonatitic) origin.
Palynological analysis was negative [SANTOS, 1993], however XRD analysis of
small prismatic tourmaline crystals supports a sedimentary origin [Foden
pers. comm., 1993]. Various exotic lithologies occurring as rafts in Mount
Adams Valley may have been emplaced via thrusting. Rafts of undeformed
sediment may be exhumed Adelaidean Wywyana formation".
The low angle fault bounding the eastern edge of Mount Adams Valley may
* Vertically dipping tertiary conglomerates were found near the entrance to Four Mile Creek.# Adelaidean sediments east of the Paralana Fault System are flat lying and undeformed [Coats &Blissett, 1971; SADME drilling data]. Tertiary thrusting may have sampled these sediments formingrafts in Mount Adams Valley.

Chapter 4: Tectonic evolution 36
in fact be extensional due to gravitational collapse of the major overthrust[Sears pers. comm., 1993], forming an olistostrome [e.g. Hobbs et alv 1978;Elter & Trevisan, 1973; Kov<ks, 1989]. This would explain the lack ofbrecciation along the eastern fault, its inconsistent orientation anddiscontinuity (see figure 1.2) and implies that the mapped portion of theMount Neill Granite Porphyry, Yagdlin Phyllite and Mount Adams Quartzitewas originally west of the Paralana Fault System. The lack of ductiledeformation in the Mount Neill Granite Porphyry is attributed to its shallowemplacement in this area (i.e. above the brittle - ductile transition depth
I suggest that the Mount Painter Inlier is, at least in part, allochthonous.Major Tertiary thrusting emplaced the Mount Painter allochthon. Thepresence of 'tillites' near Mount Gee, to the south [Sprigg pers. comm., 1993],and other melanges of socalled Wywyana Formation can be explained in thisway. The Mount Painter Inlier forms a gravity 'low7* which suggests thatbasement rocks overlie less dense material, probably younger sediments.
* Average Bouger gravity readings 20-30 milligal lower than average for the Adelaidean parts of thenorthern Flinders Ranges cannot be reconciled with dense Precambrian crystalline basement.

PART TWO
Tectonics ofProterozoic Orogenic Belts

Chapter 5Orogenic aspects of Proterozoic tectonics
1 Introduction
Plate Tectonic theory has dominated geological thinking since its inception in
the 1960's [e.g. Condie, 1989], because it offers a powerful framework for
understanding the behaviour of the modern earth. This model adequately
accounts for many modern (Palaeozoic) tectonic regimes but problems have
arisen regarding its application to some Precambrian terrains. This suggests
that important secular tectonic changes may have occurred [e.g. Kroner, 1981;
1983; Sandiford, 1989b; Loosveld & Etheridge, 1990]' so that many plate
tectonic models proposed for such terrains may be inappropriate. The
importance of such secular changes is subject to debate. Some workers
assume that modern plate tectonic systems have been operating since the
earliest crustal formation (uniformitarianism) [e.g. Glikson, 1981; Anderson &
Burke, 1983; Hoffman, 1990], while others invoke alternative mechanisms to
explain progressive tectonic change since the Archaean [e.g. Etheridge et al.,
1987; Ellis, 1992].
One of these potentially important secular changes relates to the thermal
evolution of the earth. Since the tectonic behaviour of the lithosphere
strongly reflects its thermal state, its thermal evolution may have caused
secular changes in tectonic style. Most workers recognise that Archaean
(>2.5Ga) tectonic processes reflected a 200-300°C higher mean mantle
temperature, resulting in greater convective vigour in the mantle and the
proliferation of high-temperature rock types such as komatiites [e.g. Bickle,
1978; McKenzie & Weiss, 1980; Glikson, 1981; Baer, 1983; Christensen, 1985].
In comparison the earth's subsequent cooling history and its impact on
tectonic style, especially during the Proterozoic, is much more contentious.
38

Chapter 5: Orogenic aspects o/Proterozoic Tectonics 39
According to plate tectonic theory, convergent deformation and orogenesis isrestricted to collisional plate boundaries*. Modern (Palaeozoic) orogens arecharacterised by major uplift, high-pressure metamorphic belts, calc-alkalinemagmatism (andesites), lateral crustal accretion via large scale nappestructures, and obducted oceanic crust (ophiolites) [e.g. Hargraves, 1981;Baer, 1983; Etheridge et al., 1987]. While successful interpretations of someProterozoic orogens have been made using 'classical' plate tectonic theory[e.g. Anderson & Burke, 1983; Windley, 1981; 1983; Hoffman, 1980; 1990], thedistinct absence of 'modern' signatures from many Proterozoic mobile beltsmay indicate secular tectonic change [e.g. Tarling, 1980]. Ensialic(intracontinental) orogeny has been suggested as an alternative model fororogenesis and crustal growth in the Proterozoic [e.g. Kroner, 1977, 1981,1983; Etheridge et al., 1987; Loosveld & Etheridge, 1990] and may explainmany unusual features including the abundance of high-temperature-low-pressure metamorphism and anorogenic granites. The sialic nature of theunderlying crust and palaeomagnetic data* further support this idea.
The abundance of high-temperature-low-pressure metamorphic belts in theProterozoic record suggest anomalous geothermal gradients and only limitedcrustal thickening [e.g. Newton, 1987]. Some workers have attempted toexplain this in terms of extension [e.g. Sandiford & Powell, 1986], but fieldevidence generally supports contemporaneous metamorphism andcompression [Loosveld & Etheridge, 1990; Sandiford & Powell, 1991].Metamorphic evidence suggests isobaric cooling (rather than adiabaticdecompression) occurred, indicating limited crustal thickening1" [e.g.Loosveld & Etheridge, 1990; Sandiford & Powell, 1991].
The behaviour, of the mantle lithosphere during convergent deformation iscritical to the evolution of an orogen [Houseman et al., 1981]. Several workershave shown that a prerequisite for high-temperature-low-pressuremetamorphism is the decoupling of strain between the crust and mantlelithosphere, involving simultaneous crustal thickening and mantle
* Both oceanic and continental plates are currently too rigid to deform internally at feasible drivingforces and geothermal gradients, although the continental crust is weaker than the oceanic crust.ff Palaeomagnetic evidence for the Proterozoic suggests the existence of several huge continentswhose relative movement was minimal; hence plate boundary collisional orogeny was unlikely andcannot be reconciled with the large number of Proterozoic mobile belts [McElhinny & Embleton, 1976;Hargraves, 1981; Piper, 1991].+ Isobaric cooling indicates negligible post-orogenic uplift via erosion or mountain collapse. Henceconvergent deformation did not involve substantial crustal thickening.
Chapter 5: Orogenic aspects of Proterozoic Tectonics 40
lithospheric thinning [Loosveld & Etheridge, 1990; Sandiford & Powell, 1991].
The gravitational instability of a thickened thermal boundary layer at the base
of the lithosphere may lead to its detachment; removing part or all of the
mantle lithosphere via delamination or some other means [Bird &
Baumgardner, 1981; Houseman et al., 1981]. A discussion of possible
scenarios for lithosphere delamination and ensialic orogenesis is presented in
§2 of this chapter.
While such tectonic scenarios provide intriguing insights into lithospheric
evolution, their plausibility and implications have not yet been quantitatively
evaluated. In Chapter 6 I outline methods and results employed in my
numerical evaluation of possible delamination scenarios. Application of such
models to the Proterozoic tectonic record of the Mount Painter Inlier and
other Australian orogens is discussed in Chapter 7.
2 Delamination mechanics
Lithospheric thinning via mantle lithosphere delamination will involve the
rise of hot asthenospheric material (see figure 5.1). Therefore thinning will act
(1) to heat the remaining lithosphere, hence weakening it, and (2) to increase
its buoyancy. The buoyancy increase will raise the potential energy and
elevation of the lithosphere. Gravity will act against these increases, resulting
in an extensional force known as the buoyancy force.
Lithospheric stability will be maintained if the tectonic driving force balances
the buoyancy force and the lithospheric strength. If the buoyancy force
exceeds the driving force and strength at a given rate, extension will ensue
(and vice versa). Hence the mechanical consequences of mantle lithosphere
delamination can be investigated by evaluating a simple force balance. A
numerical method for achieving this is presented in Chapter 6.
Three basic scenarios involving mantle lithosphere delamination have been
developed by different workers to explain the aforementioned features of
Proterozoic orogens (see figure 5.2):
(i) Scenario 1: Mantle lithosphere delamination may precede and localise
convergent deformation in intracratonic settings. Deformation is

Chapter 5: Orogenic aspects of Proterozoic Tectonics 41
attributed to large scale tectonic driving forces acting on thecontinental lithosphere [e.g. Loosveld & Etheridge, 1990; Sandifordpers. comm., 1993].
(ii) Scenario 2: Mantle lithosphere delamination may occur in response tothermally induced boundary layer instabilities caused by extension[e.g. Kroner 1981; 1983]. Here convergent deformation is caused bythe 'slab pull' force of the delaminating lithosphere [e.g. Kroner, 1981;1983; 1984; Etheridge et alv 1987]. This scenario suggests ensialicorogenesis is self-perpetuating and self-localising .
Workers at the Bureau of Mineral Resources have developed a'Scenario 2' model for ensialic orogenesis in Australia during theProterozoic (see figure 5.2). Nullaginian and Carpentariansedimentation was caused by limited stretching of Archaeancontinental lithosphere over relatively small polygon-shapedconvection cells* in the upper mantle around 2.0-1.87Ga [Kroner et alv
1985; Etheridge et al., 1987]. Massive magmatic underplatingaccompanied this stretching. Lithospheric delamination ensued,causing convergent deformation via 'slab pull', acting only to restorenormal crustal thickness. Note that the difference between thisscenario and 'plate tectonic' models (e.g. North America) is 'one ofdegree rather than kind'. In this case, continental extension did notproceed to the stage of sea-floor spreading, hence subduction did notinvolve oceanic lithosphere. Orogenesis acted only to restore normalcrustal thickness, thus explaining the widespread low-pressuremetamorphism in many Proterozoic terrains. [Etheridge et al., 1987]
(iii) Scenario 3: Mantle lithosphere delamination may occur in response toboundary layer instabilities caused by lithospheric thickening[Houseman et al., 1981; Sandiford, 1989b; Loosveld & Etheridge, 1990;Sandiford & Powell, 1991]. Here, delamination occurs as a response tothickening and may cause extensional collapse [Sandiford, 1989b].
* This turbulent small scale convection is thought to have been caused by the blanketing effect of avery large slow moving continental mass; a notion supported by palaeomagnetic data [Etheridge etalv 1987; Piper, 1991].

Figure 5.2 Schematicrepresentation of the threedelamination scenarios.
SCENARIO 1: Delamination of reference lithosphere
reference lithosphere
SCENARIO 2: Lithospheric thinning precedes delamination
extension & basin formation mantle lithosphere delamination
slab pull?
convergent deformation afterrelaxation of extensional forces?
SCENARIO 3: Lithospheric thickening precedes delamination
extensional collapse?

Chapter 6On the mechanical plausibility of ensialic orogenesis
1 Introduction
In this chapter I investigate the mechanical plausibility and consequences of
mantle lithosphere delamination. This method derives its inspiration from
the work of Turcotte & Schubert [1983], Sonder & England [1986] and Zhou &
Sandiford [1992].
The numerical model
The lithospheric response to deformation at long wavelengths may be
approximated by using a thin sheet model [e.g. Sonder & England/ 1986]
which assumes horizontal and vertical strain rates are independent of depth.
These simple models have proved remarkably successful in explaining many
lithosphere-scale phenomena for horizontal length scales greater than 100km
[Sonder & England, 1986]. In this case I consider the effects of thermally
induced mechanical changes on a 1-dimensional lithospheric column* (see
figure 6.1).
The mechanical plausibility of delamination may be tested by evaluating the
force balance on such a lithospheric column (see Chapter 5). The force
balance expresses the relationship between the tectonic driving force, Fd, the
horizontal buoyancy force resulting from potential energy changes caused by
deformation, Fb, and the lithospheric strength, F,, which is dependent on
thermal state and based on a vertically averaged rheology appropriate to a
thin viscous sheet [Sonder & England, 1986].
Consider an undeformed lithospheric column subjected to a far-field tectonic
driving force, Fd/ assumed insufficient to deform it at appreciable rates. The
* Since the length scales for convergent deformation greatly exceed the depth, it is reasonable toconsider changes in the vertical dimension as a first approximation.
43

Chapter 6: On the mecltanical plausibility of ensialic orogenesis 44
column has strength Fn and density pv which varies with depth.
Crust
MantleLithosphere
MantleAsthenosphere
z
Pz
z
'z
\
z
\ moho
\
\
Figure 6.1 Undeformed lithospheric column with density distribution (pz),temperature and vertical stress(crz) versus depth graphs.
Now consider this column if part or all of the mantle lithosphere is removed.
Crust
MantleLithosphere
MantleAsthenosphere
z
Pz
(
r
z
'z
z
°2
\ moho
\
Figure 6.2 Deformed lithospheric column with attenuated mantlelithosphere.
For deformation of this column, the driving force must exceed the combined
buoyancy force and strength for a given strain rate, i.e:
F.>Fb+F. (6.1)
The effects of lithospheric thinning (via delamination) on the force balance are
evaluated by delaminating a portion of the mantle lithosphere of thickness
zdelam- This is expressed numerically as a thinning factor, /?:

Chapter 6: On tJie mechanical plausibility ofensialic orogenesis 45
(6-2)
where z;o is the initial thickness of the lithosphere. Note that £ is the
reciprocal of the thickening factor defined by Sandiford & Powell [1991].
Assuming the potential thermal state (see below), a unique force balance is
defined for a given thinning factor and strain rate.
Parameters used in all calculations are listed in table 6.1. Initial boundary
conditions appropriate to the three delamination scenarios discussed in
Chapter 5 were implemented. A fourth set of boundary conditions
appropriate to a thinner, 'hotter7 Proterozoic lithosphere were also used.
Boundary conditions used are listed below:
(i) a reference lithosphere, with mean crustal and lithospheric thicknesses
of 35km and 125km (Scenario 1);
(ii) the reference configuration thinned by a factor of 2 (i.e./,=0.5; Scenario
2);(iii) the reference configuration thickened by a factor of 1.5 (Scenario 3);
(iv) a thinner lithosphere corresponding to higher geothermal gradients
(hotter mantle temperatures) suggested for the Proterozoic. Reference
crustal and lithospheric thicknesses used were 25km and 80km [Zhou
pers. comm., 1993].
2.1 Calculation of the force balance for given strain rates
2.1.1 Horizontal buoyancy force
The horizontal buoyancy force is caused by the change in potential energy
between the deformed and undeformed lithosphere. The potential energy of
a lithospheric column is given by:
EP =^+"°^)dz = gfjp(T)drdz (6.3)
where o.Jz) is the vertical stress at depth z, z, is the thickness of the
lithosphere, h is the change in elevation (negative since depth is positive), g is
gravitational acceleration and p(r) is the lithospheric density (which is a
function of depth). So the buoyancy force per unit length (of orogen), Fb is
given by:

Chapter 6: On the mechanical plausibility ofensialic orogenesis 46
" b ~ t-1p(delaminau4 ~ ^p(referenc<!) ~ ^p(excess) (0.4)
where Ep(delaminated) is the potential energy of the thinned (delaminated)
column, Ep(referenCe) is the potential energy of the reference (undeformed)
column and E excess) is the potential energy gain due to the absence of
lithospheric material between the base of the delaminated column and the
depth of isostatic compensation (taken to be the base of the reference
lithosphere).
The density structure of the lithosphere is given by (see figure 6.1):
crust: p(z) = Pc +pcac(T,- T(z)) (6.5)
mantle lithosphere: p{z) = p, + p,am(T, - T(z)) (6.6)
[Turcotte, 1983]
where pc and pm are the densities of the crust and mantle at temperature Tu
which is the temperature at the base of the lithosphere of thickness zt, a is the
coefficient of thermal expansion and T(z) is the temperature at depth z. The
simplification acpc = c^p,,, is assumed [Turcotte, 1983; Sandiford & Powell,
1990; Zhou and Sandiford, 1992].
Buoyancy force estimates are strongly dependent on the geothermal gradient,
with differences of up to 8 x 10¹² Nm"1 occurring between 'no internal heat
production' gradients and the exponential gradients used here [Zhou &
Sandiford, 1992]. Zhou & Sandiford [1992] have shown that numerical values
for the buoyancy force are especially sensitive to the value of the thermal
expansion coefficient.
The horizontal buoyancy force is proportional to the thinning factor, j8 (see
figure 6.3). Any attenuation of the mantle lithosphere results in potential
energy increases giving extensional buoyancy forces (see figures 6.3). If the
lithosphere is thickened prior to delamination, it will have a positive initial
buoyancy force of 2 x 10¹² Nm"1 and an elevation of 2km with respect to an
isostatically compensated reference lithosphere [Zhou & Sandiford, 1992]. If
the lithosphere is thinned prior to delamination it will have a negative initial
buoyancy force of -0.5 x 10¹² Nm'1 and an elevation of -1500m. A maximum
buoyancy forces of 8 x 10n Nm'1 occurs when the entire mantle lithosphere is
removed from an initially thickened crust (see figure 6.3).

Chapter 6: On the mechanical plausibility ofensialic orogenesis 47
Table 6.1 Parameter values
b
Do
Erf
8
rHo
kK
X
n
Qd
Qi
Pa
Pc
Pm
o0
T,
T.
preexponential constant for
vertical length of descending slab
length scale for heat source distribution
strain rate for Dorn creep law
gravitational acceleration
slope of Clapeyron curve
surface heat production
thermal conductivity
thermal diffusivity
ratio of pore pressure to on in
coefficient of friction in
initial velocity of descending slab
exponent for power creep law
activation energy for Dorn creep law (olivine)
activation energy for power creep law
average asthenosphere density at T;
average crustal density at T,
average mantle density at T,
cohesion for
threshold stress for Dorn creep law
temperature at base of lithosphere
temperature at surface of lithosphere
(i) quartz
(ii) olivine
(i) crust
(ii) mantle
(i) crust
(ii) mantle
(i) quartz
(ii) olivine
(i) crust
(ii) mantle '
SxlO^MPa'V
7xlO 4 MPaV
«100km
10 km
3.05 x 10" s1
9.8 ms-2
4MPaIC1
3.5 x 10⁻⁶ Win 3
lOWm^KT1
1 mmV1
0.4
0
0.6
0.8
5cm yr'1
3
5.4 x lO^mor1
1.9 x lO^mol"1
S^xlO^moP1
3300 kgnV3
2700 kgm"3
3300 kgm"3
OMPa
60MPa
8500 MPa
1280° C
0°C

Chapter 6: On the mechanical plausibility ofensialic orogenesis
zc=57.5km
Z|=187.5km
2.5
Figure 6.3 The variation in buoyancy force, Fb, as a function of the thinningfactor, p, for different thickness parameters. The initial buoyancy forcedepends on the state of the lithosphere prior to delamination. Since (b)represents a thickened lithosphere and (c) represents a thinned lithosphere,they have initial buoyancy forces of 2 x 10¹² Nm'1 and -0.5 x 10¹² Nm' (
respectively.
2.1.2 Temperature distribution
The temperature distribution in the lithosphere is assumed to vary
exponentially with depth due to the concentration of heat-producing
radioactive elements in the upper crust. It is expressed by:
/,t, (6.7)
where Ho is the surface heat production,^ is the crustal thickening factor, Do
is the length scale for internal heat production, k is thermal conductivity, z is
depth, f, is the lithospheric thickening factor and 1, is the surface temperature
[Zhou & Sandiford, 1992]. T0(z) is the temperature profile when no
lithospheric heat sources are present and is given by:

Chapter 6: On the mechanical plausibility ofensialic orogenesis 49
JlZ> (6.8)
Values for H0/ h0, z, and Do are taken from Zhou & Sandiford [1992] and were
derived by balancing the potential energy of a reference lithosphere with that
at the mid-ocean ridges.
It was assumed that thermal reequilibration following delamination occurred
appreciably faster than deformational strain rates and lithospheric
underplating. For a typical thermal time constant of lOOMa, vertical strain
rates slower than 10'14 s"1 are required when assuming time-independence
[Zhou pers. comm., 1993].
Moho temperature is proportional to the thinning factor and depends on the
initial thickness of the crust and mantle lithosphere (see figure 6.4). When the
entire mantle lithosphere is removed, moho temperature equals that at the
base of the lithosphere. Since the temperature at the base of the lithosphere is
defined Theologically* for a constant temperature, changes in mean mantle
temperature act only to decrease the depth of this transition (i.e. the thickness
of the lithosphere).
1200
1000
o£ 800
600
oo
E
1200
1000
800
600
Figure 6.4 Variation in moho temperature, Tm with the thinning factor, p.The slope of the line depends on the initial crust:mantle lithosphere ratio.The stippled region indicates temperatures above the average crustal solidus.
It is acknowledged that anatexis is likely to occur in the crust for
temperatures above 800°C [e.g. Sandiford et al., 1991; Sandiford et al., 1992],
with important implications for melt generation following delamination.
Figure 6.4(a) shows that for thinning factors greater than 2.5, moho
* The lithosphere is defined to be that part of the mantle in which heat transfer is conductive and theasthenosphere is defined to be that part of the mantle in which heat transfer is advectwe. Hence theboundary layer separating lithosphore and asthenosphere is rheological and is defined at a constanttemperature, T/.

Chapter 6: On the mechanical plausibility ofensialic orogenesis 50
temperatures approach or exceed those of the crustal solidus. The rheological
effects of granite emplacement can be significant but depend on the location
of emplacement (see strength section) [Sandiford et alv 1991], and the
temporal evolution of the thermal regime. In all scenarios removal of the
entire mantle lithosphere causes temperatures to exceed the solidus in the
lower crust.
2.1.3 Surface elevation
The isostatically supported surface elevation, h, of a deformed lithospheric
column appropriate to the exponential temperature distribution is given by:
l + e'
ft
l + e(6.9)
where h0 is the elevation appropriate to a 'no heat source' lithosphere and is
given by:
(6.10)
and;Pm~Pc
The reference surface elevation was taken to be 0 (sea level). Figure 6.5
illustrates the increase in surface elevation following delamination. It is noted
that delamination does not initiate subsidence under any circumstance.
Maximum elevations approach 4.5km for an initially thickened crust.

Chapter 6: On the mechanical plausibility ofensialic orogenesis 51
-1000
e(m)
-1400
Figure 6.5 Increase in surface elevation, e with the thinning factor, /J, fordifferent thickness parameters. The initial elevation depends on the state ofthe lithosphere prior to delamination. Since (b) represents a thickenedlithosphere and (c) represents a thinned lithosphere, they have initialelevations of 2km and -1.5km respectively.
2.1.2 Lithospheric strength
In order to calculate the integrated strength of the continental lithosphere it is
necessary to consider the brittle and ductile parts separately for both the crust
and mantle. A detailed description of lithospheric strength calculations is
provided in Appendix 1.
The integrated strength of the continental lithosphere, F,, is given by:
(6.11)
where at and Oj are the maximum and minimum deviatoric stresses required
for failure. (at - a3) must be evaluated for the brittle and ductile parts of the
crust and mantle lithosphere assuming a vertically averaged rheology. The
'Brace-Goetze' rheology is used here, and is described in Appendix 1 [Zhou &

Chapter 6: On tlie mechanical plausibility ofensialic orogenesis 52
Sandiford, 1992].
Zhou & Sandiford [1992] demonstrate the futility of calculating an absolute
strength value for the lithosphere due to uncertainties in the rheological
parameters*, however strength differences can be estimated successfully.
The strength of the lithosphere is strongly dependent on its thermal state and
drops exponentially with increasing moho temperature. Figure 6.6 illustrates
lithospheric strength estimates for different strain rates.
(a)
zc=35km
(b)
zc=57.5km
Figure 6.6 Decrease in compressional lithospheric strength, F\ with thethinning factor, 8 for different strain rates,£ (family of 4 curves representinge=10'17,10'16,10 and lO'^s'1) and initial thickness parameters.
The assumed 'Brace-Goetze' rheology has two distinct deviatoric stress failure
maxima (for crust and mantle), the position of which is governed by the
brittle-ductile transitions (see figure 6.7). Brittle-ductile transitions in the
crust range from 12 to 19km for various strain rates and thermal
configurations. Brittle failure in the mantle only occurs under cool conditions
* A 10% uncertainty in creep law activation energy can effect the strength magnitude by an order of10 [Zhou & Sandiford, 1992]. Estimates for absolute strength of 1-4 x 10¹³ Nnv1 are obtained from theforce balance on a maximally thickened crust (70km), since the horizontal buoyancy force and drivingforce are well constrained [Zhou & Sandiford, 1992; Molnar, 1992).

Chapter 6: On the mechanical plausibility ofensialic orogenesis 53
at fast strain rates. Mantle lithosphere delamination acts to significantlyweaken the remaining material assuming thermal maturation. Lithosphericstrength also depends on strain rate (the faster the strain the greater thestrength), more so for a thicker lithosphere. The integrated extensionalstrength of the lithosphere is less than its compressional strength (see figure6.7).
oi - CT3 (MPa)
1000 500 0 500 1000
ox - 03 (MPa)
1000 500 0 500 1000
20
40
a. 60N
\ T D
Z \O \
TE
NS
I
XUJ
hase of
moho
B "7/-Dp o
/ g/ 2PR
ES
S
Oz
lithosphere
80 =
100
120
20
40
£. 60N
80
100
120 EX
TEN
SIO
N
^ bdc,c
moho'/-Dp
lithosphereasthenosphere
OO"030mCOCOOz
Figure 6.7 Lithospheric strength envelopes for a reference lithosphere, left(zc=35km, z(=125km), and a thinned, 'delaminated' lithosphere, right(z^^km, z(=35km). Strength is defined as the deviatoric stress required forfailure, ox - a3. The integrated compressional and extensional strength of thelithosphere is obtained by adding areas A and B, or C and D, respectively.Brittle-ductile transitions are labelled bdcc (compression of crust), bdec(extension of crust) and bdem (extension of mantle), and Dorn-power creeptransitions, Dp.
2.1.3 Evaluation of a tectonic driving force
If an external driving force is responsible for deformation, its magnitude islimited by the strength of the reference lithosphere. Feasible driving forcesrange up to ~2 x 10¹³ Nm1, and are attributed to 'slab pull' and 'ridge push'effects. Such driving forces were probably less in the Proterozoic sincerelative plate movement was minimal [Piper, 1991].

Chapter 6: On the mechanical plausibility ofensialic orogenesis 54
Kroner [1981; 1983] and Etheridge et al. [1987] propose the 'slab pull' force of
the delaminating lithosphere is the major convergent driving force. Turcotte
& Schubert [1982] define two components of 'slab pull'; the force due to the
density defect and the force due to possible phase transitions in the
subducting slab (e.g. the gabbro-eclogite transition). Since the density defect
is largely due to temperature differences (by definition) this component of
slab pull, FAT/ is:
(6.12)
where pa is the density of the mantle, g is acceleration due to gravity, a is the
coefficient of thermal expansion, b is the vertical length of the descending
slab, T,is the temperature of the mantle, Ts is the surface temperature, KIS the
diffusivity, / is the horizontal length scale of the slab and u0 is the velocity of
the descending slab. Phase changes are considered unlikely for limited
subduction of continental lithosphere [Ellis & Maboko, 1992].
3 On the mechanical plausibility of ensialic orogenesis
The effects of mantle lithosphere delamination (i.e. thinning) on surface
elevation, moho temperature, buoyancy force and lithospheric strength are
investigated graphically (see figures 6.8 & 6.9). The aim here is to graphically
portray the force balance for a given strain rate. It follows from equation (6.1)
that the minimum driving force required to deform the lithosphere at given
strain rates, Fdmin is:
Fdrnin=\ Fb+Fl2\ (6.13)
where F\, is the horizontal buoyancy force and F/2 is the strength of the
deformed column. Plots of Fdmin versus the thinning factor are given in
figure 6.8. For scenarios where buoyancy forces may exceed driving forces,
the effective driving force, Fed is considered, where;
F«/ = F d-F b (6.14)
for a given strain rate. A negative effective driving force is extensional and if

Chapter 6: On the mechanical plausibility ofensialic orogenesis 55
it exceeds the extensional strength of the thinned lithosphere, extension willoccur (and vice versa). This is expressed graphically by plotting effectivedriving force versus lithospheric strength (see figure 6.9). The line:
Fcd=\Fl\ (5)
defines the 'failure' envelope. Deformation will occur if the effective drivingforce - strength curve transects this line (shaded region of figure 6.9).
Ei.52oO 1
•0.5
7
6
E 52
4
3
O
uT 2
1
0•Fv
(b)
zc=57.5kmzp 187.5km
^ — -
•
•
F,d
T-irnw-
1.5 2.5
?
1.5
0.5
n
A\\: :::::•\ \\
\ A A ! V . . . .
No!°v\.".""
IA\ . . .
zc=25km- •zp80km. .
^ ^^§^^§§
F,d
1.5 2.5 1.5 2.5
Figure 6.8 Variation in driving force required for deformation Fj, with thethinning factor, B, for different strain rates,£ (family of 4 curves representing£=10'" 10'15,10 and lO'^s"1), and initial thickness parameters. Estimate forthe possible 'slab pull' force, Fsp, and the maximum tectonic driving force, Fu,are shown. The lightly shaded region shows parameter range appropriate toconvergent deformation due to the maximum driving force. The heavilyshaded region shows parameter range appropriate to convergentdeformation due to 'slab pull'.
For delamination of an unthickened lithosphere, convergent deformation willoccur given a sufficient driving force. This occurs most readily if the entiremantle part of the lithosphere is removed, requiring minimum driving forcesin the order of 6 x 10¹² Nm° to deform at strain rates between 10"17 and lO' s"1
for an initial configuration of zc=35km and z/=125km. Convergent

Chapter 6: On the mechanical plausibility ofensialic orogenesis 56
deformation will occur for maximum driving forces (~2 x 10¹³ Nm'1) when
crustal thinning factors of 1.1 (s = 1CT14 s 1) to 1.4 (e = 10'17 s 1) arise. For thicker
initial configurations, higher buoyancy fojx^s prevent convergent
deformation at feasible driving forces (~2 x lO '^s^and extension may ensue
if buoyancy forces exceed the combined strength and driving force (shaded
region in figure 6.9).
1 0 -1Fe dx101 2Nnr1
Figure 6.9 Graph showing changes in lithospheric strength versus theeffective driving force (which is a function of the thinning factor) for differentstrain rates (E=10~17 to 10"14 s"1). Negative driving forces are extensional (andvice versa). The shaded areas represent driving forces greater than thestrength, allowing deformation at a given strain rate.
4 Summary of results
The results of the numerical model are summarised as follows:
(i) Although mantle lithosphere delamination of an undeformed
(reference) lithosphere is unlikely [Houseman et al., 1981], it can
initiate convergent deformation in the 'delaminated' zone at relatively
large driving forces.
(ii) Mantle lithosphere delamination of a thickened lithosphere does not
initiate or perpetuate convergent deformation at feasible driving
forces. Extensional collapse will ensue if compressional driving forces
are relaxed.
(iii) Mantle lithosphere delamination of a thinned lithosphere can initiate
convergent deformation if initial extensional driving forces are relaxed.
Further extension is possible if extensional driving forces persist. The
'slab pull' force is sufficient to cause convergent deformation at

Chapter 6: On the mechanical plausibility ofensialic orogenesis 57
appreciable rates if more than half of the mantle lithosphere isremoved. Compressional buoyancy forces are not overcome bydelamination and act to increase the chance of convergentdeformation.
(iv) For an initially thinner, 'hotter' lithosphere the likelihood ofdeformation is enhanced due to its weakness, although buoyancyforces are less.

Chapter 7Discussion and application of tectonic modelling
The numerical model presented in Chapter 6 provides a simple graphicalmeans for investigating the mechanical consequences of ensialic mantlelithosphere delamination. Zhou & Sandiford [1992] have shown that suchmodels are sensitive to the assumed thermal parameters, rendering manyabsolute calculations futile. However important qualitative insights into thetectonic implications of various delamination scenarios can be made.
The likelihood of deformation at feasible driving forces and strain ratesdepends on the initial state of the lithosphere (see Chapter 6, §4). I haveshown the mechanical consequences of delamination for 4 initialconfigurations, all of which can explain widespread low-pressure-high-temperature metamorphism and anorogenic magmatism. Further constraintsmust be obtained from the geological record. In cases where delaminationprecedes convergent deformation, heating (i.e. metamorphism andmagmatism) will be pre-syn orogenic resulting in anticlockwise pressure-temperature-time paths. If delamination occurs as a result of lithosphericthickening, high-temperature metamorphism and magmatism would be syn-post orogenic resulting in clockzvise pressure-temperature-time paths, withhigh-temperature assemblages overprinting earlier high(er)-pressureassemblages [e.g. Sandiford, 1989b]. In cases where the lithosphere is initiallythinned, sedimentation may cause a thermal blanketing effect (for timescalesless than 50Ma#) which will weaken the entire lithosphere by reducingsurface heat flow [Zhou pers. comm., 1993]. Since timescales for convergentdeformation must be less than the timescale for 'sag phase' lithosphericaccretion, thermal blanketing effects may play an important supporting rolein enabling convergent deformation.
A higher mean mantle temperature during the Proterozoic may have caused athinner lithosphere to form which was weaker and less buoyant than themodern 'reference' lithosphere [Zhou pers. comm., 1993]. Driving forces
maximum time required for thermal re-equilibration following fast sedimentation is ~50Ma[Zhou pers. comm., 1993].
58

Chapter 7: Discussion 59
required for deformation would be considerably less.
Spontaneous delamination of the mantle lithosphere from a 'reference'lithosphere is unlikely since boundary layer instabilities are unlikely todevelop [Houseman et alv 1981], and the density defect between the 'cold'mantle lithosphere and the asthenosphere is insufficient to overcome itstensional strength [Ellis, 1992].
The model presented here shows that delamination of the entire mantlelithosphere raises moho temperatures well above the crustal liquiduspotentially resulting in voluminous magmatism, greatly weakening theremaining lithosphere. The rheological effects of magmatism on thelithosphere are discussed by Sandiford et al. [1991].
Geological evidence from the Mount Painter Inlier suggests that peakmetamorphism and magmatism was syn- to post-deformational for bothmajor Proterozoic orogenies. Diffusion constraints indicate anticlockwisepressure-temperature-time paths [Sriiwe pers. comm., 1993]. Since heatingpostdated crustal thickening, delamination may have postdated deformation(assuming deformation is convergent). High grade granulites indicatemaximum crustal thickening and moho temperatures in excess of 40km and850°C (i.e. above reference). Hence the initiating mechanism for deformationmay not be explained by mantle lithosphere delamination. Repeatedextension - compression cycles (Palaeoproterozoic, Mesoproterozoic,Adelaidean-Delamerian and Tertiary) along a northeasterly axis may indicatea fundamental, localised lithospheric weakness [e.g. Ding et al., 1992],possibly associated with the weakening effects of the concentration of heat-producing (radioactive) elements in the area.
The mechanical consequences of mantle lithosphere delamination stronglydepend on the initial state of the lithosphere and the magnitude of thetectonic driving forces. I have shown that mantle lithosphere delaminationmay localise and initiate ensialic convergent deformation in response tointraplate stresses (i.e. driving forces). The magnitude of such stresses ispoorly understood, especially for the Proterozoic, although recent work byZhou, Sandiford & Hillis [in prep.] will constrain these values. Findingspresented here are limited by our poor understanding of the rheologicalproperties of the lithosphere - hence its strength. The remarkable

Chapter 7: Discussion 60
heterogeneity of the continental lithosphere, which is reflected in thegeological record, emphasises the limitations of any tectonic 'quantification'.However, such models have provided unique insights into the fickle nature oftectonic behaviour, so that we can further understand the evolution of ourplanet, and even predict its future.

Acknowledgments
I sincerely thank my supervisor, Mike Sandiford, for his inspiration, patience
and support through the year, especially in the last few months. This project
would have been impossible without him.
My co-worker, Bruce Schaefer, deserves high accolades for putting up with
me in the field for 2 months! We both pulled through, however. Thanks,
Bruce, for a great year - this thesis wouldn't be the same without your
opinions and insights.
Drs Kurt Stiiwe and Shaohua Zhou were immensely helpful through the year
- many thanks. Drs John Foden, Jim Sears, Pat James and Thomas Flottmann,
and Annette Bingemer were also helpful and their support has been welcome
- thanks. Thanks also to the technical staff - namely Sherry (drafting), Geoff
and Wayne (sections), and Sophia (management). Huw Rosser, whose help
on the microprobe was indispensable, made an otherwise tedious job quite
bearable.
Thanks to SADME for generously providing the Landcruiser and RFDS radio
for our fieldwork, which wouldn't have been possible otherwise. Thanks also
for the 30 thin sections. Malcolm Sheard and Wolfgang Preiss provided
helpful ideas during visits to SADME. Thanks to Prue Freeman and Tony
Belperio for their help with computing. Thanks to CRA for providing
logistical support - the aerial photographs, maps, use of their field camp at
Arkaroola, and the helicopter rides were all immensely helpful (and fun!).
I also thank the Sprigg family at Arkaroola for the privilege of being able to
explore and map on their spectacular property. The staff at Arkaroola were
wonderfully helpful and made our weekly sojourns great fun!
Thanks to the honours students who made this year a great one - especially
those from 'the office from hell'!
Finally, thanks to Mum and Dad from their support from afar, and for beingso generous with the computer, car etc etc etc...
61

References
Anderson, S.L. & Burke, K., 1983, A Wilson Cycle approach to some Proterozoic problems in north-eastern North America. In Medaris, L.G., et al. (eds.), Proterozoic geology: Selected papersfrom an International Proterozoic Symposium, The Geological Society of America, Memoir 161,p75-94.
Arnold, J. & Sandiford, M.A., 1990, Petrogenesis of cordierite-orthoamphibole assemblages from theSpringto region, South Australia. In Contributions to Mineralogy and Petrology, 106, plOO-109.
Baer, A.J., 1983, Proterozoic orogenies and crustal evolution. In Medaris, L.G., et al. (eds.),Proterozoic geology: Selected papers from an International Proterozoic Symposium, TheGeological Society of America, Memoir 161, p47-58.
Barker, A.J., 1990, Introduction to Metamorphic Textures and Microstructures. Blackie, London, 162p.
Bickle, M.J., 1978, Heat loss from the earth: A constraint on Archaean tectonics from the relationbetween geothermal gradients and the rate of plate production. In Earth and Planetary ScienceLetters, 40, p301-315.
Bird, P. & Baumgardner, J., 1981, Steady propagation of delamination events. In Journal of GeophysicalResearch, 86 (B6), p4891-4903.
Blake, D.H., Stewart, A.J. & Sweet, I.P., 1986, The Proterozoic Hatches Creek Group, an ensialicsandstone-bimodal volcanic association in Central Australia. In Transactions of the GeologicalSociety of South Africa, 89, p243-251.
Blight, P.G., 1977, Uraniferous metamorphics and 'younger' granites of the Paralana area, MountPainter Province, South Australia: A petrographical and geochemical study. Unpublishedhonours thesis, University of Adelaide.
Brace, W.F. & Kohlstedt, D.L., 1980, Limits on lithospheric stress imposed by laboratory experiments.In Journal of Geophysical Research, 85, p6248n6252.
Byerlee, J.D., 1968, Brittle-ductile transition in rocks. In Journal of Geoplrysical Research, 73, p4741-4750.
Christensen, U.R., 1985, Thermal evolution models for the earth. In Journal of Geophysical Research,90(B4), p2995-3007.
Coats, R.P. & Blissett, A.H., 1971, Regional and Economic Geology of the Mount Painter Province,SADMS, Bulletin 43, Government Printer, Adelaide, 426p.
• / 'yCondie, K.C., 1980, Proterozoic tectonic regimes. In Abstracts with Programs, Geological Society of
America, 12 (7), p404-405.
Condie, K.C., 1989, Plate tectonics and crustal evolution, 3rd edition, Pergamon, Oxford, 366p.
Deer, W.A., Howie, R.A. & Zussman, J., 1992, An Introduction to the Rock-Forming Minerals, 2nd ed.Longman, London, 695p.
Ding, P., James, P.R. & Sandiford, M.A., 1992, Late Proterozoic deformation in the Amadeus Basin,central Australia. In Australian Journal of Earth Sciences, 39, p495-500.
62

References 63
Ellis, DJ. & Maboko, M.A.H, 1992, Precambrian tectonics and the physicochemical evolution of thecontinental crust, I. The gabbro-eclogite transition revisited. In Precambrian Research, 55,p491-506.
Ellis, D.J., 1992, Precambrian tectonics and the physicochemical evolution of the continental crust, II.Lithosphere delamination and ensialic orogeny. In Precambrian Research, 55, p507-524.
Elter, P. & Trevisan, L., 1973, Olistostromes in the tectonic evolution of the Northern Appenines. InDe Jong, K.A. & Scholten, R. (eds.), Gravity and Tectonics, Wiley, New York.
Etheridge, M.A., Rutland, R.W.R., & Wyborn, L.A.I., 1987, Orogenesis and tectonic process in theearly to middle Proterozoic of Northern Australia. In Kroner, A. (ed.), Proterozoiclithospheric evolution, Geodynamic Series, 17, American Geophysical Union, Geological Societyof America., pl31-147.
Fyfe, W.S., 1976, Heat flow and magmatic activity in the Proterozoic. In Sutton, J. (ed.), A discussionon global tectonics in Proterozoic times, Philosophical Transactions of the Royal Society of London,280 (1298), p655-660.
Glikson, A.Y., 1981, Uniformitarian assumptions, plate tectonics and the Precambrian earth. InKroner, A. (ed.), Precambrian Plate Tectonics. Elsevier, Amsterdam, p91-104.
Grambling, J.A., 1984, Regional metamorphism in central and northern New Mexico, andimplications for Proterozoic tectonics. In Abstracts with Programs Geological Society of America,16 (6), p522-523.
Green, D.H. & Hiberson, W., 1970, The instability of plagioclase in peridotite at high pressure. InLithos 3, p209-221.
Hargraves, R.B., 1981, Precambrian tectonic style: a liberal uniformitarian interpretation. In Kroner,A. (ed.), Precambrian Plate Tectonics. Elsevier, Amsterdam, p21-56.
Hewens, R.H., 1975, Pyroxene geothermomentry of some granulite facies rocks. In Contributions toMineralogy and Petrology, 50,205-209.
Hildebrand, R.S., Reichenbach, I.G., Hoffman, P.F., Easton, R., Lalonde, A.E., Bowring, S.A. & Housh,T., 1988, Magmatism at a 1.9Ga Cordilleran-type plate margin. In Abstracts with ProgramsGeological Society of America., 20 (7), p50.
Hobbs, B.E., Means, W.D. & Williams, P.F., 1976, An Outline of Structural Geology. Wiley, New York.
Hoffman, P.F., 1980, Wopmay Orogen: A Wilson Cycle of early Proterozoic age in the northwest ofthe Canadian Shield. In Strangway, D.W. (ed.), The Continental Crust and its MineralDeposits, Geological Association of Canada Special Paper, 20, p523-549.
Hoffman, P.F., 1988, Early Proterozoic orogens and the assembly of Laurentia. In Abstracts withPrograms Geological Society of America, 20 (1), p27.
Hoffman, P.F., 1990, Dynamics of the tectonic assembly of northeast Laurentia in geon 18 (1.9-1.8 Ga).In Geoscience Canada, 17 (4), p222-226.
Holland & Powell, 1990, An enlarged and updated internally consistent thermodynamic dataset withuncertainties and correlations: the system K2O - Na2O - CaO - MgO - FeO - Fe2C>3 - AI2O3 -T1O2 - SiC>2 - C - H2 - O2. In Journal of Metamorphic Geology, 8, p89-124.
Houseman, G.A., McKenzie, D.P. & Molnar, P., 1981, Convective instability of a thickened boundarylayer and its relevance for the thermal evolution of continental convergent belts, Journal ofGeophysical Research, 86(B7), p6115-6132.

References 64
Kovdcs, S., 1989, Devonian olistostrome with limestone olistoliths and volcanic matrix from StrdzsaHill, Uppony Mountains, northeastern Hungary. In Neues Jahrbuch fur Geologie undPalaontologie: Monatschefte, 2,109-127.
Kroner, A., 1977, Precambrian mobile belts of southern and eastern Africa - ancient sutures or sites ofensialic mobility? A case for crustal evolution towards plate tectonics. In McElhinny, M.W.(ed.), The past distribution of continents, Tedonophysics, 40, plOl-135.
Kroner, A., 1981, Precambrian plate tectonics. In Kroner, A. (ed.), Precambrian Plate Tectonics.Elsevier, Amsterdam, p57-90.
Kroner, A., 1983, Proterozoic mobile belts compatible with the plate tectonic concept. In Medaris,L.G., et al. (eds.), Proterozoic geology: Selected papers from an International ProterozoicSymposium, The Geological Society of America, Memoir 161, p59-74.
Kroner, A., 1984, Evolution, growth and stabilization of the Precambrian lithosphere. In Pollack,H.N. & Murthy, V.R., Structure and evolution of the continental lithosphere, Physics andChemistry of the Earth, 15, p69-106.
Kroner, A., Hoffman, P.F., Burg, J.F. & Caby, R., 1985, Are the Proterozoic fold belts of Australiaensialic? In Episodes, 8 (4), p265-266.
Loosveld, R.J.H. & Etheridge, M.A., 1990, A model for low-pressure facies metamorphism duringcrustal thickening. In Journal of Metamorphic Geology, 1990(8), p257-267.
Marshak, S. & Mitra, G., 1988, Basic Methods of Structural Geology, Prentice Hall, New Jersey, 446p.
McElhinny, M.W. & Embleton, B.J.J., 1976, Precambrian and early Palaeozoic palaeomagnetism inAustralia. In Sutton, J. (ed.), A discussion on global tectonics in Proterozoic times,Philosophical Transactions of the Royal Society of London, 280 (1298), p417-431.
McKenzie, D. & Weiss, N., 1980, The thermal history of the Earth. In Strangway, D.W. (ed.), TheContinental Crust and its Mineral Deposits, Geological Association of Canada Special Paper, 20,p575-590.
Myers, J.SV 1990, Precambrian tectonic evolution of part of Gondwana, southwestern Australia. InGeology, 18, p537-540.
Newton, R.C., 1987, Petrologic aspects of Precambrian granulite facies terrains bearing on theirorigins. In Kroner, A. (ed.), Proterozoic lithospheric evolution, Geodynamic Series, 17,American Geophysical Union, Geological Society of America, pll-26.
Passchier, C.W., Myers, J.S. & Kroner, A., 1990, Field Geology of High-Grade Gneiss Terrains. Springer-Verlag, Berlin, 150p.
Piper, J.D.A., 1991, The quasi-rigid premise in Precambrian tectonics. In Earth and Planetary ScienceLetters, 107, p559-569.
Plumb, K.A., 1985a, Central Australian Orogeny - and Himalayan comparisons. In Tectonics andGeodtemistry of Early to Middle Proterozoic Fold Belts, IGCP Conference program and abstracts.
Plumb, K.A., 1985b, Proterozoic orogeny worldwide - diachronous, random, or episodic? In Tectonicsand Geochemistry of Early to Middle Proterozoic Fold Belts, IGCP Conference program andabstracts.
Rossiter, A.G. & Ferguson, J., 1980, A Proterozoic tectonic model for northern Australia and itseconomic implications. In Ferguson, J. & Goleby, A.B. (eds.), Uranium in the Pine Creek

References 65
Geosyndine, IAEA, Vienna, p209-232.
Sandiford, M.A. & Powell, R., 1986, Deep crustal metamorphism during continental extension:modern and ancient examples. In Earth and Planetary Science Letters, 79, pl51-158.
Sandiford, M.A., 1989a, Horizontal structures in granulite terrains: A record of mountain building ormountain collapse? In Geology, 17, p449-452.
Sandiford, M.A., 1989b, Secular trends in the thermal evolution of metamorphic terrains. In Earth andPlanetary Science Letters, 95, p85-96.
Sandiford, M.A. & Powell, R., 1990, Some isostatic and thermal consequences of the vertical straingeometry in convergent orogens. In Earth and Planetary Science Letters, 98, pl54-165.
Sandiford, M.A. & Powell, R., 1991, Some remarks of high-temperature-low-pressure metamorphismin convergent orogens. In Journal of Metamorphic Geology, 1991(9), p333-340.
Sandiford, M.A., Martin, N., Zhou, S. & Fraser, G., 1991, Mechanical consequences of graniteemplacement during high-T, low-P metamorphism and the origin of "anticlockwise" PTpaths. In Earth and Planetary Science Letters, 107, pl64-172.
Sandiford, M.A. & Foden, J.F., 1992, Tliird year tectonics notes, unpublished.
Sandiford, M.A., Foden, J., Zhou, S. & Turner, S., 1992, Granite genesis and the mechanics ofconvergent orogenic belts with application to the Southern Adelaide Fold Belt. InTransactions of the Royal Society of Edinburgh: Earth Sciences, 83, p.
Schaefer, B.F., 1993, Isotopic and geochemical constraints on Proterozoic crustal growth from theMount Painter Inlier. Unpublished honours thesis, University of Adelaide.
Sivell, W., 1988, Eastern Arunta orthogneiss suites - implications for a repeated transition from rift tosubduction-related magmatism during successive Proterozoic ensialic orogenies. InGeological Society of Australia Abstracts, 21, p370-371.
Sonder, L.J. & England, P., 1986, Vertical averages of rheology of the continental lithosphere: relationto thin sheet parameters. In Earth and Planetary Science Letters, 77, p81-90.
Tarling, T.H., 1980, Lithosphere evolution and changing tectonic regimes. In Journal of the GeologicalSociety of London, 137, p459467.
Teale, G.S., 1993, Geology of the Mount Painter and Mount Babbage Inliers. In Geology of SouthAustralia, SADME, in press.
Turcotte, D.L. & Schubert, G., 1982, Geodynamics. Applications of Continuum Physics to GeologicalProblems, Wiley, New York, 450p.
Turcotte, D.L., 1987, Implications of lithosphere delamination on Venus. In EOS, Transactions of theAmerican Geophysical Union, 68 (44), pl338-1339.
Vivallo, W. & Rickard, D., 1984, Early Proterozoic ensialic spreading-subsidence: Evidence from theGarpenberg Enclave, Central Sweden. In Precambrian Research, 26, p203-221.
Wells, P.R.A., 1977, Pyroxene thermometry in simple and complex systems. In Contributions toMineralogy and Petrology, 62, pl29-139.
Windley, B.F., 1981, Precambrian rocks in the light of the plate tectonic concept. In Kroner, A. (ed.),Precambrian Plate Tectonics. Elsevier, Amsterdam, pl-20.
'References 66
Windley, B.F., 1983, A tectonic review of the Proterozoic. In Medaris, L.G., et al. (eds.), Proterozoicgeology: Selected papers from an International Proterozoic Symposium, Vie Geological Societyof America, Memoir 161, pl-10.
Wolfram, S., 1992, Mathematica™: A System for Doing Mathematics by Computer. Addison-Wesley,Sydney.
Wyborn, L.A.I., 1985, Geochemistry and origin of a major early Proterozoic felsic igneous event ofnorthern Australia and evidence for substantial vertical accretion of the crust. In Tectonicsand Geochemistry of Early to Middle Proterozoic Fold Belts, IGCP Conference program andabstracts.
Wynne-Edwards, H.R., 1976, Proterozoic ensialic orogenesis: The millipede model of plate tectonics.In American Journal of Science, 276, p927-953.
Xu, G., Will, T.M. & Powell, R., 1993, A calculated petrogenetic grid for the system K2O - FeO - MgO -AI2O3 - SiC>2 - H2O, with particular reference to contact metamorphosed pelites. In press.
Yardley, B.W.D., 1989, An Introduction toMetamorphic Petrology, Longman, New York, 248p.
Zhou, S. & Sandiford, M.A., 1992, Mafic magmatic underplating as a possible initialising mechanismof extensional basin formation. Unpublished.
Zhou, S. & Sandiford, M.A., 1992, On the stability of isostatically compensated mountain belts. InJournal of Geophysical Research, 97(B10), pl4207-14221.

Appendix 1Lithospheric strength calculations
1 Introduction
For strength calculations I assume a 'Brace-Goetze' rheology which is derivedfrom Jaeger & Cook [1969], Brace & Kohlstedt [1980], Sonder & England[1986] and Zhou & Sandiford [1992].
2 Derivation of the brittle failure envelope
Brittle failure via frictional sliding in the lithosphere occurs at lowtemperatures and high strain rates. The Navier-Coulomb criterion for brittlefracture along a plane is:
CO
where x is the shear stress along the plane, an is the normal stress on theplane, a0 is the cohesion of the material and ,u is the coefficient of internalfriction of the material (see figure Al.l) [Byerlee, 1968; Jaeger & Cook, 1969].This can be expressed diagrammatically [Jaeger & Cook, 1969]:
Fracture Plane
o.
Figure Al.l Diagrammatic portrayal of shear and normal stresses acting ona plane where a, and a3 are the maximum and minimum deviatoric stressesrequired for failure [Jaeger & Cook, 1969].
67

Appendix 1: Lithospheric strength calculations 68
Using trigonometric algebra, it can be shown that [Jaeger & Cook, 1969]:
r(°i
(
- ( a i ~ o-3)cos2/3 (2)
(3)
where a t and a3 are the maximum and minimum deviatoric stresses.
Substituting these values in equation (1) gives:
) sin 2/3 - -fx(a1- cr3) cos2/3 (4)
cr0 - - (a, - a3)[sin2/S - cos2/3] - - JU(CT, - a3) (5)
Now a0 is maximum when:
tan 2/3 = - - (6)
So;
sin2j3 = . ; cos2/3 =J +1
(7)
and;
-+ 1
2or0 = (a, - a3)Vj"2 + 1 - p(ox - a3) ;
• + 1 - ju) - a3(VjU2 +1 + A*)2 a o =
For compression, a3=cr2 (the vertical stress), so, from (8);
(8)
2a0a. (9)
and subtracting a3 from both sides gives:

Appendix 1: Lithospheric strength calculations 69
So;
2crn
- CT3 CT. - 1 (10)
°"l - <*3 " (11)
For extension, 01=03, so, from (8);
0-3 =
and subtracting o3 from both sides gives:
2oncr.
hi2 +1 +
So;
jU2 + 1 + jU
(12)
(13)
(14)
Hence equations (11) and (14) describe a brittle failure criterion for
compression and extension. Note that sign conventions differ from previous
publications [e.g. Sonder & England, 1986]. For numerical modelling of the
crust, fluid pore pressure, A, is taken into account, so for compression:.
(15)V;"2
+ 1 -
and for extension:
/j.2 + 1 +(16)
3 Ductile strength envelope
Ductile failure irt the crust for all o1-ai and in the mantle for a, -a3 < 200MPa
is described by the Power Creep Law [Brace & Kohlstedt, 1980]:

Appendix 1: Lithospheric strength calculations 70
A \ M »T' ( 1 7 )
Apj \ nRTt
where E is the strain rate, n is the power law exponent, Qp is the activation
energy, A p is a material constant, R is the universal gas constant and T is the
temperature at depth z.
For the upper ductile part of the mantle lithosphere, the Dorn Creep Law
applies when oi-a3> 200MPa [Brace & Kohlstedt, 1980].
1- I-ffl (18)
where od, Qd anded are the threshold stress, activation energy and strain rate
for the Dorn creep law. sd must be calculated to enable a smooth transition
between two creep laws when ox-oz= 200MPa.
2 Brittle-ductile and Power-Dorn creep transitions
The brittle-ductile transition depth occurs when the ductile strength of the
lithosphere becomes less than its brittle strength (defined in the above
sections). Hence the lithosphere has two distinct strength maxima
corresponding to the brittle-ductile transitions in the crust and mantle
lithosphere. Brittle ductile transition depths are calculated by evaluating:
J_QAV\«RTJ)
where o0 is the cohesion, fx is the coefficient of thermal expansion, p is the
density, A is the fluid pore pressure, e is the strain rate, n is the power law
exponent, Qp is the activation energy, Ap is a preexponential constant, R is the
universal gas constant and ZM and Tw are the depth and temperature of the
brittle-ductile transition. This expression must be evaluated independently
for the crust and mantle.
The Power-Dorn creep transition in the mantle lithosphere occurs when the
deviatoric stress required for failure is 200MPa (i.e. o^-o^ = 200MPa). The

Appendix 1: Lithospheric strength calculations 71
temperature at the transition depth is first calculated by solving the following
equation for T:
i
eA. exp
fiRTj200MPa (20)
The strain rate for the Dorn creep law, kd is then calculated to facilitate a
smooth transition at the calculated temperature by solving the following
equation for ed:
-M) = 200MPa (21)
where Qd and od are the activation energy and threshold stress for the Dorn
creep law. The transition depth is then calculated by evaluating equation (17)
for arbitrary T(z). If the moho temperature is higher than a critical value,
there will be no brittle failure in the mantle lithosphere and possibly no Dorn
creep law failure. [Zhou & Sandiford, 1992]
3 Numerical calculation of the lithospheric strengthcomponents according to Zhou & Sandiford [1992]
Based on the previously described 'Brace-Goetze' lithosphere, Zhou &
Sandiford [1992] have derived the following numerical methods for
calculating the lithospheric strength components.
The vertically integrated strength of the crust can be approximated by:
nRT,bd)
Q(22)
where:
1 nRTjbd
QpKt >
1 2 6
1 2 6

Appendix 1: Lithospheric strength calculations 71
T -T
zc-z bd
and Zw and TM are the depth and temperature of the brittle-ductile transition,Tm is the moho temperature and xc is the geothermal gradient in the lowercrust.
The vertically integrated strength of the mantle lithosphere is given byadding the brittle, Power creep and Dorn creep components, and can beapproximated by:
I crust
2a,
where:
-ix I mantle
(23)
r
Qd .tiRT,'
q .nRT,'1 2
T + ~T
JL 2L
J-Tmz,-zc
It must be noted that the above equations are purely simple geometric
approximations of otherwise complicated integrations. They enable relatively
quick computing.

Appendix 2Mathematica™ code
The Delamination program was written using Mathematica™ on a Sun Sparc 2
computer.
DELAMINATION PROGRAM
By Jon Teasdale, September, 1993.
This program investigates the plausibility of ensialic
orogenesis by evaluating the force balance on a ID litho-
spheric column for various parameter ranges.
It derives its inspiration from the work of
Zhou & Sandiford [1993].
The following parameter set is loaded first:
This set contains all parameters necessary is this model.
The following parameters are constants, general to the entire
model.
«Grophics'MultipleListPlot "
$DefaultFont={"Helvetica",7}
g = 9.8
tl=1280
zl0=125000
zc0=35000
fbi=0
ei=0
roc := 2700
roml := 3300
alpha := 3/10*5
r=8.314
z=.;zz=.;ZC-ZC0
zcd-zc0zc2-zc0
C* gravitational acceleration *)
(* temp at base of lithosphere *)
C* initial thickness of lith *)
C* initial thickness of crust *)
C* initial buoyancy force *)
C* initial elevation •)
C* average crustal density •)
C* average mantle density *)
(• coeff of thermal expansion *)
(* Universal Gas Constant *)
(• Miscellaneous *)
The following set of substitutions contains all the temperature
related information appropriate for the reference lithosphere.
tcondsl:-{ (• surface temp
73

Appendix 2: MatJietnatica™ code 74
thickening/thinning factor •)surface elevation *)thickness of lithosphere *)
'* thickness of crust •)* surface heat production *)'* length scale of heat prod. •)* thermal conductivity const. •)
C* crustal thickening factor •)
The folowing set of substitutions contains al l informationappropriate for the reference crust.
fl->l,h->0,
zl->zl0,
ZC->ZC0,
h0->3.5*10^-6,
d0->10000,
k->3,
Cccccc
crustref:={ sigma0->0,
mu->0.6,lambda->0.4,
ap->5*10A-6,
qp->1.9*10A5,
ro->2700,
ZC->ZC0,
zl->zl0,
n->3,
h->0,fc->l,
fl->l,tl->1280,
tm->te /. tcondsl /.
t->te /. tcondsl}
C*C*(*<*C*C*C*C*C*C*c*(•
c*
cohesion
coeff of internal frictionfluid pore pressure
preexponential constant
power law activation energy
average densitycrustal thickness
lithospheric thickness
power law exponent
elevationcrustal thickening factor
thickening/thinning factor
temp at base of lithosphere
{z->zc0}, (• moho temperature
C*temperature distribution
•)*)*)•}*)•)
*)
*)
*)
*)
*)
•)
•)
*)
The following set of substitutions contains a l l informationappropriate for the reference mantle lithosphere.
mantleref:={ sigma0->60*10A6,mu->0.8,ro->3300,lambda->0,ap->7*10M,qp->5.2*10A5,n->3,h->0,f l - > l ,zl->zl0,zc->zc0,sigmad->8500*10A6, C* Dorn law threshold stress *)qd->5.4*10A5, C* Dorn law activation energy *)tl->1280,tm->te / . tcondsl / . {z->zc0},t->te / . tcondsl}
The following set of substitutions contains a l l the temperaturerelated information appropriate for the deformed lithosphere.
tconds2:={ zc->zc2,zl->zl0*fld,fc->zcd/zc0,f l->f ld,d0->10000,h0->3.k->3,ts->0}
The following set of substitutions contains a l l informationappropriate for the deformed crust.
crustdef:-{ sigma0->0,mu->0.6,ro->2700,fl->nd,lambda->0.4,h->«[-elev / . tconds2],qp->l.9*10*5,

Appendix 2: Mathematica™ code 75
op->5*10A-6,tm->te /. tconds2 /. {z->zc0},n->3,zl->zl0*fld,zc->zc2,t->te /. tconds2,fc->zcd/zc0}
The following set of substitutions contains all informationappropriate for the deformed mantle lithosphere.
mantledef:={ sigma0->60*10A6,mu->0.8,ro->3300,lambda->0,h->N[-elev /. tconds2],ap->7*10M,qp->5.2*10*5,zc->zc2,tl->1280,n->3,fl->fld,fc->zcd/zc0,zl->zl0*fld,sigmad->8500*10A6,qd->5.4*10A5,tm->te /. tconds2 /. {z->zc0},t->te /. tconds2}
The following routines calculate the temperature distributionsin the lithosphere.
Here, t0 is the temp profile for no lithospheric heat sources;U is the temp profile for constant heat source;te is the temp profile for an exponentially varying heat
source with depth.tLc & tLm are conditional statements used when calculating tL.
- *)
t0 := ts + C(tl - ts)*z)/(fl*zl0)
C*tc := t0 + tL
tL := ai0*fl*zl*z*C(2*fc*zcy(n*zl)C2*k)
tLc : = (h0*fl»zl*z*CC2*fc*zc)/Cn*zl) -z/Cn*zl)))/C2*k);
tLm := (h0*fcA2*zcA2*(l - z/(fl*zl)))/C2*k)*)
te := t0 + CCh0*fcA2*d0A2yk)*(Cl-EA(-z/(fc*d0))>Cl-EA((-fl*zl0)/(fc*d0)))•Cz/(fl*zl0)))
The following line defines the temperature distribution inthe lithosphere according to the above routines.
t:=te
This routine calculates the density distribution within thecontinental lithosphere for a given temperature profile, t.
rhoc is the density distribution in the crust;rhom is the density distribution in the mantle Uthosphere.
rhoc - roc + roml*alpha*(tl-t)
rhora - roml + roml*alpho*(U-t)

Appendix 2: Matiiematica™ code 76
This routine calculates the elevation (elev) above the referenceheight, h0, according to an exponential heat productionregime.
— - — — — * )
elev0:=zl0*(delta*psi*Cfc-l)+alpha*(tl-ts)*(l-fl)/2)
delta:=(roml-roc)/roml;psi:=zc0/zl0;psil:=d0/zl0;betae:=(alpha*h0*d0A2)/k
elev:=elev0+zl0*fl*fcA2*betae*(((l+Exp[-fl*zl0/(fc*d0)])/2)-(fc/fl)*psil*(1-Exp[-fl*zl0/(fc*d0)]))-zl0*betae*(((l+Exp[-zl0/d0])/2)-psil*Cl-Exp[-zl0/d0]))
This routine calculates the potential energy of a lithosphericcolumn by integrating the vertical stress {sigma} within thatcolumn, given a particular density distribution.
I t then calculates the buoyancy force caused by thepotential energy contrast between the deformed andreference lithospheric columns.
sigmazl is the vertical stress at the base of the reference l i t h ;p5 is the excess potential energy (see text).
fbuoyancyt calculates the buoyancy force for a thickenedlithosphere.
- — - -•)
sigmac := g*Integrate[rhoc, z]si gmaml:= g*Integrate[rhoc,{z,h,zc+h}]+g*Integrate[rhom,z]-
g*Integrate[rhom, {z,h,zc+h}j
fbuoyancy:=NModule[{},
sigmacc:=N[sigmac / . {z->zz} / . tcondsl / . crustref];sigmamlm:=N[sigmaml / . {z->zz} / . tcondsl / . crustref];sigmacd:=N[sigmac / . {z->zz-h} / . tconds2 / . crustdef];sigmamld:=N[sigmaml / . {z->zz-h} / . tconds2 / . mantledef];pl=N[Integrate[sigmacd,{zz,h,0}] / . {h->-elev / . tconds2}];p2=N[Integrate[sigmacd,{zz,0,zc+h}]-
lntegrate[sigmacc,{zz,0,zc+h}] / . {zc->zc0,h->-elev / . tconds2}];
p3=N[Integrate[sigmamld,{zz,zc+h,zc}]-Integrate[sigmacc,{zz,zc+h,zc}] / .{zc->zc0, h->-elev / . tconds2}];
p4=N[Integrate[sigmamld,{zz,zc,zl+h}]-Integrate[sigmanilm,{zz,zc,zl+h}] / .{zc->zc0,zl->zl0-zdelam, h->-elev / . tconds2}];
sigmazl:=sigmamlm / . {zz->zl0};sigmazld:=sigmaml / . tconds2 / . mantledef / .
{z->zl0-zdelam};jj:=N[(zdelam-h) / . crustdef];terml:=N[jj*sigmazl];term2:=N[0.5*Csigmazl-sigmazld)*jj];term3:=N[Integrate[sigmamlm,{zz,zl+h,zl0}]
/ . {h->-elev / . tconds2,zl->zl0-zdelam}];p5=N[terml-term2-term3];fbuoy » N[pl+p2+p3+p4+p5],
6]
fbuoyancyt:-NModule[{},
sigmazcl:=N[g*Integrate[rhoc,{z,0,zc0}] / . tcondsl / .crustref];
sigmazc2:=N[g*Integrate[rhoc,{z,0,zc2}] / . tconds2 / .crustdef];
sigmamltl:=N[sigmazcl+g*Integrate[rhom,z]-sigmazcl];
sigmamlt2:»N[sigmazc2+gtlntegrate[rhom,z]-sigmazc2];
sigmacc:»N[sigmac / . {z->zz} / . tcondsl / . crustref];sigmamlm:-N[sigmamltl / . {z->zz} / . tcondsl / . crustref];sigmacd:-N[sigmac / . {z->zz-h} / . tconds2 / . crustdef]!sigmamld:-N[sigmamlt2 / . {z->zz-h} / . tconds2 / . mantledef];pl-N[Integrate[sigraacd,{zz,h,0}] / . {h->-elev / . tconds2}];p2t-N[Integrate[sigmacd,{zz,e,zc8}]-
Integrote[signwcc,{zz,0,zc0}] / . {zc->zc2,

Appendix 2: Matltematica™ code 77
h->-elev / . tconds2}];p3t=N[Integrate[sigmacd,{zz,zc0,zc2+h}]-
Integrate[sigmamlm,{zz,zc01zc2+h}] / . {zc->zc2,h->-elev /. tconds2}];
p4t=N[Integrate[sigmamld,{zz,zc2+h,zl0}]-Integrate[sigmaiBlra,{zz,zc2+h,2l0}] / .{zc->zc2,h->-elev / . tconds2}];
sigmozl:=sigmamlm / . {zz->zl0};sigmazldt:=sigmamlt2 / . {z->zl2} / . tconds2 / . mantledef;p5t=N[Integrate[sigmamld,{zz,z!0,zl2+h}]-
sigmazl*(zl2-h-zl0)-0.5*(sigmazldt-sigmazl)*(zl2-h-zl0) /. {h->-elev /. tconds2}];
fbuoy = N[pl+p2t+p3t+p4t+p5t],6]
These relationships define the br i t t le , ductile and plasticmaximum deviatoric stress envelopes in the lithosphere.
dsbritt le defines the br i t t le stress envelope according toByerlee's law;
dsductilel defines the ductile stress envelope according tothe Power Creep Law (for sl-s3<200MPa);
dsducitle2 defines the plastic stress envelope according tothe Oorn Creep Law (for sl-s3>200MPa).
- - - *)
dsbritt le := 2*(sigma0*10A6+mu*sigmaz*(l-lambda))/(Sqrt[muA2+l]-mu)
dsductilel := 10A6*CCepsdot/ap)A(l/n))*EACqp/(n*r*Ct+273))) / . {epsdot->eee}
dsductile2 := sigmad*(l - Sqrt[(r*(t+273)*Log[epsdotd/epsdot]yqd])
dsbrittlex := 2*(sigma0*10A6+mu*sigmaz*(l-lambda))/(Sqrt[muA2+l]-Hnu)
This routine calculates the brittle-ductile transition depth,{zbdc}, and the strength of the undeformed (reference) crust,{cstrengthref} calculates the compressional strength of the crust,{cstrengthrefx} calculates the extensional strength of the crust.
strcrust is the strength of the crust;tbdc is the temperature at the brittle-ductile transition;tm is the temnperature at the moho;xl, x2, yl, y2 & tauc are all calulation parameters.
cstrengthref:=NModule[{i,j )diff,diff2,xl,x2,yl,y2},
z=.;dcbrit=dsbrittle / . crustref / . {sigmaz->sigmac / .
tcondsl / . crustref};dcduct=dsductilel / . crustref / . tcondsl;For[i=5000; diff=N[dcduct-dcbrit / . {z->i} ] , diff>0,
i += 500, diff=N[dcduct-dcbrit / . {z -> i } ] ] ;For[j=i-1000; diff2=N[dcduct-dcbrit / . {z->i-1000}L diff2>0,
j += 2, diff2=N[dcduct-dcbrit / . {z -> j } ] ] ;zbdc=j;xl:=qp/(n*r*(tbdc+273)) / . crustref;x2:=qp/(n*r*Ctm+273)) / . crustref;yl:=(l/CxlA2))+(2/CxlA3))+(6/(xlA4));y2:=Cl/(x2A2))+C2/(x2A3))+C6/(x2A4));tauc:=(tm-tbdc)/(zc-zbdc) / . crustref / . tcondsl;tbdc:»te / . {z->zbdc} / . tcondsl;strcrust=N[10A6*(Cepsdot/ap)ACl/n))*
Exp[qp/(n(r»Ctbdc+273))]*C0.5*zbdc+Cqp/Cn*r*tauc))*Cyl-y2*Exp[x2-xl])) / . c rust ref / . {z->zbdc}],
6]
cstrengthrefx:-NModule[{i,j1diff,diff2,taum,xl,x2,yl,y2,tauc},
z-.;dcbritx-dsbrittlex / . crustref / .
{sigmaz->sigmac / . tcondsl / . crustref};dcductx'dsductilel / . crustref / . tcondsl;For[i-5000; diff-N[dcductx-dcbritx / . {z->i}],
diff>0, i +- 500, diff-N[dcductx-dcbritx
For[j-i-1000; diff2-N[dcductx-dcbritx
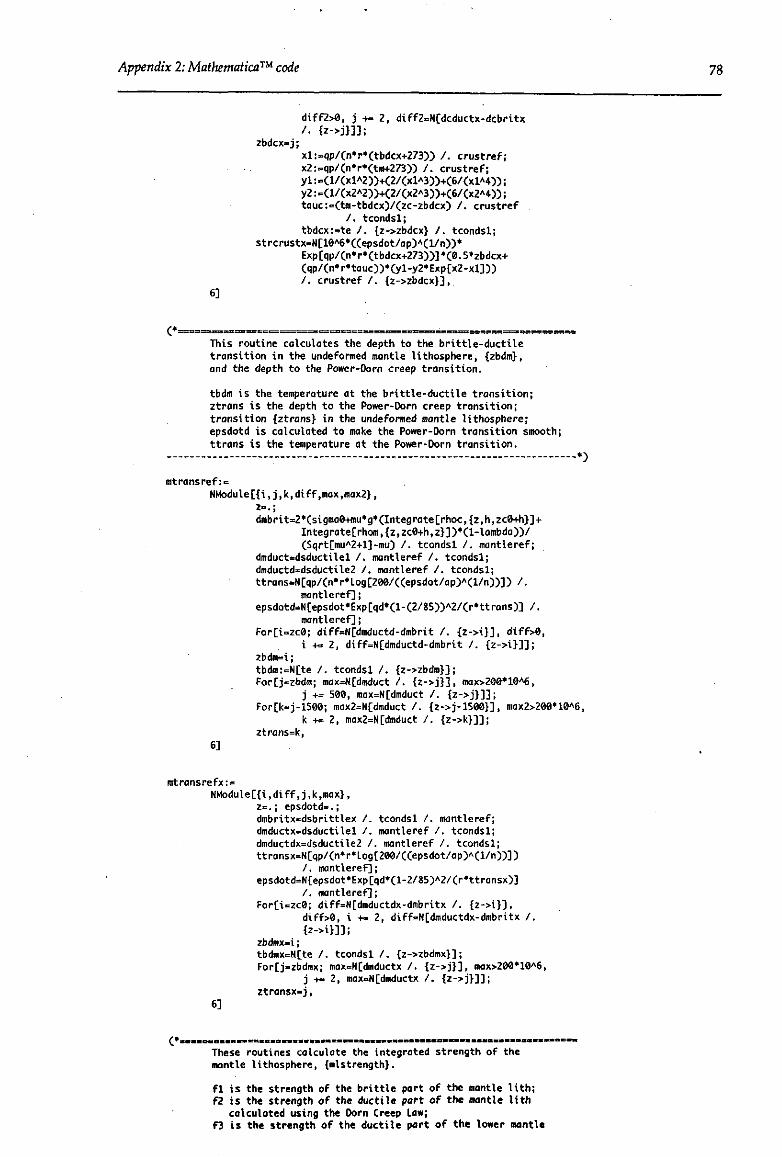
Appendix 2: Mathematica™ code 7g
diff2>0, j += 2, diff2=N[dcductx-dcbritx/ . {z->j}]];
zbdcx=j;xl:=qp/Cn*r*(tbdcx+273)) / . crustref;x2:=qp/(n*r*(tm+273)) / . crustref;y l : . • "
tauc:=Ctm-tbdcx)/(zc-zbdcx) / . crustref/ . tcondsl;
tbdcx:=te / . {z->zbdcx} / . tcondsl;strcrustx=N[10A6*((epsdot/ap)A(l/n))*
Exp[qp/(n»r*(tbdcx+273))]*C0.5*zbdcx+Cqp/(n*r»tauc))*G'l-y2*Exp[x2-xl]))/ . crustref / . {z->zbdcx}],
6]
This routine calculates the depth to the bri t t le-ducti letransition in the undeformed montle lithosphere, {zbdm},and the depth to the Power-Dorn creep transition.
tbdm is the temperature at the bri t t le-ducti le transition;ztrans is the depth to the Power-Dorn creep transition;transition {ztrans} in the undeformed mantle lithosphere;epsdotd is calculated to make the Power-Dorn transition smooth;ttrans is the temperature at the Power-Dorn transition.
- - - - *)
mtransref: =NModule[{i,j,k,diff,max,max2},
z=.;dmbrit=2*(sigma0+mu*g*(Integrate[rhoc,{z,h,zc0+h}]+
Integrate[rhom,{z,zc0+h,z}])*(l-lambda)V(Sqrt[muA2+l]-mu) / . tcondsl / . mantleref;
dmduct=dsductilel / . mantleref / . tcondsl;dmductd=dsductile2 / . mantleref / . tcondsl;ttrans=N[qp/(n*r*log[200/C(epsdot/ap)A(l/n))]) / .
mantleref];epsdotd=N[epsdot*Exp[qd*(l-C2/85))A2/Cr*ttrans)] / .
mantleref];For[i=zc0; diff=N[dmductd-dmbrit / . {z-> i } ] , diff>0,
i += 2, diff=N[dmductd-dmbrit / . {z -> i } ] ] ;zbdm=i;tbdm:=N[te / . tcondsl / . {z->zbdm}];For[j=zbdm; max=N[dmduct / . {z -> j } ] , max>200*10A6,
j += 500, max=N[dmduct / . {z -> j } ] ] ;For[k=j-1500; max2=N[dmduct / . {z->j-1500}], max2>200*10A6,
k += 2, max2=N[dmduct / . {z->k}]];ztrans=k,
6]
mtransrefx:=NModule[{i,diff,j.k,max},
z=.; epsdotd=.;dmbritx=dsbrittlex / . tcondsl / . mantleref;dmductx=dsductilel / . mantleref / . tcondsl;dmductdx=dsductile2 / . mantleref / . tcondsl;ttransx=N[qp/Cn*r*Log[200/C(epsdot/apy(l/n))])
/ . mantleref];epsdotd=N[epsdot'Exp[qd*Cl-2/85)A2/Cr*ttransx)]
/ . mantleref];For[i=zc0; diff=N[dmductdx-dmbritx / . {z->i } ] ,
diff>0, i +- 2, diff=N[dmductdx-dmbritx / .{z->i}]];
zbdmx=i;tbdmx=N[te / . tcondsl / . {z->zbdmx}];For[j=zbdmx; max=N[dmductx / . {z-> j } ] , max>200*10A6,
j +« 2, max=N[dmductx / . { z jztransx-j,
6]
These routines calculate the integrated strength of themantle lithosphere, {ralstrength}.
f l is the strength of the br i t t le part of the mantle l i t h ;f2 is the strength of the ductile part of the mantle l i t h
calculated using the Dorn Creep Law;f3 is the strength of the ductile port of the lower mantle
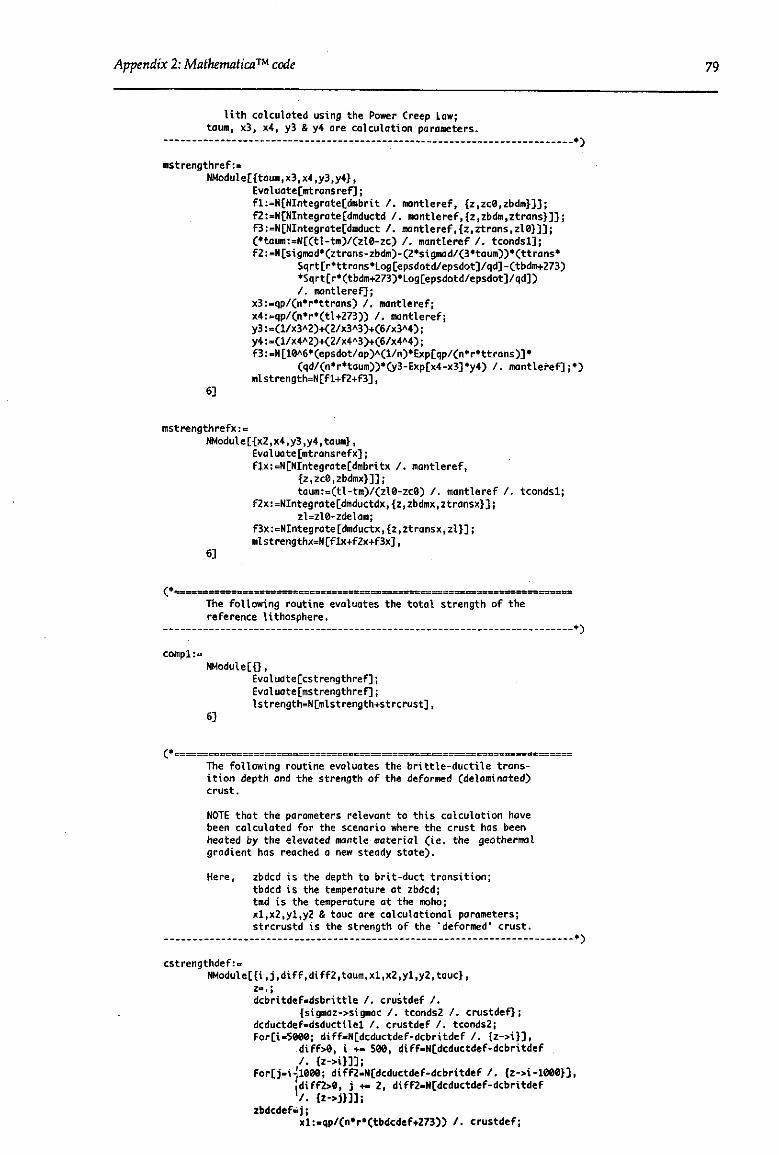
Appendix 2: Mathematical™ code 79
l i t h calculated using the Power Creep Law;taunt, x3, x4, y3 & y4 are calculation parameters.
mstrengthref :=NModule[{taum,x3,x4,y3,y4},
Evaluate[mtransref];fl:=N[NIntegrate[dmbrit / . mantleref, {z,zc0,zbdm}]];f2:=N[NIntegrate[dmductd / . mantleref,{z.zbdm.ztrans}]];f3:=N[NIntegrate[dmduct / . mantleref,{z,ztrans,zl0}]];(•taum:=N[(tl-tm)/(zl0-zc) / . mantleref / . tcondsl];f2:=N[sigmad*(ztrans-zbdm)-(2*sigmad/(3*taum))*(ttrans*
Sqrt[r*ttrans*Log[epsdotd/epsdot]/qd]-(tbdm+273)•Sqrt[r*(tbdm+273)*Log[epsdotd/epsdot]/qd])/ . mantleref];
x3:=qp/(n*r*ttrans) / . nantleref;x4:=qp/(n»r*(tl+273)) / . mantleref;y3:
f3:=N[10A6*(epsdot/ap)A(l/n)*Exp[qp/(n*r*ttrans)]*Cqd/(n*r*taum))*Cy3-Exp[x4-x3]*y4) / . mantleref];*)
mlst rength=N[fl+f2+f3],6]
mstrengthrefx:=NModule[{x2,x4,y3,y4,taum},
Evaluate[mtransrefx];flx:=N[NIntegrate[dmbritx / . mantleref,
{z,zc0,zbdmx}]];taum:=(tl-tm)/(zl0-zc0) / . mantleref / . tcondsl;
f2x:=NInteg rate[dmductdx,{z,zbdmx,ztransx}];zl=zl0-zdelam;
f3x:=NIntegrate[dmductx,{z,ztransx,zl}];mlstrengthx=N[flx+f2x+f3x],
6]
The following routine evaluates the total strength of thereference Hthosphere.
- - - *)
compl:=NModule[{},
Evaluate[cstrengthref];Evaluate[mstrengthref];1strength=N[mistrength+strerust],
6]
The following routine evaluates the brittle-ductile trans-ition depth and the strength of the deformed (delominoted)crust.
NOTE that the parameters relevant to this calculation havebeen calculated for the scenario where the crust has beenheated by the elevated mantle material (ie. the geothermalgradient has reached a new steady state).
Here, zbded is the depth to brit-duct transition;tbded is the temperature at zbded;tmd is the temperature at the moho;xl,x2,yl,y2 & tauc are calculational parameters;strcrustd is the strength of the "deformed' crust.
cstrengthdef:=NModule[{i,j,diff,diff2,taum,xl,x2,yl,y2,tauc},
z=.;dcbritdef»dsbrittle /. crustdef /.
{sigmaz->sigmac /. tconds2 /. crustdef};dcductdef-dsductilel /. crustdef /. tconds2;For[i-5000; diff-N[dcductdef-dcbritdef /. {z->i}],
diff>0, i +- 500, diff-N[dcductdef-dcbritdef/ • { z i } ] ] ;
For[j-i-1000; diff2-N[dcductdef-dcbritdef / . {z->diff2>0, j +- 2, diff2-N[dcductdef-dcbritdefV. {z->j } ] ] ;
zbdcdefnj;xl:-qp/(n«r*Ctbdcdef+273)) / . crustdef;

Appendix 2: Mathematica™ code 80
x2:=qp/(n*r*(tHR273)) / . crustdef;
y2: =Ctauc:=(tm-tbdcdef)/(zc-zbdcdef) / . crustdef
/ . tconds2;tbdcdef:=te / . {z->zbdcdef} / . tconds2;
strcrustdef=N[10A6*((epsdot/ap)A(l/n))*Exp[qp/(n*r*(tbdcdef+273))]*(0.5*zbdcdef+
/ . crustdef / . {z->zbdcdef}],6]
This routine evalutes the depths to the britt le-ducti leand Power-Dorn transition in the deformed mantleUthosphere {zbdmdef, ztransdef}.
mtransdef:=NModule[{i,diff,j,k,max,max2},
z=.; epsdotd=.;dmbritdef=2*(sigma0+mu*g*(Integrate[rhoc,{z,h,zc0+h}]+
Integrate[rhom,{z,zc0+h,z}])*Cl-lambda))/(SqrtOuA2+l]-mu) / . tconds2 / . mantledef;
dmductdef=dsductilel / . mantledef / . tconds2;dmductddef=dsductile2 / . mantledef / . tconds2;ttransdef=N[qp/(n*r*Log[200/((epsdot/ap)ACl/n))])
/ . mantledef];epsdotd=N[epsdot*Exp[qd*(l-2/85)A2/(r*ttransdef)3
/ . mantledef];For[i=zc0; diff=N[dmductddef-dmbritdef / . {z->i } ] ,
diff>0, i += 2, diff=N[dmductddef-dmbritdef / .{z->i} ] ] ;
zbdmdef=i;tbdmdef=N[te / . tconds2 / . {z->zbdmdef}];For[j=zbdmdef; max=N[dmductdef / . {z->j} ] , max>200*10A6,
j += 2, max=N[dmductdef / . {z-> j } ] ] ;ztransdef=j,
6]
These routines calculate the integrated strength of thedeformed mantle lithosphere, {mlstrengthdef}.
f id is the strength of the br i t t le part of the mantle l i t h ;f2d is the strength of the ductile part of the mantle l i t h
calculated using the Dorn Creep Law;f3d is the strength of the ductile part of the lower mantle
l i t h calculated using the Power Creep Law;taum, x3, x4, y3 & y4 are calculation parameters.
mstrengthdef:=NModule[{x2,x4,y3)y4,taum}1
Evaluate[mtransdef];fld:=N[NIntegrate[dmbritdef / . mantledef,
{z,zc0,zbdmdef}]];taum:=Ctl-tm)/(zl0-zc0) / . mantledef / . tconds2;
f2d:=NIntegrate[dmductddef,{z,zbdmdef.ztransdef}];zl=zl0-zdelam;
f3d:=NIntegrate[dmductdef,{z,ztransdef,zl}];mlstrengthdef=N[fld+f2d+f3d],
6]
This routine calculates the extensional strength of the deformedcrust.
cstrengthdefx:-NModule[{i,j,diff,diff2,taum,xl,x2,yl1y2,tauc}1
z-.;dcbritdefx-dsbrittlex / . crustdef / .
{sigmaz->sigmac / . tconds2 / . crustdef};dcductdefx-dsductilel / . crustdef / . tconds2;For[i-500O; diff«M[dcductdefx-dcbritdefx / . {z->i} ] ,
diff>«, i +- 500, diff-N[dcductdefx-dcbritdefx{ ] ] ;
For[j-i- ie00; diff2-N[dcductdefx-dcbritdefx

Appendix 2: Mathematica™ code 81
diff2>0, j += 2, diff2=N[dcductdefx-dcbritdefx
zbdcdefx=j;xl:=qp/(n*r*(tbdcdefx+273)) / . crustdef;x2:=qp/(n*r*(tiiH-273)) / . crustdef;y l :
tauc:=(tm-tbdcdefx)/(zc-zbdcdefx) / . crustdef/ . tconds2;
tbdcdefx:=te / . {z->zbdcdefx} / . tconds2;strcrustdefx=N[10A6*CCepsdot/ap)A(l/n))*
Exp[qp/(n*r*(tbdcdefx+273)XI*(0.5*zbdcdefx+(qp/(n*r*tauO)*(yl-y2*Exp[x2-xl]))/ . crustdef / . {z->zbdcdefx}],
6]
This routine calculates the various transitions appropriate tothe extensional strength calculations of the mantle lithosphere.
- - - - - - — - * )
mtransdefx:=NModule[{i,diff,j,k,max},
z=.; epsdotd=.;dmbritdefx=2*(sigma0+mu*g*(Integrate[rhoc,{z,h,zc0+b}]+
Integrate[rhom,{z,zc0+h,z}])*Cl-lambda))/(Sqrt[muA2+l]-Hnu) / . tconds2 / . mantledef;
dmductdefx=dsductilel / . mantledef / . tconds2;dmductddefx=dsductile2 / . mantledef / . tconds2;ttransdefx=N[qp/(n*r*Log[200/((epsdot/ap)A(i/n))])
/ . mantledef];epsdotd=N[epsdot*Exp[qd*Cl-2/85)A2/(r*ttransdefx)]
/ . mantledef];For[i=zc0; diff=N[dmductddefx-dmbritdefx / . {z-> i } ] ,
diff>0, i += 2, diff=N[dmductddefx-dmbritdefx / .
zbdmdefx=i;tbdmdefx=N[te / . tconds2 / . {z->zbdmdefx}];For[j=zbdmdefx; max=N[dmductdefx / . {z -> j } j , max>200*10A6,
j += 2, max=N[dmductdefx / . {z -> j } ] ] ;ztransdefx=j,
6]
This routine calculates the extensional strength of thedeformed mantle lithosphere.
mstrengthdefx:=NModule[{x2,x4)y3,y4,taum},
Evaluate[mtransdefx];fldx:=N[NIntegrate[dmbritdefx / . mantledef,
{z.zcO.zbdmdefx}]];taum:=Ctl-tm)/(zl0-zc0) / . mantledef / . tconds2;
f2dx:=NIntegrate[dmductddefx,{z,zbdmdefx,ztransdefx}];zl=zl0-zdelam;
f3dx:=NIntegrate[dmductdefx,{z,ztransdefx,zl}];mlst rengthdefx=N[fldx+f2dx+f3dx],
These routines evaulate the congressional and extensionalstrengths of the deformed lithosphere.
comp2:=NModule[{},
Evaluate[cstrengthdef];Evaluate[mstrengthdef],
6]
comp2x:«NModule[{},
Evaluate[cstrengthdefx];Evaluate[mstrengthdefx],
6]

Appendix 2: Mathematica™ code 82
This routine calculates the possible force caused by adensity defect between the cold, dense delaminating slaband the hot asthenosphere. I t is derived from Turcotte &Schubert [1983].
fspull is the net slab-pull force;kappa is the dif fusivi ty;bv is the vertical length of the subducting slab;bh is the horizontal length of the subducting slob;mu0 is the mean horizontal velocity of the system.
fspull:=2*roml*g*alpha»bv*Ctl-ts)*Sqrt[kappa*bh/(2*Pi*mu0)] / . mantleref / .{bv->700000,kappa->l*10A-9,mu0->50*10A-3/(36S*24*60*60),bh->4000000} / . tcondsl
DATA COMPILATION ROUTINE
This routine calculates the net effective driving force, fed,and compares it with the strength of the deformed lithosphere,Istrengthdef.
zdelam is the thickness of the delaminated slab;tmoho is the moho temperature;drivingforce is an assumed value less than the reference
strength of the lithosphere.- - - *)
comp3:=NModule[{},
Evaluate[compl];zstep=9375;drivingforce=5*10A12 (* has to be less than Istrength * ) ;For[zd=0;
fld=1.0;fb[fld]=drivingforce-fbi;
lstrengthdef[fld]=N[strcrust+mlstrength];
tmoho[fld]=N[te / .{z->zc0,fl->l} / . tconds2];
flsum[fld]=N[strcrust+mlstrength];elevation[fld]=ei;zdelam=zd+zstep;fld=N[(zl0-Czd+zstep))/zl0],
zd<zl0-zc0+l,zd += zstep,
Evaluate[fbuoyancy];fb[fld]=drivingforce-(fbuoy+fbi);If[fb[fld]<0,
Evaluate[comp2x / . { f l ->f ld} ] ;lstrengthdef[f\d]=
strcrustdefx+mlstrengthdefx,Evaluate[comp2 / . { f l ->f ld} ] ;lstrengthdef[fld]=
strcrustdef-Hnlstrengthdef];tmoho[fld]=N[te / . {z->zc0; fl->fld} / .
tconds2];flsum[fld]=fb[fld]+lstrengthdef[fld];elevation[fld]=N[ei+elev / . tconds2 / .
{ } ] ;fld=N[(zl0-Czd+zstep))/zl0];zdelam=zd+zstep];
w=fb[u];x=tmoho[u] / . {z->zc0};y=N[lstrengthdef[u]];s«flsum[u];e-elevation[u];
Do[ged[l/u]-fb[u],{u,0.3,l,0.05}];Do[gtmoho[l/u]-tmoho[u] / . {z->zc0},{u,0.3,l,0.05}];Do[gls[l/u]-N[lstrengthdef[u]],{u,0.3,l,0.05}];Oo[gsum[l/u]-nsum[u], {u,0.3,1,0.05}];Do[el[l/u]-elevation[u],{u,0.3,l,0.05}];
gw-ged[l/u];gx-gtmoho[l/u];gy-gls[l/u]jgyw-gsum[l/u];g [ ] ;
gwlist-Toble[{l/u,gw},{u,0.3,l,0.05}];

Appendix 2: Mathematica™ code 83
geUst=Table[{l/u,gel}, {u,0.3,l,0.05}];gxlist=Table[{l/u,gx},{u,0.3,l,0.05}];gylist=Toble[{l/u,gy},{u,0.3,l,0.05}];gywUst=Table[{l/u,gyw},{u,0.3,l,0.05}];epslist[epsdot]=Table[{l/u,gyw},{u,0.15,0.6,0.15}];wwlist[epsdot]=Table[gw,{u,0.3,1,0.05}];yylist[epsdot]=Table[gy,{u,0.3,l,0.05}];graphy[epsdot]=ListPlot[gylist,
PlotJoined->True,PlotStyle->Thickness[0.0005],DisplayFunction->Identity];
graphyw[epsdot]=ListPlot[gywlist,PlotJoined->True,Di splayFunction->Identi ty,PlotStyle->Thickness[O.0G05]];
listcombined[epsdot]=Transpose[{wwlist[epsdot],yylist[epsdot]}],
6]
This routine calculates lithospheric strength for differentmoho temperatures.
comp5:=NModule[{},
tl=.;epsdot=3.16 10A-16;eee=epsdot;For[q=1000,
q<1501,q += 50,
tl-qjtmo[q]=N[te / . tcondsl / . {2->zc0}];Evaluate[cstrengthref];Evaluate[rostrengthref];ls[q]=N[strcrust+mlstrength]];
lMs[qq];mm=tmo[qq];Ulist=Table[H,{qq,1050,1580,50}];mmlist=Table[mm,{qq,1050,1500,50}];lmtrans=Transpose[{muiUst,lHist}];tempgraph=ListPlot[lwtrans,
PlotJoined->True,DisplayFunction->$DisplayFunction,Frame->True,Axes0rigin={375,2 10^13},PlotStyle->Thickness[0.001],PlotLabel->FontForm["Lithospheric strength vs moho temperature",
{"Helvetica-Bold",12}]],6]
This routine evaluates the various force balances for differentstrain rates.
- --*)
C*comp7:=NModule[{},
epsdot=10A-17;eee=epsdot;Evaluate[comp3];epsdot=10A-16;eee=epsdot;Evaluate[comp3];epsdot=10A-15;eee=epsdot;Evaluate[comp3];epsdot=10A-14;eee=epsdot;Evaluate[comp3],
This is the FINAL plotting routine.
comp9:-NModule[{},
plotdot-RegularPolygon[2,0.00001];

Appendix 2: Mathematica™ code g4
$DotShapes={MakeSymbol[plotdot]};plotcombined=MultiplelistPlot[
listcombined[1/1000000000000000000],listcombined[l/100000000000000000],Ustcombined [1/10000000000000000],listcombined[l/1000000000000000],listcombined[l/100000000000000],DisplayFunction->Identity,PlotJoined->True,AxesOrigin->{0,0},Frame->True,LineStyles->{ {Thickness[0.001]} } ] ;
Evaluate[comp6];f dvfb=Shotv[pl otcomb i ned, f dcontou rs,
DisplayFunction->Identity,AxesOrigin->{0,0},PlotLabel->FontForm["Lithospheric strength vs buoyancy force";
"(contoured for driving force)",{"Helvetica-Bold",12}]];
tmohocombined=ListPlot[gxlist,DisplayFunction->Identity,PlotJoined->True,Frame->True,AxesOrigin->{l,400},PlotStyle->{ {Thickness[0.001]} } ,PlotLabel->FontForm["Moho temperature vs thinning factor",
{"Helvetica-Bold",12}]];strengthcombined=Show[graphy[10A-17],
graphy[10A-16],grophy[10/*-15],graphy[10'>-14]IDisplayFunction->Identity,Frame->True,PlotLabel->FontForm["Lithospheric strength vs thinning factor",
{"Helvetico-Bold",12}]];elevationcombined=ListPlot[gelist,
DisplayFunction->Identity,PlotJoined->True,Frame->True,PlotStyle->{ {Thickness[0.001]} } ,PlotLabel->FontForm["Surface elevation vs thinning factor",
{"Helvetica-Bold",12}]];fbuoycombined=ListPlot[gwlist,
DisplayFunction->Identity,PlotJoined->True,Frame->True,PlotStyle->{ {Thickness[0.001]} },PlptLabel->FontForm["Buoyancy force vs thinning factor",
{"Helvetica-Bold",12}]];fdcorobined=Show[graphyw[10A-17],
graphyw[10A-16],graphyw[10A-15],graphyw[10A-14],DisplayFunction->Identity,Frame->True,PlotLabel->FontForm["Driving force required for deformation vs thinning factor",
{"Helvetica-Bold",12}]];C*Evaluate[comp8];epsdotcombined=MultiplelistPlot[epslistl)epslist2,
epsHst3,epslist4,DisplayFunction->$OisplayFunction,PlotJoined->True,Frame->True,LineStyles->{ {Thickness[0.001]} },FrameLabel->{"strain rate","driving force",
" "," "},PlotLabel->Fontform["Oriving force required for deformation vs strain rate",
{"Helvetica-Bold",12}]];*)figurel=Show[GraphicsArray[{{elevationcombined},
{tmohocombined},{fbuoycombined}}],DisplayFunction->$DisplayFunction];
figure2-Show[GraphicsArroy[{{strengthcombined},{fdvfb},{fdcombined}}],OislpayFunction->$DisployFunction],
63

Appendix 2: Matkmatica™ code 85
STRENGTH ENVELOPE PLOTTING ROUTINE
strengthenv:=NModule[{},
pl=Plot[dcbrit,{z,0,zbdc},Displ.ayFunction->Identity];p2=Plot[-dcbritx,{z,0,zbdcx},DisplayFunction->Identity];p3=Plot[deduct,{z,zbdc,zc0},DisplayFunction->Identity];p4=Plot[-dcductx,{z,zbdcx,zc0},DisplayFunction->Identity];p5=Plot[dmbrit,{z,zc0,zbdm}1OisplayFunction->Identity];p6=Plot[-dmbritx,{z,zc0,zbdmx},DisplayFunction->Identity];p7=Plot[dmductd,{z,zbdm,ztrans},DisplayFunction->Identity];p8=Plot[-dmductdx,{z,zbdmx,ztransx},DisplayFunction->Identity];p9=Plot[dmduct,{z,ztrans,zl0},DisplayFunction->Identity];pl0=Plot[-dmductx,{z,ztransx,zl0},DisplayFunction->Identity];ShowCpl)p2,p3)p4(p51p6,p7,p8,p9,pl0,
Frame->True,AxesOrigin->{0,0},DisplayFunction->$DisplayFunction,PlotRange->{-l.43*10*9,1.43*10*9}],
4]

Appendix 3Ion microprobe data and geothermometry
1 Ion microprobe data
Analysis was carried out using a Jeol 733 Ion Microprobe and a KEVEX 7000
Series Analyser at CEMMSA, University of Adelaide. Results were
recalculated using RECALC, a simple computer program that calculates molar
weight and mineral proportions from raw microprobe data [Powell &
Holland, 1990].
Probe data included for samplesA1017-JPT010, 033, 078, 081, 084, 092, 096,
108,115.
A1017-JPT010 GARNET-BIOTTTE SCHIST
Freeling Heights Metasediments
Not recalculated: quartz
garnet: almandine
Si0236.54
sd 0.42
biotite
TiO20.090.05
A120321.820.27
FeO24.240.29
MnO13.240.18
Al2.060.02
Fe21.620.02
K20 Total0.08 101.13
sd 0.05 0.61
Si Ti2.92 0.01
sd 0.02 0.00
K0.01
sd 0.01
x(Si,Tl) x(Al,Ml)0.974 1.000
sd 0.007 0
x(Ca,M2) x(Fe2,M2) x(Mg,M2)0.062 0.540 0.117
sd 0.002 0.007 0.003
Mn0.900.01
MgO CaO2.95 2.170.08 0.07
Mg Co0.35 0.190.01 0.01
x(gr)x(py)
x(alm)
x0.0002190.00149
0.146
sdOO0.00002170.0001180.00491
9.97.93.4
SiO2 TiO235.43 1.87
sd 0.40 0.07
A120318.220.23
Fe2032.541.70
FeO12.971.54
MnO0.180.05
MgO12.650.18
NiO CaO0.05 0.090.05 0.05
86

Appendix 3: Mtcroprobe data and geothermometry 87
K20 H20 Total9.66 3.95 97.60
sd 0.15 0.03 0.62
sd
sd
sd
sd
Si2.69 00.02 0
K0.94 20.02
x(Si,T1)0.3450.011
x(Fe2,M2)
0.306
0.035
x(phl)x(ann)x(east)
Ti.11.00
OH.000
x(Al00
xCWg00
Al1.630.02
!655.011
,M2).532.010
Fe30.150.10
x(Si,T2)1.000
0
xCv,M2)0.1620.033
X
0.0908
0.0173
0.0616
000
Fe20.82 0.0.10 0.
x(Al,Ml)0.1600.012
xCCa.A)0.0070.004
sd(x).00446.00664.00413
Mn0100
1.0.
x(Fe2,0.0.
4.38,6.
x(K0.0.
,9,3,7
Mg4302
Ml)259033
936016
Ni0.000.00
xCMg,0.0.
00
449008
Ca.01.00
x(Fe3,Ml)0.0730.048
muscovite (late growth - ?retrograde)
sd
SiO243,0,.58.49
A12O3
33.87
0.39
Fe2O31.0..02,34
00
FeO.61.31
MnO0.040.05
CaO0.110.05
Na2O K20 H20 Total0.11 10.77 4.25 94.36
sd 0.05 0.16 0.03 0.68
sd
Na K OH0.01 0.97 2.00
sd 0.01 0.02 0
30
Si.08.02
20
Al.82.03
00
Fe3.05.02
00
Fe2.04.02
0.0.
Mn0000
00
Ca.01.00
sd
xCSi.Tl)0.5380.010
x(v,M2)0.998
sd 0.003
xCAl,T1)0.4620.010
x(Ca,A)0.0080.004
x(Si,T2) x(Al,Ml) x(Fe2,Ml) x(Fe3,Ml)1.000 0.947 0.018 0.027
0 0.005 0.009 0.009
xCNa.A)0.0150.007
xCK.A)0.9690.015
x(mu)x(pa)xCna)
x0.863
0.01320.00153
sd(x)0.0157
0.006190.000742
1.847.048.4
ilmenite
sd
sd
sd
sd
SiO20.630.06
Na200.090.05
Si0.020.00
Na0.000.00
TiO251.890.57
Total96.250.74
Ti1.010.01
A12030.240.05
Al0.010.00
FeO40.850.46
Fe20.880.01
MnO2.380.07
Mn0.050.00
MgO0.150.05
Mg0.010.00
CaO0.020.05
Ca0.000.00
A1017-JPT033 OLIVINE GRANULFTE
Mt Adams Valley Melange

Appendix 3: Microprobe data and geothermometry 88
Olivine - forsterite (symplectite reactant)
SiO2 TiO2 FeO MnO MgO38.72 0.17 17.61 0.30 42.45
sd 0.44 0.05 0.23 0.05 0.47
Total99.26
sd 0.69
Si Ti Fe2 Mn Mg0.99 0.00 0.38 0.01 1.62
sd 0.01 0.00 0.01 0.00 0.01
x(Si,Tl) xCFe2,Ml) x(Mg,Ml)0.993 0.189 0.811
sd 0.007 0.003 0.003
xCFe2,M2) xCMg,M2)0.189 0.812
sd 0.003 0.013
x sd(x) %x(fo) 0.658 0.0116 1.8x(fa) 0.0357 0.000976 2.7
feldspar: anorthite (symplectite reactant)
SiO2 TiO2 Cr2O3 A1203 Fe2O3 MgO CaO48.20 0.05 0.23 30.90 0.16 0.01 14.38
sd 0.53 0.05 0.05 0.36 0.06 0.05 0.19
Na2O Total3.21 97.13
sd 0.08 0.68
Si Ti Cr Al Fe3 Mg Ca2.27 0.00 0.01 1.71 0.01 0.00 0.72
sd 0.01 0.00 0.00 0.02 0.00 0.00 0.01
Na0.29
sd 0.01
x(Si,Tl) x(Al,Tl)0.567 0.428
sd 0.004 0.004
x(Ca,A) x(Na,A)0.725 0.292
sd 0.010 0.008
x sd(x) %x(an) 0.713 0.00592 0.8x(ab) 0.287 0.00592 2.1
amphibole: kaersutiteSiO2 TiO2 O203 A12O3 Fe2O3 FeO MnO MgO CaO39.04 4.20 0.22 14.59 1.35 6.89 0.03 13.28 11.91
sd 0.44 0.09 0.05 0.20 0.90 0.82 0.05 0.18 0.17
Na20 K2O H20 Total2.05 1.95 2.00 97.52
sd 0.07 0.07 0.01 0.60
Si Ti Cr Al Fe3 Fe2 Mn Mg Ca5.85 0.47 0.03 2.58 0.15 0.86 0.00 2.% 1.91
sd 0.04 0.01 0.01 0.03 0.10 0.10 0.01 0.04 0.03
Na K OH0.60 0.37 2.00
sd 0.02 0.01 0
xCSi.Tl) xCAt.Tl) x(Si,T2) x(Al,Ml) x(Fe2,Ml) x(Mg,Ml)0.462 0.538 1.000 0.212 0.093 0.320
sd 0.010 0.010 0 0.018 0.021 0.038
x<Ca,M2) x(No,M2) x(Fe2,M3) x(Mg,M3) x(No,A) x(v,A)0.956 0.044 0.226 0.774 0.508 0.120
sd 0.014 0.014 0.021 0.021 0.035 0.039

Appendix 3: Microprobe data and geothermometry 89
x(tr)x(ftr) 0x(hb)
x(porg)x(ed)x(gl) 0x(fgl) 5
x0.000239
.0000005000.006970.05780.0111
,000000223.501108e-9
sd(x)0.0000850
0.0000003880.002470.006510.00230
0.0000002305.800346e-9
spinel (symplectite product)
Cr203 A12030.03 64.17
sd 0.05 0.69
K20 Total0.05 99.10
sd 0.05 0.74
sd
Cr0.000.00
Al1.960.01
Fe2031.880.50
Fe30.040.01
FeO16.050.43
Fe20.350.01
MnO0.080.05
35.677.635.11.20.
103.3105.4
Mn0.000.00
MgO CaO16.74 0.110.22 0.05
Mg0.650.01
Ca0.000.00
0.00sd 0.00
clinopyroxene: diopside (symplectite product)
sd
sd
sd
sd
sd
sd
SiO2 TiO247.81 1.070.53 0.06
Na20 Total1.27 98.000.06 0.65
Si Ti1.79 0.030.01 0.00
Ha0.090.00
x(S i ,T l ) x(Al0.894 00.005 0
xCCa,M2) x(Na0.890 00.011 0
xCdi)x(cats)
O2030.530.06
Cr0.020.00
,TD.106.005
,M2).092.005
A12036.600.12
Al0.290.01
x(Al,M1)0.0790.009
x(Mg,M2)0.0080.008
X
0.6720.0707
Fe2034.820.10
Fe30.140.00
x(Mg,0.0.
sd(x)0.0144
0.00713
MgO13.690.19
Mg0.760.01
Ml)755008
2: 10
CaO22.21
0.27
Ca0.890.01
.2
.1
A1017-JPT078 CALC-SILICATE
Four Mile Creek Gneisses (contact metamorphosed version of A1017-JPT081)
Not recalculated: ilmenite
clinopyroxene: diopside
sd
sd
sd
SiO250.010.55
K200.140.05
Si1.920.01
K0.01
TiO20.330.05
Total95.100.65
Ti0.010.00
Cr2O30.320.05
Cr0.010.00
A12034.220.09
Al0.190.00
FeO9.900.15
Fe20.320.01
MnO0.650.06
Mn0.020.00
MgO17.210.22
Mg0.990.01
CaO12.330.17
Ca0.510.01

Appendix 3: Microprobe data and geothermometry 90
sd 0.00
sd
sd
x(Si,Tl)0.9610.005
x(Al,Tl) x(Al,Ml) x(Fe2,Ml)0.039 0.113 0.2140.005 0.009 0.003
x(Mg,Ml)0.6630.008
x(Ca,M2) x(Fe2,M2) x(Mg,M2)0.508 0.104 0.3220.008 0.002 0.007
x(hed)x(cats)
x0.3370.1090.0574
sd(x)0.007550.002790.00401
2.22.67.0
feldspar: anorthite
sd
sd
sd
sd
sd
sd
Si02 Ti0242.43 0.230.47 0.05
Na20 Total0.45 98.430.05 0.68
Si Ti2.00 0.010.01 0.00
Na0.040.00
Cr2O30.150.05
x(Si,Tl) x(Al,0.501 0.0.004 0.
x(Ca,A) x(Na1.000 0.
0 0.
x(an)xfab)
Cr0.010.00
TI)487005
,A)041005
A120335.020.40
Al1.950.02
X
0.9600.0396
Fe2030.150.06
Fe30.010.00
sd(x)0.004610.00460
MgO0.150.0S
Mg0.010.00
011
CaO19.840.25
Ca1.000.01
%.5.6
A1017-JPT081 CALC-SrLICATE
Four Mile Creek Gneisses
Not recalculated: ilmenite
amphibole: cummingtonite
sd
sd
sd
sd
sd
sd
SiO2 TiO253.85 0.050.59 0.05
K20 H200.01 2.080.05 0.02
Si Ti7.75 0.010.05 0.01
K OH0.00 2.000.01 0
Cr2O30.090.05
Total98.840.74
Cr0.010.01
x(Si,Tl) x(Al,Tl)0.938 0.0410.013 0.003
x(Ca,M2) x(Fe2,M2)0.053 0.2460.004 0.027
x(tr)x(ftr)
A12O3 (0.960.06
Al0.160.01
xCSi,T2)1.000
0
x(Mg,M2)0.6420.027
:e2O32.921.94
Fe30.320.21
x(Fe200
x(Fe200
FeO14.871.76
Fe21.790.22
,M1) ;.233.049
,M3).277.024
MnO1.580.07
Mn0.190.01
x(Mg,Ml)0.6070.056
x(Mg,M3)0.7230.024
x sd(x) 3S0.000300 0.0000644 21.5
0.00000249 0.00000185 74.4
MgO21.750.27
40,
Mg.67.06
x(v0.0.
CaO0.690.06
Ca0.110.01
.A)998009

Appendix 3: Microprobe data and geothermometry 91
x(cumm)x(grun)
0.04420.0000540
feldspar: anorthite
0.005090.0000498
11.592.3
SiO2 TiO242.43 0.23
sd 0.47 0.05
NQ20 Total0.45 98.43
sd 0.05 0.68
O2030.150.05
A120335.020.40
Fe2O30.150.06
MgO CaO0.15 19.840.05 0.25
sd
Si2.000.01
Ti0.010.00
Cr0.010.00
Al1.950.02
Fe30.010.00
Mg Ca0.01 1.000.00 0.01
Na0.04
sd 0.00
sd
sd
x(Si,Tl)0.5010.004
x(Al,T1)0.4870.005
x(Ca,A) xCNa.A)1.000 0.041
0 0.005
x(an)x(ab)
x0.960
0.0396
sd(x)0.004610.00460
0.511.6
A1017-JPT084 CALC-SILICATE
Mt Adams Valley Melange
Not recalculated: sphene, retrograde chlorite and scapolite
feldspar: oligoclase
sd
SiO251.440.56
Cr2030.140.05
A120323.080.28
Fe2030.100.06
MgO0.090.05
CaO10.100.15
Na20 K20 Total7.49 0.58 93.03
sd 0.12 0.06 0.66
sd
Si2.530.01
Cr0.010.00
Al1.340.02
Fe30.000.00
Mg Ca0.01 0.530.00 0.01
sd
sd
Na0.710.01
K0.040.00
xCSi.Tl)0.6330.003
x(Ca,A)0.533
sd 0.008
xCAl.Tl)0.3350.004
xCNa.A)0.7150.013
x(an)xCab)x(or)
x(K,A)0.0360.004
x0.4150.5570.0284
sdCx)0.00S410.005580.00267
1.31.09.4
feldspar: albite
SiO2 TiO2 Cr203 A1203 Fe2O3 MnO MgO CaO60.75 0.10 0.09 22.24 0.30 0.10 0.02 4.01
sd 0.66 0.05 0.05 0.27 0.06 0.05 0.05 0.09
Na2O K20 Total8.83 0.20 96.63
sd 0.14 0.05 0.74

Appendix 3: Microprobe data and geothermometry 92
sd
Si Ti2.78 0.000.01 0.00
Cr0.000.00
Al1.200.01
Fe30.010.00
Mn0.000.00
Mg Ca0.00 0.200.00 0.00
Na K0.78 0.01
sd 0.01 0.00
sd
xCSi.Tl)0.6960.003
x(Al,T1)0.3000.004
x(Ca,A)0.197
sd 0.005
x(Na,A)0.7850.013
x(K,A)0.0120.003
x(an)x(ab)x(or)
x0.1980.790
0.0120
sdCx)0.004370.005000.00303
2.20.625.2
feldspar: orthoclase
SiO2 TiO2 Cr2O3 A1203 CaO60.79 0.29 0.01 18.01 0.27
sd 0.66 0.05 0.05 0.23 0.05
sd
Na20 K20 Total0.98 14.63 94.990.06 0.20 0.73
sd
Si2.960.01
Ti0.010.00
Cr0.000.00
Al1.030.01
Ca0.010.00
Na K0.09 0.91
sd 0.01 0.01
sd
x(Si,Tl)0.7390.003
x(Al,T1)0.2580.003
x(Ca,A)0.014
sd 0.003
x(Na,A)0.0930.006
xCK.A)0.9080.014
x(an)x(ab)xCor)
x0.01410.09130.895
sd(x)0.002680.005170.00568
19.05.70.6
garnet: andradite
sd
sd
sd
sd
sd
SiO234.320.39
Na200.210.05
Si2.920.02
Na0.030.01
xCSi,0.0.
TiO2 Cr2O30.73 0.580.06 0.06
Total98.730.65
Ti0.050.00
TI) x(Al973 0006 0
Cr0.040.00
• Ml).142.004
A12032.840.08
Al0.280.01
x(Fe3,Ml)0.8380.004
Fe2O326.200.25
Fe31.680.01
FeO1.470.33
Fe20.100.02
MnO0.510.06
Mn0.040.00
MgO0.240.05
Mg0.030.01
CaO31.630.37
Ca2.880.03
sd
x(Ca,M2) x(Fe2,M2) xCMg,M2)0.961 0.035 0.0100.010 0.008 0.002
xCgr)x
0.0166sdCx)
0.000918X
5.5

Appendix 3: Microprobe data and geotliermometry 93
x(andr) 0.573 0.0159 2.6
clinopyroxene: diopside
sd
sd
sd
sd
sd
sd
SiO2 Cr20349.28 0.360.54 0.05
Na20 Total1.72 97.970.07 0.64
Si CP
1.90 0.010.01 0.00
Na0.130.00
x(SiJl) x(Al0.950 00.007 0
x(Ca,M2) x(Na0.891 00.010 0
x(di)xChed)
A12031.570.07
Al0.070.00
.036
.001
,M2).128.005
0.0.
Fe2O38.450.%
Fe30.250.03
x(Fe2,Ml)0.1370.027
X544 (122
FeO4.240.85
Fe20.140.03
x(Mg,0.0.
sd(x)5.009070.0233
MnO0.160.05
Mn0.010.00
Ml)611009
1.19.
MgO10.630.16
Mg0.610.01
71
CaO21.570.27
Ca0.890.01
A1017-JPT092 CALC-SILICATE
Mt Adams Valley Melange
Not recalculated: sphene, wollastonite, calcite
clinopyroxene: diopside
sd
sd
sd
sd
sd
sd
SiO2 TiO2 <50.15 0,020.55 0.05
Na20 Total0.81 98.140.06 0.64
Si Ti1.94 0.000.01 0.00
Na0.060.00
x(S\,T1) x(Al0.970 00.007 0
x(Ca,M2) x(Na0.973 00.011 0
xCdi)x(hed)x(cats)
Cr2030.320.05
CP
0.010.00
,TD.030.007
,M2).060.004
A12031.560.07
Al0.070.00
xCAl.Ml)0.0120.013
X
0.5530.2440.0114
Fe2O3 FeO3.34 7.740.96 0.85
Fe3 Fe20.10 0.250.03 0.03
MnO0.880.06
Mn0.030.00
x(Fe2,Ml) x(Mg,Ml)0.251 0.5680.027 0.008
sdCx)0.00931 1,0.0246 10.0.0128 112.
%,7,1,4
MgO9.860.15
Mg0.570.01
CaO23.460.28
Ca0.970.01
garnet: grossular-andradite
SiO2 TiO236.40 1.63
sd 0.41 0.07
Total99.18
sd 0.64
CP203
0.310.05
A120312.480.17
Fe2O313.320.19
MnO0.490.05
MgO CaO0.21 34.340.05 0.39

Appendix 3: Microprobe data and geothermometry 94
sd
sd
Si2.91 00.02 0
x(Si,T1)0.9690.007
Ti.10.00
x(Al00
Cr0.020.00
,M1).587.008
Al1.170.02
x(Fe3,Ml)0.4000.006
00
Fe3.80.01
00
Mn.03.00
00
Mg.02.01
2.0.
Co9403
x(Ca,M2) x(Mg,M2)0.980 0.008
sd 0.010 0.002
x(gr)x(andr)
x0.2950.137
sd(x)0.007050.00404
2.42.9
feldspar: oligoclase
sd
sd
SiO2 Cr2O3 A1203 CaO53.16 0.04 22.42 8.250.58 0.05 0.27 0.13
Na2O K20 Total7.97 1.02 92.85
sd 0.13 0.06 0.67
Si2.610.01
Cr0.000.00
Al1.300.02
Ca0.430.01
sd
sd
sd
Na0.760.01
K0.060.00
xCSi.Tl)0.6510.003
xCCa.A)0.4330.007
x(an)x(ab)x(or)
0.3240.004
x(Na,A)0.7580.013
x(K,A)0.0640.004
x0.3450.6040.0507
sd(x)0.005070.005440.00290
1.50.95.7
feldspar: orthoclase
SiO2 TiO2 A1203 CaO61.30 0.53 17.79 0.24
sd 0.66 0.06 0.23 0.05
Na20 K20 Total1.15 14.38 95.39
sd 0.06 0.19 0.73
sd
sd
sd
sd
Si2.% 00.01 0
Na0.11 00.01 0
x(Si,Tl)0.7410.003
x(Ca,A)0.0120.003
x(on)xCab)x(or)
Ti.02.00
K.89.01
x(Al,0.0.
x(Na0.0.
Al Ca1.01 0.010.01 0.00
Tl)254003
,A) x(K,A)108 0.887006 0.014
X
0.0123 00.107 00.881 0
sd(x).00266.00527.00574
%21.74.90.7
A1017-JPT096 EPIDOTE QUARTZrrE

Appendix 3: Microprobe data and geothermometry 95
Four Mile Creek Gneisses
Not recalculated: quartz
epidote
sd
sd
sd
sd
sd
sd
SiO2 TiO236.26 0.040.41 0.05
No20 \0.24 1,0.05 0.
Si2.96 0,0.02 0.
Na0.04 1,0.01
x(Si.Tl)0.9860.007
x(Ca,M2)1.000
0
x(cz)xCep)
QO,84.01
Ti.00.00
OH.000
Cr2O3 A12O30.10 21.320.05 0.26
Total98.660.62
Cr Al0.01 2.050.00 0.02
x(Al,Ml) x(Fe3,Ml)0.035 0.9650.013 0.013
X
0.03470.965
Fe20315.720.21
Fe30.970.01
sd(x)0.01330.0132
MnO0.090.05
Mn0.010.00
38.1.
MgO0.160.05
Mg0.020.01
34
CaO22.900.28
Ca2.000.02
feldspar: anorthite
sd
sd
sd
sd
sd
sd
SiO242.550.48
Na2O0.190.05
Si2.010.01
Na0.020.00
x(Si,0.0.
x(Ca1.
TiO20.030.05
K200.140.05
Ti0.000.00
K0.010.00
Cr2O30.210.05
Total98.530.68
Cr0.010.00
Tl) x(Al,T1)502 0.485004 0.005
,A) x(Na,A)000 0.0170 0.005
x(an)x(ab)
A12O334.880.40
Al1.940.02
x(K,A)0.0080.003
X
0.9750.0167
Fe2O30.480.06
Fe30.020.00
sd(x)0.005380.00455
MgO0.180.05
Mg0.010.00
0.27.
CaO19.880.25
Ca1.010.01
%62
A1017-JPT108 2-PYROXENE GRANULITE
Mt Adams Valley Melange
orthopyroxene: enstatite
SiO2 TiO2 Cr2O3 A12O3 Fe203 FeO MnO MgO CaO49.65 0.23 0.17 1.17 3.90 21.61 0.61 20.47 0.43
sd 0.55 0.05 0.05 0.06 0.97 0.82 0.06 0.25 0.0S
sd
K20 Total0.10 98.350.05 0.67
Si Ti Cr Al Fe3 Fe2 Mn Mg Ca

Ajrpendix 3: Microprobe data and geothermometry 96
sd
sd
sd
sd
1.910.01
K0.000.00
x(Si.Tl)0.9550.007
0.010.00
0.010.00
0.050.00
0.110.03
0.700.03
0.020.00
1.170.01
0.020.00
x(Al,Tl) xCFe2,Ml) x(Mg.Ml)0.027 0.327 0.5530.001 0.019 0.010
x(Ca,M2) x(Fe2,M2) x(Mg,M2)0.018 0.368 0.6210.002 0.007 0.019
x(en)xffs)
00
X.343.120
00
sdCx).00665.00907
1.7.
%95
clinopyroxene: diopside
sd
sd
sd
sd
sd
sd
SiO2 TiO2 (49.56 0.170.55 0.05
>2030.580.06
Na20 K20 Total0.22 0.06 98.390.05 0.05 0.64
Si Ti1.90 0.000.01 0.00
Na K0.02 0.000.00 0.00
xCSi.Tl) x(Al,0.950 0,0.007 0.
x(Ca,M2) x(Na0.897 0,0.010 0,
Cr0.020.00
JO.048.002
,M2).017.004
A12O32.140.07
Al0.100.00
x(Fe2,Ml)0.2370.027
x(Fe2,M2)0.0150.002
Fe2033.260.97
Fe30.090.03
x(Mg00
xCMg00
FeO7.860.85
Fe20.250.03
,M1).664.005
,M2).042.008
MnO0.380.05
Mn0.010.00
MgO12.350.17
Mg0.710.01
CaO21.820.27
Ca0.900.01
x(hed)
x0.5950.213
sd(x)0.007220.0232
1.210.9
ilmenite
sd
sd
sd
sd
SiO20.010.05
Na200.150.05
Si0.000.00
Na0.010.00
TiO248.790.54
K200.030.05
Ti0.930.01
K0.000.00
Cr2030.030.05
Total99.780.78
Cr0.000.00
A12030.050.05
Al0.000.00
Fe2037.020.82
Fe30.130.02
FeO42.280.50
Fe20.900.01
MnO1.080.06
Mn0.020.00
MgO0.250.05
Mg0.010.00
CaO0.060.05
Co0.000.00
feldspar: oligodase
SiO251.49
sd 0.56
Na204.45
sd 0.09
Si2.41
TiO20.010.05
K200.090.0S
Ti0.00
Cr2030.110.05
Total96.920.69
Cr0.00
A12O328.440.33
Al1.57
Fe2030.32O.06
Fe30.01
MnO0.180.05
Mn0.01
CaO11.830.17
Ca0.59

Appendix 3: Microprobe data and geotliermometry 97
sd 0.01 0.00 0.00 0.02 0.00 0.00 0.01
sd
sd
No K0.40 0.010.01 0.00
x(Si,Tl) x(Al,Tl)0.602 0.392
sd 0.003 0.004
xCCo.A) x(Na,A)0.593 0.4040.009 0.009
x(K,A)0.0050.003
x(an)x
0.5920.403
sd(x) %0.00639 1.10.00625 1.6
feldspar: orthoclase
sd
SiO261.31
0.66
TiO20.240.05
Cr2030.110.05
A120319.0,
,99.25
CaO0.500.05
sd
sd
Na20 K20 Total0.69 14.77 97.600.06 0.20 0.74
Si Ti2.90 0.010.01 0.00
Cr0.000.00
Al1.120.01
Ca0.030.00
Ha K0.06 0.89
sd 0.01 0.01
sd
x(Si.Tl)0.7250.003
x(Al,T1)0.2750.003
x(Ca,A) x(Na,A) x(K,A)0.025 0.063 0.891
sd 0.003 0.005 0.013
x(an)x(ob)xfor)
x0.02570.06480.910
sd(x)0.002790.005050.00561
10.97.80.6
amphibole: hornblende (retrograde)
sd
Si 0235.920.41
TiO21.020.06
O2030.130.05
A120312.500.18
Fe2033.592.39
FeO18.302.17
MnO0.060.05
MgO6.790.12
CaO11.220.16
Na20 K20 H20 Total1.09 2.93 1.83 95.37
sd 0.06 0.08 0.02 0.64
Si5.90
sd 0.05
sd
sd
sd
Ti0.130.01
Cr0.020.01
Na0.350.02
x(SiJl)0.4740.014
K OH0.61 2.000.02 0
x(Al,T1)0.5260.014
x(Ca,M2) x(Fe2,M2)0.986 0.0180.016 0.028
Al2.420.04
Fe30.440.29
Fe22.510.31
Mn0.010.01
x(Si,T2) x(Al,Ml) x(Fe2,Ml)1.000 0.158 0.335
0 0.031 0.088
x(Mg,M2) x(Fe2,M3) x(Mg,M3)0.012 0.602 0.3980.017 0.029 0.029
x sd(x) %x(tr) 0.0000588 0.0000113 19.2x(ftr) 0.000467 0.000350 75.1x(hb) 0.00176 0.000341 19.4
x(cumm) 8.436436e-9 0.0000000254 300.6
Mg Ca1.66 1.970.03 0.03
xCMg.Ml)0.2220.032
x(v,A)0.3870.017

Appendix 3: Microprobe data and geotliermometry 98
x(grun) 0.000000153 0.000000582 379.2
A1017-JPT115 ORTHOAMPHIBOLE-CORDIERITE ROCK
Four Mile Creek Gneisses
amphibole: anthophyllite
sd
sd
sd
sd
sd
sd
Si02 TiO252.47 0.050.57 0.05
H20 Total2.04 97.020.02 0.74
Si7.73 0.0.05 0,
OH2.00
0
xCSi.Tl)0.9320.014
x(Ca,M2) )0.0160.004
x(tr)x(ftr)x(hb)
xCcumrn)x(grun)
cordierite
sd
sd
sd
sd
Ti.01.01
O2030.100.05
Cr0.010.01
x(Al,T1)0.0680.014
((Fe2,M2)0.2870.036
0.0.
Si02 TiO248.04 0.010.53 0.05
Total96.170.66
Si4.98 00.04 0
x(Fe2,Ml)0.1990.026
x(crd)x(fcrd)
Ti.00.00
A12031.660.07
Al0.290.01
x(Si,T2)1.000
0
x(Mg,M2)0.6130.013
Fe203 FeO3.26 16.602.17 1.96
Fe3 Fe20.36 2.050.24 0.25
MnO0.720.06
Mn0.090.01
x(Al ,Ml) x(Fe2,Ml)0.009 0.2580.027 0.052
x(Fe2,M3) x(Mg,M3)0.319 0.6810.026 0.026
x sd(x)0.0000191 0.00000991 51..000000429 0.000000371 86.,000000869 0.00000246 282.
0.0272 0.00351 12.0.000134 0.000125 93.
O2030.160.05
Cr0.010.00
xCMg.Ml)0.7790.011
A12O332.900.38
Al4.020.04
X
0.6070.0395
Fe203 FeO0.17 4.590.69 0.60
Fe3 Fe20.01 0.400.05 0.05
sdCx)0.0175 20.0103 26
%.8,46,9,7
MnO0.030.05
Mn0.000.00
%.9.1
MgO19.910.25
Mg4.370.06
xCMg,0.0.
x(v1.
MgO10.100.15
Mg1.560.02
CaO0.210.05
Ca0.030.01
Ml)550048
•,A)
0000
CaO0.170.05
Ca0.020.01
feldspar: anorthite
sd
sd
sd
sd
SiO244.970.50
Na202.010.07
Si2.120.01
Ha0.180.01
Cr2030.390.05
Total97.930.68
Cr0.010.00
A120333.180.38
Al1.840.02
Fe2O30.120.06
Fe30.000.00
MgO0.18
0.05
Mg0.010.00
CaO17.080.22
Ca0.860.01

Appendix 3: Microprobe data and geothermometry 99
x(Si,Tl) x(Al,Tl)0.530 0.461
sd 0.004 0.004
x(Ca,A) x(Na,A)0.863 0.183
sd 0.012 0.006
x0.8250.175
sdCx)0.005380.00538
0.73.1
ilmenite
sd
SiO2 TiO2 Cr203 A1203 Fe203 FeO MnO MgO0.14 47.38 0.15 0.26 8.44 41.08 0.54 0.650.05 0.52 0.05 0.05 0.81 0.49 0.06 0.06
sd
sd
Totol980
00
.62
.77
Si.00.00
00
Ti.91.01
00
Cr.00.00
00
Al.01.00
00
Fe3.16.02
00
Fe2.88.01
00
Mn.01.00
00
Mg.02.00
2 Geothermometry
The garnet-biotite geothermometer of Powell & Holland [1990] is expressed
as follows:
44.970.01456 +3R In KD
where T is the maximum metamorphic temperature, R is the gas constant (in
^K"1) and KD is the distribution coefficient and is given by:
y garnet ybiotite
ygarnet^Mg '•Mg
Values for XMg (the molar proportion of magnesium) are obtained from the
above RECALC results.
The clinopyroxene-orthopyroxene geothermometer of Wells[1977] is
expressed as follows:
7341
3.355 + 2.44 X^f- In KD
where T is the closure temperature and KD is the distribution coefficient
which is given by:
ncpx
VD " aopx
aopx

Appendix 3: Microprobe data and geothermometry . 100
Here the approximation aMgiSiiOt = XMgtSkOi was used. Values for XMg and XFe
were taken from the above RECALC data.

Appendix 4Sample data
Key: TS=Thin section cut [s=by SADME, «=by department], P=Probed.
Sample No.A1017-JPT001A1017-JPT002
A1017-JPT0O4A1017-JPT008
A1017-JPT010A1017-JPT012A1017-JPT013A1017-JPT018A1017-JPT024
A1017-JPT026A1017-JPT027
A1017-JPT028
A1017-JPT029a
A1017-JPT029d
A1017-JPT033
A1017-JPT034
A1017-JPT035
A1017-JPT038
A1017-JPT040
A1017-JPT042A1017-JPT043
A1017-JPT044
A1017-JPT045A1017-IPT047A1017-JPT048
A1017-JPT049A1017-JPT051A1017-JPT054
AIOI7-JPTO56
TSs•
i
1
1
s
•s
s
s
•
s
s
s
s
•
ss
ss
s•s
•ss
•
p--
--
•----
--
-
•
•
•
-
-
•
--•
--
-
UnitYagdlin Phyllite
MyloniteFour Mile Creek Gneiss
Freeling Heights MetasedimentsFour Mile Creek Gneiss
Mount Adams Quartzite"Freeling Heights Quartzite
Four Mile Creek Gneiss
Mt Adams Valley Melange
Mt Neill Granite Porphyry?Yagdlin Phyllite
?"
Mt Neill Granite PorphyryFreeling Heights Metasediments
Four Mile Creek Gneiss
DescriptionSapphire-tourmaline schistFoliated phyllite with retrograde cordieriteporphyroblastsMylonitised Mt Neill Granite PorphyrySillimanite gneiss with large coin-shaped podsof fibrous sillimaniteGarnet-biotite-?cordierite schistClinopyroxene-bearing calc silicateSillimanite gneissKink folded feldspathic, micaceous quartziteFine grained, micaceous quartzite with heavymineral laminationsSillimanite gneissSillimanite gneiss with fibrous sillimanite andKfeldspar growing from quartz and muscoviteBiotite schist with abundant zircons withpleochroic halos.Biotite-sillimanite-muscovite-Kfeldspar-quartzschistSillimanite-tourmaline schist with large greentourmaline porphyroblasts and abundantfibrous sillimaniteOlivine gabbro with spectacular symplectites ofspinel and clinopyroxene forming from olivineand plagioclase. Rock also contains kaersutiteUnusual weathered ?igneous rock containinggreen weathering minerals and abundantmagnetiteWeathered calc-silicate found adjacent toprevious. Allotriomorphic texture.Bizarre metasomatised dolomite with sphericalscapolite crystals and prismatic tourmaline("Dalmatian skarn")Mt Adams Valley Melange. Chaotic mass ofgrits and clays supporting numerous exoticclastsSheared graniteCoarse grained, green, sapphire-chlorite-phlogopite schistAs above, with strange concentric reaction rimsin large relict porphyroblasts (now spinel +chlorite)Sheared graniteMassive, dirty quartziteBiotite schist with large relict hexagonalporphyroblasts (now quartz groundmass) andabundant ilmeniteBiotite schist with relict ?garnetSillimanite gneissAllanite bearing granite gneiss with symplectitireaction textures between feldspars andabundant opaquesRed leucocratic quartz undersaturated granitegneiss with abundant primary sulfides
101

Appendix 4: Sample data 102
A1017-JPT057
Al0l7-JPTO6O
Al0l7-JfTb61A1017-JPT066
A1017-JPT068
A1017-JPT070
A1017-JPT071A1017-JPT072A1017-JPT074
A1017-JPT075
A1017-JPT078
A1017-JPT079A1017-JPT081
A1017-JPT083A1017-JPT084
A1017-JPT085A1017-JPTO&A1017-TPT087A1017-JPT089
A1017-JPT090A1017-JPT092
A1017-JPT096A1017-TPT097A1017-JPT100Al()l7-JPT101A1017-JPT102A1017-JPT104
A1017-JPT105A1017-JPT107A1017-JPT108A1017-jPtll0A1017-TPT112A1017-JPT114A1017-JPT115A1017-IPT116Alfo7-JFfll7A1017-JPT118
A1017-IHV78
s
•
••
s
• •
s•s
s
•
ss
-s
s• •-s •
•
s
I
4
i
i
i
1
• •
•
•
•
-
•
•
*
-
•
•
•
-
•
-
•
•
•
-
•
•
•
•
-
-
-
-
•
•
•
•
-
•
•
• •
-
•
•
•
Freeling Heights Metasediments
Four Mile Creek Gneiss
Freeling Heights Metasediments
Mylonites
Four Mile Creek GneissMt Adams Quartzite
Four Mile Creek Gneiss
Mt Adams Valley Melange
Four Mile Creek Gneiss
Yagdlin PhylliteMt keill Granite?Yagdlin Phyllite
Mt Adams Valley Melange
Four Mile Creek GneissMt Adams Valley MelangeFour Mile Creek Gneiss
Yagdlin Phyllite
Epidote-scapolite-plagiodase quartzite (highlyrecrystallised)Highly radioactive amphibolite with isoclinallyfoldea feldspar vein.Paragneiss (quartzitic)Highly strained paragneiss with sillimanite,quartz, orange Kfeldspar, micas and magnetiteCoarse grained biotite schist with large (2cm)relict porphyroblasts (now quartz groundmass)Mylonitised paragneiss with strong foliationand lineation defined by sillimanite and micaMylonitised leucogneiss?Biotite schist with folded quartz veinsBiotite-phlogopite schist with relictporphyroblastsVery hard, foliated mafic gneiss with abundantperthitic feldspar and opaques - somehornblende (quite radioactive)Unusual coarse grained, contactmetamorphosedcalc-silicate with abundantilmenite and diopside (not foliated)
Lower grade version of previous with prismaticcummingtonite defining the foliationCrenulated biotite schistPink-brown calc-silicate with garnet anddiopside (highly recrystallised, very coarsegrained)" (with sphene)
TroctoliteCrenulated, hard pelite with biotite reacting tocorundumBiotite bearing calc-silicateWollastonite bearing calc-silicate with garnet,diopside, sphene, 2 feldspars and ilmenite-highly recrystallisedEpidote-scapolite-quartz-plagioclaserockSillimanite gneiss-Highly sheared ?granite-Contact metamorphosed phyllite withabundant sillimanite prisms (randomlyoriented)Phyllite with 2 phases of porphyroblastesisPhyllite with large sillimanite prismsTwo pyroxene granuliteMylonitised granite with blue quartzBiotite-cordierite-(garnet) schistTwo pyroxene granuliteCordierite-orthoamphibole rockMylonitised paragneissCordierite-biotite schistPhyllite with large sillimanite prisms reactingto sapphireGarnetiferous phyllite

Appendix 5Map and block diagram
See pocket inside back cover.
103
J

PARALANA HOT SPRINGS -MOUNT ADAMS VALLEY AREA
Sample Locations
A / \
* ^ ^ x -..

/
' 1/
/
\\11
/
//
- - "
h.
I1!j
/
Ii
N O

PARALANA HOT SPRINGS -MOUNT ADAMS VALLEY AREA
Structures


LEGEND ; - - . i " . r - " ;•
PARALANA HOT SPRINGS - MOUNT ADAMS VALLEY AREAQuaternary Undifferentiated flat lying alluvial and playa
sediments. Creeks
Tertiary Green kaolinised sands and grits,conglomeratic in part. Possibly formsmatrix of Mt Adams Valley melange.
Lithologicalboundaries
Mesozoic Pale brown-white weathered fossiliferoussandstones, silicrfied in part.
InferredLithologicalBoundaries
Carbonate Massive white calcite, found as rafts in MtAdams Valley. Faults
Calc-silicates Hard, high grade calc-silicates withcomplex mineralogies. Inferred Faults
British Empire Massive quartzofeldspathic, micaceousPegmatite pegmatites. \ - . Roads
UJQ.
British Empire Medium to coarse grained, heterogeneous,Granite undeformed, leucocratic granite. Breccia
Mylonite Highly strained L-S tectonite of para- andorthogneissic origin. F2 fold axes
Adelaidean Flat lying Adelaidean sediments,interpreted to underlie Mesozoic sedimentsto the east of the Paralana Fault System.
Bedding
Troctolite Coarse grained, olivine gabbro found asrafts in the Mt Adams Valley Melange.
44
Schistosity(when not parallelto bedding)
Granulite High grade mafic, pyroxene-bearinggranulites, found as rafts in the Mt AdamsValley Melange. 75
Kink bandfoliation
Corundum Sapphire bearing phlogopite - chlorite ±Schists tourmaline schists adjacent to Mt Neill
Granite.12
Lineation
Amphibolites Undifferentiated amphibolites.58 Sample location
Mt NeillGranite
Heterogeneous, quartz undersaturatedporphyritic granite - granite syenite,sub-volcanic in part.
Tectonicmelange
Freeling Heights Sequence of massive, crossbedded,Metasediments micaceous quartzites and mica schists. Anticline (with
plunge)
Mt Adams Massive, crossbedded, feldspathicQuartzite quartzite with pelitic interbeds.
18Syncline (withplunge)
Yagdlin Phyllite Finely laminated brown-green phyllites.Fault vergence
Orthogneisses Sequence of highly deformed, I- and A-typegranite gneisses. 351000 AMG easting
Paragneisses Highly deformed, quartzofeldspathicmigmatites and sillimanite gneisses withpelitic intebeds.
6659000 AMG northing

BLOCK DIAGRAMParalana Hot Springs - Mt Adams Valley area
Scale (km)0 1 2 3 4 5
©JTeasdale, 1993

PARALANA HOT SPRINGS -MOUNT ADAMS VALLEY AREA