Embed Size (px)
Citation preview

Proteomics and Mass Spectrometry
Ron Bose, MD PhDBiochemistry and Molecular Cell Biology Programs
Washington University School of Medicine
Molecular Cell Biology Lecture. Oct. 17, 2013

Introduction
Definition of Proteomics:The large scale identification and characterization of proteins in a cell, tissue, or organism.
http://www.chem.purdue.edu/people/faculty/Images/Tao%20proteomics-cartoon.jpg
TraditionalBiochemistry
Proteomics

Introduction
Well Established Methods for Proteomics
1. 2D-gels
2. Mass Spectrometry
Methods still under development
1. Protein Arrays
2. Antibody Arrays
3. Proteome-wide coverage with Antibodies
Definition of Proteomics:The large scale identification and characterization of proteins in a cell, tissue, or organism.
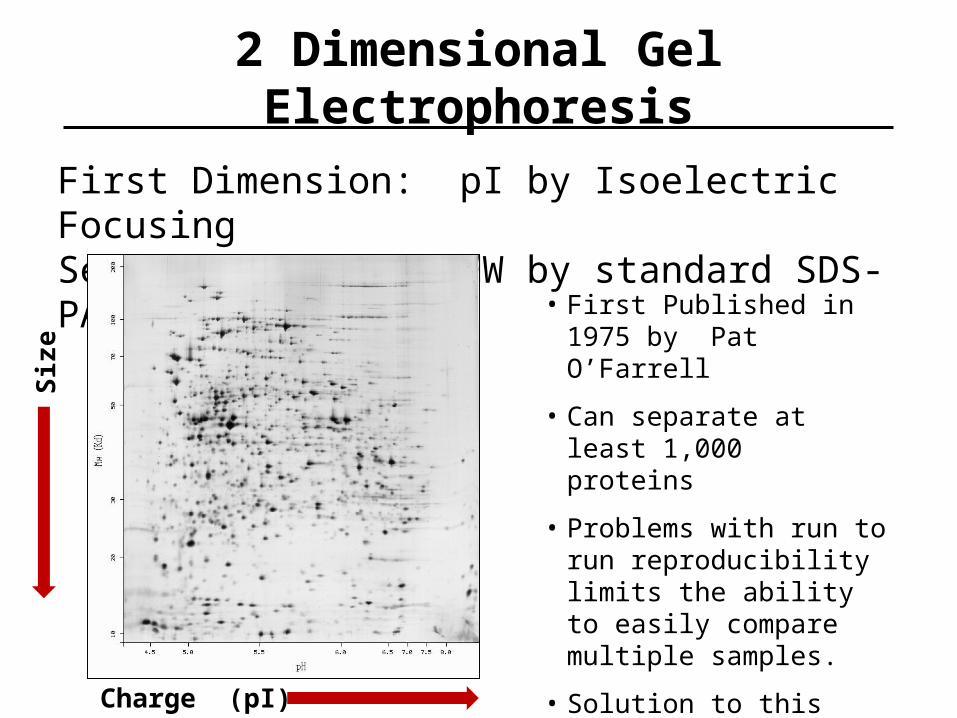
2 Dimensional Gel Electrophoresis
First Dimension: pI by Isoelectric FocusingSecond Dimension: MW by standard SDS-PAGE
• First Published in 1975 by Pat O’Farrell
• Can separate at least 1,000 proteins
• Problems with run to run reproducibility limits the ability to easily compare multiple samples.
• Solution to this problem: DIGE (Difference Imaging Gel Electrophoresis)
Siz
e
Charge (pI)
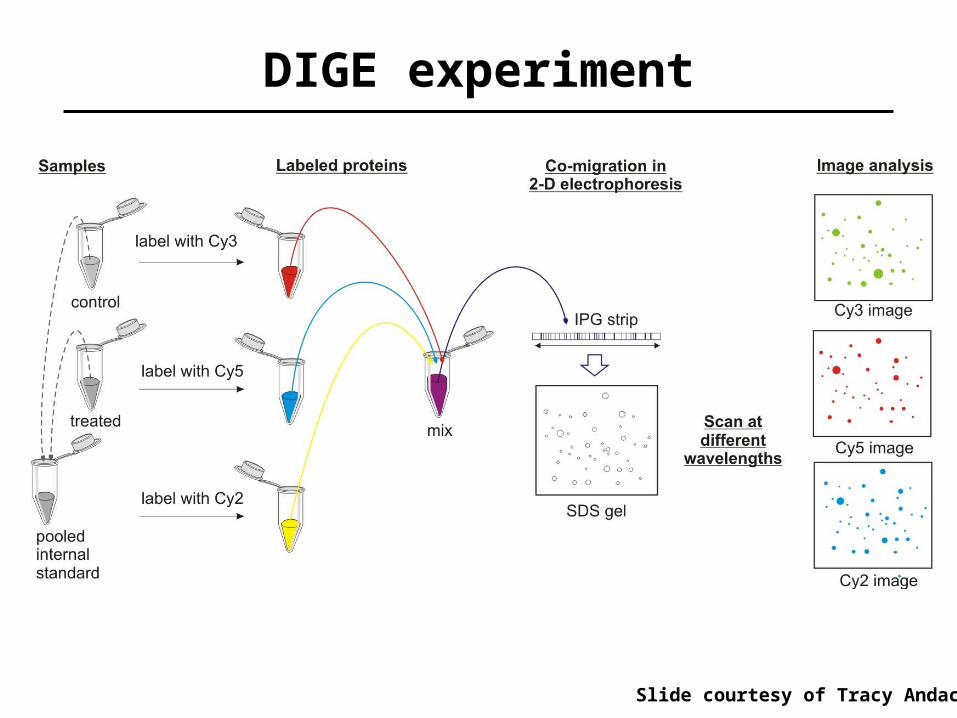
DIGE experiment
Slide courtesy of Tracy Andacht
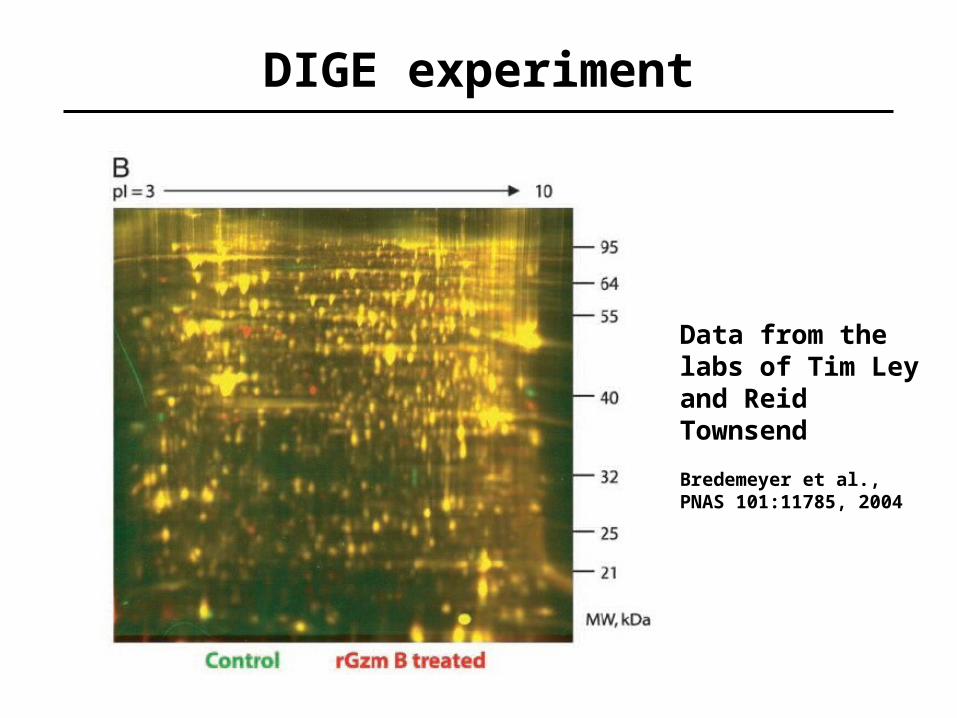
DIGE experiment
Data from the labs of Tim Ley and Reid Townsend
Bredemeyer et al., PNAS 101:11785, 2004

1. Protein solubility during Isoelectric Focusing.• Membrane proteins often lost.
2. Size Limits – difficulty with proteins >100 kD.
3. Identification of the proteins in each spot is tedious and slow.
• Use of robotics
4. Individual spots typically contain several proteins.
• Intensity change is therefore the sum of the changes of each individual protein.
Limitations of DIGE

The Importance of Mass:
1. The mass of a molecule is a fundamental physical property of a molecule.
2. Mass can be used to identify the molecule.
Fragmentation provides Chemical Structure:
If you fragment a molecule in a predictable manner and make measurements on the individual fragments, you can determine the chemical structure of the molecule.
Principles of Mass Spectrometry
1. Peptides and Proteins
2. Lipids
3. Oligosaccharides
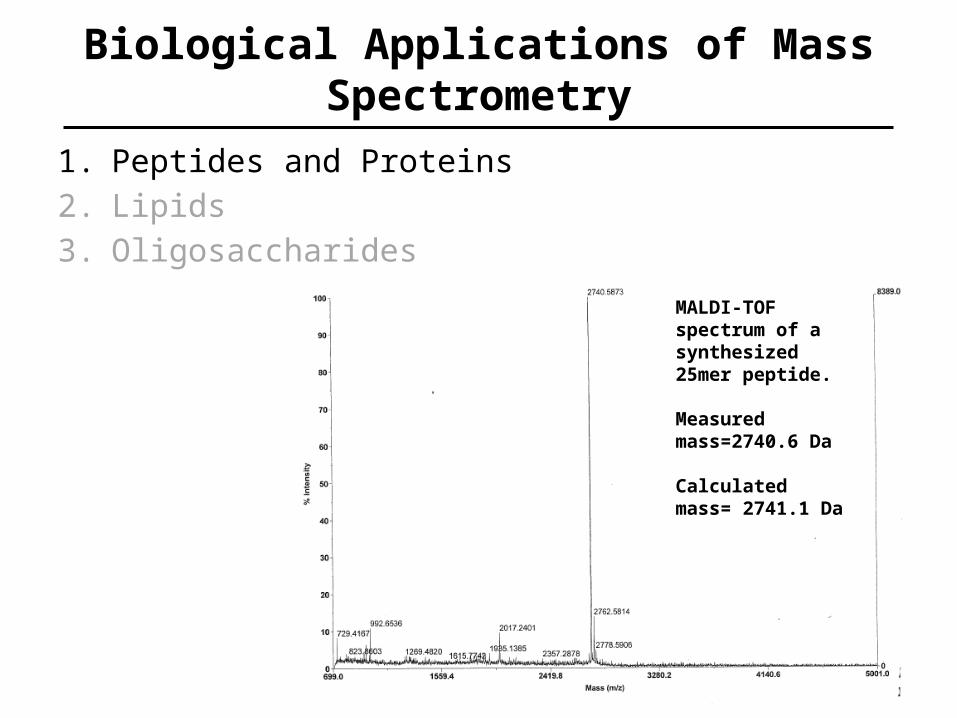
Biological Applications of Mass Spectrometry
MALDI-TOF spectrum of a synthesized 25mer peptide.
Measured mass=2740.6 Da
Calculated mass= 2741.1 Da
1. Peptides and Proteins
2. Lipids
3. Oligosaccharides
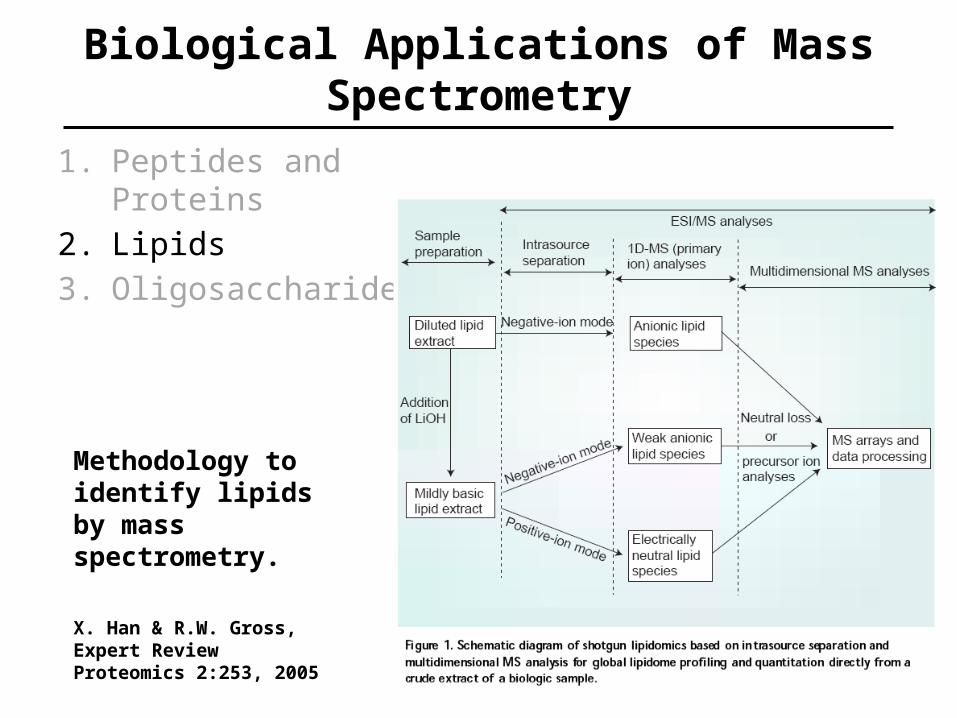
Biological Applications of Mass Spectrometry
Methodology to identify lipids by mass spectrometry.
X. Han & R.W. Gross,Expert Review Proteomics 2:253, 2005

1. Peptides and Proteins
2. Lipids
3. Oligosaccharides: Analysis of Milk
Biological Applications of Mass Spectrometry
Tao et al., J. Dairy Sci 91:3768, 2008

Widely used in Analytical Chemistry and Organic Chemistry.
Examples:• Analyzing of drugs during chemical synthesis• Identifying chemicals molecules or checking for
contaminants.• Environmental
– Measuring toxins such as PCB and Heavy Metals
• Geology– Analyzing petroleum or petrochemicals
Applications of Mass Spectrometry in the Physical Sciences

Space Exploration: Mars Curiosity Rover
Applications of Mass Spectrometry in the Physical Sciences
Sources: www.nasa.gov and Los Alamos National Laboratory
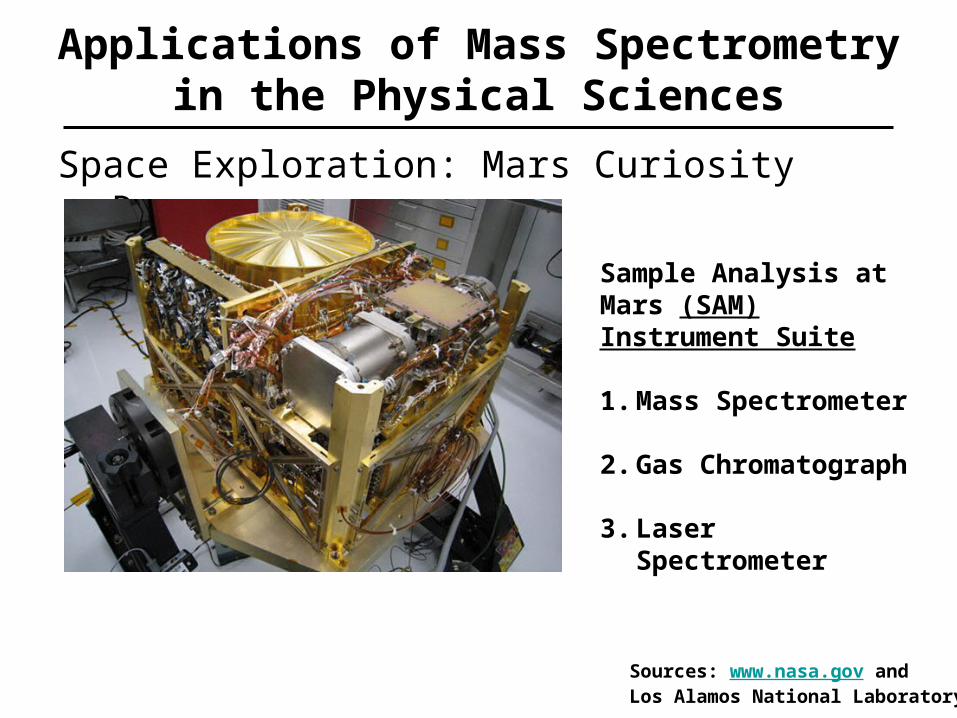
Space Exploration: Mars Curiosity Rover
Applications of Mass Spectrometry in the Physical Sciences
Sources: www.nasa.gov and Los Alamos National Laboratory
Sample Analysis at Mars (SAM) Instrument Suite
1. Mass Spectrometer
2. Gas Chromatograph
3. Laser Spectrometer
Undersea Exploration: Deep Water Horizon Spill
Applications of Mass Spectrometry in the Physical Sciences
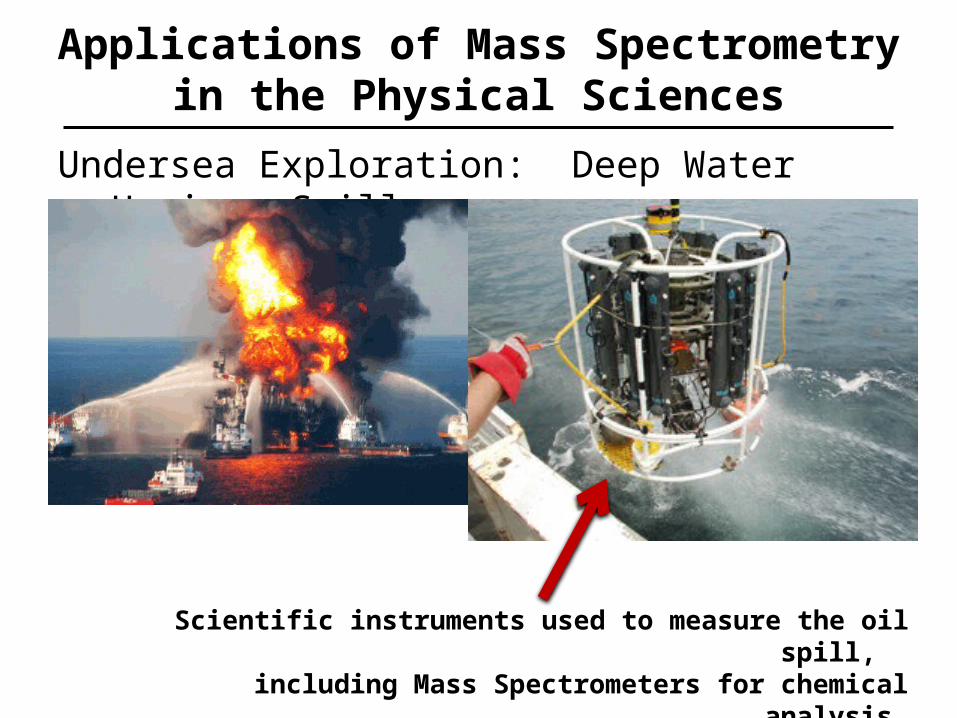
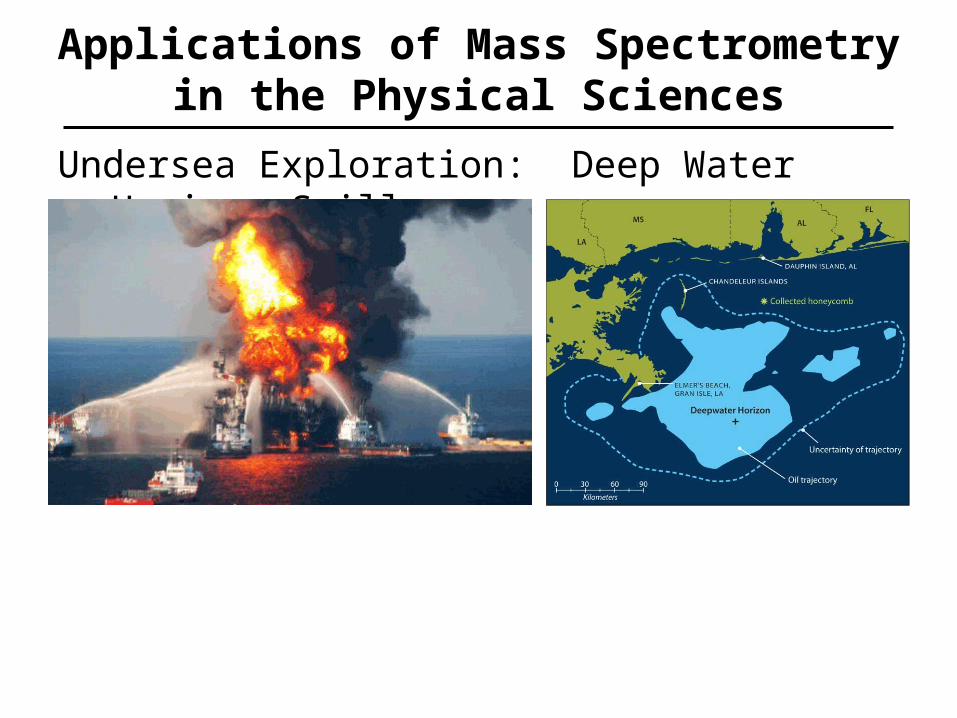
Undersea Exploration: Deep Water Horizon Spill
Applications of Mass Spectrometry in the Physical Sciences
Scientific instruments used to measure the oil spill, including Mass Spectrometers for chemical analysis.

Anti – Terrorism and Civil Defense:
Applications of Mass Spectrometry in the Physical Sciences
IonScan Mass SpectrometryUsed at Airports and other facilities for the detection of Explosives and Narcotics.
Manufacturer: Smiths Detection
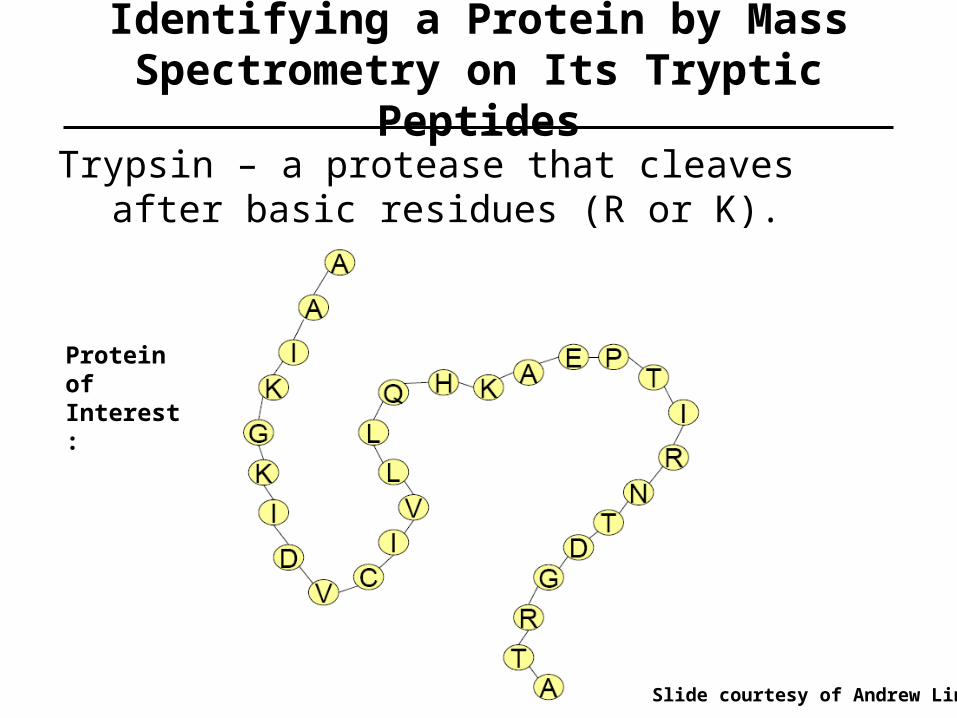
Trypsin – a protease that cleaves after basic residues (R or K).
Identifying a Protein by Mass Spectrometry on Its Tryptic Peptides
Slide courtesy of Andrew Link
Protein of Interest:
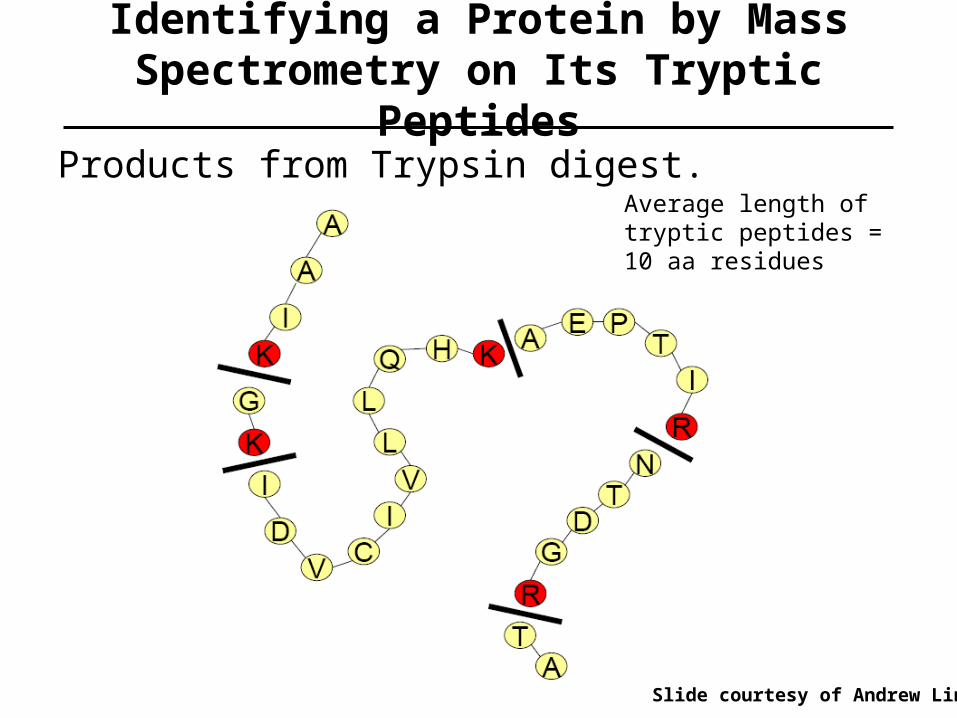
Products from Trypsin digest.
Identifying a Protein by Mass Spectrometry on Its Tryptic Peptides
Slide courtesy of Andrew Link
Average length of tryptic peptides = 10 aa residues
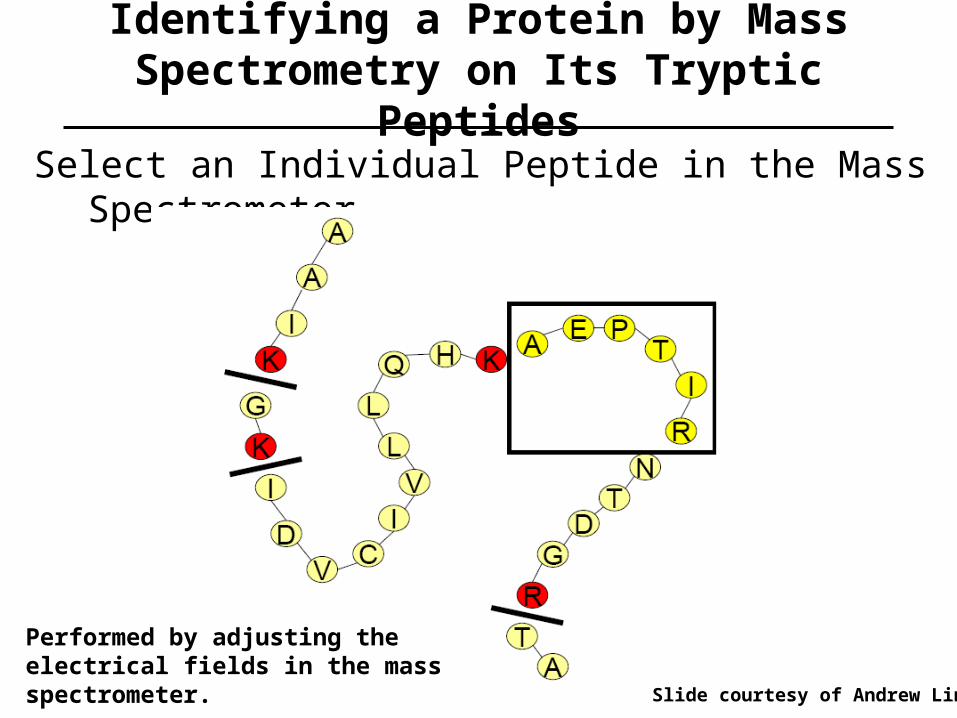
Select an Individual Peptide in the Mass Spectrometer
Identifying a Protein by Mass Spectrometry on Its Tryptic Peptides
Slide courtesy of Andrew Link
Performed by adjusting the electrical fields in the mass spectrometer.

Impart energy to the peptide by colliding it with an inert gas (Argon or Helium).
Identifying a Protein by Mass Spectrometry on Its Tryptic Peptides
Slide courtesy of Andrew Link

Measure the masses of the fragment ions.
Identifying a Protein by Mass Spectrometry on Its Tryptic Peptides
Slide courtesy of Andrew Link
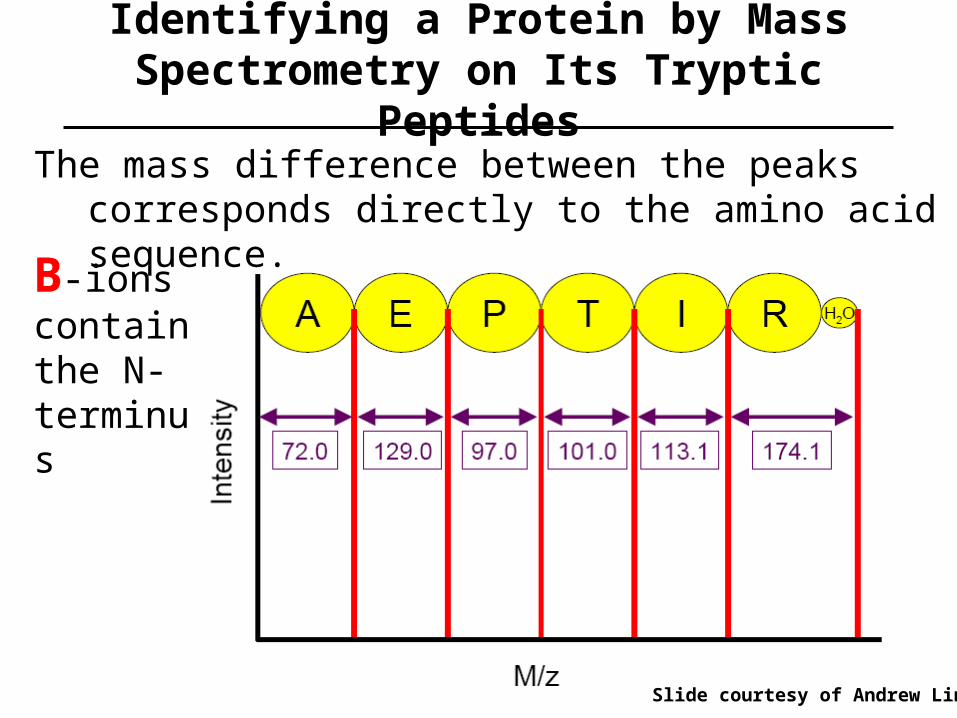
The mass difference between the peaks corresponds directly to the amino acid sequence.
Identifying a Protein by Mass Spectrometry on Its Tryptic Peptides
Slide courtesy of Andrew Link
B-ions contain the N-terminus

Identifying a Protein by Mass Spectrometry on Its Tryptic Peptides
Slide courtesy of Andrew Link
Y-ions contain the C-terminus
Identifying a Protein by Mass Spectrometry on Its Tryptic Peptides
Slide courtesy of Andrew Link
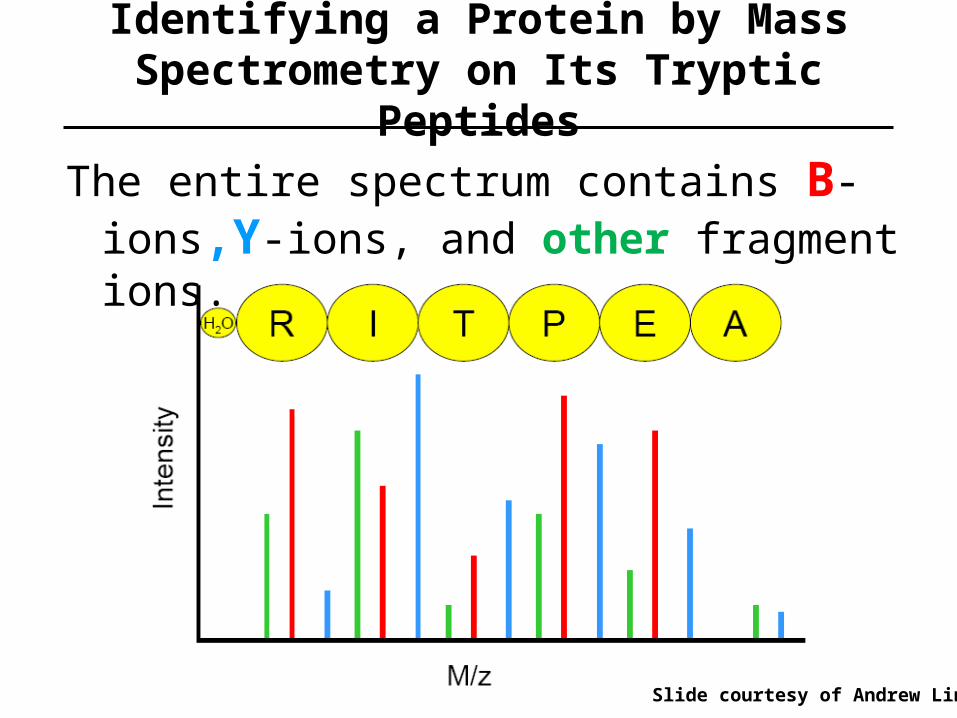
The entire spectrum contains B-ions,Y-ions, and other fragment ions.

Identifying a Protein by Mass Spectrometry on Its Tryptic Peptides
Slide courtesy of Andrew Link
The puzzle: The B, Y, and other ions occur together and we cannot distinguish them just by simple inspection of the spectrum.
Identifying a Protein by Mass Spectrometry on Its Tryptic Peptides
Slide courtesy of Andrew Link
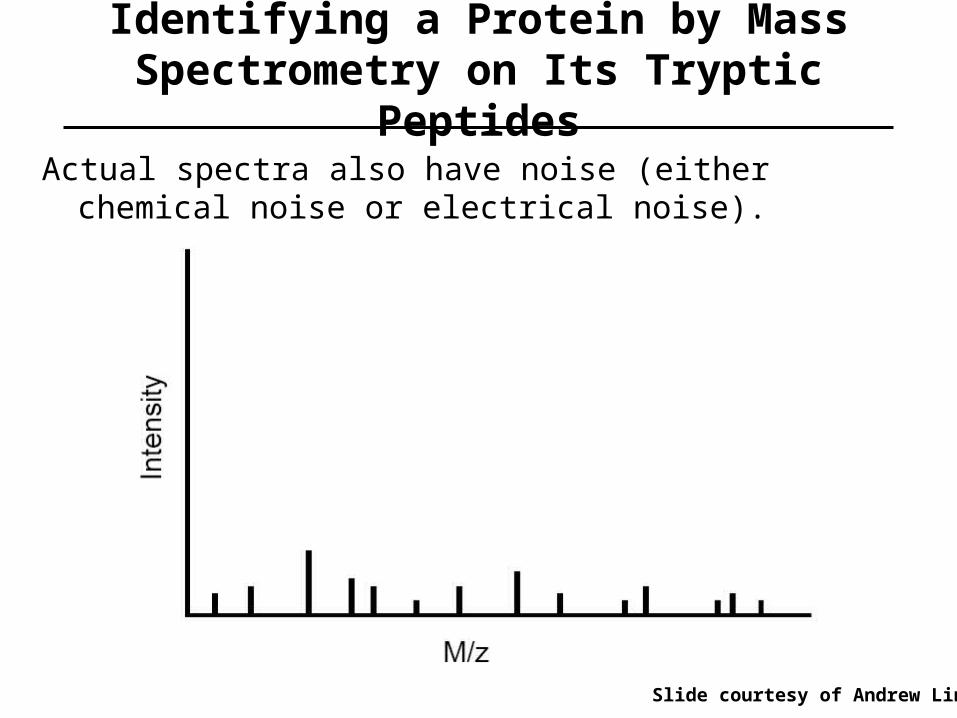
Actual spectra also have noise (either chemical noise or electrical noise).

Identifying a Protein by Mass Spectrometry on Its Tryptic Peptides
Slide courtesy of Andrew Link
The final spectrum: the interpretation requires experience and aid by software algorithms.

Software for Interpreting Peptide Mass Spectra
Statistical Matching
Work by statistically matching the measured spectra with the theoretical spectra of all possible tryptic peptides from an organism.1. SeQuest
2. MASCOT
3. X! Tandem
4. OMSSA
Requires a fully sequenced genome.
De novo sequencing (determines a peptide sequence based on the spacings of the fragment ions). 5. PepNovo
Gross_9309HER4_8 #4181 RT: 26.44 AV: 1 NL: 1.75E4T: ITMS + c NSI d w Full ms2 [email protected] [145.00-1170.00]
200 300 400 500 600 700 800 900 1000 1100m/z
0
2
4
6
8
10
12
14
16
18
20
22
24
26
28
30
32
34
36
38
40
42
44
46
48
50
Re
lativ
e A
bu
nd
an
ce
703.2590.1456.0
462.1
802.3
329.1
357.0428.0
290.2697.2
541.0
216.0
869.1668.2704.2
405.3175.0 554.2 785.3 984.0591.3284.1 754.1470.1 803.4372.1 915.4 1028.5973.7 1059.5
Y8
Y6
Y7
Y4
Y5
Y3
Y2
Y1 LVQ I
GD
D
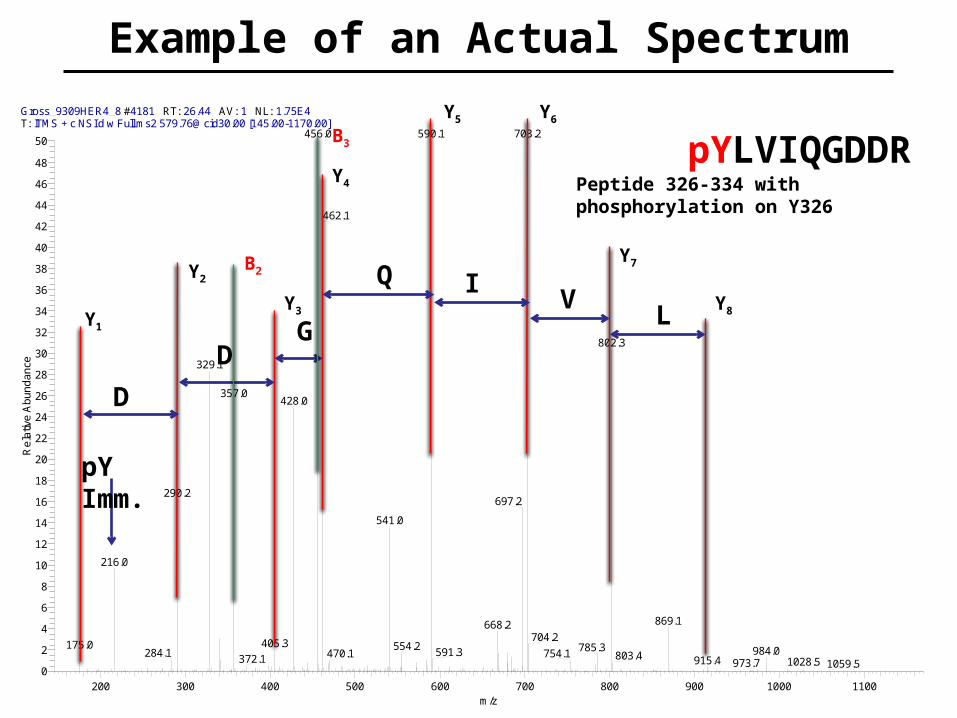
Peptide 326-334 with phosphorylation on Y326
B3
B2
pYLVIQGDDR
Example of an Actual Spectrum
pY Imm.

The Hardware for Peptide Mass Spectrometry
Pump
Liquid Chromatography
Mass Analyzer DetectorIonization Source
Vacuum Pump
Different Types:
ElectrosprayMALDI
Time of Flight (TOF)QuadropoleIon TrapOrbiTrapIon Cyclotron Resonance
(ICR)
Output:Spectra

The Hardware for Peptide Mass Spectrometry
Liquid Chromatography
Vacuum Pumps
Mass Analyzer and Detector
Ionization Source

Movie of MALDI – TOF mass spectrometer.
http://www.youtube.com/watch?v=OKxRx0ctrl0
Movie of FT-ICR mass spectrometer.
http://www.youtube.com/watch?v=a5aLlm9q-Xc&feature=related
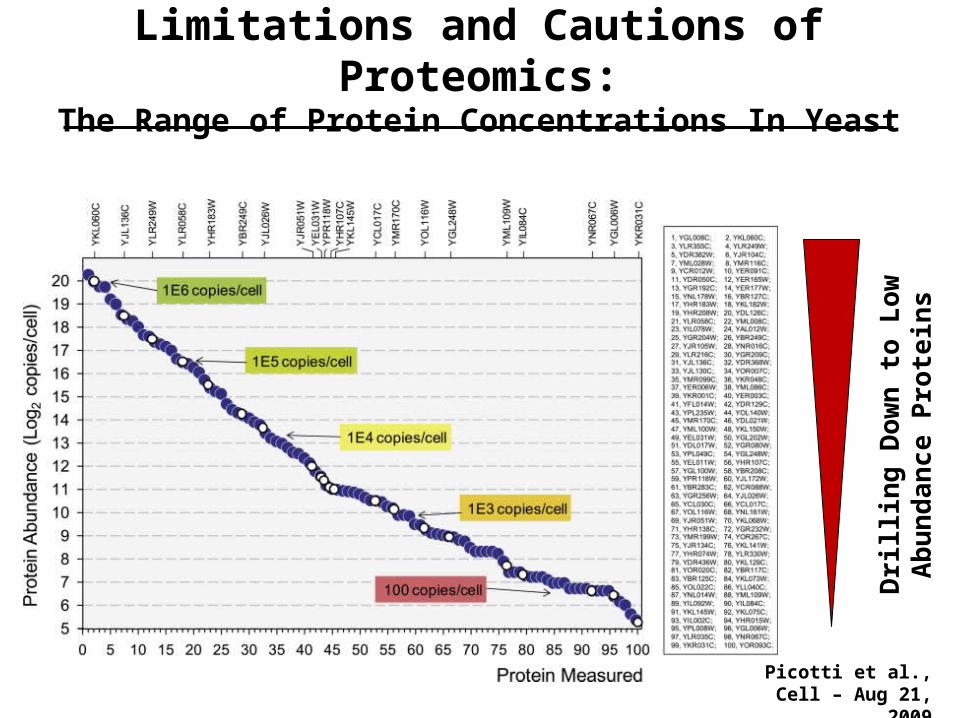
Limitations and Cautions of Proteomics:The Range of Protein Concentrations In Yeast
Picotti et al.,Cell – Aug 21, 2009
Dri
llin
g D
ow
n t
o L
ow
A
bu
nd
an
ce
Pro
tein
s

Limitations and Cautions of Proteomics:The Range of Protein Concentrations In Human Plasma
Anderson & Anderson, MCP 1:845, 2002
3 - 4 log range of Mass Spectrometers
Albumin 40 g/l Myoglobin < 100 mg/l TNF a < 1 ng/l
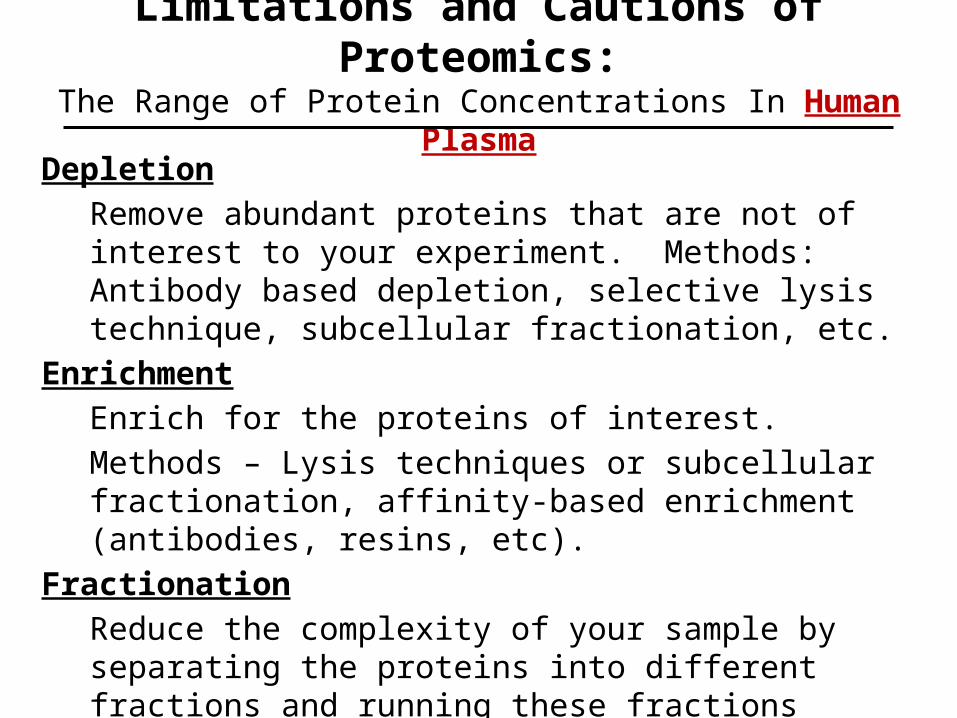
Limitations and Cautions of Proteomics:The Range of Protein Concentrations In Human Plasma
Depletion
Remove abundant proteins that are not of interest to your experiment. Methods: Antibody based depletion, selective lysis technique, subcellular fractionation, etc.
Enrichment
Enrich for the proteins of interest.
Methods – Lysis techniques or subcellular fractionation, affinity-based enrichment (antibodies, resins, etc).
Fractionation
Reduce the complexity of your sample by separating the proteins into different fractions and running these fractions separately.
Examples of Proteomic Experiments
1. Identification of Single Proteins
2. Identification of Proteins in the Nuclear Pore Complex
3. Identification of Proteins in the Secretory Pathway
4. Quantitative Measurement of Signal Transduction Pathways

Identification of Proteins in Single Bands
Mary Olanich, a graduate student in Jason Weber lab, wanted to identify proteins binding to the untranslated regions (UTR) of the NPM mRNA.
She performed a pull-down assay with biotinylated NPM mRNA. Protein bands obtained were visualized with a fluorescent protein stain.
Single bands were cut from the gel and proteins ID’ed by MS.
Olanich et al., Oncogene 30(1):77-86, 2011.
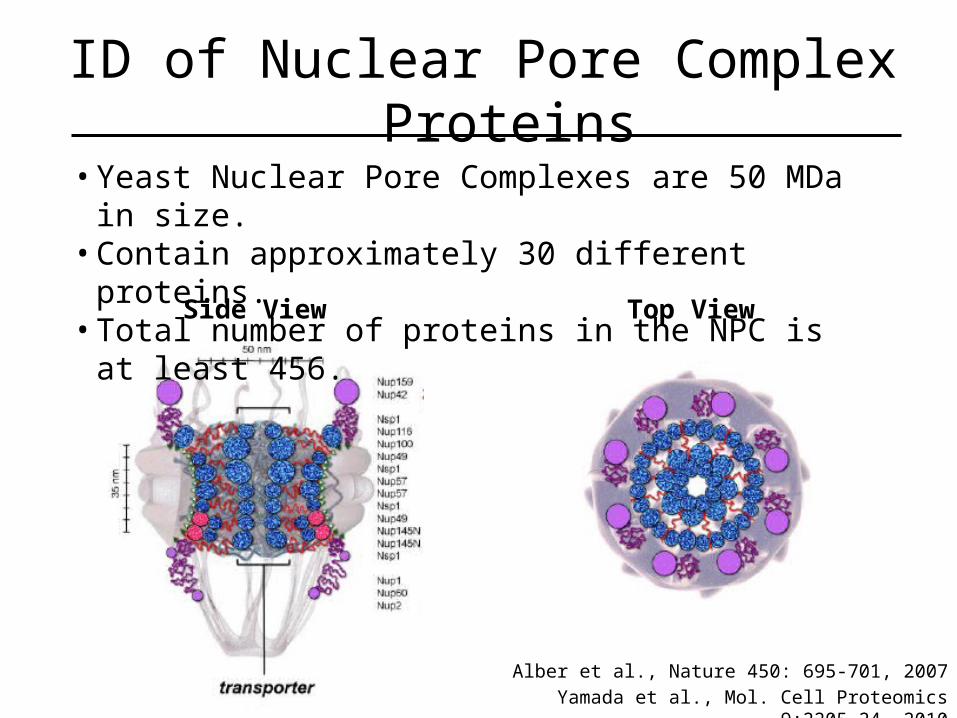
ID of Nuclear Pore Complex Proteins
Alber et al., Nature 450: 695-701, 2007
Yamada et al., Mol. Cell Proteomics 9:2205-24, 2010
• Yeast Nuclear Pore Complexes are 50 MDa in size.• Contain approximately 30 different proteins. • Total number of proteins in the NPC is at least 456.
Side View Top View

1. Make a highly pure NPC prepation
2. Extensive fractionation and Mass Spec protein identification.
3. Validate results with:a. Immunofluorescence
b. Epitope tagging
c. Immuno-electron microscopy
Strategy to Identify NPC Proteins
Rout et al., J Cell Bio 148:635-651, 2000
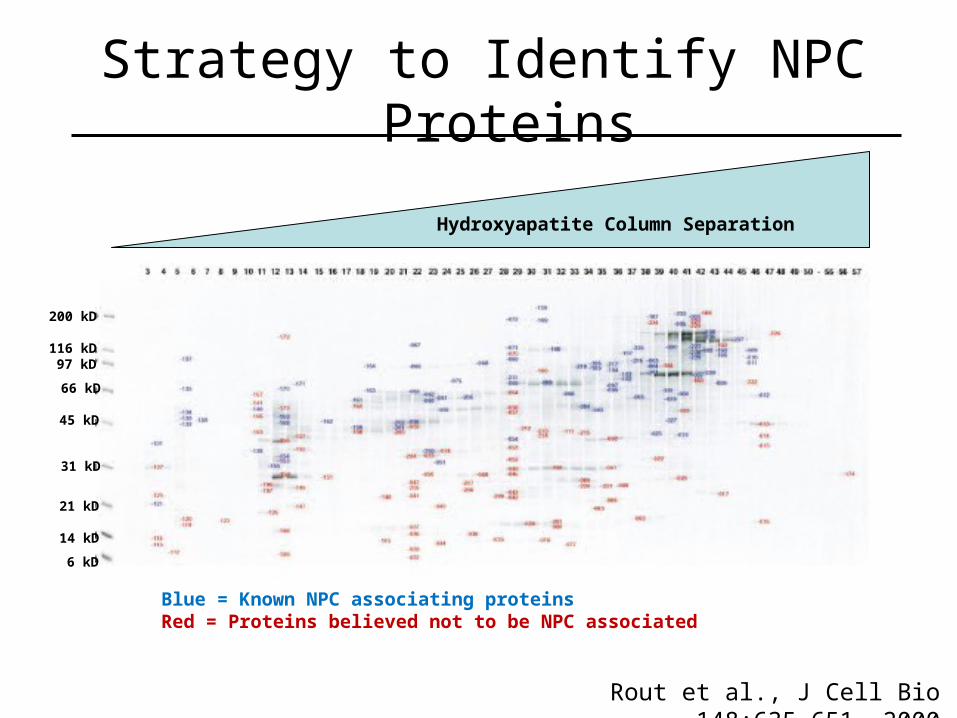
Strategy to Identify NPC Proteins
Rout et al., J Cell Bio 148:635-651, 2000
Hydroxyapatite Column Separation
200 kD
116 kD97 kD
66 kD
45 kD
31 kD
21 kD
14 kD
6 kD
Blue = Known NPC associating proteinsRed = Proteins believed not to be NPC associated
Strategy to Identify NPC Proteins
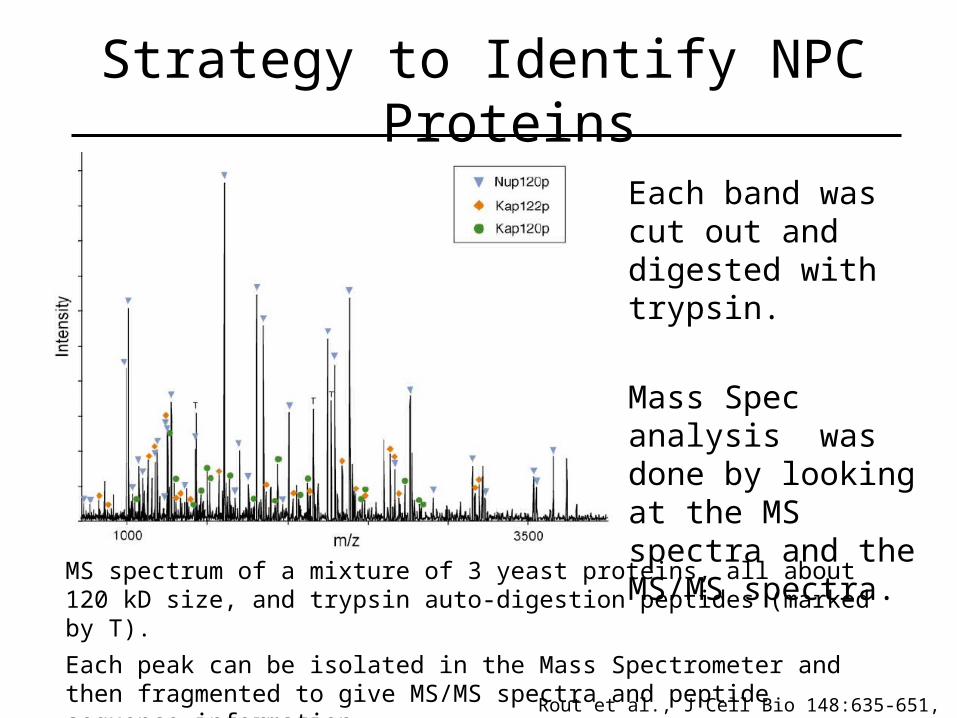
Each band was cut out and digested with trypsin.
Mass Spec analysis was done by looking at the MS spectra and the MS/MS spectra.
MS spectrum of a mixture of 3 yeast proteins, all about 120 kD size, and trypsin auto-digestion peptides (marked by T).
Each peak can be isolated in the Mass Spectrometer and then fragmented to give MS/MS spectra and peptide sequence information.
Rout et al., J Cell Bio 148:635-651, 2000
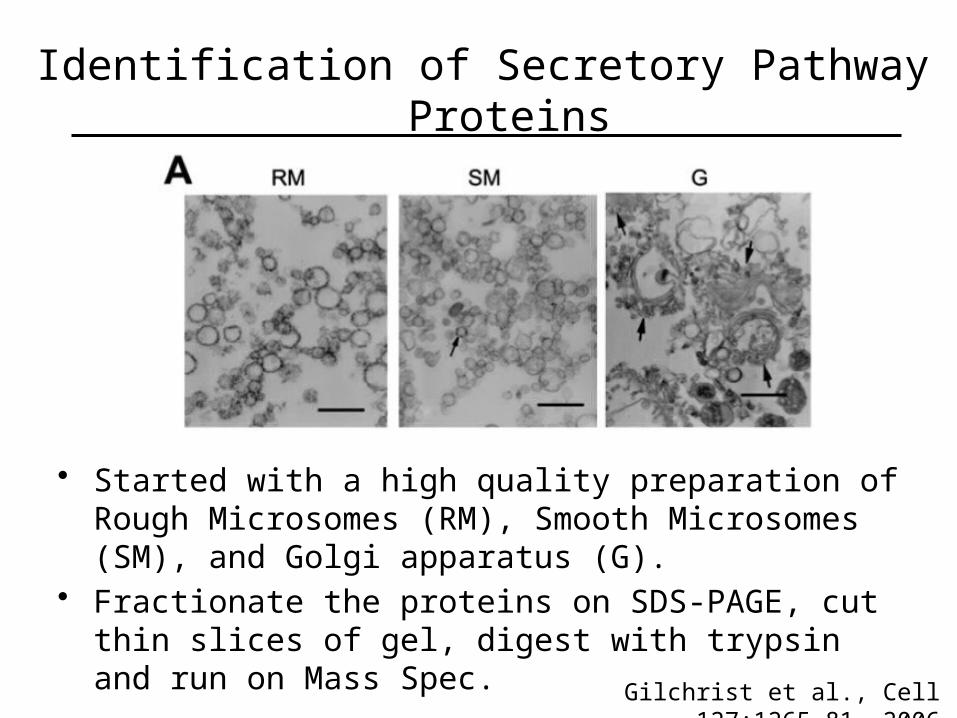
• Started with a high quality preparation of Rough Microsomes (RM), Smooth Microsomes (SM), and Golgi apparatus (G).
• Fractionate the proteins on SDS-PAGE, cut thin slices of gel, digest with trypsin and run on Mass Spec.
Identification of Secretory Pathway Proteins
Gilchrist et al., Cell 127:1265-81, 2006
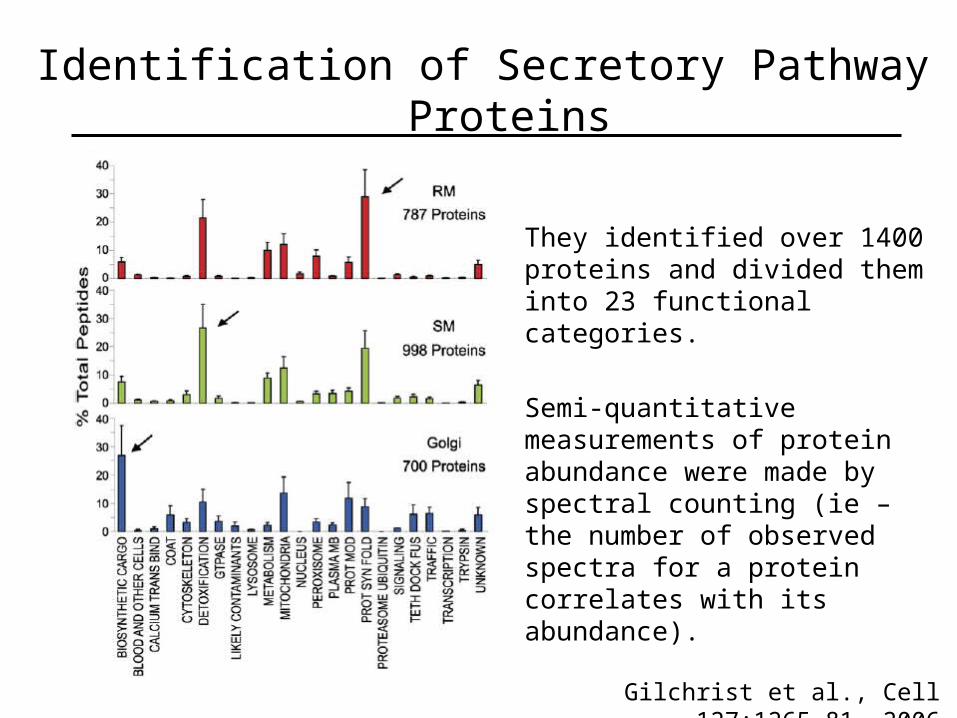
Identification of Secretory Pathway Proteins
Gilchrist et al., Cell 127:1265-81, 2006
They identified over 1400 proteins and divided them into 23 functional categories.
Semi-quantitative measurements of protein abundance were made by spectral counting (ie – the number of observed spectra for a protein correlates with its abundance).

• In Western blots, each antigen-antibody pair has a different affinity and “response characteristics.”
• Therefore, we can make comparison protein A in sample 1 vs.2 vs. 3, but not protein A vs. protein B in the same sample.
• Similarly, in Mass Spec, every peptide has its own ionization and detection characteristics.
Protein Quantitation with Mass Spectrometry
Sample
Protein A
Protein B
Protein C
1 2 3

1. Stable Isotope Labels based QuantitationExamples of Stable Isotopes: 13C, 15N, 2H, 18O
Advantage of Stable Isotopes: They are easy separated and distinguished in the Mass Spec.
Approach: An internal comparison within one Mass Spec run. Different samples can be “labeled” with different isotopes.
Advantages: Precision of quantitation, less susceptible to artifacts in Mass Spec runs.
Limitations: Cost of isotopes. Limited number of isotope combinations are feasible.
2. Label-free Quantitation – No isotopes used.
Protein Quantitation with Mass Spectrometry

Control
Mix Lysates
Identify and Quantify Proteins by Mass Spec
Fractionate Proteins on SDS-PAGEDigest Bands with Trypsin
Treatment 1 Treatment 2
Protein Quantitation with Mass Spectrometry
Bose et al., PNAS 103: 9773-8, 2006
Introduce Stable Isotope by Metabolic Labeling

500.0 502.0 504.0 506.0 508.0
505.303
503.309
500.304
459.0 461.0 463.0 465.0 467.0
464.782459.781
462.788
Protein 1
635.0 637.0 639.0 641.0 643.0
635.924
640.925638.930
Protein 3
637.0 639.0 641.0 643.0 645.0
642.405640.412
637.405
Protein 2
Protein 4
+0
+6
+10
+0
+6 +10VGQAQDILR VAGQSSPSGIQSR
FFEILSPVYR HDGAFLIR
Key +0 Control 12C-Arginine+6 Treatment 1 13C6-Arginine+10 Treatment 2 13C6
15N4-Arginine
Protein Quantitation with Mass Spectrometry
Bose et al., PNAS 103: 9773-8, 2006
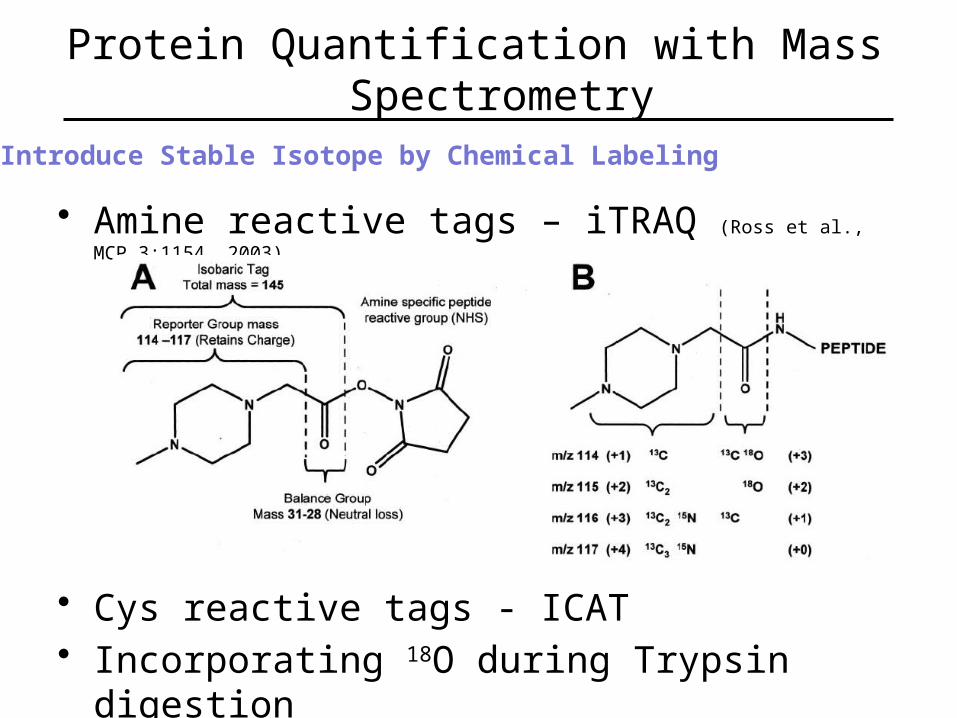
• Amine reactive tags – iTRAQ (Ross et al., MCP 3:1154, 2003)
• Cys reactive tags - ICAT• Incorporating 18O during Trypsin digestion
Protein Quantification with Mass Spectrometry
Introduce Stable Isotope by Chemical Labeling

Studying EGFR Signal Transduction with Quantitative Proteomics
Introduce Stable Isotope by Chemical Labeling
Zhang et al., MCP 4: 1240-50, 2005

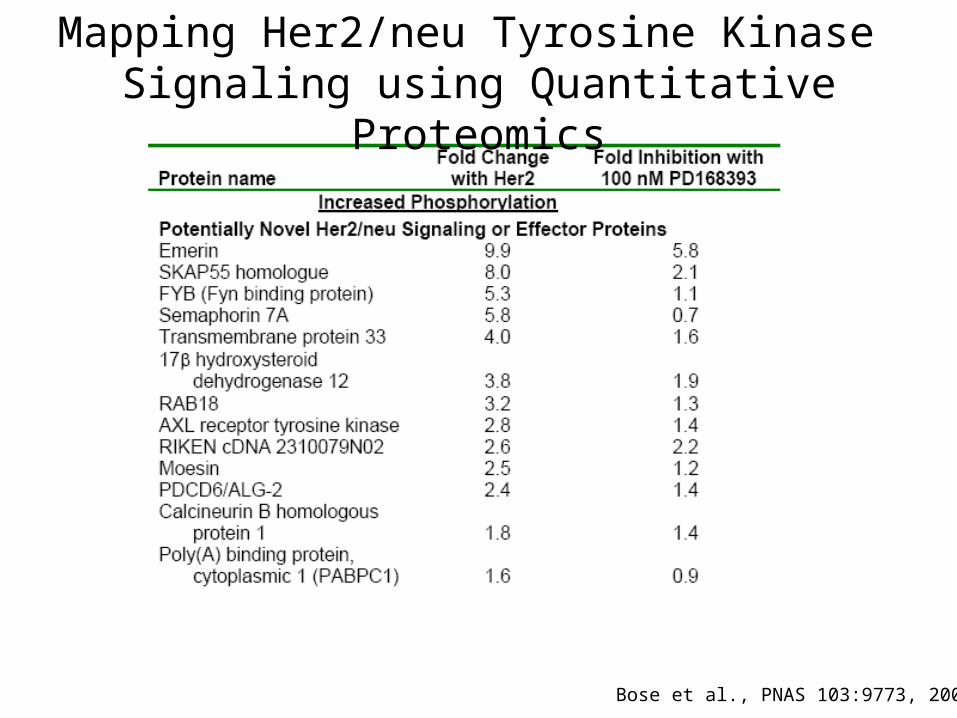
Mapping Her2/neu Tyrosine Kinase Signaling using Quantitative Proteomics
250 kD
150 kD
100 kD
75 kD
Veh
icle
0.01 0.1 1 8
Her2 inhibitor (mM)
Gef
itin
ib 1
mM
Em
pty
Vec
tor
Her
2/n
eu
A. B.
Bose et al., PNAS 103:9773, 2006
WB: Anti-pTyr

Empty vectorcells
Her2/neu cells+Her2 kinase inhibitor
Her2/neucells
Mix Lysates
Immunoaffinity Purify withAntiphosphotyrosine Antibodies
Resolve on SDS-PAGEDigest Bands with Trypsin
Identify and Quantify Proteins by LC-MS/MS
Bose et al., PNAS 103:9773, 2006
Mapping Her2/neu Tyrosine Kinase Signaling using Quantitative Proteomics

SILAC Quantitation of Protein Phosphorylation
0
1
2
3
4
5
6
7
8
9
0 50 100 150 200 250 300 350 400 450
Number of Proteins
Ra
tio
Series1 Series2 Series3
Axl & PLCg1
Dok1 & STAT1
Fyb/ADAP
Her2/neu25
20
15
10
PI3kinase p85 b subunit
A. Fold Change with Her2/neuB. Fold Change with Her2 kinase inhibitor
Fold Inhibition
Fo
ld C
han
ge
wit
h H
er2
/neu
Protein
811 6
79
156
60
9
8
27
6
83
0
50
100
150
200
>1.5 0.66-1.5 <0.66
>1.5
1.3-1.5
No Change
0.5-0.7
<0.5
Fold Change with Her2/neu
Nu
mb
er o
f P
rote
ins
Bose et al., PNAS 103:9773, 2006
Mapping Her2/neu Tyrosine Kinase Signaling using Quantitative Proteomics

Bose et al., PNAS 103:9773, 2006
Mapping Her2/neu Tyrosine Kinase Signaling using Quantitative Proteomics
Bose et al., PNAS 103:9773, 2006
Mapping Her2/neu Tyrosine Kinase Signaling using Quantitative Proteomics

Bayesian Network Analysis of Proteomic Results
Bose et al., PNAS 103:9773, 2006
Mapping Her2/neu Tyrosine Kinase Signaling using Quantitative Proteomics
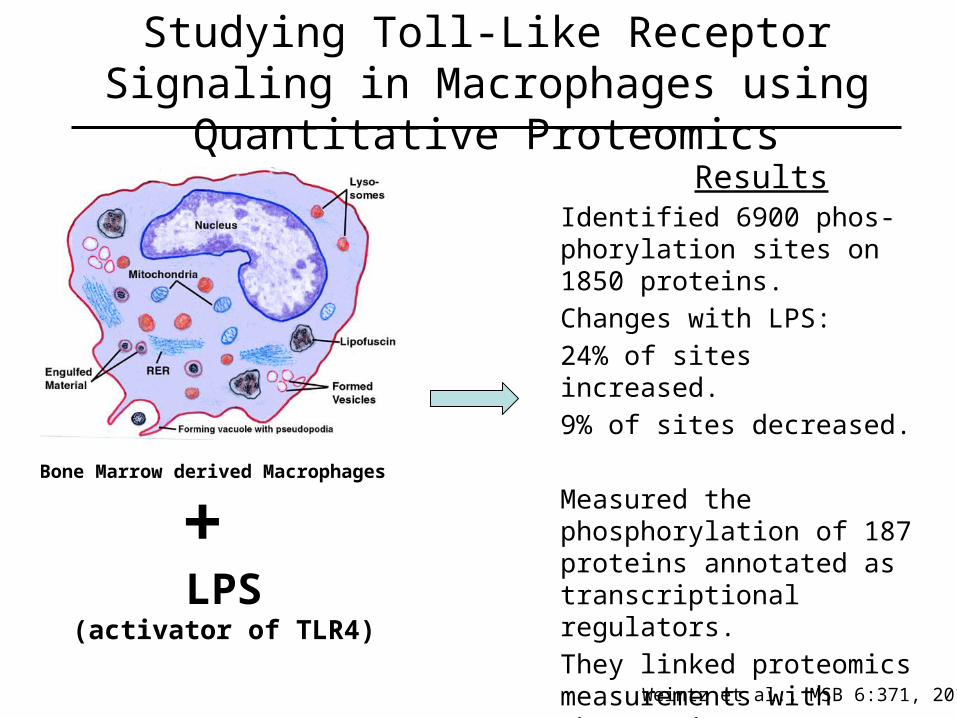
ResultsIdentified 6900 phos-phorylation sites on 1850 proteins.
Changes with LPS:
24% of sites increased.
9% of sites decreased.
Measured the phosphorylation of 187 proteins annotated as transcriptional regulators.
They linked proteomics measurements with changes in gene expression.
Weintz et al., MSB 6:371, 2010
Studying Toll-Like Receptor Signaling in Macrophages using Quantitative Proteomics
Bone Marrow derived Macrophages
+ LPS
(activator of TLR4)

Weintz et al., MSB 6:371, 2010
Studying Toll-Like Receptor Signaling in Macrophages using Quantitative Proteomics
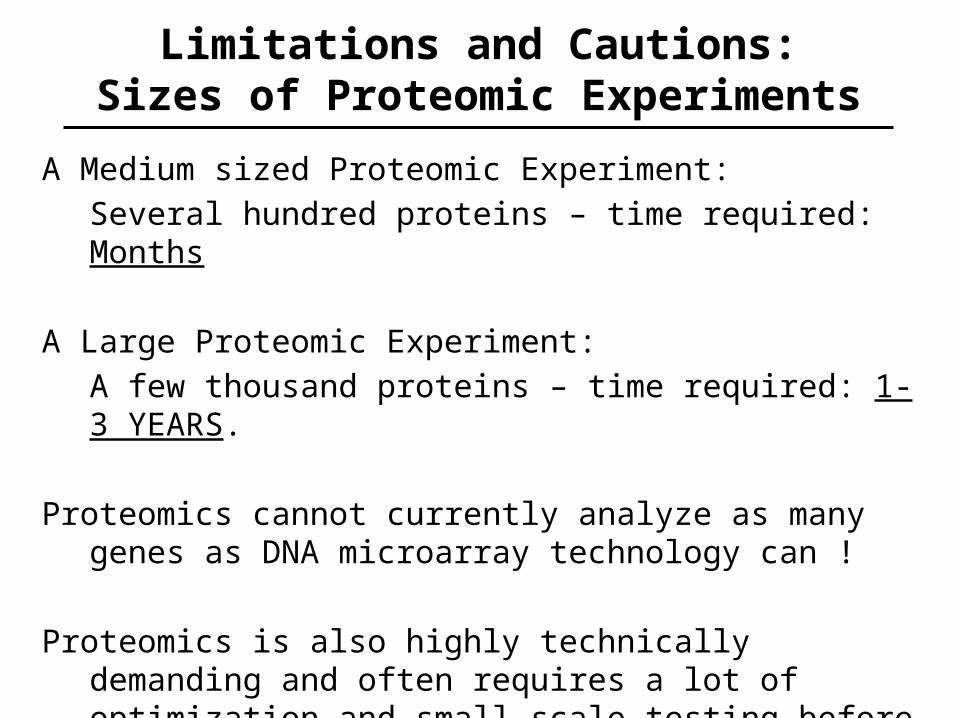
Limitations and Cautions:Sizes of Proteomic Experiments
A Medium sized Proteomic Experiment:
Several hundred proteins – time required: Months
A Large Proteomic Experiment:
A few thousand proteins – time required: 1-3 YEARS.
Proteomics cannot currently analyze as many genes as DNA microarray technology can !
Proteomics is also highly technically demanding and often requires a lot of optimization and small scale testing before performing a large experiment.
Mass Spectrometry at Washington University
• Wash U receives NIH funding for the Biological and Biomedical Mass Spectrometry Research Resource.
• At least 8 labs at Wash U. perform biological mass spectrometry experiments.
• Available instruments on the Wash U medical campus, Wash U Danforth campus, and the Danforth Plant Science Center include:
– At least 30 mass spectrometers.
– 5 LTQ-OrbiTrap mass spectrometers (some of the latest and highest performance instruments).

Summary
1. There is wide spread use of mass spectrometry in both the biological and physical sciences.
2. Proteins are usually digested into peptides. Peptide sequence is determined by fragmentation in the Mass Spectrometer.
3. Protein abundance and enrichment or fractionation methods are critical to consider in the planning of proteomic experiments.
4. Proteomics can identify proteins and map their post-translational modifications. Components of protein complexes and intracellular pathways can be analyzed by proteomics.
5. Quantitative proteomics can be performed by incorporating stable isotopes into proteins or by using label-free quantitation methods.
6. Proteomics cannot analyze as many genes as DNA microarray technology. Further, proteomics is highly technically demanding and often requires a lot of optimization.
7. Many labs at Wash U. use mass spec and proteomics. Wash U. has a lot of the necessary equipment and expertise to conduct mass spectrometry experiments.