Embed Size (px)
Citation preview

Protein Purification


Protein Purification
Philip L. R. BonnerNottingham Trent University

Published by:Taylor & Francis Group
In US: 270 Madison AvenueNew York, NY 10016
In UK: 2 Park Square, Milton ParkAbingdon, OX14 4RN
© 2007 by Taylor & Francis Group
First published 2007
ISBN: 978-0-415-38511-4 or 0-4153-8511-3
This book contains information obtained from authentic and highly regarded sources. Reprinted materialis quoted with permission, and sources are indicated. A wide variety of references are listed. Reasonableefforts have been made to publish reliable data and information, but the author and the publishercannot assume responsibility for the validity of all materials or the consequenes of their use.
All rights reserved. No part of this book may be reprinted, reproduced, transmitted, or utilized in anyform by any electronic, mechanical, or other means, now known or hereafter invented, includingphotocopying, microfilming, and recording, or in any information storage or retrieval system, withoutwritten permission from the publishers.
A catalog record for this book is available from the British Library.
Library of Congress Cataloging-in-Publication Data
Bonner, Philip L. R.Protein purification / Philip L.R. Bonner.
p. ; cm.Includes bibliographical references and index.ISBN 978-0-415-38511-4 (alk. paper)
1. Proteins--Purification. I. Title.[DNLM: 1. Proteins--isolation & purification. QU 55 B716p 2007]
QP551.B66 2007612’.01575--dc22
2006035452
Editor: Elizabeth OwenEditorial Assistant: Kirsty LyonsProduction Editor: Karin Henderson
Taylor & Francis Group, an Informa business Visit our website at http://www.garlandscience.com
This edition published in the Taylor & Francis e-Library, 2007.
“To purchase your own copy of this or any of Taylor & Francis or Routledge’scollection of thousands of eBooks please go to www.eBookstore.tandf.co.uk.”
ISBN 0–203–96726–7 Master e-book ISBN

Contents
Abbreviations vii
Preface ix
Chapter 1 Protein purification strategy and equipment 11.1 Introduction 11.2 Reasons to justify the purification of a protein 21.3 Loss of protein during a purification schedule 21.4 Overview of protein structure 41.5 Properties of proteins that enable purification 51.6 The range of techniques for protein purification 71.7 Protein purification strategy 71.8 The process of protein purification 91.9 The theory of chromatography 111.10 Equipment required for protein purification 121.11 Protein purification chromatographic runs 151.12 Information required for a protein purification balance sheet 18
Chapter 2 Groundwork 252.1 Introduction 252.2 Acids and bases 252.3 Buffers 262.4 Assay to identify a target protein 272.5 Protein assays 292.6 Extraction of protein from cells or tissue 312.7 Techniques used to disrupt tissue or cells 352.8 Extraction methods for small amounts of tissue or cells 372.9 Extraction methods for large amounts of animal/plant
tissue or cells 392.10 Extraction methods for bacterial or yeast cells 402.11 Points to remember about extraction procedures 412.12 Techniques for clarifying homogenized extracts
(centrifugation) 412.13 Techniques for clarifying homogenized extracts (aqueous
two-phase partitioning) 452.14 Techniques for concentrating proteins from dilute solutions
(laboratory scale) 472.15 Clarification of process-scale extracts 562.16 Membrane chromatography 572.17 Storage of protein samples 58

Chapter 3 Nonaffinity absorption techniques for purifying proteins 793.1 Ion exchange chromatography (IEX) 793.2 Chromatofocusing 843.3 Hydroxyapatite chromatography 863.4 Hydrophobic interaction chromatography (HIC) 873.5 Hydrophobic charge induction chromatography (HCIC) 913.6 Mixed mode chromatography (MMC) 92
Chapter 4 Affinity procedures for purifying proteins 974.1 Affinity chromatography 974.2 Covalent chromatography 1034.3 Dye ligand affinity chromatography 1054.4 Immobilized metal (ion) affinity chromatography (IMAC) 1064.5 Immunoaffinity chromatography 1084.6 Lectin affinity chromatography 1094.7 Purification of recombinant proteins 1124.8 IMAC for purifying recombinant proteins 1134.9 Fusion proteins for purifying recombinant proteins 1144.10 Affinity partitioning (precipitation) 116
Chapter 5 Nonabsorption techniques for purifying proteins 1215.1 Size exclusion chromatography (SEC) 1215.2 Some factors to consider in SEC 1245.3 Preparation and storage of SEC resins 1275.4 Analytical SEC 1275.5 SEC to separate protein aggregates or the removal of low
amounts of contaminating material 1275.6 Desalting (group separation) 1285.7 SEC in the refolding of denatured proteins 1285.8 Preparative polyacrylamide gel electrophoresis (PAGE) 1285.9 Isolation of proteins from polyacrylamide gels or from
nitrocellulose membranes 1305.10 Preparative isoelectric focusing (IEF) 131
Chapter 6 Monitoring the purity of protein solutions 1376.1 Electrophoresis of proteins 1376.2 The theory of electrophoresis 1386.3 Polyacrylamide gel electrophoresis (PAGE) 1396.4 Western blotting 1446.5 Isoelectric focusing (IEF) 1466.6 Capillary electrophoresis (CE) 1476.7 Reversed phase high-pressure liquid chromatography
(RP-HPLC) 149
Appendix 1 The common units used in biology 161Appendix 2 Answers to the exercises 162Appendix 3 Single-letter code for amino acids 165Appendix 4 List of suppliers 166
Glossary 175
Index 185
vi Contents

A280 absorbance at 280 nm∆A440 change in absorbance at
440 nmADP adenosine 5′-diphosphateAMP adenosine 5′-
monophosphateATP adenosine 5′-triphosphateBCA bicinchoninic acid BCIP 5-bromo-4-chloro-3-indolyl
phosphateBICINE N,N-bis-(2-hydroxyethyl)
glycinebis-Tris– 1,3-bis[Tris(hydroxymethyl)propane methylamino]propaneBSA bovine serum albumin CAPS 3-[(3-cholamidopropyl)
dimethylammonio]-1-propane sulfonate
CHAPSO 3-[(3-cholamidopropyl)dimethylammonio]-2-hydroxypropane sulfonicacid
CE capillary electrophoresisCHAPS 3-[3-(cholamidopropyl)
dimethylammonia]-1-propane sulfonate
CHES 2-(N-cyclohexylamino)ethane sulfonic acid
CMC critical micelle concentrationCTAB cetyl trimethylammonium
bromideDEAE diethylaminoethyl (as in
DEAE IEX)DIECA diethyldithiocarbamateDMF dimethylformamideDNA deoxyribonucleic acidDTT dithiothreitolE64 trans-epoxy succinyl-L-
leuculamido-(4-guanidino)butane
E.C. enzyme classificationE. coli Escherichia coliECL enhanced
chemiluminescenceEDTA ethylenediaminetetraacetic
acid
FITC fluorescein isothiocyanateGPI glycosylphosphatidylinositolHA hydroxyapatiteHCIC hydrophobic charge
induction chromatographyHEPES N-2-hydroxyethylpiperazine-
N′-2-ethane sulfonic acid HIC hydrophobic interaction
chromatographyHPLC high-pressure liquid
chromatographyHRP horseradish peroxidaseIEF isoelectric focusingIEX ion exchange
chromatographyIDA iminodiacetateIgA class A immunoglobulinIgG class G immunoglobulinIgM class M immunoglobulinIMAC immobilized metal affinity
chromatographyIU International Units of
enzyme activityKSCN potassium thiocyanateLDH lactate dehydrogenaseLubrol 2-dodecoxyethanol(PX;12A9)Mr relative molecular mass2-ME 2-mercaptoethanolMBI mercaptobenzimidazole
sulfonic acidMEP 4-mercaptoethylpyridineMES 2(N-morpholine)ethane
sulfonic acidMMC mixed mode
chromatographyMOPSO 3-(N-morpholino)-2-hydroxy-
propane sulfonic acidMWCO molecular weight cut-off
(used in ultrafiltrationmembrane selection)
NAD+ nicotinamide adeninedinucleotide (oxidized)
NADP+ nicotinamide adeninedinucleotide phosphate(oxidized)
Abbreviations

NaSCN sodium thiocyanateNBT nitroblue tetrazoliumNonidet ethylphenolpoly(ethylen(P40) glycolether)11
NTA nitrilotriacetatePAGE polyacrylamide gel
electrophoresis2D PAGE two-dimensional
polyacrylamide gelelectrophoresis
PBS phosphate-buffered saline PEEK polyetheretherketonesPEG polyethylene glycolPIPES 1,4-piperazinebis(ethane
sulfonic acid)PMSF phenylmethylsulfonyl
fluoridepsi pounds per square inch (a
unit of pressure)PVPP polyvinylpolypyrrolidoneRCF relative centrifugal forceRf relative mobility (relative to
the front)RNA ribonucleic acidRPC reversed phase
chromatography
r.p.m. revolutions per minuteSDS sodium dodecyl sulfate SEC size exclusion
chromatographyS.I. Système InternationalTBS Tris-buffered salineTCA trichloroacetic acidTCE trichloroethanolTEMED N,N,N′,N′-tetramethyl
ethylenediamineTricine N-[Tris(hydroxymethyl)
methyl]glycineTris 2-amino-2-hydroxymethyl-
propane-1,3-diolTriton t-octylphenoxypoly-
ethoxyethanolTween polyoxyethylene sorbitan
monolaurate polysorbateUV ultravioletVe SEC elution volumeV0 the void volume of an SEC
columnVt the total volume of an SEC
columnv/v volume/volumew/v weight/volume
viii Abbreviations
Preface
Protein Purification is a basic guide which illustrates the basis and limitations of variousprotein purification techniques and in what circumstances to use them. It can be used inthe laboratory and for self-study and, as such, contains diagrams, protocols, and practiceexercises. An extensive glossary and abbreviations section have been included to help thereader to understand nomenclature. A guide to protein purification strategy precedeschapters on the major techniques (the solubility of proteins, ion exchange chromato-graphy, hydrophobic interaction chromatography, affinity chromatography and sizeexclusion chromatography) used to purify proteins and the methods used to measure thepurity of samples. The book is aimed at those new to protein purification techniques andwill also be a useful resource for more experienced scientists.
Increasing academic and commercial interest has led to a wide choice of techniques,conditions and equipment to separate and enrich proteins from complex mixtures. Thechoice of technique to purify a protein is far from clear cut and relies on some knowledgeof the properties of the target protein and of the technique employed. The degree of purifi-cation required depends on further studies to be undertaken on the protein – a partiallyenriched protein preparation may be required for kinetic analysis – whereas a homogenouspreparation could be required for structural analysis.
Many protein purification techniques have been, and will continue to be, used success-fully, particularly for laboratory-scale protein purification. But the requirements of thebiotechnology industry for novel and robust resins to speed process-scale chromatographyhas seen the development of other methods, for example, expanded bed, mixed mode andmembrane chromatography, which are also covered in the book.
I would like to acknowledge the support of Liz (my wife), Francesca (my daughter),family, Alan, Wayne (work colleagues) and Kirsty (Taylor & Francis) for their help andsupport throughout the preparation of this book.
Philip Bonner


‘Purifying a protein is an essential first step in understanding itsfunction’ (Berg et al., 2006)
1.1 Introduction
In recent years the success of genomics has provided the impetus toexplore and understand the molecular events that happen within the cell.The genome provides the information to manufacture a protein, but itprovides none of the information on the activity or function of thatprotein once it has been synthesized by the cell. Post-translational modifi-cations and changes in the intracellular levels of cofactors can significantlyalter a protein’s activity, which is not easy to predict from the informa-tion provided by the genome. As a result there has been a collectiverefocusing upon the proteome and the methods that can be employed toisolate and identify key proteins.
A popular method for the identification of proteins that alter inabundance as a result of changes in cellular condition is 2-dimensionalpolyacrylamide gel electrophoresis (2D PAGE). This technique first separatesproteins according to their charge and then in the second dimensionaccording to their molecular mass. After staining, up to a 1000 polypep-tides can be visualized and key components can be identified using massspectrometry. However, there are limits even to this highly resolvingtechnique and methods of protein enrichment may be required prior to2D PAGE, particularly to visualize low-abundance proteins.
There is an increasing requirement for biological scientists of all disci-plines (at all levels) to be able to devise protocols to enrich a low-abundance protein for subsequent analysis. Initially, protein purification(enrichment) can seem unnecessarily complex with little or no strategyinvolved. But with a little experience protein purification can become anengrossing challenge.
To help prepare for the start of a protein purification schedule, makeuse of the information that is already available:
1. Search the databases for purification protocols on the protein of inter-est. Even if the journal article describes the purification of the proteinfrom a different species, the techniques may be applicable and this cansave a lot of laboratory time.
2. Familiarize yourself with purification techniques by reading articles andthe technical information provided by manufacturers.
3. If possible prior to starting the laboratory work, try a computer-basedprotein purification program, for example Proteinlab (Leeds University,
Protein purificationstrategy and equipment 1
UK) or the simulation available from GE Healthcare. These programsallow the user to experience the empirical nature of protein purificationin a truncated time-frame without the cost of reagents and resins.
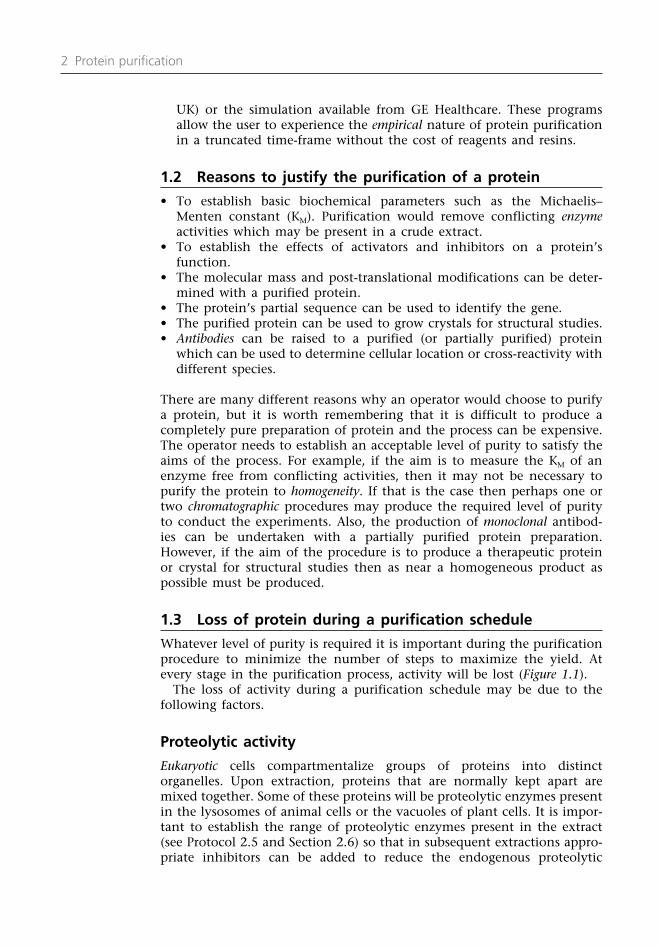
1.2 Reasons to justify the purification of a protein
• To establish basic biochemical parameters such as the Michaelis–Menten constant (KM). Purification would remove conflicting enzymeactivities which may be present in a crude extract.
• To establish the effects of activators and inhibitors on a protein’sfunction.
• The molecular mass and post-translational modifications can be deter-mined with a purified protein.
• The protein’s partial sequence can be used to identify the gene.• The purified protein can be used to grow crystals for structural studies.• Antibodies can be raised to a purified (or partially purified) protein
which can be used to determine cellular location or cross-reactivity withdifferent species.
There are many different reasons why an operator would choose to purifya protein, but it is worth remembering that it is difficult to produce acompletely pure preparation of protein and the process can be expensive.The operator needs to establish an acceptable level of purity to satisfy theaims of the process. For example, if the aim is to measure the KM of anenzyme free from conflicting activities, then it may not be necessary topurify the protein to homogeneity. If that is the case then perhaps one ortwo chromatographic procedures may produce the required level of purityto conduct the experiments. Also, the production of monoclonal antibod-ies can be undertaken with a partially purified protein preparation.However, if the aim of the procedure is to produce a therapeutic proteinor crystal for structural studies then as near a homogeneous product aspossible must be produced.
1.3 Loss of protein during a purification schedule
Whatever level of purity is required it is important during the purificationprocedure to minimize the number of steps to maximize the yield. Atevery stage in the purification process, activity will be lost (Figure 1.1).
The loss of activity during a purification schedule may be due to thefollowing factors.
Proteolytic activity
Eukaryotic cells compartmentalize groups of proteins into distinctorganelles. Upon extraction, proteins that are normally kept apart aremixed together. Some of these proteins will be proteolytic enzymes presentin the lysosomes of animal cells or the vacuoles of plant cells. It is impor-tant to establish the range of proteolytic enzymes present in the extract(see Protocol 2.5 and Section 2.6) so that in subsequent extractions appro-priate inhibitors can be added to reduce the endogenous proteolytic
2 Protein purification

activity. In the early stages of purification (when the protein concentrationis relatively high) the proteolytic enzymes have a wide range of proteinsto act upon and the damage done to the target protein may be minimal.But during the later stages of purification, when the protein of interestbecomes a significant percentage of the total protein, any protease conta-mination will produce significant loss of yield. Bacterial contaminationcan be minimized by filtering chromatographic buffers through 0.2 µmmembranes and by regularly centrifuging the extracts at 13000 g for 20min (see Section 2.12). Co-purification of an endogenous proteinase can bechecked by assaying the fractions from a chromatographic run using aproteolytic assay (see Protocol 2.5). If this proteolytic assay shows positive,adjustments can be made to the chromatographic conditions to try toavoid co-elution, or additional proteolytic inhibitors can be added toprevent proteolysis or other protein (e.g. bovine serum albumin (BSA))included as a preferential substrate. The damage to target proteins due to proteolytic activity can be minimized by conducting the experimentsat 5–10°C.
Temperature and pH instability
Having determined the proteolytic profile of the extract, the temperaturestability of a protein can be established by incubation of the extract atdifferent temperatures over the period of a week. This should be deter-mined at the same time as buffer and pH compatibility. It may well bethat a protein can be stored at a different pH to the one that is requiredfor maximal activity. The effect of different buffers on the activity can alsobe determined (see Section 2.3).
Protein purification strategy and equipment 3
100
90
80
70
60
50
40
30
20
10
010 2 3 4 5 6 7 8 9 10
90% recovery ateach step
No. of handling steps
% Y
ield
75% recovery ateach step
Figure 1.1
The decrease in overall yield in a protein purification schedule as a function ofthe number of handling steps (assuming either a 90% or 75% recovery at eachstep).

Interfaces
Irreversible binding of the protein of interest may occur to the materials(glass, plastic and chromatographic resins) used in the purification process,particularly at the later stages of purification when the protein concen-tration is dilute. This can be reduced by silanizing the glassware and bythe inclusion of low levels of a non-ionic detergent such as 0.01% (v/v)Triton X-100. In addition, protein will be lost at air/liquid interfaces dueto the formation of soluble and insoluble aggregates, and great care mustbe taken to reduce foaming.
Divalent metal ions
Proteins that are exported from the cell can have a number of covalentdisulfide bridges present to help stabilize their tertiary structure. Otherproteins may have reduced sulfhydryl groups present on the surface of theprotein or at the active site of the protein. Divalent heavy metal ions cancovalently bind with reduced sulfhydryl groups, altering the surfaceproperties of a protein or causing an enzyme to be inactive. To avoid thisproblem the reagents and the water (ultrapure 18.2 MΩ·cm at 25°C) usedto make up chromatographic buffers should be of the highest grade possi-ble. In addition, the inclusion of a chelating agent (e.g. EDTA) which canbind divalent metal ions will reduce the problem.
1.4 Overview of protein structure
Primary structure
Proteins are polymers made from 20 amino acids each with a differentfunctional group. The content and sequence of the amino acids are deter-mined by the gene sequence for that protein. The arrangement of theamino acids in a protein sequence starting from the first amino acid atthe amino terminus and finishing at the carboxyl terminus is called theprimary structure.
Secondary structure
To lower the energy states of the primary structure of a protein, thesequence of amino acids may fold into areas of localized secondary struc-tures (e.g. α-helix and β-strands).
Tertiary structure
Proteins are synthesized on the ribosomes and as they emerge they arehelped to fold into their correct conformation by helper proteins calledchaperones. They help locate amino acids with hydrophobic functionalgroups into the core of the folded protein structure. Once the location ofthe hydrophobic amino acids has been satisfied, the rest of the proteinassumes its final shape, called the tertiary structure. The final structure is held together by weak noncovalent forces, including: hydrophobic
4 Protein purification

interactions, hydrogen bonding, van der Waals interactions and salt bridges.In this structure the amino acids with hydrophilic properties are in contactwith water and the amino acids with hydrophobic properties are awayfrom contact with water.
Quaternary structure
Some proteins, particularly proteins at key control points in a metabolicpathway, may be comprised of more than one polypeptide or a numberof the same polypeptides gathered together in an organized, predeter-mined superstructure. The arrangement of these groups of proteins isdescribed as the quaternary structure.
1.5 Properties of proteins that enable purification
There is a limited number of physical properties of proteins which can beutilized to aid purification.
Surface charge
The surface of proteins is covered with a charge contributed by aminoacids with side chains that have weak acid properties (see Sections 2.2, 2.3and 3.1). The charge on a weak acid depends upon the pH. The carboxylgroups on the amino acid side chains of aspartic (D) and glutamic (Q) acidhave little charge below pH 3.0 but are negatively charged at a physio-logical pH of around pH 7.0. The amino groups on the amino acid sidechains of lysine (K) and arginine (R) side chains have little charge abovepH 9.0 but are positively charged at a physiological pH of around pH 7.0.In addition, below pH 5.5 histidine (H) becomes positively charged(Appendix 3, ‘The single-letter code for amino acids’).
If oppositely charged amino acid side chains are in close proximity onthe protein’s structure they may form a salt bridge to help stabilize theprotein’s tertiary structure.
The scale of the charge on the surface of the protein is pH dependent.At a low pH the overall charge will be positive and at a high pH the overallcharge will be negative. There is a point on the pH scale at which thepositive charges on the protein surface are balanced by the negativecharges; at this point there is no overall charge on the protein. This pointon the pH scale is called the isoelectric point (pI) of a protein.
Because proteins arise from different genes they will have a variablenumber of amino acids with charged side chains, resulting in differentsurface charge and a variety of pI values.
These differences in charge can be exploited to resolve proteins in acomplex mixture.
Hydrophobic nature
There are eight amino acids with functional side groups with varying degreesof hydrophobicity: the aromatic amino acids tyrosine (Y), tryptophan (W)and phenylalanine (F); the aliphatic amino acids leucine (L), isoleucine (I),
Protein purification strategy and equipment 5

valine (V), alanine (A) and methionine (M). If not situated at the core of aprotein’s structure, they are usually hidden in pockets at the surface of aprotein by areas of charged amino acids. It is these pockets of surfacehydrophobic amino acids that can be exploited to purify a protein from acomplex mixture. Again, because proteins arise from different genes they willhave a different content of the eight hydrophobic amino acids and as suchpossess different degrees of hydrophobicity. These differences in surfacehydrophobicity can be exploited to resolve a protein from a complex mixture.
Solubility
Proteins are usually soluble in water because of the interaction between watermolecules and the hydrophilic/polar amino acids in their structure (differentproteins have a different content of hydrophilic/polar amino acids). Thesolubility of proteins in solution can be altered by temperature, pH and ionicstrength. At low salt concentrations proteins show increased solubility (‘saltingin’) but as the concentration of salt increases, proteins show differentialsolubility (‘salting out’) which can be used to fractionate complex proteinmixtures or concentrate dilute solutions of proteins (see Section 2.14).
Biospecificity
Proteins have evolved with a specific biological function, for example,enzymes have a stereospecific active site, making them very specific fortheir substrates. This biospecificity can be utilized in a protein purificationprotocol to isolate an individual protein from a complex mixture (e.g. asmall molecule such as glutathione attached to a Sepharose resin can beused to purify the enzyme glutathione S-transferase, or the relatively largeprotein G attached to agarose can be used to purify IgG from serum).
Molecular mass (Mr)
Different proteins have different numbers of amino acids and as such havea different molecular mass. The differences in size can be exploited toresolve a protein from a complex mixture.
Post-translational modifications
After translation, some proteins have additional groups added to alter thestructure of the original amino acid. For example, approximately 30% ofthe proteins present in a cell at any one time will have a phosphate groupattached to a serine, threonine or tyrosine residue. Another commonmodification is the attachment of sugar residues to arginine or serine.These modifications alter the size and surface charge of the originalprotein and can be utilized to isolate a protein from a complex mixture.
Engineering proteins to aid purification
If the gene for a protein is available it is possible to express the gene inanother organism to overproduce the protein of interest. The increase in
6 Protein purification

total amount of the protein of interest in the initial extraction aids purifi-cation and it is also possible to add components to the protein’s structurewhich promote the purification process (see Sections 4.7–4.9).
1.6 The range of techniques for protein purification
There is a wide variety of techniques which can be used in a purificationprocedure, the most popular of these techniques being covered in this book.
Charge
The techniques which exploit the charge on a protein’s surface include:ion exchange chromatography (IEX), chromatofocusing, hydroxyapatitechromatography (HA), nondenaturing polyacrylamide gel electrophoresis(PAGE) and preparative isoelectric focusing (IEF).
Hydrophobicity
The techniques which exploit the hydrophobic character of a proteininclude: hydrophobic interaction chromatography (HIC) and reversedphase chromatography.
Biospecificity
The techniques which exploit some aspect of biospecificity, post-translational modification or engineering include: affinity chromatography,covalent chromatography, immunoaffinity chromatography and immobi-lized metal affinity chromatography (IMAC).
Molecular mass
The techniques which exploit the molecular mass of a protein include:size exclusion chromatography (SEC), ultrafiltration and denaturing (in thepresence of the detergent sodium dodecyl sulfate (SDS)) polyacrylamidegel electrophoresis (SDS-PAGE).
1.7 Protein purification strategy
The human genome contains only approximately 30000 different genes butin excess of 400000 different proteins (the difference is due to alternativesplicing of genes and many different post-translational modifications, forexample glycosylation and phosphorylation). All these proteins have beenderived from 20 amino acids, of which four have a charge at physiologi-cal pH values. So it is unlikely that there are enough differences in thesurface charge of proteins to be able to isolate a target protein from acomplex mixture using this one physical property alone. Therefore apurification strategy based upon one physical property in exclusion of theothers is unlikely to succeed. A purification strategy which exploits oneproperty such as charge will result in a less complex mixture of proteinswith similar charge. However, the group of proteins in this less complex
Protein purification strategy and equipment 7

mixture will still have subtle differences in hydrophobicity, biospecificityand/or size. A strategy which uses a combination of techniques exploitingdifferences in charge, biospecificity hydrophobicity and/or size is morelikely to be successful.
To maximize the differences between different proteins, the selection oftechniques for a purification protocol should avoid overlappingtechniques. For example, if a protein mixture has been fractionated usingan anion exchange resin with a diethylaminoethyl (DEAE) functionalgroup, following this technique with another that exploits a protein’ssurface charge, such as an anion exchange resin using a quaternaryammonium functional group, is unlikely to produce the resolutionrequired. However, there can be merit in switching to a different size ofresin bead later in a purification schedule as this can yield benefits e.g. anIEX resin with a 50 µm bead diameter may be used in the early stages ofpurification, then in the later stages an IEX resin with a 5 µm bead diame-ter that will concentrate a dilute sample and provide improved resolutionof the eluted material.
At each stage it is well to remember the original aims of the experiment.If the protocol devised is cost effective and produces the desired level ofpurification, stop at this point. A lot of time can be spent making subtlechanges to a purification schedule with little or no benefit to the finalyield. There is no absolute prescribed order in the use of chromatographictechniques to purify a protein. However, some chromatographictechniques are best used early in the purification schedule and somechromatographic techniques are more effective in the later stages of apurification schedule. For example, SEC (see Section 5.1) is not the idealearly stage technique because it has relatively low capacity, medium tolow resolution and will also dilute the sample. For these reasons it isfavored later in a purification schedule after other techniques have beenemployed.
Of all the properties of a protein listed, only the exploitation of biospeci-ficity and engineering a protein for purification are likely to work in one-step purification. Affinity ligands can be expensive to produce and theymay require harsh elution conditions; for these reasons it is rare to use anaffinity resin without at least one prior enrichment step (IEX or HIC). Onthe other hand, proteins that have been engineered to be distinctive andexpressed as recombinant proteins are routinely purified effectively in aone-step process (see Sections 4.7–4.9).
Whatever technique is chosen, the resin should be evaluated in a seriesof small-scale experiments (see Protocol 3.1) for (a) binding conditions,and, after these have been established, (b) the total amount of the proteinof interest that can bind to 1.0 ml of resin (capacity). Again, in a series ofsmall-scale experiments preliminary elution conditions and the expectedyield can be established. These preliminary experiments will provide theinformation on the volume of resin required for a given amount of sampleas well as the approximate starting and elution conditions for thechromatographic run. After the initial chromatographic run, the condi-tions can be altered in subsequent runs to improve the ability of the resinto resolve the target protein from the complex mixture applied (resolu-tion). There will come a point, particularly in the early stages of a
8 Protein purification

purification schedule, when subtle alterations in the conditions will notsignificantly improve the resolution and another procedure will have tobe employed.
1.8 The process of protein purification
The general cytoplasmic environment is oxygen-free (reducing) and theprotein concentration is relatively high. After the initial extraction thecellular content is disgorged into the extraction buffer. The protein is nowdiluted (usually 5–10-fold) and put into an oxidizing environment(additives such as reducing agents can be added to overcome this problem:see Section 2.6). In addition, because eukaryotic cells are compartmental-ized (i.e. contain a nucleus, mitochondria, lysosomes etc.) the targetprotein for purification may come into contact with molecules it wouldnot normally encounter. These may inhibit the target protein or degradethe target protein. Therefore the initial procedure in a purification sched-ule should be a protein concentration step to remove water (the primarycontaminant at the early stage of purification) and low Mr inhibitors. Thetechniques that are best employed in this initial concentration stepinclude: salt precipitation (typically the use of ammonium sulfate: Section2.14), polyethylene glycol precipitation (Section 2.14), ultrafiltration(Section 2.14), and IEX chromatography (Sections 2.14 and 3.1). These techniques typically are easy to use, produce a good yield butusually have low resolving power. The role in this initial step in a purifi-cation schedule (whether in the laboratory or in industry) is to reduce thevolume of the extract that will be applied to subsequent chromatographicsteps.
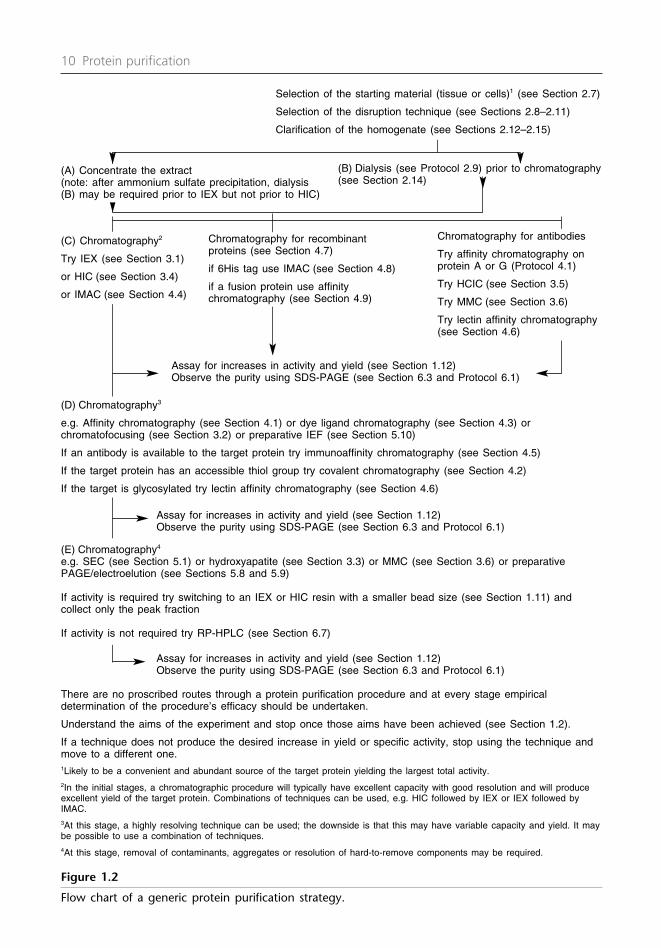
It is difficult to generalize on the purification of any protein, but Figure1.2 provides a general overview of a purification schedule with suggestionsfor the appropriate use of various techniques. The choice and order ofchromatographic steps depends upon the target protein – indeed someproteins can be purified using two chromatographic steps, although morethan two chromatographic steps are typically required for most proteinsbeing purified from crude extracts.
Having concentrated the protein from the initial extract, it is prudentto employ a technique that will have a high capacity, good resolution andproduce a good yield. There are several techniques demonstrating theseproperties, including IEX chromatography, HIC and IMAC. Combinationsof these techniques in columns of decreasing volume (as the total proteindecreases) and possibly of decreasing resin bead size may produce a prepa-ration that satisfies the initial aims of the experiment.
However, the above techniques in combination with others may notprovide the resolving power necessary to produce a homogeneous protein.It is quite often necessary to introduce a technique which exploits theunique character of the protein, to enable the target protein’s selectionfrom a complex mixture. The following techniques may be used for a high-resolution step: affinity chromatography, immunoaffinity chromato-graphy, chromatofocusing, preparative IEF or preparative PAGE. Theresolving power of these techniques is usually high but in some instancesthe methods used to elute proteins from these resins (see Section 4.1) can
Protein purification strategy and equipment 9
10 Protein purification
Assay for increases in activity and yield (see Section 1.12)Observe the purity using SDS-PAGE (see Section 6.3 and Protocol 6.1)
Assay for increases in activity and yield (see Section 1.12)Observe the purity using SDS-PAGE (see Section 6.3 and Protocol 6.1)
Assay for increases in activity and yield (see Section 1.12)Observe the purity using SDS-PAGE (see Section 6.3 and Protocol 6.1)
There are no proscribed routes through a protein purification procedure and at every stage empiricaldetermination of the procedure’s efficacy should be undertaken.
Understand the aims of the experiment and stop once those aims have been achieved (see Section 1.2).
If a technique does not produce the desired increase in yield or specific activity, stop using the technique andmove to a different one.1Likely to be a convenient and abundant source of the target protein yielding the largest total activity.2In the initial stages, a chromatographic procedure will typically have excellent capacity with good resolution and will produceexcellent yield of the target protein. Combinations of techniques can be used, e.g. HIC followed by IEX or IEX followed byIMAC.3At this stage, a highly resolving technique can be used; the downside is that this may have variable capacity and yield. It maybe possible to use a combination of techniques.4At this stage, removal of contaminants, aggregates or resolution of hard-to-remove components may be required.
(B) Dialysis (see Protocol 2.9) prior to chromatography(see Section 2.14)
Selection of the starting material (tissue or cells)1 (see Section 2.7)
Selection of the disruption technique (see Sections 2.8–2.11)
Clarification of the homogenate (see Sections 2.12–2.15)
Figure 1.2
Flow chart of a generic protein purification strategy.
(C) Chromatography2
Try IEX (see Section 3.1)
or HIC (see Section 3.4)
or IMAC (see Section 4.4)
Chromatography for recombinantproteins (see Section 4.7)
if 6His tag use IMAC (see Section 4.8)
if a fusion protein use affinitychromatography (see Section 4.9)
(E) Chromatography4
e.g. SEC (see Section 5.1) or hydroxyapatite (see Section 3.3) or MMC (see Section 3.6) or preparativePAGE/electroelution (see Sections 5.8 and 5.9)
If activity is required try switching to an IEX or HIC resin with a smaller bead size (see Section 1.11) andcollect only the peak fraction
If activity is not required try RP-HPLC (see Section 6.7)
(D) Chromatography3
e.g. Affinity chromatography (see Section 4.1) or dye ligand chromatography (see Section 4.3) orchromatofocusing (see Section 3.2) or preparative IEF (see Section 5.10)
If an antibody is available to the target protein try immunoaffinity chromatography (see Section 4.5)
If the target protein has an accessible thiol group try covalent chromatography (see Section 4.2)
If the target is glycosylated try lectin affinity chromatography (see Section 4.6)
Chromatography for antibodies
Try affinity chromatography onprotein A or G (Protocol 4.1)
Try HCIC (see Section 3.5)
Try MMC (see Section 3.6)
Try lectin affinity chromatography(see Section 4.6)
(A) Concentrate the extract(note: after ammonium sulfate precipitation, dialysis(B) may be required prior to IEX but not prior to HIC)

be harsh. This may result in irreversible denaturation of the majority of thetarget protein and hence significantly reduce the yield of active material(this can be a problem if the aim is kinetic analysis but may not beproblem if the aim is raise antibodies to the target protein).
Towards the end of a purification schedule, as the total protein concen-tration starts to drop, the percentage losses of a target protein can easilyreach double figures. There is always the temptation to try one method,but the introduction of additional steps in these later stages will onlyaccelerate the loss of active material. It is at this stage in the purificationprocess that the aims of the experiment have to be reviewed. If a compro-mise position is not acceptable, other techniques can be employed toremove low levels of trace contaminants, including: SEC (Section 5.5),hydroxyapatite (Section 3.3), reversed phase chromatography (RPC) (notethat RPC may denature the target protein; see Section 6.7) and PAGE(Section 6.3). It should be noted again that, depending on the targetprotein, these techniques can be employed earlier in a purification sched-ule. For example, SEC will dilute the sample, has limited capacity andresolving power, so it is a technique best employed towards the end of apurification schedule.
1.9 The theory of chromatography
Chromatography (‘colored writing’) was first described by Mikhail Twsett in1903 when separating plant pigments using calcium carbonate. Allcompounds have different properties which influence their interactionwith different phases (solid, liquid or gas). When compounds are placedin contact with two immiscible phases they will distribute themselvesbetween the two phases as a result of their different properties. The distri-bution or partition coefficient (Kd) of a compound between two immisciblephases (X and Y) is constant at a given temperature and can be measured.
Kd =concentration of the compound in phase X
concentration of the compound in phase Y
All chromatography is based upon the partition or distribution of acompound between two immiscible phases, a stationary phase (usually asolid or a liquid) and a mobile phase (liquid or a gas) which flows overand/or through the stationary phase. If a mixture of compounds is appliedto a chromatography column they will distribute between the immisciblephases according to their Kd values.
In partition chromatography the continuous introduction of freshmobile phase will promote new distributions between the mobile andstationary phases. The result is that during a chromatographic run,compounds will be continuously moving between the two immisciblephases (stationary and mobile) as they progress down the column. Somecompounds will preferentially distribute with the mobile phase emergingearly, others will prefer to distribute with the stationary phase emerginglater in the chromatographic run. They will be separated because theyhave different Kd values. Compounds emerge from a chromatographiccolumn in a ‘normal’ distribution.
Protein purification strategy and equipment 11
1.10 Equipment required for protein purification
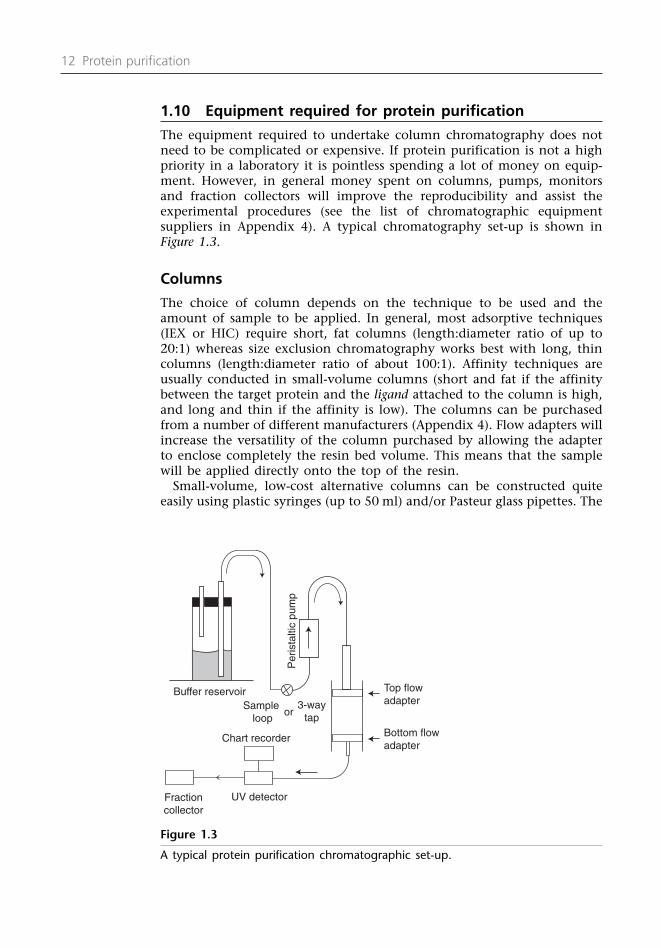
The equipment required to undertake column chromatography does notneed to be complicated or expensive. If protein purification is not a highpriority in a laboratory it is pointless spending a lot of money on equip-ment. However, in general money spent on columns, pumps, monitorsand fraction collectors will improve the reproducibility and assist theexperimental procedures (see the list of chromatographic equipmentsuppliers in Appendix 4). A typical chromatography set-up is shown inFigure 1.3.
Columns
The choice of column depends on the technique to be used and theamount of sample to be applied. In general, most adsorptive techniques(IEX or HIC) require short, fat columns (length:diameter ratio of up to20:1) whereas size exclusion chromatography works best with long, thincolumns (length:diameter ratio of about 100:1). Affinity techniques areusually conducted in small-volume columns (short and fat if the affinitybetween the target protein and the ligand attached to the column is high,and long and thin if the affinity is low). The columns can be purchasedfrom a number of different manufacturers (Appendix 4). Flow adapters willincrease the versatility of the column purchased by allowing the adapterto enclose completely the resin bed volume. This means that the samplewill be applied directly onto the top of the resin.
Small-volume, low-cost alternative columns can be constructed quiteeasily using plastic syringes (up to 50 ml) and/or Pasteur glass pipettes. The
12 Protein purification
Top flowadapterSample
loop
Chart recorder
UV detectorFractioncollector
3-waytap
Per
ista
ltic
pum
p
Buffer reservoir
or
Bottom flowadapter
Figure 1.3
A typical protein purification chromatographic set-up.
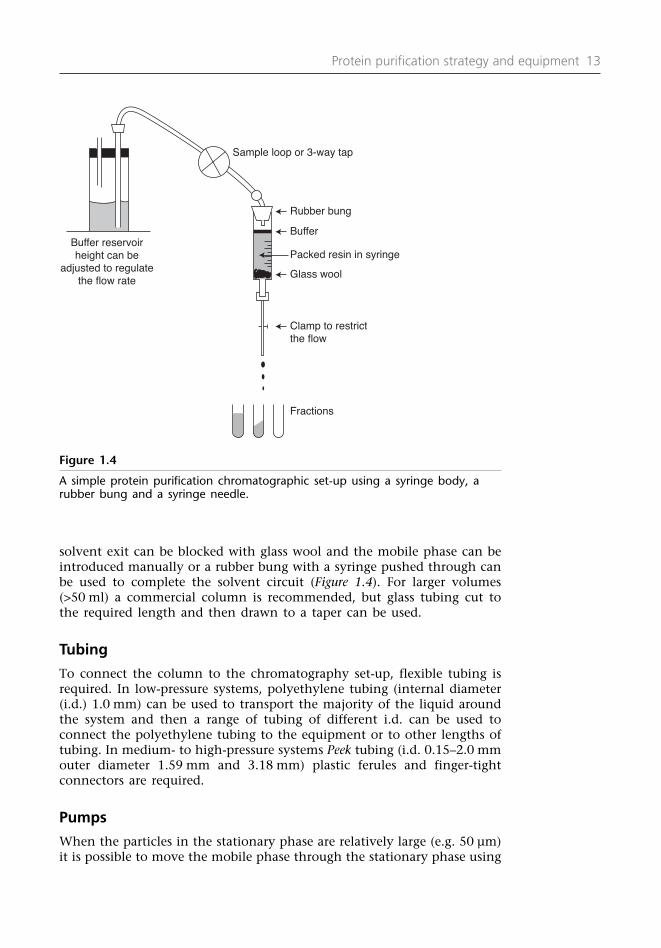
solvent exit can be blocked with glass wool and the mobile phase can beintroduced manually or a rubber bung with a syringe pushed through canbe used to complete the solvent circuit (Figure 1.4). For larger volumes(>50 ml) a commercial column is recommended, but glass tubing cut tothe required length and then drawn to a taper can be used.
Tubing
To connect the column to the chromatography set-up, flexible tubing isrequired. In low-pressure systems, polyethylene tubing (internal diameter(i.d.) 1.0 mm) can be used to transport the majority of the liquid aroundthe system and then a range of tubing of different i.d. can be used toconnect the polyethylene tubing to the equipment or to other lengths oftubing. In medium- to high-pressure systems Peek tubing (i.d. 0.15–2.0 mmouter diameter 1.59 mm and 3.18 mm) plastic ferules and finger-tightconnectors are required.
Pumps
When the particles in the stationary phase are relatively large (e.g. 50 µm)it is possible to move the mobile phase through the stationary phase using
Protein purification strategy and equipment 13
Rubber bung
Sample loop or 3-way tap
Buffer reservoirheight can be
adjusted to regulatethe flow rate
Buffer
Glass wool
Packed resin in syringe
Clamp to restrictthe flow
Fractions
Figure 1.4
A simple protein purification chromatographic set-up using a syringe body, arubber bung and a syringe needle.

hydrostatic pressure. The flow rate of the mobile phase can be regulated byadjusting the height of the buffer reservoir relative to the column outlet.However, for ease of use and for consistently delivered variable flow rates,a peristaltic or piston pump is recommended. At smaller bead diameters(≤20 µm) medium- to high-pressure pumps are required to move thestationary phase through the column.
Fraction collectors
When a complex protein mixture is applied to the resin in a column itwill be fractionated during the chromatographic run. The volume of thechromatographic run emerging from the column outlet can be dividedinto fractions. Manually collecting 50 ml fractions on 500 ml total volumeis not too onerous but the same cannot be said if the same volume is tobe divided into fractions of 5.0 ml or less. Fraction collectors are availablewhich will collect in excess of 100 fractions on a volume or time basis. Inaddition, there is usually the facility to collect the chromatographic runinto tubes of different sizes and formats (0.25 ml (96-well) microtiterplates, 1.5 ml microtubes, test tubes and bottles).
Monitors
Most proteins absorb light at 280 nm due to the amino acids tyrosine andtryptophan being present in a protein’s primary structure. The fractionscollected throughout a chromatographic run can be analyzed for theprotein by manually measuring the absorbance of each fraction at 280 nm(A280) against an appropriate buffer blank. But it is more convenient toallow the volume emerging from the column outlet to flow through anultraviolet (UV) monitor to display continuously the changing proteinconcentration on a chart recorder or data management system. Themonitors emit UV light and a filter is used to select the wavelength of280 nm.
Gradient makers
A number of chromatographic procedures (including IEX and HIC) requirechanges in salt concentration to elute bound protein. This can beperformed by passing a buffer with one concentration of salt through thecolumn and collecting the eluted protein. The salt concentration can thenbe altered and the process repeated. Fractions are then collected through-out this isocratic elution of the column.
A gradient maker can be used to generate a gradual continuous changein salt concentration presented to the column. They can be purchased (orconstructed – see Figure 1.5) and consist of two reservoirs of equal diame-ter connected by a clamped tube in the middle. The tube with the startconditions should be stirred and when the flow rate starts the clampconnecting the two reservoirs is removed. As liquid is pumped from thereservoir with the start conditions, it is replaced by liquid from the end-conditions reservoir. Thus the salt concentration in the start-conditionsreservoir gradually changes. Alternatively, chromatography systems with a
14 Protein purification

binary pumping system will generate a gradient by proportionally mixingthe start- and end-condition buffers prior to pumping the buffer onto theresin.
1.11 Protein purification chromatographic runs
Whatever technique is employed in purification strategy, all chromato-graphic runs follow a set of separate but interrelated stages.
Starting conditions
Prior to embarking on a chromatographic run, it is a good idea to spendsome time getting to know the protein you are working with. This willprovide valuable information on some of the protein’s properties. Theseproperties will then provide a guide to the starting conditions of thechromatographic run. Properties such as the pH optimum for catalyticactivity, pH optimum for storage, thermal stability, the proteolytic profileof the extract and the effect of activators and inhibitors on these proper-ties can be evaluated in small-scale experiments to guide the startingconditions for a chromatographic run (see Protocol 3.1).
Protein purification strategy and equipment 15
End condition buffer Starting condition buffer
Clamp(A)
Clamp(B)
(i) Add the liquid and start the stirrer(ii) Release clamp (A) and then clamp (B)
Measuringcylinders
To column
Plastic tubingMagnetic
stirrer
Figure 1.5
An easy-to-construct gradient-former for use in the gradient elution of proteinsfrom chromatographic resins.

Pre-equilibrate the resin
Chromatographic resins are usually stored at 4°C in a bactericide/fungicide(e.g. 0.1% (w/v) Thiomersol; 0.05% (w/v) sodium azide or 20% (v/v)ethanol). The preservative needs to be removed and the resin needs to beequilibrated in a buffer which encourages the protein of interest to bindto the resin, for example a low-salt buffer for IEX or a high-salt buffer forHIC. This can be conveniently achieved by using a Buchner flaskconnected to a vacuum to which a funnel with a sintered glass mesh isattached.
The chromatographic resin can be poured onto the glass mesh and thevacuum started. The preservative is quickly removed and the resin canthen be washed in start buffer. Allow the vacuum to remove most of thebuffer and then switch off the vacuum.
Re-suspend the resin in start buffer (2 × the resin volume) and allow theresin to settle. Particles that do not settle (‘fines’) should be removed byaspiration. If the fines are not removed they can lodge themselves intospaces in the resin. This will increase the back pressure and may block theflow of the mobile phase. Once the fines have been removed the resin canbe degassed (to remove dissolved gas from the buffer/resin slurry) undervacuum before being packed into the column.
Assembly of the column and pouring the resin
Prior to the assembly of the column it is recommended that the mesh atthe ends of the column (or flow adapters), which prevents the resin fromleaving the column, are checked for tears and cleaned by sonication inwater (or if visibly dirty sonicate first in 5% (w/v) SDS in 0.1 M NaOH andthen in water) for 5 min.
The assembled chromatographic column should be checked for leaks atthe seals and the connections to the tubing using water. Once the integrityof the column has been verified, a small volume of start buffer should beplaced in the bottom of the column and run from the outlet to liberatetrapped air beneath the mesh. Additional start buffer can then be addedto cover the end mesh.
The column should be tilted at an angle and the degassed resin slurryintroduced to the column by running the slurry down the sides of thecolumn until it is full. The column should be placed in a verticalposition and the resin packed into the column at a flow rate margin-ally faster than the anticipated flow rate for the experimental run (thiswill prevent a reduction in the column’s volume when the sample isapplied). Remember that the resin has been introduced to the columnas a slurry (i.e. there is more liquid than resin) and this may require theintroduction of more resin from the slurry to achieve the required bedvolume.
When the required bed volume has been packed, the flow of liquid isstopped and the upper column connector can be attached. Take care atthis stage to insure that there is no air trapped within the system. Theresin within the column can then be equilibrated with the starting buffer(five to 10 column volumes) at the required experimental flow rate.
16 Protein purification

The column should ideally be packed at the temperature at which thechromatographic run is to be conducted. The choice of temperature willbe guided by the thermal stability of the enzyme, the estimated run timeand the presence of proteolytic enzymes, particularly in crude extracts.Most modern resins have quite rigid structures which allow relatively highflow rates. This significantly reduces chromatographic run times and mostexperiments can be conducted at room temperature. If the target proteinis particularly unstable, the chromatographic run should be conducted ina cold environment.
Application of the sample
After the resin has been equilibrated with the starting buffer, and ifthere are no leaks, the sample can be applied either through an in-linethree-way valve or using a sample loop (Figure 1.2). If a large volume ofsample is to be applied, stop the pump delivering the start buffer, trans-fer the start buffer tube to the sample and use the pump to apply thesample to the column (take care to avoid air bubbles when transferringthe tube between buffer and sample). When the sample has beenapplied, stop the pump and reconnect the system to the start buffer. Assoon as the sample has been applied to the top of the column, fractionsfrom the column outlet should be collected throughout the chromato-graphic run.
In general, smaller diameter (3–15 µm) resin beads will improve theresolution. This is because, as the diameter of the bead decreases, morebeads can be packed into the column, which increases the volume avail-able for proteins to interact/partition into. The columns with smaller-diameter beads need higher pressures to move the liquid through thecolumn and require medium- to high-pressure pumping systems.
Flow rates and elution of the sample
Flow rates are usually measured in ml min–1 which is fine for individualexperiments but to compare chromatographic runs made of the samesample on different columns a linear flow rate (cm h–1) is used.
Linear flow rate (cm h–1) =flow rate (ml min–1) × 60
cross-sectional area of the column (cm2)
The sample will interact with the selected resin and as a result of the startconditions some protein will bind to the resin. Other proteins will notinteract and will percolate through the column as unbound material. Theunbound material should be eluted from the column using the start bufferuntil the absorbance at 280 nm of the unbound eluate reaches abackground level. The elution conditions can then be applied and theeluted protein should be collected in fractions.
Note: Never assume that the chromatographic run has worked even if ithas worked for the previous 10 runs. Remember to keep all the fractions(including the unbound fractions) until you are absolutely sure whatfraction(s) the target protein has eluted in.
Protein purification strategy and equipment 17

Regeneration and storage of the resin
The resin within the column can then be washed according to themanufacturer’s instructions and re-equilibrated in the start conditionsready for another run.
If the column is not to be reused for a period of time, it may be disman-tled and the resin stored in preservative. Alternatively, the column shouldbe washed with two column volumes of water followed by two columnvolumes of a preservative.
The eluted fractions: The fractions collected should be assayed for theprotein of interest (enzyme assay or antibody) and the peak fraction(s)identified and pooled. The volume, the protein concentration (seeProtocols 2.1, 2.2 or 2.3) and the activity of the pooled fractions shouldbe measured. The information obtained can then be recorded on thepurification balance sheet (Table 1.1).
In addition to measuring the percentage yield and fold purity at eachstage, it may be expedient to determine the purity by other techniques.The most popular method is denaturing (in the presence of the detergentsodium dodecyl sulfate SDS) polyacrylamide gel electrophoresis (PAGE). Asingle polypeptide band on an SDS-PAGE gel stained with Coomassie bluedye is usually taken to be good indication of a homogeneous preparation(see Section 6.3). But it should be remembered that SDS-PAGE separatespolypeptides by Mr. A single band on an SDS-PAGE gel does not neces-sarily mean a homogeneous preparation because contaminants of a similarMr may have co-purified with the target protein of interest or because thecontaminants are present at low levels not detectable with the stain. It ispossible to load a gel with increasing amounts of the ‘homogeneous’protein to try to visualize the presence of these low levels of contaminantsor to switch to a more sensitive stain (e.g. silver stain: see Protocol 6.2).An alternative approach is to run the ‘homogeneous’ preparation on adifferent electrophoretic or chromatographic technique, for examplenondenaturing PAGE, capillary electrophoresis (CE), isoelectric focusing(IEF) or reversed phase chromatography. A single band on SDS-PAGE atdifferent loadings and a single band on nondenaturing PAGE or IEF (or asingle peak after reversed phase chromatography) is a very good indica-tion of the homogeneity of the preparation.
1.12 Information required for a protein purificationbalance sheet
A protein purification balance sheet (Table 1.1) provides the data neces-sary to measure the efficacy of the chromatographic (electrophoretic)technique used. It contains information on the volume, the proteinconcentration and the biological activity (an assay can be used to deter-mine the presence of the target protein) relative to the amount of proteinpresent (specific activity). It provides data on the yield (percentage recovery i.e. how much remains after a chromatographic technique whenthis is compared with the amount present in the starting material) andthe degree (fold) of purification (a measure of the increase in specificactivity after the chromatographic procedure).
18 Protein purification
The following calculations are required to complete a protein purifica-tion balance sheet and examples can be found in Exercise 1.1.
The activity (enzymic and protein) in the initial (crude) extraction (Step1) represents the maximal amount of activity that can be worked withduring the purification schedule. The value for percentage yield in thecrude extract is 100% and the value for fold purity is 1. Therefore theinformation gained for percentage yield and the degree of purification insubsequent steps are relative to the activity and protein determined in theinitial extract. In an ideal world the percentage yield will remain close to100% and the degree of purification will increase rapidly. Please note thatit can be common to find an increase in the percentage yield (i.e. >100%)in the purification step following the initial extraction. This may be dueto conflicting enzyme activities or the presence of inhibitors in the initialextract which are subsequently removed during the first purification step.The net result is an underestimation of the total activity in the initialextract and this is not a cause for concern.
Specific activity (SA) (units mg–1 protein) =
target protein (total units* of activity in a fraction)
total protein in a fraction protein (mg)
Total protein (TP) = protein mg ml–1 × volume (ml)
Total activity (TA) = units* mg–1 protein (SA) × total protein (TP)
Protein purification strategy and equipment 19
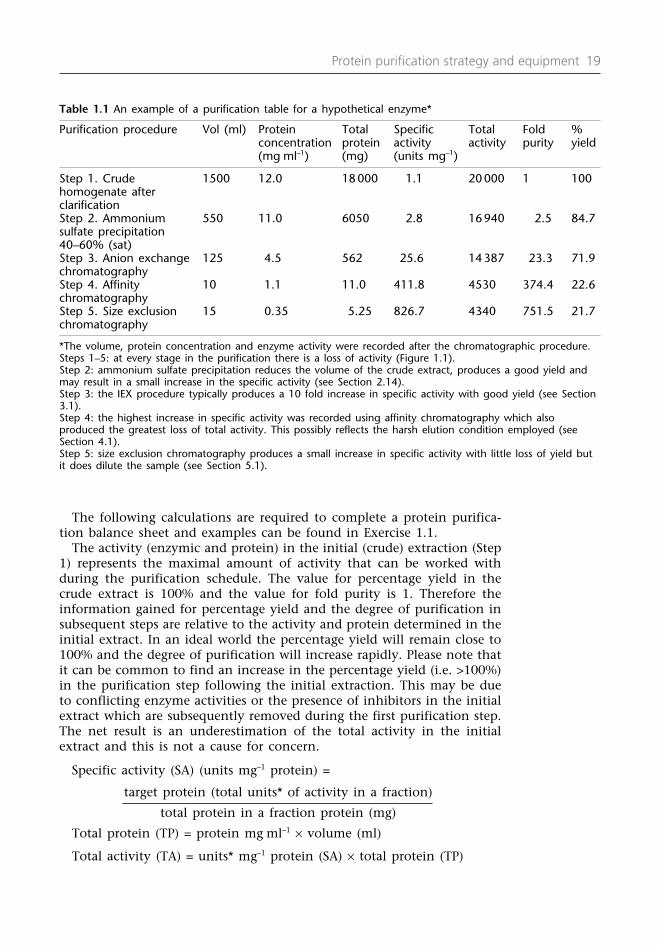
Table 1.1 An example of a purification table for a hypothetical enzyme*
Purification procedure Vol (ml) Protein Total Specific Total Fold % concentration protein activity activity purity yield(mg ml–1) (mg) (units mg–1)
Step 1. Crude 1500 12.0 18 000 1.1 20 000 1 100homogenate afterclarificationStep 2. Ammonium 550 11.0 6050 2.8 16 940 2.5 84.7sulfate precipitation40–60% (sat)Step 3. Anion exchange 125 4.5 562 25.6 14387 23.3 71.9chromatographyStep 4. Affinity 10 1.1 11.0 411.8 4530 374.4 22.6chromatographyStep 5. Size exclusion 15 0.35 5.25 826.7 4340 751.5 21.7chromatography
*The volume, protein concentration and enzyme activity were recorded after the chromatographic procedure.Steps 1–5: at every stage in the purification there is a loss of activity (Figure 1.1). Step 2: ammonium sulfate precipitation reduces the volume of the crude extract, produces a good yield andmay result in a small increase in the specific activity (see Section 2.14).Step 3: the IEX procedure typically produces a 10 fold increase in specific activity with good yield (see Section3.1).Step 4: the highest increase in specific activity was recorded using affinity chromatography which alsoproduced the greatest loss of total activity. This possibly reflects the harsh elution condition employed (seeSection 4.1).Step 5: size exclusion chromatography produces a small increase in specific activity with little loss of yield butit does dilute the sample (see Section 5.1).

Degree of purification (fold purity) = SSAA
SStteepp
21
Yield (% recovery) = TT
AA
SStteepp
21
× 100
(*see Exercise 1.1 and Section 2.4)
Further readingBeynon RJ and Easterby JS (1996) Buffer Solutions. Biosis, Oxford.Cameselle JC, Cabezas A, Canales J, Costas MJ, Faraldo A, Fernandez A, Pinto RM
and Ribeiro JM (2000) The simulated purification of an enzyme as a ‘dry’practical within an introductory course of biochemistry. Biochem Educn 28:148–153.
Cutler P (ed) (2004) Protein Purification Protocols, 2nd edn. Humana Press, Totowa,NJ.
Deutscher MP (ed) (1990) Guide to protein purification. Meth Enzymol 182.Academic Press, London.
Garrat RH and Grisham CM (2005) Biochemistry, 3rd edn. Thomas Brooks/Cole,Belmont, CA.
Roe S (ed) (2001) Protein Purification: Methods, 2nd edn. Oxford University Press,Oxford.
Rosenberg IM (2005) Protein Analysis and Purification, 2nd edn. Birkhauser, Boston.
Reference1. Berg JM, Tymoczko JL and Stryer L (2006) Biochemistry, 6th edn. WH Freeman,
New York.
20 Protein purification

Exercise 1.1Protein purification practicecalculations
(Quote your answers in international enzyme units (I.U.) i.e. 1 unit = 1 µmol product formedmin–1.)
The aspartate kinase (E.C. 2.7.2.4) assay is based upon the conversion of unstable β-aspartylphosphate to stable β-aspartyl hydroxamate.
The molar absorption coefficient at 550 nm (ε505) = 750 M–1 cm–1.
Three different 50 g of carrot suspension cell cultures in mid-log phase were harvested bycentrifugation to be analyzed for aspartate kinase activity.
• The carrot cells pellets were resuspended in 150 ml of 50 mMTris/HCl buffer pH 7.5 containing: a reducing agent 5 mM DTT,a chelating agent 5 mM EDTA, and four proteolytic enzymeinhibitors 1 mM PMSF, 1 mM E64, 100 µM leupeptin and 100 µMpepstatin. The cell paste was divided into three equal amountsand then disrupted using either sonication, a blender or frozenin liquid nitrogen before being ground with acid washed sandin a mortar and pestle.
• The extracts were clarified by centrifugation at 13000 g for 20min to remove cell debris.
• The extraction volumes, protein concentrations and enzymeactivities were determined.
• The crude enzyme (25 µl) was assayed with buffer and substratein a total volume of 1.0 ml at 37°C for 15 min incubation (1.0 mlcuvette was used with a 1.0 cm path length).
The volume, protein concentration and aspartate kinase activity after three different extractionprocedures
Extraction procedure Volume (ml) Protein (mg ml–1) A550 after 15 min
(A) Sonication 172 0.35 0.06
(B) Blender 225 8.67 0.34
(C) Liquid N2/acid washed sand in a 196 9.55 0.103mortar and pestle
Question: Calculate total protein, total activity and specific activity for each of the abovetechniques and complete the table below.
Protein purification strategy and equipment 21

Extraction procedure Total protein Specific activity Total activity (mg) (units mg–1 of protein) (units)
(A) Sonication* 60.2 0.61 36.72
(B) Blender
(C) Liquid N2 and acid washed sand
*See example calculation.
Question: What is the most appropriate disruption technique for this carrot cell culture and whyis it the most appropriate technique?
(Answers in Appendix 2.)
EXAMPLE CALCULATION FOR PROTEIN PURIFICATION ASSIGNMENT, FOREXAMPLE SONICATIONThe molar absorptivity coefficient (ε) at 550 nm (ε505nm) = 750 M–1 cm–1
For the sonication extract the change (∆) in A505 over 15 min = 0.06
or: 0.06/15 = ∆A505 0.004 min–1
THE BEER–LAMBERT LAW (SEE GLOSSARY AND CHAPTER 2) A = LεC0.004 = 1 × 750 × C
0.004/750 = C
0.0000053 = C (mol l–1) min–1
or 5.3 µM min–1 (i.e. µmol in 1000 ml or nmol ml–1).
The cuvette volume is not a liter but 1.0 ml. Therefore in the cuvette we have 5.3 nmol ofproduct formed min–1.
The international units of enzyme activity: 1 unit of enzyme activity = 1 µmol of product formed(or substrate consumed) min–1. These units should be used throughout the following calcula-tions.
Units ml–1: 0.0053 units were produced from 25 µl of crude enzyme extract or 0.0053 × 40 =0.212 units ml–1 of extract.
The protein concentration in the extract is 0.35 mg ml–1.
Specific activity (SA)† (units mg–1 protein) =target protein (units ml–1)
protein (mg ml–1)
SA = 00.2.3152
SA = 0.61 units mg–1 protein
Total protein (TP) = mg ml–1 × total volume
0.35 × 172 = 60.2 mg
22 Protein purification

Total activity (TA) = (SA × TP) 0.61 × 60.2 = 36.72 units.
†The specific activity can be enzyme units or another method of quantifyingthe amount of the target protein in a fraction relative to the other proteins.
Specific activity (SA) can also be calculated as Total activity (TA)/Total protein(TP).
Protein purification strategy and equipment 23


2.1 Introduction
It is quite likely that, as a result of preliminary investigation in crudeextracts, a decision is a taken to purify the protein of interest. But beforeembarking on chromatographic procedures a limited period of time shouldbe invested in answering a few basic questions and determining a numberof parameters.
A suitable assay for the target protein and a convenient protein assayare two fundamentals that have to be addressed early. Bearing in mindthat a chromatographic run may generate many tens of fractions, an assaythat is easy to perform will allow speedy processing of results and limitthe sample storage time between chromatographic runs. The choice ofassay will depend on the target protein but it is possible to use an indica-tive assay to focus on the fractions containing the target protein and thenuse a more complex assay for the pooled fractions. The assay does notneed to be based upon biological activity, for example an antibody can beused to identify a protein of interest.
The information obtained from this groundwork will pay dividendswhen decisions have to be made on the choice of resin andstarting/elution conditions for chromatography.
2.2 Acids and bases
Brønsted proposed that acid–base reactions involve the transfer of an H+
ion (proton). A Brønsted acid is a proton donor and a Brønsted base is aproton acceptor. Every Brønsted acid has a conjugate base and the sameis true for the Brønsted base, for example:
HCl + H2O ↔ H3O+ + Cl–
acid base acid base
Acids are often referred to as being ‘strong’ or ‘weak’ and a measure of thestrength of an acid is the acid-dissociation equilibrium/dissociationconstant (Ka) for that acid.
HA + H2O ↔ H3O+ + A–
acid base acid base
Ka =[H3
[OH
+
A][]A–]
A strong acid (proton donor) readily dissociates at all pH values and hasa high Ka value (HCl: Ka = 1 × 10³), whereas a weak acid has a small Ka
value (CH3COOH: Ka = 1.8 × 10⁻⁵) and its dissociation is pH dependent;for example:
Groundwork 2

(a) HCl H+ + Cl– Strong acid dissociation(dissociates from pH 0 to 14)
(b) CH3COOH H+ + CH3COO– Weak acid dissociation(pH <3.0) (Starts to dissociate at pH = 3.0 and is fully dissociated at pH >7.0)
2.3 Buffers
Proteins have pH optima for their activity and storage; outside these pHvalues a protein may become denatured and inactivated. Therefore inbiology maintaining the pH of a solution is vitally important. A buffer(Table 2.1) can maintain the pH of a solution by soaking up or releasingprotons upon the addition of an acid or an alkali.
A buffer solution is composed of a weak acid and one of its salts (conju-gate base) or a weak base and one of its salts (conjugate acid). TheHenderson–Hasselbalch equation can be used to determine the quantita-tive aspects of buffers.
pH = pKa + log10 [[HAA
–]]
where [A–] is the concentration of base and [HA] is the concentration ofacid. The square brackets usually mean molar concentration but, because[A–]/[HA] is a ratio, any concentration unit will suffice.
It is the [A–]/[HA] ratio which determines the pH of a solution, whenthe acid concentration is equal to the base concentration pH = pKa andbuffers are most effective at their pKa. When [acid] > [base] the pH of thebuffer is less than the pKa and when the [base] > [acid] the pH is greaterthan pKa. The [A–]/[HA] ratio can only be varied within certain limits,usually to 1.0 pH unit either side of the pKa value. This means that thereis little or no buffering at the extremes of the buffering range and it may
26 Protein purification
Table 2.1 A list of common buffers and their effective pH range
Buffer pKa Effective buffer range
Maleate 1.97 1.2–2.6Glycine–HCl 2.35 2.2–3.6Citric acid/Na2HPO4 Citrate: 3.13, 4.76, 6.40 2.6–7.6
Phosphate: 7.20Acetate/CH3COOH 4.76 3.6–5.6MES 6.10 5.5–6.7bis-Tris–propane 6.46 5.8–7.2PIPES 6.76 6.1–7.5MOPSO 6.87 6.2–7.6NaH2PO4/Na2HPO4 7.20 5.8–8.0HEPES 7.48 6.8–8.2Triethanolamine 7.76 7.0–8.3Tricine 8.05 7.4–8.8Tris–HCl 8.06 7.5–9.0BICINE 8.26 7.6–9.0CHES 9.50 8.6–10.0CAPS 10.40 9.7–11.1Na2CO3/NaHCO3 10.33 9.0–10.7

be necessary to increase the concentration of the buffer to maintain goodbuffering capacity or switch to a different buffer. The components of somebuffers (e.g. citrate/phosphate) have several pKa values which allow buffer-ing over a wider pH range.
Points to remember about buffers
• Avoid the temptation to adjust the pH of a buffer with strong acids orbases (unless they are integral in the buffer) as this will mop up theavailable buffering capacity. Make minor adjustments to the pH withconcentrated solutions of either the acid or base component of thebuffer. This will slightly increase the buffer concentration but willmaintain the buffering capacity.
• The pKa value for buffers can vary with temperature (e.g. pKa of Tris at4°C is 8.8 and 8.3 at 20°C). Equilibrate the buffer to the temperature atwhich it is to be used before adjusting the pH.
• Components (e.g. EDTA) added to a buffer may alter the pH, so adjustthe pH after the additions have dissolved.
• For convenience make 10–100-fold stock solutions of the buffer anddilute to the required concentrations before use. The pH should notalter after dilution but check before using the buffer.
• Dissolve the buffer components in the highest grade of water available.• Before using a buffer for chromatography, filter the buffer through a
0.2 µm membrane to remove particulate matter and trace bacterialcontamination.
• Check that the buffer is compatible with the target protein. Phosphatewill form insoluble complexes with some divalent metal ions(phosphate buffers should be avoided with enzymes that require Ca2+ atphysiological pH values) and borate will form complex with hydroxylgroups (borate buffers should be avoided with glycoproteins).
2.4 Assay to identify a target protein
If the target protein is an enzyme then a few factors have to be taken intoaccount when designing an assay. If the enzyme requires cofactors theseshould always be included in the assay in excess.
Temperature
The rate of any chemical reaction can be approximately doubled by a 10°Crise in temperature, but proteins are liable to denaturation above a criti-cal temperature. The forces that hold a protein together (hydrogen bonding,ionic bridging, van der Waals interactions and hydrophobic interactions) areindividually relatively weak but collectively the combination of these weakforces enables proteins to maintain their tertiary structure. These weakforces can be easily broken down by an increase in heat. The choice oftemperature for an enzyme assay is a balance between a temperaturewhich enables an efficient rate of reaction but does not immediatelydenature the target enzyme. The chosen temperature must allow theenzyme to be active throughout the duration of the assay.
Groundwork 27

Most enzymes (including plant and bacterial enzymes) are thermallysemi-stable between 30 and 40°C, that is, protein structure can toleratetemperatures up to 40°C enabling increased reaction rates, but above 40°Cprotein structure starts to unravel. To enable the fractions from achromatographic run to be processed quickly, an enzyme assay should berun at as high a temperature as can be tolerated by the target enzyme.This can be determined empirically by incubating a clarified (centrifuga-tion at 13 000 g for 20 min) extract at different temperatures (e.g. 10, 20,30, 40, 50, 60 and 70°C) for 5–10 min before cooling the extract to beassayed at the normal assay temperature. A plot of specific activity againsttemperature will indicate the temperature above which the target enzymebecomes terminally inactivated
pH
The pH at which an enzyme is maximally active in vitro may not matchthe pH that the enzyme normally experiences in vivo. But in assayingfractions after a chromatographic run the conditions which encouragemaximum activity should be employed. This is important particularly inthe latter stages of a purification schedule when protein concentrationsmay drop dramatically. Different buffers may suit different enzymes anda range of buffers (Table 2.1) should be tested at the target enzyme’s pHoptimum.
Substrate concentration
Michealis–Menten equation:
v0= [SV
0
m
]a
+x[S
K0]
M
When the substrate concentration [S0] is equal to the KM value:
v0= [K
V
M
m
]ax
+[K
[M
K]
M]
v0= Vm
2a
Kx[
M
KM]
v0= V
2max
that is, the velocity (v0) is 50% of Vmax when the substrate concentration[S0] is equal to the KM value.
When the substrate concentration [S0] is equal to a concentration 10times the KM value.
v0 = [K
V
m
m
]ax
+[1
[01K0
M
K]
M]
v0 = Vma
1x
1[1K0
M
KM]
v0 = 10
1V1max
28 Protein purification

i.e. the velocity (v0) is 90.1% of Vmax when S0 is equal to 10 times the KM
value.The Michealis–Menten equation demonstrates that the maximum veloc-
ity cannot be reached and that saturating levels of substrate concentrationcan only be achieved at infinite substrate concentrations. In practice it isimpossible to feed substrates into a reaction at such high concentrationsdue to solubility problems and expense. Substrate concentrations set at5–20-fold higher than the KM value (near saturating concentrations)usually ensure efficient catalysis.
When the substrate concentration in an assay is fixed at near saturat-ing levels the initial rate of an enzyme-catalyzed reaction is directlyproportional to the enzyme concentration. There should be a linearrelationship between the enzyme concentration and the rate of reaction.
Enzyme activity is measured in international units (I.U.) which are equalto 1 µmol of product formed (or substrate consumed) min–1 at a giventemperature (usually 25°C). Another measure of enzyme activity is the S.I.unit ‘katal’ which is defined as 1 mol of product formed (or substrateconsumed) s–1 at a given temperature (usually 25°C).
For some enzymes international units are not always appropriate andin this case it is usual to define one unit of activity. For example, someproteolytic enzyme activities are quoted as a change in absorbance at agiven wavelength (e.g. 1 unit of enzyme activity is defined as ∆A440 of0.001 min–1) at a given temperature. The value of the absorbancechange over unit time is immaterial as long as the unit is clearlydefined.
The Beer–Lambert law can be used to convert a change in absorbance dueto an enzyme-catalyzed reaction to the amount of product formed (orsubstrate consumed) per unit time.
2.5 Protein assays
During a protein purification schedule, along with a means to specificallydetect the protein of interest, it is important to routinely measure the totalprotein. This enables determination of the efficiency of the methodemployed. At all stages in a purification schedule it is desirable to have asmuch of the target protein as possible (high total activity) while at thesame time limiting the amount of other proteins present in the sample(high specific activity) (see Section 1.12).
There are a number of different protein assays (Table 2.2 and seeProtocols 2.1–2.4) available for the routine measurement of protein in asample, using bovine serum albumin (BSA) as a standard protein toconstruct a standard calibration graph. The unknown samples are treatedin the same manner as the standards and the color generated is convertedinto a protein concentration by reference to the standard calibrationgraph. The results obtained will not be completely accurate because thereadings for the samples are in reference to a standard protein (BSA),implying that the proteins in the sample have the same number of reactiveamino acids (e.g. lysine or aromatic residues) as BSA. This will not be truefor all proteins, but this small loss in accuracy is traded off for the conve-nience of the methods used.
Groundwork 29

30 Protein purification
Tab
le 2
.2Po
pul
ar p
rote
in a
ssay
s
Prot
ein
assa
yBa
sed
onD
etec
tion
Dis
adva
ntag
esA
dvan
tage
sC
omm
ents
Refe
renc
esra
nge
Abs
orba
nce
of
The
amin
o ac
ids
tyro
sine
0.
2–2.
0 In
cru
de e
xtra
cts
othe
r Q
uick
and
U
V tr
ansp
aren
t (1
)U
Vlig
ht a
t an
d tr
ypto
pha
n p
rese
ntm
gm
l–1co
mp
ound
s ab
sorb
lig
htno
ndes
truc
tive
cuve
ttes
req
uire
d28
0 nm
in a
pro
tein
s st
ruct
ure
at 2
80 n
m,
e.g.
am
ino
The
cont
ent
of T
rp a
nd
abso
rb U
V lig
ht a
t ac
ids,
nuc
leic
aci
ds
Tyr
varie
s be
twee
n 28
0 nm
and
nucl
eotid
esdi
ffere
nt p
rote
ins
Prot
ocol
2.1
Coo
mas
sie
blue
D
ye b
indi
ng t
o ly
sine
St
anda
rd
Det
erge
nts
can
inte
rfer
e Q
uick
and
Th
e co
nten
t of
Lys
var
ies
(2)
dye
bind
ing
resi
dues
assa
y 0.
1–w
ith t
he c
olor
re
lativ
ely
betw
een
diffe
rent
pro
tein
s1.
0 m
gm
l–1de
velo
pm
ent
inex
pen
sive
Mic
ro a
ssay
C
olor
sta
ble
for
1 h
Prot
ocol
2.4
Mod
ifica
tion:
0.05
–0.1
(3)
mg
ml–1
Biur
etRe
duct
ion
of C
u2+to
Cu+
1.0–
5.0
(a)
Inse
nsiti
veIn
exp
ensi
ve(4
)by
the
pep
tide
bond
in
mg
ml–1
(b)
Am
mon
ium
ion
s an
d al
kalin
e co
nditi
ons
Tris
buf
fers
can
int
erfe
re
Low
ryRe
duct
ion
of F
olin
–0.
1–1.
0 M
any
com
pou
nds
inte
rfer
e Po
pul
ar(5
)C
ioca
lteau
rea
gent
by
mg
ml–1
with
the
col
or d
evel
opm
ent
Mod
ifica
tions
:ox
idiz
ed a
rom
atic
am
ino
(6),
(7)
, (8
)ac
ids
gene
rate
d in
the
Bi
uret
rea
ctio
n
Bici
ncho
nini
cBC
A ch
elat
esC
u+to
St
anda
rd
Am
mon
ium
ion
s an
d Tr
is
Can
be
used
Pr
otoc
ol 2
.2 a
nd 2
.3(9
)ac
id (
BCA)
enha
nce
the
colo
r as
say
0.1–
can
inte
rfer
ein
the
pre
senc
e Re
ad t
he a
bsor
banc
e of
M
odifi
catio
n:de
velo
pm
ent
of t
he
1.0
mg
ml–1
BCA
col
or d
evel
opm
ent
of a
det
erge
ntth
e sa
mp
les
with
in 1
0 m
in
(10)
Biur
et r
eact
ion
Mic
ro a
ssay
do
es n
ot r
each
a t
rue
of e
ach
othe
r0.
05–0
.1en
dpoi
nt.
The
colo
r m
gm
l–1de
velo
pm
ent
will
con
tinue
afte
r th
e 30
min
inc
ubat
ion
but
the
incr
ease
is
min
imal
at r
oom
tem
per
atur
e

The chosen protein assay during a purification protocol will largelydepend on the one routinely used in the laboratory at the time, andstandardization is important when results are compared between workersin the same and different laboratories. The BCA protein assay (Protocol2.2) is sensitive (Protocol 2.3) and can be used in the presence of deter-gents, whereas the Coomassie blue dye binding assay (Protocol 2.4) isquick and easy to use. All protein assays have limitations and these needto be appreciated, but in most cases the limitations can be overcome bythe inclusion of appropriate buffer blanks.
When using the BCA assay (Protocol 2.2) interference can be avoidedby precipitating the protein from the contaminating buffer using 7% (w/v)trichloroacetic acid (final concentration) and collecting the precipitate bycentrifugation at 10 000 g for 10 min. The precipitate can then be redis-solved in 5% (w/v) SDS in 0.1 M NaOH before the addition of the BCAstandard working reagent (Brown et al., 1989). Interference in theCoomassie blue dye binding assay can be overcome by adsorbing proteinsonto calcium phosphate (hydroxyapatite; see Section 3.3) in ethanol (3).
2.6 Extraction of protein from cells or tissue
At the initial stages of protein purification the target protein has to beremoved from the source tissue or cells. This requires a means of disrupt-ing the tissue/cells and a suitable buffer to solubilize the cellular proteins.In a cell, protein exists in a reducing environment at high concentrations,which is exactly the opposite of the conditions experienced during theextraction process.
The extraction buffer (100–250 mM) should be set at a pH which is idealfor the target protein, usually between pH 7.0 and 8.5, to which can beadded a range of reagents which may help to stabilize the target proteinor inhibit unwanted activities. The additions and the effective concentra-tions can be determined experimentally (described below).
Reducing agents
Many proteins contain surface (some enzymes have an active site)sulfhydryl groups which, when oxidized, may result in a change in theprotein’s tertiary structure or loss of catalytic activity. Dithiothreitol (DTT),2-mercaptoethanol (2-ME), cysteine or reduced glutathione can be added tothe extraction buffer to prevent oxidation of sulfhydryl residues. Dependingon the conditions, reducing agents can have a variable half-life, for exampleDTT in 0.1 M potassium phosphate buffer pH 6.5 at 20°C has a half-life of40 h but at pH 8.5 in the same conditions the half-life decreases to 1.5 h.
Chelating agents
Divalent heavy metal ions can bind to a protein’s surface (or active site)sulfhydryl residues causing problems. A chelating agent, for example EDTA,can be included to mop up low levels of metal ions. However, if the targetprotein requires Ca2+ or Mg2+ ions for activity it should be rememberedthat EDTA will also chelate these metal ions.
Groundwork 31
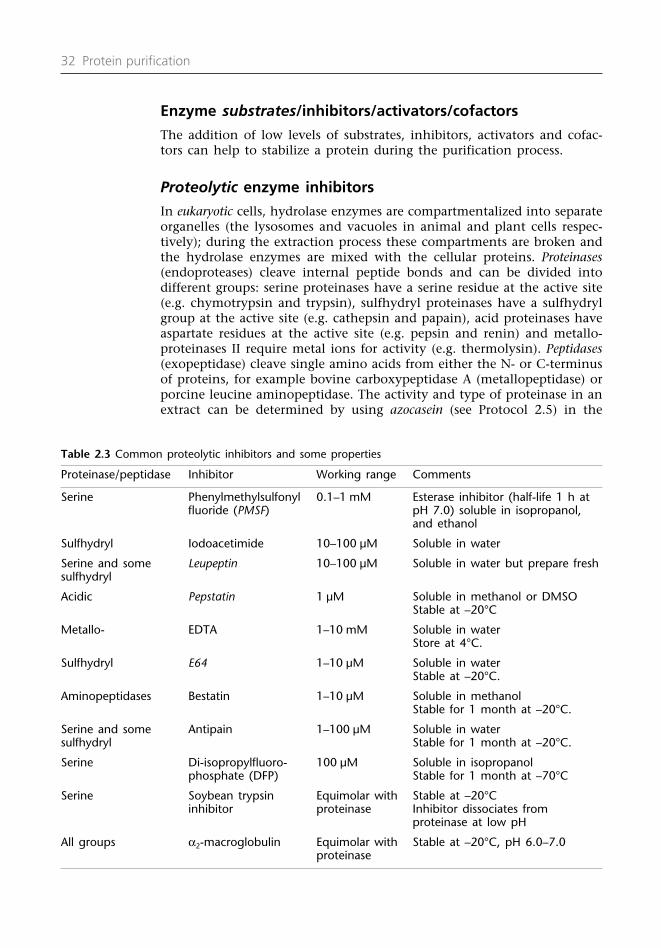
Enzyme substrates/inhibitors/activators/cofactors
The addition of low levels of substrates, inhibitors, activators and cofac-tors can help to stabilize a protein during the purification process.
Proteolytic enzyme inhibitors
In eukaryotic cells, hydrolase enzymes are compartmentalized into separateorganelles (the lysosomes and vacuoles in animal and plant cells respec-tively); during the extraction process these compartments are broken andthe hydrolase enzymes are mixed with the cellular proteins. Proteinases(endoproteases) cleave internal peptide bonds and can be divided intodifferent groups: serine proteinases have a serine residue at the active site(e.g. chymotrypsin and trypsin), sulfhydryl proteinases have a sulfhydrylgroup at the active site (e.g. cathepsin and papain), acid proteinases haveaspartate residues at the active site (e.g. pepsin and renin) and metallo-proteinases II require metal ions for activity (e.g. thermolysin). Peptidases(exopeptidase) cleave single amino acids from either the N- or C-terminusof proteins, for example bovine carboxypeptidase A (metallopeptidase) orporcine leucine aminopeptidase. The activity and type of proteinase in anextract can be determined by using azocasein (see Protocol 2.5) in the
32 Protein purification
Table 2.3 Common proteolytic inhibitors and some properties
Proteinase/peptidase Inhibitor Working range Comments
Serine Phenylmethylsulfonyl 0.1–1 mM Esterase inhibitor (half-life 1 h at fluoride (PMSF) pH 7.0) soluble in isopropanol,
and ethanol
Sulfhydryl Iodoacetimide 10–100 µM Soluble in water
Serine and some Leupeptin 10–100 µM Soluble in water but prepare freshsulfhydryl
Acidic Pepstatin 1 µM Soluble in methanol or DMSOStable at –20°C
Metallo- EDTA 1–10 mM Soluble in waterStore at 4°C.
Sulfhydryl E64 1–10 µM Soluble in waterStable at –20°C.
Aminopeptidases Bestatin 1–10 µM Soluble in methanolStable for 1 month at –20°C.
Serine and some Antipain 1–100 µM Soluble in watersulfhydryl Stable for 1 month at –20°C.
Serine Di-isopropylfluoro- 100 µM Soluble in isopropanolphosphate (DFP) Stable for 1 month at –70°C
Serine Soybean trypsin Equimolar with Stable at –20°Cinhibitor proteinase Inhibitor dissociates from
proteinase at low pH
All groups α2-macroglobulin Equimolar with Stable at –20°C, pH 6.0–7.0proteinase

presence and absence of specific inhibitors (Table 2.3). The appropriatelevels of inhibitors can then be included in the extraction medium toprevent unnecessary damage to the target protein. If the level of prote-olytic activity is low in the crude extract the damage to the target proteinwill be negligible as the target protein concentration is initially relativelylow, but problems can occur later in a purification schedule (when thetarget protein concentration increases relative to the other proteins) if aproteolytic enzyme co-purifies with the target protein. Alternatively,cocktails of proteinase inhibitors can be purchased (e.g. Sigma) and addedto the initial extract to prevent proteolysis. Some proteinase inhibitors arenot specific and care must be taken to check that any inhibitors added donot inhibit the activity of the target protein.
Removal of nucleic acids and nucleoproteins
The increase in viscosity of an extract due to the coextraction of nucleicacids with protein can be reduced by the addition of DNase (25–50 µg ml–1)and RNase (50 µg ml–1). As well as the addition of nucleases, the additionof positively charged material such as 1% (w/v) protamine sulfate or 0.1%(w/v) polyethyleneimine will help precipitate the negatively chargednucleic acids, which can be removed from the soluble protein by centrifu-gation. If ultrasonication is the method of extraction (see Section 2.8)nuclease treatment is not usually required as ultrasonication shearschromosomes.
Removal of lipoproteins
If an extract is suspected to be rich in lipoproteins (e.g. ascites fluid) theaddition of dextran sulfate and CaCl2 to a final concentration of 0.2%(w/v) and 500 mM respectively will aggregate the lipoproteins, which canbe removed by centrifugation.
Additions for the extraction of plant tissue
The extraction of proteins from plant material presents additionalproblems to that experienced in the extraction of proteins from animalsources (see Protocol 2.6). Plants can contain large amounts of secondarymetabolites, some of which (phenols and tannins) can bind to proteinscausing precipitation. They also have phenol oxidase enzymes that convertthe phenols into reactive quinones, which can also interact with proteinsincreasing the problems of protein aggregation and precipitation. Thephenol oxidase activity can be moderated by increasing the concentrationof reducing agents (DTT or 2-ME) in the extraction buffer (10–15 mM), bythe inclusion of oxygen scavengers such as vitamin C (5 mM) and by theinclusion of a copper-chelating agent such as diethyldithiocarbamate(DIECA) which will inhibit the activity of the copper-requiring phenoloxidases (see Protocol 2.6 which describes the isolation of an enzyme fromplant material). In addition, the phenol oxidases have a relatively low pHoptimum, so increasing the pH of the extraction buffer to pH 8.5 andadjusting the pH immediately after extraction can limit the activity of
Groundwork 33

these enzymes. Insoluble polyvinylpolypyrrolidone (PVPP) (whichprovides an alternative substrate to proteins for absorbing reactive species)can also be added to the extraction buffer (5% w/v). The insoluble PVPPcan be removed at the clarification stage by centrifugation or filtration. Ifthe above procedures are performed on ice (or at 4°C) phenol oxidaseactivity should be minimized.
Additions for the extraction of membrane proteins
To maintain the integrity of subcellular organelle/membranes, 0.25 M sucrosecan be included in the extraction and resuspension buffers. Significant enrich-ment of a membrane protein can be initially achieved by isolating theorganelle/membrane of interest by differential centrifugation (see Protocol 2.6which outlines the preparation of membranes from plant tissue). Membraneproteins can be divided into proteins which are associated with themembrane by ionic interactions (peripheral) and those associated with themembrane by hydrophobic interactions (integral). The peripheral membraneproteins can be removed by washing the membrane with a buffer contain-ing either high salt (2 M NaCl), high- and low-pH buffers or by the additionsof a chelating agent such as EDTA (5 mM) and can then be purified as solubleproteins. Integral membrane proteins are associated with the membrane bythe interaction of hydrophobic amino acids (or attached lipids) with thehydrophobic fatty acid tails of the lipids making up the membrane bilayer.These hydrophobic integral membrane proteins can only be solubilized froma membrane by the inclusion of a detergent or a solvent. In general, the useof solvents is to be avoided because solvents can have a detrimental effect ona protein structure (see Section 2.14) and can represent a fire risk. The inclu-sion of detergents will solubilize the membrane proteins and lipids bymasking the hydrophobic areas of the protein in detergent molecules (Figure2.1). A variety of different detergents is available (Table 2.4) and the correctone for the membrane target protein of interest has to be determined empir-ically. An important property of detergents is the concentration above whichthey start to form micelles, called the critical micelle concentration (CMC). TheCMC of a detergent is dependent on the temperature, and for ionic deter-gents the salt concentration is also important. The aggregation number(number of detergent monomers in a micelle which determines the micelleMr) also has implications, as detergents which form large micelles are hard toremove from proteins.
Low concentrations of the correct detergent (below the detergent’sCMC) need to be included in the buffers throughout the purificationprocess to maintain the solubility of the membrane protein. This can bea problem as some detergents absorb UV light at the same wavelength asproteins (the amino acids tyrosine and tryptophan when present in aprotein’s structure absorb light at 280 nm); in addition some protein assaysare not compatible with the presence of detergents (Table 2.2).
The presence of a detergent is not a problem for size exclusionchromatography (SEC) (Section 5.1) and this chromatographic techniqueis a popular first purification step for membrane proteins. In ion exchangechromatography (IEX) (see Section 3.1) to avoid the detergents binding tothe resin a detergent with the same charge as the resin or a neutrally
34 Protein purification

charged detergent would be required. Many membrane proteins are glyco-proteins and lectin affinity chromatography (Section 4.6) using a lectinwhich tolerates detergents can also be used.
2.7 Techniques used to disrupt tissue or cells
Having established an ideal buffer and pH for extraction containing theappropriate additions (proteolytic inhibitors can be added to the extrac-tion medium after the initial disruption from a concentrated stock) it is
Groundwork 35
membrane proteinin lipid bilayer
water-soluble complexesof transmembrane proteinsand detergent molecules
water-soluble mixedlipid–detergent complexes
detergentmicelles
detergentmonomers
hydrophobic tailhydrophilic head
Detergent solubilized membrane proteins
+
+
At concentrations abovethe CMC detergentsform micelles
Figure 2.1
The use of detergents to solubilize membrane proteins and lipids. Reproducedfrom Alberts et al. (2002) The Molecular Biology of the Cell, 4th edn, p. 599,Figure 10-24 (Garland Science, New York).
Table 2.4 The properties of common detergents
Detergent Classification Mr of CMC* (mM) Aggregation Micelle Mr
monomer number
Tween 80 Nonionic 1310 0.012 58 76 000Triton X-100 Nonionic 650 0.3 140 90 000Nonidet P-40 Nonionic 603.0 0.05–0.3 100–155 60 000–93 500Lubrol PX Nonionic l 582 0.006 110 64 000SDS Anionic 288.5 2.3 84 24 200Sodium deoxycholate Anionic 414.6 1.5 5 2000CTAB Cationic 364 1.0 170 62 000CHAPSO Zwitterionic 630.9 8.0 11 9960CHAPS Zwitterionic 614.9 6–10 10 6150
*CMC conditions 50 mM Na+.

worth examining the method of tissue/cell disruption to maximize theamount of active target protein isolated. Remember that this is the start-ing point for the purification process and the protein extracted represents100% of the material that can be subsequently purified.
The cells from animal, plant, bacterial and fungal sources are differentsizes and have different properties.
Animal cells
Animal cells in culture (diameter 10 µm) are surrounded by a thin (6.0 nm)plasma membrane which can be easily broken by the shear forces gener-ated by tissue grinders, homogenizers or sonicators. In addition, the integrityof animal cell membranes can be broken by the inclusion of membranedestabilizing compounds (e.g. detergents and solvents) or by osmotic shock.
Animal cells from tissue (e.g. liver or lung), after being trimmed fromsurrounding fatty tissue, can be cut with scissors into small fragments anddisrupted by the shear forces generated by homogenization. Smallamounts of tissue can be fragmented in a tissue grinder or small hand-held homogenizers (Douce (glass–glass) or Potter–Elvehjem (glass–teflon)).Larger amounts of tissue or animal tissue with a lot of fibrous extracellu-lar material can be homogenized using a Waring blender or Polytron/Ultraturax disruptor.
Plant cells (typically 100 µm diameter)
Plant cells have a carbohydrate-based cell wall surrounding the plasmamembrane. The problems associated with this additional fibrous materialwill depend upon the plant tissue used. Grinding with acid-washed sandin a mortar and pestle can be used for small amounts of tissue and homog-enization in a Waring blender can be used for larger amounts of tissue.
Bacterial cells (0.7–4.0 µm in diameter)
Bacterial cells can be divided into two groups: Gram positive and Gramnegative (stains positive or negative with crystal violet and iodine). Gram-positive bacteria have a plasma membrane surrounded by a peptidoglycancoating (20–50 nm) whereas Gram-negative bacteria have a periplasmicspace (7.0 nm) separating a peptidoglycan coat (3.0 nm) covered inlipopolysaccharide polymers (7.0 nm) held together by divalent metal ions.These cell coatings and the size of the bacteria make them difficult tobreak open by homogenization techniques, and other techniques such asliquid extrusion under pressure and enzymic lysis can be used.
Fungal cells
Fungal cells have a plasma membrane surrounded by a cell wall composedmainly of polysaccharide (80–90%), typically chitin and cellulose. Filamentousfungi (2–7 µm in diameter) are susceptible to agitation with abrasive materi-als and the single-cell yeast (5–10 µm in diameter) can be disrupted by liquidextrusion, sonication and agitation with abrasive materials.
36 Protein purification

Cells from different sources have different properties and will requiredifferent extraction procedures. Table 2.5 summarizes suitable extractionprocedures for different tissues but the most appropriate extraction proce-dure would have to be determined experimentally (e.g. see Exercise 1.1).
2.8 Extraction methods for small amounts of tissue or cells
Note: Heat can denature a protein’s structure and the mechanical extrac-tion procedures that generate heat should be performed on ice or in a coldenvironment. A reduced temperature will also minimize the activity of anyproteolytic enzymes.
Liquid nitrogen
Tissue (animal or plant) should be cut into small pieces and placed intoa precooled mortar. Taking appropriate safety precautions, liquid nitrogenshould be added slowly to quickly freeze the tissue and then the tissueshould be ground into a fine powder with a pestle (for plant tissue, acid-washed sand can be added to aid the extraction process). Chilled extrac-tion buffer can then be added to solubilize the proteins.
Acid-washed sand
Tissue should be cut into small pieces and placed into a precooled mortar.The tissue can be ground with a mortar in the presence of acid-washedsand, PVPP and chilled extraction buffer.
Osmotic shock
Animal cells from tissue culture can be broken open by placing the cellsin a suitable hypotonic buffer (≤50 mM). The cells will take up water and
Groundwork 37
Table 2.5 A summary of extraction methods which are best used with different tissue
Method Animal Animal Plant Plant Bacteria Yeast Fungi tissue cell tissue cell (filamentous)
culture culture
Osmotic shock Grind in liquid N2 Grind with acid-washed sand Homogenizer, e.g. Douce Ultrasonicator Blenders Polytrons Ballotini beads Compression/expansion Freezing/thawing Enzyme treatment, e.g. lysozyme or enzyme + detergentsEnzyme treatment, e.g. lyticase

burst, disgorging the cellular contents into the buffer. This technique canbe used in conjunction with sonication or in the presence of a detergentto improve the yield of the target protein.
Homogenizers/tissue grinders
Homogenizers come in a variety of different sizes and configurations toaccommodate volumes of 0.1–50.0 ml. Douce tissue grinders (Figure 2.2)have a borosilicate glass mortar that can be used with a glass pestle witha large clearance (0.5–0.11 mm) for the initial reduction of soft tissue orcellular sample followed by a glass pestle with a small clearance(0.025–0.055 mm) to fragment cells with the retention of nuclei andmitochondria. Potter–Elvehjem homogenizers (Figure 2.3; see Protocol 2.7which outlines the use of a Potter-Elvehjem homogenizer in the extrac-tion of animal tissue) have a borosilicate glass mortar to be used with ateflon pestle which can be rotated either mechanically at 600 r.p.m. orused as hand-held unit. The teflon pestle provides an increased level ofsafety compared with the Douce homogenizers.
38 Protein purification
Figure 2.2
Douce tissue grinder. Reproducedfrom the manufacturer’s web site:http://www.gpelimited.co.uk
Figure 2.3
Potter–Elvehjem homogenizer.Reproduced from the manufacturer’sweb site:http://www.gpelimited.co.uk
Tissue should be cut into small pieces (or cell pellet collected aftercentrifugation) and placed into the glass mortar. Chilled extraction buffercan be added and the pestle is used to provide the shear forces necessaryto fragment the tissue. During the homogenization process the mortarshould be periodically chilled using ice to moderate the damage toproteins caused by heat.

Sonicators
Ultrasonicators rapidly generate gas bubbles in liquids which collapsecausing shock waves which can perforate the membranes of animal/plantcells from culture and some bacterial cells. The cell pastes collected aftercentrifugation should be suspended (<20% w/v) in chilled extractionbuffer and the ultrasonic probe placed in the buffer which should be satupon ice. Typically, 170 W acoustic power at 20 kHz for short bursts of30 s provides cell disruption, but the exact conditions for each cell typeneeds to be determined experimentally.
2.9 Extraction methods for large amounts of animal/planttissue or cells
Blenders
Domestic or Waring blenders can be used to quickly fragment animal andplant tissue (see Protocol 2.6 which outlines the use of a blender to isolateplant proteins). The tissue should be placed in the bowl of the blender(chilled stainless steel bowls will retain the cold for longer and will quicklyconduct away any heat produced) along with chilled extraction buffer. Thelid should be attached and the blender set to operate in short (15–30 s)bursts interspersed with cooling time until the tissue is fragmented.
Ultraturax/Polytron homogenizers
Animal or plant tissue can be dispersed efficiently using a Polytronhomogenizer (Kinematica, CZ) (Figure 2.4A) which acts in a similar mannerto domestic hand-held blenders. The tissue to be fragmented is first cutinto small pieces and then placed in a beaker with sufficient chilled bufferon ice. The tissue is torn between the probe’s rotor moving at up to27000 r.p.m. and the stationary stator surrounding the rotor (Figure 2.4B).
Groundwork 39
Figure 2.4
(A) Handheld Polytron units. (B) The tip of a Ultraturax/Polytron probe.
Stator
Rotor
(A) (B)

Different units can be purchased for different volume throughputs anddifferent probes can be purchased to deal with a variety of tissues.
2.10 Extraction methods for bacterial or yeast cells
Abrasive materials
Small amounts of bacterial or yeast cells can be disrupted by first freezing inliquid nitrogen and then grinding the frozen material to a powder with acid-washed sand in a mortar and pestle (see Section 2.8). Alternatively, cells canbe suspended in extraction buffer with glass beads (‘ballotini’) of 0.2–1.0 mmdiameter and shaken vigorously. The cells are disrupted by collision with thebeads and as such the method is most effective against cells with large diame-ters, e.g. filamentous fungi or plant cell cultures. In addition, a large numberof small-diameter beads is more effective than a small number of large beadsbecause of the increase in the number of collisions. The shaking can takeplace using specialist equipment (e.g. ball mill) or using a vortex mixer, butthe exact conditions need to be determined experimentally.
Compression/expansion
Cell pellets of bacterial or animal cells collected by centrifugation can beplaced in a thick metal cylinder with a piston (‘French press’). Pressure(10000–40000 psi) is applied using a mechanical press and released by avalve at the bottom of the cylinder. The sudden release of pressure andshear forces generated at the valve opening tears the majority of the cellsapart; usually between two and four passes through the press is requiredfor maximum lysis. An X-press extracts bacterial protein under pressureusing a frozen paste of cells and extrusion through a disc. The Parr disrup-tion bomb uses nitrogen gas to pressurize a stainless steel vessel; when thepressure is released the nitrogen gas dissolved in the cells explodes, provid-ing efficient cell disruption. The method can be applied to animal andplant cell cultures and bacterial cell pastes that have been pretreated withlysozyme (see Section 2.10 below) to weaken the cell wall. It is not suitablefor yeast, filamentous fungi or spores. The equipment for compression andexpansion extraction can be expensive.
Freezing and thawing
Freezing bacteria and mammalian cells in a freezer causes the cells to swelland break as ice crystals form. The cellular contents can be collectedduring the thawing cycle at 37°C. Several freeze/thaw cycles are requiredfor efficient lysis and the process is dependent on the age and type of cellas well as the rates of freezing and thawing. These factors would need tobe determined experimentally.
Enzyme treatment
The plasma membranes of bacterial cells are covered in a peptidoglycanmatrix (see Section 2.7) making them susceptible to enzymic hydrolysis.
40 Protein purification

Lysozyme can be used to breakdown the peptidoglycan complex surround-ing Gram-positive bacteria. Gram-negative bacteria require the disruptionof the lipopolysaccharide coating by EDTA prior to lysozyme treatment.The cell walls surrounding yeast cells can be broken down with β-1,3-glucanases (e.g. lyticase or zymolase) to produce spheroplasts (yeast cellswithout a cell wall). The use of these enzymes degrades the cell wallssurrounding the cells; the cellular contents can be accessed by combiningthe enzyme treatment with another procedure such as osmotic shock,detergents, chelating agents, freezing and thawing or compression andexpansion. The cost of the lytic enzymes may make this method inappro-priate for large-scale extractions.
2.11 Points to remember about extraction procedures
• Not all techniques will be an appropriate extraction method for everytissue (cell) and the efficacy of a method would have to be determinedempirically for the target tissue (cell).
• In eukaryotic cells, if the target protein is located in an organelle theextraction process should be engineered to leave the subcellularorganelles intact.
• Combining different methods may produce improved extraction (e.g.the use of a Polytron blender followed by ultrasonication or the use oflytic enzymes followed by freezing and thawing).
• Remember to cool the items of equipment and buffers before extrac-tion to minimize heat damage to proteins.
• Where possible include cooling cycles to minimize the damage toproteins caused by the heat generated in extraction.
• Add the appropriate additives (e.g. proteolytic enzyme inhibitors).• Check the pH of the extract after extraction and adjust as necessary.
2.12 Techniques for clarifying homogenized extracts(centrifugation)
After the conversion of the target tissue or cell suspension into ahomogenate the insoluble material will have to be removed. A eukaryoticcell homogenate will contain clumps of cells, cellular organelles, fragmentsof membranes and soluble cellular components in the extraction buffer.Large clumps of fibrous plant or animal material can be filtered out usingfour layers of muslin prior to centrifugation.
Particles sediment under the influence of gravity as a function of theirsize and density, with large and dense materials sedimenting first. In arotating centrifuge rotor, particles are subjected to a centrifugal field withelevated g force which increases the rate of sedimentation. Particles willbe subjected to different g forces depending on the rotor shape (Figure2.6) which have variable distances from the center of the rotor. Tostandardize centrifugation conditions, values for centrifugation arequoted in g (average) rather than rev min–1. Most modern centrifugesallow the experiment to be run in relative centrifugal force (RCF); if thisfacility is not available then the calculation below can be used to convertrev min–1 into RCF. Alternatively, if the rev min–1 and the average radial
Groundwork 41

distance are known, a nomogram (Figure 2.5) can be used to calculate theRCF.
The applied centrifugal field (G) = ω2r [2.1]
where r = radial distance from the center of the axis rotor to the particlebeing centrifuged (cm) and ω = angular velocity (radians s–1); 1 radian isthe angle subtended at the center of a circle by an arc with a length equalto the radius of the circle. One revolution of the rotor is equivalent to360° = 2π radians.
ω = 2π re
6v0min–1
Substitute into Equation 2.1:
(G) = 4π2 (re
3v60
m0
in–1)2r
To use the nomogram, measure the radius (mm) from the center of thecentrifuge rotor to a point on the centrifuge tube (see Figure 2.6; the averagedistance is usually quoted). Draw a line from the right-hand column (radius
42 Protein purification
Speed of centrifugeSpindle in rev min–1
25,000
30,00020,000
10,000
5000
2000
500475450425400375350325300
275
250
225
200
175
150140130120110100
90
80
70
60
50
1000
500
200
100
50
20
10
0
20,000
15,000
10,000
6000
4000
3000
2000
1000
500
200
Relative CentrifugelForce (¥ g)
Radius in mm from Center ofCentrifuge Spindle to Point
Along Tube or Bottle
Figure 2.5
Nomogram for calculating relative centrifugal force. Reproduced from Corningweb site:http://www.corning.com/lifesciences/technical_information/techdocs/nomogram.asp

value) to the left-hand column (rotor speed in rev min–1). The relativecentrifugal force is where the line crosses on the center column.
In general, the densities of organelles in eukaryotic cells are very similarbut they do vary in size (Table 2.6 and Figure 2.8) and as such can beseparated by differential centrifugation with the largest particles sediment-ing first.
If the target protein is located in a particular organelle or membrane, at the appropriate stage (Table 2.6 and Figure 2.7) the pellet can be
Groundwork 43
Axis of the rotor
Centrifugal field
(A) Fixed angle rotor
(B) Vertical tube rotor
(C) Swing-out rotor
rmax
rav
rmaxrav
rmax
rav
Figure 2.6
The design of three main types of centrifuge rotor and the radial measurementsfor the minimum (rmin) average (rav) and maximum (rmax) distances from thecenter of the rotor.

44 Protein purification
Table 2.6 The size and density of common eukaryotic cell components
Organelle Diameter Density Centrifugation speed Example of (µm) (g cm–3) required to sediment marker enzyme
Nuclei 5–10 1.4 Low speed (1000 g 10 min) DNA-dependent RNApolymerase
Mitochondria 1–2 1.19 Medium speed (20000 g Outer membrane:for 20 min) monoamine oxidase
Inner membrane:cytochrome C oxidase
Lysosomes 0.2–2 1.12 Medium speed (20000 g Acid phosphatasefor 20 min)
Peroxisomes 0.7 (variable) 1.07 Medium speed (20000 g Catalasefor 20 min)
Golgi (variable) 1.03–1.06 High speed (80000 g NADP+ phosphatasefor 60 min)
Plasma membrane (variable) 1.02–1.04 High speed (80000 g Na+K+ ATPasefor 60 min)
Ribosomes 0.02 1.6 Very high speed (150000 gfor 180 min)
Cell homogenate after extraction, the addition of proteolytic inhibitors and the pH readjusted
(A) Low speed spin (1000 g 10 min)
Pellet Supernatant(containing cell debrisnuclei and clumps of cells)
If required homogenize againand start again at (A)
(B) Medium speed spin (20000 g 20 min)*
Pellet Supernatant*(containing enrichmentof mitochondria)
(C) High speed spin (80000 g 60 min)
Pellet Supernatant*(containing enrichment ofmixed microsomal membranes)
Resuspend as outlined in Protocol 2.2Wash and recentrifuge at step (C)
(D) Very high speed spin (150000 g 180 min)
Pellet Supernatant*(containing ribosomes, viruses (containing soluble proteinsand large macromolecules) metabolites etc)
*If the target protein is not enriched in a pellet the centrifugation can be terminated and the supernatantprocessed for purification. This often happens after the medium speed spin.
Figure 2.7
Cell fractionation by differential centrifugation flow chart.

resuspended in buffer and used either as the starting point of the purifi-cation protocol or enriched further using density gradient centrifugation.In this technique the sample after differential centrifugation is layeredonto a 5–20% (w/v) gradient of sucrose (Ficol, Percoll or metrizamide canbe used at different concentrations) and during centrifugation the parti-cles will migrate through the sucrose according to size and shape. Thebands of different components are sharpened by the fact that the leadingedge of each component encounters increasingly dense material during itsprogress down the sucrose gradient. At the end of the run the centrifugetube can be punctured to release the enriched components (Figure 2.8).
Alternatively the sample after differential centrifugation can be layeredonto a 20–70% (w/v) gradient of sucrose and during centrifugation theparticles will migrate down the gradient until they reach a point wheretheir density matches that of the sucrose, a technique called equilibriumdensity gradient centrifugation (Figure 2.9). The bands can be collected bypuncturing the tubes and collecting fractions. The identity of themembranes isolated and the enrichment factor can be determined byusing marker enzymes (Table 2.6).
2.13 Techniques for clarifying homogenized extracts(aqueous two-phase partitioning)
Phases can be formed when solutions of two polymers (e.g. polyethyleneglycol (PEG) and dextran), or a polymer and a high salt solution (e.g. PEGand phosphate) are mixed together (Table 2.7). When the polymers aremixed in the correct proportion they will form separate phases. These
Groundwork 45
Sample 5%
Sucrose
20%
Slow sedimenting
Fast sedimenting
Before centrifugation
After centrifugation
Figure 2.8
Density gradient centrifugation.
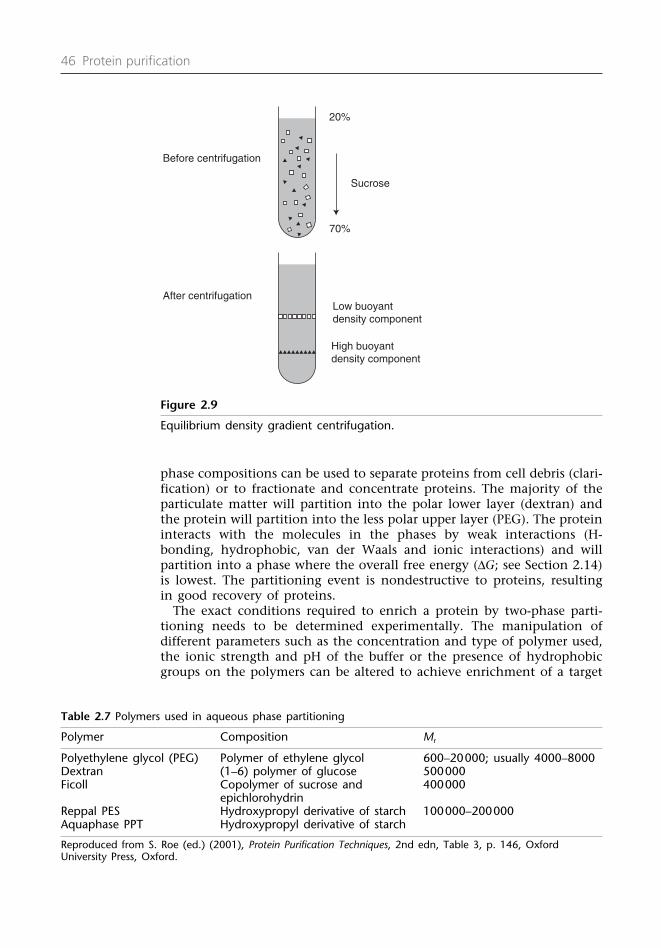
phase compositions can be used to separate proteins from cell debris (clari-fication) or to fractionate and concentrate proteins. The majority of theparticulate matter will partition into the polar lower layer (dextran) andthe protein will partition into the less polar upper layer (PEG). The proteininteracts with the molecules in the phases by weak interactions (H-bonding, hydrophobic, van der Waals and ionic interactions) and willpartition into a phase where the overall free energy (∆G; see Section 2.14)is lowest. The partitioning event is nondestructive to proteins, resultingin good recovery of proteins.
The exact conditions required to enrich a protein by two-phase parti-tioning needs to be determined experimentally. The manipulation ofdifferent parameters such as the concentration and type of polymer used,the ionic strength and pH of the buffer or the presence of hydrophobicgroups on the polymers can be altered to achieve enrichment of a target
46 Protein purification
20%
Sucrose
70%
Low buoyant density component
High buoyant density component
Before centrifugation
After centrifugation
Figure 2.9
Equilibrium density gradient centrifugation.
Table 2.7 Polymers used in aqueous phase partitioning
Polymer Composition Mr
Polyethylene glycol (PEG) Polymer of ethylene glycol 600–20000; usually 4000–8000Dextran (1–6) polymer of glucose 500000Ficoll Copolymer of sucrose and 400000
epichlorohydrinReppal PES Hydroxypropyl derivative of starch 100000–200000Aquaphase PPT Hydroxypropyl derivative of starch
Reproduced from S. Roe (ed.) (2001), Protein Purification Techniques, 2nd edn, Table 3, p. 146, OxfordUniversity Press, Oxford.

protein into the upper phase. In addition, ligands can be attached to thepolymers to facilitate selective isolation of a target protein (see Section4.10).
In the laboratory, stock solutions of the polymer (PEG and Dextran) areused to construct the phases in a centrifuge tube and after the sample hasbeen added and mixed, a centrifuge with a swing-out rotor (2000 g for 5min) can be used to separate the phases (gravity can also be used taking10–120 min). The two phases can then be separated and assayed forprotein, activity and volume. If required the upper PEG layer can be addedto more Dextran (or a different polymer) and the process repeated toimprove the enrichment. The protein can then be recovered from the PEGby ultrafiltration (see Section 2.14; using a filter with an appropriatemolecular weight cut-off) or salt can be added to the PEG (see Section2.13) rich phase to establish a new phase into which the protein prefer-entially partitions, as mentioned above.
2.14 Techniques for concentrating proteins from dilutesolutions (laboratory scale)
Proteins are present within the cell in a reducing environment at arelatively high concentration. After extraction the cellular proteins aredisgorged into an oxidizing buffer which also dilutes the protein several-fold. The buffer is present to facilitate successful extraction of the targetprotein, but at the initial stages of purification the excess water can beviewed as a major contaminant. This is particularly true for industry wherepumping large volumes of dilute feedstock can be expensive. This concen-tration step may also have the benefit of removing low-molecular-weightinhibitors from the target protein.
After extraction and clarification the next step in a purification sched-ule is usually the concentration of the extracted protein. In addition,concentration steps may also be required throughout the purificationschedule, for example prior to a chromatographic step or prior toelectrophoresis and there are several techniques that can be used.
Salt precipitation
The solubility of proteins in an aqueous environment depends on thetemperature, pH and the concentration and composition of the solutionin which the protein is solubilized. Proteins have a surface which iscovered in a patchwork of different functional groups (ionizable, polar andhydrophobic), the arrangement of which is dictated by the protein’ssequence of amino acids. This variable surface distribution of functionalgroups makes it difficult to predict how a protein will interact with theconstituents of a solution, and empirical determination of the solubilityof a target protein is usually undertaken initially on a small scale beforebeing scaled up.
Water interacts with the surface of a protein forming dipole interactionswith polar and ionizable groups and clathrate (‘caged’) structures when incontact with any hydrophobic groups. In a protein solution as the saltconcentration increases water molecules are gradually stripped away from
Groundwork 47

the protein surface. At the same time the hydrophobic patches becomemore exposed, increasing the number of clathrate water molecules. Thisincrease in ordered water molecules is thermodynamically unfavorablebecause the entropy decreases. The second law of thermodynamics statesthat entropy (S) (a measure of the randomness of a system) tends toincrease over time. The presence of clathrate water molecules decreases theentropy.
Gibbs free energy equation: ∆G = ∆H – T∆S
In the Gibbs free energy equation a decrease in entropy results in a positive free energy (∆G) change which is thermodynamically unfavorable. To release the clathrate water molecules and increase theentropy, hydrophobic patches on the surface of the protein interact witheach other to form interprotein complexes. When these complexesbecome too large they start to come out of solution and are large enoughto be collected by centrifugation. Proteins with a large complement ofsurface hydrophobic groups will precipitate first and those with the leastsurface hydrophobic groups will precipitate at higher salt concentrations.The differences in the hydrophobic amino acid content and surface distri-bution can be used as a means to fractionate complex protein mixtures(see Protocol 2.8 and Section 3).
In the laboratory the most common method for concentrating proteinsfrom solutions is precipitation by increasing the salt concentration. Proteinsusually demonstrate increased solubility at low salt concentrations (‘saltingin’) and decreased solubility at high salt concentrations (‘salting out’). TheHofmeister series of ions (Figure 2.10) was determined by the ability of ionsto precipitate a mixture of chicken egg proteins. The anions with multiplecharges appear to be more effective at ‘salting out’ proteins than cations.
The ideal salts for precipitating proteins are on the left of the Hofmeisterseries, but in practice ammonium sulfate is used for the routine precipi-tation of proteins for the following reasons.
• Ammonium sulfate dissolves at high concentrations (about 4 M at 0°C)generating little heat. The amount of solid ammonium sulfate to addto achieve the appropriate saturation is given in Table 2.8.
• The density of saturated ammonium sulfate solution (1.235 g ml–1) isless than the density of aggregated protein (1.29 g ml–1) which allowscollection of the precipitate by centrifugation.
• Ammonium sulfate precipitation is a mild method of protein concen-tration giving very good recoveries of activity.
48 Protein purification
Anions: PO43– > SO4
2– > CH3COO– > CI– > NO3– > ClO4
– > SCN–
Cations: NH4+ > K+, Na+ > Mg2+ > Ca2+ > Ba2+
Lyotropic Chaotropicsalts salts
Figure 2.10
The Hofmeister series.
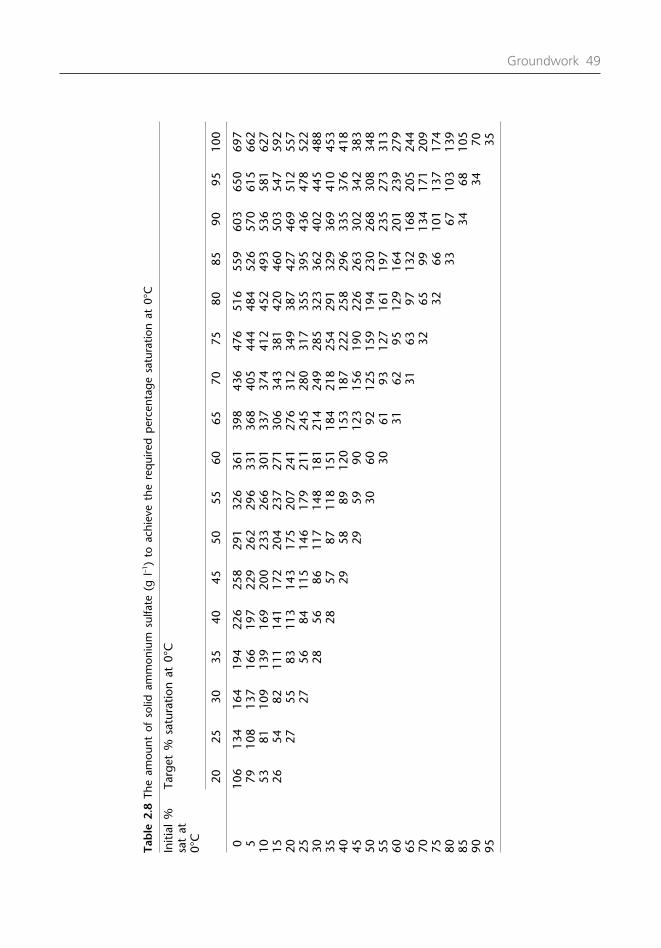
Groundwork 49
Tab
le 2
.8Th
e am
ount
of
solid
am
mon
ium
sul
fate
(g
l–1)
to a
chie
ve t
he r
equi
red
per
cent
age
satu
ratio
n at
0°C
Initi
al %
Ta
rget
% s
atur
atio
n at
0°C
sat
at
0°C
2025
3035
4045
5055
6065
7075
8085
9095
100
010
613
416
419
422
625
829
132
636
139
843
647
651
655
960
365
069
75
7910
813
716
619
722
926
229
633
136
840
544
448
452
657
061
566
210
5381
109
139
169
200
233
266
301
337
374
412
452
493
536
581
627
1526
5482
111
141
172
204
237
271
306
343
381
420
460
503
547
592
2027
5583
113
143
175
207
241
276
312
349
387
427
469
512
557
2527
5684
115
146
179
211
245
280
317
355
395
436
478
522
3028
5686
117
148
181
214
249
285
323
362
402
445
488
3528
5787
118
151
184
218
254
291
329
369
410
453
4029
5889
120
153
187
222
258
296
335
376
418
4529
5990
123
156
190
226
263
302
342
383
5030
6092
125
159
194
230
268
308
348
5530
6193
127
161
197
235
273
313
6031
6295
129
164
201
239
279
6531
6397
132
168
205
244
7032
6599
134
171
209
7532
6610
113
717
480
3367
103
139
8534
6810
590
3470
9535

• Proteins can be stored as an ammonium sulfate precipitate (covered insaturated ammonium sulfate at –25°C) for long periods with little lossof activity when the precipitate is redissolved.
Below are some points to note about using ammonium sulfate.
• Fractionation of complex protein mixtures (see Protocol 2.8 whichdescribes the total and fractional precipitation of proteins usingammonium sulfate): ammonium sulfate precipitation is not a highlyresolving technique; for this reason there is little to be gained in usingsmall incremental additions of the salt to try and produce a highlypurified fraction containing the target protein. Broad incrementaladditions are usually used to capture all the target protein in onefraction. After the precipitate has been collected and redissolved in abuffer the extract is then moved onto chromatographic fractionationtechniques (see the example extractions in Protocols 2.6 and 2.7 whichuse ammonium sulfate to concentrate the extracted protein).
• Ammonium sulfate precipitation is not usually used in industry as ithas a corrosive effect on stainless steel.
• Ammonium sulfate will acidify the extract: check the pH after theaddition of the salt and adjust if required.
• Trace contamination with heavy metal ions may be a problem. Use thehighest quality reagents available and include 5 mM EDTA if the targetprotein is particularly sensitive to metal ions.
• The formation of protein aggregates can be problematic at proteinconcentrations below 1.0 mg ml–1. At the latter stages of purificationother techniques to concentrate proteins are recommended.
Organic solvent precipitation
The dielectric constant is the ability of a solvent to repel the attractive forcesbetween two charged particles, and water has a large dielectric constant(80.4). The addition of solvents such as ethanol and acetone can lowerthe dielectric constant of water, allowing charged groups on the surfaceof proteins to interact. In addition, water starts to hydrate the solventmolecules which strips the solvation shell from around the protein expos-ing more polar and charged groups. Aggregation occurs via these ionicinteractions with the most highly charged precipitating first. Acetonestored at –25°C is added in an equal volume to the protein and thesolution is left overnight at –25°C to promote precipitation. The aggregatecan be collected by centrifugation (10000 g for 20 min at 4°C). In generalthis method of protein concentration does not allow for the correct refold-ing of proteins, and as such, activity is usually lost. However, it works welleven at low protein concentrations and is a convenient method of prepar-ing samples for electrophoresis or immunization. Solvent precipitationwould not be used on a large scale because of the obvious fire risks.
Polymer precipitation
Polyethylene glycol (6000–20000) is a very hygroscopic compound and
50 Protein purification

when added to a protein solution at concentrations up to 25% (w/v) itcauses precipitation of the protein, which can be collected by centrifuga-tion. The precipitation occurs in a similar fashion to solvent precipitationbut lower concentrations are used, resulting in improved recovery of activ-ity.
In aqueous two-phase partitioning (see Section 2.13), proteins can beselectively partitioned into a phase by using mixtures of polymers (e.g.PEG and Dextran). Protein is less polar and tends to partition into theupper layer (PEG). By altering the phase composition where there isproportionally less PEG than Dextran, protein can then be concentratedinto the smaller volume of the PEG layer. The exact conditions to effecta successful partition need to be determined experimentally.
Isoelectric precipitation
Proteins have no overall charge and minimum solubility at their isoelec-tric point (pI) (see Section 3.1). Aggregates can form as the pH is adjustedto approach the pI of a protein which can be collected by centrifugation.However, the recovery of the activity can be very low.
Chromatography
Ion exchange chromatography and hydrophobic interaction chromatog-raphy (HIC) have high capacities to bind protein. The binding is repro-ducible and easily reversed with good recoveries of active material (seeSections 3.1 and 3.4). Relatively small resin volumes can be used toconcentrate proteins from dilute feedstocks. This technique can be usedin both the early and later stages of a purification protocol.
Hygroscopic material
In the later stages of a purification protocol, when the concentration ofprotein is not high and the volume is manageable, the sample can beplaced in a prepared dialysis bag (see Protocol 2.9) and held in a measur-ing cylinder. Powdered hygroscopic material such as sucrose, SephadexG25/50 or polyethylene glycol (8000–20000) can be packed around thedialysis bag to withdraw the water through the dialysis membrane. Thismethod can be very efficient and the sample must be continually observedto prevent the sample drying out. When the desired level of concentra-tion has been achieved the sample can be removed and the inside of thedialysis bag rinsed with a small volume of buffer.
Dried acrylamide
A high percentage (≥12%) of acrylamide can be polymerized (see Protocol6.1) and dried in an oven for several days. If a fragment of driedacrylamide is added to a protein extract the acrylamide will swell back tonormal size taking up the liquid from the sample. This technique is bestused in the later stages of purification to concentrate small volumes ofdilute sample.
Groundwork 51

Lyophilization (freeze drying)
Water is removed from a frozen solution of protein by sublimation underreduced pressure. The solution of protein is rapidly frozen in liquid nitro-gen to avoid any deleterious effects of slow freezing (e.g. pH changes andice crystal formation) and placed in a suitable freeze dryer to remove thewater under vacuum. If the target protein is to be stored as a lyophilizedpowder free from buffer components then the last chromatographic step(e.g. SEC; see Section 5.1) should be conducted in a volatile buffer (Table2.9). Nonreducing sugars (e.g. sorbitol, sucrose and trehalose), cyclodex-trin derivatives, enzyme substrates and lyotropic salts (e.g. ammoniumsulfate) can be added to help stabilize proteins during lyophilization. Theeffects of these additives on the stability of the target protein would haveto be determined empirically. Lyophilization can be a convenient methodof concentrating large volumes of dilute sample and as a method of long-term storage of proteins.
Table 2.9 Volatile buffers
pH range Buffer system
2.0 Formic acid 2.3–3.5 Pyridine/formic acid 3.0–5.0 Trimethylamine/formic acid 3.0–6.0 Pyridine/acetic acid 4.0–6.0 Trimethylamine/acetic acid 6.8–8.8 Trimethylamine/HCl 7.0–8.5 Ammonia/formic acid 8.5–10.0 Ammonia/acetic acid 7.0–12.0 Trimethylamine/carbonate 7.9 Ammonium bicarbonate 8.0–9.5 Ammonium carbonate/ammonia 8.5–10.5 Ethanolamine/HCl 8.5 Ammonium carbonate
Reproduced from Ion exchange chromatography: Principles and Methods, 3rd edn.,GE Healthcare, USA., p 63.
Ultrafiltration
This is a versatile technique with many formats; it concentrates proteinsby filtration through semipermeable membrane filters. Ultrafiltration iscapable of concentrating bacteria and proteins by using membranes withdifferent molecular weight cut-offs (MWCOs). Ultrafiltration is onlymarginally dependent upon the charge of the particle and is more depen-dent on the size and shape of the particle. Elevated temperatures improvefiltration rates by lowering the viscosity but in the concentration ofprotein samples elevated temperatures will also cause protein denatura-tion.
Stirred cells
A membrane (Figure 2.11) with the appropriate MWCO (e.g. 10 000 willretain all molecules with a mass above 10 000) is placed at the bottom of
52 Protein purification

the stirred cell (sizes range from 3 to 2000 ml). After the sample has beenplaced in the cell, the lid is replaced and the apparatus is placed on amagnetic stirrer (or shaken) to reduce membrane fouling as the sampleconcentrates (Figure 2.12). The concentration begins when the stirred cellis connected to a source of pressurized nitrogen gas (70 psi). The pressureof the gas forces the liquid through the membrane, concentrating thesample. The technique can also be used to exchange buffers by repeatedlytopping up the stirred cell with the new buffer and repeating the concen-tration step.
Centrifugal concentrators
For many protein concentration applications in the laboratory, centrifu-gal concentrators have replaced stirred cells for several reasons: (a)
Groundwork 53
Figure 2.11
A cross-section through aMillipore ultracell-regeneratedcellulose membrane showingthe porous structure. Takenfrom the Millipore web site.www.millipore.com
Nitrogen gas(20–70 psi)
MWCOmembrane
Sample
Magnetic bead
Metalrestrainingholder
outlet
Filtrate
Figure 2.12
Stirred cell ultrafiltration concentrator. MWCO, molecular weight cut-off.
Liquid flow

specialist equipment is not required as most laboratories will have a bench-top centrifuge; (b) a stirred cell can process only one sample at a timewhereas a centrifuge can process many samples together; (c) the centrifu-gal concentrators come in a range of sizes (0.5–50 ml) and with a varietyof MWCO (or IEX) options (Figure 2.13). The upper chamber of theconcentrator has a MWCO filter on one face which is placed towards theaxis of the centrifuge rotor. The sample is placed into the upper chamberand centrifugal force is used to force the liquid through the MWCO filter.The technique works best with dilute (<5.0 mg ml–1) samples in the laterstages of a purification protocol as membrane fouling with crude extractsgreatly increases the time taken to concentrate a sample.
Static concentrators
The sample is loaded into the static concentrator using a pipette and anabsorbent cellulose pad mounted behind the ultrafiltration (MWCO)membrane draws the liquid through the membrane. The molecules abovethe molecular weight cut-off are retained and concentrated in the bottomof the sample container. Advantages of these concentrators are that theyare available in different sizes (0.5–20.0 ml) and no additional equipmentis required (Figure 2.14).
Tangential flow (cross-flow) concentrators
The large surface areas offered by tangential flow concentrators make thema viable alternative to stirred cells for the concentration of large volumesof protein solutions. In a flat plate system (Figure 2.15) the solution to beconcentrated (retentate) is continuously flowed across a membrane (orstacks of membranes). As the filtrate passes through the membrane theretentate becomes concentrated. In hollow fiber systems the ultrafiltrationmembrane is manufactured as a tube (internal diameter 0.5–3.0 mm) withthe MWCO filter on the inside of the tube. The feedstock is pumpedthrough the fibers (connected in series) with the filtrate passing throughthe fiber and the retentate becomes more concentrated. Elevated flow ratesimprove the rates of filtration but increased flow rates can also increaseprotein denaturation.
54 Protein purification
Centrifugalfield
MWCO filter
Sample
Filtrate
Figure 2.13
Micron® centrifugal concentration unit.

Groundwork 55
Figure 2.14
A static ultrafiltration concentrator.
Retentate
Filtrate
Filtrate
Retentate
MWCOFilter
MWCOfilter
Figure 2.15
Diagram of a tangential flow plate concentrator.
Absorbent pad
Sample application and retrieval
MWCO filter

2.15 Clarification of process-scale extracts
In process-scale chromatography, after the extraction of the cells used toproduce the target protein there is a need to remove the particulate matterbefore moving onto the chromatography in packed columns.Centrifugation clarifies a cell homogenate by exploiting the differencesbetween particle size and density, but the high viscosity of some cellextracts, the small differences in particle size and the large volumes ofliquid can make centrifugation an inappropriate technique for the clarifi-cation of process-scale extracts. Ultrafiltration can produce particle-freeextracts as the problems associated with viscosity may be overcome bydilution, but the increase in process time can result in a decrease in yieldof the target protein. The ultrafiltration set-ups used in the process indus-try include flat-plate tangential flow devices, hollow fiber tubes andspirally wound membranes.
Alternative procedures have been developed to overcome the problemsassociated with centrifugation and ultrafiltration for handling process-scale particulate extracts.
Stirred bed
The extract can be stirred with a resin (e.g. ion exchange) after which theresin is separated from the particulate liquid by filtration or sedimenta-tion. The resin can then be washed and the target protein eluted using asimilar batch process or the resin can be packed into a column. However,the adsorption efficiency of this technique is poor because there is onlyone adsorption equilibrium and a larger volume of resin is required tobind the same amount of sample when compared with a resin packed intoa column. The larger volume of resin also presents handling problems.
Fluidized bed
The particulate extract can be pumped through resin suspended as afluidized bed but turbulence and channelling can be extensive, resultingin poor adsorption of protein. Time-consuming recycling of the feedstockwould be required to achieve the maximum amount of target proteinbinding to the resin. To improve the operation of fluidized beds the resinparticles need to be fixed in the liquid stream; baffles and magnetic parti-cles have been used to achieve this with some success.
Expanded bed
This consists of resin with particles of different sizes and densities whichbecome suspended in a liquid flow. The largest dense particles remain atthe bottom of the column and the lighter, smaller particles are held insuspension by the flow of the liquid resulting in a stable (expanded) bedof resin. The particles have been constructed with agarose containing aquartz core (GE Healthcare) and a ceramic gel within zirconia bead (Pall)to which a variety of functional groups can be attached (IEX, HIC, affin-ity or IMAC). The crude feedstock is applied with an upward flow which
56 Protein purification

expands the resin particle bed (Figure 2.16). The cell debris passes throughthe expanded bed unimpaired and the cellular protein binds to the resin.After a wash step, the upward flow of liquid is stopped to allow the bedto settle. The upper adapter is lowered to the bed surface and the elutionconditions applied. The robust resins also allow the stringent washingprocedures required by the biotechnology industry.
2.16 Membrane chromatography
Column chromatography using resins is not always an ideal medium forprocessing the large volumes of viscous feedstocks experienced in thebiotechnology industry. Micro- and macroporous adsorptive membranes(2–3 mm thickness) can be used instead of conventional bead-based resins.The membranes are easy to scale up and may have better flow propertiesthan the equivalent columns, speeding up the process of washing,binding, elution and sanitation, thus reducing the possible denaturationof the target protein.
The membranes (thin discs, hollow fibers and spiral-wound membranes)can be constructed from a variety of materials, including: cellulose and
Groundwork 57
Top adapter
Bottomadapter
(A) Bed settled before sample application
(B) (i) Bed expanded with start buffer (ii) Crude sample application (iii) Wash with start buffer
(C) Bed allowed to settle
(D) (i) Elution (ii) Regeneration
FlowFlow
Figure 2.16
Diagram of an expanded bed column.

cellulose derivatives, inert polymers (polymethacrylate, polystyrene,polyethylene nylon and polyamide) as well as chitin and chitosan. Inaddition, a variety of functional groups (IEX, HIC, reversed phase andaffinity) can be attached to the membranes as a means to fractionate andpurify complex protein mixtures.
The use of membranes to process samples in the laboratory is alsobecoming popular. Ion exchange membranes and affinity membranes (e.g.protein A for the purification of IgG; see Protocol 4.1) are available torapidly process small volume samples.
2.17 Storage of protein samples
Some of the amino acid functional groups present in a protein are proneto alteration on storage. Amide nitrogen can be slowly lost from gluta-mine and asparagine residues at most pH values; cysteine, methionine andtryptophan are prone to oxidation: reducing sugars can be added to freeamino groups at the N-terminus or lysine residues. In addition, proteinaggregation or proteolysis can also occur at most temperatures. The stabil-ity of proteins during storage is not easy to predict and has to be deter-mined empirically, but conditions need to be standardized beforeembarking on storage analysis.
This can be undertaken by incubating aliquots of the target protein afterclarification (or following dialysis after ammonium sulfate concentration)under different storage conditions in the presence of different compoundsand then periodically assaying the stored material for activity and protein(every day for the first week, then weekly for the first month, thenmonthly for the next 2 months) to assess the suitability of the conditions.The rate at which the sample is frozen can affect the stability of storedprotein, so to assess the effects of different storage temperatures belowfreezing it is advisable to freeze in liquid nitrogen before storing thesample aliquots at the different storage temperatures.
The storage containers should ideally have low protein binding charac-teristics, and be pre-sterilized or autoclaved. The reagents (highest gradepossible) should be filtered through 0.2 µm membranes to remove bacte-rial contamination. The samples should be centrifuged at 13000 g for 20min to remove any aggregates or bacteria.
Suggested storage temperatures:• liquid nitrogen (–196°C)• freezer (–80°C)• freezer (–25°C)• fridge (4–8°C)• room temperature.
Suggested conditions:• Different buffers at one pH to determine an ideal buffer.• Different pH values in the ideal buffer.• The ideal buffer at the ideal pH in the presence of the following at
different concentrations: substrate(s), reversible inhibitors/activators,cofactors, reducing agents, proteolytic inhibitors, lyotropic salts (e.g.ammonium sulfate at a concentration below the concentration which
58 Protein purification

causes the target protein to precipitate), antimicrobial agents (e.g. 0.05%(w/v) sodium azide or 0.01% (w/v) thiomersal), nonreducing sugars (e.g.sucrose, trehalose or sorbitol), cyclodextrins, glycerol (this will increasethe viscosity of the medium) or ethanediol (this will increase the viscos-ity of the medium but not as much as glycerol).
• Combinations of these different conditions (e.g. reducing agents in thepresence of ethanediol) may eventually provide the ideal storage condi-tions for the target protein.
As previously mentioned, storage as an ammonium sulfate pellet orlyophilization may provide the storage solution for some proteins.
Further readingAlbertson P (1974) Separation of cells and cell organelles by partition in aqueous
polymer two-phase systems. Meth Enzymol 171: 532–549.Beynon RJ, Easterby JS (1996) Buffer Solutions. Biosis, Oxford.Cutler P (ed) (2004) Protein Purification Protocols, 2nd edn. Humana Press, Totowa, NJ.Deutscher MP (ed) (1990) Guide to protein purification. Meth Enzymol 182.Huddleston J, Albelaira JC, Wang R, Lyddiatt A (1996) Protein partition between
the different phases comprising poly(ethylene glycol)-salt aqueous two-phasesystems, hydrophobic interaction chromatography and precipitation: a genericdescription in terms of salting-out effects. J Chromatogr B Biomed Applns 680:31–41.
Olson RJ, Klenk DC (1985) Measurement of protein using bicinchoninic acid.Analyt Biochem 150: 76–85.
Patel D (2001) Separating Cells. Biosis, Oxford.Reid E, Williamson R (1974) Centrifugation. Meth Enzymol 31: 713–733.Rosenberg IM (2005) Protein Analysis and Purification, 2nd edn. Birkhauser, Boston.
References1. Warburg O, Christian W (1941) Isolation and crystallisation of enolase.
Biochem Zellforsch 310: 384–421.2. Bradford MM (1976) A rapid and sensitive method for the quantitation of
microgram quantities of protein utilizing the principle of protein-dye binding.Analyt Biochem 72: 248–254.
3. Shu-Sheng Z, Lundahl P (2000) A Micro-Bradford membrane protein assay.Analyt Biochem 284: 162–164.
4. Gornall AG, Bardawill CS, David MM (1949) Determination of serum proteinsby means of the Biuret reaction. J Biol Chem 177: 751–766.
5. Lowry D, Rosebrough NJ, Farr AR, Randall RJ (1951) Protein measurement withFolin phenol reagent. J Biol Chem 193: 265–275.
6. Raghupathi RN, Diwan AM (1994) A Protocol for protein estimation that givesa nearly constant color yield with simple proteins and nullifies the effects offour known interfering agents: microestimation of peptide groups. AnalytBiochem 219: 356–359.
7. Harrington C (1989) Lowry protein assay containing sodium dodecyl sulfatein microtiter plates for protein determinations on fractions from brain tissue.Analyt Biochem 186: 285–287.
8. Rodríguez-Vico F, Martínez-Cayuela M, García-Peregrín E, Ramírez H (1989) Aprocedure for eliminating interferences in the Lowry method of protein deter-mination. Analyt Biochem 183: 275–278.
Groundwork 59
9. Smith PK, Krohn RI, Hermanson GT, Mallia AK, Gartner FH, Provenzano MD,Fujimoto EK, Goeke NM, Olson RJ, Klenk DC (1985) Measurement of proteinusing bicinchoninic acid. Analyt Biochem 150: 76–85.
10. Brown RE, Jarvis KL, Hyland KJ (1989) Protein measurement using bicin-choninic acid: elimination of interfering substances. Analyt Biochem 180:136–139.
60 Protein purification

Protocol 2.1 The measurementof protein concentration usingthe absorbance of light at280 nm
Proteins absorb light maximally at 280 nm mainly due to the presence of the aromatic residuesin the structures of tryptophan and tyrosine.
EQUIPMENTSpectrophotometer which can generate and measure light in the UV wavelengths (200–340 nm)
Quartz or disposable UV grade plastic cuvettes (1.0 or 3.0 ml volumes)
METHOD1. Switch on the spectrophotometer and set the wavelength to
280 nm.
2. Allow the machine to stabilize (times vary with each machine).
3. Fill the cuvette with buffer in which the sample is dissolved andset absorbance to zero (blank).
4. Replace the buffer with the protein sample and measure theabsorbance of the sample.
NOTES1. Prepare buffers fresh or from frozen stocks and use the highest
reagent grade available.
2. Check the data sheets provided by the reagent manufacturersand take appropriate Health and Safety precautions.
3. This method of measuring concentration is quick and nonde-structive but it can be subject to interference from nucleic acidswhich also absorb light at this wavelength. (Use the correctionfactor: protein (mg ml–1) = 1.55 A280 – 0.76 A260.)
4. The majority of proteins have a percentage absorptivity coeffi-cient in the range of 4.0–24.0. In general, an absorbance reading
Groundwork 61

of 1.0 approximates to a protein concentration of 1.0 mg ml–1
(i.e. ε1% 280 nm = 10.0) (specific values BSA ε1% 280 nm = 6.67and immunoglobulins ε1% 280 nm = 13–15 (use 14).
5. Small Mr metabolites such as the amino acids (tryptophan andtyrosine), peptides (containing tryptophan and tyrosine) andnucleotides will also contribute to the absorbance of light at280 nm. The extract can be dialyzed (see Protocol 2.8), subjectedto ammonium sulfate precipitation (see Protocol 2.7) or SEC (seeSection 5.6) to reduce the contamination from these compo-nents.
6. Crude extracts are sometimes cloudy due to particulate matter.This will contribute to the reading by scattering the light (atten-uance). Clarifying the extract by centrifugation at 13000 g for20 min (see Section 2.12) prior to reading the absorbance willhelp reduce this problem.
7. Warm the extract to room temperature prior to taking thereading to prevent moisture from condensing on the surface ofthe cuvette.
62 Protein purification

Protocol 2.2 Bicinchoninic acid(BCA) protein assay (0–1.0 mg ml–1)
EQUIPMENTThe reagents can be prepared as detailed below or a kit can be purchased (Sigma or Pierce)for very little difference in overall price.
MATERIALS AND REAGENTSReagents A and B are can be stored at room temperature
Reagent A: dissolve 5.0 g BCA, 10.0 g sodium carbonate, 0.8 g sodium tartrate, 2.0 g sodiumhydroxide and 4.75 g sodium bicarbonate in 400 ml of distilled and deionized water; adjust thepH to 11.25 with concentrated sodium hydroxide and make up to 500 ml
Reagent B: dissolve 4 g copper sulfate (CuSO4 pentahydrate)
Standard working reagent: prepare enough for the assay by mixing 100 volumes of reagent Awith 2 volumes of reagent B (apple green color)
Standard protein: 1.0 mg ml–1 bovine serum albumin (ε1% 280 nm = 6.67)
Microfuge tube Sample buffer (µl) 1.0 mg ml–1 BSA (µl) Standard workingreagent (ml)
1 50.0 0.00 1.02, 3, 4 45.0 5.00 1.05, 6, 7 40.0 10.0 1.08, 9, 10 30.0 20.0 1.011, 12, 13 20.0 30.0 1.014, 15, 16 10.0 40.0 1.017, 18, 19 0.00 50.0 1.0
METHOD• Prepare the standards as outlined in the above table in the same
buffer as the sample.
• Incubate at 37°C for 30 min and measure the absorbance at562 nm. Use the information to prepare a calibration graph ofprotein concentration mg ml–1 against absorbance at 562 nm.
• Add 1.0 ml of the standard working reagent to 50 µl of theundiluted and 50 µl of two dilutions of the sample (e.g. 1/10 and1/50) in triplicate and incubate at 37°C for 30 min.
Groundwork 63

• Read the absorbance at 562 nm and using the calibration graphconvert the sample absorbance readings into protein concentra-tion values.
• Remember to multiply by the dilution factor to obtain the proteinconcentration of the samples.
• The assay can be performed in a 96-well ‘flat bottom’ microplateformat by adjusting the volumes to 25 µl of the standards (orsample) and 200 µl of the standard working reagent. Incubate at37°C for 30 min and measure the absorbance at 562 nm.
NOTES1. Prepare buffers fresh or from frozen stocks and use the highest
reagent grade available.
2. Check the data sheets provided by the reagent manufacturersand take appropriate Health and Safety precautions.
3. Read the samples within 10 min of each other (the BCA reactionwith proteins is not a true endpoint reaction and the color willcontinue to develop after the 30 min incubation, but thisincrease in color is minimal at room temperature).
64 Protein purification

Protocol 2.3 Bicinchoninic acid(BCA) protein assay(0.5–10 µg ml–1)
REAGENTS AND MATERIALSReagent A: dissolve 8 g sodium carbonate, 1.6 g sodium hydroxide, 1.5 g sodium tartrate in50 ml of distilled water; add solid sodium bicarbonate to adjust the pH to 11.25 and make upto 100 ml
Reagent B: Dissolve 4 g BCA in 100 ml of distilled water
Reagent C: Dissolve 4 g copper sulfate (CuSO4 pentahydrate) in 100 ml of distilled water
Reagents A, B and C are stable at room temperature
Before use prepare Reagent D: mix 4 volumes of reagent C with 100 volumes of reagent B
Standard working reagent: mix 1 volume of reagent D with 1 volume of reagent A
Standard protein: 1.0 mg ml–1 bovine serum albumin (ε1% 280 nm = 6.67)
METHOD1. Prepare bovine serum albumin (BSA) standards (0–10.0 µg ml–1)
in the same buffer as the sample in triplicate.
2. Add 0.5 volume of standard working reagent to 0.5 ml ofstandards (or sample) in a microfuge tube.
3. Mix and incubate at 60°C for 60 min.
4. Cool to room temperature and measure absorbance at 562 nm.
5. Use the readings from the standards to prepare a calibrationgraph.
6. Convert the reading from the samples into protein concentra-tion using the calibration graph.
7. Remember to multiply by any dilution factor to obtain the finalprotein concentration.
Groundwork 65

NOTES1. Prepare buffers fresh or from frozen stocks and use the highest
reagent grade available.
2. Check the data sheets provided by the reagent manufacturersand take appropriate Health and Safety precautions.
3. Read the samples within 10 min of each other (the BCA reactionwith proteins is not a true endpoint reaction and the color willcontinue to develop after the 30 min incubation, but thisincrease in color is minimal at room temperature).
66 Protein purification

Protocol 2.4 Coomassie Blue dye binding protein assay
MATERIALS AND REAGENTSReagent A: dissolve 500 mg of Coomassie brilliant blue G-250 in 250 ml of 95% (v/v) ethanol,after which add 500 ml of 85% (v/v) phosphoric acid and store at room temperature
Standard working reagent: dilute reagent A (1:4) with distilled water and filter before use
Standard protein: 1.0 mg ml–1 bovine serum albumin (ε1% 280 nm = 6.67)
Microfuge tube Sample Standard Standard working Protein buffer (µl) protein (µl) reagent (ml) concentration (mg ml–1)
1 20 0 1.0 0.02, 3, 4 18 2 1.0 0.15, 6, 7 16 4 1.0 0.28, 9, 10 14 6 1.0 0.311, 12, 13 12 8 1.0 0.414, 15, 16 10 10 1.0 0.517, 18, 19, 5 15 1.0 0.7520, 21, 22 0 20 1.0 1.0
METHOD1. Prepare the standards as outlined above in the same buffer as
the sample.
2. Vortex mix the tubes, incubate for 5 min at room temperatureand then measure the absorbance at 595 nm. Use the informa-tion to prepare a calibration graph of protein concentrationmg ml–1 against absorbance at 562 nm.
3. Add 1.0 ml of the standard working reagent to 20 µl of theundiluted and 20 µl of two dilutions of the sample (e.g. 1/10and 1/50) in triplicate, vortex mix, incubate for 5 min at roomtemperature and measure the absorbance at 595 nm (the coloris usually stable for 60 min). Using the calibration graph convertthe sample absorbance readings into protein concentrationvalues.
4. Remember to multiply by the dilution factor to obtain thesamples protein concentration.
Groundwork 67

NOTES1. Prepare buffers fresh or from frozen stocks and use the highest
reagent grade available.
2. Check the data sheets provided by the reagents manufacturersand take appropriate Health and Safety precautions.
68 Protein purification
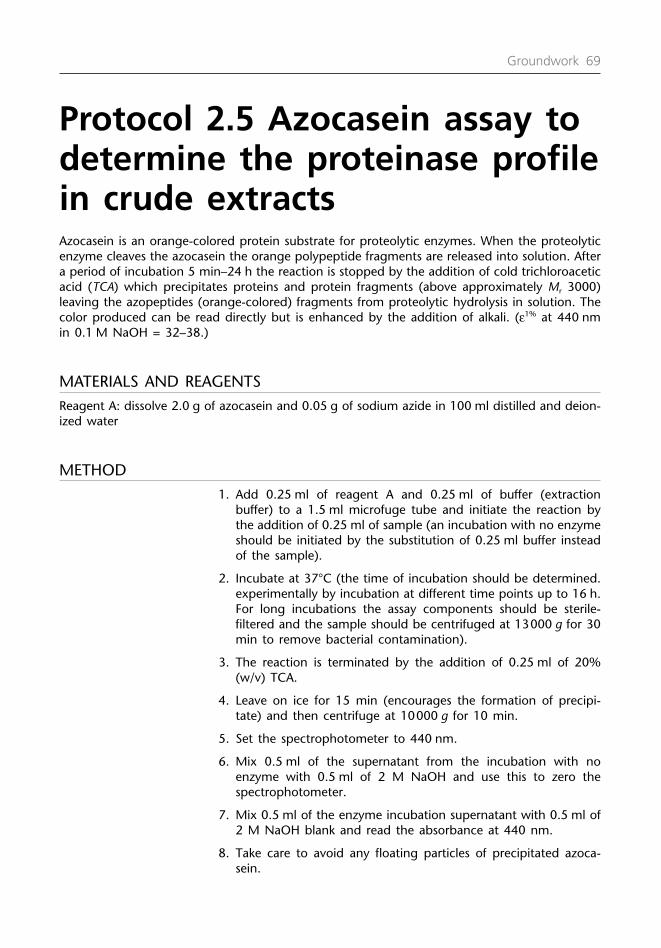
Protocol 2.5 Azocasein assay todetermine the proteinase profilein crude extractsAzocasein is an orange-colored protein substrate for proteolytic enzymes. When the proteolyticenzyme cleaves the azocasein the orange polypeptide fragments are released into solution. Aftera period of incubation 5 min–24 h the reaction is stopped by the addition of cold trichloroaceticacid (TCA) which precipitates proteins and protein fragments (above approximately Mr 3000)leaving the azopeptides (orange-colored) fragments from proteolytic hydrolysis in solution. Thecolor produced can be read directly but is enhanced by the addition of alkali. (ε1% at 440 nmin 0.1 M NaOH = 32–38.)
MATERIALS AND REAGENTSReagent A: dissolve 2.0 g of azocasein and 0.05 g of sodium azide in 100 ml distilled and deion-ized water
METHOD1. Add 0.25 ml of reagent A and 0.25 ml of buffer (extraction
buffer) to a 1.5 ml microfuge tube and initiate the reaction bythe addition of 0.25 ml of sample (an incubation with no enzymeshould be initiated by the substitution of 0.25 ml buffer insteadof the sample).
2. Incubate at 37°C (the time of incubation should be determined.experimentally by incubation at different time points up to 16 h.For long incubations the assay components should be sterile-filtered and the sample should be centrifuged at 13000 g for 30min to remove bacterial contamination).
3. The reaction is terminated by the addition of 0.25 ml of 20%(w/v) TCA.
4. Leave on ice for 15 min (encourages the formation of precipi-tate) and then centrifuge at 10000 g for 10 min.
5. Set the spectrophotometer to 440 nm.
6. Mix 0.5 ml of the supernatant from the incubation with noenzyme with 0.5 ml of 2 M NaOH and use this to zero thespectrophotometer.
7. Mix 0.5 ml of the enzyme incubation supernatant with 0.5 ml of2 M NaOH blank and read the absorbance at 440 nm.
8. Take care to avoid any floating particles of precipitated azoca-sein.
Groundwork 69
When a suitable incubation time has been established the assay can be repeated in the presenceof a variety of proteolytic enzyme inhibitors (Table 2.3) at different concentrations to establishthe concentration required to prevent proteolysis of the target protein.
70 Protein purification

Protocol 2.6 Extraction of planttissue material using a blender
MATERIALS AND REAGENTSExtraction buffer: 100 mM Tris–HCl pH 8.0 containing: 10 mM 2-ME (add fresh), 250 mMsucrose, 3 mM ascorbic acid and 3 mM EDTA
Membrane washing buffer: 5 mM Tris–HCl pH 7.2 containing: 1 mM DTT (add fresh), 250 mMsucrose and 1.0 M potassium chloride
Membrane resuspension buffer: 5 mM Tris–Mes pH 7.2 containing: 1 mM DTT (add fresh) and250 mM sucrose
METHOD1. Solid PVPP is added to the extraction buffer at a concentration
of 5% (w/v) and left overnight at 4°C.
2. Leaf tissue is harvested after 14 days and homogenized in ice-cold extraction buffer in a ratio of 1:2 (w/v) using a blender,using 15 s bursts of the blender followed by 30 s cooling untilthe tissue is completely homogenized. After the first 15 s burstproteolytic inhibitors (1 mM PMSF, 10 µm leupeptin, 1 µmpepstatin and 10 µm E64) and phenol oxidase inhibitors (1 mMDIECA) are added to the final concentrations indicated.
3. The homogenate is strained through two layers of muslin andthe pH readjusted to 7.4 using solid Tris.
4. The extract is then centrifuged at 13000 g for 20 min at 4°Cusing a centrifuge fitted with an 8 × 50.0 ml prechilled anglerotor (see Section 2.12).
5. The pellet is discarded and the supernatant is further clarified bycentrifugation at 80000 g for 45 min at 4°C to sediment themixed membrane fraction using an ultracentrifuge fitted with aprechilled rotor.
6. The protein in the supernatant is precipitated by the gradualaddition of solid ammonium sulfate to 90% saturation at 4°C(0.6 g ammonium sulfate per ml of supernatant; see Section2.14). After stirring for 20 min at 4°C the precipitated protein iscollected by centrifugation (13000 g for 20 min at 4°C) using acentrifuge fitted with an 8 × 50.0 ml prechilled angle rotor. Thepellet is resuspended in 50 mM Tris–HCl buffer pH 7.4 contain-ing 1 mM EDTA and 1 mM DTT and dialyzed (see Protocol 2.9)against 5.0 l of the same buffer (changed twice).
Groundwork 71

7. The dialyzed extracted protein is clarified by centrifugation(13000 g for 20 min at 4°C) before storage at –25°C.
8. The membrane pellet from the 80000 g centrifugation isremoved with a spatula and placed into a 5 ml Potter–Elvehjemhomogenizer (see Section 2.8). The membrane fraction is resus-pended in the membrane washing buffer before beingcentrifuged at 80000 g for 45 min.
9. The supernatant is discarded and the membrane is resuspendedas above in membrane resuspension buffer before beingaliquoted and stored at –25°C.
NOTES1. Prepare buffers fresh or from frozen stocks and use the highest
reagent grade available.
2. Check the data sheets provided by the reagent manufacturersand take appropriate Health and Safety precautions.
3. The buffer components will depend on the requirements of thetarget protein. The details provided in this Protocol are for theextraction of transglutaminase (E.C. 2.3.2.13) from 14-day-oldPisum sativum tissue.
72 Protein purification
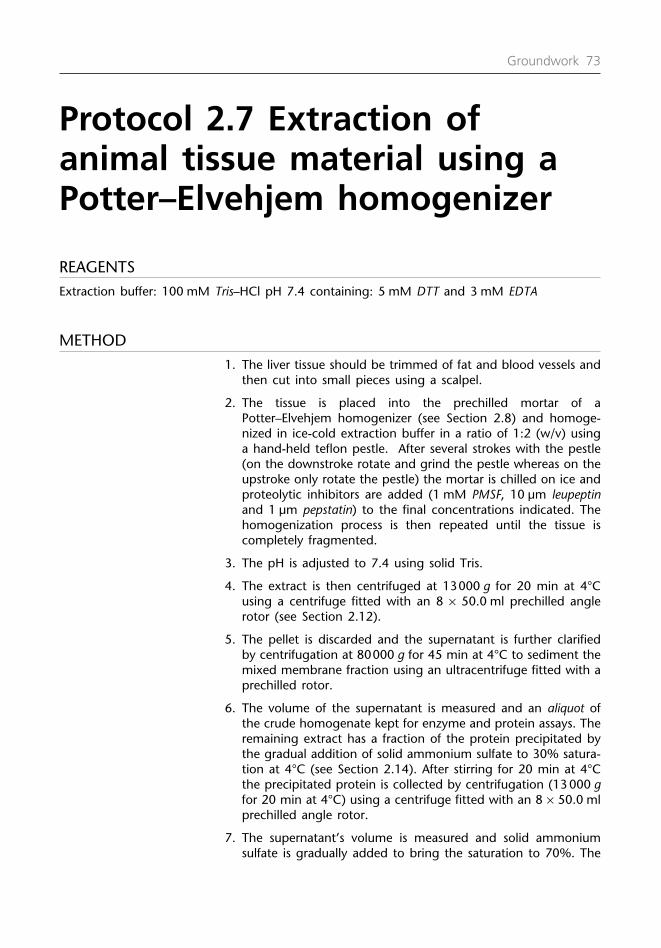
Protocol 2.7 Extraction ofanimal tissue material using aPotter–Elvehjem homogenizer
REAGENTSExtraction buffer: 100 mM Tris–HCl pH 7.4 containing: 5 mM DTT and 3 mM EDTA
METHOD1. The liver tissue should be trimmed of fat and blood vessels and
then cut into small pieces using a scalpel.
2. The tissue is placed into the prechilled mortar of aPotter–Elvehjem homogenizer (see Section 2.8) and homoge-nized in ice-cold extraction buffer in a ratio of 1:2 (w/v) usinga hand-held teflon pestle. After several strokes with the pestle(on the downstroke rotate and grind the pestle whereas on theupstroke only rotate the pestle) the mortar is chilled on ice andproteolytic inhibitors are added (1 mM PMSF, 10 µm leupeptinand 1 µm pepstatin) to the final concentrations indicated. Thehomogenization process is then repeated until the tissue iscompletely fragmented.
3. The pH is adjusted to 7.4 using solid Tris.
4. The extract is then centrifuged at 13000 g for 20 min at 4°Cusing a centrifuge fitted with an 8 × 50.0 ml prechilled anglerotor (see Section 2.12).
5. The pellet is discarded and the supernatant is further clarifiedby centrifugation at 80000 g for 45 min at 4°C to sediment themixed membrane fraction using an ultracentrifuge fitted with aprechilled rotor.
6. The volume of the supernatant is measured and an aliquot ofthe crude homogenate kept for enzyme and protein assays. Theremaining extract has a fraction of the protein precipitated bythe gradual addition of solid ammonium sulfate to 30% satura-tion at 4°C (see Section 2.14). After stirring for 20 min at 4°Cthe precipitated protein is collected by centrifugation (13 000 gfor 20 min at 4°C) using a centrifuge fitted with an 8 × 50.0 mlprechilled angle rotor.
7. The supernatant’s volume is measured and solid ammoniumsulfate is gradually added to bring the saturation to 70%. The
Groundwork 73

mixture is left stirring at 4°C for 20 min and the pellet iscollected by centrifugation (13000 g for 20 min at 4°C).
8. The supernatant’s volume is measured and solid ammoniumsulfate is gradually added to bring the saturation to 100%. Themixture is left stirring at 4°C for 30 min and the pellet iscollected by centrifugation (13000 g for 20 min at 4°C).
9. The three ammonium sulfate pellets are resuspended in 50 mMTris/HCl buffer pH 7.8 containing 0.1 mM EDTA and 1 mM DTTand separately dialyzed (see Protocol 2.9) against 5.0 l of thesame buffer (changed twice).
10. After dialysis the extracted protein is clarified by centrifugation(13000 g for 20 min at 4°C) and the volume of each fractionis measured.
11. A protein and enzyme assay is performed on the crudehomogenate and the three ammonium sulfate fractions todetermine the fraction enriched in transglutaminase (seeSections 1.11 and 2.4). The ammonium sulfate fractionenriched in transglutaminase is then stored at –70°C.
NOTES1. Prepare buffers fresh or from frozen stocks and use the highest
reagent grade available.
2. Check the data sheets provided by the reagent manufacturersand take appropriate Health and Safety precautions.
3. The buffer components will depend on the requirements of thetarget protein. The details provided in this Protocol are for theextraction of Type II (tissue) transglutaminase (E.C. 2.3.2.13)from guinea-pig liver.
74 Protein purification
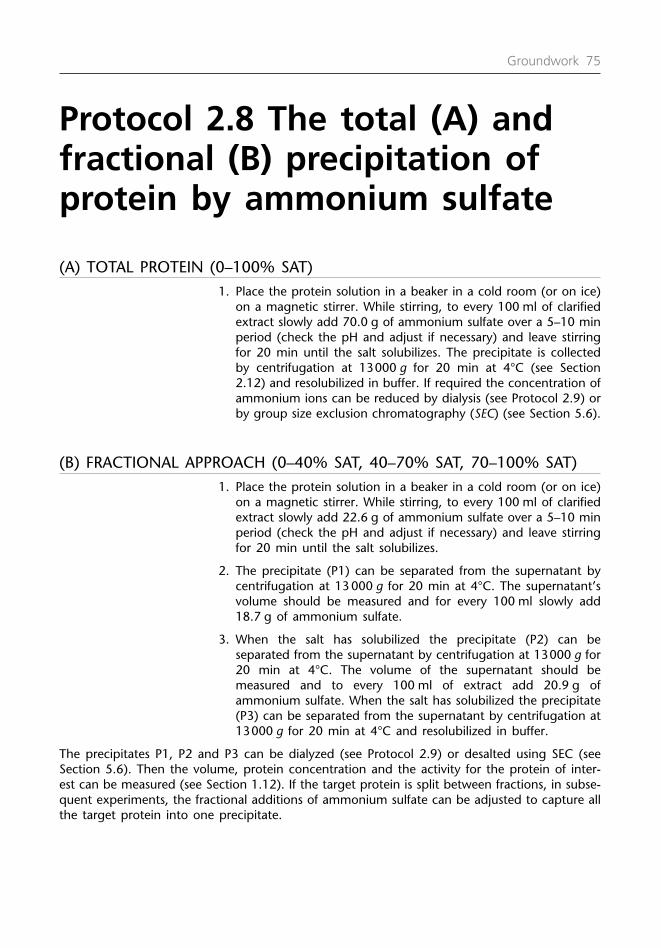
Protocol 2.8 The total (A) andfractional (B) precipitation ofprotein by ammonium sulfate
(A) TOTAL PROTEIN (0–100% SAT)1. Place the protein solution in a beaker in a cold room (or on ice)
on a magnetic stirrer. While stirring, to every 100 ml of clarifiedextract slowly add 70.0 g of ammonium sulfate over a 5–10 minperiod (check the pH and adjust if necessary) and leave stirringfor 20 min until the salt solubilizes. The precipitate is collectedby centrifugation at 13000 g for 20 min at 4°C (see Section2.12) and resolubilized in buffer. If required the concentration ofammonium ions can be reduced by dialysis (see Protocol 2.9) orby group size exclusion chromatography (SEC) (see Section 5.6).
(B) FRACTIONAL APPROACH (0–40% SAT, 40–70% SAT, 70–100% SAT)1. Place the protein solution in a beaker in a cold room (or on ice)
on a magnetic stirrer. While stirring, to every 100 ml of clarifiedextract slowly add 22.6 g of ammonium sulfate over a 5–10 minperiod (check the pH and adjust if necessary) and leave stirringfor 20 min until the salt solubilizes.
2. The precipitate (P1) can be separated from the supernatant bycentrifugation at 13 000 g for 20 min at 4°C. The supernatant’svolume should be measured and for every 100 ml slowly add18.7 g of ammonium sulfate.
3. When the salt has solubilized the precipitate (P2) can beseparated from the supernatant by centrifugation at 13000 g for20 min at 4°C. The volume of the supernatant should bemeasured and to every 100 ml of extract add 20.9 g ofammonium sulfate. When the salt has solubilized the precipitate(P3) can be separated from the supernatant by centrifugation at13000 g for 20 min at 4°C and resolubilized in buffer.
The precipitates P1, P2 and P3 can be dialyzed (see Protocol 2.9) or desalted using SEC (seeSection 5.6). Then the volume, protein concentration and the activity for the protein of inter-est can be measured (see Section 1.12). If the target protein is split between fractions, in subse-quent experiments, the fractional additions of ammonium sulfate can be adjusted to capture allthe target protein into one precipitate.
Groundwork 75
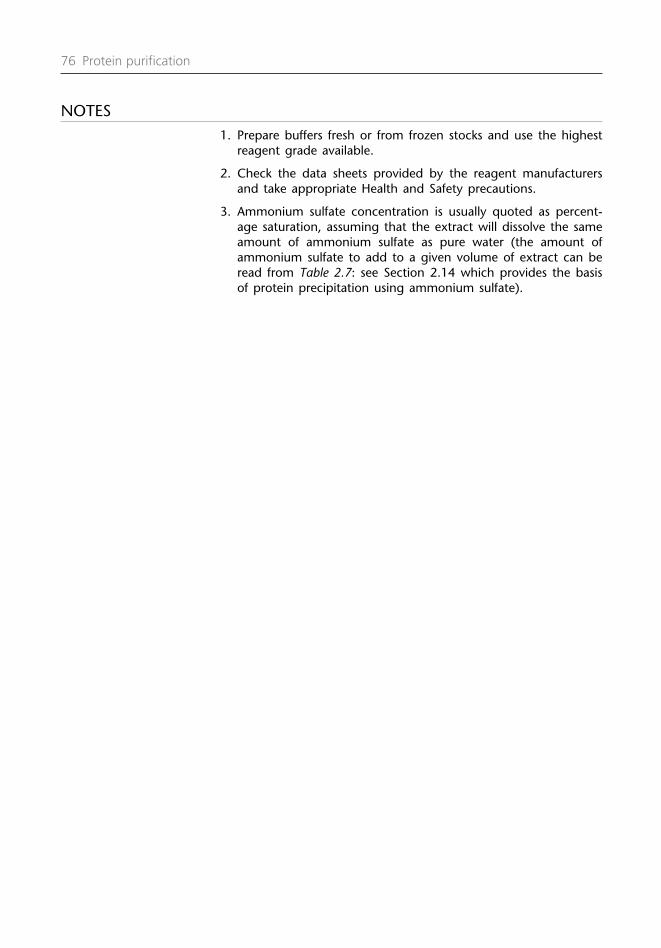
NOTES1. Prepare buffers fresh or from frozen stocks and use the highest
reagent grade available.
2. Check the data sheets provided by the reagent manufacturersand take appropriate Health and Safety precautions.
3. Ammonium sulfate concentration is usually quoted as percent-age saturation, assuming that the extract will dissolve the sameamount of ammonium sulfate as pure water (the amount ofammonium sulfate to add to a given volume of extract can beread from Table 2.7: see Section 2.14 which provides the basisof protein precipitation using ammonium sulfate).
76 Protein purification

Protocol 2.9 Preparation ofdialysis tubingDialysis (Visking) tubing is a semipermeable membrane that allows movement of moleculesbelow the Mr cut-off into and out of the dialysis bag. The tubing comes in a variety of differ-ent sizes, usually with an Mr cut-off of approximately 12000, but tubing with smaller and largerpore sizes can be obtained (Perbio, Pierce Ltd).
PREPARATION1. Place a length of dialysis tubing in a glass beaker and boil in 2%
(w/v) sodium bicarbonate and 0.05% (w/v) EDTA for 5 min toremove heavy metal ions.
2. Rinse in distilled water.
3. Boil in distilled water for 5 min.
4. Rinse in distilled water and then store at 4°C in 20% (v/v)ethanol or 0.05% (w/v) sodium azide until required.
SAMPLE DIALYSIS1. Cut a length of prepared dialysis tubing and tie a double knot
at one end (alternatively a bag sealer can be purchased, e.g.Perbio, Pierce Ltd).
2. Rinse the inside of the tube with distilled water and check forleaks.
3. Using a funnel carefully add the sample.
4. Expel the air from the tubing and tie another double knot at theend to seal the tubing. Remember to leave some room for theliquid to expand into.
5. Place the dialysis bag with the sample in a large beaker contain-ing buffer (e.g. the start buffer for the next chromatographicstep) at 4°C and stir (arrange the dialysis bag so that it does nottouch the stirring mechanism) for 3–4 h to allow the concen-tration of salt to reach equilibrium. Several changes of buffer maybe necessary to lower the salt concentration to the desired level.
NOTES1. Prepare buffers fresh or from frozen stocks and use the highest
reagent grade available.
Groundwork 77
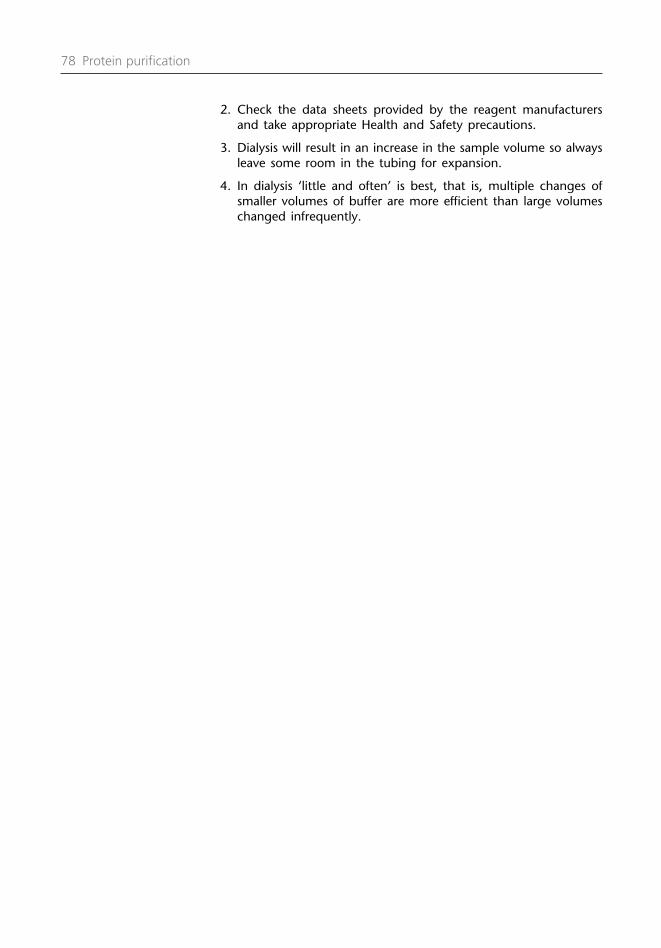
2. Check the data sheets provided by the reagent manufacturersand take appropriate Health and Safety precautions.
3. Dialysis will result in an increase in the sample volume so alwaysleave some room in the tubing for expansion.
4. In dialysis ‘little and often’ is best, that is, multiple changes ofsmaller volumes of buffer are more efficient than large volumeschanged infrequently.
78 Protein purification

Nonaffinity absorptiontechniques for purifyingproteins
3.1 Ion exchange chromatography (IEX)
Ion exchange chromatography is a versatile technique which can be usedfor the purification of biological components with charged functionalgroups, including: proteins, peptides, amino acids, nucleotides, nucleicacids and charged metabolites. The resins used in IEX are relativelyinexpensive, and they can be easily washed and sanitized ready for arepeat run using simple procedures. Ion exchange resins have a highcapacity for the biological material applied; during elution they show goodrecovery of biological activity (nondenaturing) and excellent resolution ofcomplex protein mixtures.
Proteins are derived from different genes and as such they will have adifferent quantity and content of amino acids. The differences in thecontent of amino acids with a charged functional group result in proteinswith different surface charge. The charges present in the functional groupsof the amino acids lysine, arginine, aspartic and glutamic are weak acids(although lysine and arginine are basic groups, because they are proto-nated (positive charge) at physiological pH and the charge is pH depen-dent they can be considered to be weak acids – see Table 3.1 and Section2.2).
Amino acids are zwitterionic molecules containing an amino group(basic) and a carboxyl group (acidic). These groups are weak acids showingpH-dependent ionization (Figure 3.1). At the pKa1, 50% of the carboxylgroup is in the ionized form and at pKa2 50% of the amino group is inthe ionized form.
Every protein has an amino group at the first amino acid and a carboxylgroup at the terminal amino acid. In addition, some amino acids withcharged functional groups (Table 3.1) will be pointing outwards from theprotein’s surface, interacting with water and so keeping the protein insolution. The presence of these surface charges means that proteins alsohave an overall charge which is dependent on the pH of the environment.At low pH the overall charge on the surface of a protein is positive andat high pH the overall charge on the surface of a protein is negative. Thereis a point on the pH scale when the positive charges are balanced out bythe negative charges and the overall charge on the protein’s surface is zero.This is described as the isoelectric point (pI) of a protein. At one pH unitabove a protein’s pI the overall charge on the protein will be negative and
3

at one pH unit below the pI of a protein the overall charge will be positive.At the pH values (pI ± 1.0) the protein will have sufficient charge to bindto a particle with an opposite charge (see Section 3.1) or move to anoppositely charged electrode under the influence of an electrical field (seeSection 6.1).
Approximately 70% of proteins have a pI between pH 4.0 and 7.0, whichmeans that at physiological pH most proteins have an overall negativecharge. At physiological pH (7.0) the amino acids aspartate and glutamatecontribute the negative charge on a protein’s surface (Table 3.1) and thepositive charge is contributed by arginine and lysine. In some organelles,for example lysosomes, the pH is approximately 5.0 and at this pH histi-dine will contribute a positive charge to a protein’s surface charge.
80 Protein purification
12
10
8
6
4
2
00 0.5 1.0 1.5 2.0
pH
OH– (equivalents)
Overall charge +ve zero -ve
pKa 2 = 9.6
pI = 5.97
pKa = 2.34
H3N–C–COOHpKa 1
H3 N–C–COO– H2 N–C–COO–H
H
+ H
H
H
H
pKa 2+
1
Figure 3.1
A pH titration curve for glycine.
Table 3.1 The charges on amino acid functional groups at pH 5 and 7
Amino acid Functional group pKa Charge Charge at pH 7 at pH 5
Primary amino acid –NH3+ ↔ –NH2 + H+ 9.5 +ve +ve
Terminal carboxyl group –COOH ↔ –COO– + H+ 2.5 –ve –veLysine (K) –NH3
+ ↔ –NH2 + H+ 10.5 +ve +veArginine (R) –NH3
+ ↔ –NH2 + H+ 12.5 +ve +veHistidine (H) ≥NH+ ↔ ≥NH + H+ 6.0 Negligible +veAspartate (D) –COOH ↔ –COO– + H+ 3.9 –ve –veGlutamate (Q) –COOH ↔ –COO– + H+ 4.3 –ve –ve

Ion exchange resins
There are two types of ion exchanger (Table 3.2): an anionic exchangeresin is positively charged and attracts negatively charged molecules(anions), and a cation exchange resin attracts positively charged molecules(cations). They can also be divided into strong and weak ion exchangers;this does not reflect the strength of binding of oppositely chargedmolecules but refers to their ionization range. Strong ion exchange resinsionize over a wider pH range than weak ion exchange resins.
A variety of different support matrices are available for IEX, including:cellulose, dextrans and agarose, which are suitable for low-pressure IEX.There are also more robust resins (cross-linked mixtures ofdextrans/acrylamide, polyacrylate, ceramic, polystyrene and silica)strengthened to withstand compression by elevated pressures and suitablefor use in medium- and high-pressure chromatography. The capacity ofthe resin to bind charged molecules is given by the number of functionalgroups present per gram of dried resin (mEq g–1) or per volume of hydratedresin (mEq ml–1). Often the maximum capacity of an IEX resin is compro-mised by steric hindrance of bound proteins and the available capacity tobind a standard protein such as bovine serum albumin (BSA) may bequoted in mg protein g–1 (or ml–1) of resin (typically 10–100 mg BSA ml–1
resin). This provides a guide to the amount of resin required for an IEXexperiment.
In addition, it is possible to avoid resins and columns and use IEXfunctional groups bonded to membranes as the stationary phase. Themobile phase can be pumped or centrifuged through membrane discs andthe sample is usually eluted isocratically using buffers with a fixed concen-tration of salt. The low volume occupied by the membranes and theimproved flow characteristics means that these IEX membranes can beutilized to concentrate large volumes of dilute protein solutions.
Binding and elution of protein to IEX resins
Ion exchange chromatography relies on the association between a chargedmolecule in the mobile phase and an oppositely charged group bonded toa stationary phase. The functional groups on the stationary phase’s surfaceare neutralized by oppositely charged counter ions in the mobile phase(e.g. Na+ for cation IEX and Cl– for anion IEX). When the protein sample
Nonaffinity absorption techniques 81
Table 3.2 Functional groups on cation and anion exchange resins
IEX matrix Functional Strong/weak Working Charge in the functional group group pH range working pH range
abbreviation
Diethylaminoethyl DEAE Weak anion 2.0–9.0 +veQuaternary ammonium Q Strong anion 2.0–12.0 +veQuaternary aminoethyl QAE Strong anion 2.0–12.0 +veCarboxymethyl CM Weak cation 6.0–10.0 –veMethyl sulfonate S Strong cation 4.0–13.0 –veSulfopropyl SP Strong cation 4.0–13.0 –ve
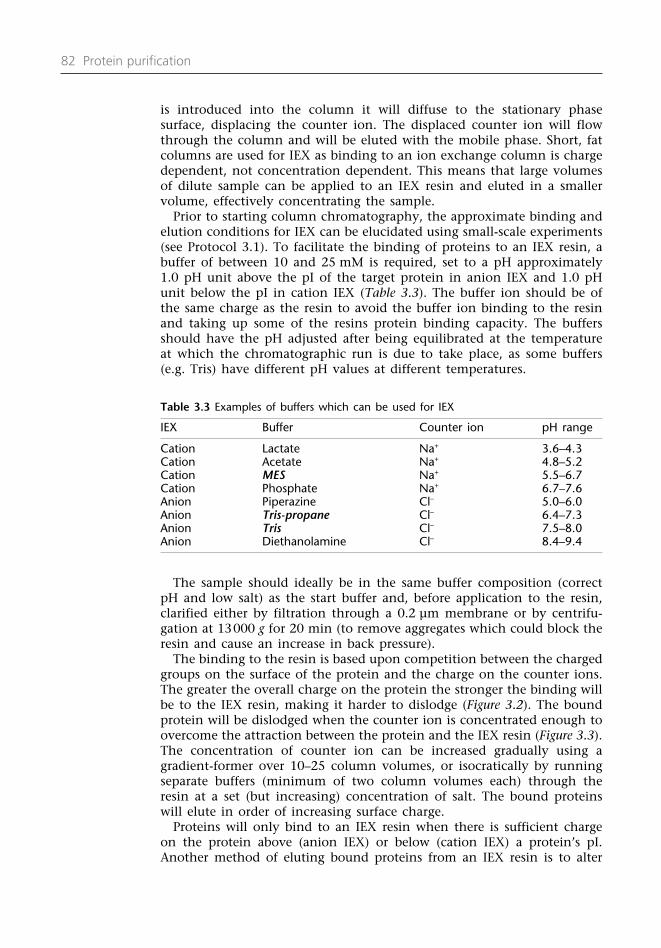
is introduced into the column it will diffuse to the stationary phasesurface, displacing the counter ion. The displaced counter ion will flowthrough the column and will be eluted with the mobile phase. Short, fatcolumns are used for IEX as binding to an ion exchange column is chargedependent, not concentration dependent. This means that large volumesof dilute sample can be applied to an IEX resin and eluted in a smallervolume, effectively concentrating the sample.
Prior to starting column chromatography, the approximate binding andelution conditions for IEX can be elucidated using small-scale experiments(see Protocol 3.1). To facilitate the binding of proteins to an IEX resin, abuffer of between 10 and 25 mM is required, set to a pH approximately1.0 pH unit above the pI of the target protein in anion IEX and 1.0 pHunit below the pI in cation IEX (Table 3.3). The buffer ion should be ofthe same charge as the resin to avoid the buffer ion binding to the resinand taking up some of the resins protein binding capacity. The buffersshould have the pH adjusted after being equilibrated at the temperatureat which the chromatographic run is due to take place, as some buffers(e.g. Tris) have different pH values at different temperatures.
The sample should ideally be in the same buffer composition (correctpH and low salt) as the start buffer and, before application to the resin,clarified either by filtration through a 0.2 µm membrane or by centrifu-gation at 13000 g for 20 min (to remove aggregates which could block theresin and cause an increase in back pressure).
The binding to the resin is based upon competition between the chargedgroups on the surface of the protein and the charge on the counter ions.The greater the overall charge on the protein the stronger the binding willbe to the IEX resin, making it harder to dislodge (Figure 3.2). The boundprotein will be dislodged when the counter ion is concentrated enough toovercome the attraction between the protein and the IEX resin (Figure 3.3).The concentration of counter ion can be increased gradually using a gradient-former over 10–25 column volumes, or isocratically by runningseparate buffers (minimum of two column volumes each) through theresin at a set (but increasing) concentration of salt. The bound proteinswill elute in order of increasing surface charge.
Proteins will only bind to an IEX resin when there is sufficient chargeon the protein above (anion IEX) or below (cation IEX) a protein’s pI.Another method of eluting bound proteins from an IEX resin is to alter
82 Protein purification
Table 3.3 Examples of buffers which can be used for IEX
IEX Buffer Counter ion pH range
Cation Lactate Na+ 3.6–4.3Cation Acetate Na+ 4.8–5.2Cation MES Na+ 5.5–6.7Cation Phosphate Na+ 6.7–7.6Anion Piperazine Cl– 5.0–6.0Anion Tris-propane Cl– 6.4–7.3Anion Tris Cl– 7.5–8.0Anion Diethanolamine Cl– 8.4–9.4

the pH of the eluting buffer. Using a gradient chamber, a descending pHgradient (in the case of anion IEX or ascending pH for cation IEX) can beformed with the high-pH buffer placed in the mixing chamber and a low-pH buffer placed in the other chamber. The solution (high pH) leaving themixing chamber to the column is replaced by an equal volume of the lowerpH buffer, resulting in a gradually decreasing pH of the buffer beingpumped onto the column. The proteins are eluted as the descending pHapproaches their pI. In practice, some proteins irreversibly denature as theyapproach their pI; elution from an IEX resin using a gradient with anincreasing salt concentration is the preferred method of elution from IEX.
If the pI of a target protein is not known, then binding to an anionexchange resin at pH 8.0 and elution of the bound protein using a gradi-ent of 0–2.0 M NaCl over 10 column volumes is a reasonable set of start-ing conditions. If the target protein is unbound then reapply the sampleto clean resin at a higher pH. If the target protein has bound to thecolumn but elutes late in the gradient profile at a relatively high saltconcentration, this means that the starting pH is more than 1.0 pH unitabove the protein’s pI, imparting a large negative surface charge. Figure 3.4outlines a flow chart for a typical anion IEX run for a protein with
Nonaffinity absorption techniques 83
Figure 3.2
A schematic representation of proteinbinding to anion IEX.
Figure 3.3
A schematic representation of protein elutingfrom anion IEX.
Low salt (Cl–)concentration
Medium salt (Cl–)concentration
High salt (Cl–)concentration
Negativelychargedproteins
Positively chargedanion exchange
resin
Cl–
Cl–
Cl–
Cl–
Cl–
Cl–
Cl–
Cl–
Cl–

unknown characteristics. The approach is empirical at all stages, ideally,the binding conditions should be chosen so that the target protein elutesrelatively early in the gradient profile and the salt gradient is sufficient togive the required resolution. At the early stages of purification a 10-foldincrease in the specific activity can be expected with IEX.
Regeneration and storage of IEX resins
After each IEX run the resin should be washed prior to the next run. Awash of 4.0 M NaCl will remove most tightly bound protein not elutedduring the chromatographic run. But to ensure complete removal oftightly bound proteins a wash of 0.5–1.0 M NaOH will clean and sanitizethe resin. The resin should be washed extensively with distilled water andthen reequilibrated with start buffer ready for another run. If another runis not imminent then the resin can be stored in a bactericide, either 0.05%(w/v) sodium azide or 20% (v/v) ethanol depending on the manufacturer’srecommendations.
3.2 Chromatofocusing
Chromatofocusing is a chromatographic technique that combines anionexchange chromatography with isoelectric focusing (IEF), separatingproteins according to their pI. The anion exchange resin and the proteins
84 Protein purification
Equilibrate the resin* at low salt in a 25 mM Tris buffer pH 8.0
Unbound (A) Bound (B)
Elutes early (C) Elutes late (D)Next experiment keep the same Next experiment lower the pH
starting conditions of the starting bufferKeep gradient conditions the same 0–2.0 M
Elute with a shallower gradient(e.g. 0–0.5 M)
Repeat until satisfactory Elutes early Elutes lateEquilibrate at a resolution is obtained Go to (C) Go to (D)
higher pH
Unbound BoundReapply to clean resin Apply a gradient to elute the proteinGo to (A) Go to bound (B)
*In general the choice of resin depends on the pH stability of the sample; at pH 8.0 both strong and weak anion IEX resins(Table 3.2) can be used. Different resins used at the same pH may produce some advantageous selectivity of the target molecule.
In the case of stages A, B, C and D the resin and sample must be equilibrated in the new starting buffer before anotherchromatographic run. This may require fresh sample, or dialysis/desalting (see Protocol 2.9 and Section 5.6) of a collectedsample.
Figure 3.4
A flow diagram of the events in a typical anion exchange chromatographyexperiment.

to be separated are equilibrated in a low ionic strength buffer at a set pH.Those proteins with a pI below the starting pH of the column will havean overall positive charge and will not bind to the column. Proteins witha pI above the preset pH will bind to the anion exchange resin. The boundproteins are eluted with (approximately 12.5 column volumes) an ampho-teric buffer (GE Healthcare or Biorad) set at a pH below the starting pH ofthe experiment. The eluting buffers have an even buffering capacity overthe set pH range and establish a pH gradient that is lower at the top ofthe column than at the bottom of the column. (The pH gradient is gener-ated in situ, which is in contrast to pH elution in IEX, where two buffersand a gradient mixer are used to generate a pH gradient.) At the start ofthe elution, when the pH falls below the starting pH, bound proteins (witha pI between the starting and finishing pH) will become positivelycharged. They will be repelled from the resin and start to migrate downthe column where they encounter increasing pH. At a point on the pHscale just beyond the protein’s pI it will again be negatively charged andwill be retained by the resin. As the pH gradient is developed within thecolumn, proteins will be dissociating and binding to the resin, graduallybeing focused and eluting at a pH near to the protein’s pI. Proteins withthe highest pI elute first and proteins with the lowest pI will elute last.Any protein which does not elute during the pH gradient can be removedfrom the column by washing with two column volumes each of 2.0 MNaCl and 1.0 M NaOH. The collected fractions can be assayed for thetarget protein, and the pH at which the protein eluted may be determined(the pH should be measured immediately after the chromatographic run
Nonaffinity absorption techniques 85
0.5
1.0
40 80 120 160Volume (ml)
Abs
orba
nce
280
nm
Act
ivity
(un
its m
l–1)(
)
pH (
)
200 240 280
504.5
5.0
5.5
100
Figure 3.5
Chromatofocusing of a peptidase isolated from germinating Vicia faba cotyledonson a narrow pH gradient.

to avoid interference by atmospheric CO2 which may solubilize, acidify-ing the solution and altering the pH). If a wide pH gradient, for examplepH 7–4 (approximately 70% of proteins have a pI between 4 and 7) hasbeen used initially, the target protein can be reapplied to the chromato-focusing resin and reequilibrated to be run over a narrow pH scale whichwill improve the resolution of the sample (Figure 3.5). If the target proteinelutes in the unbound fraction a gradient of lower pH is required, and ifthe protein remains bound to the resin a gradient of higher pH is required.
The amphoteric buffers used in chromatofocusing will interfere withprotein assays based upon the biuret reaction (Table 2.1 and see Protocols2.2 and 2.3) but they are compatible with the reagents in the Bradfordprotein assay (see Protocol 2.4). Salt precipitation (see Section 2.14), dialy-sis (see Protocol 2.9), size exclusion chromatography (SEC; see Section 5.1),affinity chromatography (see Section 4.1) and hydrophobic interactionchromatography (HIC; see Section 3.3) can be used to remove the ampho-teric buffers from the sample.
Some proteins may denature and precipitate as they approach their pIwhich may be overcome by increasing the amphoteric buffer concentra-tion or by adding a low concentration of NaCl. If this does not alleviatethe problem that results in loss of activity, then other chromatographicprocedures should be considered.
3.3 Hydroxyapatite chromatography
Hydroxyapaptite (HA) is the crystalline form of calcium phosphate(Ca10(PO4)6(OH)2) prepared by mixing calcium chloride and sodiumphosphate. The precipitate is collected and then boiled with either sodiumor ammonium hydroxide to produce the crystalline form. These crystalscan be used for chromatography but require careful handling as they areeasily fragmented, thus generating ‘fines’ which result in poor flow ratesdue to high back pressure. Hydroxyapatite encapsulated in agarose (HAUltrogel, Pall Ltd) or coated to a solid ceramic support (CHT; Biorad) canbe purchased and are easy to use.
The structure of hydroxyapatite has a surface comprised of pairs ofpositively charged calcium ions, triplet clusters of negatively chargedphosphates and hydroxyl groups. When protein is added to hydroxyap-atite the positively charged amino groups on the surface of the proteinare attracted to the phosphate groups and are repelled by the positivelycharged calcium ions. The carboxyl groups on a protein’s surface arerepelled by the phosphate groups and are attracted to the positivelycharged calcium groups (Figure 3.6). The interaction between the carboxylgroups and the calcium is greater than mere electrostatic attraction andinvolves the formation of coordination (dative) complexes (see Section4.4). Phosphate groups on proteins will also coordinate with the calciumgroups. The varied nature of these interactions makes it difficult to predictthe outcome of a chromatographic run.
A typical chromatographic run with hydroxyapatite involves loading asample in a low ionic strength buffer (1–10 mM phosphate pH 7.0) andeluting the bound acidic proteins with a phosphate gradient(100–400 mM). Alternative elution patterns after binding can include
86 Protein purification

washing with 5 mM MgCl2 to elute bound basic proteins followed by agradient of NaCl to elute proteins with a pI around 7.0, followed by agradient of phosphate (100–400 mM) to elute the acidic proteins. Ceramicfluoroapatite (Ca10(PO4)6(F2); Biorad) can also be used for the separation ofacidic proteins. The composite fluoroapatite and hydroxyapatite materialhas increased tensile strength and chemical stability in the low pH (5.0)range required to separate acidic proteins.
Hydroxyapatite can be a useful technique in a purification schedulebecause the interaction between the protein and the resin is not basedsolely on ionic interactions. It does require careful investigation of thebinding and elution conditions and may find merit when used late in apurification schedule (after IEX) to resolve components which are difficultto resolve by other chromatographic procedures.
3.4 Hydrophobic interaction chromatography (HIC)
Proteins have different quantities and contents of amino acids; thoseamino acids with hydrophobic functional groups that prefer to avoidcontact with water include: the amino acids with aliphatic functionalgroups isoleucine (I), leucine (L), valine (V), alanine (A), methionine (M)and those with aromatic functional groups phenylalanine (F) tyrosine (Y)and tryptophan (W). To avoid contact with water many of these residuesare buried in the core of the protein’s tertiary structure. Those that cannotbe accommodated in this way remain as hydrophobic patches near thesurface of a protein’s structure. To minimize their contact with water, thesurface hydrophobic residues may be surrounded or masked by neighbor-ing polar, more hydrophilic, amino acid residues. These hydrophobicsurface patches may be involved in the biological role of a protein, forexample when calmodulin binds calcium it changes conformation, exposing
Nonaffinity absorption techniques 87
Similar chargesrepelled
HAresin
OH
OH
OH
OH
A
OH
III
Ca2+ H3N+
H3N+
H3N+
H3N+
Ca2+
Ca2+
Ca2+COO–
COO–
OP
OP
PO2–4
2–4
2–4
PO2–4
OHOpposite charges
attracted
IIII
IIII
III
B
COO–
COO–
BA
HAresin
Figure 3.6
Protein binding to hydroxyapatite (A is a basic protein and B is an acidicprotein).
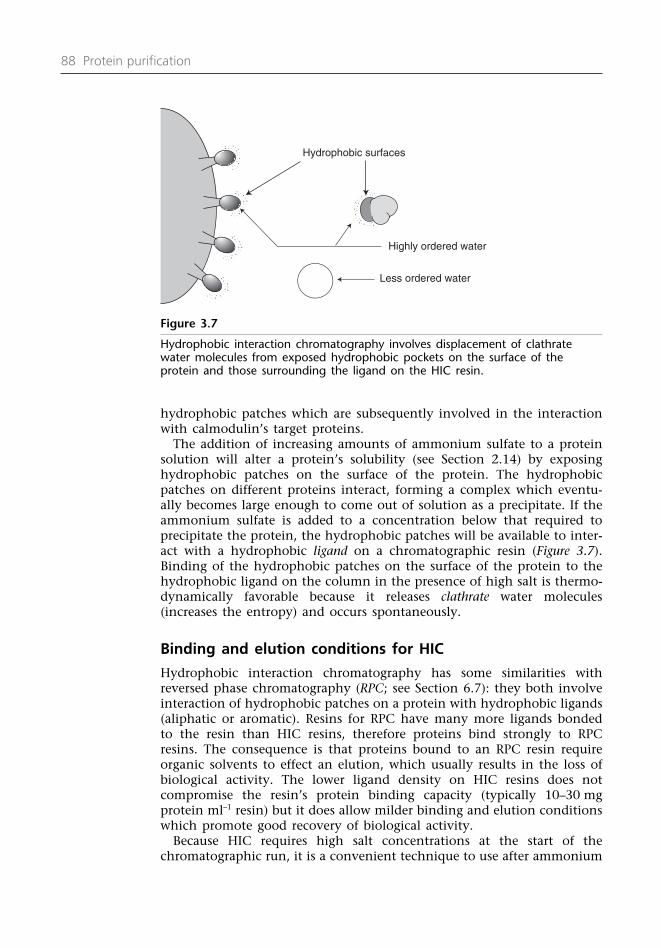
hydrophobic patches which are subsequently involved in the interactionwith calmodulin’s target proteins.
The addition of increasing amounts of ammonium sulfate to a proteinsolution will alter a protein’s solubility (see Section 2.14) by exposinghydrophobic patches on the surface of the protein. The hydrophobicpatches on different proteins interact, forming a complex which eventu-ally becomes large enough to come out of solution as a precipitate. If theammonium sulfate is added to a concentration below that required toprecipitate the protein, the hydrophobic patches will be available to inter-act with a hydrophobic ligand on a chromatographic resin (Figure 3.7).Binding of the hydrophobic patches on the surface of the protein to thehydrophobic ligand on the column in the presence of high salt is thermo-dynamically favorable because it releases clathrate water molecules(increases the entropy) and occurs spontaneously.
Binding and elution conditions for HIC
Hydrophobic interaction chromatography has some similarities withreversed phase chromatography (RPC; see Section 6.7): they both involveinteraction of hydrophobic patches on a protein with hydrophobic ligands(aliphatic or aromatic). Resins for RPC have many more ligands bondedto the resin than HIC resins, therefore proteins bind strongly to RPCresins. The consequence is that proteins bound to an RPC resin requireorganic solvents to effect an elution, which usually results in the loss ofbiological activity. The lower ligand density on HIC resins does notcompromise the resin’s protein binding capacity (typically 10–30 mgprotein ml–1 resin) but it does allow milder binding and elution conditionswhich promote good recovery of biological activity.
Because HIC requires high salt concentrations at the start of thechromatographic run, it is a convenient technique to use after ammonium
88 Protein purification
Hydrophobic surfaces
Highly ordered water
Less ordered water
Figure 3.7
Hydrophobic interaction chromatography involves displacement of clathratewater molecules from exposed hydrophobic pockets on the surface of theprotein and those surrounding the ligand on the HIC resin.
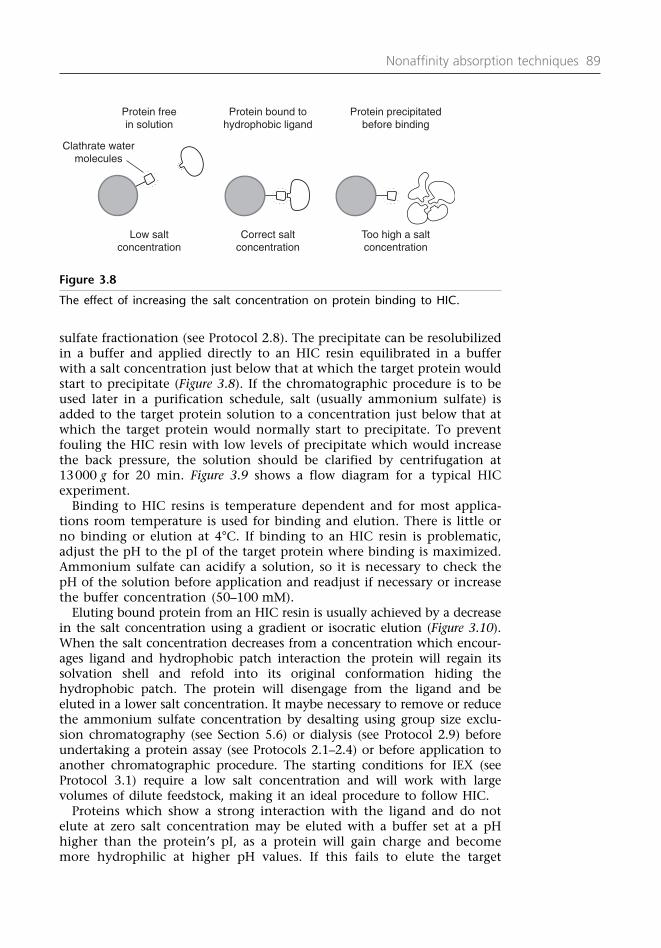
sulfate fractionation (see Protocol 2.8). The precipitate can be resolubilizedin a buffer and applied directly to an HIC resin equilibrated in a bufferwith a salt concentration just below that at which the target protein wouldstart to precipitate (Figure 3.8). If the chromatographic procedure is to beused later in a purification schedule, salt (usually ammonium sulfate) isadded to the target protein solution to a concentration just below that atwhich the target protein would normally start to precipitate. To preventfouling the HIC resin with low levels of precipitate which would increasethe back pressure, the solution should be clarified by centrifugation at13000 g for 20 min. Figure 3.9 shows a flow diagram for a typical HICexperiment.
Binding to HIC resins is temperature dependent and for most applica-tions room temperature is used for binding and elution. There is little orno binding or elution at 4°C. If binding to an HIC resin is problematic,adjust the pH to the pI of the target protein where binding is maximized.Ammonium sulfate can acidify a solution, so it is necessary to check thepH of the solution before application and readjust if necessary or increasethe buffer concentration (50–100 mM).
Eluting bound protein from an HIC resin is usually achieved by a decreasein the salt concentration using a gradient or isocratic elution (Figure 3.10).When the salt concentration decreases from a concentration which encour-ages ligand and hydrophobic patch interaction the protein will regain itssolvation shell and refold into its original conformation hiding thehydrophobic patch. The protein will disengage from the ligand and beeluted in a lower salt concentration. It maybe necessary to remove or reducethe ammonium sulfate concentration by desalting using group size exclu-sion chromatography (see Section 5.6) or dialysis (see Protocol 2.9) beforeundertaking a protein assay (see Protocols 2.1–2.4) or before application toanother chromatographic procedure. The starting conditions for IEX (seeProtocol 3.1) require a low salt concentration and will work with largevolumes of dilute feedstock, making it an ideal procedure to follow HIC.
Proteins which show a strong interaction with the ligand and do notelute at zero salt concentration may be eluted with a buffer set at a pHhigher than the protein’s pI, as a protein will gain charge and becomemore hydrophilic at higher pH values. If this fails to elute the target
Nonaffinity absorption techniques 89
Protein freein solution
Protein bound tohydrophobic ligand
Protein precipitatedbefore binding
Low saltconcentration
Correct saltconcentration
Too high a saltconcentration
Clathrate watermolecules
Figure 3.8
The effect of increasing the salt concentration on protein binding to HIC.

90 Protein purification
Equilibrate the resin at room temperature in a 50 mMTris buffer pH 8.0 containing ammonium sulfate*
Unbound (A) Bound (B)
Elutes early (C) Elutes late (D) Does not elute
Next experiment increase the pH Sequentially wash withof the starting buffer, keep (a) Buffer at a high pH
gradient conditions the same (b) 0–40% (v/v) ethanediol(starting ammonium sulfate (c) buffer at high pHconcentration down to zero) containing 1% v/v Triton
X-100
Next experiment elute witha shallower gradient
(e.g. starting ammonium sulfateconcentration down to zero) Does not elute**
Repeat until satisfactory resolution Elutes early Elutes late Switch to a differentis obtained Go to (C) Go to (D) chromatographic procedure
(i) Equilibrate at a lower pH and reapply to the same resin(ii) Reapply to a more hydrophobic resin (e.g. octyl or butyl)
*It is best to start with a phenyl HIC resin (the least hydrophobic ligand). The ammonium sulfate concentration at the start ofthe experiment should be just below the concentration which brings about the ‘salting out’ of the target protein.
In the case of stages A, B, C and D the resin and sample must be equilibrated in the new starting buffer before anotherchromatographic run. This may require fresh sample, or dialysis/desalting (see Protocl 2.9 and Section 5.6) of a collected sample.
**Wash the resin sequentially in 1.0 M NaOH (five column volumes), water (two column volumes), 30% (v/v) isopropanol (10column volumes and water (two column volumes). The resin can then be equilibrated in starting buffer for the next experimentor stored in 20% (v/v) ethanol.
Figure 3.9
A flow diagram of the events in a typical HIC experiment.
Clathrate watermolecules
Bindingin high salt
Elutionin low salt
HICresin
HICresin
Figure 3.10
Binding and elution from HIC is dependent on the salt concentration (high saltfor binding and low salt for elution).

protein, a gradient of 0–40% (v/v) ethanediol or a wash with a 1% (v/v)solution of a nonionic detergent (Tween or Triton) in a high-pH buffercan be used and if this elutes the target protein it will usually remainactive. Should the target protein elute in ethanediol or detergent, an alter-native ligand should be considered. It is better to start with the leasthydrophobic ligand (phenyl) before progressing onto the more hydropho-bic octyl (C8) and butyl (C5) ligands.
Regeneration and storage of HIC resins
To elute precipitated proteins, lipoproteins and lipids that show a verystrong interaction with the ligand, the resin can then be washed with fivecolumn volumes of 1.0 M NaOH followed by two column volumes ofwater and then 10 column volumes of 30% (v/v) isopropanol; alterna-tively, a two-column volume wash of 0.5% (v/v) of a nonionic detergentsuch as Triton X-100, followed by five column volumes of 70% (v/v)ethanol and five column volumes of water can be used. The resin can thenbe stored in 20% (v/v) ethanol or in a bactericide such as 0.05% (w/v)sodium azide (see manufacturer’s recommendations).
3.5 Hydrophobic charge induction chromatography (HCIC)
In traditional HIC, protein binding to the HIC ligand is controlled by theconcentration of lyotropic salts. In hydrophobic charge inductionchromatography (HCIC) the binding of proteins to the hydrophobic ligandis controlled by the pH.
The modified cellulose resin has 4-mercaptoethylpyridine (4-MEP; PallLtd; Figure 3.11) as the ligand and has been designed as an alternative toprotein A or protein G (see Protocol 4.1) for the purification of immunoglob-ulins from culture media, ascites fluid or blood serum. The MEP ligand’smode of binding to antibodies (typically 30.0 mg IgG ml–1 resin) involvesboth ‘pseudoaffinity’ molecular recognition by interacting with the Fc
region on the antibody and hydrophobic interactions at neutral pH. Thealiphatic spacer arm also contributes to the hydrophobic interactions withimmunoglobulins.
The bound antibody typically elutes from the resin around pH 5.0 asthe pH is reduced from the neutral pH binding conditions to pH 4.0(independent of the salt concentration); both the resin and the antibody
Nonaffinity absorption techniques 91
N
S
4-Mercaptoethylpyridine (4-MEP) pKa = 4.8
Figure 3.11
The structure of the MEP ligand head group.

gradually gather positive charge repelling each other (Figure 3.12). This isusually achieved by washing the resin isocratically with two columnvolumes of a 50 mM sodium acetate or citrate buffer at gradually decreas-ing pH values (e.g. pH 6.0, 5.5, 5.0, 4.5, 4.0 and 3.0). The exact elutionconditions for an antibody may vary depending on the source of theantibody, but by the adjustment of the elution conditions it may be possi-ble to elute the antibody substantially free from contaminating proteins(e.g. albumin). The resin can then be washed with two column volumesof 0.1 M acetic acid, 2 column volumes of 1.0 M NaOH and five columnvolumes of distilled water before being stored in 20% (v/v) ethanol.
The binding and elution of an antibody to HCIC is independent of thesalt concentrations (low-salt-binding conditions would help reducenonspecific interactions with other hydrophobic proteins), which makesit an ideal resin to use with large volumes of dilute antibody solutions.After elution the low-salt conditions mean that the eluted protein can besubmitted to another chromatographic procedure such as IEX. Althoughdesigned for the purification of immunoglobulins, the resin could be usedas an alternative to HIC resin for the purification of other proteins. Thebinding and elution conditions would have to be determined empirically.
3.6 Mixed mode chromatography (MMC)
Mercaptobenzimidazole sulfonic acid (MBI) is a zwitterionic ligand bondedto modified cellulose which interacts with immunoglobulins in a ‘mixedfunction’ mode. There is interaction with the Fc region of theimmunoglobulins (‘pseudoaffinity’) and electrostatic interaction betweenthe ligand and the immunoglobulin (the ligand remains negativelycharged throughout the procedure). At the binding conditions (typically30.0 mg IgG ml–1 resin) of 50 mM sodium acetate pH 5.0–5.5 in the
92 Protein purification
ADSORPTION
(hydrophobic association)
HIC
DESORPTION
(ionic repulsion)+
+ ++
+
++
Figure 3.12
Binding of IgG in HCIC involves weak hydrophobic interactions and elutioninvolves charge repulsion.
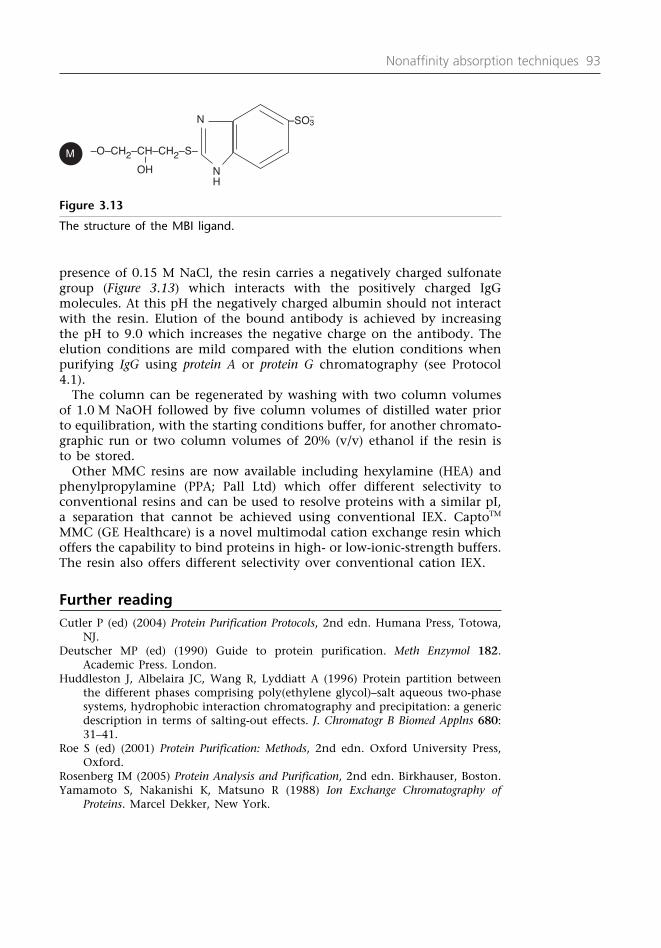
presence of 0.15 M NaCl, the resin carries a negatively charged sulfonategroup (Figure 3.13) which interacts with the positively charged IgGmolecules. At this pH the negatively charged albumin should not interactwith the resin. Elution of the bound antibody is achieved by increasingthe pH to 9.0 which increases the negative charge on the antibody. Theelution conditions are mild compared with the elution conditions whenpurifying IgG using protein A or protein G chromatography (see Protocol4.1).
The column can be regenerated by washing with two column volumesof 1.0 M NaOH followed by five column volumes of distilled water priorto equilibration, with the starting conditions buffer, for another chromato-graphic run or two column volumes of 20% (v/v) ethanol if the resin isto be stored.
Other MMC resins are now available including hexylamine (HEA) andphenylpropylamine (PPA; Pall Ltd) which offer different selectivity toconventional resins and can be used to resolve proteins with a similar pI,a separation that cannot be achieved using conventional IEX. CaptoTM
MMC (GE Healthcare) is a novel multimodal cation exchange resin whichoffers the capability to bind proteins in high- or low-ionic-strength buffers.The resin also offers different selectivity over conventional cation IEX.
Further reading Cutler P (ed) (2004) Protein Purification Protocols, 2nd edn. Humana Press, Totowa,
NJ.Deutscher MP (ed) (1990) Guide to protein purification. Meth Enzymol 182.
Academic Press. London.Huddleston J, Albelaira JC, Wang R, Lyddiatt A (1996) Protein partition between
the different phases comprising poly(ethylene glycol)–salt aqueous two-phasesystems, hydrophobic interaction chromatography and precipitation: a genericdescription in terms of salting-out effects. J. Chromatogr B Biomed Applns 680:31–41.
Roe S (ed) (2001) Protein Purification: Methods, 2nd edn. Oxford University Press,Oxford.
Rosenberg IM (2005) Protein Analysis and Purification, 2nd edn. Birkhauser, Boston.Yamamoto S, Nakanishi K, Matsuno R (1988) Ion Exchange Chromatography of
Proteins. Marcel Dekker, New York.
Nonaffinity absorption techniques 93
N
NH
–O–CH2–CH–CH2–S–
–SO3
OH
M
–
Figure 3.13
The structure of the MBI ligand.

Protocol 3.1 Small-scalescreening experiments toestablish the appropriatebinding and elution conditionsfor chromatographic resinsThis protocol describes a small-scale screening with an anion exchange resin but the principlecan be applied to other chromatographic resins (the starting and eluting buffers may changefor other resins).
EQUIPMENT10 ml of washed anion exchange resin (after the preservative has been removed) in an equalvolume of distilled and deionized water
A microfuge and 1.5 ml microfuge tubes
200–1000 µl pipette and appropriate pipette tips
10 ml each of 25 mM bis-Tris–propane–HCl buffer adjusted to pH 6.5 and 7.0. Also 10 ml eachof the buffers at the set pH value containing 0.5, 1.0 and 2.0 M NaCl
10 ml each of 25 mM Tris–HCl buffer adjusted to pH 7.5, 8.0, 8.5 and 9.0. Also 10 ml each ofthe buffers at the set pH value containing 0.5, 1.0 and 2.0 M NaCl.
10 ml of homogenate clarified by centrifugation at 13000 g for 20 min (see Protocol 2.8 ifammonium sulfate precipitation to concentrate the protein in the extract is required). Theextract should be essentially salt-free before ion exchange chromatography (IEX) and should beeither dialyzed (see Protocol 2.9) against 10 mM Tris buffer pH 7.5 or subjected to group sizeexclusion chromatography (see Section 5.6) using either Sephadex G25/G50 or Biogel P6/P10equilibrated in 10 mM Tris buffer pH 7.5
METHOD1. Slurry the resin by gently swirling the resin in the distilled water.
Allow the bulk of the resin to settle and remove any floatingparticles (‘fines’). Repeat this two or three times until the liquidabove the settled resin looks clear.
2. Cut the bottom 5 mm from the end of the 1.0 ml pipette tip.
3. Dispense 1.0 ml of the resin slurry into six microfuge tubesusing the 200–1000 µl pipette and the cut pipette tip.
94 Protein purification

4. Centrifuge the tubes in the benchtop microfuge at 2000 g for1 min.
5. Pipette off the liquid and add 1.0 ml of the buffers at differentpH values to each tube (remember to label the tubes) andcentrifuge the tubes in the microfuge at 2000 g for 1 min.Remove the liquid and repeat three times. (A)
6. In a separate microfuge tube add 0.5 ml of the appropriatebuffer to 0.5 ml of the extract. Centrifuge at 10000 g for 5 minto clarify any precipitation. Then add 0.5 ml of the extract atdifferent pH values to the IEX resin equilibrated at that pHvalue, retaining 0.5 ml for assay. (B)
7. Gently mix the resin and buffered extract for 1 min by invert-ing the tube.
8. Centrifuge the tubes in the benchtop microfuge at 2000 g for1 min.
9. Remove the liquid and place in a separate labeled microfugetube. (C)
10. Add 0.5 ml of the appropriate buffer containing 0.5 M NaCl tothe microfuge. Gently mix the resin, centrifuge and remove theliquid into a labeled microfuge as described above. (D)
11. Repeat this for the buffers containing 1.0 M and 2.0 M NaCl.(E and F)
ANALYZING THE RESULTS1. Measure the volume of the retained liquid (A–F) and measure
for protein concentration (see Protocols 2.1–2.4) and the biolog-ical activity of the target protein (see Section 2.4).
2. Determine the specific activity, total activity, fold purity andpercentage recovery (see Section 1 .11 and Exercise 1.1) for eachfraction.
3. For IEX the ideal starting condition will give 100% binding (atand above a pH value) with 100% recovery (at a salt concen-tration), coupled with a 5–10-fold increase in the fold purity (thebinding, recovery and increases in the purity will depend on theresin being used).
4. After analysis, these screening experiments can be repeated tofine tune the starting and elution conditions before starting thescaled-up chromatographic procedures.
5. For a protein to bind to an anion exchange resin, the pH of thebuffer has to be approximately >1.0 above the pI of the protein.The minimum pH for binding to the anion IEX resin will indicatea pI value for the target protein.
Nonaffinity absorption techniques 95

NOTES1. Prepare buffers fresh or from frozen stocks and use the highest
reagent grade available.
2. Check the data sheets provided by the reagent manufacturersand take appropriate Health and Safety precautions.
3. Use the highest quality water available to make the buffers andfilter through 0.2 µm membrane before use.
4. Conduct the experiment at the temperature at which thechromatographic run is to be conducted; this will depend onthe thermal stability of the target protein.
5. Check and adjust the pH of the buffers at the working temper-ature, as some buffers (e.g. Tris) show alterations in the pH withtemperature.
96 Protein purification

Affinity procedures forpurifying proteins
4.1 Affinity chromatography
Proteins are synthesized from the information contained within the gene;as a result they have a different content of charged, hydrophobic and totalamino acids. All proteins possess these physical properties and the differ-ences in these parameters can be exploited to purify proteins. Proteins aresynthesized for a unique cellular role and this property can also beexploited to purify a protein from a complex mixture.
Affinity chromatography does not exploit the physical differencesbetween proteins; instead it relies upon a target protein’s unique biospeci-ficity to provide the means to resolve the target protein from a complexprotein mixture. It involves a reversible interaction between a ligand (e.g.a small molecule such as an enzyme substrate or a macromolecule such asIgG) immobilized on a resin (stationary phase) and a target protein in asolute (mobile phase). The technique was originally developed as a meansto purify enzymes, but it has expanded to cover a wide variety of differ-ent interactions, including: the interaction between nucleic acids, antibod-ies with antigens (immunoaffinity chromatography), receptors withagonists, glycoproteins with lectins (sugar-binding proteins) and ligandswith intact cells or cell membranes.
For example, enzymes will bind with a high affinity to their substratesbecause their active sites are stereospecific. Therefore a substrate (ligand)immobilized onto a resin can be used to bind the target enzyme to theexclusion of other proteins present in the mixture (Figure 4.1). Otherenzymes will not bind to the ligand because their active sites do not matchthe three-dimensional shape of the ligand, they will percolate through theresin and elute in the unbound fraction. The enzyme can then be elutedfrom the resin in a highly purified format. In theory, affinity chromatog-raphy provides the means to purify and concentrate a target protein inone chromatographic step from a complex mixture, but in practice,successful one-step purifications are rare and affinity chromatography isusually used in conjunction with other chromatographic procedures (IEX,HIC, and SEC) to successfully purify a protein of interest.
Resins used in affinity chromatography
There is a wide choice of support resins available for affinity chromatog-raphy, including: agarose, Sephadex, polyacrylamide and silica. If the resinis porous (agarose or Sepharose) a large pore size (particle size 50–400 µm)will help to prevent size exclusion effects. In addition, the resin should bechemically stable during ligand coupling and during the chromatographyof the target protein.
4

Affinity ligands
Prior knowledge about the protein (substrate specificity, cofactor require-ments, inhibitor/activator profile) of interest will help determine thechoice of a good ligand for affinity chromatography.
98 Protein purification
Complex protein mixture
Target protein
Immobilized ligand
Target bound to resin; wash to remove nonspecifically bound protein
Displacement
Nonspecific displacement NaCl pH
Specific displacementHigh conc. of natural substrate
Dialysis or SECRestore to
optimum pH
Purifiedenzyme
Matrix
Spacer
Figure 4.1
The basis of affinity chromatography.

P + L ↔ PLprotein + ligand protein–ligand complex
The equilibrium/dissociation (affinity) constant (Ka) for the interactionbetween a protein and a ligand is given by
Ka= [[PP]L[L
]]
where [PL] is the concentration of the protein–ligand complex, [P] is theconcentration of the protein and [L] is the concentration of free ligand.A value for Ka can be determined using equilibrium dialysis (kits availablefrom Perbio Pierce Ltd) and values ranging between 10–5 and 10–11 M areusually required for a good affinity ligand. When a ligand is bound to aresin it no longer has completely free movement and the value for Ka
between a protein and a ligand can be up to a 1000-fold less when theligand is bound to a resin. All affinity ligands should ideally not leak fromthe column during the elution process.
Affinity chromatography depends upon reversible binding to a ligand;a strong interaction may mean that harsh elution conditions have to beused to disrupt the protein–ligand interaction which may result in adenatured target protein. If a strong interaction between the ligand and thetarget protein is observed it may be possible to alter the chemistry of theligand to reduce the strength of the binding.
Large ligands (e.g. proteins) can be directly attached to a resin but smallmolecules may require the presence of a spacer arm to allow interactionbetween the ligand and the target protein in the mobile phase. The spacerarm is usually six to 10 carbons (or equivalent) in length (e.g. 1,6-diamino-hexane or 6-aminohexanoic acid) and the nature of the spacer arm(hydrophobic or hydrophilic) can be an important additional factor in theinteraction between the ligand and the target protein. Many of thecommercially available affinity resins have spacer arms attached for ligandbinding (Table 4.1). The reaction schemes for two popular activated resinsare shown in Figures 4.2 and 4.3.
Designing a specific affinity ligand for a protein can be difficult andexpensive, so it may be possible to exploit a general property of a targetprotein to purify all the proteins in a complex mixture with the same
Affinity procedures for purifying proteins 99
O–C=N
OH
Cyanogen-bromide-activated matrix
Protein with anamino group
Isoureaderivative
+ R–NH2
(pH 7–9)
(16 h)
O–C–NHR
=
OH
NH
Matrix
Figure 4.2
Coupling of proteins with a free amino group to a cyanogen-bromide-activatedmatrix.

general property (e.g. glycoproteins). After elution, other chromatographictechniques can be used to isolate the target protein from the group-specificmixture. There are commercially available affinity resins with group-specific ligands preattached (Table 4.2); these resins are available for low-and high-pressure chromatography systems.
Binding and elution conditions for affinity chromatography
The ideal binding and elution conditions for affinity chromatographymust be determined experimentally and can initially be determined on a
100 Protein purification
Table 4.1 Commercially available activated matrices for coupling ligands
Name Coupling groups Comments Supplier*
Affi 10 (coupling Proteins with available –NH2 N-Hydroxysuccinimide esters Bioradproteins pI >6.5) andAffi 15 (coupling protein pI <6.5)
Epoxy activated Coupling of free thiols, Conditions: pH 9–13 for GE Healthcare sepharose hydroxyls and amino 16–72 h
groups Useful for small ligands
Affi gel Hz Coupling of glycoproteins Bioradvia oxidized aldehyde in a carbohydrate residue
Thiopropyl Sepharose Coupling via thiols GE Healthcare
Cyanogen activated Proteins with available –NH2 Conditions: pH 7–9 for 16 h GE HealthcareSepharose 4B No spacer arm
EAH Sepharose Coupling of ligands with Use water-soluble N-ethyl-N’- GE Healthcarefree carboxyl groups (3-dimethylaminopropyl)
carbodiimide HCl (EDC)
EAH Sepharose Coupling of ligands with Use EDC GE Healthcarefree amino groups
AminoLink (gel and Coupling through primary Lysine and the terminal Perbio Piercekit format) amino groups amino group
MicroLink peptide kit Coupling through Sulfhydryl containing Perbio Piercesulfhydryl groups peptides and proteins
Reacti-Gel CDI Coupling through free (a) Three different matrices Perbio Piercesupports amino groups at pH 9–11.0 (b) Stable imidazolyl
carbamate attachment
OCH2CONH(CH2)2NHCO(CH2)2C–ON X–C–N–R + H–O–N
O O
OH
O
+ R–NH2
=
O
XO
Figure 4.3
The coupling of proteins with a free amino group to Affi gel 10.

small scale (adapt the method described in Protocol 3.1). Binding isconducted in a buffer (containing cofactors if required, e.g. metal ions) setat a pH which encourages an interaction between the target protein andthe ligand (e.g. pH optimum of an enzyme). If the affinity interactioninvolves any hydrophobic forces the inclusion of 0.1–0.5 M NaCl maypromote binding and overcome nonspecific interactions with the ligand.Slow flow rates (10 cm h–1) and long, thin columns can also promote affin-ity interactions. A flow diagram of a typical affinity chromatographyexperiment is shown in Figure 4.4.
The protein bound to the ligand will be in equilibrium with free ligandand free protein (protein moving on and off the resin). If the ligandconcentration is high and there is a strong association between the targetprotein and ligand, the free protein will be immediately captured by freeligand resulting in a concentrated band of target protein at or near to thetop of the resin. The elution conditions will move the equilibrium in favorof free protein resulting in the target protein eluting in a single sharp peak.High concentrations of substrate or inhibitor in a buffer can be used tospecifically displace ligand-bound enzymes. Alternatively, displacementmay be achieved by the inclusion of EDTA in the eluting buffer if theprotein has a metal ion requirement.
Often specific displacement will not remove the target protein from theaffinity ligand and nonspecific displacement conditions have to beemployed. Increasing the salt concentration to 1.0 M NaCl or decreasingthe pH can be used. Care must be taken to quickly return the elutedfractions to the ideal pH for the target protein to minimize active proteinloss due to denaturation. Denaturation of the eluted protein can beminimized by reducing the dead volume between the column outlet andthe fraction collector. In addition, a small volume of concentrated buffer(e.g. 1.0 M Tris pH 8.5) can be placed into the collection tubes which willminimize the time the target protein spends in the low pH buffer.Nonspecific elution conditions can provide good recovery of the targetprotein but may result in poor recovery of biological activity. If the proteinstill remains bound to the column, elution with a buffer containing either3 M KSCN, 2 M potassium iodide, 4 M MgCl2, 8 M urea, 6 M guanidine/HCl,or 10% (v/v) dioxane can be tried. After elution, dialysis (see Protocol 2.9)or size exclusion chromatography (see Section 5.6) can be used to separatethe target enzyme from contaminating low molecular mass components.If the ligand is a protein, the nonspecific elution conditions may also
Affinity procedures for purifying proteins 101
Table 4.2 Some examples of commercially available group-specific ligands
Ligand Target proteins
Protein A or protein G ImmunoglobulinsBenzamidine Serine proteasesCalmodulin Calmodulin binding proteinsLectin Glycoproteins (see Table 4.3)Cibacron blue Dehydrogenases, kinases and albumin5’AMP, ATP DehydrogenasesNAD+, NADP+ DehydrogenasesHeparin Lipoproteins, coagulation factors (DNA and RNA)Lysine Plasminogen (rRNA and dsDNA)

compromise the integrity of the ligand, effectively resulting in a ‘one-use’affinity matrix.
Affinity chromatography can be a highly resolving technique but someof the nonspecific elution conditions can result in poor yields due todenaturation and incorrect refolding of the target protein. The loss ofactivity may be a problem if the eluted protein is to be used for kineticanalysis but may not be of consequence if the eluted protein is to be usedto generate antibodies.
Regeneration and storage of affinity resins
Cleaning the resin will depend on the nature of the ligand. Resins coupledto low Mr substrates can be washed with low (e.g. 1.0 M CH3COOH) and
102 Protein purification
(A) Choose an appropriate ligand
(B) Bind ligand to the resin (Table 4.1)Equilibrate resin (and sample) in appropriate binding conditions
Apply the sample (at a slow flow rate)
Target protein does Target protein does not bind Target protein bindsnot bind and elutes but elutes as a broad bandin the unbound fraction in the latter fractions of
the unbound fraction Specific displacement Non-specific displacement
Rebind the ligand viaanother reactive group Try altering the starting Elute with a High salt(go to B) conditions (pH, salt or concentration of e.g.
cofactors) or repack the substrate/inhibitorresin in a long, thin column Change pH (2.5)*
Use another ligand(activator/inhibitor) Target protein elutes(go to A) Then try**
3 M KSCNDialysis or SEC 0.1% (w/v) SDS
If appropriate try a (to remove substrate) 10% (v/v) dioxanegroup-specific ligand
Check purity Protein elutes
Dialysis or SEC toremove eluant and
refold the target protein
Check purity
*Put an aliquot of high pH buffer into the tubes of the fraction collector to quickly restore ideal conditions for the target protein.**Use of these conditions may compromise the recovery of biologically active material. But it may still be suitable for theproduction of antibodies.
Figure 4.4
A flow diagram of the events in a typical affinity chromatography experiment.
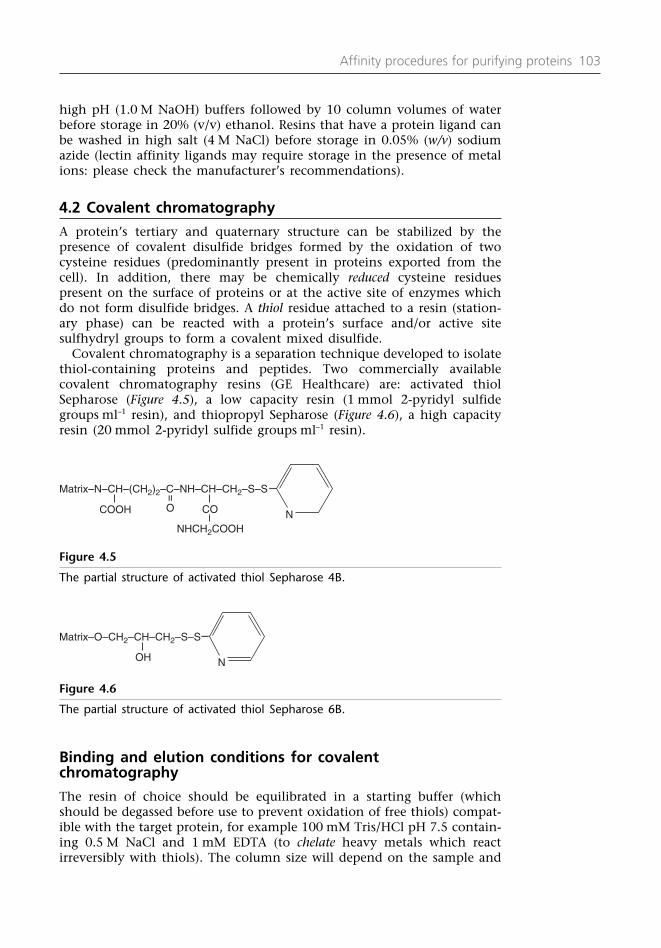
high pH (1.0 M NaOH) buffers followed by 10 column volumes of waterbefore storage in 20% (v/v) ethanol. Resins that have a protein ligand canbe washed in high salt (4 M NaCl) before storage in 0.05% (w/v) sodiumazide (lectin affinity ligands may require storage in the presence of metalions: please check the manufacturer’s recommendations).
4.2 Covalent chromatography
A protein’s tertiary and quaternary structure can be stabilized by thepresence of covalent disulfide bridges formed by the oxidation of twocysteine residues (predominantly present in proteins exported from thecell). In addition, there may be chemically reduced cysteine residuespresent on the surface of proteins or at the active site of enzymes whichdo not form disulfide bridges. A thiol residue attached to a resin (station-ary phase) can be reacted with a protein’s surface and/or active sitesulfhydryl groups to form a covalent mixed disulfide.
Covalent chromatography is a separation technique developed to isolatethiol-containing proteins and peptides. Two commercially availablecovalent chromatography resins (GE Healthcare) are: activated thiolSepharose (Figure 4.5), a low capacity resin (1 mmol 2-pyridyl sulfidegroups ml–1 resin), and thiopropyl Sepharose (Figure 4.6), a high capacityresin (20 mmol 2-pyridyl sulfide groups ml–1 resin).
Affinity procedures for purifying proteins 103
Matrix–N–CH–(CH2)2–C–NH–CH–CH2–S–S
NO CO
NHCH2COOH
COOH
Matrix–O–CH2–CH–CH2–S–S
NOH
Figure 4.5
The partial structure of activated thiol Sepharose 4B.
Figure 4.6
The partial structure of activated thiol Sepharose 6B.
Binding and elution conditions for covalentchromatography
The resin of choice should be equilibrated in a starting buffer (whichshould be degassed before use to prevent oxidation of free thiols) compat-ible with the target protein, for example 100 mM Tris/HCl pH 7.5 contain-ing 0.5 M NaCl and 1 mM EDTA (to chelate heavy metals which reactirreversibly with thiols). The column size will depend on the sample and

typically low flow rates (5–10 cm h–1) are used during the run. The reactionscheme for covalent chromatography is shown in (Figure 4.7) whichinvolves displacement of pyridine 2-thione by the thiol groups present onthe protein. The pyridine 2-thione absorbs light at 343 nm and can beused to monitor protein binding to the column.
After washing to remove nonspecifically bound protein the covalentlybound protein can be eluted with a buffer at pH 8.0 containing either:5–25 mM L-cysteine, 20–50 mM 2-mercaptoethanol (useful because 2-MEcan be removed by freeze drying) or 20–50 mM dithiothreitol (DTT).Different thiol containing proteins maybe eluted by sequential elutionwith these reducing agents. Unreacted pyridine 2-thione will also elute withthe protein but can easily be removed by desalting using SEC (see Section
104 Protein purification
S–SMatrix
N
S–S–R + S=
S–S
NH
N
SH + protein-SH
(Absorbance 343 nm)
Purified protein
Regenerated resin
+
Protein–SH Protein with a free thiol
2,2–Dipyridyl disulfide
Cysteine,2-ME, DTT
S–S
N
N
Figure 4.7
The reaction scheme for covalent chromatography on activated thiol Sepharose.

5.6). Alternatively, prior to protein elution washing the column with50 mM sodium acetate buffer pH 4.0 containing 4 mM 2-ME or DTT willdisplace the unreactive pyridine 2-thione. The column can be reequili-brated in at pH 8.0 before eluting the covalently bound protein (as above).
Regeneration and storage of covalent chromatographyresins
The column can be regenerated by passing two column volumes ofsaturated 2,2¢-dipyridyl disulfide (stir 40 mg disulfide in 50 ml buffer atroom temperature for a few hours; remove the insoluble material andadjust to pH 8.0) in buffer at pH 8.0 through the resin. The column canthen be washed with buffer pH 8.0 containing 0.05% (w/v) sodium azideand stored at 4°C.
4.3 Dye ligand affinity chromatography
Aromatic triazine dyes bound to a support matrix (Sepharose or agarose)have been shown to selectively bind proteins. They were originally identi-fied using SEC in the presence of dextran blue (see Section 5.1) as theelution volumes of certain proteins were altered because the proteins hadbound to the Cibacron blue FG-3A dye on the dextran. It has beensuggested that the structure of the dyes (Figure 4.8) resembles the struc-ture of nucleotide cofactors (e.g. NAD+); indeed dehydrogenases and otherproteins can be competively eluted from dye ligand resins using substratesor cofactors, but other proteins (e.g. endonucleases and albumin) bind todyes without a cofactor requirement. The interaction between a proteinand a dye appears to involve both hydrophobic and ionic interactions,making predictions about binding difficult.
A range of different triazine dyes attached to resins in small-volumecolumns is available for screening the suitability of the technique for thetarget protein of interest. Once the appropriate dye has been established
Affinity procedures for purifying proteins 105
N
NNH
NH2
N
NHNH
SO3H
SO3H
SO3H
C1O
O
Figure 4.8
The structure of Cibacron blue FG-3A triazine dye. Reproduced from P. Cutler(ed.) (2004) Protein Purification Protocols, 2nd edn, Chapter 17, Figure 1(a), p.152, Humana Press, Totowa, NJ.

the dye can be purchased and attached to an activated resin (Table 4.1)via the reactive chloro group.
The correct pH for binding usually lies between pH 7.0 and 8.5 andelution is usually achieved by increasing the salt concentration up to 1.0 MNaCl or by inclusion of an affinity displacement agent. The gel can beregenerated by washing in 2 M NaCl, 1.0 M NaOH or 6 M guanidine/HCl.
4.4 Immobilized metal (ion) affinity chromatography (IMAC)
In covalent bonding, one atom shares an electron with another atomwhereas in coordinate (dative) bonding one atom provides both electronsfor another atom to share. Metal ions such as Cu2+, Hg2+, Cd2+, Zn2+ ortransition metal ions such as Ni2+, Co2+ or Mn2+ can accept pairs ofelectrons from electron-rich atoms to form coordinate bonds.
Some amino acids present in a protein’s structure have electron-rich atomsat a physiological pH, including: the imidazole group of histidine, the thiolgroup of cysteine, and the indole group of tryptophan which can form dativebonds with metal ions. In addition, at approximately pH 3.0 the amino acidswith acid residues (glutamate and aspartate) and the phosphorylated aminoacids (phosphoserine, phosphothreonine and phosphotryrosine) can formcoordinate bonds with trivalent metal ions (e.g. Fe3+, Al3+ and Ga3+). The latterinteraction has proved useful for studying the phosphoproteome although thelow pH of the binding conditions may prevent recovery of active proteins.
Commercially available IMAC resins typically have either iminodiacetate(IDA) or nitrilotriacetate (NTA) bound via a spacer arm to Sepharose oragarose (Figure 4.9).
At above pH 3.0 the carboxyl groups on the resin become electron richwhen they are deprotonated. When a metal ion is added to the resin, acomplex can form with the electron-rich nitrogen and carboxyl groups onthe resin. The metal ion is held in the complex by coordinate bondingbut it still retains the ability to complex with additional electron-richatoms present on the surface of a protein.
106 Protein purification
H2OH2O
OO
O
O
O
MM
NN
CO
CO
CO
CO
CH
CH2
CH2
CH2
CH2
H2O
CO
(a) (b)
Figure 4.9
The partial structures of iminodiacetate and nitrilotriacetate bonded to a matrix.
(a) The tridentate iminodiacetic acid adsorbent charged with a metal ion having coordination number 4(e.g. Cu2+). One valency is occupied by H2O and remains for biopolymer interaction.
(b) The quadridentate nitrilotriacetic acid adsorbent charged with a metal ion of coordination number 6(e.g. Ni2+). Two valencies are occupied by H2O and remain for biopolymer interaction.

At a physiological pH the nitrogen atom in the imidazole group of histi-dine is electron rich (Table 3.1) and able to form coordinate bonds withmetal ions immobilized on the resin. Other electron rich atoms in cysteineand tryptophan can also complex with the immobilized metal ion buthistidine residues in proteins form the major complexes. Different proteinshave a different number of accessible histidine residues, forming the basisof the chromatographic separation. At higher pH values (>9.0) selectivityis lost as the amino group on every protein’s first amino acid starts tobecome deprotonated and electron rich.
Binding and elution conditions for IMAC
The resin should be washed in 5 mM EDTA to remove any trace metal ionsand then loaded with a solution of the metal ion of choice. Copper, nickelor zinc ions are popular choices for IMAC, with copper ions providingstronger binding (the most appropriate metal ion should be determinedempirically). The metal-ion-binding capacity of the resin should be known(see manufacturer’s data sheets) and a concentration of metal ions shouldbe applied to fill 75–80% of the column’s metal-ion-binding capacity. Forexample: a 1.0 ml Hitrap® resin (GE Healthcare) has a metal-ion-bindingcapacity of 23 µmol. To achieve approximately 80% of the total capacity,apply 1.0 ml of an 18 mM solution of the chosen metal ion. This leaves thebottom of the column free to entrap any metal ion released during theelution process. After the application of the metal ions the column shouldbe washed with three column volumes of distilled and deionized water, thenthree column volumes of starting buffer that is compatible with the metalion on the column and with the target protein to be applied to the column.
As mentioned previously, protein adsorption is best achieved under neutralconditions in the absence of chelating agents. Phosphate buffers form insol-uble salts at neutral pH with some metal ions, and Tris buffers have chelat-ing properties which can be used to reduce the strength of the interactionbetween the protein-bound histidine and the resin. All starting buffers shouldcontain 0.5–1.0 M NaCl to reduce nonspecific electrostatic interactions.
Elution is achieved by displacement at neutral pH with imidazole(0–250 mM), histidine, glycine or ammonium chloride. Alternatively,decreasing the pH (0.05–0.1 M sodium acetate buffer pH 6.0–4.0) willprotonate the histidine residues on the target protein and release themfrom their interaction with the metal ion. Approximately 70% of proteinshave their pI between pH 4.0 and 7.0 and they may denature and formprecipitates as they approach their pI; for this reason elution by displace-ment should be attempted first. Denaturing agents such as urea or guani-dine/HCl can be included to help overcome the problem of proteinprecipitation. These additions can be removed by dialysis (see Protocol 2.9)or size exclusion chromatography (see Section 5.6).
Regeneration and storage of IMAC resins
After elution of the target protein the column can be stripped of metalions by a wash with 50 mM EDTA and the resin can be stored in 0.05%(w/v) sodium azide or 20% (v/v) ethanol.
Affinity procedures for purifying proteins 107

4.5 Immunoaffinity chromatography
IgG antibodies can be purified from antisera, ascites fluid or from culturesupernatant using affinity chromatography with protein A or protein G (Table4.2 and Protocol 4.1). Alternatively, IgG can be purified using IEX (seeSection 3.1), hydrophobic charge induction chromatography (see Section3.5) and mixed mode chromatography (see Section 3.6). The purifiedantibody can be specific for a protein from one species or it may show cross-reactivity with the same protein from different species. In immunoaffinity(immunoadsorption) chromatography the antibody, or fragment of theantibody, is bound to an activated resin (Table 4.1) and used to select outthe target protein (antigen) from a complex protein mixture. Binding of theIgG via free amino groups using activated resins will randomly orientatesome of the antibody in a configuration which will not allow an interac-tion with the target antigen, thus reducing the capacity of the column.
Protein A (or protein G) does not bind to the IgG in the variable region,so by first binding IgG to protein A agarose (see Protocol 4.1) and thencovalently cross-linking the IgG to the protein A, it is possible to constructan immunoaffinity column with all the bound IgG free to interact with theantigen in solution. (IgG orientation kits are available from Perbio Pierce,Ltd.) Alternatively, as IgG is a glycoprotein it can be bound to an activatedhydrazine resin (Table 4.1) via its saccharide residues which will alsocorrectly orientate the IgG to maximize the binding capacity of the resin.
Binding and elution conditions for immunoaffinity resins
Binding conditions for immunoaffinity chromatography are usually at pH7.0 in the presence of 0.5 M NaCl to prevent nonspecific interactions. Aslow flow rate (30 cm h–1) can be used to encourage antibody and antigeninteraction. Alternatively, the output from the column can be recycled tothe column input for a period of time before washing the column toremove the unbound material. Low levels of detergents (0.05% (v/v) Tween80 or Triton X-100) can be included in the wash to improve the removalof the nonspecifically bound proteins. This should be followed by exten-sive washing with buffer prior to elution.
The specificity between an antibody and its antigen is high and thisprovides the means to extract and concentrate a target protein from acomplex protein mixture. But because the specificity is high, harsh elutionconditions may have to be employed to prise the target protein from theantibody complex. A low pH buffer (e.g. 0.1 M glycine/HCl, pH 2.8) iscommonly used and the target protein should elute in a sharp peak.Denaturation of the eluted protein can be minimized by reducing the deadvolume between the column outlet and the fraction collector. Theaddition of a small volume of concentrated buffer (e.g. 1.0 M Tris pH 8.5)into the collection tubes will minimize the time the target protein spendsin the low pH buffer. These elution conditions usually guarantee goodrecovery of protein but poor recovery of activity. After the bound proteinhas been released the column should be quickly washed in a neutral pHbuffer, to help prevent irreversible denaturation of the bound IgG andthen stored in a preservative, for example 0.05% (w/v) sodium azide.
108 Protein purification
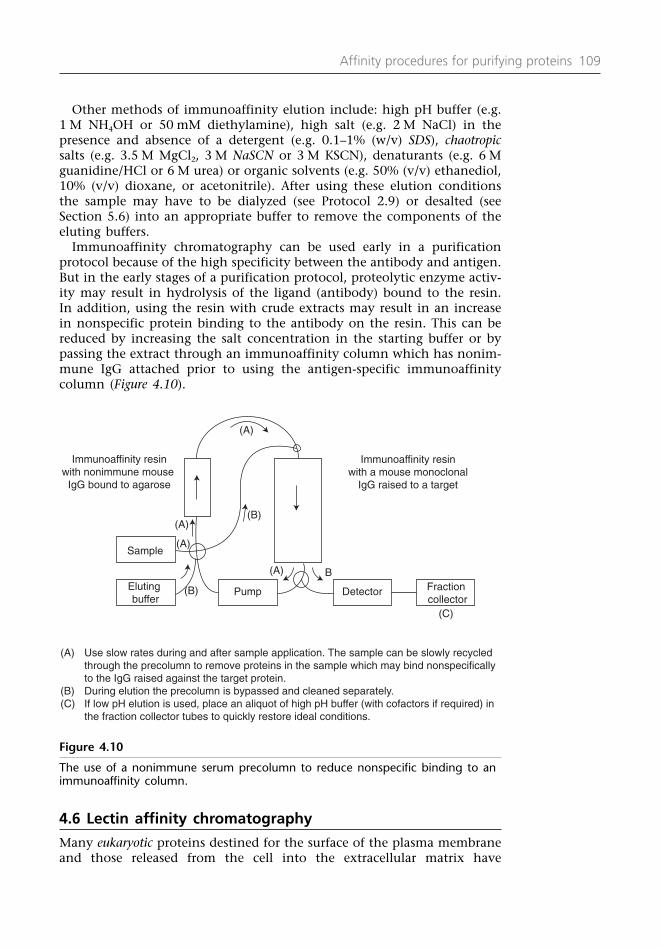
Other methods of immunoaffinity elution include: high pH buffer (e.g.1 M NH4OH or 50 mM diethylamine), high salt (e.g. 2 M NaCl) in thepresence and absence of a detergent (e.g. 0.1–1% (w/v) SDS), chaotropicsalts (e.g. 3.5 M MgCl2, 3 M NaSCN or 3 M KSCN), denaturants (e.g. 6 Mguanidine/HCl or 6 M urea) or organic solvents (e.g. 50% (v/v) ethanediol,10% (v/v) dioxane, or acetonitrile). After using these elution conditionsthe sample may have to be dialyzed (see Protocol 2.9) or desalted (seeSection 5.6) into an appropriate buffer to remove the components of theeluting buffers.
Immunoaffinity chromatography can be used early in a purificationprotocol because of the high specificity between the antibody and antigen.But in the early stages of a purification protocol, proteolytic enzyme activ-ity may result in hydrolysis of the ligand (antibody) bound to the resin.In addition, using the resin with crude extracts may result in an increasein nonspecific protein binding to the antibody on the resin. This can bereduced by increasing the salt concentration in the starting buffer or bypassing the extract through an immunoaffinity column which has nonim-mune IgG attached prior to using the antigen-specific immunoaffinitycolumn (Figure 4.10).
Affinity procedures for purifying proteins 109
(A)
(A)
(A)
(A)
(C)
(B)
B
(B) Pump Detector Fractioncollector
Elutingbuffer
Sample
Immunoaffinity resinwith a mouse monoclonal
IgG raised to a target
Immunoaffinity resinwith nonimmune mouse
IgG bound to agarose
(A) Use slow rates during and after sample application. The sample can be slowly recycled through the precolumn to remove proteins in the sample which may bind nonspecifically to the IgG raised against the target protein.
(B) During elution the precolumn is bypassed and cleaned separately.(C) If low pH elution is used, place an aliquot of high pH buffer (with cofactors if required) in
the fraction collector tubes to quickly restore ideal conditions.
Figure 4.10
The use of a nonimmune serum precolumn to reduce nonspecific binding to animmunoaffinity column.
4.6 Lectin affinity chromatography
Many eukaryotic proteins destined for the surface of the plasma membraneand those released from the cell into the extracellular matrix have

110 Protein purification
Tab
le 4
.3Th
e co
mm
on l
ectin
s us
ed t
o fr
actio
nate
gly
cop
rote
ins
Lect
inSp
ecifi
city
Use
ful
elue
nts
Use
s
Con
cana
valin
A,
from
Can
aval
iaα-
D-M
anno
side
with
fre
e hy
drox
yl
(a)
0.01
–0.5
M m
ethy
l-α-
Sep
arat
ion
of g
lyco
pro
tein
sen
sifo
rmis
(Jac
k be
an)
(req
uire
s gr
oup
s at
C3,
C4
and
C6
D-m
anno
side
Bind
ing
effic
ienc
y is
red
uced
in
Mn2+
and
Ca2+
for
bind
ing
(b)
D-M
anno
seth
e p
rese
nce
of a
det
erge
nt(c
)D-G
luco
se
Lens
cul
inar
isTe
rmin
alα-
D-m
anno
side
or
(a)
Met
hyl-α
-D-g
luco
side
Gly
cop
rote
ins
bind
les
s st
rong
ly
α-D-g
luco
side
(b)
0.15
M m
ethy
l-α-
than
Con
cana
valin
AD-m
anno
side
Bind
ing
take
s p
lace
in
the
(c)
0.1
M N
a bo
rate
pH
6.5
pre
senc
e of
0.1
% (
w/v
) so
dium
deox
ycho
late
Use
ful
for
the
isol
atio
n of
mem
bran
e gl
ycop
rote
ins
Triti
um v
ulga
risN
-Ace
tyl- D
-glu
cosa
min
e0.
1 M
N-A
cety
l-D-g
luco
sam
ine
Bind
ing
take
s p
lace
in
the
pre
senc
e of
0.1
% (
w/v
) so
dium
deox
ycho
late
Purif
icat
ion
of R
NA
pol
ymer
ase
tran
scrip
tion
fact
ors
Rici
nus
com
mun
isα-
D-G
alac
tosi
de0.
15 M
D-g
alac
tose
Jaca
linfr
om A
rtoc
arpu
s in
tegr
ifolia
α-D-G
alac
tosi
de(a
) O
-link
ed s
ugar
s 20
mM
(a
) Se
par
atio
n of
O-li
nked
sug
ars
α-m
ethy
lgal
acto
side
(b)
IgA
fro
m I
gG(b
) 80
0m
M D
-gal
acto
se
Gal
anth
us n
ival
isM
ultip
leα(
1–3)
man
nose
res
idue
s0.
5 M
met
hyl-α
-D-m
anno
side
M
ouse
IgM
Man
nan
bind
ing
pro
tein
. Te
rmin
al n
on-r
educ
ing
suga
r (a
) 25
mM
man
nose
M
ouse
IgM
Req
uire
s C
a2+(p
art
of
resi
dues
, m
anno
se,
N-a
cety
l-(b
) N
-Ace
tyl-D
-glu
cosa
min
em
amm
alia
n co
llect
in f
amily
D-g
luco
sam
ine
Glc
NA
c, f
ucos
eof
lec
tins)
and
gluc
ose

oligosaccharides attached. The oligosaccharides may be attached post-translationally, immediately after synthesis (N-linked) and during theprotein’s progress through the endomembrane system (O-linked andGPI-linked). The oligosaccharides attached are complex, branched struc-tures built up from many different saccharides and after the addition ofoligosaccharides the proteins are termed glycoproteins.
Lectins are proteins which have an affinity for saccharides and as suchthey will interact with the saccharide residues on the surface of glyco-proteins, glycopeptides, membranes and cells. They have a quaternarystructure (usually tetrameric) and if composed of different subunits theycan bind more than one type of saccharide. There are commercial sourcesof lectin affinity resins (Table 4.3) or they can be attached to preactivatedresins (Table 4.1). If using a preactivated resin, protection must be givento the lectin’s saccharide binding by using an appropriate saccharide(Table 4.4).
Binding and elution conditions for lectin affinitychromatography
If the saccharide content of the target glycoprotein is not known then arange of resins should be tested prior to packing the resin in a column(adapt the method in Protocol 3.1). A long, thin column can be used toresolve mixtures of glycoproteins and short, fat columns can be used forunwanted glycoprotein abstraction from a protein mixture containing thetarget protein (nonglycopeptide). The binding of glycoproteins to lectincolumns involves hydrophobic, not ionic, interactions, allowing thesample to be applied in high salt concentrations. If required, low concen-trations of appropriate metal ions (Table 4.3) should be included in thechromatographic buffers (avoid the use of chelating agents, e.g. EDTA) andthe resins should be used between pH 3 and 10.
The sample can be applied and the column can be washed to removeunbound material. The later volumes of the unbound fraction may includeglycoproteins (retarded) that have only a weak interaction with the resin.
The column can be eluted isocratically by a buffer containing the appro-priate saccharide or by a gradient of saccharide (Table 4.3). Altering thepH, switching to a borate buffer (which forms complexes with glycopro-teins) or washing with 0–40% (v/v) ethanediol may effect an elution ofactive material.
Affinity procedures for purifying proteins 111
Table 4.4 Protective saccharides used when coupling a lectin to a preactivated resin(see Table 4.1)
Lectin Protective saccharide
Concanavalin A Methyl-α-D-mannosideL. culinaris Methyl-α-D-mannosideT. vulgaris Chitin oligosaccharides R. communis Methyl-α-D-galactosideJacalin D-Galactoside

Regeneration and storage of lectin resins
Strongly bound glycoproteins can be removed using detergents (0–5%(w/v) SDS) in 6 M urea with heat. This will denature both the glycopro-tein and the resin bound lectin. After use the resin can be stored in abuffer (with appropriate low concentrations of metal ions if required) inthe presence of a bactericide, for example 0.05% (w/v) sodium azide.
4.7 Purification of recombinant proteins
When affinity chromatography is used in a purification protocol withcrude cell lysates it has the necessary credentials to purify a target proteinin a single chromatographic step. However, affinity chromatography resinscan be expensive to design and make, and they are usually used after thetarget protein has been partially purified using salt precipitation (seeSection 2.14) and IEX or HIC (see Sections 3.1 and 3.4). This is primarilybecause the target protein may be present at a fraction of a percentage ofthe total protein. A partially purified preparation applied to an affinitychromatography resin would reduce nonspecific interactions and be essen-tially free from proteolytic enzymes (important if a protein ligand is used).
However, it may not be possible to purify the large amounts of proteinfrom natural sources required for structural studies, kinetics analysis or for theproduction of therapeutic proteins. If the gene for the target protein is avail-able it is possible to incorporate it into an expression plasmid and overpro-duce the recombinant protein in a prokaryotic (e.g. Escherichia coli), fungal (e.g.Picchia) or eukaryotic (e.g. yeast, insect and mammalian) cell line. Theincrease in total protein in itself would significantly help the purificationprocess. But the expression system also allows the addition of affinity compo-nents or signal sequences which facilitate the target protein’s purification.
The gene for the target protein can be placed in an expression vectorunder the control of an inducible operon (e.g. in E. coli the lac operoncan be induced by isopropylthiogalactoside, IPTG). The N-terminus of aprotein does not appear to play a major functional role in most proteinsand affinity/signal sequence additions at the N-terminus can range froma few amino acids to a complete protein (Table 4.5). After plasmid induc-
112 Protein purification
Table 4.5 Examples of some fusion systems that can be used to purify recombinant proteins
Purification tag Mr Ligand Elution
β-Galactosidase 116 000 APTG (p-aminophenyl-β- Borate pH 10.0D-thiogalactose)
Glutathione S-transferase 26000 Glutathione GlutathioneChloramphenicol 24000 Chloramphenicol ChloramphenicolacetyltransferaseProtein A 31000 IgG pH 3.5Maltose binding protein 40000 Amylose MaltoseFlag peptide Asp-Tyr-Lys-Asp- Anti Flag antibody pH 3.5
Asp-Asp-Asp-LysPoly Arg (Arginine)5 IEX Salt gradient6 His (Histidine)6 IMAC ImidazoleCys (Cysteine)4 Thiopropyl 2-ME or DTT

tion and cell growth, the target protein can be recovered by cell lysis (seeSection 2.10). The target protein’s N-terminal addition can be used topurify the protein by binding and elution from an affinity resin. The affin-ity label can then be removed to reveal a homogeneous preparation of thetarget protein (see examples below).
Expression of recombinant proteins in E. coli is popular, although thehigh levels of expression (up to 40% of the total cell protein) may resultin the production of insoluble cytoplasmic aggregates of the target proteincalled inclusion bodies. After extraction, the inclusion bodies can becollected by centrifugation (13 000 g for 20 min); the aggregates thenrequire solubilization, purification and refolding of the protein which willreduce the final yield. Another problem with the expression of eukaryoticproteins in prokaryotes is that they do not have the necessary enzymes tocorrectly add eukaryotic post-translational modifications (e.g. glycosylation)which may be required for the correct folding of the protein and forachieving biological functionality. For post-translationally modifiedproteins a eukaryotic expression system may be required.
4.8 IMAC for purifying recombinant proteins
Six consecutive histidine residues in a protein’s sequence is unlikely to occurin the proteome of any cell. A sequence of six histidines placed at the N-terminus of a recombinant protein will result in it binding strongly to anIMAC resin loaded with either Cu2+ or Ni2+ ions. The presence of the 6 Histag may not interfere with the functionality of the target protein but it canbe removed by the action of peptidases (Qiagen Ltd) or by the inclusion ofa proteolytic cleavage sequence (Table 4.6) after the 6 His sequence and priorto the N-terminal amino acid of the target protein. The peptide fragmentcan be removed from the target protein by size exclusion chromatography(see Section 5.1). One of the major advantages of using the 6 His affinitylabel to purify recombinant proteins is that the binding to IMAC can occurin the presence of detergents, which makes it a technique suitable for thepurification of proteins from inclusion bodies (Figure 4.11).
Affinity procedures for purifying proteins 113
Table 4.6 Cleavage peptides used in fusion proteins
Peptide Method Product
N-Met-C (5) Cyanogen bromide N-Met and CN-Asp-Pro-C (6) Acid N-Asp and Pro-CN-Lys/Arg-C (7) Trypsin N-Lys/Arg and CN-Glu/Asp-C (8) V-8 protease N-Glu/Asp and CN-Lys-Arg-C (9) Clostropain N-Lys-Arg and CN-(Lys)n/(Arg)n (10) Carboxypeptidase B n(Lys)/n(Arg) and NN-Asp-Asp-Lys-C (11) Enterokinase N-Asp-Asp-Lys and CGlu-Ala-Glu-C (12) Aminopeptidase I Glu-Ala-Glu and CN-Ile-Glu-Gly-Arg-C (13) Factor Xa N-Ile-Glu-Gly-Arg and CN-Pro-X-Gly-Pro-C (14) Collagenase N-Pro-X and Gly-Pro-C
The amino acid sequences above (where X indicates any amino acid) have been used infusion proteins to allow a specific hydrolysis reaction. Depending on the hydrolysismethod, these cleavage peptides may be used with fusion polypeptides linked at either orboth their amino and carboxy termini. These are indicated as N and C polypeptidesrespectively.

4.9 Fusion proteins for purifying recombinant proteins
A popular method for the purification of recombinant proteins is to fusethe target protein to a protein (e.g. glutathione S-transferase, IgG, ormaltose-binding protein) that is easy to purify by affinity chromatography.In addition, if the presence of the target protein is difficult to monitor,fusion to an enzyme (Table 4.5, e.g. β-galactosidase) with an easy colori-metric assay can also provide a means to monitor the presence of the target
114 Protein purification
6 His taggedrecombinant protein Native protein
Plasmid
Nativecell lysis
Wash20–50mMImidazole
pH 6.3
100–250mMImidazole
pH 5.9or 4.5
Elute
Native proteins Denatured nativeproteins
Denatured recombinantprotein (may require
refolding)
Purified recombinantprotein
Denaturing cell lysis8M urea or
6M guandine HCL
Binding to column
Figure 4.11
Purification of 6 His tag recombinant proteins in denaturing and nondenaturingconditions.

protein as it is being purified. After cell lysis the fusion protein can bepurified by affinity chromatography followed by treatment with a prote-olytic enzyme to cleave a sequence (Table 4.6) spanning the protein fusion.The two proteins can then be separated by reapplication to the affinityresin used to isolate the fusion protein from the cell extract (Figure 4.12).
Affinity procedures for purifying proteins 115
Unbound material elutes
Specific displacement of X
Proteolytic cleavage of X–A
Reapply to affinity resin
Purified target protein
Affinity ligand
X
X
A
A
A
X
X A
X A
A
Fusion protein X–A
X = protein to interact with affinity ligand– = proteolytic cleavage sequenceA = target protein
Figure 4.12
The recovery of a target protein after production as a recombinant fusionprotein.

4.10 Affinity partitioning (precipitation)
Affinity chromatography is a separation usually conducted in a column,relying upon an interaction between a binding site on a protein and aligand bound to a resin. The column format can have limitations whenused with crude extracts including column fouling and sometimes thereare slow association rates between the target protein and the resin-boundligand due to diffusion limitations. A variation upon column-based affin-ity chromatography is affinity precipitation, in which the target proteinbinds to a ligand in free solution resulting in the formation of a precipi-tate which can then be collected by centrifugation or membrane filtration.
The use of bis affinity ligands was developed for the purification of thetetrameric enzyme lactate dehydrogenase (LDH) using a bis-NAD+ ligand(N2,N1¢-adipodihydrazido-bis-(N6-carbonylmethyl)-NAD+ (Figure 4.13). TheNAD+ molecules on the ends of the spacer arm can interact with two
116 Protein purification
N
NN
N
HN–CH2–C–NH–NH–C–(CH2)4–C–NH–NH–C–CH2–NH
R
N
N
R
O O O O
N
N
Figure 4.13
The structure of N2,N1¢-adipodihydrazido-bis-(N6-carbonylmethyl)-NAD+.Reproduced from P. Cutler (ed.) (2004) Protein Purification Protocols, 2nd edn,Chapter 23, Figure 1, p. 206, Humana Press, Totowa, NJ.
Table 4.7 Examples of proteins purified using affinity precipitation with bis affinity ligands
Affinity precipitant Protein purified
bis-Cibacron blue LDH, albumin and chymosin
bis-ATP Phosphofructokinase
bis-borate IgG
Biotin–phospholipid Avidin and IgG
bis-copper chelate Human hemoglobin and galactose dehydrogenase
Copolymer of N-acryloyl-p-aminobenzoic Trypsin (adjust the pH to below 4.0 to precipitate the acid and N-acryloyl-m-aminobenzamide complex)
Cibacron blue, dextran Lactate dehydrogenase (add Concanavalin A (see Table4.3) to form a precipitable complex)
Protein A attached to Edragit S100 Monoclonal antibodies (adjust the pH to below 4.5 to (copolymer of methyl methacrylate and precipitate the complex)methacrylic acid)
Protein A attached to a copolymer of Monoclonal antibodies (adjust the temperature above N-isopropyl acrylamide and 32°C to precipitate the complex)N-acryloxysuccimide

different LDH molecules and the subunits on each of these molecules canbe linked to other affinity ligands forming a network which eventuallybecomes large enough to precipitate.
The target protein must have a quaternary structure to form a precip-itable complex and the length of the spacer arm used in the ‘bis’ affinityligand was found to be important to prevent intramolecular and encourageintermolecular interactions. The specificity and strength of complex forma-tion can be increased by the inclusion of substrate analogues of the targetenzyme. The precipitate can be separated by centrifugation and thecomplex can be competitively displaced with high concentrations of theenzyme’s substrate. These low molecular weight contaminants can thenbe removed by size exclusion chromatography (see Section 5.6).
The technique can also be used to isolate proteins which do not havea quaternary structure. In this form of affinity precipitation, multipleligands are attached to a polymer whose solubility depends on a numberof parameters. The interaction between the target protein and the ligandon the polymer does not result in precipitation. To facilitate precipitationof the protein–polymer complex, the environment (e.g. pH or tempera-ture) is altered and the precipitate can be collected by centrifugation.Examples of both techniques can be found in Table 4.7.
Further readingBurnouf T, Radosevich M (2001) Affinity chromatography in the industrial
purification of plasma proteins for therapeutic use. J Biochem Biophys Meth 49:575–586.
Burton SC, Harding DRK (2001) Salt-independent adsorption chromatography: newbroad-spectrum affinity methods for protein capture. J Biochem Biophys Meth49: 275–287.
Caron M, Seve AP, Baldier D, Joubert-Caron R (1998) Glycoaffinity chromatogra-phy and biological recognition. J Chromatogr B 715: 153–161.
Chaga GS (2001) Twenty five years of immobilised metal ion affinity chromatog-raphy: past, present and future. J Biochem Biophys Meth 49: 313–334.
Cutler P (ed) (2004) Protein Purification Protocols, 2nd edn. Humana Press, Totowa,NJ.
Deutscher MP (ed) (1990) Guide to protein purification. Meth Enzymol 182.Academic Press, London.
Firer MA (2001) Efficent elution of functional proteins in affinity chromatography.J Biochem Biophys Meth 49: 433–442.
Gottschalk I, Lagerquist C, Zuo SS, Lundqvist A, Lundahl P (2002) Immobilised-biomembrane affinity chromatography for binding studies of membraneproteins. J Chromatogr B 768: 31–40.
Hansen S, Thiel S, Willis A, Holmskov U, Jensenius JC (2000) Purification andcharacterisation of two mannan-binding lectins from mouse serum. J Immunol164: 2610–2618.
Hilbrig F, Freitag R (2003) Protein purification by affinity precipitation. J ChromatogrB 790: 79–90.
Huse K, Bohme HJ, Scholz GH (2002) Purification of antibodies by affinitychromatography. J Biochem Biophys Meth 51: 217–231.
Imam-Sghiouar N, Joubert-Caron R, Caron M (2005) Application of metal–chelateaffinity chromatography to the study of the phosphoproteome. Amino Acids28: 105–109.
Affinity procedures for purifying proteins 117

Janson JC, Ryden L (eds) (1998) Protein Purification, 2nd edn. Wiley–VCH, NewYork.
Muronetz VI, Korpela T (2003) Isolation of antigens and antibodies by affinitychromatography. J Chromatogr B 790: 53–66.
Raggiaschi R, Gotto S, Terstappen GC (2005) Phosphoproteome analysis. Biosci Rep25: 33–34.
Roe S (ed) (2001) Protein Purification: Methods, 2nd edn. Oxford University Press,Oxford.
Rosenberg IM (2005) Protein Analysis and Purification, 2nd edn. Birkhauser, Boston.Shen SY, Lui YC, Chang CS (2003) Exploiting immobilised metal affinity
membranes for the isolation or purification of therapeutically relevant species.J Chromatogr B 797: 305–315.
Zou H, Lou Q, Zhou D (2001) Affinity membrane chromatography for the analy-sis and purification of proteins. J Biochem Biophys Meth 49: 199–240.
118 Protein purification
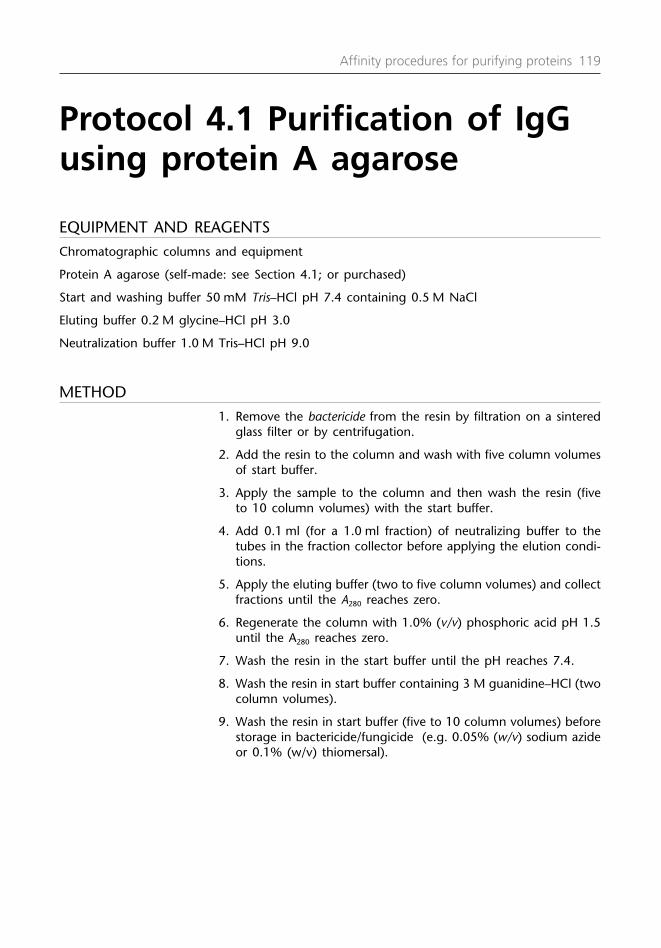
Protocol 4.1 Purification of IgGusing protein A agarose
EQUIPMENT AND REAGENTSChromatographic columns and equipment
Protein A agarose (self-made: see Section 4.1; or purchased)
Start and washing buffer 50 mM Tris–HCl pH 7.4 containing 0.5 M NaCl
Eluting buffer 0.2 M glycine–HCl pH 3.0
Neutralization buffer 1.0 M Tris–HCl pH 9.0
METHOD1. Remove the bactericide from the resin by filtration on a sintered
glass filter or by centrifugation.
2. Add the resin to the column and wash with five column volumesof start buffer.
3. Apply the sample to the column and then wash the resin (fiveto 10 column volumes) with the start buffer.
4. Add 0.1 ml (for a 1.0 ml fraction) of neutralizing buffer to thetubes in the fraction collector before applying the elution condi-tions.
5. Apply the eluting buffer (two to five column volumes) and collectfractions until the A280 reaches zero.
6. Regenerate the column with 1.0% (v/v) phosphoric acid pH 1.5until the A280 reaches zero.
7. Wash the resin in the start buffer until the pH reaches 7.4.
8. Wash the resin in start buffer containing 3 M guanidine–HCl (twocolumn volumes).
9. Wash the resin in start buffer (five to 10 column volumes) beforestorage in bactericide/fungicide (e.g. 0.05% (w/v) sodium azideor 0.1% (w/v) thiomersal).
Affinity procedures for purifying proteins 119


Nonabsorptiontechniques for purifyingproteins
5.1 Size exclusion chromatography (SEC)
Size exclusion chromatography is also known as gel permeationchromatography and gel filtration chromatography. It is a chromato-graphic technique that was developed in the 1950s using cross-linkeddextrans and involves a partition of molecules between two liquidvolumes; the volume of the mobile phase and the accessible volumecontained within the stationary porous bead (Figure 5.1). The separationin SEC does not involve binding between the sample and the resin and itis independent of the eluent used. These properties have made SEC atechnique that is useful for the separation of biological (proteins, nucleicacids and oligosaccharides) and organic polymers.
5
Figure 5.1
A scanning electron micrograph of a porous agarose gel (magnification:×50000).

Proteins can be separated using SEC in their native conformation, andsince there is no interaction with the resin there is good recovery ofbiological activity. However, there are disadvantages with SEC as it haslow capacity, will dilute the sample applied and shows at best moderateresolution. For these reasons SEC is usually used towards the end of apurification schedule.
Molecules percolate through and around the porous beads in thecolumn and are separated according to their mass and shape. Thetechnique is named ‘size exclusion’ chromatography because the poreswithin the material (Figure 5.1) have a maximum pore size, so that acomponent which is larger than the pore size will be excluded from enter-ing into the porous material and will travel down the column in the liquidvolume surrounding the porous beads. Small molecules will also be ableto travel down the column in the liquid volume surrounding the porousbeads but they will also be able to diffuse into the volume within thebeads. These smaller molecules can diffuse (partition) into a larger volume.The net result is that molecules applied to SEC will elute from the columnin decreasing molecular mass.
When a complex mixture of protein molecules is applied to an SECcolumn (Figure 5.2) they can effectively occupy three different volumes ofthe column. Depending on the fractionation range of the resin (Table 5.1),large proteins may be totally excluded from the volume of the beads andwill elute first, in the volume of liquid surrounding the beads called thevoid volume (V0). If the protein molecules are small enough they willoccupy both the volume of liquid surrounding the beads (V0) and the totalvolume contained within the porous beads called the total column volume(Vt). Proteins which can occupy some (but not all) of the volume of thebeads will elute in a volume (Ve) between these two extremes V0 and Vt.Only the proteins which elute in volume (Ve) between V0 and Vt will befractionated because, depending on their mass, they will be able to occupya lot of the volume of the beads, in which case they will elute towards Vt,
122 Protein purification
Sampleapplied
Porousbeadspackedinto a column
Fractioncollector
Largeproteinselute first
Large molecules can onlyoccupy the space in thecolumn around the beads (V0)
Porous bead
Small molecules can occupy all the volume of the column (Vt)
Buffer
Figure 5.2
A schematic representation of size exclusion chromatography.

or very little of the volume of the beads, in which case they will elutetowards V0 (Figure 5.3).
An effective partition coefficient (Kav) can be determined for proteinsfractionated using SEC.
Kav = VV
e
t ––
VV
0
0.
Ve is the elution volume of the sample of interest. V0 is the void volume of the column.Vt is the total volume column.The partition coefficient Kav is an approximation to the true partition
coefficient Kd because (Vt – V0) does not take into account the volumeoccupied by the resin itself, only the volume contained by the resin.However, it is easy to measure and Kav represents the fraction of thestationary gel volume which is available for the diffusion of a given solutespecies. It is a number between 0 (V0) and 1.0 (Vt) and is effectively apercentage value of the stationary gel volume occupied by the fraction-ated protein. The value of Kav is thus related to the volume the proteinoccupies (hydrodynamic volume) which is related to the protein’s interac-tion with the mobile phase as well as the protein’s size and shape (tertiaryand/or quaternary structure). In SEC the Kav of a protein is inverselyproportional to the log10 of the proteins relative molecular mass (Mr)(Exercises 5.1 and 5.2).
Some proteins do not conform to standard elution behavior; long, thinproteins will elute earlier than globular proteins of the same molecularmass. Performing SEC in the presence of chaotropic (see Section 2.14) salts,
Nonabsorption techniques for purifying proteins 123
Table 5.1 A selection of resins for SEC with their approximate fractionation range for proteins
Manufacturer/ Name Material Bead Protein pH supplier diameter fractionation stability
(µm) range
GE Healthcare Sephadex range Cross-linked dextran 20–300 1 × 10²– 2–137 × 104
GE Healthcare Sephacryl range Cross-linked dextrans 25–75 1 × 10³– 2–11and acrylamide 8 × 10⁶
GE Healthcare Sepharose range Agarose 45–165 1 × 10³– 4–94 × 107
GE Healthcare Superdex range Dextran and 24–44 1 × 10⁴– 3–12cross-linked agarose 6 × 10⁵
Biorad Bio-gel P100 fine Acrylamide 45–90 2 × 10²– 2–101 × 105
Merk Fractogels Polymeric 45–90 5 × 10³– 1–141 × 105
Pall Ultrogel Acrylamide/agarose 60–140 1 × 10³– 3–101.2 × 10⁶
Phenomenex Biosep-SEC-S Silica 5 2 × 10³– 3–73 × 106

for example guanidine hydrochloride, opens up the tertiary structure of aprotein, generating a random coil which will lead to a more accurate deter-mination of a protein’s Mr.
If the Mr of the target protein is not known then a resin with a broadfractionation range (e.g. Sephacryl S200) would be a good resin to choosefor the first SEC experiment (Table 5.1). If the column packing is accept-able the column can either be calibrated using proteins of known Mr orused directly for sample fractionation. A flow diagram for a typical SECexperiment is shown in Figure 5.4.
5.2 Some factors to consider in SEC
Resin
The resins used in SEC are made from essentially inert biocompatiblematerial and there are many different resins to choose from with differ-ent fractionation ranges for protein samples (Table 5.1). Try to match the
124 Protein purification
Void volume (V0)
V0 is the volumearound the beads
Vt is the totalaccessible liquid volume
*Volume of the empty column. The difference between Vt and the column volume is the volume occupied by the polymers making up the beads
Elution volume of sample protein (Ve)
Total accessible liquid volume (Vt)
Column volume*
Figure 5.3
The three accessible volumes in size exclusion chromatography.

Nonabsorption techniques for purifying proteins 125
Pack a long, thin column with SEC resin (A)
Equilibrate the resin with at least two column volumes of buffer(e.g. 50 mM Tris buffer pH 8.0 containing 0.15 M NaCl)*
Determine Vo and Vt by applying blue dextran and vitamin B12
in a volume equal to 1–2% of the column bed volume
Observe the flow of the blue dextran and vitamin B12 through the resin
Packing unacceptable Packing acceptable
Unpack the column, reslurry Measure the elution volumes of blue dextranthe resin and return to (A) and vitamin B12
Apply the sample 0.5–5% of the bed volume
Target protein elutes in the void volume (V0) Elutes towards the total volume (Vt)
Reapply the sample to a resin with a larger Reapply the sample to a resin with aexclusion limit** smaller exclusion volume**
The sample elutes between V0 and Vt (B)
The resolution of the target is acceptable The resolution of the target is unacceptable
Assess purity **Then return to (A) and either: (a) lower the flow rate1,(b) increase the column length2,(c) switch to a resin with a lowerparticle diameter3
Purity acceptable Purity unacceptableGo to (B)
Reapply to a different separation technique
*In general the choice of resin depends on the estimated Mr of the sample. Table 5.1 provides the suppliers of different resins.A convenient starting resin might be Sephacryl S200. The choice of buffer, additives and the pH will depend on the stability ofthe sample. If agarose- or dextran-based resins are used a minimum of 0.15 M NaCl should be included in the equilibrationbuffer. If acrylamide-based resins are used the salt concentration should not be high enough to encourage hydrophobic interac-tions that may arise between the resin and the target protein.
**The sample may need concentrating (see Chapter 2) before (re)application to a new SEC resin.
1The flow rate needs to be a compromise between improved resolution and the stability of the sample.
2Use a longer column or connect two (or more) columns (filled with the same resin) in series. Remember that this will increasethe dilution of your sample at the end of the SEC run.
3Before switching to a resin with a smaller bead size, check that there is a pumping system that can cope with the increasedpressure requirements of smaller diameter beads.
Figure 5.4
A flow diagram of the events in a typical size exclusion chromatography experiment.

fractionation range of the resin to the Mr of the target protein. Many resinshave been strengthened by chemical cross-linking, allowing higher flowrates without damaging the resins due to increased pressure. In addition,there are many SEC resins compatible with medium- to high-pressurepumping. The choice of resin depends on the application required and thebudget available.
Resin bead size
In general, smaller diameter (3–15 µm) resin beads will improve the resolu-tion (see Section 1.11). The columns with smaller diameter beads needhigher pressures to move the liquid through the column and requiremedium- to high-pressure pumping systems.
Flow rate
In SEC, a long, thin column packed with resin (Table 5.1) should be used,run at slow flow rates to maximize the partition interactions between thesample and the liquid in the porous beads. Fast flow rates may compro-mise the resolution of the proteins applied and too slow a flow rate mayresult in band broadening. Longer flow volumes improve the resolutionand can be achieved by connecting smaller columns in series but theadditional flow volume will increase the dilution of the eluted sample.
Sample size
The resolution in SEC is dependent upon the sample volume; low samplevolume:column volume ratios result in the best resolution. The ideal rationeeds to be determined experimentally but in general a sample volumebetween 0.5 and 5% of the column bed volume should be used.
Sample viscosity
Sample viscosity increases as the concentration of protein increases. If thesample viscosity is higher than the viscosity of the eluting buffer (>2-fold;which happens at 70.0 mg ml–1 protein concentrations) the sample willhave a reduced rate of diffusion into accessible pore space in the columnat the early stages of the chromatographic run. The sample will run pastthe beads, resulting in band broadening.
Buffer composition
To overcome sample interactions with charged sulfate groups on agaroseresins and charged carboxyl groups on dextrans, a minimum salt concen-tration of 0.15 M should be used in eluting buffers. The opposite may bethe case when using acrylamide-based resins as some proteins in thepresence of high salt may show hydrophobic interactions. All eluting buffersshould be set at a pH chosen to maintain the stability of the target proteinand to maintain the integrity of the resin (Table 5.1). If the sample is tobe concentrated by freeze drying after the chromatographic run, a volatile
126 Protein purification

buffer (with no salt addition) should be used as the mobile phase (Table2.8). Any mobile phase buffer should also be degassed and filtered through0.2 µm membranes before use in SEC.
5.3 Preparation and storage of SEC resins
SEC resins are supplied either preswollen in 20% (v/v) ethanol or as a drypowder. To use the preswollen resins the preservative can be removed byfiltration, the resin can then be resuspended in the desired buffer anddegassed under vacuum before being packed into a column (see Section1.11). The dry powders can be swollen for use in an excess of bufferovernight or heated in a water bath for 3 h at 100°C. After allowing thegel to cool and settle, any floating material (‘fines’) should be poured offprior to packing into a column. If not removed these ‘fines’ (fragments ofresin) will lodge in the pores of the beads and will eventually causeproblems.
When an SEC column has been packed and calibrated it can be left (withthe inlet and outlet tubes blocked off) in a storage area after two columnvolumes of preservative (see manufacturer’s recommendations) have beenpumped through the resin.
5.4 Analytical SEC
To assess the column-packing efficiency and to determine the V0 and Vt
of the column, a solution of blue dextran (Mr 2000000) and vitamin B12
(pink; Mr 1385) or potassium dichromate (yellow; Mr 294) can be used.The progress of the colored compounds down the column can bemonitored and these should flow down the column in even, level bands.Any deviation, such as tailing or uneven distribution, will indicate unevenpacking which will result in flow distortion of applied sample and mayrequire the column to be repacked.
The elution volume of blue dextran and vitamin B12 (or potassiumdichromate) is from the midpoint of the sample volume application to themidpoint of the elution volume (Figure 5.3). If the packing is judged to beworkable the column can be calibrated by the application of a series ofstandard proteins of known Mr, the elution volumes (Ve) of these proteinscan be measured, their Kav values determined and used to construct acalibration graph for the column. The Kav of the standard proteins isplotted against the log10 Mr. A protein sample can be applied to thecolumn, the Kav for the target protein can be measured and using thecalibration graph an estimate of the target protein’s Mr in its native confor-mation can be determined (see Exercises 5.1 and 5.2).
5.5 SEC to separate protein aggregates or the removal oflow amounts of contaminating material
If, after trying separations based upon charge (see Sections 3.1–3.3 and6.5), biospecificity (see Section 4.1) and hydrophobicity (see Section 3.4)there are still low levels of contaminating protein, separation based uponsize using SEC may be appropriate. The chromatographic run using an SEC
Nonabsorption techniques for purifying proteins 127

resin will have the dual benefit of separating the target protein from otherproteins with a different size and shape as well as any dimers andoligomers of the target protein. The disadvantage is that SEC will dilutethe target protein.
5.6 Desalting (group separation)
At different stages in a purification protocol a change of buffer may berequired prior to application to another resin or prior to electrophoresis. Theexchange of buffer ions can be achieved by dialysis (see Protocol 2.9), butthe process is time consuming. An alternative to dialysis can be achievedwith SEC using resins with a small pore size which totally exclude theproteins in the sample applied and totally include the buffer ions.Sephadex G-25 or G-50 (GE Healthcare) and Biogels P-6 or P-10 (Bio-Rad)resins can be used for desalting (or prepacked columns of G-50 (PD-10)can be purchased (GE Healthcare). Preswollen resin can be packed into asyringe with glass wool at the base (to prevent the resin leaving thecolumn) and equilibrated with the buffer to be exchanged into. Thesample in the buffer that is no longer required is applied to the resin(sample:SEC resin volume ratio should be 1:5) and fractions are collected.The protein will elute early in the new buffer because it is excluded fromthe gel; the buffer ions that are not required will elute later. Desaltingrequires significantly less time than dialysis and is favored in industry forbuffer exchange.
5.7 SEC in the refolding of denatured proteins
Prokaryotic protein expression systems will not have the necessary chaper-ones to correctly fold eukaryotic proteins into their tertiary structure (seeSection 4.7). Proteins that have been expressed in the bacteria Escherichiacoli may form cytoplasmic aggregates called inclusion bodies. The extrac-tion of these expressed recombinant proteins will require the use ofchaotropic salts (e.g. urea) and detergents (e.g. SDS). After extraction thesolubilizing agents will have to be slowly removed to allow the proteinsto fold into their correct conformation. The reduced diffusion in SEC hasbeen used to promote the correct refolding of proteins by suppressingnonspecific protein–protein interactions. In addition, during SEC theaggregates and solubilizing buffers are removed in a single experiment.
5.8 Preparative polyacrylamide gel electrophoresis (PAGE)
Polyacrylamide gel electrophoresis is a highly resolving technique whichis routinely used to monitor the purity of pooled fractions produced bychromatographic separations (see Section 6.1). Analytical electrophoresiscan be viewed as incomplete electrolysis because the experiment is stoppedbefore the sample reaches the electrode and the samples within the gelare visualized by staining. If a PAGE experiment is allowed to proceed(after the bromophenol blue tracking dye has run off the end of the gel)the applied sample will eventually emerge from the bottom of an analyt-ical gel and enter the anodic buffer chamber.
128 Protein purification

This is analogous to a chromatographic separation and there are anumber of proprietary apparatuses available for the purification of proteinsusing either nondenaturing or denaturing preparative polyacrylamide gelelectrophoresis (see Section 6.3). In these systems the sample is applied toa column of acrylamide and run using conventional PAGE buffer systems.The end of the acrylamide column rests upon a sintered glass disc (Figure5.5) through which a buffer flows tangentially to the column, removingprotein and/or polypeptides as they emerge from the bottom of theacrylamide gel, taking them to a fraction collector. Proteins are preventedfrom contacting an electrode by the use of dialysis tubing which alsomaintains the electrical integrity of the system.
Preparative gel apparatus rarely gives excellent resolution of bands thatappear close together on an analytical gel. This is because as the bandsemerge from the bottom of the acrylamide column, mixing takes place inthe eluting buffer (reducing the amount of sample applied and reducingthe dead volume between the preparative PAGE apparatus and the fractioncollector can help reduce sample mixing). For these reasons, it is not anideal technique to use in the early stages of a purification protocol whenthe target protein is usually a small percentage of the total protein.However, it can be used successfully in the later stages of a purificationprotocol to remove trace contaminants. If the temperature is controlledduring a nondenaturing preparative PAGE experiment (separation basedupon surface charge and relative mass; see Section 6.3) the sample will
Nonabsorption techniques for purifying proteins 129
Cathode –ve
Sintered glass
PumpElutionbuffer
Anode +ve
Upper buffer chamber
Detector andfraction collector
Rubber bands
Dialysis tubing
Lower buffer chamber
Stacking gel
Resolving gel
Figure 5.5
A typical preparative polyacrylamide gel electrophoresis set-up.
emerge from the experiment in an active conformation. If the purity ofthe sample is still not acceptable the active fractions can be concentrated(see Section 2.14), incubated with SDS and 2-ME and rerun on the samepolyacrylamide column (the electrode buffers would require changing fordenaturing PAGE) isolating the sample this time on molecular mass.
If the target protein can be identified on an analytical gel using (i) anantibody to the target protein (western blotting; see Protocol 6.3), (ii)detecting the protein’s activity in situ (nondenaturing PAGE; see Section6.3), or (iii) using the Mr of the target protein (denaturing PAGE; seeSection 6.3), the band containing the target protein can be excised fromthe gel. Preparative well-forming combs coupled with wider gel spacers(0.75, 1.0 and 1.5 mm) will enable larger amounts of the target protein tobe applied. However, there is an upper limit to the amount of protein thatcan be applied to any acrylamide gel which depends on the number andrelative amounts of proteins in the sample. Localized heat spots can begenerated at high protein loadings as the protein concentrates within thegel during the electrophorectic run, resulting in band distortion.
5.9 Isolation of proteins from polyacrylamide gels or fromnitrocellulose membranes
Electroelution
Proprietary electroeluting apparatus can be used which moves the sampleby electrophoresis from the gel into a collection chamber. The sample isprevented from contacting the anode by dialysis membrane. Alternatively,gel slices can be placed into a dialysis bag in buffer and then draped overa horizontal electrophoresis apparatus. Minimum buffer can be used in thedialysis bag to contact the two electrodes. The proteins within the gel willmigrate into the buffer, where they can be collected. While the electricalfield is in place they will continue to move towards the anode. Over timethis can result in proteins contacting the dialysis membrane; to overcomethis at the end of the electroelution the current polarity should be reversedfor 2 min to propel the proteins back into the buffer. Stained andunstained proteins can be electroeluted and the recovery of protein isusually higher when SDS is included in the electrode buffers.
Gel homogenization
To increase the diffusible gel surface area, acrylamide gel slices containingtarget proteins can be fragmented by finely chopping with a scalpel or bycentrifugation through copper wire (see Protocol 5.1). The gel fragmentsare then put into a suitable buffer to allow diffusion of the target proteinto take place. The target protein can be recovered from the gel fragmentsby centrifugation or by centrifugation through silanized glass wool (seeProtocol 5.1). To improve the recovery of the target protein, fresh buffercan be added to the gel fragments and the process repeated. The inclusionof 0.05–0.1% (w/v) SDS in the diffusion buffer will improve recoveries. Ifrequired the pooled fractions can be concentrated and the SDS removedusing SEC.
130 Protein purification

Gel solubilization
Polyacrylamide gel slices can be solubilized in 30% (v/v) hydrogen perox-ide at 50°C overnight. This treatment can be damaging to proteins andmakes the resultant material suitable only for scintillation counting ofradioactively labeled proteins.
The recovery of proteins from nitrocellulose membranes
After western blotting, proteins can be visualized on the nitrocellulosemembranes by using reversible stains such as copper phthalocyanine (seeProtocol 6.3). If the area on the blot occupied by the target protein canbe identified (e.g. by Mr) it can be excised. Alternatively, a strip from theblot can be blocked and probed with an antibody raised to (or which cross-reacts with) the target protein. After visualization (see Protocol 6.3) thestrip can be aligned with the unprobed blot to excise the correct area corre-sponding to the target protein. The protein can be recovered from thenitrocellulose membrane by using a buffer containing either detergents(e.g. 0.1–1.0% (w/v) SDS) or 20% (v/v) acetonitrile or pyridine.
5.10 Preparative isoelectric focusing (IEF)
Isoelectric focusing separates proteins according to their charge (seeSection 6.5). Preparative IEF apparatus (Rotofor or mini Rotofor; Bio-Rad)can be used to concentrate and fractionate proteins by liquid phase IEF.The proteins (microgram to gram amounts) are focused into chambers andcollected under vacuum into fractions. The proteins will be in their nativeconformation and may start to precipitate at their pI, but the inclusion ofnon-ionic detergents (e.g. Nonidet, Tween, Triton) can improve a protein’ssolubility. By initially using a wide pH range (3–10) followed by a narrowpH range (1.0 pH scale spanning the pI of the target protein), highlypurified fractions can be obtained which may then be subjected toadditional chromatographic or electrophoretic techniques.
Further readingBatas B, Chaudhuri JB (1995) Protein refolding at high concentration using size-
exclusion chromatography. Biotechnol Bioengng 50: 16–23.Cutler P (ed) (2004) Protein Purification Protocols, 2nd edn. Humana Press, Totowa, NJ.Deutscher MP (ed) (1990) Guide to protein purification. Meth Enzymol 182.
Academic Press, London.Fountoulakis M, Juranville JF (2003) Enrichment of low abundance brain proteins
by preparative electrophoresis. Analyt Biochem 313: 267–282.Gee CE, Bate IM, Thomas TM, Ryaln DB (2003) The purification of IgY from
chicken egg yolk by preparative electrophoresis. Prot Expr Purifcn 30: 151–155.Kobayashi M, Hiura N, Matsuda K (1985) Isolation of Enzymes from Polyacrylamide
Disk Gels by a Centrifugal Homogenisation Method. Analyt Biochem 145:351–353.
Li M, Su ZG, Janson JC (2004) In vitro protein refolding by chromatographic proce-dures. Prot Expr Purifcn 33: 1–10.
Roe S (ed) (2001) Protein Purification: Methods, 2nd edn. Oxford University Press,Oxford.
Nonabsorption techniques for purifying proteins 131

Rosenberg IM (2005) Protein Analysis and Purification, 2nd edn. Birkhauser, Boston.Thomas TM, Shave EE, Bate IM, Franklin SC, Rylatt DB (2002) Preparative
electrophoresis: a general method for the purification of polyclonal antibod-ies. J Chromatogr A 944: 161–168.
Wang S, Chang C, Liu H (2006) Step change of mobile phase flow rates to enhanceprotein folding in size exclusion chromatography. Biochem Engng J 29: 2–11.
Wu CS (ed) (2004) Handbook of Size Exclusion Chromatography and related Techniques,2nd edn. Marcel Dekker, New York.
132 Protein purification

Protocol 5.1 Homogenization ofpolyacrylamide gels containingtarget protein
MATERIALSTwo 1.0 ml pipette tips cut in half
Copper wire from an electrical cable (10 × 15 mm pieces) compressed in a ball
1.5 ml microfuge tube
A small amount of silanized glass wool
METHODThe compressed copper wire is placed in the bottom half of the 1.0 ml pipette tip and the tipput into a 1.5 ml microfuge tube. The acrylamide gel slice is placed on top of the copper wireand centrifuged at 13000 g for 15 s. The homogenized gel can be incubated in a suitable bufferfor a period of time (2–16 h) with mixing to allow diffusion to occur. The target protein canbe recovered from the fragmented gel by repeating the above procedure, substituting silanizedglass wool for the copper wire in the cut 1.0 ml pipette tip. After centrifugation at 13000 g for15 s the supernatant free from acrylamide can then be analyzed further.
Nonabsorption techniques for purifying proteins 133

Exercise 5.1 Practice calculationsfor Mr estimation using SECA gel filtration column (V0 = 85 ml and Vt = 250 ml) has been calibrated with five standardproteins of known molecular mass (Mr).
Standards Mr Log10 Mr Ve (ml) Kav
Aprotinin 6500 215Trypsinogen 24000 187Bovine serum albumin 66000 150Alcohol dehydrogenase 150000 103Amylase 200000 94
Question: Calculate the Kav for the standard proteins and plot a calibration graph for the column(log10 Mr versus Kav).
On the same column the Ve for egg albumin was 135 ml. Determine the Kav for egg albuminand using the calibration graph estimate the Mr of egg albumin.
(Answer in Appendix 2.)
134 Protein purification

Exercise 5.2 The differencebetween estimating the Mr of aprotein using SEC andSDS–PAGE (see Chapter 6 andExercise 6.1)When a sample of hemoglobin and a sample of myoglobin are run on 10% SDS–PAGE gel, bothproteins produce a single band with an estimated Mr of 16 000.
When the samples are subjected to SEC, hemoglobin has an Mr of 64 000 and myoglobin anMr of 16 000.
Question: Explain?
(Answer in Appendix 2.)
Nonabsorption techniques for purifying proteins 135


Monitoring the purity ofprotein solutions
6.1 Electrophoresis of proteins
Throughout the purification process the purity of the pooled target proteinfraction should be monitored regularly; denaturing polyacrylamide gelelectrophoresis (PAGE) is the most widely used technique to monitor thepurity of pooled protein fractions after chromatography. This techniquedenatures proteins with a detergent (sodium dodecyl sulfate (SDS)) and areducing agent (e.g. 2-mercaptoethanol (2-ME); Figure 6.1) into polypeptidesand then separates the polypeptides according to their relative molecularmass (Mr). A single band on an SDS-PAGE gel is a good indication of a homogeneous preparation of protein. However, because SDS-PAGEseparates polypeptides on their Mr, a single band does not rule out thepossibility that there are other polypeptides present in the sample withthe same Mr. To verify the homogeneity of the protein preparation, alter-native methods can be used in combination with denaturing SDS-PAGE.These supplementary techniques must exploit a physical parameter otherthan the molecular mass of proteins to increase the stringency of theanalysis. For example, PAGE in the absence of a detergent (nondenatur-ing PAGE) will separate proteins according to both their hydrodynamicvolume (related to Mr) and surface charge. A homogeneous band on bothdenaturing and nondenaturing PAGE is a good indication of the purity ofthe protein fraction. Other techniques which could be considered tosupplement denaturing SDS-PAGE include: isoelectric focusing (IEF), capil-lary electrophoresis (CE), or reversed phase chromatography (RPC).
Another problem with SDS-PAGE is that the presence of low amounts ofcontaminating polypeptides of different Mr may not be obvious with lowsample loadings. To overcome this problem it is possible to load a denatur-ing polyacrylamide gel with increasing amounts of the ‘homogeneous’
6
CH3–(CH2)11
– O – S – O – Na+
OH–(CH2)2–SH
O
O
-
Hydrophobic tail Hydrophilic head
Sodium dodecyl sulfate
2-Mercaptoethanol
Figure 6.1
The structure of sodium dodecyl sulfate (SDS) and 2-mercaptoethanol (2-ME).

protein. At the higher loadings the presence of low levels of contaminat-ing proteins should be visible. Another alternative is to switch to a moresensitive protein stain such as a silver stain (see Protocol 6.2).
6.2 The theory of electrophoresis
Charged molecules will move under the influence of an electrical field toan electrode of opposite charge. Anions (negatively charged molecules)will move to the anode (positively charged electrode) whereas cations(positively charged molecules) will move to the cathode (negativelycharged electrode). In electrolysis the charged molecules move under theinfluence of an electrical field and may contact the electrode. Biologicalmolecules would denature if they were allowed to contact an electrode;therefore, when biological molecules are subjected to movement in anelectrical field, the experiment is terminated before the sample contactsthe electrode. This is process is termed electrophoresis and can be viewedas incomplete electrolysis.
In an electrical field, a charged molecule is subjected to both apropelling force contributed by the field strength and the charge on themolecule, and a retarding force contributed by the size and shape of themolecule and the viscosity of the medium.
If two electrodes with a potential difference (v) of 100 V are placed in asolution 0.1 m (10 cm) apart (l), the field strength (E) = v/l = 100/0.1 =1000v m–1.
If the net charge on a molecule is q coulombs, the propelling force on themolecule (F) is given by:
F = E.q = v/l.q N. [6.1]
In solution the retarding force on a molecule (f ) is comprised of frictioninfluenced by the size and shape of the molecule and the viscosity of themedium.
The frictional force (Ff) = 6πrην = fν [6.2]
r = radius of a spherical molecule, η = viscosity of the medium and ν =velocity of the molecule.
The overall rate of migration, taking into account both the propellingforce contributed by the field strength and charge on the molecule(Equation 6.1) and the retarding force contributed by the size of themolecule and the viscosity of the medium (Equation 6.2).
E.q = fν
ν = .
The term electrophoretic mobility (m) is given by (n/E), a ratio of amolecules velocity to the field strength. Molecules of different size andcharge have different electrophorectic mobility.
To increase the net rate of movement of a charged molecule in anelectrical field, it is possible either to reduce the viscosity of the mediumor to increase the field strength. In practice, increasing the field strength
Eqf
138 Protein purification

is the only sensible option; the drawback is that high field strengths gener-ate heat which can be damaging to a protein’s structure. Someelectrophoresis apparatus can be fitted with cooling apparatus to dispersethe heat generated, which is particularly important in nondenaturingPAGE.
Proteins are derived from different genes, and therefore have differentcontents of amino acids: they have different masses; they fold into differ-ent three-dimensional shapes; and they are covered in different surfacecharges. The charge on a protein’s surface is pH dependent (see Section3.1). At a certain point on the pH scale, the overall charge on a protein’ssurface is zero. This is termed the isoelectric point (pI). At its pI, a proteinwill not move under the influence of an electrical field, whereas at pHvalues above its pI a protein will behave as an anion and at pH valuesbelow its pI a protein will behave as a cation.
6.3 Polyacrylamide gel electrophoresis (PAGE)
Electrophoresis using polyacrylamide is a very popular method of analyzing protein mixtures because the technique is both reproducible andflexible. The polyacrylamide gels are formed by the polymerization ofacrylamide monomers in the presence of the N,N′-methylene bis-acrylamide which acts as a cross-linking reagent. The reaction is free radicalcatalysis, and following initiation there is a period of polymer elongationand then termination.
Two catalysts are required to initiate the polymerization: N,N,N′,N′-tetramethylenediamine (TEMED) and ammonium persulfate. TEMEDcatalyzes the decomposition of the persulfate ion to produce a free radical(indicated by the symbol ).
S2O82– + e– → SO4
2– + SO4–
The reactive free radical (SO4–) interacts with the acrylamide monomer
generating an acrylamide free radical which reacts with anotheracrylamide monomer, sequentially adding monomers to form a polymer.Occasionally the bis-acrylamide is added into the growing polyacrylamidechain, linking adjacent polyacrylamide chains together. Eventually, whenall the monomers have been used up, two free radicals interact to termi-nate the polymerization. The result is a solid polyacrylamide gel which iscomprised of a porous network of cross-linked acrylamide monomers(Figure 6.2).
Monitoring the purity of protein solutions 139
FR + Acryl FRAcryl
FRAcryl + Acryl FRAcrylAcryl etc
Figure 6.2
Diagram to show how the polyacrylamide network is built (FR is the free radicaland Acryl is the acrylamide monomer).
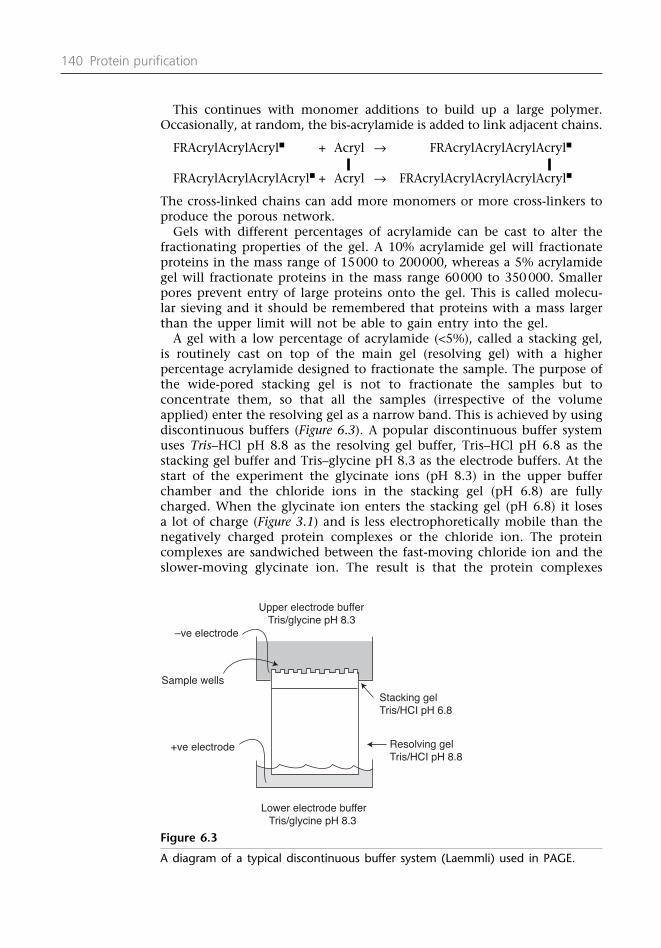
This continues with monomer additions to build up a large polymer.Occasionally, at random, the bis-acrylamide is added to link adjacent chains.
FRAcrylAcrylAcryl + Acryl → FRAcrylAcrylAcrylAcryl
FRAcrylAcrylAcrylAcryl + Acryl → FRAcrylAcrylAcrylAcrylAcryl
The cross-linked chains can add more monomers or more cross-linkers toproduce the porous network.
Gels with different percentages of acrylamide can be cast to alter thefractionating properties of the gel. A 10% acrylamide gel will fractionateproteins in the mass range of 15000 to 200000, whereas a 5% acrylamidegel will fractionate proteins in the mass range 60000 to 350 000. Smallerpores prevent entry of large proteins onto the gel. This is called molecu-lar sieving and it should be remembered that proteins with a mass largerthan the upper limit will not be able to gain entry into the gel.
A gel with a low percentage of acrylamide (<5%), called a stacking gel,is routinely cast on top of the main gel (resolving gel) with a higherpercentage acrylamide designed to fractionate the sample. The purpose ofthe wide-pored stacking gel is not to fractionate the samples but toconcentrate them, so that all the samples (irrespective of the volumeapplied) enter the resolving gel as a narrow band. This is achieved by usingdiscontinuous buffers (Figure 6.3). A popular discontinuous buffer systemuses Tris–HCl pH 8.8 as the resolving gel buffer, Tris–HCl pH 6.8 as thestacking gel buffer and Tris–glycine pH 8.3 as the electrode buffers. At thestart of the experiment the glycinate ions (pH 8.3) in the upper bufferchamber and the chloride ions in the stacking gel (pH 6.8) are fullycharged. When the glycinate ion enters the stacking gel (pH 6.8) it losesa lot of charge (Figure 3.1) and is less electrophoretically mobile than thenegatively charged protein complexes or the chloride ion. The proteincomplexes are sandwiched between the fast-moving chloride ion and theslower-moving glycinate ion. The result is that the protein complexes
140 Protein purification
–ve electrode
Stacking gel Tris/HCI pH 6.8
Resolving gel Tris/HCI pH 8.8
Lower electrode buffer Tris/glycine pH 8.3
+ve electrode
Sample wells
Upper electrode buffer Tris/glycine pH 8.3
Figure 6.3
A diagram of a typical discontinuous buffer system (Laemmli) used in PAGE.

focus into a narrow band as they progress through the stacking gel. Whenthe resolving gel (pH 8.8) is reached the glycinate ion becomes fullycharged and moves with the chloride ion at the dye front. The proteincomplexes enter the smaller pores of the resolving gel and are fraction-ated during the course of the experiment.
Equipment required for PAGE
There are a number of different manufacturers of electrophoretic equip-ment (see Appendix 4) who also supply suitable power packs with appro-priate safety features.
The most popular equipment for separating proteins operates by runningvertical gels which separate an upper and lower buffer chamber. The gel provides a porous support for the sample and buffer ions to migratethrough.
Proprietary electrophoretic equipment usually comes complete with anappropriate gel casting stand. The glass plates are separated by a spacerand held in a leak-proof seal. Gels can be cast with standard solutions (seeProtocol 6.1) or purchased as pre-cast gels.
Denaturing polyacrylamide gel electrophoresis
The detergent (SDS) (Figure 6.1) initially disrupts a protein’s hydrophobicareas, and as the tertiary structure of the protein starts to unwind, theother weak forces that hold the protein’s structure together (hydrogenbonds, salt bridges and van der Waals interactions) are broken. The proteinloses its globular/fibrous shape and becomes rod-like. The charge on aprotein’s surface (see Section 3.1) becomes swamped with the negativecharge on the SDS, which binds on average every two amino acids. Thenet result is that a protein molecule with a tertiary structure which had asurface charge comprised of both positive and negative charges is alteredinto a linear polypeptide with an overall negative charge (Figure 6.4).
SDS will unravel a protein’s secondary and tertiary structure, but it willnot break the covalent disulfide (S–S) bonds present in some protein struc-tures. A reducing agent is required (e.g. 2-mercaptoethanol (2-ME)) tobreak the covalent disulfide bond and completely linearize all the proteinspresent. In general, only proteins which are to be exported from the cellhave disulfide bridges.
Prior to application on the gel, the sample is boiled for 5 min in:Tris–HCl buffer pH 8.3, SDS–2-ME 10% (v/v) glycerol (added so that thesample will sink to the bottom of the sample application well in the gel)and bromophenol blue (a small negatively charged molecule used to trackthe progress of the experiment) (see Protocol 6.1).
When the samples are applied to the stacking gel the SDS–polypeptidecomplexes become concentrated but migrate unhindered through the widepores of the stacking gel. When the SDS–polypeptide complexes enter theresolving gel, small polypeptide chains migrate through the porousacrylamide network with relative ease. The movement of larger polypep-tides through the gel is restricted, so they migrate more slowly. At the endof the experiment, when the bromophenol blue (the fastest-running
Monitoring the purity of protein solutions 141

visible molecule) has come to within 1 cm of the end of the gel, theexperiment can be stopped. The gel is removed from the cassette andstained, to visualize the samples applied.
Visualizing the proteins on polyacrylamide gels
The most commonly used protein stain, after SDS-PAGE, is Coomassie blue(sensitivity approximately 100 ng per protein band; see Protocol 6.1) in amethanol–acetic acid mixture (used to precipitate the proteins within thegel, preventing them from floating away before analysis). OtherCoomassie-based protein gel stains are available to purchase (e.g. colloidalCoomassie) with increases in the levels of detection and ease of use.
Silver staining (see Protocol 6.2) increases the level of sensitivity approx-imately 100-fold, detecting down to 1 ng of protein in a band. Silver stain-ing can be used instead of Coomassie blue (or after Coomassie bluestaining) to increase the levels of detection. Fluorescent stains such asSypro® red (Invitrogen) give a comparable level of sensitivity to silver.
A rapid method of visualizing polypeptide bands in gels is to include0.5% (v/v) trichloroethanol (TCE) in the acrylamide mixture prior topolymerization (Ladner et al., 2004). After electrophoresis the polypeptidescan be visualized by exposure to UV light for 5 min, which catalyzes areaction between tryptophan and TCE to produce a fluorescent product.Once visualized, the gel can used for other analytical techniques such aswestern blotting (see Protocol 6.3).
Analyzing the results of SDS-PAGE
The distance a polypeptide migrates in SDS-PAGE is inversely proportional
142 Protein purification
H
H
H
+
+
+
–+
+
+ +
+
Charged functional groups
Hydrophobic functional groups
Disulfide bridge
After treatment with SDS, 2-ME and heat(a linear pelypeptide with an overall negative charge)
S S
Before SDS (a globular structure with positive and negative charge)
Figure 6.4
The structure of proteins before and after the addition of SDS and 2-ME.
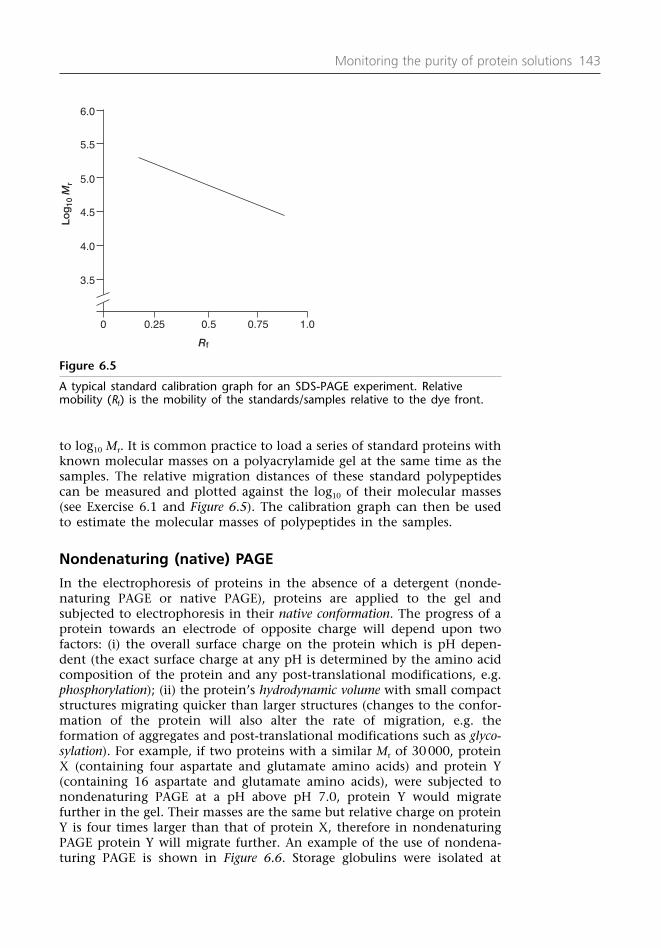
to log10 Mr. It is common practice to load a series of standard proteins withknown molecular masses on a polyacrylamide gel at the same time as thesamples. The relative migration distances of these standard polypeptidescan be measured and plotted against the log10 of their molecular masses(see Exercise 6.1 and Figure 6.5). The calibration graph can then be usedto estimate the molecular masses of polypeptides in the samples.
Nondenaturing (native) PAGE
In the electrophoresis of proteins in the absence of a detergent (nonde-naturing PAGE or native PAGE), proteins are applied to the gel andsubjected to electrophoresis in their native conformation. The progress of aprotein towards an electrode of opposite charge will depend upon twofactors: (i) the overall surface charge on the protein which is pH depen-dent (the exact surface charge at any pH is determined by the amino acidcomposition of the protein and any post-translational modifications, e.g.phosphorylation); (ii) the protein’s hydrodynamic volume with small compactstructures migrating quicker than larger structures (changes to the confor-mation of the protein will also alter the rate of migration, e.g. the formation of aggregates and post-translational modifications such as glyco-sylation). For example, if two proteins with a similar Mr of 30 000, proteinX (containing four aspartate and glutamate amino acids) and protein Y(containing 16 aspartate and glutamate amino acids), were subjected tonondenaturing PAGE at a pH above pH 7.0, protein Y would migratefurther in the gel. Their masses are the same but relative charge on proteinY is four times larger than that of protein X, therefore in nondenaturingPAGE protein Y will migrate further. An example of the use of nondena-turing PAGE is shown in Figure 6.6. Storage globulins were isolated at
Monitoring the purity of protein solutions 143
5.5
6.0
5.0
4.5
4.0
3.5
0 0.25 0.5 0.75 1.0
Rf
Log
10M
r
Figure 6.5
A typical standard calibration graph for an SDS-PAGE experiment. Relativemobility (Rf) is the mobility of the standards/samples relative to the dye front.

different days after the onset of germination; they have similar Mr butshow increased electronegativity due to the loss of amide nitrogen (i.e.conversion of asparagine to aspartate and glutamine to glutamate).
Different uses of nondenaturing PAGE
If, after purifying a protein, a homogeneous band is visualized using SDS-PAGE (separation on size) and the same preparation shows a homogeneousband after nondenaturing PAGE (separation on hydrodynamic volume andcharge), this can be taken as a good indication of the purity of the fraction.
The electrophoretic progress of a protein in nondenaturing PAGE isdetermined in part by the protein’s conformation. Changes in the confor-mation due to the formation of aggregates (dimers or oligomers) or thebinding of ligands to generate more compact (or disperse) structures canbe visualized on nondenaturing PAGE.
In nondenaturing PAGE if the apparatus is cooled throughout theelectrophoretic run, the proteins will retain their native conformation andtheir biological activity. An enzyme of interest can be identified in situ byincubating the gel in a chromogenic substrate solution or by including thechromogenic substrate in 1% (w/v) agarose and overlaying theagarose/substrate mixture on top of the polyacrylamide gel. Bands willappear in areas of the gel corresponding to where the enzyme has migratedto. This can be a useful technique to identify isoenzymes which may onlydiffer by a few amino acid substitutions.
6.4 Western blotting
After either denaturing or nondenaturing PAGE, individual polypep-tides/proteins can be identified using western blotting. This involves
144 Protein purification
Days after germination
1 3 7 10 14
Cathode (–ve)
Anode (+ve)
Figure 6.6
Storage proteins isolated from Vicia faba seeds at different stages of germinationsubjected to nondenaturing (native) PAGE in a 7.5% gel.

the electrophoretic transfer of polypeptides separated by PAGE onto a nitrocellulose membrane filter (Figure 6.7). The transfer can be completed ina ‘wet’ blotter in which the gel membrane sandwich is immersed incontinuous transfer buffer (CTB) or a ‘semi-dry’ blotter which uses onlysufficient buffer to complete the electrical circuit (see Protocol 6.3).
The western blot effectively produces a replica of the gel pattern ontothe nitrocellulose membrane, rendering the separated polypeptides moreaccessible to probing with an antibody (either monoclonal or polyclonal). Butbefore probing with an antibody, any vacant protein binding sites on thenitrocellulose membrane need to be masked with another protein (e.g. BSAor powdered milk protein). This masking of the nitrocellulose membraneprevents the primary antibody (also a protein) from binding nonspecifi-cally to the membrane. After probing the blot with the primary antibody,the polypeptide–antibody complex can be visualized using a secondaryantibody (raised against the IgG fraction of the primary antibody species,e.g. antimouse IgG raised in rabbit) conjugated to an enzyme (e.g. horse-radish peroxidase (HRP) or alkaline phosphatase), a radioactive molecule(e.g. 125I) or a fluorescent molecule (e.g. FITC: fluorescein isothiocyanate).Many conjugated secondary antibodies are polyclonal antibodies resultingin multiple binding of the conjugated secondary antibodies to the primaryantibody which then amplifies the detection (Figure 6.8).
Monitoring the purity of protein solutions 145
Metal cathode (–ve) is placed on top
Moist filter paper
(ii)
(i) Above the polyacrylamide(ii) Below nitrocellulose sheet
Polyacrylamide gel
Nitrocellulosemembrane
Metalanode
+ve(i)
Figure 6.7
The arrangement of the polyacrylamide gel and nitrocellulose filter in westernblotting.

Enhanced chemiluminescence (ECL) is a popular method of visualizingprotein–antibody complexes on nitrocellulose after western blots becauseit is cost effective, safe, sensitive and easy to use. After probing theimmunoblot with the primary antibody, the HRP-conjugated secondaryantibody can be used with hydrogen peroxide, luminol and chemicalenhancers to generate light (see Protocol 6.3). The area on the nitrocellu-lose producing the light can be detected after incubation on an X-ray film(or immediately with a luminescent image analyzer).
6.5 Isoelectric focusing (IEF)
In IEF, a pH gradient is generated in a polyacrylamide (4%) gel (agarosegels can be used for proteins with high molecular masses) by the inclu-sion of ampholytes in the monomer mixture prior to polymerization. A pHgradient is established within the polymerized polyacrylamide by theapplication of an electrical field for a short period of time. Sample canthen be applied and the electrical field is again switched on. The proteinsin the sample will move towards their isoelectric point (pI). When theyreach their pI they will have no charge and will remain immobile withinthe gel (Figure 6.8). When the experiment has finished, the gel is washedwith 10% (w/v) trichloroacetic acid to fix the proteins in the gel and towash away the ampholytes. The gel can then be stained with Coomassieblue (see Protocol 6.1) to visualize the samples.
In IEF, some proteins will move towards their pI and retain their confor-mation (other proteins denature as they approach their pI) and can bevisualized in situ using chromogenic substrates (see Section 6.3). Standardproteins each with a different pI can be purchased and loaded onto thesame gel as the sample. The course of the experiment can be monitoredby the movement of the colored standards, and a calibration graph canbe prepared by measuring the distance moved by the colored standards
146 Protein purification
Coloredproduct
Coloredproduct
Primaryantibody
Enzyme-conjugated secondary antibody to amplify and report the detection
Target protein
Proteins transferredfrom the polyacrylamide gel
Nitrocellulosemembrane
Spare protein bindingsites blocked (beforeantibody probing) with 3% BSA
Figure 6.8
The use of primary antibodies in western blotting to detect the protein ofinterest on nitrocellulose and the use of conjugated secondary antibodies toreport and amplify the detection.

from an electrode and plotting this migration distance against the pH. Themigration distance of the proteins present in the samples can then bemeasured and their pI values determined.
Ampholytes can be purchased to generate gradients with different pHranges. This allows better resolution of the proteins present around the pIof the protein of interest. Alternatively, IEF gels can be purchased with animmobilized pH gradient present within the gel. These strips arerehydrated in the presence of the sample, which becomes absorbed intothe entire length of the gel, but when the electrical field is applied theproteins will migrate towards their pI (Figure 6.9).
Isoelectric focusing is a highly resolving technique that can separateproteins with as little as 0.01 pH difference in pI values. This makes itideal for visualizing any contaminating proteins that might be present ina sample that has been purified. In addition, IEF is able to identify isoen-zymes (different forms of the enzyme which may differ by a single aminoacid) or showing microheterogeneity (a protein may exist as a phospho-rylated and non-phosphorylated form). Isoenzymes and proteins withmicroheterogeneity would migrate to the same point on an SDS-PAGE gelbecause the mass differences would be small, but the change in chargewould be sufficient to show different bands on an IEF gel.
6.6 Capillary electrophoresis (CE)
Capillary electrophoresis is electrophoresis in a narrow-bore glass capillary(typically 50–100 cm with a 50 µm internal diameter) using high voltages(10–50 kV). The ends of the capillary are submerged into two separatebuffer chambers containing either the anode or cathode (Figure 6.9).
Monitoring the purity of protein solutions 147
at low pH,the proteinis positively
charged
at high pH,the protein
is negativelycharged
Sta
ble
pH g
radi
ent
at the isoelectric point the proteinhas no net charge and therefore nolonger migrates in the electric field;for the proteinshown theisoelectricpH is 6.5
4
10
9
8
7
6
5
–– –
Figure 6.9
Isoelectric focusing of proteins. (Reproduced from Alberts (2002) MolecularBiology of the Cell , 4th edn., Garland Science, New York, Figure 8-16, p. 487.)

Depending on the instrument the sample can be injected into one end ofthe capillary by syphoning, high pressure or high voltage. The capillary isthen removed from the sample, replaced in the buffer chamber and thehigh voltage reapplied to commence the separation.
The surface of the glass walls of the capillary contain silanol (Si–OH)groups which become ionized above pH 2.0, coating the internal walls ofthe capillary in a negative charge. This negatively charged surface becomesattractive to positively charged hydrated ions (e.g. hydronium ions, H3O
+)which move towards the cathode when an electrical field is applied. In CEthis electroendosmotic flow is greater than the electrophoretic velocity of thecharged components in the sample, and all components migrate towards thecathode. In a complex mixture the cations will migrate the quickest, followedby neutrally charged species and finally the anionic components.
Capillary electrophoresis of free solutions is the most widely practicedtechnique, but the charged surfaces can adsorb proteins which may leadto band broadening or the total loss of the sample. Chemically modifiedcapillaries can be used, in which the silanol groups are capped with aneutral reagent. This eliminates the electroendosmotic flow, and thecharged species will migrate towards the oppositely charged electrode. Thedetector is usually placed at one end of the capillary (Figure 6.10) and willonly detect the charged species flowing towards that electrode. By control-ling the pH of the buffer, proteins can be made to migrate to the chosenelectrode.
Capillaries can be filled with a gel (either agarose or polyacrylamide) andseparations undertaken which are similar to SDS-PAGE or IEF. A singlepeak on an acrylamide-filled capillary in the presence of SDS and a singlepeak on a free solution run would be a good indication of the purity ofa protein sample.
148 Protein purification
High voltage power supply
Detector
Capillary
Cathode(–ve)
Anode(+ve)
Figure 6.10
A typical capillary electrophoresis set-up.

The advantages of CE include fast separation times, low sample volumes(nanolitre), high sensitivity (femtomol) and excellent resolution. Thedisadvantage is that the equipment can be expensive.
6.7 Reversed phase high-pressure liquid chromatography(RP-HPLC)
Reversed phase HPLC is a well-established technique in the isolation andanalysis of proteins. Aliphatic groups (e.g. C8, C12 or C18) bonded to a silicaresin form the stationary phase in the column. There are many resins specifi-cally manufactured for use with proteins and peptides (see Appendix 4). Atthe start of the chromatographic run, the mobile phase is initially a polarsolvent. When a protein sample is applied to the RP resin, the hydrophobicregions in the protein’s structure interact with the hydrophobic stationaryphase (see Section 3.4). Gradually increasing the hydrophobicity of thesolvent over a period of time will elute the bound proteins, with the mosthydrophobic proteins eluting later in the chromatographic run.
To increase the amount of bonded phase in an RP column, the particlesize is normally 5 µm but can be as small as 2 µm. Elevated pressures,produced by piston pumps, are required to move the mobile phasethrough the small-diameter resins. The pumps can also be controlled toproduce a solvent gradient. A detector capable of monitoring in the UVregion is also required, as proteins absorb UV light at 280 nm (due to thepresence of the amino acids tyrosine and tryptophan) and at 206 nm (dueto the presence of the peptide bond). A fluorescence detector can be used(excitation wavelength 280 nm and emission wavelength of 320 nm fortyrosine or 340 nm for tryptophan) which will increase the sensitivity, anda fraction collector after the detector can be used to collect the samples.
The solvents used in RP-HPLC (e.g. methanol and acetonitrile) arevolatile and easily removed from the sample at the end of the chromato-graphic run. However, the tertiary structure of a protein may be altered asa result of the interaction with the stationary phase, and the protein maynot fold back into its native conformation, resulting in loss of biologicalactivity. The loss of biological activity may be minimized by reducing therun times and by switching to a less damaging solvent. The inclusion ofinhibitors or cofactors can help to stabilize a protein’s structure. Also, theaddition of a concentrated buffer in the fraction collector tubes may helpthe protein to refold, as the protein will spend less time in solvent. Theloss of biological activity may be a problem if RP-HPLC is to be used topurify the protein, but is not a problem when the technique is used tomonitor the purity of protein fractions, or when a protein is beingprepared for raising antibodies.
Further readingDavis BJ (1964) Disc Electrophoresis. Ann NY Acad Sci 121: 321–349.Hames BD (1998) Gel Electrophoresis of Proteins: A Practical Approach, 2nd edn.
Oxford University Press, Oxford.Laemmli UK (1970) Cleavage of structural proteins during the assembly of the head
of bacteriophage T4. Nature 227: 680–685.
Monitoring the purity of protein solutions 149

Ornstein L (1964) Disc electrophoresis-I. Background and theory. Ann NY Acad Sci121: 321–349.
Petersen JR, Okorodudu AO, Mohammad A, Payne DA (2003) Capillaryelectrophoresis and its application in the clinical laboratory. Clin Chim Acta330: 1–30.
Oliver RWA (1998) HPLC of Macromolecules: A Practical Approach, 3rd edn. OxfordUniversity Press, Oxford.
Strege MA, Lagu AL (eds) Capillary Electrophoresis of Proteins and Peptides (2004)Humana Press, Totowa, NJ.
Vegvari A (2005) Peptide and proteins separations by capillary electrophoresis andelectrochromatography. Comprehen Analyt Chem 46: 149–252.
Westermeier R (2005) Electrophoresis in Practice, 4th edn. Wiley–VCH, New York.Wilson K, Walker J (eds) (2005) Principles and Techniques of Biochemistry and
Molecular Biology, 6th edn. Cambridge University Press.
Reference1. Ladner CL, Yang J, Turner RJ, Edwards RA (2004) Visible fluorescent detection
of proteins in polyacrylamide gels without staining. Analyt Biochem 326: 13–20.
150 Protein purification

Protocol 6.1 The procedure andsolutions for denaturing andnondenaturing PAGE(For nondenaturing PAGE remove the SDS and 2-ME and increase the volume of water to keepthe overall volume constant.)
RUNNING BUFFERpH 8.3 (10 × stock)
Tris base 30.3 g
Glycine 144 g
SDS 10 g
Make to 1000 ml with dH2O
REAGENTS(A) Resolving buffer 1.5 M Tris–HCl pH 8.9
(B) Stacking buffer 0.5 M Tris–HCl pH 6.7
(C) Acrylamide 29.2 g acrylamide, 0.8 g bis-acrylamide
The acrylamide monomer is very toxic and should be handled with due care (refer to therelevant health and safety documentation). Pre-prepared stock solutions are available and shouldbe used in preference to the powder.
Resolving gel mixture 7.5% 10.0% 12.0%(ml) (ml) (ml)
(A) 5.0 5.0 5.0(C) 5.0 6.7 8.020% (w/v) SDS 0.1 0.1 0.1H2O 9.8 8.1 6.8+10% (w/v) ammonium persulfate 0.06 0.06 0.06TEMED 0.04 0.04 0.04
Total 20.0 20.0 20.0
Monitoring the purity of protein solutions 151

Stacking gel (ml)
(B) 5.0(C) 2.520% (w/v) SDS 0.1H2O 12.3+10% (w/v) ammonium persulfate 0.06TEMED 0.04
Total 20.0
SAMPLE BUFFER (2 × STOCK)5.0 ml (B)
2.0 ml glycerol
1.0 ml 20% (w/v) SDS
1.0 ml 2-ME
11 ml H2O
Boil samples for 5.0 min before applying to the gel.
Note: For nondenaturing PAGE, omit the SDS and 2-ME in the sample buffer and do not boilthe samples.
METHOD1. Pour resolving gel to a height approximately 1.0 cm below
comb, overlay with isopropanol and allow the gel mixture topolymerize.
2. Remove the solvent and wash with distilled water. Remove thewater using blotting paper (without touching the resolving gel).
3. Insert the teflon well-forming comb, add the catalysts to thestacking gel mixture and pour onto the resolving gel until thestacking gel reaches the top of the glass plates. Overlay with aminimal volume of isopropanol (approximately 50–100 µl) andallow to polymerize.
4. When the polymerization has been completed, gently removethe well-forming comb. Wash the sample wells with distilledwater to remove unpolymerized acrylamide and add runningbuffer up to the top of the wells.
5. Apply the standards (nondenaturing gels do not requirestandards) and samples and run the gel at 40 mA per gel (thismay need adjusting to avoid going over 200 V). Stop the exper-iment when the bromophenol blue reaches 0.5 cm from the endof the gel.
152 Protein purification

6. Remove the gel from the gel cassette, place in a tray and coverwith Coomassie blue stain for at least a couple of hours.
7. Remove from the stain and place in destain until the backgroundis clear enough to visualize the samples and standards.
Note: if a nondenaturing PAGE has been run to detect enzymes in the gel then theelectrophoretic buffer should be cooled to 4°C throughout the run. At the end of the run thegel should be incubated with the appropriate reagents to detect the enzymes present.
STAIN1.25 g Coomassie blue R (Page Blue 83) dissolved in 225 ml methanol 225 ml H2O filteredthrough Whatman no. 1 filter paper; add 50 ml of acetic acid
DESTAIN25% (v/v) methanol (or ethanol) + 10% (v/v) acetic acid
NOTES1. Prepare buffers fresh or from frozen stocks and use the highest
reagent grade available.
2. Check the data sheets provided by the reagent manufacturersand take appropriate Health and Safety precautions.
Monitoring the purity of protein solutions 153

Protocol 6.2 Silver stain(adapted from GE Healthcareprotocol) compatible with massspectrometryAfter the electrophoretic run the gel can be placed sequentially in the following solutions.
FIXATIONPlace the gel in a solution of 40% (v/v) ethanol and 10% (v/v) acetic acid for 30 min.
SENSITIZINGPlace the gel in a solution of 7% (w/v) sodium acetate, 5% (w/v) sodium thiosulfate, 30% (v/v)ethanol and 0.5% (v/v) of glutaraldehyde (25% w/v) for 30 min.
Note: If the silver-stained polypeptides in the gel are required for mass spectrometry then omitthe glutaraldehyde addition.
WASHPlace the gel in ultrapure water (3 × 5 min per wash).
SILVER STAININGPlace the gel in a solution of 10% (v/v) silver nitrate (2.5% w/v), 0.04% formaldehyde (37% w/v) for 20 min.
WASHPlace the gel in ultrapure water (2 × 1 min per wash).
DEVELOPINGPlace the gels in a solution of 2.5% (w/v) sodium carbonate. Add 40 µl of formaldehyde if thepolypeptides in the gel are required for mass spectrometry and 20 µl of formaldehyde if theyare not required for mass spectrometry. The developing should take 2–5 min.
154 Protein purification

STOPPINGPlace the gel in a solution of 1.5% (w/v) EDTA for 10 min.
WASHPlace the gel in ultrapure water (3 × 5 min per wash).
STORAGEPlace the gel in a solution of 4.6% (v/v) glycerol (87% w/w) and 30% (v/v) ethanol (2 × 30 min).
NOTES1. Prepare buffers fresh or from frozen stocks and use the highest
reagent grade available.
2. Check the data sheets provided by the reagent manufacturersand take appropriate Health and Safety precautions.
3. The solutions for silver staining should be freshly prepared withultrapure water (18.2 MΩ·cm at 25°C) and filtered through0.2 µm membrane.
Monitoring the purity of protein solutions 155

Protocol 6.3 Western blottingusing a semi-dry blotter
MATERIALS Twelve pieces of 3MM filter paper cut slightly larger than the gel itself (i.e. 8 cm × 9 cm formini gels)
One piece of nitrocellulose membrane filter (6 cm × 9 cm for mini gels)
Tris-buffered saline (TBS ): 0.5 M Tris pH 7.6 containing 9% (w/v) NaCl
Continuous transfer buffer (CTB ): dissolve 5.81 g Tris, 2.89 g glycine, 0.315 g SDS in 800 mldistilled H2O then add 200 ml methanol
0.05% (w/v) copper phthalocyanine
3% (w/v) bovine serum albumin (BSA ) in TBS (BSA/TBS)
0.05% (v/v) Tween 20 in TBS (TBS/Tween)
Primary and secondary antibodies at appropriate dilutions in BSA/TBS
PROCEDURE FOR USE WITH A SEMI-DRY BLOTTER1. After the completion of PAGE, remove the polyacrylamide gel
from the glass cassette and soak briefly in CTB.
2. Moisten the top and bottom (cathode and anode) surfaces ofthe blotter with distilled water.
3. Soak six pieces of blotting paper in CTB, remove any excess,and then place on the anode plate of the blotting apparatus.Remove any air bubbles by rolling the filter papers with a glassrod. After soaking the nitrocellulose in CTB, place the nitrocel-lulose membrane on top of the filter papers.
4. Transfer the polyacrylamide gel from CTB onto the surface ofthe nitrocellulose membrane filter.
5. Soak another six pieces of 3MM paper in CTB and place on topof the gel, again using a glass rod to remove air bubbles.
6. Position the cathodic plate of the blotting apparatus onto thefilter paper/gel sandwich.
7. Connect to the power supply and run the transfer at a currentof 45 mA per gel for 50 min.
8. If colored standards have been included in the PAGE experi-ment, the transfer can be checked by gently lifting the gel overthe standards. If the standards have not completely transferred,
156 Protein purification

carefully reset the gel and the filter paper and resume the trans-fer.
9. If colored standards have not been included the nitrocellulosecan be reversibly stained with 0.05% (w/v) copper phthalocya-nine. The nitrocellulose membrane can be destained with12 mM NaOH followed by neutralization in TBS.
10. To prevent the binding of primary antibody to the nitrocellu-lose membrane during probing, the unbound sites on themembrane are blocked by incubation for at least 1 h at roomtemperature in either 3% (w/v) BSA or 3% (w/v) milk powderin TBS (the blots can be left at this stage for days at 4°C if abactericide such as 0.05% (w/v) sodium azide is included).
11. Wash the blot in several changes of TBS/Tween (minimum of6 × 10 min washes) before incubation, with an appropriatedilution of primary antibody for at least 2 h at room tempera-ture, but preferably overnight at 4°C (the blots can be left atthis stage for days at 4°C if a bactericide such as 0.05% (w/v)sodium azide is included).
12. Wash the blot in several changes of TBS/Tween (minimum of6 × 10 min washes) to remove unbound primary antibody.
13. Incubate with alkaline phosphatase-conjugated secondaryantibody at an appropriate dilution in BSA/TBS (usually 1/1000to 1/2000). This incubation should be conducted for at least2 h at room temperature, but preferably overnight at 4°C (theblots can be left at this stage for days at 4°C if a bactericidesuch as 0.05% (w/v) sodium azide is included).
14. Wash as above to remove unbound secondary antibody andrinse the blot in substrate buffer for 2 min (0.2 M Tris pH 9.5).Then develop to reveal antibody–antigen binding in the follow-ing substrate mixture:
14. 33 ml BCIP (5-bromo-4-chloro-3-indolyl phosphate; 50 mg ml–1 inDMF (dimethyl formamide)) and 44 ml NBT (nitroblue tetrazolium;75 mg ml–1 in 70% (v/v) DMF) in 20 ml 0.2 M Tris pH 9.5.
15. The color development normally takes up to 30 min but maytake up to several hours. Rinse developed blots in distilled waterand blot dry on filter paper.
16. As an alternative, the secondary antibody mixture may beconjugated to horseradish peroxidase and reactivity revealedusing a variety of substrates such as 4-chloronaphthol (2.0 mlat 5 mg ml–1 in ethanol plus 10 ml TBS and 10 ml 30% (v/v)H2O2, freshly mixed).
17. For greater sensitivity, antibody reactivity can be detected usingenhanced chemiluminescence (ECL ). In this case, the washedand probed blot is placed on a clean glass plate and excessbuffer removed with filter paper.
Monitoring the purity of protein solutions 157

18. A 1:1 mixture of ECL reagents (GE Healthcare; Biorad; Perbio,Pierce Ltd) A+B (usually approximately 2 ml total volume for amini-gel blot) is spread evenly on the surface of the blot andleft for 1 min at room temperature. Excess reagent is removedwith filter paper and the blot covered with a sheet of cling film.The blot is then exposed in the dark room for at least 10 s ontoHyper film ECL and the image revealed using X-ray developer.
NOTES1. Prepare buffers fresh or from frozen stocks and use the highest
reagent grade available.
2. Check the data sheets provided by the reagent manufacturersand take appropriate Health and Safety precautions.
3. Nitrocellulose will irreversibly bind all proteins; handle thematerials with gloves to avoid contamination.
158 Protein purification

Exercise 6.1 SDS-PAGEcalculation and graph drawingexerciseRelative mobility (Rf) is the mobility of the standards/samples relative to the dye front (a valuebetween 0 and 1.0).
Rf =
The distances should be measured from the point of sample application to the midpoint ofeither the dye front or the protein bands.
A 10% polyacrylamide gel has been run with standard proteins on lane A and a sample on laneB.
Question: Calculate the Rf values for the standard proteins in lane A and plot a calibration graphfor the experiment (remember that of log10 3.0 = 1000; there are no proteins with such a lowMr so start the graph axis at log10 3.5).
Question: Using the calibration graph and the Rf value for the sample run in lane B, estimatethe molecular mass of the protein in lane B.*
distance moved by the sampledistance moved by the dye front
Monitoring the purity of protein solutions 159
LaneA
Cathode (–ve)
Sample origin
Standard proteins
Protein A
Protein B
Protein C
Protein D
Protein E
Protein F
Bromophenolblue dye front
LaneB
Anode (+ve)

Table 6.1 Standard proteins run on SDS-PAGE (Exercise 6.1)
Standard proteins Mr Rf Log10 Mr
A Myosin 205 000B β-Galactosidase 116 000C Phosphorylase 97 400D Albumin (bovine) 66 000E Albumin (egg) 45 000F Anhydrase 29 000
*A typical calibration graph and the answer to the problem can be foundin Appendix 2.
160 Protein purification

Appendix 1 The common unitsused in biology1 mol (or mole) of a compound is the molecular weight in grams.
1 mol of any compound contains the same number of molecules (Avogadro’s number = 6.023× 10²³).
A molar (M) solution is 1 mol of a compound dissolved in a liter (1000 ml) of water.
1.0 1.0 × 10⁻³ 1.0 × 10⁻⁶ 1.0 × 10⁻⁹ 1.0 × 10⁻¹²
Concentration molar millimolar micromolar nanomolar picomolarM mM µM nM pM
Amount mol millimol micromol nanomol picomolmmol µmol nmol pmol
g mg µg ng pg
Volume liter (dm3) milliliter (cm3) microliter nanoliter picoliterl ml µl nl pl
Appendix 1 The common units used in biology 161
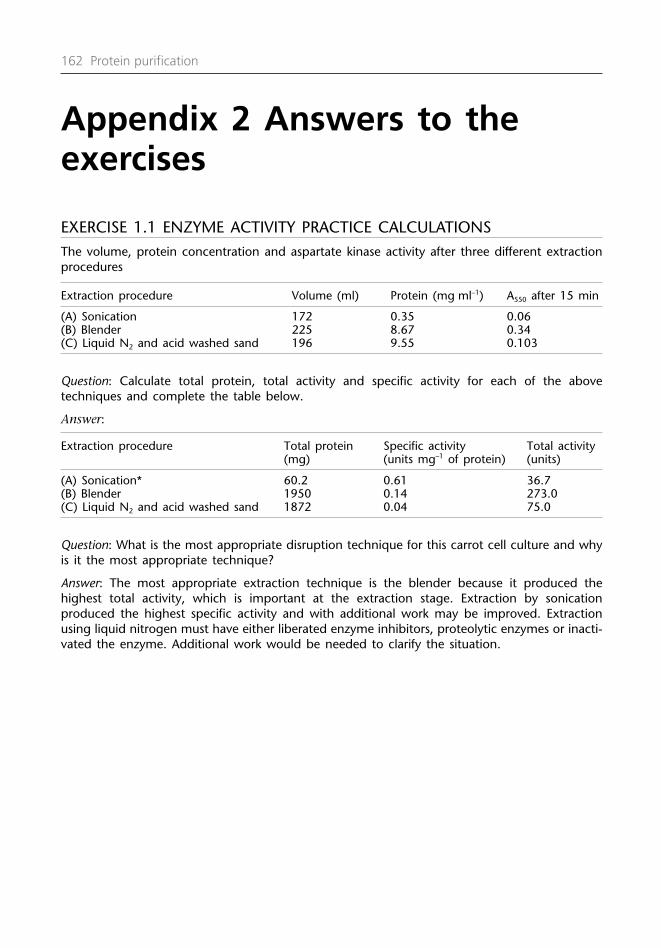
Appendix 2 Answers to theexercises
EXERCISE 1.1 ENZYME ACTIVITY PRACTICE CALCULATIONS The volume, protein concentration and aspartate kinase activity after three different extractionprocedures
Extraction procedure Volume (ml) Protein (mg ml–1) A550 after 15 min
(A) Sonication 172 0.35 0.06(B) Blender 225 8.67 0.34(C) Liquid N2 and acid washed sand 196 9.55 0.103
Question: Calculate total protein, total activity and specific activity for each of the abovetechniques and complete the table below.
Answer:
Extraction procedure Total protein Specific activity Total activity(mg) (units mg–1 of protein) (units)
(A) Sonication* 60.2 0.61 36.7(B) Blender 1950 0.14 273.0(C) Liquid N2 and acid washed sand 1872 0.04 75.0
Question: What is the most appropriate disruption technique for this carrot cell culture and whyis it the most appropriate technique?
Answer: The most appropriate extraction technique is the blender because it produced thehighest total activity, which is important at the extraction stage. Extraction by sonicationproduced the highest specific activity and with additional work may be improved. Extractionusing liquid nitrogen must have either liberated enzyme inhibitors, proteolytic enzymes or inacti-vated the enzyme. Additional work would be needed to clarify the situation.
162 Protein purification
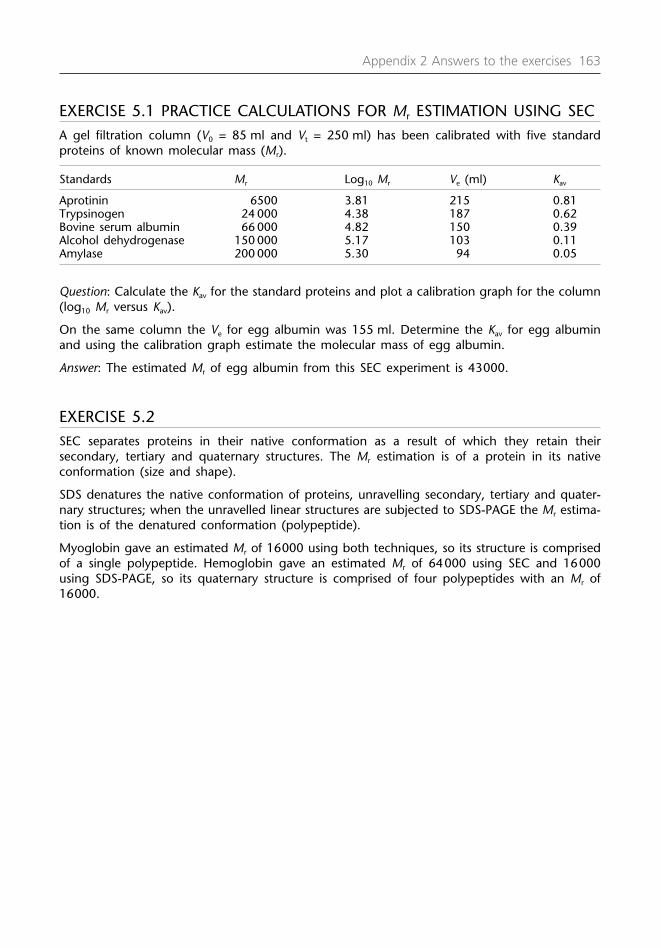
EXERCISE 5.1 PRACTICE CALCULATIONS FOR Mr ESTIMATION USING SECA gel filtration column (V0 = 85 ml and Vt = 250 ml) has been calibrated with five standardproteins of known molecular mass (Mr).
Standards Mr Log10 Mr Ve (ml) Kav
Aprotinin 6500 3.81 215 0.81Trypsinogen 24 000 4.38 187 0.62Bovine serum albumin 66 000 4.82 150 0.39Alcohol dehydrogenase 150 000 5.17 103 0.11Amylase 200 000 5.30 94 0.05
Question: Calculate the Kav for the standard proteins and plot a calibration graph for the column(log10 Mr versus Kav).
On the same column the Ve for egg albumin was 155 ml. Determine the Kav for egg albuminand using the calibration graph estimate the molecular mass of egg albumin.
Answer: The estimated Mr of egg albumin from this SEC experiment is 43000.
EXERCISE 5.2SEC separates proteins in their native conformation as a result of which they retain theirsecondary, tertiary and quaternary structures. The Mr estimation is of a protein in its nativeconformation (size and shape).
SDS denatures the native conformation of proteins, unravelling secondary, tertiary and quater-nary structures; when the unravelled linear structures are subjected to SDS-PAGE the Mr estima-tion is of the denatured conformation (polypeptide).
Myoglobin gave an estimated Mr of 16000 using both techniques, so its structure is comprisedof a single polypeptide. Hemoglobin gave an estimated Mr of 64000 using SEC and 16000using SDS-PAGE, so its quaternary structure is comprised of four polypeptides with an Mr of16000.
Appendix 2 Answers to the exercises 163

EXERCISE 6.1 PRACTICE CALCULATIONS FOR SDS-PAGETable 6.1 Standard proteins run on SDS-PAGE (Exercise 6.1)
Standard proteins Mr Rf Log10 Mr
A Myosin 205000 0.19 5.31B Galactosidease 116000 0.29 5.06C Phosphorylase 97400 0.39 4.98D Albumin (bovine) 66000 0.54 4.82E Albumin (egg) 45000 0.69 4.65F Anhydrase 29000 0.88 4.46
Answer: From Figure 6.5, unknown protein in lane B: Rf = 0.61 corresponding to an Mr of60200.
164 Protein purification

Appendix 3 Single-letter codefor amino acids
NONPOLAR SIDE CHAINS (HYDROPHOBIC) A Alanine (Ala)C Cysteine (Cys)F Phenylalanine (Phe)G Glycine (Gly)I Isoleucine (Ile)L Leucine (Leu)M Methionine (Met)P Proline (Pro)V Valine (Val)W Tryptophan (Trp)
NONCHARGED POLAR SIDE CHAINS (HYDROPHILIC)N Asparagine (Asn)Q Glutamine (Gln)S Serine (Ser)T Threonine (Thr)Y Tyrosine (Tyr)
ACIDIC SIDE CHAINS (POLAR, HYDROPHILIC)D Aspartic acid (Asp)E Glutamic acid (Glu)
BASIC SIDE CHAINS (POLAR, HYDROPHILIC)H Histidine (His)K Lysine (Lys)R Arginine (Arg)
Appendix 3 Single-letter code for amino acids 165

Appendix 4 List of suppliers(The information below was correct at the time of going to press.)
MANUFACTURERS OF CHROMATOGRAPHY EQUIPMENT AND RESINS
Columns and tubingGE Healthcare offices: Offices throughout the world; access the web site for relevant location(http://www.gehealthcare.com)
GE Healthcare UK LtdAmersham PlaceLittle ChalfontBuckinghamshire HP7 9NAUK
Tel: +44 (0)870 606 1921Fax: +44 (0)1494 542010
Bio-Rad Laboratories: Offices throughout the world; access the web site for relevant location(http://www.bio-rad.com)
Bio-Rad Laboratories LtdBio-Rad HouseMaxted RoadHemel Hempstead Hertfordshire HP2 7DXUK
Tel: +44 (0)208 328 2000Fax: +44 (0)208 328 2550
Omnifit Ltd: Offices throughout the world; access the web site for relevant location(http://www.bio-chemvalve.com/default.asp)
Bio-Chem Valve/Omnifit2 College ParkColdhams LaneCambridge CB1 3HDUK
Tel: +44 (0)1223 416642 Fax: +44 (0)1223 416787
Millipore: Offices throughout the world; access the web site for relevant location and distribu-tors (http://www.millipore.com/)
Millipore Corporate Headquarters290 Concord RoadBillerica, MA 01821USA(1) (978) 715-4321
166 Protein purification

Millipore UK Offices
Millipore (U.K.) LimitedUnits 3&5 The CourtyardsHatters LaneWatford, WD18 8YH UK
For Customer Service inquiries contact:Tel: +44 (0)870 900 4645Fax: +44 (0)870 900 4644
Chromatographic media (to pack in empty columns)GE Healthcare: Offices throughout the world; access the web site for relevant location(http://www.gehealthcare.com)
(Address: see page 166)
Bio-Rad Laboratories: Offices throughout the world; access the web site for relevant location(http://www.bio-rad.com)
(Address: see page 166)
Pall Corporation: Offices throughout the world; access the web site for relevant location(http://www.pall.com/)
Europa HouseHavant StreetPortsmouthHampshire PO1 3PDUK
Tel: +44 (0)23 92 303303Fax: +44 (0)23 92 302510
Merck KGaA: Offices throughout the world; access the web site for relevant location(http://www.merck.de/servlet/PB/menu/1001723/index.html)
Merck HouseSeldown LanePooleDorsetBH15 1TDUK
Tel: +44 (0)1202 661616Fax: +44 (0)1202 666730
Qiagen Ltd: Offices in the UK; access the web site for relevant information(http://www.neb.com/nebecomm/default.asp)
Qiagen House Fleming Way CrawleyWest Sussex RH10 9NQUK
Tel: +44 (0)1293 422911Fax: +44 (0)1293 422922
Appendix 4 List of suppliers 167

New England Biolaboratories: Offices in the USA; access the web site for relevant information(http://www.neb.com/nebecomm/default.asp)
New England Biolabs240 County RoadIpswichMA 01938-2723USA
Tel: 1-800-632-5227Fax: 1-800-632-7440
Perbio Science Ltd (Pierce Biotechnology Inc.): Offices throughout the world; access the website for relevant location (http://www.piercenet.com/) (http://www.perbio.co.uk)
Perbio Science UK LtdUnit 9Atley WayNorth Nelson Industrial EstateCramlingtonNorthumberland NE23 1WAUK
Tel: +44 (0)800 252 185Fax: +44 (0)800 085 8772
Sigma–Aldrich: Offices throughout the world; access the web site for relevant location(http://www.sigmaaldrich.com)
Sigma–Aldrich Company LtdThe Old BrickyardNew RoadGillinghamDorsetSP8 4XTUK
Tel: +44 (0)800 717181Fax: +44 (0)800 378785
Whatman: Offices throughout the world; access the web site for relevant location and distrib-utors (http://www.whatman.com/)
For UK, Ireland, France, Italy, Spain, Belgium, Luxembourg, Portugal, Greece, Cyprus and Malta
Tel: +44 (0)1622 676670 Fax: +44 (0)1622 670755
Promega: Offices throughout the world; access the web site for relevant location and distribu-tors (http://www.promega.com/)
Promega UK
Promega, Delta HouseSouthampton Science ParkSouthampton, SO16 7NS UK
Tel +44 (0)800 378994FAX +44 (0)800 181037
168 Protein purification

Millipore: Offices throughout the world; access the web site for relevant location and distribu-tors (http://www.millipore.com/)
Tel : +44 (0)870 900 4645Fax : +44 (0)870 900 4644
(Address: see pages 166 and 167)
Chromatographic columns (pre packed for use)
GE Healthcare: Offices throughout the world; access the web site for relevant location(http://www.gehealthcare.com)
(Address: see page 166)
Bio-Rad Laboratories: Offices throughout the world; access the web site for relevant location(http://www.bio-rad.com)
(Address: see page 166)
Pall Corporation: Offices throughout the world; access the web site for relevant location(http://www.pall.com/)
(Address: see page 167)
Tosoh Bioscience: Offices throughout the world; access the web site for relevant location(http://www.tosohbiosep.com)
Tosoh Bioscience GmbHZettachring 670567 StuttgartGermany
Tel: 0049 (0)711 13257-0Fax: 0049 (0)711 13257-89
Waters plc: Offices throughout the world; access the web site for relevant location(http://www.waters.com)
Waters Ltd730–740 Centennial CourtCentennial ParkElstreeHertfordshire WD6 3SZUK
Tel: +44 (0)208 238 6100Fax: +44 (0)208 207 7070
Appendix 4 List of suppliers 169

Phenomenex plc: Offices throughout the world; access the web site for relevant location(http://www.phenomenex.com)
Queens AvenueHurdsfield Industrial EstateMacclesfieldCheshireSK10 2BNUK
Tel: +44 (0)1625 501367Fax: +44 (0)1625 501796
Chromatography equipment
GE Healthcare: Offices throughout the world; access the web site for relevant location(http://www.gehealthcare.com)
(Address: see page 166)
Bio-Rad Laboratories: Offices throughout the world; access the web site for relevant location(http://www.bio-rad.com)
(Address: see page 166)
Waters plc: Offices throughout the world; access the web site for relevant location(http://www.waters.com)
(Address: see page 169)
Shimadzu: Offices throughout the world; access the web site for relevant location(http://www.shimadzu.co.uk/index.html)
Shimadzu UK Mill Court Featherstone Road Wolverton Mill South, Milton Keynes MK12 5RDUK
Tel: +44 (0)8708 375209
Agilent Technologies: Offices throughout the world; access the web site for relevant location(http://www.home.agilent.com)
Agilent Technologies UK Ltd South Queensferry West Lothian EH30 9TG UK
Tel: +44 (0)131 331 1000Fax: +44 (0)131 331 3000
170 Protein purification

Perkin Elmer LAS: Offices throughout the world access the web site for relevant location(http://las.perkinelmer.co.uk)
Tel: +44 (0)800 896046Fax: +44 (0)800 891714
SUPPLIERS OF PROTEIN ELECTROPHORETIC AND WESTERN BLOTTINGEQUIPMENTGE Healthcare offices: throughout the world; access the web site for relevant location(http://www.gehealthcare.com)
GE Healthcare UK LtdAmersham PlaceLittle ChalfontBuckinghamshire HP7 9NAUK
Tel: +44 (0)870 606 1921Fax: +44 (0)1494 544350
Bio-Rad Laboratories: Offices throughout the world; access the web site for relevant location(http://www.bio-rad.com)
Bio-Rad Laboratories LtdBio-Rad House Maxted RoadHemel Hempstead Hertfordshire HP2 7DXUK
Tel +44(0) 208 328 2000Fax +44(0) 208 328 2550
Harvard Apparatus Company USA is the parent company for Biochrom(http://www.biochrom.co.uk) and Scie-Plas (http://www.scie-plas.com). The equipment isdistributed via a number of different companies worldwide including Web Scientific(http://www.webscientific.co.uk) and Flowgen (http://www.flowgen.co.uk/)
Biochrom LtdCambridge Science ParkMilton RoadCambridge CB4 0FJUK
Tel: +44 (0)1223 423723Fax: +44 (0)1223 420164
Scie-PlasUnit 3, Gainsborough Trading EstateOld RoadSouthamWarwickshire CV47 1HPUK
Tel: +44 (0)1926 814093Fax: +44 (0)1926 813975
Appendix 4 List of suppliers 171

Web Scientific Ltd CreweCheshireCW2 5PR UK
Tel: +44 (0)1270 875172Fax: +44 (0)1270 878186
Flowgen Bioscience LtdWilford Industrial EstateRuddington LaneWilfordNottingham NG11 7EPUK
Tel: +44 (0)1159 775494Fax: +44 (0)1159 455379
Engineering & Design Plastics Ltd 84 High StreetCherry HintonCambridge CB1 9HZUK
Tel +44 (0)1223 249431 Fax +44 (0)1223 411803www.edplastics.co.uk
Owl Separation Systems (http://www.owlsci.com/) are distributed via a number of differentcompanies worldwide including Autogen Bioclear (http://www.autogen-bioclear.com/) andVWR international (http://uk.vwr.com/app/Home) in the UK
Owl Separation Systems55 Heritage AvenuePortsmouthNH 03801USA
Tel: 1-800-242-5560 Fax: 1-603-559-9258
Autogen Bioclear UK LtdHolly Ditch Farm Mile Elm CalneWiltshire SN11 0PYUK
Tel: +44 (0)1249 819008 Fax: +44 (0)1249 817266
172 Protein purification

VWR International LtdHunter BoulevardMagna ParkLutterworthLeicestershire LE17 4XNUK
Tel: +44 (0)1455 558600 Fax: +44 (0)1455 558586
Whatman Biometra offices: Offices throughout the world; access the website for details(http://www.biometra.de/). Distributors throughout the world include Thistle Scientific Ltd(www.thistlescientific.co.uk)
Biometra GmbH i. L.Rudolf-Wissell-Straße 3037079 GoettingenGermany
Tel: 0049-551-50686-0Fax: 0049-551-50686-66
Thistle Scientific LtdDFDS HouseGoldie RoadUddingtonGlasgow G71 6NZUK
Tel: 0044 (0)1698-338844Fax: 0044 (0)1698-338880
Millipore (for nitrocellulose membranes): Offices throughout the world; access the web site forrelevant location and distributors (http://www.millipore.com/)
For Customer Service inquiries contact:Tel: +44 (0)870 9004645Fax: +44 (0)870 9004644
(Address: see pages 166 and 167)
SUPPLIERS OF ULTRAFILTRATION EQUIPMENT AND MEMBRANESSartorius (Vivascience): Offices throughout the world; access the web site for relevant locationand distributors (http://www.sartorius.com/)
Sartorius LtdLongmead Business CentreBlenheim RoadEpsomSurrey KT19 9QQUK
Tel: +44 (0)1372 737101Fax: +44 (0)1372 722151
Appendix 4 List of suppliers 173

Millipore: Offices throughout the world access the web site for relevant location and distribu-tors (http://www.millipore.com/)
For Customer Service inquiries contact:Tel: +44 (0)870 9004645Fax: +44 (0)870 9004644
(Address: see pages 166 and 167)
Pall Corporation: Offices throughout the world access the web site for relevant location(http://www.pall.com/)
Europa HouseHavant StreetPortsmouthHampshire PO1 3PDUK
Tel: +44 (0)2392 303303Fax: +44 (0)2392 302506
Sigma–Aldrich: Offices throughout the world access the web site for relevant location(http://www.sigmaaldrich.com)
Sigma–Aldrich Company LtdThe Old BrickyardNew RoadGillinghamDorset SP8 4XTUK
Tel: +44 (0)800 717181Fax: +44 (0)800 378785
174 Protein purification

GlossaryAbsorbance (of light): the log10 (1/T). The values range between 0 andinfinity (∞). (Spectrophotometers typically measure linear absorbancevalues between 0 and 3.0.)
Agarose: A polysaccharide with many hydroxyl groups. The material canbe used to construct biocompatible resins to be used in protein purifica-tion.
Agonist: A substance that binds to a receptor and triggers a response inthe cell.
Aliquot: A portion of the total amount of solution.
Amphipathic: A molecule which contains both hydrophilic andhydrophobic groups, for example phospholipids and detergents.
Ampholytes: Mixtures of polyamino and polycarboxylic acids.
Antibody: A protein released by B cells in response to a foreign compound(antigen). There are different classes of antibodies collectively known asimmunoglobulins.
Antigen: A foreign compound, which, when it enters the body, is recog-nized as foreign and elicits the production of an antibody.
Ascites: Fluid which collects in the peritoneum (which is the membranethat forms the lining of the abdominal cavity).
Assay: A process in which the concentration of a component (e.g. targetprotein) as part of a mixture is measured. There are many different typesof assay depending on the target protein’s biological function, including:enzyme assay, bioassay (the effect of a substance on a living organism),immunoassay, antigen capture assay, receptor assay, radioimmunoassayetc.
Attenuance (of light): Measurement of light scattering, as is the case whena spectrophotometer is used to estimate bacterial cell numbers (incorrectlyreferred to as optical density). When light scattering is low, attenuancereduces to absorbance.
Azocasein: The orange sulfanilamide dye is covalently bonded to the milkprotein casein to provide a substrate for proteolytic enzymes (see below).
Bactericide: A reagent that destroys bacteria.
Ballotini beads: Glass beads (0.2–1.0 mm diameter) used to puncture thewalls of prokaryotic and eukaryotic cells.
Beer–Lambert law (also see ‘Molar adsorption (absorptivity) coefficient(ε)’): The absorbance (A) of a solution at a given wavelength (nm) is equalto the path length of the cuvette (l) in the spectrophotometer (1 cm) × (ε)the molar absorption coefficient (M–1 cm–1) × (C) the concentration (mol l–1).
Beer–Lambert law: A = lεC
Example: The absorbance of a solution of NADH is 1.2; calculate theconcentration of the solution.
The molar absorption coefficient (ε) of NADH at 340 nm is 6.22 × 10³.
The path length of the cell is 1.0 cm.
Beer–Lambert law: A = lεC,1.2 = 1 × 6220 × C.
Therefore C = 0.000193 M (Appendix 2),or C = 0.193 mM or 193 µM.
Answer: The concentration of a solution of NADH with an absorbance of1.2 is 193 µM.
bis: Occurring twice, as in bis-acrylamide or bis-Tris–propane.
Biogel: A trade name (Bio-Rad) for polyacrylamide gel formed into beadsused for protein purification.
Brønsted: Brønsted proposed a definition for acids and bases, namely thatan acid is a proton donor and that a base is a proton acceptor.
Calmodulin: A small, ubiquitous calcium-binding protein which affectsthe activity of many calcium-dependent enzymes.
Clathrate: Is a cage or lattice formed around a molecule (or structure),trapping and containing that molecule (or structure).
Chaotropic salts: ‘Chaos-forming’ salts, referring to a salt’s ability to disruptthe regular hydrogen bond structures in water. They increase the watersolubility of nonpolar substances and increase the ‘salting in’ of proteins.
Chelating agent: A compound (e.g. EDTA or DIECA) which preferentiallybinds to metal ions. This reduces or effectively eliminates the metal ion’spresence in a solution.
Chromatography: A separation process that distributes analytes(substances) between two immiscible phases, a moving phase and astationary phase. How they distribute between the two phases is deter-mined by their partition coefficient (Kd).
Concentration: A molar (M) solution is 1 mol of a compound dissolvedin 1 l of water, that is, the molecular weight in grams dissolved in 1000 mlof water.
Conformation (of proteins): The three-dimensional shape of the macro-molecular chain.
Conjugated (as in secondary antibody): Joined together, for exampleantimouse IgG raised in rabbit conjugated to horseradish peroxidase.
Coordinate bonds: A covalent bond where both electrons for sharing areprovided by one of the atoms.
Covalent bond: A chemical bond that involves the sharing of pairs ofelectrons between atoms.
176 Protein purification

Critical micelle concentration (CMC): The concentration above which adetergent will start to form micelles (temperature and possibly salt depen-dent).
Cuvette: A small square tube, sealed at one end, made of plastic glass orquartz (required for UV), designed to hold samples for spectrophotomet-ric analysis.
Dalton (Da): The molecular mass of a compound relative to 1/12 themolecular weight of carbon (i.e. 1).
Dative bonds: See ‘Coordinate bonds’.
Denatured (conformation of proteins): The native conformation of aprotein can be altered by changes in pH, temperature and the presence ofdetergents. The unravelled native conformation (biologically active) isdenatured (biologically inactive).
Dielectric constant: The ability of a medium to reduce the force of attrac-tion between two charged particles. Water has a large dielectric constant(80.4) which is able to weaken the attractive forces between anions andcations (e.g. Na+ Cl–) resulting in the salt solubilizing in the water.
DNase: An enzyme which cleaves DNA.
Douce homogenizer: A homogenizer with a glass mortar and pestle.
E64: An inhibitor of some proteolytic enzymes (sulfhydryl).
Electrophoresis: Describes the movement of a molecule under the influ-ence of an electrical field in which the experiment is typically stoppedbefore the sample contacts the electrode.
Empirical: Derived from experimentation, that is, by trial and error ratherthan by theory.
Endoplasmic reticulum: A specialized membranous organelle withineukaryotic cells responsible for synthesis of many membrane proteins. Inaddition, the endoplasmic reticulum synthesizes proteins exported by thecell as well as proteins to be directed to the lumens of other organelles.
Enzyme: A biological macromolecule (typically a protein but also someribonucleic acids called ribozymes) that acts as a catalyst, increasing therate of reaction.
Eukaryotes: Organisms that are composed of one or more cells whichcontain a membrane-enclosed nucleus and organelles (e.g. animal, plant,fungi, yeast and most algae).
Fc: The crystallizable portion of an immunoglobulin (the constant region)which is not involved in antigen binding.
Feedstock: The raw material used in an industrial process.
Fines: Chromatography resins can break down as a result of handling andusually float when the resin is resupended. If the fines are not removedthey can block the spaces around and in the resin, which may result inhigh back pressure.
Glossary 177

Free radical: A molecule with a reactive unpaired electron.
Fungicide: Chemical compounds used to prevent the growth of fungi.
∆G: The change in the Gibbs free energy derived from the Gibbs freeenergy equation: ∆G = ∆H – T∆S.
Genome: The whole hereditary information of an organism that isencoded in the DNA, including genes and noncoding regions. This can befractionated into the nuclear genome and mitochondrial genome.
Glycosylation: The addition of saccharide residues to proteins and lipids(see O-, N- and GPI-linked saccharides).
Gravity: The natural force of attraction that exists between all bodies inthe universe (g = 981 cm s–2).
GPI-linked saccharides: An amphipathic molecule composed ofphosphatidyl inositol, phosphate and sugar residues attached to the N-terminus of some membrane proteins.
Homogenate: Tissue (cell)/buffer mixture resulting from the action of ahomogenizer.
Homogenizer: A laboratory machine that disrupts tissue (cells) by cutting,mixing and blending the starting material in a buffer.
Hydrodynamic volume: The volume a macromolecule (e.g. protein) insolution. This volume can vary depending on the Mr of the macromole-cule and its interaction with the solvent.
Hydrogen bond: When hydrogen is bonded to a very electronegativeatom such as oxygen or nitrogen, the result is a dispersion of chargewithin the molecule with the oxygen (or nitrogen) side becoming slightlynegative and the hydrogen side becoming slightly positive, creating adipole. Hydrogen bonds exist throughout nature, giving water its uniqueproperties. In a protein’s structure a weak attractive force can be estab-lished if these oppositely charged dipole molecules are in close proximity.
Hydronium ion: Water dissociates into a proton and a hydroxyl ion:
H2O ↔ H+ + OH–
The proton associates with another water molecule to produce the hydro-nium ion (a protonated water molecule):
H2O + H+ ↔ H3O+,
producing H2O ↔ H3O+ + OH–.
The molar concentration of water is 55.5 and the concentration of H3O+
and OH– at 25°C is 10–7 molar. This gives a pH (see definition of pH) of7 for water and neutral solutions. In practice, because atmospheric CO2
dissolves in water to produce the acidic bicarbonate ion HCO3–, the pH of
water is usually around pH 5.5.
Hydrophilic (‘water loving’): A molecule or functional group which ishydrophilic will prefer to interact with water or other polar solvents.
178 Protein purification

Hydrophobic (‘water hating’): A molecule or functional group which ishydrophobic will tend to avoid contact with water or other polar solvents.
Hydrostatic pressure: The pressure exerted or transmitted by a fluid.
Hygroscopic: A substance that readily attracts and retains water.
Immiscible: Incapable of mixing, for example oil and water.
Immunoglobulin (antibody): A protein produced by the lymphocyteswhich binds to a specific antigen.
Inclusion bodies: Small intracellular insoluble aggregates.
Intermolecular: A property or interaction occurring between differentmolecules or macromolecules.
Intramolecular: A property or interaction occurring within a singlemolecule or macromolecule.
In situ: Literally means ‘in place’, that is, exactly where it occurs.
In vitro: Literally means ‘in glass’, for example in a test tube or dish,outside a living organism or cell.
In vivo: Literally means ‘in life’, that is, inside a living organism or cell.
Isocratic: A chromatographic mobile phase of constant composition.
Isoelectric point (pI): The pH value when a molecule carries no netcharge. The molecule will not move under the influence of an electricalfield or bind to anion exchange resin.
Isoenzymes (isozymes): Two or more forms of an enzyme that catalyzethe same reaction but differ from each other in their physical properties,such as amino acid sequence, substrate affinity, Vmax, tissue expression orregulatory properties.
I.U.: International units of enzyme activity defined as 1 µmol of productformed (or substrate consumed) min–1 at a given temperature (usually25°C).
Ka: The equilibrium constant (association/dissociation constant).
Katal: S.I. unit of enzyme activity defined as 1 mol of product formed (orsubstrate consumed) s–1 at a given temperature (usually 25°C).
Kav: The effective dissociation constant (Kd) in size exclusion chromato-graphy.
Kd: The partition coefficient is a measure of the distribution of acompound between two immiscible phases.
Km: The Michaelis–Menten constant, which is the substrate concentrationwhich produces half the maximum rate in an enzyme catalyzed reaction.
Lectins: Naturally produced proteins or glycoproteins (mainly from plants)that can bind with carbohydrates or sugars to form stable complexes.
Leupeptin: An inhibitor of some proteolytic enzymes (serine like andsome sulfhydryl proteinases). (See Chapter 2.)
Glossary 179
Ligand: A molecule that binds to a specific site on a protein.
Lipopolysaccharide: A molecule comprising both lipid and sugar residues.
Lyotropic salts: The opposite of chaotropic salts, in that they increase thestructure of water and increase the ‘salting out’ of proteins.
Lysosomes: Organelles containing many digestive hydrolases present inanimal cells.
Lysozyme: An enzyme that catalyzes the hydrolysis of the β-1,4-glycosidicbonds. It can be used to break down the peptidoglycan complex surround-ing Gram-positive bacteria.
Microfuge: A benchtop centrifuge used to centrifuge small-volumesamples contained in microfuge tubes.
Microfuge tube (Eppendorf tube): Small, cylindrical plastic containerswith a conical bottom and a ‘snap shut’ lid. Different sized tubes are avail-able for use in a microfuge.
Mitochondria: Organelles present in most eukaryotic cells; their primaryfunction is to convert organic materials into energy in the form of ATPvia the process of oxidative phosphorylation.
Mole (mol): 1 mol of any compound is the molecular weight in gramsand this contains 6.023 × 10²³ molecules (Avogadro’s number).
Molar: 1 mol of a compound dissolved in 1 l (1000 ml) of water.
Molar absorption (absorptivity) coefficient (ε) (also known as the molarabsorbance coefficient or, incorrectly, as the molar extinction coefficient):The absorbance of a molar solution of a compound in a 1 cm path lengthof light at a given wavelength. The units are (M–1 cm–1) of a compound ata given wavelength. The molar absorption coefficient for manycompounds can be found in reference books. For proteins, molar concen-trations are not always appropriate and in this case a 1% (w/v) absorptionat a given wavelength is quoted (e.g. ε1% at 280 nm for bovine serumalbumin = 6.67).
Monoclonal antibody: Antibodies raised to a protein specific for one partof the protein.
Mr = The molecular mass of a compound relative to the molecular weightof hydrogen (i.e. 1).
Native (conformation of proteins): Proteins are polymers of amino acidswhich eventually fold to form a compact three-dimensional structure. Theshape may alter depending on the pH but at the protein’s normal residentpH value the shape can be assumed to be its native conformation.
Nitrocellulose membrane: A form of cellulose membrane which effec-tively irreversibly binds proteins used in western blotting.
N-linked saccharides: Sugar residues attached to the amino acid argininein a glycoprotein.
Nomogram: A two-dimensional graphical calculating device which usually
180 Protein purification

has three scales: two scales represent known values and the final scale iswhere the answer is read from.
Nucleus: A eukaryotic membrane-bound organelle which contains themajority of the cell’s genetic material.
O-linked saccharide: Sugar residues attached to the amino acids serine orthreonine in a glycoprotein.
Particulate: Small, insoluble material which can block the pores (andspaces around the pores) of chromatographic resins, resulting in anincrease in back pressure. They can be removed using a 0.2 µm membranefilter or by centrifugation at 13000 g for 20 min.
Pepstatin: An inhibitor of some proteolytic enzymes (acidic proteinases).
Peptidase: Enzymes that degrade proteins by cleaving amino acids fromeither the N- or the C-terminus of a protein.
Peptidoglycan: A carbohydrate polymer cross-linked by proteins. Crystalviolet stains the peptidoglycan of the cell wall of Gram-positive bacteria.
Peroxisomes: Present in all eukaryotic cells; its role is to remove toxicsubstances from the cell.
pH: The negative log10 of the activity of hydrogen ions in solution, thatis, pH= –log10 (αH
+) which is a measure of acidity. In dilute solutions theactivity of hydrogen ions approximates to the molar concentration (moll–1) of hydrogen ions in solution, that is, pH = –log10 [H+]:
[H+] = 10–3 M (pH 3.0)
[H+] = 10–7 M (pH 7.0)
Note: The logarithmic changes in acidity ([H+]) are converted into a linearpH scale.
Phosphoproteome: The complete set of phosphoproteins present withina cell.
Phosphorylation: The addition of a phosphate monoester to a macro-molecule, catalyzed by a specific enzyme (kinase). Proteins can bephosphorylated on the amino acid side chains of serine, threonine andtyrosine (in addition histidine may also be phosphorylated in both eukary-otic and prokaryotic cells). Phosphorylation can alter the conformation ofa protein, resulting in modulation of the protein’s activity.
pI: The isoelectric point is the point on a pH scale where the positivecharges on a molecule are balanced by the negative charges, resulting inno overall net charge. At a molecule’s pI it will not move under the influ-ence of an electrical field and will not bind to an ion exchange resin.
pKa: The negative log10 of the equilibrium constant (Ka), that is, pKa =–log10 Ka. It is a value where the acidic and basic forms are in equal concen-tration.
Plasma membrane: A phospholipid and protein bilayer approximately 6nm thick which surrounds the cell, separating the cellular componentsfrom the extracellular environment.
Glossary 181

Polyclonal antibodies: Antibodies raised to a protein in an animal result-ing in many different IgG molecules being produced against different partsof the protein.
Polysaccharide: A chain of many saccharide units covalently linkedtogether to form a polymer.
Potter–Elvehjem homogenizer: A homogenizer with a glass mortar anda teflon pestle which can be rotated by hand or machine.
Prokaryotes: Unicellular organisms which do not have a membrane-enclosed nucleus or organelles (e.g. bacteria).
Protein A: A protein (Mr 42000) found naturally in the cell wall ofStaphylococcus aureus which binds to the Fc domain of immunoglobulins.The interaction is species and immunoglobulin dependent.
Protein G: A protein (Mr 30000–35000) found naturally in the cell wallof β-hemolytic Streptococci C or G strains, which binds to the Fc region ofimmunoglobulins. Antibodies from different species which do not bindwell to protein A may bind to protein G.
Proteinases: Enzymes which degrade proteins by cleaving internal peptidebonds.
Proteolytic profile: The number of different classes of proteinases andpeptidases in an extract.
Proteome: The complete set of proteins encoded by the genome.
Radian: 1 radian is the angle subtended at the center of a circle by an arcwith an equal length to the radius of the circle. One revolution of acentrifuge rotor is equivalent to 360° = 2π radians.
Reducing agents: A substance that chemically reduces other substances,especially by donating an electron or electrons.
Rf: The mobility of the standards/samples relative to the dye front (a valuebetween 0 and 1.0).
Resolving gel: A polyacrylamide gel (typically 7.5, 10 or 12% acrylamide)used to separate a complex protein mixture.
Ribosomes: A large complex of proteins and nucleic acids that functionsto manufacture proteins from genetic material.
RNase: An enzyme that degrades RNA. There are many different forms ofRNase (ribonuclease) and they are extremely stable.
Saccharide: A carbohydrate.
Salt bridge (salt bond, ionic bond): Formed as a result of the attractiveforce between two oppositely charged side chains in a protein’s structure.Although relatively weak, they contribute to the stability of a protein’stertiary structure.
Salting in (of proteins): Most proteins show increased solubility at lowsalt (ionic) concentrations.
182 Protein purification

Salting out (of proteins): A method of separating proteins of differentialsolubility in high salt (ionic) concentrations. The salt concentrationneeded for a protein to precipitate out of the solution differs from proteinto protein.
Sephacryl: A trade name (GE Healthcare) for covalently cross-linked allyldextrose gel formed into beads used for protein purification.
Sephadex: A trade name (GE Healthcare) for cross-linked dextran gelformed into beads used in protein purification.
Sepharose: A trade name (GE Healthcare) for agarose beads (chargedpolysaccharides removed) used in protein purification.
Silanizing: Conversion of active silanol (Si–OH) groups on the surface ofglass into the less polar silyl ethers (Si–O–R) groups. This makes the glasssurface less adhesive to proteins.
Slurry: A liquid and resin mixture which flows freely.
Sonication: A method of disrupting biological material by the energy insound waves.
Stacking gel: A polyacrylamide gel (typically 3–5% acrylamide) which islayered over the resolving gel. In combination with discontinuous buffersthe stacking gel concentrates the sample before it enters the resolving gel.
Sublimation: Sublimation of an element or substance is the conversionfrom the solid phase to the gas phase without entering the liquid phase.
Substrate: A molecule that an enzyme binds and acts upon.
Theoretical plates (in chromatography): The height of the theoreticalplate is the length of column in which the equivalent to a single equilib-rium separation takes place. The separating power of a chromatographycolumn can be given by the number of theoretical plates.
Thiol: A compound containing a functional group composed of a sulfuratom and a hydrogen atom (–SH).
Transmittance (of light) (T): A ratio of the intensity of the incident light(I0) to the intensity of the transmitted light (I) (T = I/I0). A partially trans-parent absorbing substance will allow some of the light that strikes it (I0)to pass through (I). A transparent substance has 100% T (no light absorbedby the substance) and an opaque substance has 0% T (all the lightabsorbed).
van der Waals: A weak intermolecular force arising from the polarizationof molecules into dipoles.
Viscosity: A measure of the resistance of a fluid to deform under stress. Itcan be thought of a measure of how easy it is to pour a liquid; for example,water possesses a lower viscosity than vegetable oil.
Vmax: The maximum rate of an enzyme-catalyzed reaction.
Zwitterion: A molecule with both acidic and basic residues, for exampleamino acids.
Glossary 183

Index
Absorbance (of light), 14, 17, 29,30, 61, 67
coefficients, 21–22Acid (and bases), 25, 81
washed sand, 36Acrylamide (see also
Polyacrylamide), 81, 116,123, 125, 137–141, 151–153
dried, 51Activity
aspartate kinase, 21assay, 10 biological, 1, 18, 25, 47–48, 75,
79, 88, 95, 130, 144 cofactor requirement, 31–32effect of buffers, 3, 14, 24, 33loss of, 2, 31, 50–51, 86, 88,
101–102, 108, 122, 149phenol oxidase, 33–34pooled fractions, 18proteolytic, 2–3, 32–33, 37, 109specific, 10, 18–19, 21–23,
28–29, 84–85, 95 stored material, 58total, 10, 19, 21–23, 29, 95
Adenosine monophosphate (AMP),161
Adenosine triphosphate (ATP),101
ATPase, 44bis, 114
Additionsmembrane proteins, 34plant tissue, 33–34
Adsorption (see alsoChromatography), 56, 57,92, 107
Affinitychromatography, 97–98cyanogen bromide activation,
99–100dye ligand, 105–106immuno, 108–109lectin, 109–112ligand, 99–100membranes, 58partitioning (Precipitation), 7,
9, 10, 116–117pseudo, 91, 92spacer (s), 91, 98–100, 106,
114, 117
Agarose, 6, 56, 81, 86, 97, 105,106, 108, 119, 121, 123, 125,126, 144, 146, 148
Ammoniumbicarbonate, 52carbonate, 52chloride, 107hydroxide, 86ions, 30lyotropic, 52persulfate, 139, 151–152protein precipitation, 9–10, 19,
47–50, 58–59, 62, 71–76,88–90, 94
quaternary, 81Ampholytes, 146–147Analytical
isoelectric focusing (IEF),146–147
size exclusion chromatography(SEC), 127
Animal cellsdisruption, 36–39
Animal tissuedisruption, 39–40
Anion exchange chromatography(see Ion exchangechromatography)
Assay(s)bicinchoninic acid (BCA), 30,
31, 63–66pH, 28protein, 29–31substrate concentration, 28–29temperature, 27–28
Antibodymonoclonal, 2, 109, 116, 145polyclonal, 145
Aqueous phase two phasepartitioning, 45–47, 51
Attenuance (of light), 62ATP (see Adenosine triphosphate)Azocasien, 69–70
Bacteria, 3, 27, 28, 36, 39, 52, 58,69, 128
extraction methods, 40–41Bactericide, 16, 84, 112, 119, 157Balance sheet (see Purification)Ballotini beads, 37, 40BCA (see Bicinchoninic acid)
Bedexpanded, 56–57fluidized, 56stirred, 56
Beer Lamberts Law, 22, 29Bicinchoninic acid (BCA) (see also
Assays), 30, 31, 63–66BICINE, 26Binding (proteins to)
affinity, 99–102, 116chromatofocusing, 85covalent chromatography,
103–104detergent, 34dye binding protein assay,
30–31, 47–48dye ligand chromatography,
105–106immobilized metal affinity
chromatography (IMAC),106–107
immunoaffinitychromatography, 108–109
ion exchange chromatography(IEX), 51, 81–84
irreversible, 4hydrophobic charge induction
chromatography (HCIC),91–92
hydrophobic interactionchromatography (HIC), 51,88–90
hydroxyapatite, 86–87lectin affinity chromatography,
97, 109–112ligands, 144membranes, 56mixed mode chromatography
(MMC), 92no binding to size exclusion
chromatography (SEC), 121recombinant proteins, 112–115resin, 54, 94–95storage container, 58western blotting, 144–146,
156–157Biogel, 94, 128bis
acrylamide, 139–140, 151affinity ligands, 116–117tris propane, 26, 94

Bradford assay, 59Brønsted (see Buffers)Bovine serum albumin (BSA), 3,
29, 42–45, 81, 145–146,154–155
Buffer (s)Brønsted, 25Exchange (see also Desalting),
84, 89–90, 104, 128Henderson–Hasselbach
equation, 26pKa, 26–27points to remember, 27volatile, 52, 126, 149
Calcium phosphate (seeHydroxyapatite)
Calmodulin, 87, 88, 101Capillary electrophoresis, 147–149CAPS, 26Cation exchange chromatography
(see Ion exchangechromatography)
Cell(s)animal, 36–37, 39bacteria, 36, 40–44debris (removal of), 21, 44, 46,
57fungal, 36lysis, 113–115plant, 36, 39
Centrifugationacrylamide fragmentation, 130,
133cell harvesting, 21, 38–40clarification, 21, 28, 34, 41–45,
56, 62, 71–73, 82, 89, 94,114
collection of proteinprecipitate, 31, 48, 50–51,71, 73–76, 117
density gradient, 45equilibrium density gradient,
46inclusion body collection, 113removal of bactericide, 119removal of lipoproteins, 33removal of nucleic acids, 33
Cetyl trimethylammoniumbromide (CTAB), 35
Chaotropic, 7, 9, 48, 109, 123, 128CHAPS, 35CHAPSO, 35Chelating agents (see also EDTA
and DIECA), 4, 21, 31,33–34, 41, 107, 111
Chromatofocusing, 7, 9, 10,84–86
Chromatographyaffinity, 97–98chromatofocusing, 84–86
columns, 12–13, 101–103covalent, 7, 10, 103–105dye ligand, 10, 105–106expanded bed, 56hydrophobic charge induction
(HCIC), 91–92, 108hydrophobic interaction (HIC),
7, 51, 87–91immobilized metal affinity
(IMAC), 106–107immunoaffinity, 7, 9, 10, 97,
108–109ion exchange (IEX), 7, 8, 19,
34, 51, 56, 58, 79–84, 93lectin, 10, 35, 97, 101, 103,
109–112membrane, 57–58mixed mode (MMC), 92–93reversed phase (RP-HPLC), 7,
11, 18, 58, 88, 137, 149sample application, 55, 57, 141,
159size exclusion (SEC), 7, 12, 19,
34, 75, 86, 89, 94, 97,101, 107, 113, 117,121–128
theory, 11Cibacron blue, 101, 105, 116Clarification (of homogenates)
aqueous two phasepartitioning, 45–47, 51
centrifugation, 41–45expanded bed, 56–57ultrafiltration, 7, 47, 52–55
Clathrate, 47–48, 88–90Cofactors, 1, 27, 32, 58, 101–102,
105, 149Columns (see also Equipment)
assembly, 16–17Compression (and expansion), 37,
40–41Concanavalin A, 110–111, 116Concentration
molar, 26protein, 3–4, 9, 11, 14, 18–19,
21–22, 28–29, 33, 48, 50,61, 63–65, 67, 70, 75, 95,101, 106, 126
salt, 6, 14, 16, 34, 48, 77,81–83, 88–92, 95, 111,125
substrate, 28–29, 101, 102, 117
Concentrate (proteins), 47–55Constant
dielectric, 50equilibrium (Ka), 5, 99Michealis–Menten (Km), 2
Coomassie bluepolyacrylamide gel stain, 18,
142, 146, 153protein assay, 30–31, 67
Coordinate (dative) bonds, 86,106–107
Covalent bonds, 4, 7, 10, 103, 106,108, 141
Critical micellar concentration(CMC), 34–35
CTAB (see Cetyltrimethylammoniumbromide)
Cyanogen bromide, 99–100, 113
Dative bonding (see Coordinatebonding)
DEAE (see Diethylaminoethyl)Denaturing
agents, 107electrophoresis, 7, 18, 129,
137–138, 141–143Desalting (see also Size exclusion
chromatography)proteins, 84, 89–90, 104, 128
Detector(s) (see also Monitors),109, 129, 148
fluorescence, 149UV, 12,149
Detergent(s), 30–31, 34–37, 41,109–110, 112–113, 131
non-ionic, 4, 91, 108–109SDS (see also Sodium dodecyl
sulfate), 7, 18, 109, 111,128, 131, 137, 141–143
Dialysis, 10, 51, 58 ,74–75, 77–78,84, 86, 89–90,101–102, 107,128–130
DIECA, 33, 71Dielectric constant, 50Diethylaminoethyl, 8, 81Diethyldithiocarbamate (see
DIECA)Dilution
effect of SEC, 11, 19, 122, 128reversal (concentration of
protein), 4, 6, 8, 47–55,81–82, 89
stock solutions, 27Dissociation
acid, 25affinity, 99equilibrium, 25, 99
Distribution coefficient (seePartition coefficient)
Dithiothreitol (DTT), 21, 31, 104Douce (see also Homogenizers),
36–38DTT (see also Dithiothreitol), 21, 31,
33, 71, 73–74, 104–105, 112Dye ligand chromatography, 10,
105–106
E64 (see also Proteolyticinhibitors), 21, 32, 71
186 Index

ECL (see Enhancedchemiluminescence)
E.coli (see also Escherichia coli),112–113
EDTA, 4, 21, 27, 31–32, 34, 41,50, 71, 73–74, 77, 101, 103,107, 111, 155
Electroblotting (see Westernblotting)
Electroelution, 10, 130–131Electroendosmotic, 148Electrophoresis
PAGE, 139–144preparative IEF, 7, 9–10, 131preparative PAGE, 9–10,
128–130theory, 138–139
Elution, 17, 25, 57, 79, 87, 94,99, 105, 111–112, 129
co-elution, 3electro, 130gradient, 14–15harsh, 8, 19, 99, 108isocratic, 14volume (Ve), 123, 124, 127
Elution (from chromatographyresins)
affinity, 100–102covalent, 103–105hydrophobic charge induction
chromatography (HCIC),92
hydrophobic interactionchromatography (HIC),88–91
ion exchange chromatography(IEX), 81–84
immobilized metal ion affinitychromatography (IMAC),107
immuno affinitychromatography,108–109,119
lectin affinity chromatography,111
mixed mode chromatography(MMC), 93
Empirical, 2, 10, 28, 34, 41, 47,52, 58, 84, 92, 107
Endoproteases (see Proteinase; seealso Proteolytic inhibitors)
Enhanced chemiluminescence(ECL), 146, 157–158
Enzymeassay, 18, 27–28, 74inhibitors (activators/cofactors),
2, 3, 16, 19, 21, 32–33,35, 41, 44, 47, 58, 70–71,73, 98, 101–102, 149
treatment, 33, 37, 40–41, 115units, 19–23, 29
Equilibrium constant (seeDissociation constant)
Equipmentcolumns, 12–13fraction collector, 14gradient maker, 14–15monitors, 14PAGE, 141pumps, 14tubing, 13
Escherichia coli, 112, 128Ethylenediaminetetraacetic acid
(see EDTA)Expanded bed chromatography,
56–57Extraction
animal cells and tissue (largeamounts), 39–40
animal cells and tissue (smallamounts), 37–39
bacterial (fungal), 40–41membrane proteins, 34–35plants, 33–34
Eukaryotic, 2, 9, 32, 41, 43–44,109, 112–113, 128, 131
Exopeptidase (see also Peptidase),32
Flowadaptors, 12–13, 16charts, 10, 44, 83diagrams, 10, 44, 84, 90, 102,
125rates, 13–14, 16–17, 54, 86,
101–102, 104, 108,125–126
tangential, 54–56, 129Fines, 16, 86 ,94, 127 Filtration, 34, 127
buffers, 82gel (see SEC)membrane, 114proteins (see Ultrafiltration)sintered glass, 119
Folin-Ciocalteau assay, 30Fractionation
cells, 44glycoprotein(s), 110–111protein, 6, 8, 48, 50, 58, 123,
131, 137, 140–141resin range (SEC), 122–124, 126
Fractionsammonium sulfate, 74–75, 89chromatographic, 3, 10, 13–14,
17, 19, 23, 25, 28, 45, 85,95, 128, 130, 144–145,149
collectors, 12, 14, 101–102,108–109, 119, 122, 129,149
eluted, 18, 101membrane, 71–73
unbound, 17, 86, 97, 102, 111Free radical, 139Freeze drying (see Lyophilization)Freezing (thawing), 37, 40–41Fungal (see Cells)Fungicide, 16, 119
Gel filtration chromatography (seeSize exclusionchromatography)
Gel permeation chromatography(see Size exclusionchromatography)
Genome, 1,7Glutathione, 6, 31, 112,114Glutathione-S-transferase, 6, 112,
114Glycerol, 59, 141, 152, 155Glycoprotein, 27, 35, 97,
100–101, 109–112Glycosylation, 7, 113, 143GPI linked saccharides (see
Saccharides)Gradient (s)
ethanediol, 91isocratic, 14, 81–82, 89, 92, 111makers (formers), 14–15, 82–83pH, 83, 85–86, 146–147phosphate, 86–87saccharide, 111salt, 83–84, 87, 112
HCIC (see Hydrophobic chargeinduction chromatography)
Henderson–Hasselbach equation(see Buffers)
HEPES, 26His tag (6), 10, 113–114Hofmeister series, 48Homogenizers
Douce, 38Potter–Elvehjem, 38Waring, 39Ultraturex/Polytron, 39–40
HPLC (see Reversed phasechromatography)
Hydrodynamic volume, 123, 137,143–144
Hydrogen bonding, 5, 27, 141Hydrophilic, 5–6, 87, 89, 99, 137Hydrophobic, 4–8, 27, 34, 46–48,
51, 86–87, 93, 97, 99, 101,105, 108, 111, 125–127, 137,141–142, 149
Hydrophobic charge inductionchromatography (HCIC),91–92, 108
Hydrophobic interactionchromatography (HIC), 7, 51,86–91
Hygroscopic, 50–51
Index 187

Hydrostatic pressure, 14Hydroxyapatite chromatography,
7, 10–11, 31, 86–87
IEX (see Ion exchangechromatography)
IEF (see Isoelectric focusing)IMAC (see Immobilized metal
affinity chromatography)Imidazole, 106–107, 112, 114Iminodiacetate, 106Immobilized metal (ion) affinity
chromatography (IMAC)chromatography, 7,9–10, 56,
106–107, 112–113recombinant proteins,
113–114Immunoaffinity chromatography,
7, 9–10, 97, 108–109Immunoglobulin
IgA, 110IgG, 6, 58, 91–93, 97, 108–110,
112, 114, 116, 119, 145IgM, 110
Inclusion bodies (see Recombinantproteins)
Ion exchange anion, 8, 19, 81, 84–85binding and eluting from,
81–84cation, 81–84, 93chromatography (IEX), 7, 34,
51, 56, 79–81, 84membranes, 58regeneration and storage, 84resins, 81
Isocratic, 14, 81–82, 89, 92, 111Isoelectric point (see also pI), 5, 51,
79, 80, 82–87, 89, 93, 100,107, 131, 139 146,147
Isoelectric focusing (IEF), 7, 18,84, 137, 146–147
preparative, 131
Ka (see Dissociation constant)Kav, 123, 127, 134Kd (see Distribution coefficient)Kinase, 101
aspartate, 21enterokinase, 113phosphofructo, 116
Km (see Michaels–Mentenconstant)
KSCN (see Thiocyanate)
Lactate, 82Lactate dehydrogenase (LDH), 116Lectin(s), 97, 101, 110–111
affinity chromatography, 10,35, 103, 109–112
Leupeptin, 21, 32, 71, 73
Ligands, 47, 102, 106, 112,115–117, 144
affinity, 8, 98–101, 103,115–117
dye, 105–106group specific, 100–102heterobifunctional, 116–117hydrophobic, 88, 91immobilized, 98protein, 103, 109–110substrate, 97
Lowry assay, 30Lubrol PX, 35Lyophilization (freeze drying), 52,
104, 126Lyotropic, 48, 52, 58, 91Lysosomes, 2, 9, 32, 44, 80Lysozyme, 37, 40–41
2-ME (see 2-Mercaptoethanol)2-Mercaptoethanol (2-ME),
31,104,137,141Mass spectrometry, 1,154MBI (see Mercapto-benzimidazole
sulfonic acid)Membrane(s)
cell, 97,109chromatography, 57–58, 81endo, 111glycoproteins, 110–111hollow fibre, 56mixed, 71, 73nitrocellulose, 130–131,
145–146, 156–158pellet, 72proteins (extraction from),
34–41, 43–45, 51re-suspension buffer, 71–72semipermeable (dialysis), 77,
130ultrafiltration, 52–55, 116
Mercapto-benzimidazole sulfonicacid (MBI), 92
MES, 26, 71, 82Michaels–Menten constant (Km),
2, 28–29 Mitochondria, 9, 38, 44Mixed mode chromatography
(MMC), 92–93, 108MMC (see Mixed mode
chromatography)Mobile phase, 11, 13–14, 16, 81–82,
97, 99, 121, 123, 127, 149Molar
absorptivity coefficient, 21–22concentration, 26
Molecular weight cut off(MWCO), 47, 52–54
Monitors (see also Detector), 14Monoclonal antibody (see also
Antibody), 2, 109, 116, 145
MOPSO, 26Mr (see Relative molecular mass)MWCO (see Molecular weight cut
off)
N-linked saccharide (seeSaccharides)
NAD+, 101,105,116NADP+, 44, 101NaSCN (see Thiocyanate)Native
conformation (of proteins),122, 127, 131, 149
nondenatured PAGE, 143–144proteins, 114
Nicotinamide adeninedinucleotide (oxidized) (seeNAD+)
Nicotinamide adeninedinucleotide phosphate(oxidized) (see NADP+)
Nitrilotriacetate (NTA), 106Nitrogen
amide, 58,144electron rich, 106–107gas, 40, 53liquid, 21, 37, 41, 58
Nitrocellulose, 130–131, 145–146,156–158
Nondenatured (see Native)Nonidet, 35, 131Nomogram, 42NTA (see Nitrilotriacetate)Nucleic acids, 30, 33, 61, 79, 97,
121Nucleoproteins, 33Nucleotides, 30, 62, 79, 105Nucleus, 38, 44
O-linked saccharides (seeSaccharides)
Organelle, 2, 32, 34, 41, 43–44, 80
PAGE (see Polyacrylamide gelelectrophoresis)
Particulates (removal), 27, 46, 56,62
Partition coefficient, 11, 123PEG (see Polyethylene glycol)Peptidase, 32, 85, 113Peptide(s), 62, 79, 100, 113, 149
azo, 69flag peptide, 112glycopeptide, 111peptide bond, 30, 32polypeptide(s), 1, 5, 18, 69, 113,
129, 137, 141–145, 154thiol peptide, 103
Peroxisome, 44pH (see also Buffers)
instability, 3–4
188 Index

Phenols, 33–34, 71bromophenol, 128, 141, 152,
159Phenyl
phenylmethylsulfonyl fluoride(PMSF), 32
phenylpropylamine, 93phenyl sepharose, 90–91
PhosphoPhosphorylation (ated),
7,106,143,147Phsphorylase, 160
pI (see Isoelectric point)PIPES, 26Pisum sativum, 72pKa (see Equilibrium constant; see
also Buffers)Plasma membrane, 36, 40, 44, 109PMSF (see Phenylmethylsulfonyl
fluoride)Points to remember
ammonium sulfate, 50buffers, 27extraction procedures, 41
Polyacrylamide gel electrophoresis(PAGE) (see Electrophoresis)
2-dimensional, 1denaturing, 137, 141–142electroelution, 130nondenaturing, 7, 143–144preparative, 128–130SDS, 7, 10, 18, 135, 137,
141–143, 147–148,159–160
Polyclonal antibody (see Antibody)Polyethylene glycol
aqueous two phase, 45–47concentration of proteins,
50–51hygroscopic, 51precipitation, 9, 50–51
Polyethyleneimine, 33Polymer, 45–46, 106, 117, 121,
123–124, 138–139copolymer, 116
Polysaccharide, 36lipo, 36,41
Polyvinylpolypyrrolidone (PVPP),34
Potter–Elvehjem homogenizer, 36,38, 72, 73
Process scale extractionclarification, 56–57
Precipitation (of proteins)ammonium sulfate, 9–10, 19,
47–50, 94isoelectric, 51organic solvent, 50polymer, 9, 50–51salt, 47–50
Protease inhibitorsE64, 21, 32, 71
EDTA, 21, 27, 31–32, 34, 41,50, 71, 73–74, 77, 101,103, 107, 111, 155
leupeptin, 21, 32, 71, 73pepstatin, 21, 32, 71, 73PMSF (see Phenylmethylsulfonyl
fluoride)Protein A, 10, 58, 91, 93, 101,
108, 112, 116Protein G, 10, 91, 93, 101, 108Proteins
assay, 18, 25, 29–31, 34, 47,58, 61–68, 73–74, 84, 89
biospecificity, 6–8, 97, 127concentration from dilute
solutions, 47–55fold purity, 18–20, 95fusion, 10, 112–115hydrophobicity, 5–8,127,149molecular mass, 1–2, 6–7, 101,
122–123, 130, 134, 137,143, 146, 159
post-translational, 1–2, 6–7,113, 143
purity, 2, 10, 18–20, 102, 125,128, 130, 137, 144,148–149
recombinant, 8, 10, 112–115,128
refolding, 50, 102, 113–114,128
solubility, 6, 34, 47–51, 88, 131storage of, 16, 25–26, 52, 58–59surface charge, 5–8, 79–80,
82–83, 129, 137, 139, 141,143
temperature stability, 3yield, 2–3, 8–11, 18–20, 38, 54,
102, 113Proteinase(s), 3, 32–33, 69Proteome, 1, 113
phospho, 104Prokaryotes, 112–113,128Pumps (see Equipment)Purification (protein)
balance sheet, 18–20PVPP (see
Polyvinylpolypyrrolidone)
RCF (see Relative centrifugal force)Recombinant proteins, 8, 10
inclusion bodies, 113,128purification, 112–115refolding, 128
Reducing agents, 9, 21, 31, 33,58–59, 104, 137, 141
Relative centrifugal force (RCF),41–45
Relative mobility (Rf), 143,159–160
Relative molecular mass (Mr), 123,129, 137
Resinbead size, 9–10, 125–126flow rate, 13–14, 16–17, 54, 86,
101–102, 104, 108,125–126
pre-equilibration, 16preparation and storage (SEC),
127regeneration and storage
(affinity), 102regeneration and storage
(covalent), 105 regeneration and storage
(general), 18regeneration and storage (HIC),
91regeneration and storage (IEX),
84regeneration and storage
(IMAC), 107regeneration and storage
(lectin), 112Resolving gel, 129, 140–141,
151–152Reversed phase high pressure
liquid chromatography (RP-HPLC), 7, 11, 18, 58, 88,137, 149
Rf (see Relative mobility)RP-HPLC (see Reversed phase high
pressure liquidchromatography)
SaccharidesGPI linked, 111N-linked, 111O-linked, 110–111
Saltaqueous two phase
partitioning, 47buffers, 26concentration, 6, 14–16, 26, 34,
45, 81–84, 88–92, 94–95,106, 109, 111–112,125–127
desalting, 128dialysis, 77insoluble, 107precipitation, 9, 47–50, 75–76,
86, 112salt bridge, 5, 141‘Salting in’ (see also Chaotropic),
6, 109, 123, 128‘Salting out’ (see also Lyotropic),
6, 52, 58, 91Sample
application, 12–13, 17, 81–83,102, 109, 111, 119,121–122, 125, 127, 129
buffer, 82, 84, 86, 126–127, 152capillary electrophoresis (CE),
147–149
Index 189

Sample – continuedclarification, 41–47, 56–57concentration, 47–55dilution, 8, 11, 82electrophoresis, 129–130, 135,
137–138, 140–142, 146,152
elution, 17, 19, 123–124extraction, 37–41fractionation, 123–124, 140homogenization, 38–41IEF, 146–147interactions, 126loop, 12–13pH, 84protein assay, 29–30reversed phase, 149salt removal (see also Dialysis
and SEC), 84, 86, 89–90,109, 128
size, 126storage, 25viscosity, 126wells, 140, 152
SDS, 7, 10, 16, 18, 31, 35, 102,109, 112, 128, 130–131, 135,137, 141–144, 147–148,151–152, 156, 159–160
SDS-PAGE (see Polyacrylamide gelelectrophoresis)
SEC (see Size exclusionchromatography)
Seed proteins (see Storageproteins)
Semi-dry blotting (see Westernblotting)
Sephacryl, 123–125Sephadex, 51, 94, 97, 123, 128Sepharose, 6, 97–98, 103–106, 123Silver staining, 18, 138, 142, 154Size exclusion chromatography
(SEC)aggregate removal, 127–128analytical, 127desalting (buffer exchange), 84,
89–90, 104, 128protein refolding, 128
Slurry (chromatographic resins),16, 94, 125
Sodium dodecyl sulfate (see SDS)Solvent(s), 34, 36, 88, 109
protein concentration, 50–51reversed phase
chromatography, 149Sonication, 16, 21–22, 33, 36, 38,
41Spacers (see Affinity ligand)Stacking gel, 129, 151–153Stationary phase, 11, 13–14,
81–82, 97, 103, 149Stirred cells (see Ultrafiltration)
Storage proteins, 143–144Storage of
affinity resins, 102covalent chromatography
resins, 105hydrophobic interaction
chromatography (HIC)resins, 91
immobilized metal affinitychromatography (IMAC)resins, 107
ion exchange chromatography(IEX) resins, 84
lectin resins, 112PAGE gels, 155proteins, 16, 25–26, 52, 58–59sample, 25size exclusion chromatography
(SEC) resins, 127Strategy (protein purification), 7–9Subcellular fractionation, 44Sublimation, 52Substrate
concentration, 28–29Subunits
enzyme, 117glycoproteins, 111
Superdex, 123Superose, 123Syringe(s) 13, 128
N,N,N’,N’,–tetramethylethylenediamine(see TEMED)
TCA (see Trichloroacetic acid)TCE (see Trichloroethanol acid)TEMED, 139, 151–152Temperature
affinity partitioning, 116–117binding to hydrophobic resins,
89–90buffers, 27, 82, 96, 105column packing, 17critical micelle concentration, 34enzyme rate of reaction, 27–28enzyme units, 29preparative PAGE, 117protein assay, 30protein instability, 3, 96protein solubility, 6, 47protein storage, 58–59ultrafiltration, 52western blotting, 157–158
Theorychromatography, 11electrophoresis, 138–139
Thiocyanatesodium (NaSCN), 109potassium (KSCN), 101–102, 109
Thiophilic chromatography (seeCovalent chromatography)
Tissueanimal, 36–41, 73–74fatty, 36grinders, 36, 38plant, 33–34, 36–37,
39–41,71–72Trans-epoxy succinyl-L-
leuculamido-(4-guanidino)butane (see E64)
Tricine, 26Tris, 21, 26–27, 30, 71, 73–74, 82,
84, 90, 94, 96, 101, 103,107–108, 119, 125, 140–141,151, 156–157
Triton X100, 4, 35, 90–91, 108, 131Tween, 35, 91, 108, 131, 156–157Triazine dyes, 105Trichloroacetic acid (TCA), 69Trichloroethanol (TCE), 142Tubing (see Equipment)Two-dimensional gel
electrophoresis (2D-PAGE), 1
Ultrafiltrationcentrifugal, 53–54hollow fibres, 54, 56, 57static devices, 54stirred cells, 52–53tangential flow, 54–55
Ultrapurereagents, 4, 58, 61, 64, 66, 68,
72, 74, 76–77, 96, 153,155, 158
water, 4, 154–155Ultraviolet (UV), 14Ultrasonication, 33, 37, 39, 41Ultraturax, 36–37, 39, 40–41Units
enzyme, 19–23international, 29, 39
van der Waal interactions (forces),5, 27, 46, 141
Ve, 122–124, 127, 134Vicia faba, 144Viscosity (see also Sample), 33, 52,
56, 59, 126, 138Visking tubing (see also Dialysis),
77Vmax, 28–29V0, 122–124, 127, 134Volatile (see also Buffers), 28–29,
126, 149Vt, 122–124, 127, 134
Western blotting, 144–146
Yeast (see also Cell lysis), 36–37,40–41, 112
Zwitterionic, 35, 79, 92
190 Index


