Embed Size (px)
Citation preview

Chemistry & Biology
Article
Protein Kinase D Inhibitors UncouplePhosphorylation from Activity by PromotingAgonist-Dependent Activation Loop PhosphorylationMaya T. Kunkel1 and Alexandra C. Newton1,*1Department of Pharmacology, University of California, San Diego, La Jolla, CA, 92093, USA
*Correspondence: [email protected]
http://dx.doi.org/10.1016/j.chembiol.2014.11.014
SUMMARY
Protein kinase D (PKD) is acutely activated bytwo tightly coupled events: binding to the secondmessenger diacylglycerol (DAG) followed by novelprotein kinase C (nPKC) phosphorylation at theactivation loop and autophosphorylation at the Cterminus. Thus, phosphorylation serves as a widelyaccepted measure of PKD activity. Here we showthat treatment of cells with PKD inhibitors paradox-ically promotes agonist-dependent activation loopphosphorylation, thus uncoupling phosphorylationfrom activation. This inhibitor-induced enhance-ment of phosphorylation differs mechanisticallyfrom that previously reported for PKC and Akt, forwhich active-site inhibitors stabilize a phospha-tase-resistant conformation. Rather, a confor-mational reporter reveals that inhibitor bindinginduces a conformational change, resulting in re-localization of PKD to basal DAG pools, where itis more readily phosphorylated by nPKCs. Thesefindings illustrate the diverse conformational ef-fects that small molecules exert on their target pro-teins, underscoring the importance of using cautionwhen interpreting kinase activity from phosphoryla-tion state.
INTRODUCTION
Protein kinase D (PKD) transduces numerous signals down-
stream of diacylglycerol (DAG) production, playing a role in
diverse cellular functions such as regulation of immune cell
signaling, Golgi sorting, cell polarity, proliferation, survival, and
migration (Rozengurt, 2011). A vast number of distinct stimuli
can lead to an increase in DAG by binding to cell surface recep-
tors and stimulating phospholipase C (PLC) activity. PLC cata-
lyzes the hydrolysis of the membrane lipid phosphatidylinositol
4,5-biphosphate, generating the two second messengers
inositol 1,4,5-trisphosphate and DAG. C1 domains are protein
modules that bind to DAG, as well as to their functional ana-
logs, phorbol esters. Thus, downstream of activating stimuli,
increased levels of DAG recruit C1 domain-containing proteins
to cellular membranes; such proteins include PKDs as well as
98 Chemistry & Biology 22, 98–106, January 22, 2015 ª2015 Elsevier
their activating kinases, the novel protein kinase Cs (nPKCs)
(Toker, 2005).
The PKD family consists of three isozymes: PKD1, PKD2, and
PKD3. Although PKD was originally classified as a PKC family
member and called PKCm, PKD actually belongs to the cal-
cium-calmodulin kinase superfamily, a family distinct from the
AGC kinase group to which PKCs belong (Rozengurt et al.,
2005). PKDs consist of an N-terminal regulatory domain
comprising two C1 domains followed by a pleckstrin homology
(PH) domain. The C1 domain serves as a DAG sensor and re-
cruits PKD to membranes. Additionally, this module and the
PH domain both autoinhibit the C-terminal kinase domain:
disruption of either the C1 or PH domains results in a constitu-
tively active kinase (Iglesias and Rozengurt, 1998, 1999). Autoin-
hibition is relieved by DAG-dependent recruitment to mem-
branes, an event that poises PKD near its upstream kinases,
the nPKCs. The nPKCs are similarly recruited to DAG-containing
membranes via their C1 domains; however, unlike PKD, which
becomes activated once phosphorylated, PKCs are constitu-
tively phosphorylated and are active when bound to DAG. Acti-
vated nPKCs phosphorylate PKD within its activation loop at
two serines (e.g., S744 and S748 in mouse PKD1) and PKD sub-
sequently autophosphorylates at a site in its C terminus (e.g.,
S916 in mouse PKD1). These phosphorylations are activating
and are commonly used as ameasure of PKD activity (Rozengurt
et al., 2005).
PKC and Akt are also critically regulated by phosphorylation.
For PKC, phosphorylation is constitutive and part of its priming
process, whereas for Akt, phosphorylation is agonist evoked.
Recent studies revealed that both enzymes display a paradox-
ical increase in phosphorylation following treatment of cells with
active-site inhibitors (Cameron et al., 2009; Okuzumi et al.,
2009). In the case of PKC, which is constitutively phosphory-
lated, this phenomenon is observed using kinase-inactive con-
structs that have highly reduced autophosphorylation capacity
and are thus not normally phosphorylated in cells. For Akt,
this is observed for wild-type enzyme. We have previously
shown that in the case of PKC, occupancy of the active site
by inhibitors (or peptides or autoinhibitory pseudosubstrate [Du-
til and Newton, 2000]) locks PKC in a phosphatase-resistant
conformation (Gould et al., 2011). The same mechanism was
described for Akt: active-site occupancy locks the kinase in a
phosphatase-resistant conformation (Chan et al., 2011; Lin
et al., 2012). Whether the ability of inhibitors to enhance kinase
phosphorylation is a general phenomenon remains to be
established.
Ltd All rights reserved

A
B
Figure 1. Time Course of PKD Activation in the Presence of Kinase
Inhibitors
(A) Western blots depicting activation loop phosphorylation (p744/748) and
C-terminal autophosphorylation (p916) of PKD endogenous to COS-7 cells
induced by 100 mM UTP stimulation over 10 min in the absence (first three
lanes) or presence of 10min pretreatment with the PKD or PKC kinase inhibitor
Go 6976 (500 nM, middle lanes) or Go 6983 (250 nM, right lanes), respectively.
A representative blot is depicted.
(B) Graphs depicting the average intensities of the phospho-bands from ex-
periments as in (A). Data were normalized to the 0 min time point for each time
course and then averaged. Errors represent SEM; n = 6 for untreated (blue
diamond) andGo 6976-treated (green square) plots, and n = 4 for the Go 6983-
treated (red triangle) plots. *p < 0.05 between the untreated and Go 6976-
treated cells as determined by Student’s t test.
See also Figure S1.
Chemistry & Biology
Inhibitor Binding Alters PKD Phosphorylation
Here we show that PKD also undergoes a paradoxical increase
in activation loop phosphorylation following treatment of cells with
PKD inhibitors. Specifically, these inhibitors abolish downstream
signaling by PKD but promote the steady-state phosphorylation
at the activation loop. This inhibitor-dependent increase in phos-
phorylation occurs by a mechanism distinct from that for Akt and
PKC. Specifically, using a fluorescence resonance energy trans-
fer (FRET)-based conformational reporter, we show that inhibitor
binding promotes a conformational change in PKD that unmasks
its C1 domain for enhancedmembrane binding. This allows inhib-
itor-bound PKD to bind basal levels of DAG in DAG-enriched
Chemistry & Biology 22, 9
membranes such as Golgi, a location also enriched in the up-
stream kinase, the nPKCs. This colocalization of PKD and nPKC
promotes enhanced phosphorylation of PKD by nPKC following
agonist stimulation, thus accounting for the paradoxical increase
in phosphorylation despite inhibition of PKD activity.
RESULTS
Active-Site Inhibitor Binding Increases PKD ActivationLoop PhosphorylationTime courses of PKD activation downstream of G protein-
coupled receptors (GPCRs) unexpectedly revealed increased
phosphorylation at the activation loop site following 10 min pre-
treatment with the PKD active-site inhibitor Go 6976. COS-7 cells
stimulated with uridine triphosphate (UTP) to activate endoge-
nous Gq-coupled GPCRs resulted in increasing PKD activation,
as measured via activation loop (744/748 in mouse PKD1) and
C-terminal (916 in mouse PKD1) phosphorylation (Figure 1). We
have previously shown that pretreatment of COS-7 cells with
500 nM Go 6976 for 10 min effectively abolishes PKD signaling
as monitored using a PKD activity reporter, DKAR (Kunkel
et al., 2007). Thus, despite the complete inhibition of PKD under
these conditions, activation loop phosphorylation was increased
compared with untreated cells at each time point (Figure 1). In or-
der to determine whether this effect was specific to Go 6976
acting on PKD, we used another competitive PKD inhibitor,
CRT0066101 (Christopher Ireson, personal communication),
which is more specific to PKD than Go 6976 (Harikumar et al.,
2010). CRT0066101 pretreatment similarly resulted in increased
activation loop phosphorylation on PKD following UTP stimula-
tion (Figure S1 available online). We note that C-terminal phos-
phorylation, an event that is catalyzed by autophosphorylation,
was not abolished in the presence of the kinase inhibitors,
but the rate of autophosphorylation was reduced (Figures 1
and S1). In contrast, pretreatment of the cells with 250 nM Go
6983, to inhibit activity of the upstream kinases that catalyze
PKD activation loop phosphorylation (nPKCs), abolished UTP-
induced phosphorylation at the activation loop site and signifi-
cantly diminished C-terminal phosphorylation (Figure 1).
Noncompetitive Inhibitor Binding Also Increases PKDActivation Loop PhosphorylationPrevious work on Akt and PKC has revealed that binding to
active-site inhibitors leads to increased phosphorylation of the
kinase, but binding to noncompetitive inhibitors does not (Gould
et al., 2011; Okuzumi et al., 2009). To assess whether this was
also the case for PKD, we used the ATP-noncompetitive PKD in-
hibitor CID 755673 (Sharlow et al., 2008). First, to validate that
CID 755673 could effectively inhibit PKD in COS-7 cells, we
tested its effect on inhibition of signaling by both endogenous
PKD as well as overexpressed PKD. Figure 2A shows that the
response from the PKD activity reporter DKAR (Kunkel et al.,
2007) induced by the DAG analog phorbol 12,13-dibutyrate
(PDBu) was readily reversed following the addition of 50 mM
CID 755673. Importantly, the DKAR response was enhanced in
the presence of overexpressed PKD1, and this increased
response was fully reversed following CID 755673 addition.
Next, we examined the effect of 50 mM CID 755673 on UTP-
dependent phosphorylation. Surprisingly, we observed greatly
8–106, January 22, 2015 ª2015 Elsevier Ltd All rights reserved 99

Figure 3. Time Course of PKD Activation at 37�C in the Presence of
PKD Inhibitors
Western blots depicting activation loop phosphorylation (p744/748) and
C-terminal autophosphorylation (p916) of PKD induced by 100 mM UTP
stimulation over 30 min in the absence (first three lanes) or presence of 10 min
pretreatment with the PKD inhibitor Go 6976 (500 nM, middle lanes) or CID
755673 (50 mM, right lanes). A representative blot is depicted.
A
B
Figure 2. Effect of CID 755673 on PKD
(A) Graph depicting changes in the FRET ratio fromCOS-7 cells expressing the
kinase activity reporter DKAR following activation of endogenous PKD (light
blue diamonds) or overexpressed PKD (dark blue diamonds) via 200 nM PDBu
treatment and subsequent PKD inhibition with the noncompetitive PKD in-
hibitor CID 755673 (50 mM). The FRET ratio was normalized to the 0 min time
point. Shown is a representative experiment.
(B) Western blots depicting activation loop phosphorylation (p744/748) and
C-terminal autophosphorylation (p916) of PKD endogenous to COS-7 cells
induced by 100 mM UTP stimulation over 10 min in the absence (first three
lanes) or presence of 10 min pretreatment with the PKD or PKC kinase in-
hibitors CID 755673 (50 mM, middle lanes) and Go 6983 (250 nM, right lanes),
respectively. A representative blot is depicted. All experiments were per-
formed at room temperature.
Chemistry & Biology
Inhibitor Binding Alters PKD Phosphorylation
enhanced phosphorylation at the activation loop site as well as
considerably reduced autophosphorylation at the C-terminal
site (Figure 2B). The UTP-stimulated increase in activation loop
phosphorylation was on average 20-fold higher in CID-pre-
treated cells than in untreated cells (22 ± 7 compared with
4.3 ± 0.6, errors representing SEM). Thus, in contrast to the con-
ditions for PKC, the phosphorylation state of PKD at the activa-
tion loop is influenced by binding to both ATP-competitive and
ATP-noncompetitive inhibitors. Furthermore, autophosphoryla-
tion at the C-terminal site was more effectively reduced in the
presence of CID 755673 compared with Go 6976 (compare Fig-
ure 2B with Figure 1A, p916).
Transient PKD Phosphorylation at 37�CThe previous experiments were conducted at room temperature
to keep in parallel with all of our kinase imaging studies; there-
fore, we next set out to examine the time course of PKD activa-
100 Chemistry & Biology 22, 98–106, January 22, 2015 ª2015 Elsevie
tion at a more physiologically relevant temperature. Figure 3
reveals the transient nature of PKD activation as monitored via
activation loop (p744/748) and C-terminal autophosphorylation
(p916) at 37�C. Phosphorylation at the activation loop and C-ter-
minal autophosphorylation site peaked at 5 min. After 30 min of
UTP treatment, activation loop phosphorylation returned to
basal levels, and phosphorylation at the C-terminal site, although
still elevated, declined. In the presence of Go 6976, activation
loop phosphorylation was elevated over the UTP time course
but displayed the same transient phosphorylation as observed
from cells that were not pretreated with inhibitor; thus, although
the effect of increased phosphorylation with inhibitor was pre-
sent, phosphorylation did eventually decay. However, a 10 min
pretreatment with CID 755673 resulted in a robust increase in
activation loop phosphorylation that remained elevated over
the 30 min experiment. In fact, increased phosphorylation at
this site was still present following 60 min of UTP treatment
(data not shown).
Increased Phosphorylation in the Presence of InhibitorIs Not an Intrinsic Property of PKDPrevious studies on Akt and PKC have demonstrated that active-
site occupancy induces a change in conformation of the kinase
that is now resistant to dephosphorylation by phosphatases
(Chan et al., 2011; Gould et al., 2011; Lin et al., 2012; Srivastava
et al., 2002). We therefore tested whether the increased activa-
tion loop phosphorylation observed from inhibitor-bound PKD
resulted from its adopting a phosphatase-resistant conforma-
tion. PKD that had been fully phosphorylated following PDBu
treatment was immunoprecipitated and incubated with the
PP1 phosphatase in the absence or presence of PKD inhibitors.
Figure 4A shows time-dependent PP1 dephosphorylation of the
activation loop and C-terminal site of immunoprecipitated PKD2.
Preincubation of the immunoprecipitated PKD2with CID 755673
for 10 min followed by PP1 addition modestly altered the rate of
dephosphorylation compared with PKD2 without inhibitor pre-
treatment (t½ = 16.5 min in the absence of inhibitor and t½ =
10 min in the presence of CID), a difference too small to account
for the approximately 20-fold increase in phosphorylation
observed in cells (Figure 4A). Furthermore, addition of the
active-site inhibitor Go 6976 at concentrations 12-fold greater
r Ltd All rights reserved

A
B
Figure 4. In Vitro Analysis of PKD Phosphorylation
(A) Western blots of PKD2 phosphorylation at the activation loop site (p744/
748) and C-terminal autophosphorylation site (p916) of immunoprecipitated,
fully phosphorylated Flag-PKD2 in the absence (left lanes) and presence of
25 U/ml PP1 without (middle lanes) and with (right lanes) 50 mM CID 755673.
(B) Western blots of PKD2 activation loop phosphorylation (p744/748) and
PKD2 C-terminal phosphorylation (p916) following incubation of immunopre-
cipitated Flag-PKD2 with purified PKCd (5 ng of 1280 U/mg stock) in the
absence (left lanes) and presence (right lanes) of the PKD inhibitor Go 6976
(6 mM).
Chemistry & Biology
Inhibitor Binding Alters PKD Phosphorylation
than what was used in the COS-7 time courses above (i.e., 6 mM
inhibitor) did not detectably slow the rate of dephosphorylation
by PP1 (t½ = 16.5 min in the absence of inhibitor and t½ =
14 min in the presence of 6 mM Go 6976; data not shown).
Thus, the mechanism by which inhibitors result in increased
phosphorylation of PKD is not by inducing a phosphatase-re-
sistant species and thus is distinct from the mechanism for Akt
and PKC.
Because inhibitor binding to PKD did not induce a conforma-
tion that was resistant to phosphatase activity, we next asked
whether the inhibitor-bound enzyme was in a conformation,
making it more amenable to phosphorylation by one of its up-
stream kinases, PKCd. Incubation of immunoprecipitated
PKD2 with pure PKCd resulted in a time-dependent increase in
phosphorylation at the PKC site (p744/748) as well as at the au-
tophosphorylation site (p916) (Figure 4B). Preincubation of Go
6976 for 10 min prior to incubation with PKCd did not increase
the rate of phosphorylation; in the in vitro system, CID 755673 in-
hibited PKCd, so the role of this ATP-noncompetitive PKD inhib-
itor could not be assessed in this assay (data not shown). Taken
together, there was little to no effect of inhibitor binding on the
rate of phosphorylation or dephosphorylation of PKD by PKCd
or PP1, respectively; the increased activation loop phosphoryla-
tion observed in the presence of inhibitor is not an intrinsic prop-
erty of inhibitor-bound PKD.
Chemistry & Biology 22, 98
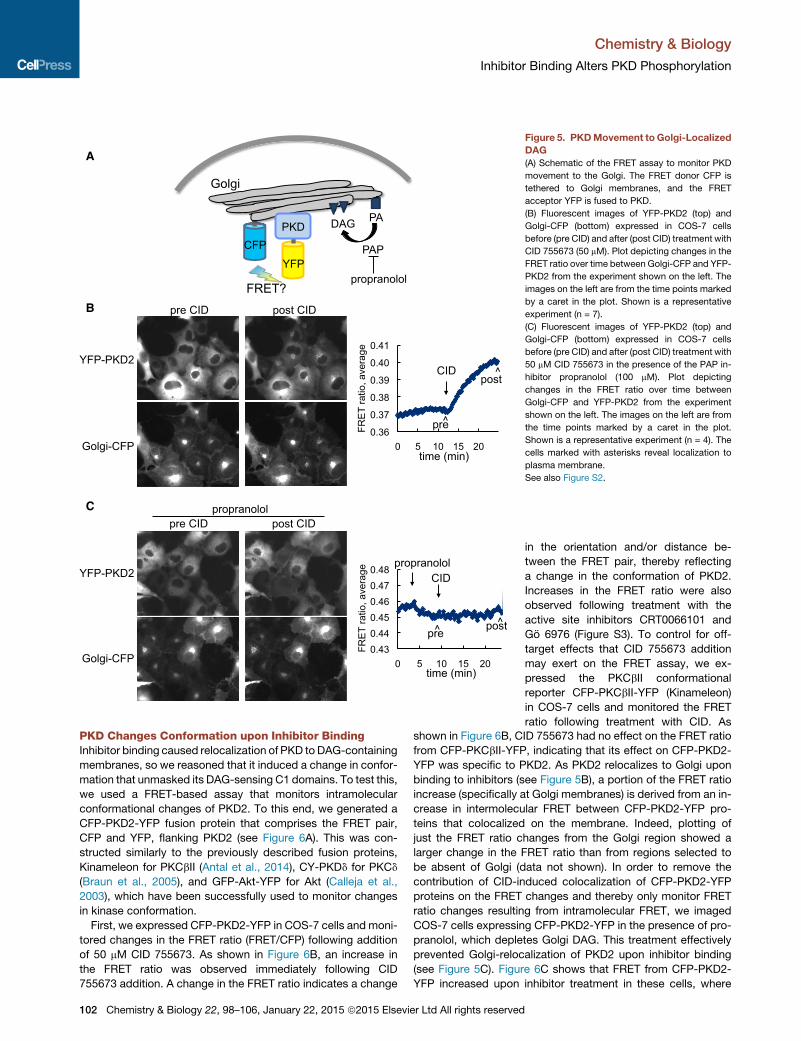
Binding to Inhibitors Unmasks the DAG Sensor of PKDBecause the effect of inhibitors on the phosphorylation state of
PKD could not be recapitulated in vitro with purified proteins,
we monitored PKD in cells to determine if inhibitor binding
altered the conformation or localization of PKD. For these
experiments, we expressed yellow fluorescent protein (YFP)-
tagged PKD2 in COS-7 cells and monitored its subcellular local-
ization in real time following addition of CID 755673. Within
minutes of CID 755673 addition, YFP-PKD2 relocalized to a
subcellular region characteristic of Golgi membranes (Figure 5).
To confirm that the enzyme was indeed relocalizing to Golgi
membranes, we used a bipartite FRET assay in which the
FRET donor cyan fluorescent protein (CFP) is tethered to Golgi
membranes (Gallegos et al., 2006) and the FRET acceptor YFP
is fused onto PKD2 (Kunkel et al., 2009) (Figure 5A). Indeed,
following addition of CID 755673, YFP-PKD2 colocalized to
the Golgi-targeted CFP signal, and this colocalization was
confirmed by an increase in FRET between the two fluorophores
(Figure 5B); a similar redistribution, albeit less robust, was
observed with PKD1 (data now shown), so all subsequent
experiments were performed with PKD2. Importantly, the
morphology of the Golgi was unaffected following treatment
with CID 755673, as illustrated by the Golgi-CFP images (Fig-
ure 5B, bottom). Because PKD contains C1 domains and is acti-
vated by binding to membrane-embedded DAG, we examined
whether DAG levels at the Golgi were involved in enzyme move-
ment to this organelle. Basal levels of DAG at the Golgi are
maintained via phosphatidic acid phosphatase (PAP), which
converts phosphatidic acid to DAG (Figure 5A) (Baron and Mal-
hotra, 2002). To ascertain whether Golgi DAG played a role in
relocalization of PKD to Golgi, we treated cells first with the
PAP inhibitor propranolol, followed by the addition of CID
755673. As shown in Figure 5C, depletion of Golgi DAG pre-
vented movement of PKD to Golgi membranes. Interestingly,
in select cells (e.g., the two marked with an asterisk in Fig-
ure 5C), we observed localization of PKD to plasma membrane
after CID 755673 addition in Golgi DAG-depleted cells, suggest-
ing that plasma membrane DAG was elevated in those select
cells. To exclude the possibility that CID 755673 addition re-
sulted in an increase in cellular DAG levels and that this ac-
counted for PKD relocalization to membranes, we examined
the effect of CID on a distinct, Golgi-localized, DAG-dependent
kinase, PKCd. In COS-7 cells, we comonitored YFP-PKD2 and
mCherry-PKCd movement in the same cell following CID addi-
tion and determined that the effect of inhibitors on PKD move-
ment is unique to PKD. PKCd localization did not change with
CID addition, whereas PKD movement to Golgi was robust (Fig-
ure S2A). By western analysis, CID 755673 treatment resulted
in a much more robust increase in activation loop phosphoryla-
tion than Go 6976 or CRT0066101 (compare Figures 1A and
S1 with Figure 2B), so was not surprising that Go 6976 and
CRT0066101 were less effective than CID in causing movement
of PKD to the Golgi (Figure S2B). In the case of Go 6976, PKD
relocalization was more readily observed at later time points
or with excess Go 6976 (6 mM compared with 500 nM) (Fig-
ure S2B). In summary, Go 6976, CRT0066101, and CID
755673 binding to PKD induced movement of PKD to Golgi,
and at this location, phosphorylation at its activation loop site
is enhanced by activated nPKCs.
–106, January 22, 2015 ª2015 Elsevier Ltd All rights reserved 101
A
B
C
Figure 5. PKDMovement to Golgi-Localized
DAG
(A) Schematic of the FRET assay to monitor PKD
movement to the Golgi. The FRET donor CFP is
tethered to Golgi membranes, and the FRET
acceptor YFP is fused to PKD.
(B) Fluorescent images of YFP-PKD2 (top) and
Golgi-CFP (bottom) expressed in COS-7 cells
before (pre CID) and after (post CID) treatment with
CID 755673 (50 mM). Plot depicting changes in the
FRET ratio over time between Golgi-CFP and YFP-
PKD2 from the experiment shown on the left. The
images on the left are from the time points marked
by a caret in the plot. Shown is a representative
experiment (n = 7).
(C) Fluorescent images of YFP-PKD2 (top) and
Golgi-CFP (bottom) expressed in COS-7 cells
before (pre CID) and after (post CID) treatment with
50 mM CID 755673 in the presence of the PAP in-
hibitor propranolol (100 mM). Plot depicting
changes in the FRET ratio over time between
Golgi-CFP and YFP-PKD2 from the experiment
shown on the left. The images on the left are from
the time points marked by a caret in the plot.
Shown is a representative experiment (n = 4). The
cells marked with asterisks reveal localization to
plasma membrane.
See also Figure S2.
Chemistry & Biology
Inhibitor Binding Alters PKD Phosphorylation
PKD Changes Conformation upon Inhibitor BindingInhibitor binding caused relocalization of PKD to DAG-containing
membranes, so we reasoned that it induced a change in confor-
mation that unmasked its DAG-sensing C1 domains. To test this,
we used a FRET-based assay that monitors intramolecular
conformational changes of PKD2. To this end, we generated a
CFP-PKD2-YFP fusion protein that comprises the FRET pair,
CFP and YFP, flanking PKD2 (see Figure 6A). This was con-
structed similarly to the previously described fusion proteins,
Kinameleon for PKCbII (Antal et al., 2014), CY-PKDd for PKCd
(Braun et al., 2005), and GFP-Akt-YFP for Akt (Calleja et al.,
2003), which have been successfully used to monitor changes
in kinase conformation.
First, we expressed CFP-PKD2-YFP in COS-7 cells and moni-
tored changes in the FRET ratio (FRET/CFP) following addition
of 50 mM CID 755673. As shown in Figure 6B, an increase in
the FRET ratio was observed immediately following CID
755673 addition. A change in the FRET ratio indicates a change
102 Chemistry & Biology 22, 98–106, January 22, 2015 ª2015 Elsevier Ltd All rights reserved
in the orientation and/or distance be-
tween the FRET pair, thereby reflecting
a change in the conformation of PKD2.
Increases in the FRET ratio were also
observed following treatment with the
active site inhibitors CRT0066101 and
Go 6976 (Figure S3). To control for off-
target effects that CID 755673 addition
may exert on the FRET assay, we ex-
pressed the PKCbII conformational
reporter CFP-PKCbII-YFP (Kinameleon)
in COS-7 cells and monitored the FRET
ratio following treatment with CID. As
shown in Figure 6B, CID 755673 had no effect on the FRET ratio
from CFP-PKCbII-YFP, indicating that its effect on CFP-PKD2-
YFP was specific to PKD2. As PKD2 relocalizes to Golgi upon
binding to inhibitors (see Figure 5B), a portion of the FRET ratio
increase (specifically at Golgi membranes) is derived from an in-
crease in intermolecular FRET between CFP-PKD2-YFP pro-
teins that colocalized on the membrane. Indeed, plotting of
just the FRET ratio changes from the Golgi region showed a
larger change in the FRET ratio than from regions selected to
be absent of Golgi (data not shown). In order to remove the
contribution of CID-induced colocalization of CFP-PKD2-YFP
proteins on the FRET changes and thereby only monitor FRET
ratio changes resulting from intramolecular FRET, we imaged
COS-7 cells expressing CFP-PKD2-YFP in the presence of pro-
pranolol, which depletes Golgi DAG. This treatment effectively
prevented Golgi-relocalization of PKD2 upon inhibitor binding
(see Figure 5C). Figure 6C shows that FRET from CFP-PKD2-
YFP increased upon inhibitor treatment in these cells, where

A
B C
Figure 6. Inhibitor Binding to PKD Induces aConformational Change
(A) Schematic showing the CFP-PKD2-YFP fusion protein. The FRET pair CFP
and YFP are fused to the N and C termini of PKD2, respectively. Conforma-
tional changes are measured by changes in FRET.
(B) Plot of the whole-cell FRET ratio changes from CFP-PKD2-YFP and CFP-
PKCbII-YFP following addition of 50 mM CID 755673. Data from multiple cells
from five independent experiments were first normalized and then averaged.
Errors are SEM; n = 28 for CFP-PKD2-YFP, and n = 18 for CFP-PKCbII-YFP.
(C) Plot of the FRET ratio changes from CFP-PKD2-YFP following addition of
50 mMCID 755673 in the presence of propranolol. Data frommultiple cells from
five independent experiments were first normalized and then averaged. Errors
are SEM (n = 35).
See also Figure S3.
Chemistry & Biology
Inhibitor Binding Alters PKD Phosphorylation
there was no relocalization of PKD2 to Golgi membranes,
consistent with an intramolecular change in FRET.
DISCUSSION
Here we show that PKD inhibitors that robustly inhibit kinase
activity exert additional effects on the enzyme: they induce reloc-
alization of the kinase to DAG-containing membranes, thus facil-
itating substrate phosphorylation by nPKCs. On the basis of our
studies, we present a model (Figure 7) depicting how inhibitors
act on PKD to result in increased phosphorylation at its activation
loop site. Under basal conditions, PKD resides in the cytosol in
an autoinhibited state. In this state, the PH and C1 domains
interact with the catalytic core, thereby preventing the C1 do-
mains from associating with basal levels of DAG, while also pre-
venting PKD phosphorylation and activation by its upstream
kinases. Binding of inhibitors to PKD alters the conformation be-
tween the regulatory domains and kinase domain such that the
C1 domain is now available to bind DAG; this is evident based
on intramolecular conformational changes detected by the
FRET-based PKD2 (CFP-PKD2-YFP) reporter and the move-
ment of PKD to Golgi membranes, where basal DAG is relatively
high (Figure 5). Once its regulatory domains are engaged at
membranes, PKD has a readily accessible activation loop site.
This species of PKD is still unphosphorylated, but subsequent
to stimuli that activate the upstream nPKCs (e.g., UTP stimula-
tion of purinergic receptors in COS-7 cells), PKD phosphoryla-
tion occurs at its activation loop site. Importantly, this phosphor-
ylation by nPKCs is now greatly enhanced compared with levels
of phosphorylation on the untreated, cytosolic form (p744/748 in
Chemistry & Biology 22, 98
Figures 1A, 2B, and S1). Interestingly, although PKD is in a DAG-
binding conformation, the phosphorylation of its activation loop
site by nPKCs is still stimulus dependent, thereby reflecting tight
regulation of nPKC activity. Note that although the activated
GPCRs reside at the plasma membrane, we have previously
shown that the increase in Ca2+ downstream of GPCR signaling
results in an increase in Golgi DAG, thus PKCd is locally activated
at Golgi (Kunkel and Newton, 2010).
The effect of increased activation loop phosphorylation in the
presence of PKD inhibitors was abundantly evident, as our initial
studies were done at room temperature, at which the effect is
exaggerated; however, we have shown that this finding remains
present at 37�C, albeit more subtle (Figure 3). Importantly,
though, this initial observation led to our studies on binding of
the noncompetitive inhibitor CID 755673, which so dramatically
affects PKD conformation that it is pronounced and prolonged
both at room temperature and 37�C (Figures 2B and 3).
Our finding that inhibitor binding results in PKD membrane
localization was unexpected (Figure 5), but the induction of
cellular translocation of a kinase upon inhibitor binding is not un-
precedented. Okuzumi and colleagues showed membrane
localization of Akt in the presence of active-site inhibitors. In
addition, similar to our observation that PKD relocalization is
DAG-dependent, the authors found that depletion of basal levels
of phosphoinositol 3,4,5-trisphosphate (PIP3), the activating lipid
of Akt, prevented this relocalization (Okuzumi et al., 2009).
In the course of these studies, we analyzed the phosphoryla-
tion state of PKD in the presence and absence of PKD inhibitors.
As described above, phosphorylation at the C-terminal S916 oc-
curs via PKD autophosphorylation; however, PKD inhibitors
were not able to fully prevent autophosphorylation (p916 in Fig-
ures 1A, 2B, and S1), even though phosphorylation toward
cellular substrates was inhibited (Figure 2A and Kunkel et al.,
2007). It is important to consider that a negative result (S916
phosphorylation despite PKD inhibitor treatment) does not
discredit the well-accepted model of PKD activation via auto-
phosphorylation at this site; rather, this observation highlights
the fact that kinases that are in close proximity to their substrates
are still able to phosphorylate them. The residual kinase activity
present within the inhibitor-bound enzyme is sufficient to induce
phosphorylation of nearby substrates, such as those located at
the same protein complex or, as in this case, on the same poly-
peptide. One clear example of this has been demonstrated for
phosphoinositide-dependent kinase (PDK-1), the upstream ki-
nase for both PKC and Akt. PDK-1 and unphosphorylated PKC
are tightly associated (Gao et al., 2001), whereas PDK-1 and
Akt do not interact. PKC is constitutively phosphorylated at its
activation loop by the interacting PDK-1, but Akt phosphoryla-
tion by PDK-1 occurs only following colocalization of the two en-
zymes at membranes after signal-induced PIP3 production.
Thus, addition of a PDK-1 inhibitor does not hinder PKC phos-
phorylation and processing, but phosphorylation of Akt is com-
pletely blocked (Hoshi et al., 2010). Additionally, it was shown
that active site PKC inhibitors were unable to block modulation
by phosphorylation of the channels that constitute M current;
this is a result of the scaffold protein AKAP79/150 anchoring
the two proteins in close proximity (Hoshi et al., 2010). Thus, au-
tophosphorylation reactions and reactions of substrates scaf-
folded to kinases can be refractory to inhibition compared with
–106, January 22, 2015 ª2015 Elsevier Ltd All rights reserved 103
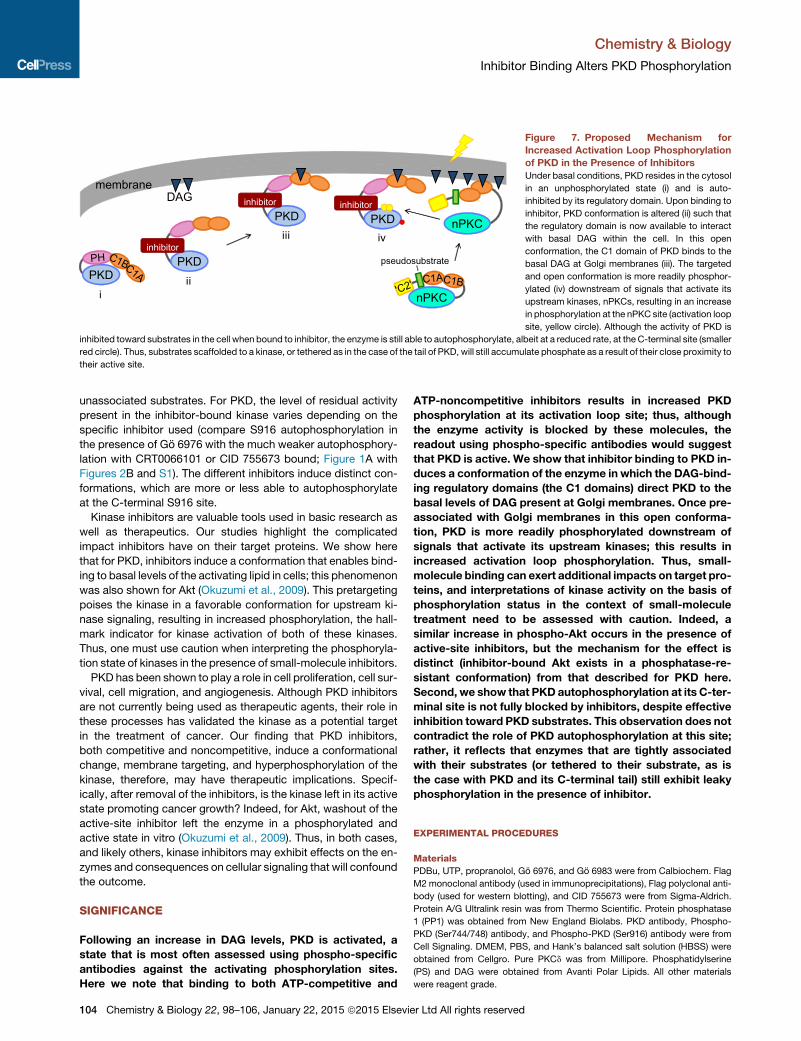
Figure 7. Proposed Mechanism for
Increased Activation Loop Phosphorylation
of PKD in the Presence of Inhibitors
Under basal conditions, PKD resides in the cytosol
in an unphosphorylated state (i) and is auto-
inhibited by its regulatory domain. Upon binding to
inhibitor, PKD conformation is altered (ii) such that
the regulatory domain is now available to interact
with basal DAG within the cell. In this open
conformation, the C1 domain of PKD binds to the
basal DAG at Golgi membranes (iii). The targeted
and open conformation is more readily phosphor-
ylated (iv) downstream of signals that activate its
upstream kinases, nPKCs, resulting in an increase
in phosphorylation at the nPKC site (activation loop
site, yellow circle). Although the activity of PKD is
inhibited toward substrates in the cell when bound to inhibitor, the enzyme is still able to autophosphorylate, albeit at a reduced rate, at the C-terminal site (smaller
red circle). Thus, substrates scaffolded to a kinase, or tethered as in the case of the tail of PKD, will still accumulate phosphate as a result of their close proximity to
their active site.
Chemistry & Biology
Inhibitor Binding Alters PKD Phosphorylation
unassociated substrates. For PKD, the level of residual activity
present in the inhibitor-bound kinase varies depending on the
specific inhibitor used (compare S916 autophosphorylation in
the presence of Go 6976 with the much weaker autophosphory-
lation with CRT0066101 or CID 755673 bound; Figure 1A with
Figures 2B and S1). The different inhibitors induce distinct con-
formations, which are more or less able to autophosphorylate
at the C-terminal S916 site.
Kinase inhibitors are valuable tools used in basic research as
well as therapeutics. Our studies highlight the complicated
impact inhibitors have on their target proteins. We show here
that for PKD, inhibitors induce a conformation that enables bind-
ing to basal levels of the activating lipid in cells; this phenomenon
was also shown for Akt (Okuzumi et al., 2009). This pretargeting
poises the kinase in a favorable conformation for upstream ki-
nase signaling, resulting in increased phosphorylation, the hall-
mark indicator for kinase activation of both of these kinases.
Thus, one must use caution when interpreting the phosphoryla-
tion state of kinases in the presence of small-molecule inhibitors.
PKD has been shown to play a role in cell proliferation, cell sur-
vival, cell migration, and angiogenesis. Although PKD inhibitors
are not currently being used as therapeutic agents, their role in
these processes has validated the kinase as a potential target
in the treatment of cancer. Our finding that PKD inhibitors,
both competitive and noncompetitive, induce a conformational
change, membrane targeting, and hyperphosphorylation of the
kinase, therefore, may have therapeutic implications. Specif-
ically, after removal of the inhibitors, is the kinase left in its active
state promoting cancer growth? Indeed, for Akt, washout of the
active-site inhibitor left the enzyme in a phosphorylated and
active state in vitro (Okuzumi et al., 2009). Thus, in both cases,
and likely others, kinase inhibitors may exhibit effects on the en-
zymes and consequences on cellular signaling that will confound
the outcome.
SIGNIFICANCE
Following an increase in DAG levels, PKD is activated, a
state that is most often assessed using phospho-specific
antibodies against the activating phosphorylation sites.
Here we note that binding to both ATP-competitive and
104 Chemistry & Biology 22, 98–106, January 22, 2015 ª2015 Elsevie
ATP-noncompetitive inhibitors results in increased PKD
phosphorylation at its activation loop site; thus, although
the enzyme activity is blocked by these molecules, the
readout using phospho-specific antibodies would suggest
that PKD is active. We show that inhibitor binding to PKD in-
duces a conformation of the enzyme in which the DAG-bind-
ing regulatory domains (the C1 domains) direct PKD to the
basal levels of DAG present at Golgi membranes. Once pre-
associated with Golgi membranes in this open conforma-
tion, PKD is more readily phosphorylated downstream of
signals that activate its upstream kinases; this results in
increased activation loop phosphorylation. Thus, small-
molecule binding can exert additional impacts on target pro-
teins, and interpretations of kinase activity on the basis of
phosphorylation status in the context of small-molecule
treatment need to be assessed with caution. Indeed, a
similar increase in phospho-Akt occurs in the presence of
active-site inhibitors, but the mechanism for the effect is
distinct (inhibitor-bound Akt exists in a phosphatase-re-
sistant conformation) from that described for PKD here.
Second, we show that PKD autophosphorylation at its C-ter-
minal site is not fully blocked by inhibitors, despite effective
inhibition toward PKD substrates. This observation does not
contradict the role of PKD autophosphorylation at this site;
rather, it reflects that enzymes that are tightly associated
with their substrates (or tethered to their substrate, as is
the case with PKD and its C-terminal tail) still exhibit leaky
phosphorylation in the presence of inhibitor.
EXPERIMENTAL PROCEDURES
Materials
PDBu, UTP, propranolol, Go 6976, and Go 6983 were from Calbiochem. Flag
M2 monoclonal antibody (used in immunoprecipitations), Flag polyclonal anti-
body (used for western blotting), and CID 755673 were from Sigma-Aldrich.
Protein A/G Ultralink resin was from Thermo Scientific. Protein phosphatase
1 (PP1) was obtained from New England Biolabs. PKD antibody, Phospho-
PKD (Ser744/748) antibody, and Phospho-PKD (Ser916) antibody were from
Cell Signaling. DMEM, PBS, and Hank’s balanced salt solution (HBSS) were
obtained from Cellgro. Pure PKCd was from Millipore. Phosphatidylserine
(PS) and DAG were obtained from Avanti Polar Lipids. All other materials
were reagent grade.
r Ltd All rights reserved

Chemistry & Biology
Inhibitor Binding Alters PKD Phosphorylation
Plasmid Constructs
DNA encoding Golgi-CFP was originally described by Gallegos et al. (2006).
pcDNA3-DKARwas originally described by Kunkel et al. (2007). DNA encoding
HA-PKD1 and Flag-PKD2 were gifts from Dr. Alex Toker. DNA encoding YFP-
PKD2 was described by Kunkel et al. (2009). CFP-PKCbII-YFP (Kinameleon)
was previously described by Antal et al. (2014). CFP-PKD2-YFP was made
by subcloning PKD2 in place of PCKbII within the original CFP-PKCbII-YFP.
Cell Culture and Transfection
COS-7 cells weremaintained in DMEMcontaining 10% fetal bovine serum and
1%penicillin/streptomycin at 37�C in 5%CO2. Transient transfection was car-
ried out using FuGENE 6 (Promega).
PKD Activation Time Courses
COS-7 cells were grown to confluence in 60 mm dishes. Cells were washed
once and then treated at room temperature or 37�C in HBSS containing
1 mM Ca2+. Inhibitor pretreatment was for 10 min with 250 nM Go 6983,
500 nM Go 6976, or 50 mMCID 755673. UTP (100 mM) was added for the indi-
cated times. Treatments were stopped on ice and cells were washed with PBS
and lysed in 100 ml potassium phosphate buffer (50 mM NaPO4, 20 mM NaF,
1 mM NaP2O7, 2 mM EDTA, 2 mM EGTA [pH 7.5]) with 1% Triton supple-
mented with 1 mM dithiothreitol (DTT), 1 mM PMSF, 40 mg/ml leupeptin,
1 mM bestatin, and 1 mM microcystin. The Triton-insoluble fraction was
removed by centrifugation, and the soluble fraction analyzed by SDS-PAGE
and western blotting via chemiluminescence on a FluorChem Q imaging sys-
tem (ProteinSimple). Total and phospho-specific antibodies against PKD
(listed under Materials) were used to detect the PKD isozymes endogenous
to COS-7 cells.
In Vitro Experiments with Immunoprecipitated PKD
Dishes (2 3 10 cm) of COS-7 cells were transiently transfected with DNA en-
coding Flag-PKD2 and grown to confluence. For dephosphorylation experi-
ments using PP1, Flag-PKD2 cells were first treated for 15 min with 200 nM
PDBu before harvesting tomaximally phosphorylate PKD2. Cells were washed
once with PBS and then lysed in 1 ml PBS/1% Triton containing protease in-
hibitors; for dephosphorylation experiments, microcystin was included in the
lysis buffer. The Triton-insoluble portion was removed by centrifugation. Two
microliters anti-Flag M2 antibody was added to the remaining lysate and
rocked for 1 hr at 4�C, followed by addition of 20 ml Protein A/G Ultralink resin
and a further 1 hr of rocking at 4�C. Beads were pelleted and washed three
times with 1 ml reaction buffer. For dephosphorylation experiments with
PP1, beads were resuspended in 350 ml PP1 reaction buffer supplemented
with 140 mM/3.8 mM PS/DAG membranes (10x stock prepared as described
by Newton and Koshland, 1987) and protease inhibitors. Beads were divided
into two tubes and preincubated with (1) 50 mM CID 755673 or (2) DMSO for
10 min at room temperature. Reactions were initiated by the addition of PP1
at a final concentration of 25 U/ml. For Flag-PKD2 phosphorylation by
PKCd, beads were resuspended in 100 ml PKC buffer (20 mM HEPES, 2 mM
DTT, 100 mg/ml BSA with protease inhibitors). Resuspended beads were
divided into two tubes and preincubated with (1) 6 mM Go 6976 or (2) DMSO
for 10 min at room temperature. Reactions were initiated by addition of ATP
(100 mMf), MgCl2 (5 mMf), 140 mM/3.8 mM PS/DAG membranes, and 5 ng
1,280 U/mg PKCd per tube. For both in vitro time courses, reactions pro-
ceeded at 30�C with regular mixing. Time points were removed and stopped
by the addition of sample buffer at the indicated times. Each time point was
run in triplicate by SDS-PAGE and analyzed by western blotting via chemilumi-
nescence on a FluorChemQ imaging system (ProteinSimple). Data averages ±
SEM were plotted and analyzed using Prism (GraphPad Software). For
dephosphorylation experiments with PP1, the half-time of dephosphorylation
was calculated by fitting the data to a nonlinear regression using a one-phase
decay equation within the software. For phosphorylation experiments with
PKCd, data were fit by linear regression to calculate relatives rates of
phosphorylation.
Cell Imaging
COS-7 cells were plated onto sterilized glass coverslips in 35 mm dishes prior
to transfection. For DKAR experiments, cells were transfected with 1 mg DKAR
DNA with or without 1 mg PKD DNA. For Golgi localization imaging, cells were
Chemistry & Biology 22, 98
transfected with 1 mg YFP-PKD2 DNA and 0.1 mg Golgi-CFP DNA. For CFP-
PKD2-YFP or CFP-PKCbII-YFP experiments, cells were transfected with
1 mg DNA. Twenty-four hours following transfection, cells were washed once
and then imaged in HBSS containing 1 mMCaCl2 in the dark, at room temper-
ature. Two hundred nanomolar PDBu, 100 mMpropranolol, 50 mMCID 755673,
500 nM, or 6 mMGo 6976 was added when indicated. CFP, YFP, and FRET im-
ages were acquired and analyzed as previously described (Kunkel et al., 2005).
For DKAR experiments, the FRET ratio plotted was CFP/FRET, whereas for
Golgi localization and CFP-PKD2-YFP experiments, the FRET ratio plotted
was FRET/CFP; the inverse FRET ratio is plotted for DKAR experiments so
that a phosphorylation event is shown as an increase in the plot.
SUPPLEMENTAL INFORMATION
Supplemental Information includes Supplemental Experimental Procedures
and three figures and can be found with this article online at http://dx.doi.
org/10.1016/j.chembiol.2014.11.014.
ACKNOWLEDGMENTS
We thank Lisa L. Gallegos for generation of the pDEST-mCherry plasmid and
members of the Newton Lab for helpful comments. This work was supported
by grant P01 DK54441 from the NIH to A.C.N.
Received: July 11, 2014
Revised: October 18, 2014
Accepted: November 13, 2014
Published: December 31, 2014
REFERENCES
Antal, C.E., Violin, J.D., Kunkel, M.T., Skovsø, S., and Newton, A.C. (2014).
Intramolecular conformational changes optimize protein kinase C signaling.
Chem. Biol. 21, 459–469.
Baron, C.L., and Malhotra, V. (2002). Role of diacylglycerol in PKD recruitment
to the TGN and protein transport to the plasma membrane. Science 295,
325–328.
Braun, D.C., Garfield, S.H., and Blumberg, P.M. (2005). Analysis by fluores-
cence resonance energy transfer of the interaction between ligands and pro-
tein kinase Cdelta in the intact cell. J. Biol. Chem. 280, 8164–8171.
Calleja, V., Ameer-Beg, S.M., Vojnovic, B., Woscholski, R., Downward, J., and
Larijani, B. (2003). Monitoring conformational changes of proteins in cells by
fluorescence lifetime imaging microscopy. Biochem. J. 372, 33–40.
Cameron, A.J., Escribano, C., Saurin, A.T., Kostelecky, B., and Parker, P.J.
(2009). PKC maturation is promoted by nucleotide pocket occupation inde-
pendently of intrinsic kinase activity. Nat. Struct. Mol. Biol. 16, 624–630.
Chan, T.O., Zhang, J., Rodeck, U., Pascal, J.M., Armen, R.S., Spring, M.,
Dumitru, C.D., Myers, V., Li, X., Cheung, J.Y., and Feldman, A.M. (2011).
Resistance of Akt kinases to dephosphorylation through ATP-dependent
conformational plasticity. Proc. Natl. Acad. Sci. USA 108, E1120–E1127.
Dutil, E.M., and Newton, A.C. (2000). Dual role of pseudosubstrate in the coor-
dinated regulation of protein kinase C by phosphorylation and diacylglycerol.
J. Biol. Chem. 275, 10697–10701.
Gallegos, L.L., Kunkel, M.T., andNewton, A.C. (2006). Targeting protein kinase
C activity reporter to discrete intracellular regions reveals spatiotemporal dif-
ferences in agonist-dependent signaling. J. Biol. Chem. 281, 30947–30956.
Gao, T., Toker, A., and Newton, A.C. (2001). The carboxyl terminus of protein
kinase c provides a switch to regulate its interactionwith the phosphoinositide-
dependent kinase, PDK-1. J. Biol. Chem. 276, 19588–19596.
Gould, C.M., Antal, C.E., Reyes, G., Kunkel, M.T., Adams, R.A., Ziyar, A.,
Riveros, T., and Newton, A.C. (2011). Active site inhibitors protect protein ki-
nase C from dephosphorylation and stabilize its mature form. J. Biol. Chem.
286, 28922–28930.
Harikumar, K.B., Kunnumakkara, A.B., Ochi, N., Tong, Z., Deorukhkar, A.,
Sung, B., Kelland, L., Jamieson, S., Sutherland, R., Raynham, T., et al.
–106, January 22, 2015 ª2015 Elsevier Ltd All rights reserved 105
Chemistry & Biology
Inhibitor Binding Alters PKD Phosphorylation
(2010). A novel small-molecule inhibitor of protein kinase D blocks pancreatic
cancer growth in vitro and in vivo. Mol. Cancer Ther. 9, 1136–1146.
Hoshi, N., Langeberg, L.K., Gould, C.M., Newton, A.C., and Scott, J.D. (2010).
Interaction with AKAP79 modifies the cellular pharmacology of PKC. Mol. Cell
37, 541–550.
Iglesias, T., and Rozengurt, E. (1998). Protein kinase D activation by mutations
within its pleckstrin homology domain. J. Biol. Chem. 273, 410–416.
Iglesias, T., and Rozengurt, E. (1999). Protein kinase D activation by deletion of
its cysteine-rich motifs. FEBS Lett. 454, 53–56.
Kunkel, M.T., and Newton, A.C. (2010). Calcium transduces plasma mem-
brane receptor signals to produce diacylglycerol at Golgi membranes.
J. Biol. Chem. 285, 22748–22752.
Kunkel, M.T., Ni, Q., Tsien, R.Y., Zhang, J., and Newton, A.C. (2005). Spatio-
temporal dynamics of protein kinase B/Akt signaling revealed by a genetically
encoded fluorescent reporter. J. Biol. Chem. 280, 5581–5587.
Kunkel, M.T., Toker, A., Tsien, R.Y., and Newton, A.C. (2007). Calcium-depen-
dent regulation of protein kinase D revealed by a genetically encoded kinase
activity reporter. J. Biol. Chem. 282, 6733–6742.
Kunkel, M.T., Garcia, E.L., Kajimoto, T., Hall, R.A., and Newton, A.C. (2009).
The protein scaffold NHERF-1 controls the amplitude and duration of localized
protein kinase D activity. J. Biol. Chem. 284, 24653–24661.
Lin, K., Lin, J., Wu, W.I., Ballard, J., Lee, B.B., Gloor, S.L., Vigers, G.P.,
Morales, T.H., Friedman, L.S., Skelton, N., and Brandhuber, B.J. (2012). An
106 Chemistry & Biology 22, 98–106, January 22, 2015 ª2015 Elsevie
ATP-site on-off switch that restricts phosphatase accessibility of Akt. Sci.
Signal. 5, ra37.
Newton, A.C., and Koshland, D.E., Jr. (1987). Protein kinase C autophosphor-
ylates by an intrapeptide reaction. J. Biol. Chem. 262, 10185–10188.
Okuzumi, T., Fiedler, D., Zhang, C., Gray, D.C., Aizenstein, B., Hoffman, R.,
and Shokat, K.M. (2009). Inhibitor hijacking of Akt activation. Nat. Chem.
Biol. 5, 484–493.
Rozengurt, E. (2011). Protein kinase D signaling:multiple biological functions in
health and disease. Physiology (Bethesda) 26, 23–33.
Rozengurt, E., Rey, O., and Waldron, R.T. (2005). Protein kinase D signaling.
J. Biol. Chem. 280, 13205–13208.
Sharlow, E.R., Giridhar, K.V., LaValle, C.R., Chen, J., Leimgruber, S., Barrett,
R., Bravo-Altamirano, K., Wipf, P., Lazo, J.S., and Wang, Q.J. (2008). Potent
and selective disruption of protein kinase D functionality by a benzoxoloazepi-
nolone. J. Biol. Chem. 283, 33516–33526.
Srivastava, J., Goris, J., Dilworth, S.M., and Parker, P.J. (2002).
Dephosphorylation of PKCdelta by protein phosphatase 2Ac and its inhibition
by nucleotides. FEBS Lett. 516, 265–269.
Toker, A. (2005). The biology and biochemistry of diacylglycerol signalling.
Meeting on molecular advances in diacylglycerol signalling. EMBO Rep. 6,
310–314.
r Ltd All rights reserved


![Diacylglycerol kinase ζ generates dipalmitoyl-phosphatidic ... · kinase C [6], and p21 activated protein kinase 1 [7,8].PAasan intracellular signaling lipid is generated by phosphorylation](https://img.dokumen.tips/doc/110x75/5fe275ed0f93ac2b35696d07/diacylglycerol-kinase-generates-dipalmitoyl-phosphatidic-kinase-c-6-and.jpg)