Embed Size (px)
Citation preview
Ho et al. BMC Systems Biology 2010, 4:84http://www.biomedcentral.com/1752-0509/4/84
Open AccessR E S E A R C H A R T I C L E
Research articleProtein interaction network topology uncovers melanogenesis regulatory network components within functional genomics datasetsHsiang Ho†1, Tijana Milenkovic†2, Vesna Memiševic2, Jayavani Aruri3, Nataša Przulj4 and Anand K Ganesan*1,3
AbstractBackground: RNA-mediated interference (RNAi)-based functional genomics is a systems-level approach to identify novel genes that control biological phenotypes. Existing computational approaches can identify individual genes from RNAi datasets that regulate a given biological process. However, currently available methods cannot identify which RNAi screen "hits" are novel components of well-characterized biological pathways known to regulate the interrogated phenotype. In this study, we describe a method to identify genes from RNAi datasets that are novel components of known biological pathways. We experimentally validate our approach in the context of a recently completed RNAi screen to identify novel regulators of melanogenesis.
Results: In this study, we utilize a PPI network topology-based approach to identify targets within our RNAi dataset that may be components of known melanogenesis regulatory pathways. Our computational approach identifies a set of screen targets that cluster topologically in a human PPI network with the known pigment regulator Endothelin receptor type B (EDNRB). Validation studies reveal that these genes impact pigment production and EDNRB signaling in pigmented melanoma cells (MNT-1) and normal melanocytes.
Conclusions: We present an approach that identifies novel components of well-characterized biological pathways from functional genomics datasets that could not have been identified by existing statistical and computational approaches.
BackgroundIdentifying the complete set of genes that regulate a bio-logical phenotype is a challenge of systems biology. Avail-ability of systems-level protein-protein interaction (PPI),gene expression, and functional genomics (FG) data hasfacilitated the development of integrative computationalapproaches to uncover genes involved in biological pro-cesses [1]. Integration of C. elegans FG data [1] with exist-ing gene expression and PPI data has facilitated thediscovery of co-expressed gene networks [2], earlyembryogenesis control networks [3], and large-scale pro-tein function networks [4]. Integrating Drosophila RNAidatasets with PPI networks helped identify novel func-tional regulators of biological phenotypes, demonstrating
that PPI networks and RNAi datasets can be effectivelyintegrated to derive additional functional informationfrom RNAi screens [5]. Application of these methods tomammalian RNAi datasets has been more problematicsecondary to higher false positive and false negative ratesof mammalian RNAi screens [6]. Biological pathways aredistinct, experimentally-validated subnetworks of pro-teins within the larger PPI network that interact witheach other by well defined mechanisms to regulate a spe-cific biologic phenotype. While currently available meth-ods can identify components of RNAi datasets thatinteract with each other within PPI networks [7], nomethod currently exists to determine which of thesescreen "hits" are novel components of well defined path-ways known to regulate the process under study.
Numerous studies have identified molecular determi-nants of pigment variation: 127 mouse coat color geneshave been identified [8] that coordinately regulate thetranscription, translation, and intracellular trafficking of
* Correspondence: [email protected] Department of Biological Chemistry, University of California, Irvine, CA 92697-1700, USA† Contributed equallyFull list of author information is available at the end of the article
© 2010 Ho et al; licensee BioMed Central Ltd. This is an Open Access article distributed under the terms of the Creative Commons Attri-bution License (http://creativecommons.org/licenses/by/2.0), which permits unrestricted use, distribution, and reproduction in anymedium, provided the original work is properly cited.
Ho et al. BMC Systems Biology 2010, 4:84http://www.biomedcentral.com/1752-0509/4/84
Page 2 of 13
melanogenic enzymes [9]. These studies have identifiedthe master regulator of melanocyte transcriptionmicrophthalmia-associated transcription factor (MITF)[10], several melanogenic enzymes [9], and regulators ofmelanosome formation and trafficking [11]. Despitethese advances, our current understanding of skin andeye color variability is incomplete [12].
Recently, we utilized a systems-level FG platform toidentify 92 novel genes that regulate melanin production,novel regulators of melanin secretion, and novel depig-menting agents [13]. Notably, our approach failed toidentify many known regulators of melanogenesis amongour top tier hits, and annotation data failed to identifyconnections between many screen targets and biologicalpathways known to regulate melanogenesis. In this study,we apply PPI network topology-based computationalmethods to identify genes within our FG dataset that arenovel components of biological pathways known to regu-late melanogenesis.
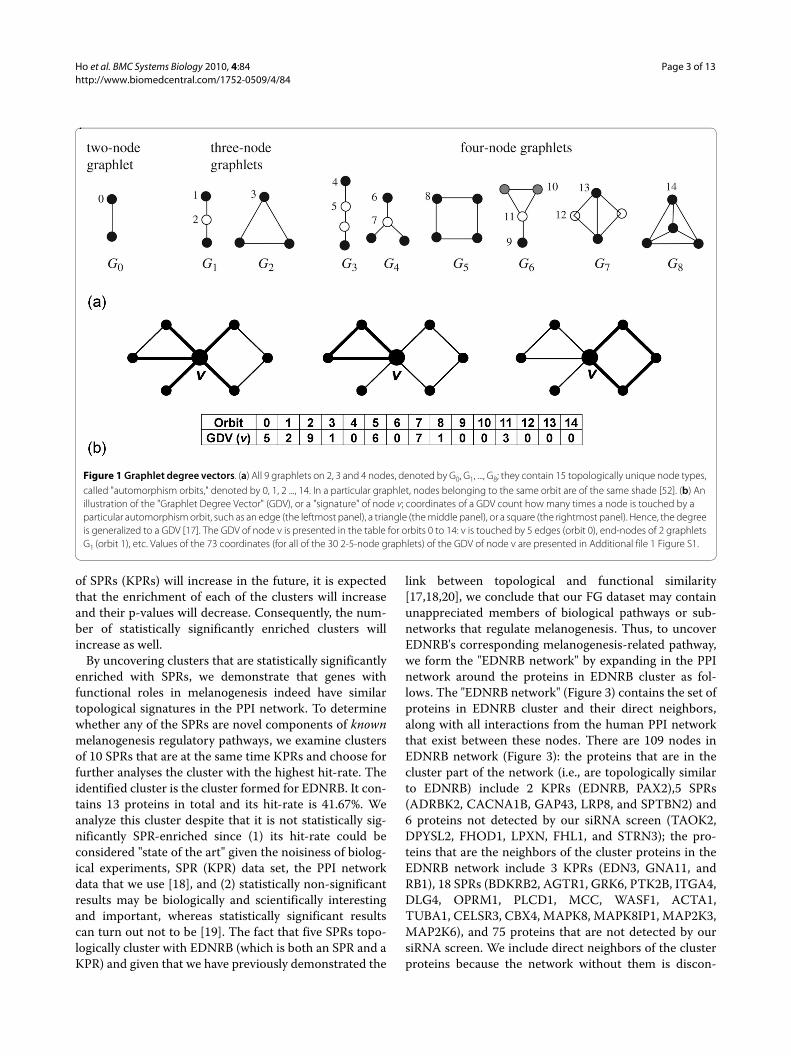
Results and DiscussionTopological similarity uncovers novel melanogenesis-related regulatory network members within a functional genomics datasetIn this study, we examine the interrelationship betweenPPI network topology and both known and newly identi-fied biological pathways that regulate melanogenesis. InPPI networks, nodes correspond to proteins and edgesrepresent possible interactions amongst them. Toincrease the coverage of PPIs, we analyze the union of thephysical human PPI networks from HPRD [14], BioGRID[15], and by Radivojac et al. [16], consisting of 47,303interactions amongst 10,282 proteins. We characterizethe topology of nodes' neighborhoods in the PPI networkwith their "graphlet degree vectors" (GDVs) [17];graphlets are small connected induced subgraphs of anetwork (Figure 1). GDV of a node, also called the node"signature," generalizes the degree of a node that countshow many edges the node touches into the vector ofgraphlet degrees that counts how many graphlets of agiven type, such as a triangle or a square, the nodetouches (see Figure 1 and additional file 1 Figure S1 for anillustration). All 2-5-node graphlets, presented in Figure 1and additional file 1 Figure S1, are taken into account.Clearly, the degree of a node is the first coordinate in thisvector, since an edge (graphlet G0 in Figure 1) is the only2-node graphlet. To take into account the symmetrygroups within a graphlet, the notion of automorphismorbits (or just orbits, for brevity) is used for all graphletswith 2-5-nodes. For example, it is topologically relevantto distinguish between nodes touching a 3-node linearpath (graphlet G1 in Figure 1) at an end, or at the middlenode. By taking into account these symmetries betweennodes of a graphlet, there are 73 different orbits for 2-5-
node graphlets, numbered from 0 to 72 in Figure 1 andadditional file 1 Figure S1. Thus, GDV of a node, describ-ing the complex topological wiring of node's up to "4-deep neighborhood," has 73 coordinates [17]. We com-pute pairwise "similarities" between GDVs; higher signa-ture similarity corresponds to higher topologicalsimilarity of the nodes' "network surroundings" (see [17]for details). We say that two proteins are "signature-simi-lar" if their GDV similarity is above a given threshold.This measure has been used to demonstrate that topolog-ically similar proteins have similar functions [17,18].
To find proteins topologically similar to known mel-anogenesis regulators in the context of the PPI network,we compute GDVs for pigment regulators identified inour siRNA screen (henceforth called Screen PigmentRegulators (SPRs)). As previous studies demonstratedthat many known pigment regulators (KPRs) were notpresent in our top tier targets but did have some impactson pigment production [13], we define SPRs as geneswhose siRNAs have some impact on pigment production(Z-score < -1 or >1) (Additional File 2 Table S1). 1,244SPRs are present in the existing PPI network. Also, theexisting PPI network contains 41 KPRs from the ESPCRdatabase, 10 of which are SPRs at the same time [8]. Wenote that a choice of a higher Z-score threshold might bemore appropriate; however, such a choice omitted severalKPRs from the analyzed dataset and resulted in a limitednumber of SPRs in the dataset that was insufficient forany statistical analysis.
To identify specific melanogenesis regulatory subnet-works hidden in our FG dataset, we identify SPRs withsimilar GDVs in the PPI network, with the hypothesisthat some signature-similar SPRs would be componentsof the same protein subnetwork. For each SPR, we form a"cluster" containing that protein and all other proteins inthe network that are signature-similar to it (see Meth-ods). Thus, the clusters contain proteins that have similartopologies within the PPI network. We measure the sta-tistical significance of SPRs to cluster together. Wedenote by "hit-rate" the percentage of proteins in a clusterthat are SPRs, excluding the protein for which the clusterwas formed (see Methods and Figure 2). We find that 26of our clusters are statistically significantly enriched withSPRs at p-value threshold of SPR-enrichment of 0.05 (seeMethods); the list of proteins for which the clusters wereformed, together with their hit-rates and p-values, is pro-vided in additional file 3 Table S2. By analyzing randomclusters (see Methods) and by using the same enrichmentand statistical significance criteria, we find that it isunlikely to observe 26 statistically significantly SPR-enriched clusters by chance (p-value = 0.009; see Meth-ods). Note that the relatively low number of statisticallysignificantly SPR-enriched clusters is expected due toincompleteness of SPR (KPR) data set. Since the number
Ho et al. BMC Systems Biology 2010, 4:84http://www.biomedcentral.com/1752-0509/4/84
Page 3 of 13
of SPRs (KPRs) will increase in the future, it is expectedthat the enrichment of each of the clusters will increaseand their p-values will decrease. Consequently, the num-ber of statistically significantly enriched clusters willincrease as well.
By uncovering clusters that are statistically significantlyenriched with SPRs, we demonstrate that genes withfunctional roles in melanogenesis indeed have similartopological signatures in the PPI network. To determinewhether any of the SPRs are novel components of knownmelanogenesis regulatory pathways, we examine clustersof 10 SPRs that are at the same time KPRs and choose forfurther analyses the cluster with the highest hit-rate. Theidentified cluster is the cluster formed for EDNRB. It con-tains 13 proteins in total and its hit-rate is 41.67%. Weanalyze this cluster despite that it is not statistically sig-nificantly SPR-enriched since (1) its hit-rate could beconsidered "state of the art" given the noisiness of biolog-ical experiments, SPR (KPR) data set, the PPI networkdata that we use [18], and (2) statistically non-significantresults may be biologically and scientifically interestingand important, whereas statistically significant resultscan turn out not to be [19]. The fact that five SPRs topo-logically cluster with EDNRB (which is both an SPR and aKPR) and given that we have previously demonstrated the
link between topological and functional similarity[17,18,20], we conclude that our FG dataset may containunappreciated members of biological pathways or sub-networks that regulate melanogenesis. Thus, to uncoverEDNRB's corresponding melanogenesis-related pathway,we form the "EDNRB network" by expanding in the PPInetwork around the proteins in EDNRB cluster as fol-lows. The "EDNRB network" (Figure 3) contains the set ofproteins in EDNRB cluster and their direct neighbors,along with all interactions from the human PPI networkthat exist between these nodes. There are 109 nodes inEDNRB network (Figure 3): the proteins that are in thecluster part of the network (i.e., are topologically similarto EDNRB) include 2 KPRs (EDNRB, PAX2),5 SPRs(ADRBK2, CACNA1B, GAP43, LRP8, and SPTBN2) and6 proteins not detected by our siRNA screen (TAOK2,DPYSL2, FHOD1, LPXN, FHL1, and STRN3); the pro-teins that are the neighbors of the cluster proteins in theEDNRB network include 3 KPRs (EDN3, GNA11, andRB1), 18 SPRs (BDKRB2, AGTR1, GRK6, PTK2B, ITGA4,DLG4, OPRM1, PLCD1, MCC, WASF1, ACTA1,TUBA1, CELSR3, CBX4, MAPK8, MAPK8IP1, MAP2K3,MAP2K6), and 75 proteins that are not detected by oursiRNA screen. We include direct neighbors of the clusterproteins because the network without them is discon-
Figure 1 Graphlet degree vectors. (a) All 9 graphlets on 2, 3 and 4 nodes, denoted by G0, G1, ..., G8; they contain 15 topologically unique node types, called "automorphism orbits," denoted by 0, 1, 2 ..., 14. In a particular graphlet, nodes belonging to the same orbit are of the same shade [52]. (b) An illustration of the "Graphlet Degree Vector" (GDV), or a "signature" of node v; coordinates of a GDV count how many times a node is touched by a particular automorphism orbit, such as an edge (the leftmost panel), a triangle (the middle panel), or a square (the rightmost panel). Hence, the degree is generalized to a GDV [17]. The GDV of node v is presented in the table for orbits 0 to 14: v is touched by 5 edges (orbit 0), end-nodes of 2 graphlets G1 (orbit 1), etc. Values of the 73 coordinates (for all of the 30 2-5-node graphlets) of the GDV of node v are presented in Additional file 1 Figure S1.

Ho et al. BMC Systems Biology 2010, 4:84http://www.biomedcentral.com/1752-0509/4/84
Page 4 of 13
nected. Also, since biological pathways are contiguous"linear" structures in PPI networks, including them willaid in detecting new members of a biological pathway.
An alternative approach to finding new pathway mem-bers would be to consider simply an SPR and its directneighbors as cluster members, since it has been shownthat proteins that are closer in the network (i.e., directneighbors) are more likely to be functionally similar (i.e.,involved in a same biological process) than proteins thatare further apart in the network [20]. Every clusterdefined in this way would topologically be somewherebetween a "star-like" network structure centered at thechosen SPR (as illustrated in Additional File 4 Figure S2that presents the EDNRB cluster obtained by this "directneighborhood" approach) and a fully connected network.That is, network clusters obtained with the direct neigh-borhood approach would have the diameter of either 1 or2, where the diameter is defined as the maximum ofshortest path lengths between all node pairs in the net-
work. However, we tested all biological pathways fromKEGG [21] mapped onto the human PPI network to com-pare their diameters with the diameters of the directneighborhood-based clusters. Due to the incompletenessof the PPI network data, about 30% of KEGG pathwayswere consisting mainly of isolated edges after they weremapped onto the human PPI network; hence, weremoved these pathways from our analysis. For theremaining 70% of the mapped pathways, we found that93% of them have diameters larger than 2. The distribu-tion of diameters of these pathways was bell-shaped, withthe average of 6.24 and the standard deviation of 2.6.Therefore, since pathways correspond to parts of PPI net-works that are of relatively large diameters, the simpledirect neighborhood approach is not appropriate forfinding new pathway members, since it can only producesubgraphs of small diameters. Hence, other approachesshould be sought. In contrast, our GDV-based methodgenerates EDNRB network of diameter 9. Also, sinceGDVs are based on all up to 5-node graphlets hence cov-ering parts of the PPI network of diameter < 9 around anSPR of interest, the GDV-based approach is more appro-priate for finding new pathway members than the directneighborhoods.
With our GDV-based approach, in addition to the pro-teins in the cluster formed for a given SPR, we includeinto the SPR's "network" (defined above) the direct neigh-bors of proteins in the cluster to make the network con-nected; note that by doing so, we are indirectly takinginto account the fact that direct neighbors are more likelyto be involved in a same biological process than proteinsthat are further apart in the network [20]. For compari-son, we perform the equivalent procedure for the directneighborhood approach and evaluate whether thisincreases the diameters of such "expanded" direct neigh-borhood-based subnetworks. However, even if weinclude direct neighbors of the SPR's direct neighborsinto the cluster, the diameter of the resulting networkswould be between 1 and 4. Even if the resulting subnet-works would have the diameter of 4, that diameter isalmost one standard deviation below the average diame-ter of known biological pathways (which is 6.24, as statedabove). In contrast, our GDV-based approach producesPPI subnetworks with diameters between 5 and 9, withthe average of 6.33 and the standard deviation of 1.5, thusmimicking well the diameters of known biological path-ways.
Validation of novel melanogenesis regulatory genes identified by topological clustering analysisTopological clustering identified both SPRs and poten-tially novel pigment regulators that are components ofthe EDNRB network. As EDNRB and GNA11 siRNAimpact pigment formation in our screen and regulate
Figure 2 Application of protein interaction network topology to uncover novel melanogenesis gene networks from functional ge-nomics data. Step-by-step methodology diagram is presented.

Ho et al. BMC Systems Biology 2010, 4:84http://www.biomedcentral.com/1752-0509/4/84
Page 5 of 13
melanogenesis by well-characterized mechanisms, wenext sought to experimentally validate novel EDNRBpathway components identified by our method. EDNRB,a g-protein coupled receptor mutated in Waardenburg-Shah syndrome [22], binds to EDN3 [23] and activates anintracellular signaling cascade via GNA11 [24]. Activa-tion of EDNRB leads to PKC activation, and subsequentERK phosphorylation. Phosphorylated ERK can eitheractivate MITF by protein phosphorylation, or up-regulateMITF transcription through CREB phosphorylation[25,26]. MITF directly activates the expression of manymelanogenesis regulators, such as tyrosinase, the rate-limiting enzyme in melanin synthesis [27]. In addition toregulating melanogenesis, EDNRB plays a critical role in
neural crest development [28]. As some proteins thatinteract with EDNRB may impact neural crest develop-ment as opposed to melanogenesis, we focused on vali-dating proteins in the EDNRB network most likely todirectly impact melanogenesis. For this analysis, we selecthalf of the SPRs most likely to directly regulate melano-genesis (Z-score < -1) from Figure 3: two SPRs in the clus-ter (EDNRB, CACNA1B), and four SPRs adjacent to thecluster (PTK2B, AGTR1, PLCD1, OPRM1). We then vali-date known regulators of pigmentation in our experimen-tal system (PAX2, EDNRB, GNA11, EDN3), and examineother proteins in the EDNRB network not identified inour FG screen (FHOD1, DPYSL2, TAOK2, FHL1, RING1,CXCR4).
Figure 3 EDNRB network containing proteins in the EDNRB cluster and their direct neighbors, as well as all interactions from the human PPI network that exist between these nodes. Known pigment regulators (KPRs) from the ESPCR database and screen pigment regulators (SPRs) are noted.

Ho et al. BMC Systems Biology 2010, 4:84http://www.biomedcentral.com/1752-0509/4/84
Page 6 of 13
To experimentally validate our computational observa-tions, we transfect MNT-1 cells with three siRNAsdirected towards each gene or control siRNAs. The abil-ity of each target siRNA to inhibit pigment production iscompared to tyrosinase siRNA to control for the efficacyof siRNA transfection and the background absorbance ofMNT-1 cells [13]. In this analysis, we utilize differentsiRNA sequences than those used in the initial FG screen(Additional File 3 Table S2) to further exclude any pheno-types from the initial screen that were the result of RNAioff-target effects. We also utilize a more robust cutoff toidentify pigment regulators (~50% normalized pigmentproduction) to identify only those genes with significantimpacts on pigment production. SiRNAs targeting KPRs(EDNRB, GNA11, PAX2, EDN3) have impacts on pig-ment production, consistent with published studies. Amajority of analyzed SPRs (86%) from EDNRB network(PTK2B, AGTR1, PLCD1, OPRM1) have significantimpacts on pigment production observed with more thanone oligonucleotide sequence, indicating that the pheno-types are not secondary to RNAi off-target effects (Figure4a). Other proteins from EDNRB cluster (FHOD1,DPYSL2, TAOK2, FHL1) have a high retest rate as well(100%) (Figure 4a). The one gene that did not impact pig-mentation in this analysis (CACNA1B) is a regulator ofpostganglionic synaptic transmission [29], an EDNRBneurologic phenotype independent of melanogenesis[30]. These results demonstrate that our EDNRB networkcontains newly defined regulators of pigment production(PTK2B, AGTR1, PLCD1, OPRM1, FHOD1, DPYSL2,TAOK2, FHL1, RING1, CXCR4).
Impact of novel EDNRB pathway components on downstream signalingOur RNAi validation studies (Figure 4a) identified genesin the EDNRB network that impact pigment production.Based on functional annotation (Table 1), we next select10 pigment regulators from Figure 4a to verify that thesegenes impact pigment production by impacting EDNRBsignaling. Quantitative RT-PCR was utilized to determinethe impact of each siRNA on its cognate target. RT-PCRvalidation studies were performed at two different time-points to account for the potential differences in half-lifeof an individual mRNA. Our validation studies revealedthat each siRNA inhibited the expression of the targetgene at either 24 or 48 hours after siRNA transfection(Figure 4b). SiRNAs directed towards known EDNRBpathway components (EDNRB, EDN3, and GNA11)impact MITF protein levels, consistent with publishedstudies [26] (Figure 4c). Similarly, novel EDNRB pathwaycomponents (FHOD1, TAOK1, AGTR1, RING1,DPYSL2, PLCD1) impact MITF protein levels, suggestingthat these genes may have similar impacts on pigmentproduction. Activation of the EDNRB pathway leads to
increased MITF expression through p-CREB or leads toactivation of MITF protein through phosphorylation [26].In the simplest model, genes that impact MITF phospho-rylation will impact tyrosinase expression while genesthat impact MITF expression will impact both MITF andtyrosinase expression. Therefore, we would predict thatsiRNAs that inhibit MITF phosphorylation would haveimpacts on tyrosinase expression but not MITF expres-sion, while siRNAs that impact CREB phosphorylationwould inhibit both tyrosinase and MITF expression. Tofurther validate this assertion, we examine the impact ofeach siRNA on the mRNA expression of MITF and tyro-sinase. EDNRB, EDN3, and GNA11 have modest impactson both MITF and tyrosinase expression, as predicted.Most of the other siRNAs examined impact on bothMITF and tyrosinase expression, with the exception ofDPYSL2 (Figure 5a).
To determine the role of individual targets in EDNRBsignaling, we examined whether the 9 genes (EDNRB,GNA11, EDN3, FHOD1, TAOK1, AGTR1, RING1,PTK2B, and PLCD1) that impact MITF and tyrosinasemRNA expression also impact CREB phosphorylation.Previous studies have determined that MNT-1 melanomacells contain a BRAF mutation resulting in constitutiveERK activity [31]. Therefore, we would predict that themajority of EDNRB pathway components that impactpigment production in MNT-1 cells would do so viaimpacts on CREB phosphorylation, as the ERK pathwayleading to MITF phosphorylation is constitutively active.Treatment of MNT-1 cells with EDNRB, EDN3, andGNA11 siRNAs impacts CREB phosphorylation but notERK phosphorylation (Figure 5b). Similarly, TAOK1,PTK2B, FHOD1 and PLCD1 siRNAs inhibit CREB phos-phorylation (Figure 5b). Published studies support thenotion that these four genes are components of theEDNRB signaling network upstream of CREB phospho-rylation. Serine/threonine-protein kinase TAO1(TAOK1) activates the p38 MAP kinase pathway throughthe specific activation of the upstream MKK3 kinase [32].This signaling pathway activates p38 leading to CREBphosphorylation in melanocytes [33,34]. It also is knownthat Protein tyrosine kinase 2 beta (PTK2B) activationleads to ERK1/2 activation [35]. In turn, ERK1/2 phos-phorylates p90rsk, which phosphorylates CREB [34,36].Endothelins promote dendrite formation facilitating mel-anosome transport from melanocytes to keratinocytes[37,38], processes that require extensive actin cytoskeletalreorganization [39,40]. Formin homology 2 domain con-taining 1 (FHOD1), a protein with several potential PKCphosphorylation sites [41], directly binds to F-actin andplays a role in actin cytoskeleton organization [42] andcell elongation [43]. Additionally, FHOD1 activates ERKinducing changes in gene expression [44]. Our studies

Ho et al. BMC Systems Biology 2010, 4:84http://www.biomedcentral.com/1752-0509/4/84
Page 7 of 13
implicate FHOD1 as a potential player in endothelinmediated actin-cytoskeletal reorganization.
Upon endothelins binding to endothelin receptors ofmelanocytes, phospholipase C is activated [45] and initi-ates subsequent activation of protein kinase C and ERKpathways. Phospholipase C delta-1 (PLCD1) hydrolyzesphosphatidylinositol 4,5-bisphosphate (PIP2) to generatetwo second messengers: diacylglycerol (DG) and inositol1,4,5-trisphosphate (IP3) [46]. DG mediates the activa-tion of protein kinase C (PKC), and IP3 releases calciumfrom intracellular stores, which in turns activate ERK[47]. In melanocytes, PLC antagonist U73122 inhibitsendothelin-1-induced intracellular calcium rise and ERKphosphorylation [48,49], providing direct evidence thatphospholipase C activity impacts endothelin-induced sig-naling in primary melanocytes. Analysis of gene annota-tion data reveals that PLCD1 is a phospholipase C
homologue that may function directly downstream ofGNA11 (Table 1). As PLC activity impacts EDNRB sig-naling in melanocytes, we sought to examine whetherPLCD1 was the PLC isoform that impacts EDNRB signal-ing in normal melanocytes. Depletion of PLCD1 in nor-mal melanocytes impacts MITF protein levels (Figure 5c).Additionally, we demonstrate that PLCD1 siRNA inhibitsCREB phosphorylation in the context of EDNRB receptorstimulation, consistent with the hypothesis that PLCD1 isupstream of the CREB phosphorylation event. Theseresults demonstrate that some components in ourEDNRB network participate in EDNRB signaling in nor-mal and cancer cells (Figure 5d).
In this study, we apply a PPI network topology-basedapproach that utilizes GDVs to identify novel compo-nents of melanogenesis regulatory pathways. Relatedapproaches that detect biological function from PPI net-
Figure 4 Identification of novel EDNRB network components that impact melanogenesis. (a) Genes from EDNRB network are examined for their impact on pigment production in MNT-1 cells. The impact of each siRNA on pigment production is calculated as described in [14] relative to control (c) and tyrosinase (TYR) siRNA treated cells using a normalized percent inhibition calculation. (b) Ten genes are selected from panel (a) that have > 50% NPI, and are not the result of siRNA off-target effects (2/3 of oligos have > 50% inhibition). The efficacy of protein knockdown for 10 pooled siRNAs directed towards these genes is measured by quantitative RT-PCR at both 24 and 48 hours after transfection. The timepoint where maximum inhibition of expression is observed is reported. AGTR1 mRNA level after siRNA treatment is below the detection limit and is not reported. Control siRNAs are depicted with a black bar, and target siRNAs with a white bar. *, p < 0.05. **, p < 0.01. (c) Both EDNRB and selected novel EDNRB network components impact the MITF protein levels in MNT-1 cells. MNT-1 cells are transfected with the indicated siRNAs for 96 hours followed by immuno-blotting with MITF and ERK antibody as shown.

Ho et al. BMC Systems Biology 2010, 4:84http://www.biomedcentral.com/1752-0509/4/84
Page 8 of 13
work topology rely on simpler network properties such asdirect neighbors of nodes and shortest path distances[20,50]. Since none of the 6 SPRs in EDNRB cluster areadjacent in the PPI network, but are at distance three orfour from each other, they could not have been topologi-cally clustered together by analyzing only their neighborsor distances in the PPI network. Additionally, as men-tioned above, examining only direct neighbors of an SPRis not appropriate for constructing its underlying melano-genesis-related pathway.
Although GDV-based computational method hasalready been used to demonstrate that topologically simi-lar proteins share common biological properties such asprotein function or involvement in cancer [17,18], in thispaper, we provide a novel application of the method,namely identifying novel components of biological path-ways known to regulate melanogenesis. We use this graphtheoretic method to identify proteins with similar topo-logical signatures to known pigment regulators and toconstruct the corresponding melanogenesis-related sub-
networks. Most importantly, we experimentally validatethat the novel components of these melanogenesis-related subnetworks are components of the EDNRB path-way in both pigmented melanoma cells and normal mel-anocytes.
ConclusionsIn this study, we utilize a PPI network topology-basedcomputational approach to identify a set of novel EDNRBpathway components. Using RNAi-based approaches, wevalidate that some of the proteins in EDNRB networkimpact melanogenesis, demonstrating that topologicalclustering approaches can uncover additional compo-nents of known regulatory networks. SPRs that clusterwith EDNRB have similar impacts on MITF protein lev-els, on MITF and tyrosinase expression, and on CREBphosphorylation, indicating that they are likely compo-nents of the same biological pathway. Validation ofPLCD1, a potent regulator of MITF in MNT-1 cells,reveals that novel EDNRB pathway component identified
Table 1: Annotation of genes identified in EDNRB network.
Symbol Comments Motifs Z-score
EDNRB Endothelin receptor type B. Mutation causes Hirschsprung disease type 2 (HSCR2) [MIM:600155]
7tm_1 -1.1
GNA11 G-protein activates phospholipase C in endothelin pathway
Gα -1.9
EDN3 Ligand for endothelin receptor type B EDN 0.2
PLCD1 Phospholipase produces diacylglycerol and inositol 1,4,5-trisphosphate in endothelin pathway
PH-PLC, C2_2, EFh -1.5
TAOK1 Kinase activates the p38 MAP kinase pathway in endothelin pathway
SbcC, STKc_TAO -0.2
PTK2B Kinase regulates ion channel and activation of the MAP kinase signaling pathway in endothelin pathway
PTKc_FAK, FERM_M. Focal_AT, B41, Pkinase_Tyr -1.9
AGTR1 Receptor for angiotensin II; defect causes renal tubular dysgenesis (RTD) [MIM:267430]
7tm_1 -1.7
RING1 E3 ubiquitin-protein ligase for histone H2A RING-finger 0.5
FHOD1 Required for the assembly of F-actin structures FH, GBD 0.2
DPYSL2 Signaling by class 3 semaphorins and subsequent remodeling of the cytoskeleton
D-HYD -0.5
Gene Ontology Database is used to assess function and identify conserved domains within the corresponding proteins. Z-scores are calculated based on the initial screen data [14].

Ho et al. BMC Systems Biology 2010, 4:84http://www.biomedcentral.com/1752-0509/4/84
Page 9 of 13
in MNT-1 cells impact EDNRB signaling in normal mel-anocytes. Our study demonstrates that integration of PPInetwork topology-based algorithms with functionalgenomics datasets is a fruitful method to enhance our
systems-level understanding of biological phenotypes. Inthe future this method may be used to place targets iden-tified in RNAi screens within the context of known bio-logical pathways that regulate the system under study,
Figure 5 Computationally derived EDNRB network components impact EDNRB signaling through CREB phosphorylation. (a) Novel EDNRB network components impact both tyrosinase and MITF expression. MNT-1 melanoma cells are transfected with pooled siRNAs and relative MITF (black bar) and Tyrosinase (gray bar) expression is measured by quantitative RT-PCR 96 hours after transfection. *, p < 0.05. **, p < 0.01. (b) Novel components of the EDNRB network impact CREB phosphorylation. Lysates from MNT-1 cells treated with the indicated pooled siRNAs are subjected to immunob-lotting with the indicated antibodies. (c) PLCD1 impacts MITF protein levels in melanocytes. Lysates from PLCD1 siRNA transfected melanocytes are subjected to immunoblotting with the indicated antibodies. (d) PLCD1 impacts CREB phophorylation in normal human melanocytes. Lysates from melanocytes transfected with the indicated siRNAs followed by EDNRB stimulation (treatment with 10 mM Endothelin-1 for 5 minutes) are subjected to immunoblotting with the indicated antibodies.

Ho et al. BMC Systems Biology 2010, 4:84http://www.biomedcentral.com/1752-0509/4/84
Page 10 of 13
deriving additional relevance from systems-level RNAidatasets.
MethodsCell cultureMNT-1 melanoma cells were a gift of M. Marks (Univer-sity of Pennylvania) and were cultured in DMEM (Invit-rogen) with 15% fetal bovine serum (Hyclone), 10% AIM-V medium (Invitrogen), 1xMEM (Invitrogen) and 1 ×antibiotic/antimycotic (Invitrogen). Darkly pigmentedhuman neonatal epidermal melanocytes (Cascade Biolog-ics) were cultured in Medium 254 with the melanocytespecific HMGS supplement (Cascade Biologics) and 0.1mM 3-Isobutyl-1-methylxanthine (IBMX).
Protein clustering via topological similarity measureIn our study, we focus on proteins with more than threeinteracting partners in the PPI network, since poorly con-nected proteins are more likely to reside in incompleteparts of PPI networks [17,18]. However, to account forthe entire topology of the PPI network, when GDVs arecomputed, all proteins and interactions in the PPI net-work are taken into account. There are 5,423 proteinswith degrees higher than three in the network, out ofwhich 1,244 are SPRs, and 41 are KPRs contained in theESPCR database [8]; 10 SPRs are KPRs at the same time.The code for computing GDVs [17] is available in Graph-Crunch [51], an open source software tool for large net-work modeling and analyses.
We perform the GDV-based clustering as follows: foreach of the 1,244 SPRs with degrees greater than 3 in thePPI network, we identify a cluster containing that proteinand all other proteins in the network having degreeshigher than 3 that are topologically similar to it, i.e., thathave GDV similarities with the protein of interest above athreshold; thresholds between 90% and 95% have beenused previously [17]. We find the highest threshold atwhich a node is clustered with at least one more node byperforming the following: (1) we initially set the signaturesimilarity threshold to 96%; (2) if the SPR for which thecluster is formed is signature-similar with at least onemore node at the given threshold, we create the clustercontaining these nodes and the SPR; (3) if a protein ofinterest is not signature-similar with any other protein ata given threshold, we decrease the threshold and repeatsteps 2 and 3; (4) we stop the clustering process for agiven SPR when its cluster has been formed; we decreasethe threshold down to 90% searching for non-empty clus-ters, but not below 90%; if a protein is not signature-simi-lar with any other protein at the lowest threshold of 90%,we do not form a cluster for that protein. We try to formclusters for all 1,244 SPRs. However, 263 of them are not90% signature similar to any other nodes in the PPI net-work. Additional 237 of them cluster only with one other
node. Thus, we analyze clusters of size 3 or more formedfor 743 SPRs. The minimum threshold of 90% for signa-ture similarity was chosen because it has been empiricallyshown that for higher thresholds, only a few small clus-ters are obtained, indicating too high stringency in signa-ture similarities, whereas for lower thresholds, clustersare very large, indicating a loss of signature similarity[17].
In each cluster formed in this fashion, we measure theenrichment of SPRs. We define the "hit-rate" of a clusteras the percentage of proteins in the cluster that are SPRs,excluding the protein of interest. We also compute thestatistical significance of observing a given hit-rate in thecluster, measuring the probability that the cluster isenriched by a given number of SPR proteins purely bychance. This probability (p-value) is computed as follows.The total number of proteins in the PPI network withdegrees higher than 3 is N = 5,422 (excluding the SPR forwhich the cluster was formed) and there are S = 1,243SPRs with degrees higher than 3 (excluding the SPR forwhich the cluster was formed). We use the followingnotation: the size of a cluster of interest is C, excludingthe protein for which the cluster was formed; the numberof proteins in the cluster that are SPRs is k, excluding theprotein for which the cluster was formed. The hit-rate ofthe cluster is k/|C|, and the p-value for the cluster, i.e., theprobability of observing the same or higher hit-ratepurely by chance is:
Depending on a method and its application, sensiblecut-offs for p-values were reported to range from 10-2 to10-8 [52]. We find that 26 out of 743 clusters formed forSPRs are enriched with SPRs with p-values of SPR enrich-ment below 0.05. Since we perform statistical testing on743 clusters, we believe that the reported p-values do notneed to be corrected for multiple testing.
Given that 26 of our clusters are statistically signifi-cantly SPR-enriched at p-value threshold of 0.05, wecompute the probability of observing 26 statistically sig-nificantly SPR-enriched clusters by chance (i.e., statisticalsignificance). For each of the 743 SPRs, we create "ran-dom" clusters of the same size as the correspondingGDV-based clusters. Then, we measure statistical signifi-cance of SPR enrichment in these random clusters. Sincethe clusters are random, we repeat the randomizationprocedure 1,000 times. We find that only in 9 out of the1,000 runs, 26 or more clusters are statistically signifi-cantly enriched with SPRs, leading to empirical (fre-
p value
S
i
N S
C iN
C
i
k− = −
⎛
⎝⎜
⎞
⎠⎟
−−
⎛
⎝⎜
⎞
⎠⎟
⎛
⎝⎜
⎞
⎠⎟
=
−∑10
1

Ho et al. BMC Systems Biology 2010, 4:84http://www.biomedcentral.com/1752-0509/4/84
Page 11 of 13
quency) probability of 0.009 for observing 26 or morestatistically significantly SPR-enriched clusters by chance.Furthermore, since the distribution of the number of sta-tistically significantly SPR-enriched random cluster overthe 1,000 runs is bell-shaped, we use the formula for com-puting Z-score to standardize our observation in the dataof having 26 statistically significantly SPR-enriched clus-ters. Then, we use the normal distribution table to com-pute the p-value corresponding to the resulting Z-score.If we denote by x = 26 the raw score to be standardized,by μ= 15.45 the mean of the (random) population, i.e., theaverage over the 1,000 runs of the number of randomclusters that are statistically significantly SPR-enriched,and by σ = 4.03 the standard deviation over the 1,000runs, we get Z-score of 2.62. Using the normal distribu-tion table, we find that this Z-score corresponds to the p-value of 0.0044; that is, in this way, we find that the prob-ability of observing 26 or more statistically significantlySPR-enriched clusters at random is lower than 0.0044.
SiRNA transfectionFor western blot analysis, 6 × 10⁴ MNT-1 cells were trans-fected with 75 nM pooled siRNAs using a Dharmafect-2transfection reagent as previously described [13]. Simi-larly, 6 × 10⁴ melanocytes were transfected with 12.5 nMpooled siRNAs (two) toward each gene using a HiPerFecttransfection reagent as previously described [13]. For pig-ment measurement, 1 × 10⁴ MNT-1 cells were trans-fected with 8 nM pooled siRNAs (two siRNAs) using aDharmafect-2 transfection reagent as described. We per-formed each transfection in triplicate. For RT-qPCR, weused 4 × 10³ MNT-1 cells in the same 96-well format. Weobtained pooled siRNAs for tyrosinase from Dharmacon,and all the other siRNAs from Ambion. A list of all siRNAsequences are contained in Additional File 5 Table S3.
Pigment measurement and data normalizationFor pigment measurement, we transfected MNT-1 cellswith the corresponding siRNA in 96 well plates and incu-bated them for 120 hours at 37°C/5% CO2. Subsequently,we removed 100 ul of the medium from each well andadded 15 ul of CellTiter-Glo Reagent (CTG) (Promega) toeach well according to the manufacturer's protocol. Wemeasured luminescence and absorbance at 405 nm foreach well of the 96 well plate using a DTX800 MultimodeDetector (Beckman Coulter). We normalized absorbancevalues with raw luminescence values that are propor-tional to cell number to determine relative pigment percell. We calculated a normalized percent inhibition fromthese values to account for the background absorbance ofMNT-1 cells and variability in transfection. Normalizedpercent inhibition (NPI) = [(Pigment Index non-targeting con-
trol siRNA -Pigment Index sample)/(Pigment Index non-targeting
control -Pigment Index tyrosinase siRNA)] × 100%. We use astudent's t-test to calculate the p-values of each samplev.s. non-targeting control.
ImmunoblottingFor our immunoblotting experiments, MNT-1 cells 96hrs post-transfection and melanocytes 144hrs post-trans-fection were lysed in RIPA buffer supplied with proteasesinhibitors cocktail, PMSF and sodium orthovanadate(Santa Cruz Biotechnology). For experiments in melano-cytes looking at downstream EDNRB signaling, wetreated melanocytes with 10 μM Endothelin-1 for 5mins.After boiling with sample buffer, we loaded the samplesto 4-20% SDS-PAGE and subjected them to western blot-ting with anti-MITF (C5, Santa Cruz Biotechnology),anti-phospho-ERK1/2 (Cell Signaling Technologics),anti-phospho-CREB (Cell Signaling Technologics), anti-alpha/beta-tubulin (Cell Signaling Technologics) andanti-beta-actin (Cell Signaling Technologics) antibodies.
Quantitative RT-PCR96hrs after siRNA transfection, we prepared cDNA fromMNT-1 cells using a Cells-to-Ct kit (Ambion) accordingto the manufacterer's protocol. For measurement ofsiRNA knockdown efficiency, we prepared cDNA fromMNT-1 cells 48 hrs after transfection for most of thegenes except RING1, FHOD1, TAOK1 at 24 hrs to cap-ture the impact in different mRNA kinetics. We added analiquot of each cDNA reaction to each Taqman mastermix reaction along with the appropriate primer andprobe set purchased from Applied Biosystems per themanufacturer's protocol (Applied Biosystems). Primersand probes sequences are listed in Additional File 6 TableS4. We utilized a 7900HT Fast Real-Time PCR System(Applied Biosystems) to determine Ct values. We normal-ized values by human beta-actin Ct values and analyzedour data using the relative quantification mathematicalmodel (Pfaffl).
Additional material
Additional file 1 Figure S1: (a) All 30 graphlets on 2 to 5 nodes; they contain 73 topologically unique node types, called "automorphism orbits". In a particular graphlet, nodes belonging to the same orbit are of the same shade [52]. (b) An illustration of the "Graphlet Degree Vector" (GDV), or a "signature" of node v; coordinates of a GDV count how many times a node is touched by a particular automorphism orbit, such as an edge (the leftmost panel), a triangle (the middle panel), or a square (the rightmost panel). Hence, the degree is generalized to a GDV [17]. The GDV of node v is presented in the table for orbits 0 to 72: v is touched by 5 edges (orbit 0), end-nodes of 2 graphlets G1 (orbit 1), etc.
Additional file 2 Table S1: siRNAs from our genome wide siRNA screen with Z-score < -1 or > 1.Additional file 3 Table S2: Proteins that form the cluster.Additional file 4 Figure S2: EDNRB cluster obtained by considering its direct neighbors in the PPI network. Unlike the EDNRB network obtained with our GDV-based approach, this network is clearly a star-like network structure centered around EDNRB. This structure is unlikely to represent a biological pathway, since its diameter, defined as the maximum of shortest path distances between all node pairs in the network, is 2, whereas we find that about 93% of real human biological pathways from KEGG [21], when mapped onto the human PPI network, have diameters larger than 2, with the average of 6.24 and the standard deviation of 2.6.Additional file 5 Table S3: siRNA sequences used in this study.Additional file 6 Table S4: qPCR probe sequences used in this study.

Ho et al. BMC Systems Biology 2010, 4:84http://www.biomedcentral.com/1752-0509/4/84
Page 12 of 13
AbbreviationsRNAi: RNA-mediated interference; siRNA: small interfering RNA; RT-PCR:reverse-transcription polymerase chain reaction; PPI: protein-protein interac-tion; FG: functional genomics; EDNRB: Endothelin receptor type B; MITF:microphthalmia-associated transcription factor; SPR: screen pigment regulator;KPR: known pigment regulator; GDV: graphlet degree vector; CREB: cAMPresponse element binding; ERK: extracellular signal-regulated kinase.
Authors' contributionsTM and VM performed the computational data analysis. HH and JA performedbiological experiments. AKG and NP conceived of the study. All the authorsparticipated in its design and coordination. AKG, NP and HH drafted the manu-script. All authors read and approved the final manuscript.
AcknowledgementsAnand Ganesan, Hsiang Ho, and Jayavani Aruri were supported by two NIH awards (1K08AR056001-01A1 and 1R03AR057150-01). Nataša Pržulj, Tijana Milenković, and Vesna Memišević were supported by the NSF CAREER IIS-0644424 grant.
Author Details1Department of Biological Chemistry, University of California, Irvine, CA 92697-1700, USA, 2Department of Computer Science, University of California, Irvine, CA 92697-3435, USA, 3Department of Dermatology, University of California, Irvine, CA 92697-2400, USA and 4Department of Computing, Imperial College London SW7 2AZ, UK
References1. Lehner B, Lee I: Network-guided genetic screening: building, testing
and using gene networks to predict gene function. Brief Funct Genomic Proteomic 2008, 7:217-227.
2. Lamitina T: Functional genomic approaches in C. elegans. Methods Mol Biol 2006, 351:127-138.
3. Gunsalus KC, Ge H, Schetter AJ, Goldberg DS, Han JD, Hao T, Berriz GF, Bertin N, Huang J, Chuang LS, et al.: Predictive models of molecular machines involved in Caenorhabditis elegans early embryogenesis. Nature 2005, 436:861-865.
4. Lee K, Chuang HY, Beyer A, Sung MK, Huh WK, Lee B, Ideker T: Protein networks markedly improve prediction of subcellular localization in multiple eukaryotic species. Nucleic Acids Res 2008, 36:e136.
5. Kaplow IM, Singh R, Friedman A, Bakal C, Perrimon N, Berger B: RNAiCut: automated detection of significant genes from functional genomic screens. Nat Methods 2009, 6:476-477.
6. Echeverri CJ, Beachy PA, Baum B, Boutros M, Buchholz F, Chanda SK, Downward J, Ellenberg J, Fraser AG, Hacohen N, et al.: Minimizing the risk of reporting false positives in large-scale RNAi screens. Nat Methods 2006, 3:777-779.
7. Konig R, Zhou Y, Elleder D, Diamond TL, Bonamy GM, Irelan JT, Chiang CY, Tu BP, De Jesus PD, Lilley CE, et al.: Global analysis of host-pathogen interactions that regulate early-stage HIV-1 replication. Cell 2008, 135:49-60.
8. Bennett DC, Lamoreux ML: The color loci of mice--a genetic century. Pigment Cell Res 2003, 16:333-344.
9. Slominski A, Tobin DJ, Shibahara S, Wortsman J: Melanin pigmentation in mammalian skin and its hormonal regulation. Physiol Rev 2004, 84:1155-1228.
10. Levy C, Khaled M, Fisher DE: MITF: master regulator of melanocyte development and melanoma oncogene. Trends Mol Med 2006, 12:406-414.
11. Raposo G, Marks MS: Melanosomes--dark organelles enlighten endosomal membrane transport. Nat Rev Mol Cell Biol 2007, 8:786-797.
12. Sulem P, Gudbjartsson DF, Stacey SN, Helgason A, Rafnar T, Magnusson KP, Manolescu A, Karason A, Palsson A, Thorleifsson G, et al.: Genetic determinants of hair, eye and skin pigmentation in Europeans. Nat Genet 2007, 39:1443-1452.
13. Ganesan AK, Ho H, Bodemann B, Petersen S, Aruri J, Koshy S, Richardson Z, Le LQ, Krasieva T, Roth MG, et al.: Genome-wide siRNA-based functional
genomics of pigmentation identifies novel genes and pathways that impact melanogenesis in human cells. PLoS Genet 2008, 4:e1000298.
14. Peri S, Navarro JD, Kristiansen TZ, Amanchy R, Surendranath V, Muthusamy B, Gandhi TK, Chandrika KN, Deshpande N, Suresh S, et al.: Human protein reference database as a discovery resource for proteomics. Nucleic Acids Res 2004, 32:D497-501.
15. Stark C, Breitkreutz BJ, Reguly T, Boucher L, Breitkreutz A, Tyers M: BioGRID: a general repository for interaction datasets. Nucleic Acids Res 2006, 34:D535-539.
16. Radivojac P, Peng K, Clark WT, Peters BJ, Mohan A, Boyle SM, Mooney SD: An integrated approach to inferring gene-disease associations in humans. Proteins 2008, 72:1030-1037.
17. Milenković T, Pržulj N: Uncovering Biological Network Function via Graphlet Degree Signatures. Cancer Inform 2008, 6:257-273.
18. Milenković TVM, Ganesan AK, Pržulj N: Systems-level cancer gene identification from protein interaction network topology applied to melanogenesis-related functional genomics data. J R Soc Interface 2010.
19. Motulsky H: Intuitive Biostatistics Oxford University Press, New York; 1995. 20. Sharan R, Ulitsky I, Shamir R: Network-based prediction of protein
function. Mol Syst Biol 2007, 3:88.21. Kanehisa M, Goto S: KEGG: kyoto encyclopedia of genes and genomes.
Nucleic Acids Res 2000, 28:27-30.22. Shanske A, Ferreira JC, Leonard JC, Fuller P, Marion RW: Hirschsprung
disease in an infant with a contiguous gene syndrome of chromosome 13. Am J Med Genet 2001, 102:231-236.
23. Hofstra RM, Osinga J, Tan-Sindhunata G, Wu Y, Kamsteeg EJ, Stulp RP, van Ravenswaaij-Arts C, Majoor-Krakauer D, Angrist M, Chakravarti A, et al.: A homozygous mutation in the endothelin-3 gene associated with a combined Waardenburg type 2 and Hirschsprung phenotype (Shah-Waardenburg syndrome). Nat Genet 1996, 12:445-447.
24. Van Raamsdonk CD, Fitch KR, Fuchs H, de Angelis MH, Barsh GS: Effects of G-protein mutations on skin color. Nat Genet 2004, 36:961-968.
25. McGill GG, Horstmann M, Widlund HR, Du J, Motyckova G, Nishimura EK, Lin YL, Ramaswamy S, Avery W, Ding HF, et al.: Bcl2 regulation by the melanocyte master regulator Mitf modulates lineage survival and melanoma cell viability. Cell 2002, 109:707-718.
26. Sato-Jin K, Nishimura EK, Akasaka E, Huber W, Nakano H, Miller A, Du J, Wu M, Hanada K, Sawamura D, et al.: Epistatic connections between microphthalmia-associated transcription factor and endothelin signaling in Waardenburg syndrome and other pigmentary disorders. Faseb J 2008, 22:1155-1168.
27. Murisier F, Beermann F: Genetics of pigment cells: lessons from the tyrosinase gene family. Histol Histopathol 2006, 21:567-578.
28. Hou L, Pavan WJ, Shin MK, Arnheiter H: Cell-autonomous and cell non-autonomous signaling through endothelin receptor B during melanocyte development. Development 2004, 131:3239-3247.
29. Motagally MA, Lukewich MK, Chisholm SP, Neshat S, Lomax AE: Tumour necrosis factor alpha activates nuclear factor kappaB signalling to reduce N-type voltage-gated Ca2+ current in postganglionic sympathetic neurons. J Physiol 2009, 587:2623-2634.
30. Barlow A, de Graaff E, Pachnis V: Enteric nervous system progenitors are coordinately controlled by the G protein-coupled receptor EDNRB and the receptor tyrosine kinase RET. Neuron 2003, 40:905-916.
31. Hoek K, Rimm DL, Williams KR, Zhao H, Ariyan S, Lin A, Kluger HM, Berger AJ, Cheng E, Trombetta ES, et al.: Expression profiling reveals novel pathways in the transformation of melanocytes to melanomas. Cancer Res 2004, 64:5270-5282.
32. Yustein JT, Xia L, Kahlenburg JM, Robinson D, Templeton D, Kung HJ: Comparative studies of a new subfamily of human Ste20-like kinases: homodimerization, subcellular localization, and selective activation of MKK3 and p38. Oncogene 2003, 22:6129-6141.
33. Saha B, Singh SK, Sarkar C, Bera R, Ratha J, Tobin DJ, Bhadra R: Activation of the Mitf promoter by lipid-stimulated activation of p38-stress signalling to CREB. Pigment Cell Res 2006, 19:595-605.
34. Tada A, Pereira E, Beitner-Johnson D, Kavanagh R, Abdel-Malek ZA: Mitogen-and ultraviolet-B-induced signaling pathways in normal human melanocytes. J Invest Dermatol 2002, 118:316-322.
35. Lev S, Moreno H, Martinez R, Canoll P, Peles E, Musacchio JM, Plowman GD, Rudy B, Schlessinger J: Protein tyrosine kinase PYK2 involved in Ca(2+)-induced regulation of ion channel and MAP kinase functions. Nature 1995, 376:737-745.
Received: 4 November 2009 Accepted: 15 June 2010 Published: 15 June 2010This article is available from: http://www.biomedcentral.com/1752-0509/4/84© 2010 Ho et al; licensee BioMed Central Ltd. This is an Open Access article distributed under the terms of the Creative Commons Attribution License (http://creativecommons.org/licenses/by/2.0), which permits unrestricted use, distribution, and reproduction in any medium, provided the original work is properly cited.BMC Systems Biology 2010, 4:84

Ho et al. BMC Systems Biology 2010, 4:84http://www.biomedcentral.com/1752-0509/4/84
Page 13 of 13
36. Bohm M, Moellmann G, Cheng E, Alvarez-Franco M, Wagner S, Sassone-Corsi P, Halaban R: Identification of p90RSK as the probable CREB-Ser133 kinase in human melanocytes. Cell Growth Differ 1995, 6:291-302.
37. Demunter A, De Wolf-Peeters C, Degreef H, Stas M, van den Oord JJ: Expression of the endothelin-B receptor in pigment cell lesions of the skin. Evidence for its role as tumor progression marker in malignant melanoma. Virchows Arch 2001, 438:485-491.
38. Hara M, Yaar M, Gilchrest BA: Endothelin-1 of keratinocyte origin is a mediator of melanocyte dendricity. J Invest Dermatol 1995, 105:744-748.
39. Busca R, Bertolotto C, Abbe P, Englaro W, Ishizaki T, Narumiya S, Boquet P, Ortonne JP, Ballotti R: Inhibition of Rho is required for cAMP-induced melanoma cell differentiation. Mol Biol Cell 1998, 9:1367-1378.
40. Hata K, Mukaiyama T, Tsujimura N, Sato Y, Kosaka Y, Sakamoto K, Hori K: Differentiation-inducing activity of lupane triterpenes on a mouse melanoma cell line. Cytotechnology 2006, 52:151-158.
41. Westendorf JJ, Mernaugh R, Hiebert SW: Identification and characterization of a protein containing formin homology (FH1/FH2) domains. Gene 1999, 232:173-182.
42. Takeya R, Sumimoto H: Fhos, a mammalian formin, directly binds to F-actin via a region N-terminal to the FH1 domain and forms a homotypic complex via the FH2 domain to promote actin fiber formation. J Cell Sci 2003, 116:4567-4575.
43. Gasteier JE, Schroeder S, Muranyi W, Madrid R, Benichou S, Fackler OT: FHOD1 coordinates actin filament and microtubule alignment to mediate cell elongation. Exp Cell Res 2005, 306:192-202.
44. Boehm MB, Milius TJ, Zhou Y, Westendorf JJ, Koka S: The mammalian formin FHOD1 interacts with the ERK MAP kinase pathway. Biochem Biophys Res Commun 2005, 335:1090-1094.
45. Tanaka H, Moroi K, Iwai J, Takahashi H, Ohnuma N, Hori S, Takimoto M, Nishiyama M, Masaki T, Yanagisawa M, et al.: Novel mutations of the endothelin B receptor gene in patients with Hirschsprung's disease and their characterization. J Biol Chem 1998, 273:11378-11383.
46. Stallings JD, Tall EG, Pentyala S, Rebecchi MJ: Nuclear translocation of phospholipase C-delta1 is linked to the cell cycle and nuclear phosphatidylinositol 4,5-bisphosphate. J Biol Chem 2005, 280:22060-22069.
47. Kobayashi A, Hachiya A, Ohuchi A, Kitahara T, Takema Y: Inhibitory mechanism of an extract of Althaea officinalis L. on endothelin-1-induced melanocyte activation. Biol Pharm Bull 2002, 25:229-234.
48. Imokawa G, Kobayasi T, Miyagishi M: Intracellular signaling mechanisms leading to synergistic effects of endothelin-1 and stem cell factor on proliferation of cultured human melanocytes. Cross-talk via trans-activation of the tyrosine kinase c-kit receptor. J Biol Chem 2000, 275:33321-33328.
49. Kang HY, Kang WH, Lee C: Endothelin-B receptor-mediated Ca2+ signaling in human melanocytes. Pflugers Arch 1998, 435:350-356.
50. Pržulj N, Milenković T: Computational Methods for Analyzing and Modeling Biological Networks, a chapter in "Biological Data Mining". Edited by: Jake Chen, Stefano Lonardi. Chapman & Hall/CRC; 2009.
51. Milenković T, Lai J, Pržulj N: GraphCrunch: a tool for large network analyses. BMC Bioinformatics 2008:70 [http://www.ics.uci.edu/~bio-nets/graphcrunch/].
52. King AD, Pržulj N, Jurisica I: Protein complex prediction via cost-based clustering. Bioinformatics 2004, 20:3013-3020.
doi: 10.1186/1752-0509-4-84Cite this article as: Ho et al., Protein interaction network topology uncovers melanogenesis regulatory network components within functional genomics datasets BMC Systems Biology 2010, 4:84