Embed Size (px)
Citation preview

RAPID COMMUNICATION
Protein abundances are more conserved than mRNA
abundances across diverse taxa
Jon M. Laurent1�, Christine Vogel1�, Taejoon Kwon1, Stephanie A. Craig1, Daniel R. Boutz1,Holly K. Huse1,2, Kazunari Nozue3, Harkamal Walia3, Marvin Whiteley1,2, Pamela C. Ronald3
and Edward M. Marcotte1,4
1 Center for Systems and Synthetic Biology, Institute for Cellular and Molecular Biology, University of Texas atAustin, TX, USA
2 Section of Molecular Genetics and Microbiology, University of Texas at Austin, TX, USA3 Department of Plant Pathology, University of California, Davis, CA, USA4 Department of Chemistry and Biochemistry, University of Texas at Austin, TX, USA
Received: May 21, 2010
Revised: July 16, 2010
Accepted: July 25, 2010
Proteins play major roles in most biological processes; as a consequence, protein expression
levels are highly regulated. While extensive post-transcriptional, translational and protein
degradation control clearly influence protein concentration and functionality, it is often
thought that protein abundances are primarily determined by the abundances of the corre-
sponding mRNAs. Hence surprisingly, a recent study showed that abundances of ortholo-
gous nematode and fly proteins correlate better than their corresponding mRNA abundances.
We tested if this phenomenon is general by collecting and testing matching large-scale
protein and mRNA expression data sets from seven different species: two bacteria, yeast,
nematode, fly, human, and rice. We find that steady-state abundances of proteins show
significantly higher correlation across these diverse phylogenetic taxa than the abundances of
their corresponding mRNAs (p 5 0.0008, paired Wilcoxon). These data support the presence
of strong selective pressure to maintain protein abundances during evolution, even when
mRNA abundances diverge.
Keywords:
Global protein analysis / Protein expression / Quantitative analysis / Shotgun
proteomics / Systems biology
Proteins play major roles in most biological processes,
ranging from central metabolism to cell structure, main-
tenance, and replication. Consequently, protein expression
levels are subject to diverse and complex control. Owing to
extensive post-transcriptional, translation and stability
regulation, protein abundance is only partly determined by
accumulation and degradation of the corresponding mRNAs
(e.g. as in References [1–3]), with perhaps 20–60% of the
variation in steady-state protein abundances attributable to
mRNA levels, depending upon organism and conditions [4].
A recent study of the nematode and fly proteomes made the
remarkable observation that the abundances of orthologous
nematode and fly proteins correlated better than their
corresponding mRNA abundances [3]. The difficulty in
making such measurements on a proteome scale has until
recently held back such comparisons, and it is unknown
whether this observation is generally true. We asked if this
phenomenon is indeed general by collecting and testing
matching large-scale protein and mRNA expression data
sets from seven different species. We find that steady-state
abundances of proteins show significantly higher correlation
across diverse phylogenetic taxa than the abundances of
their corresponding mRNAs (p 5 0.0008, paired Wilcoxon).
These data support the presence of strong selective
pressure to maintain protein abundances during evolution.
�These authors contributed equally to this work.
Correspondence: Dr. Edward M. Marcotte, Center for Systems
and Synthetic Biology, Institute for Cellular and Molecular Biol-
ogy, University of Texas at Austin, TX 78712, USA
E-mail: [email protected]
Fax: 11-512-232-3432
& 2010 WILEY-VCH Verlag GmbH & Co. KGaA, Weinheim www.proteomics-journal.com
Proteomics 2010, 10, 4209–4212 4209DOI 10.1002/pmic.201000327

A necessary consequence is that protein stability and post-
transcriptional regulatory schemes must compensate for
divergent mRNA levels to maintain protein levels at evolu-
tionarily optimized levels.
Specifically, we assembled large-scale quantitative
protein expression data sets and measured protein abun-
dances from bacteria (E. coli, P. aeruginosa), fungi (Baker’s
yeast, S. cerevisiae), rice, (O. sativa), fruit fly (D. melanoga-ster), nematodes (C. elegans), and humans, as described in
the Supporting Information. For each species, we identified
or collected mRNA expression data sets from matching
strain and growth conditions. We limited data sets to those
from similar measurement platforms. For mRNA, we
compiled data from single channel DNA microarrays and
counting methods if available (Supporting Information
Table S1). For proteins, we used MS-based shotgun
proteomics, measuring absolute abundances with a label-
free weighted spectral counting approach [2]. We then
computed orthologous genes between each pair of species
using InParanoid [5]. Alternate choices of measurement
platforms, quantitation, and calculation of orthology,
described below, all give similar results.
We then determined the extent to which steady-state
protein concentrations were conserved between each pair of
organisms by calculating the rank correlation of the protein
abundances originating from orthologous genes, as shown
for human and yeast in Fig. 1A. Similarly, we measured the
rank correlation in the abundances of the corresponding
mRNAs. Importantly, we limited all comparisons to only
those genes for which we had both protein and mRNA
measurements, thereby controlling for possible sources of
bias related to selection of genes, including technology-
specific abundance biases (for example, the tendency for MS
to selectively sample abundant proteins). The relative
conservation of protein and mRNA abundances could then
be estimated by comparing the resulting rank correlations,
listed in full in Fig. 1B. Of the 21 organism pairs considered,
the correlation in protein abundances was greater than that
of mRNAs in 17 cases, and less than that in only four. The
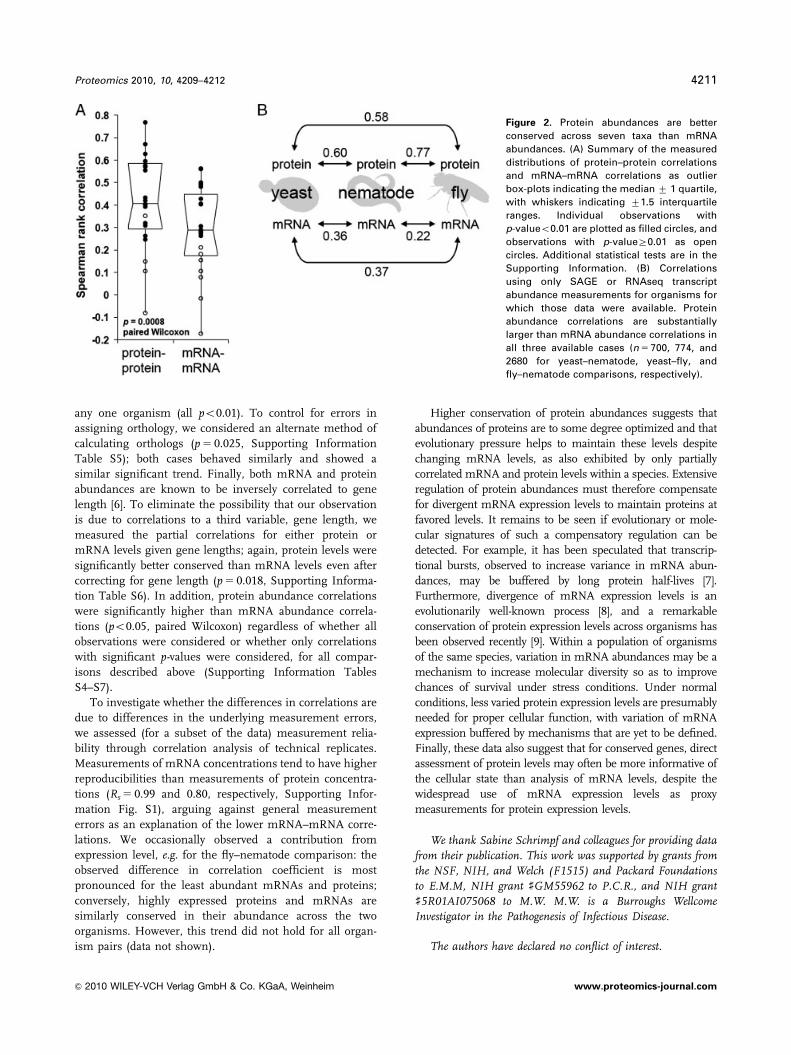
trend can be clearly seen in the distributions of protein–
protein and mRNA–mRNA correlations (Fig. 2A), support-
ing a significantly greater conservation of protein abun-
dances than for the abundances of the corresponding
mRNAs (p 5 0.0008, paired Wilcoxon).
We attempted to rule out the possibility of either tech-
nical artifacts or conflating trends giving rise to our obser-
vations as follows: the trend was also observed when we
considered mRNA measurements based only on sequencing
(SAGE and RNA-seq) rather than DNA microarrays
(Fig. 2B; only 3 such comparisons available) and was highly
statistically significant when we considered average mRNA
abundance measurements obtained by multiple techniques
(i.e. mixing microarrays and SAGE or RNA-seq; po0.0001,
Supporting Information Table S4), and when we omitted
Figure 1. (A) General scheme for collecting, organizing, and analyzing protein and mRNA expression data sets involved in the study. For
each organism, expression data sets were either assembled or measured in-house, with protein and mRNA abundances estimated by MS
and single-channel microarrays, respectively. For the genes orthologous between each pair of organisms, we calculated the Spearman
rank correlation between their corresponding protein levels and between their corresponding mRNA levels, as reported in (B). Blue
and red represent protein–protein and mRNA–mRNA correlations, respectively, with darker boxes indicating those correlations with
p-valueo0.01. White boxes down the diagonal are the protein–mRNA correlations within each species.
4210 J. M. Laurent et al. Proteomics 2010, 10, 4209–4212
& 2010 WILEY-VCH Verlag GmbH & Co. KGaA, Weinheim www.proteomics-journal.com
any one organism (all po0.01). To control for errors in
assigning orthology, we considered an alternate method of
calculating orthologs (p 5 0.025, Supporting Information
Table S5); both cases behaved similarly and showed a
similar significant trend. Finally, both mRNA and protein
abundances are known to be inversely correlated to gene
length [6]. To eliminate the possibility that our observation
is due to correlations to a third variable, gene length, we
measured the partial correlations for either protein or
mRNA levels given gene lengths; again, protein levels were
significantly better conserved than mRNA levels even after
correcting for gene length (p 5 0.018, Supporting Informa-
tion Table S6). In addition, protein abundance correlations
were significantly higher than mRNA abundance correla-
tions (po0.05, paired Wilcoxon) regardless of whether all
observations were considered or whether only correlations
with significant p-values were considered, for all compar-
isons described above (Supporting Information Tables
S4–S7).
To investigate whether the differences in correlations are
due to differences in the underlying measurement errors,
we assessed (for a subset of the data) measurement relia-
bility through correlation analysis of technical replicates.
Measurements of mRNA concentrations tend to have higher
reproducibilities than measurements of protein concentra-
tions (Rs 5 0.99 and 0.80, respectively, Supporting Infor-
mation Fig. S1), arguing against general measurement
errors as an explanation of the lower mRNA–mRNA corre-
lations. We occasionally observed a contribution from
expression level, e.g. for the fly–nematode comparison: the
observed difference in correlation coefficient is most
pronounced for the least abundant mRNAs and proteins;
conversely, highly expressed proteins and mRNAs are
similarly conserved in their abundance across the two
organisms. However, this trend did not hold for all organ-
ism pairs (data not shown).
Higher conservation of protein abundances suggests that
abundances of proteins are to some degree optimized and that
evolutionary pressure helps to maintain these levels despite
changing mRNA levels, as also exhibited by only partially
correlated mRNA and protein levels within a species. Extensive
regulation of protein abundances must therefore compensate
for divergent mRNA expression levels to maintain proteins at
favored levels. It remains to be seen if evolutionary or mole-
cular signatures of such a compensatory regulation can be
detected. For example, it has been speculated that transcrip-
tional bursts, observed to increase variance in mRNA abun-
dances, may be buffered by long protein half-lives [7].
Furthermore, divergence of mRNA expression levels is an
evolutionarily well-known process [8], and a remarkable
conservation of protein expression levels across organisms has
been observed recently [9]. Within a population of organisms
of the same species, variation in mRNA abundances may be a
mechanism to increase molecular diversity so as to improve
chances of survival under stress conditions. Under normal
conditions, less varied protein expression levels are presumably
needed for proper cellular function, with variation of mRNA
expression buffered by mechanisms that are yet to be defined.
Finally, these data also suggest that for conserved genes, direct
assessment of protein levels may often be more informative of
the cellular state than analysis of mRNA levels, despite the
widespread use of mRNA expression levels as proxy
measurements for protein expression levels.
We thank Sabine Schrimpf and colleagues for providing datafrom their publication. This work was supported by grants fromthe NSF, NIH, and Welch (F1515) and Packard Foundationsto E.M.M, NIH grant ]GM55962 to P.C.R., and NIH grant]5R01AI075068 to M.W. M.W. is a Burroughs WellcomeInvestigator in the Pathogenesis of Infectious Disease.
The authors have declared no conflict of interest.
Figure 2. Protein abundances are better
conserved across seven taxa than mRNA
abundances. (A) Summary of the measured
distributions of protein–protein correlations
and mRNA–mRNA correlations as outlier
box-plots indicating the median 7 1 quartile,
with whiskers indicating 71.5 interquartile
ranges. Individual observations with
p-valueo0.01 are plotted as filled circles, and
observations with p-valueZ0.01 as open
circles. Additional statistical tests are in the
Supporting Information. (B) Correlations
using only SAGE or RNAseq transcript
abundance measurements for organisms for
which those data were available. Protein
abundance correlations are substantially
larger than mRNA abundance correlations in
all three available cases (n 5 700, 774, and
2680 for yeast–nematode, yeast–fly, and
fly–nematode comparisons, respectively).
Proteomics 2010, 10, 4209–4212 4211
& 2010 WILEY-VCH Verlag GmbH & Co. KGaA, Weinheim www.proteomics-journal.com

References
[1] Anderson, L., Seilhamer, J., A comparison of selected mRNA
and protein abundances in human liver. Electrophoresis
1997, 18, 533–537.
[2] Lu, P., Vogel, C., Wang, R., Yao, X., Marcotte, E. M., Absolute
protein expression profiling estimates the relative contribu-
tions of transcriptional and translational regulation. Nat.
Biotechnol. 2007, 25, 117–124.
[3] Schrimpf, S. P., Weiss, M., Reiter, L., Ahrens, C. H. et al.,
Comparative functional analysis of the Caenorhabditis
elegans and Drosophila melanogaster proteomes. PLoS Biol.
2009, 7, e48.
[4] de Sousa Abreu, R., Penalva, L. O., Marcotte, E. M., Vogel, C.,
Global signatures of protein and mRNA expression levels.
Mol. Biosyst. 2009, 5, 1512–1526.
[5] Remm, M., Storm, C. E., Sonnhammer, E. L., Automatic
clustering of orthologs and in-paralogs from pairwise
species comparisons. J. Mol. Biol. 2001, 314, 1041–1052.
[6] Nie, L., Wu, G., Zhang, W., Correlation of mRNA expression
and protein abundance affected by multiple sequence
features related to translational efficiency in Desulfovibrio
vulgaris: a quantitative analysis. Genetics 2006, 174,
2229–2243.
[7] Raj, A., Peskin, C. S., Tranchina, D., Vargas, D. Y., Tyagi, S.,
Stochastic mRNA synthesis in mammalian cells. PLoS Biol.
2006, 4, e309.
[8] Khaitovich, P., Enard, W., Lachmann, M., Paabo, S., Evolu-
tion of primate gene expression. Nat. Rev. Genet. 2006, 7,
693–702.
[9] Weiss, M., Schrimpf, S., Hengartner, M. O., Lercher, M. J.,
von Mering, C., Shotgun proteomics data from multiple
organisms reveals remarkable quantitative conservation
of the eukaryotic core proteome. Proteomics 2010, 10,
1297–1306.
4212 J. M. Laurent et al. Proteomics 2010, 10, 4209–4212
& 2010 WILEY-VCH Verlag GmbH & Co. KGaA, Weinheim www.proteomics-journal.com