Embed Size (px)
Citation preview

Protection for Peanuts: Supply, Demand, and Agricultural Support Policies
Lesson by Lesley Mace, senior economic and financial education specialist, Federal Reserve Bank of Atlanta, Jacksonville Branch Introduction for teachers
U.S. peanut producers have been given protection from market forces since 1941, when an amendment to the Agricultural Adjustment Act of 1938 was made, including peanuts to the list of agricultural commodities protected by the act. Initially established as a production quota system where total acreage allowed for peanut farming was set by the government, the bill was modified in the 1940s to include price supports and government loans that did not have to be repaid in full if the farmer sold his crop at a loss. In the 1960s, farmers who held peanut acreage allotments (known as “quota holders”) were additionally allowed to sell or lease their peanut quotas to other farmers, with certain restrictions. The Food and Agriculture Act of 1977 established poundage limits and a two-tier quota system designating “quota peanuts” and “additional peanuts.” Additional peanuts were guaranteed a much lower price support. The 1996 FAIR Act introduced marketing assistance loans, which were guaranteed by the U.S. Department of Agriculture (USDA) to make up the difference if a crop’s sales fell short of the loan amount. “Loan rates” were set for quota peanuts, establishing a price floor for the commodity. Peanut buyers paid this loan rate price, which was ultimately passed on to the consumer. To discourage excess production, nonquota peanuts were guaranteed a price of about 20 percent of the quota price.
In reaction to the North American Free Trade Agreement (NAFTA), the 2002 Farm Bill made major changes to the peanut subsidy program. The bill created a onetime “buyout” of all peanut quota holders, and established a new price support system. Under the new system, the USDA pays peanut producers any time their prices fall below a “reference price” established under the existing five-year Farm Bill. Under the current marketing loan program, peanut producers are allowed to forfeit their crop to the government in lieu of repayment if their price falls below the established loan rate. The government is responsible for the storing and handling of forfeited crops. (Reuters estimates that 145,000 tons were forfeited in 2014.) Although other commodities such as corn, wheat, soybeans, and rice have similar price support structures, the reference price established for peanuts (the current price was set for five years in the 2014 Farm Bill) has tended to be far above the market price in recent years, especially as lower trade barriers established through the General Agreement on Tariffs and Trade (GATT), the World Trade Organization (WTO), and NAFTA have increased U.S. imports of peanuts as well as overall world production. (China is the world’s largest peanut producer, followed by India; the United States is the third largest producer.)
Concerns have been raised that the current system alters incentives in a way that encourages peanut production without regard to market signals. Despite increasing demand for the product, particularly from China, increasing crop yields have led to ever decreasing prices in recent years, especially as some farmers switch to peanuts from other crops, such as cotton, which no longer has a commodity program. This recent trend has required the government to increase the amount of payments made to peanut farmers and is also straining storage facilities designed to house the leftover legumes.

The government’s support of peanut production provides a real-world example to illustrate the concepts of supply and demand and how trade barriers such as quotas and subsidies work. In this two-part lesson, students will gain a greater understanding of the nature of U.S. government support for peanut farming both historically and today. A review of the basics of supply and demand will set the stage for an examination of arguments for and against agricultural subsidies and price supports. In addition, students will identify the types of market interventions used in the U.S. peanut market and their effects on the market when applied. Students will then determine incentives, beneficiaries, and those who lose when government policies intervene in the agricultural market and in economic markets in general.
Lesson description
In this two-part lesson, students will build their understanding of the history of government support for peanut production and the current price support system for peanut farmers, and analyze its effects on market participants through primary and secondary sources and graphical analysis.
Part 1 begins with a basic background on the U.S. peanut market and a classroom discussion of the history of government support for peanut farmers. Students will review the basics of supply and demand and using the definitions of quotas and subsidies as a guide, classify historical price supports for peanut farmers into categories. Students will then read three secondary sources (news articles) to evaluate differing points of view regarding support for peanut farmers. They will analyze these viewpoints by completing a guided worksheet. In groups, students will formulate the arguments into tweets of 140 or fewer characters, representing groups that are either for or against the government support programs, and share their tweets with the class. An extension activity allows students more time to express their own opinions on agricultural subsidies by participating in a structured classroom discussion.
Part 2 introduces students to various types of market interventions, including those used in the peanut market, and students evaluate five documents (primary and secondary sources) to identify the type of market intervention described in each document. Students will (based on skill level) either draw graphs to illustrate the market effects of each type of intervention described in the documents or pair graphs with the documents’ text. Students will consider current market incentives of peanut farmers and analyze graphical representations of the current peanut market to discover evidence of farmers responding to identified incentives. In conclusion, students will classify U.S. peanut market participants as being either positively or negatively affected by the program.
Concepts
Demand Embargo Equilibrium price Equilibrium quantity Incentives Quotas
Subsidies Supply Tariffs Tariff rate quotas U.S. agricultural policy

Objectives
Students will be able to:
1. Explain the nature of U.S. government support for peanut farming, both historically and today.
2. Identify the specific types of market interventions used in the U.S. peanut market, both historically and today.
3. Apply the laws of supply and demand to analyze the market for peanuts.
4. Examine arguments for and against agricultural subsidies and price supports and formulate concise reasoning for both sides of the argument.
5. Participate in a structured discussion of the pros and cons of government support for peanut farming (extension activity).
6. Analyze primary source documents and classify types of market interventions that have been applied to the U.S. peanut market.
7. Illustrate graphically the effects of market interventions on the peanut market when applied, using primary and secondary source documents. (Alternately, students may pair graphical representations of market interventions with primary corresponding primary and secondary sources.)
8. Examine the nature of current U.S. agricultural policy and evaluate the incentives peanut farmers must consider.
9. Distinguish between U.S. peanut market participants who benefit from or are hurt by the farm support program.
Related content
Economics, history, business education, agribusiness, and government
Time required
110 minutes consisting of two 55-minute class periods if completing both parts of the lesson; extension activity adds 30–45 minutes to the lesson, depending on class size
(Note: Part 1 can be taught as a standalone lesson to introduce students to the background and history of U.S. government support for peanut farmers and the arguments for and against government support of the peanut market; Part 2 focuses more on economic analysis and graphical representation to provide a more thorough examination of the types of market interventions used in the peanut market and their effects on market participants.)
Materials
Document camera, computer with projector, or interactive whiteboard to display
Visual 1: “Timeline History of U.S. Government Support for Peanut Farmers”
Article 1: “Peanut Growers Quick to Defend Quota System”
Article 2: “Peanut Proposals Put a New Wrinkle on Farm Subsidies”
Article 3: “U.S. Should End Its Nutty Subsidy Programs”
(Optional) Handout 1: “Quota and Subsidy Signs,” one of each per group of students
Handout 2: “Peanut Program Article Analysis,” one for each student
Visual 2: “Peanut Program Article Analysis (Answer Key)”
(Optional) Extension Activity: Structured Discussion
(Optional) Visual 3: “Market Interventions and Trade Barriers”
(Optional) Documents 1–7
• Document 1: “QBT-13-505 -2013 Tariff-Rate Quota for Peanuts”
• Document 2: “How the Marketing Quota Program Worked”
• Document 3: “Members of the Peanut Quota Holders Association Inc., Augustus Garrett, Jerome Paulk, Faye Paulk, and D.U. Pullum, Plaintiffs-Appelants vs. United States, Defendant-Appellee”
• Document 4: “Peanut Trade and the World Trade Organization”
• Document 5: “U.S. Peanut Program and Issues”
• Document 6: “United States International Trade Commission”
• Document 7: “U.S. Peanut Program and Issues”
(Optional) Appendix 1: “Extension Activity Graphs (Answer Key)” if graphs were required for the extension activity

Procedures
Part 1: An Introduction to Peanut Subsidies
1. To introduce the lesson, ask students if they can name a food that is called a nut but is actually not a nut, but rather belongs to the legume family. (Answers will vary.) Peanuts belong to the same food family as beans, soybeans, alfalfa, and clover. The United States is the world’s leading exporter of peanuts, exporting approximately 250,000 tons per year.
2. Ask students if they eat peanuts and what products they might eat that contain peanuts. (Answers may vary, but may include in the shell, roasted, boiled, candy bars, peanut butter, or peanut oil.) Inform students that peanuts are the number one U.S. snack “nut” and Americans consume an average of seven pounds of peanuts per person each year. Peanut butter is the leading use for peanuts, and half of the most popular candy bars in the country contain peanuts. Scientist George Washington Carver was known as the “father of the peanut industry” for discovering over 300 uses for peanuts as a researcher at the institution now known as Tuskegee University.
3. Ask students if they can guess where most peanuts are grown in the United States. (Answers will vary.) Explain that peanut production is concentrated in the South and Southwest. Almost half of all peanuts grown in the United States are grown in Georgia.
4. Ask students the following:
A. How are prices determined for products such as peanuts in a free market economy? (Prices are determined through the interaction between buyers and sellers in the market, supply and demand.)
B. If peanut production increases (holding demand constant), what is likely to happen to peanut prices? (Prices will decrease.)
C. What will happen to the amount of income peanut producers receive if prices fall? (It will decrease.)
D. How are peanut farmers likely to feel if they see their prices falling and incomes declining? (Possible responses: unhappy, angry, worried, or discouraged.)
E. If you were a peanut farmer, what possible actions could you take to increase the price of peanuts? (Answers will vary, but may include decrease supply, block imports, try to increase demand through a marketing campaign, lobby the government for help.)
5. Explain to students that this scenario is what happened to U.S. peanut farmers in the years following the Great Depression. As a result of economic conditions in the nation, peanut farmers were facing declines in their incomes. To help the situation, the government created assistance programs to raise the incomes of peanut farmers and other farmers growing crops such as tobacco and wheat.
6. Write the following vocabulary on the board with definitions, leaving space below each word or writing one word on each side of the board. Review the meaning of the words with students.

Vocabulary Quota: A production target that sets a goal or a restriction on the amount of a good or service that can be produced; in international trade it establishes a limit on imports or exports. Subsidy: A government payment to a domestic producer; subsidies may take the form of direct payments, loans, grants, tax breaks, or payment assistance for production costs (such as crop storage or insurance).
7. Display Visual 1: “Timeline History of Government Support for Peanut Farmers” and read each event that has occurred in the timeline. As you review each event, stop after each one and ask students to categorize the events on the timeline as either a quota or subsidy and write each on the board underneath the definitions.
(Optional strategy: Place students in groups and give each group the two signs from Handout 1: “Quota and Subsidy Signs." For each event on Visual 1, ask the students to discuss the information and hold up the sign that correctly identifies the type of trade barrier.)
The items in the timeline should follow this answer key:
Quota
Production quota system—1941 Amendment to the Agricultural Adjustment Act (AAA) Poundage quotas—1977 Subsidy
Loan guarantees—1941 Amendment to the Agricultural Adjustment Act (AAA) Price supports—1949 and 1977 Marketing assistance loans—1996 Price support system—2002 Direct payments—2002 Price loss coverage program—2014 Federally subsidized insurance—2014
8. Discuss the following:
a. Who is most likely to be in favor of farm support programs? (Farmers)
b. When a quota is established, what will happen to the price if the quota is set below the amount of a product buyers want to buy, or the quantity demanded for the product? (Price will rise)
c. If prices for peanuts are high, who gains? (Peanut farmers) Who loses? (Consumers/buyers of peanuts, producers who use peanuts in their products)

d. If the government provides payments to peanut producers and guarantees them a price for their product, what incentives will peanut producers have in terms of peanut production? (They will have an incentive to increase production)
e. If peanut production increases (given no increase in demand), what will happen to the price of peanuts? (It will decrease)
f. Who benefits when the price of peanuts falls? (Consumers/buyers of peanuts, producers who use peanuts in their products)
g. How does the falling price of peanuts affect peanut producers? (They receive lower prices for their crops and revenue may decline)
h. How does the current peanut program protect peanut producers from falling crop prices? (If prices fall they receive a payment to make up any difference between the market price and the established reference price; they do not have to pay back loans at full price if prices fall below established loan rates. Farmers can forfeit their crops to the government instead of paying back their loans.)
i. Who pays for the peanut production protection program? (Students will likely say the government, but the government receives its funding from taxpayers. Explain to students that taxpayers pay for U.S. peanut farming support programs.)
9. Tell students that they will read a set of three articles expressing various views on the agricultural assistance programs for peanut farmers throughout history. When they have finished reading the articles, they are to complete Handout 2: “Peanut Program Article Analysis,” summarizing the articles’ viewpoints and effects of the highlighted programs.
10. Pass out copies of the following articles, or provide URLs for students to read the articles online.
(They may also read the articles outside of class prior to the lesson.)
Article 1: “Peanut Growers Quick to Defend Quota System” http://newsok.com/article/2485258
Article 2: “Peanut Proposals Put a New Wrinkle on Farm Subsidies” http://www.nytimes.com/2002/03/04/us/peanut-proposals-put-a-new-wrinkle-on-farm-subsidies.html
Article 3: “U.S. Should End Its Nutty Subsidy Programs” http://www.investors.com/politics/capital-hill/us-government-should-stop-shelling-out-for-peanut-subsidies/
11. After students have read the articles and completed Handout 2, discuss the answers using Visual 2: “Peanut Program Article Analysis (Answer Key).”
12. Now that students have explored various viewpoints concerning agricultural subsidies for peanut farmers, ask them to consider their own opinions regarding farm subsidies. Divide the class into an

even number of groups of four or five students (for example, for a class of 24 students, six groups of four) and inform half of the groups that they represent groups in favor of farm subsidies, and the other half that they represent groups that oppose farm subsidies. Have students work together in their groups to write a “tweet” expressing their group’s assigned opinion on farm subsidies. (Tweets are a maximum of 140 characters, including spaces.) Allow students about five to 10 minutes to compose their tweets. Tweets must include supporting evidence or reasons to back their claims and cannot be purely opinion, such as “subsidies are stupid” or “farmers need support.” Have students share their work with the class, displaying them on the board if desired.
Answers will vary. Typical arguments in favor of agricultural price supports include: food products are necessities; farming is a low-income occupation despite its importance; farming is a way of life that should be preserved; farmers face risks from supply shocks (drought, floods, insects, natural disasters) that are unique to their industry; farmers face a purely competitive market and therefore only break even; many farms are small operations run by families; farming is a crucial part of the U.S. economy; peanuts are a relatively inexpensive product so support is minimal in comparison to the overall federal budget; peanuts are a nutritious, low-cost source of protein that is an important staple in the diet of low-income consumers; lower prices for peanuts benefit consumers and producers of peanut-based products; lower trade barriers due to NAFTA, GATT, and the WTO make it difficult for U.S. peanut farmers to compete.
Arguments against price supports include: price supports and subsidies distort market signals, resulting in a misallocation of resources; subsidies based on production allow large-scale farmers who may be more well off to gain greater benefits than small farmers; U.S. taxpayers pay for the subsidies; subsidies increase production, which lowers prices for peanuts and makes it harder for foreign producers to compete with U.S. peanut producers; increased government spending contributes to the U.S. budget deficit; subsidies alter incentives in a way that distorts market activity; the support for peanut farming is politically motivated; subsidies create an unwanted surplus of peanuts; taxpayers pay for the storage of surplus peanuts; government support diverts production to peanuts from other crops; peanut producers gain government aid while producers of other commodities do not get government assistance.
Sample tweets
Food is necessary, so farmers are necessary. #FamilyFarming is an American way of life we can’t lose
Protection for peanuts makes sense: prop up poor people’s protein!
US farmers produced over 6 billion lbs of peanuts in 2015—a lot of peanut butter! #Farming #PeanutButter
Politicians gain from goober giveaways—return to the free market in peanut farming & end peanut subsidies
Stop the surplus! Subsidies distort market signals so take your hands off peanuts & let supply & demand work
Who pays for peanut farm subsidies? As a taxpayer, you do! #Working for peanuts
13. If you are not including the primary source analysis in the lesson, this completes the lesson.
Extension Activity: If you would like to give your students more time to express their own opinions about agricultural subsidies, the Structured Discussion Extension Activity may be added to the lesson. In this activity, students use the knowledge from the articles they have already read in the lesson to participate in a structured discussion where each student is given one or two turns to speak and each opinion must be expressed beginning with a sentence prompt that builds on previous contributions. The activity will take about 30–45 minutes of class time, depending on the number of students.
Part 2: Primary Source Analysis
1. Display Visual 3: “Market Interventions and Trade Barriers.” Explain that each of the bulleted points describes a trade or market barrier. Discuss each bullet point, explaining that many of these barriers have been used in government programs for peanut farmers. (Not all will apply.) Let students know that as the World Trade Organization has eliminated the majority of trade barriers in international trade, nontariff barriers and requirements for imports have become more important means of protectionism. Some international companies base their production in the United States in part to avoid trade barriers (a good example is the auto industry), which provides jobs for workers in the United States. This is not, however, an option for farmers, who are tied to the land.
2. Divide students into pairs or groups of three or four students and give each student pair or group a set of Documents 1–6 (Document 7 will be used in Step 5 of the lesson).
3. Instruct students to read each document and determine which trade barrier is described in each document. (Not all will be used, and some will be used more than once.) Students in advanced classes may draw graphs to accompany the documents; other classes may wish to match the articles to the graphs in Appendix A. Students should also answer the following who, what, when, and why questions about each document:
a. What types of document is this? b. When was it written? c. Who is the author of creator of the document? d. For whom was the document written? e. Why do you think this document was written?
4. After students have completed reading, reviewing, and assessing the documents, review them together as a class, answering the questions above and identifying the trade barrier(s) described. Then draw graphs to illustrate the concepts on the board, or allow students to share

the graphs they have drawn (advanced classes). Appendix 1 gives examples of graphs to illustrate each concept.
Answers and document descriptions
Document 1 is a list from the U.S. Customs and Border Patrol Agency that describes the tariff rates quota for imported peanuts, special instructions for Mexico (no tariff exists for Mexican peanuts under NAFTA), and countries that the Department of Agriculture prohibits from importing peanuts into the United States. It was written in 2013 for Customs agents to follow and for companies that import peanuts. The quota period has expired, but a note at the bottom of the document explains that it will remain in force until a new document has been issued. Market Interventions and Trade Barriers: tariff rate quotas, embargo
Document 2 comes from a publication from the USDA, the Peanut Backgrounder. It was published in 2005, shortly after the change from a quota to a subsidy system was made. The paragraph describes how the quota system worked for peanut farmers. This document was written to explain the changes made in the peanut subsidy program and explores the history of the program. Market Interventions and Trade Barriers: quota Document 3 is an excerpt from the decision in a lawsuit decided in 2005 where members of the Peanut Quota Holders Association were suing the U.S. government. The excerpt highlights the history of the peanut quota system, describing the peanut support system as it was first established. Market Interventions and Trade Barriers: quota, subsidy Note: This appellate court decision affirmed the lower court’s decision, which decided that farmers who leased their quotas and were therefore not eligible to receive a “buyout” under the new system established in 2002 were not entitled to compensation for their loss when the farm support system changed. Document 4 was published by the Center for North American Studies at Texas A&M University. Two faculty members from the University of Georgia, Stanley M. Fletcher and Nathan Smith, wrote the document. The date of the document is sometime after 2002. It addresses changes to the peanut market as a result of GATT, NAFTA, and subsequent effects of falling trade barriers as a result of the Uruguay Round of GATT (which commenced in 1986 and ended in 1994, when the World Trade Organization was founded). It describes tariff rate quotas and standards for levels of aflatoxins, a mold that affects peanuts. The allowable aflatoxin rate for the European Union (EU) is much lower than that established by the CODEX, a commission jointly funded by the FAO (Food and Agricultural Administration) and WHO (World Health Organization), which determines international food safety standards. It was written to inform readers on the history of government support for the peanut market, and how the support for peanuts works today, as well as to inform peanut growers on the levels of aflatoxin allowable for imports. Market Interventions and Trade Barriers: tariff rate quota, nontariff barriers Document 5 is from the Congressional Research Service and is a graph showing the amount of payments farmers received under farm subsidies from 2002 through the 2014 Farm Bill. Dennis

Shields, an agricultural specialist, is the author. It shows the difference between what the actual farm prices were during those years, and what farmers received in subsidies, if any. The document was written to inform members of Congress who may have legislation before them that involves the peanut market. Market Interventions and Trade Barriers: subsidies Note: Under the current bill, farmers are limited to $125,000 per year in support payments, with a separate $125,000 cap that applies to all other farm product commodities. Married farmers may receive up to $250,000 per year. Document 6 is a U.S. International Trade Commission harmonized tariff schedule that details the current tariffs imposed on peanuts. It was written in 2016 to inform those involved in international trade in peanuts on the tariff rates that apply to each country. Market Interventions and Trade Barriers: tariffs Note: The "general" rate listed is the normal U.S. trade relations duty rates. Some countries may be eligible to import products under preferential tariff programs; these are listed in the “special” column. Some of the codes may be recognizable—CA (Canada), MX (Mexico), AU (Australia), PA (Panama). The letters designating country codes can be found here: https://www.usitc.gov/publications/docs/tata/hts/bychapter/1400statannx.pdf. Note how our NAFTA neighbors and many South American countries are granted special rates. Document 7 will be used in the next step of the lesson. Note: You may also want to let students know that other countries also impose trade barriers on U.S. exports. This brief video (https://www.youtube.com/watch?v=xqthlM85C8Q) is a news story that focuses on tariffs imposed by China on Georgia peanuts.
For recent developments in the peanut market, this infographic (http://www.fas.usda.gov/sites/default/files/2016-03/tpp-peanuts-03-13-2016.pdf) on the Trans-Pacific Partnership (TPP) and the USDA Fact Sheet (http://www.fas.usda.gov/sites/default/files/2015-10/tpp_details_peanuts_10-28-15.pdf) highlight current tariff rates and how the TPP will open up the market for peanuts both in the United States and in Pacific nations.
5. Document 7 is from the Congressional Research Service, found in the same publication as Document 5. Remind students that people respond to incentives, and ask them the following questions:
a. What recent trends do you see on the three graphs in the document? (Planted area is rising, yield appears to be rising, production is rising)
b. What do you see happening on the graphs around 2002? (Planted acres falling, yield falling, production falling) Why might this have happened? (The new farm bill eliminated the old quota system, weather and other related agricultural factors)
c. What are factors that influence peanut production? (Weather, technology, number of farmers, production costs, price of peanuts, incentives from government programs)
d. Do recent trends suggest that the current agricultural program could be encouraging or discouraging peanut production? (Peanut production has risen since the new farm bill in 2014, but one cannot directly conclude that it is the cause of the recent increases in

production. Weather, farming techniques and technology, number of farmers, foreign competition, the relative profitability of peanuts compared to other crops, and expectations such as the future demand and price for peanuts influence U.S. farmers as well.) Note: Shields concluded that it is possible that the reference price payment for peanuts, which is relatively higher than that of other supported commodity crops, could indeed provide an incentive for farmers to plant more peanuts. The resulting lower price of peanuts would benefit peanut consumers, harm foreign producers, and ultimately leave the U.S. taxpayer with a larger amount of subsidy to pay.
6. To conclude the lesson, have students summarize the costs and benefits of the current peanut price support program, tallying the results on the board.
Answers may vary, but should include:
Beneficiaries:
Peanut producers Input suppliers Peanut processors Consumers of peanuts (U.S. and foreign)
Those Negatively Affected by the Program:
Foreign producers U.S. taxpayers

Visual 1: Timeline History of U.S. Government Support for Peanut Farmers
1. 1941: An amendment to the 1938 Agricultural Adjustment Act (AAA) establishes a production quota system for peanut production through acreage allotment to prevent oversupply. Financial penalties were applied for exceeding the quota. Farmers who were given acreage allotments were known as “quota holders.” The act also provided for loans to peanut farmers that did not have to be paid back in full if crops were sold at a loss.
2. 1949: Price supports were established; loan rates set so they fell as production increased.
3. 1977: Food and Agriculture Act established poundage quotas in addition to the restriction on acreage devoted to peanut farming. Excess production was discouraged as price supports were much higher for peanuts grown within the quota.
4. 1981: Acreage allotments were discontinued, but quota holders were still the only producers allowed to sell quota peanuts.
5. 1996: Marketing assistance loans were established by the FAIR Act; loans did not have to be paid back in full if the crop sales did not cover the loan, with the USDA making up the difference. “Loan rate” basically guaranteed farmers a price for their crops; manufacturers pay this price set by the USDA to buy peanuts. Nonquota peanuts received a rate about one-fifth of the quota rate and had to be sold overseas or for nonfood use (such as peanut oil).
6. 2002: The U.S. government, in reaction to the passage of NAFTA, bought out all “quota holders” (about 70,000 farmers) and created a new price support system. Under the new system, marketing assistance loans continue and farmers can also forfeit their crops in lieu of loan payments. Fixed direct payments are made to farmers to counteract the effects of the business cycle.
7. 2014: The U.S. Farm Bill established a “reference price” for peanuts ($535 per ton); under this Price Loss Coverage (PLC) program, farmers are paid the difference if they receive crop prices below the reference price. An alternative program, Agricultural Risk Coverage, or ARC, reimburses farmers based on a five-year price average. Expanded federally subsidized insurance programs protect farmers from weather-related crop losses.

Handout 1: Quota and Subsidy Signs (Optional)

Handout 2: Peanut Program Article Analysis Article 1 : “Peanut Growers Quick to Defend Quota System”
Summary: This 1994 article conveys the view of Jack Coppedge, then president of the Oklahoma Peanut Grower’s Association, on the production quota system.
1) Is Coppedge for or against the quota system?
2) What reasons does he give in favor of his opinion?
3) What opposing arguments are expressed in the article?
Article 2: “Peanut Proposals Put a New Wrinkle on Farm Subsidies”
Summary: This 2002 article highlights the details of the new farm bill and gives viewpoints both for and against the new program.
1) Which people interviewed in the article are in favor of the new farm program?
2) Who does the article list as opponents of the new program?
3) Name two arguments in favor of the new program and two arguments against the new bill that are mentioned in the article.
Article 3: “U.S. Should End Its Nutty Subsidy Programs”
Summary: This 2015 editorial is written for Investor Business Daily by Terry Jones.
1) Is Jones for or against the peanut subsidy program?
2) What reasons does he give in favor of his opinion?
3) What words or phrases in this article indicate to you that it is an editorial opinion?
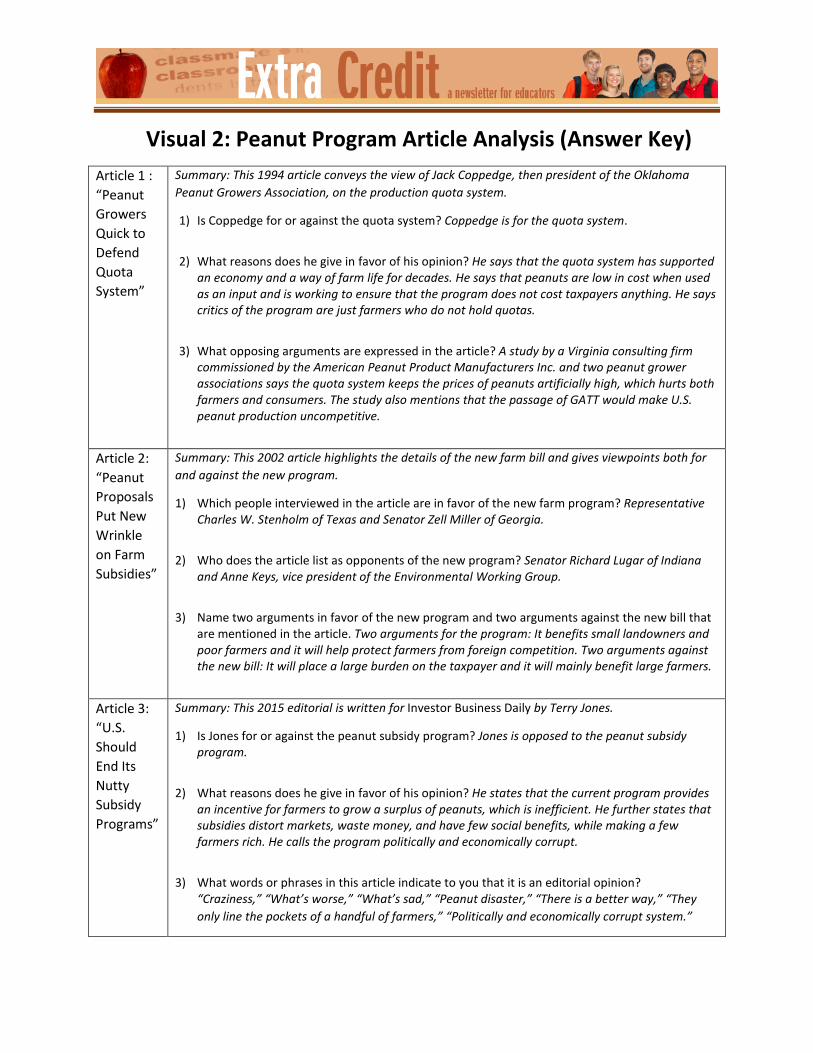
Visual 2: Peanut Program Article Analysis (Answer Key) Article 1 : “Peanut Growers Quick to Defend Quota System”
Summary: This 1994 article conveys the view of Jack Coppedge, then president of the Oklahoma Peanut Growers Association, on the production quota system.
1) Is Coppedge for or against the quota system? Coppedge is for the quota system.
2) What reasons does he give in favor of his opinion? He says that the quota system has supported an economy and a way of farm life for decades. He says that peanuts are low in cost when used as an input and is working to ensure that the program does not cost taxpayers anything. He says critics of the program are just farmers who do not hold quotas.
3) What opposing arguments are expressed in the article? A study by a Virginia consulting firm commissioned by the American Peanut Product Manufacturers Inc. and two peanut grower associations says the quota system keeps the prices of peanuts artificially high, which hurts both farmers and consumers. The study also mentions that the passage of GATT would make U.S. peanut production uncompetitive.
Article 2: “Peanut Proposals Put New Wrinkle on Farm Subsidies”
Summary: This 2002 article highlights the details of the new farm bill and gives viewpoints both for and against the new program.
1) Which people interviewed in the article are in favor of the new farm program? Representative Charles W. Stenholm of Texas and Senator Zell Miller of Georgia.
2) Who does the article list as opponents of the new program? Senator Richard Lugar of Indiana and Anne Keys, vice president of the Environmental Working Group.
3) Name two arguments in favor of the new program and two arguments against the new bill that are mentioned in the article. Two arguments for the program: It benefits small landowners and poor farmers and it will help protect farmers from foreign competition. Two arguments against the new bill: It will place a large burden on the taxpayer and it will mainly benefit large farmers.
Article 3: “U.S. Should End Its Nutty Subsidy Programs”
Summary: This 2015 editorial is written for Investor Business Daily by Terry Jones.
1) Is Jones for or against the peanut subsidy program? Jones is opposed to the peanut subsidy program.
2) What reasons does he give in favor of his opinion? He states that the current program provides an incentive for farmers to grow a surplus of peanuts, which is inefficient. He further states that subsidies distort markets, waste money, and have few social benefits, while making a few farmers rich. He calls the program politically and economically corrupt.
3) What words or phrases in this article indicate to you that it is an editorial opinion? “Craziness,” “What’s worse,” “What’s sad,” “Peanut disaster,” “There is a better way,” “They only line the pockets of a handful of farmers,” “Politically and economically corrupt system.”

Visual 3: Market Interventions and Trade Barriers (Optional) Dumping: Selling a product in a foreign market at a price that is less than the cost of production or fair market value. Embargo: A ban on trade with certain countries or in certain products. Local Content Requirement: A requirement that a certain percentage of a good be produced domestically, specified either in percentage or value. Nontariff barriers (also known as administrative trade policies): Rules and regulations that make it more difficult for imports to be brought into a country. These may include product standards, inspections, and transportation and entry requirements. Quota: A production target that sets either a goal or a restriction on the amount of a good or service that can be produced; in international trade it establishes a limit on imports or exports. Subsidy: A government payment to a domestic producer; subsidies may take the form of direct payments, loans, grants, tax breaks or payment assistance for production costs (such as crop storage or insurance). Tariff: A tax levied on imports. Tariff Rate Quota (TRQ): A combination of a tariff and a quota, a tariff rate quota applies a lower tariff rate to imports within the quota and a higher tariff rate to imports above the quota. This higher nonquota rate can reach 100 percent or more, effectively blocking imports above the quota. Voluntary Export Restraint: An agreement between an importing and exporting country where the exporter voluntarily agrees to a quota on an exported product, usually to avoid more restrictive trade barriers.

Document 1: QBT-13-505 - 2013 Tariff-Rate Quota for Peanuts (Excerpt)
COMMODITY:
Peanuts provided for in Chapter 12, Additional U.S. Note 2.
QUOTA PERIOD:
April 1, 2013 through March 31, 2014.
OPENING DAY:
Monday, April 1, 2013
RESTRAINT LEVELS:
Argentina 43,901,000 kg
Other Countries or Areas 9,005,000 kg
REPORTING INSTRUCTIONS:
Use entry type code 02, 06, 07, 12, 23, 32, 38, or 52.
Articles the product of Mexico shall not be permitted or included under this quantitative limitation and no such articles shall be classifiable therein.
SPECIAL INSTRUCTIONS:
Imports of peanuts in the shell shall be charged against the quantities on the basis of 75 kilograms for each 100 kilograms in the shell.
In accordance with Department of Agriculture regulations (7 CFR 139.37-2), imported raw peanuts under HTS numbers 1202.10.40, 1202.10.80, 1202.20.40, 1202.20.80, from the following countries are prohibited from entry:
Burkina Faso India Indonesia Ivory Coast
Japan Philippines Peoples Republic of China
Senegal Thailand Taiwan NOTIFICATION:
No further editions of this QBT for Peanuts, Chapter 12 AUSN 2, will be issued until amendments in agreements or changes in quota amounts occur. Questions from the importing community regarding this electronic message should be referred to the local CBP port. The port may refer questions to Quota Branch Point of Contact.
Source: U.S. Customs and Border Protection https://www.cbp.gov/trade/quota/QBT-13-505

Document 2: How the Marketing Quota Program Worked
The marketing quota system was a price support program that placed a limit on the amount of peanuts that could be produced and sold in the domestic market for food uses, such as peanut butter, snacks, and peanut candy. These peanuts were referred to as “quota peanuts” and the rights to sell them were allocated among roughly 70,000 quota owners who farmed or leased the quota on about 9,000 peanut farms at the time the program was ended. Under the former system, peanuts produced in excess of quota (“additional” peanuts) had to be either exported or diverted into the lower value crush market for peanut oil and meal. The quota level was established annually by USDA based on anticipated demand and then distributed among quota owners. The quota allocations were based upon area (acreage) allotments originally established in 1949, which limited the amount of area each eligible farmer could plant to peanuts. The acreage allotments were converted fully to volume (poundage) quotas in 1981 to prevent excess production stemming from yield increases. Peanut producers who owned or rented quota rights were assured of receiving relatively high prices based on a government-established “quota loan rate” of $610 per ton during 1996–2001. Producers not controlling quota rights or who produced in excess of their quota were guaranteed only a lower “additionals” loan rate of $132 per ton. These peanuts were typically grown under contract for export at world prices ($320–$460 per ton). With the higher price of quota peanuts passed along to consumers, the program was intended to operate at no direct cost to the Government. The 2002 Farm Act shifted program costs from peanut consumers to all taxpayers.
Source: Peanut Backgrounder/OCS-05i-01 Economic Research Service/USDA http://www.ers.usda.gov/media/864326/ocs05i01_002.pdf
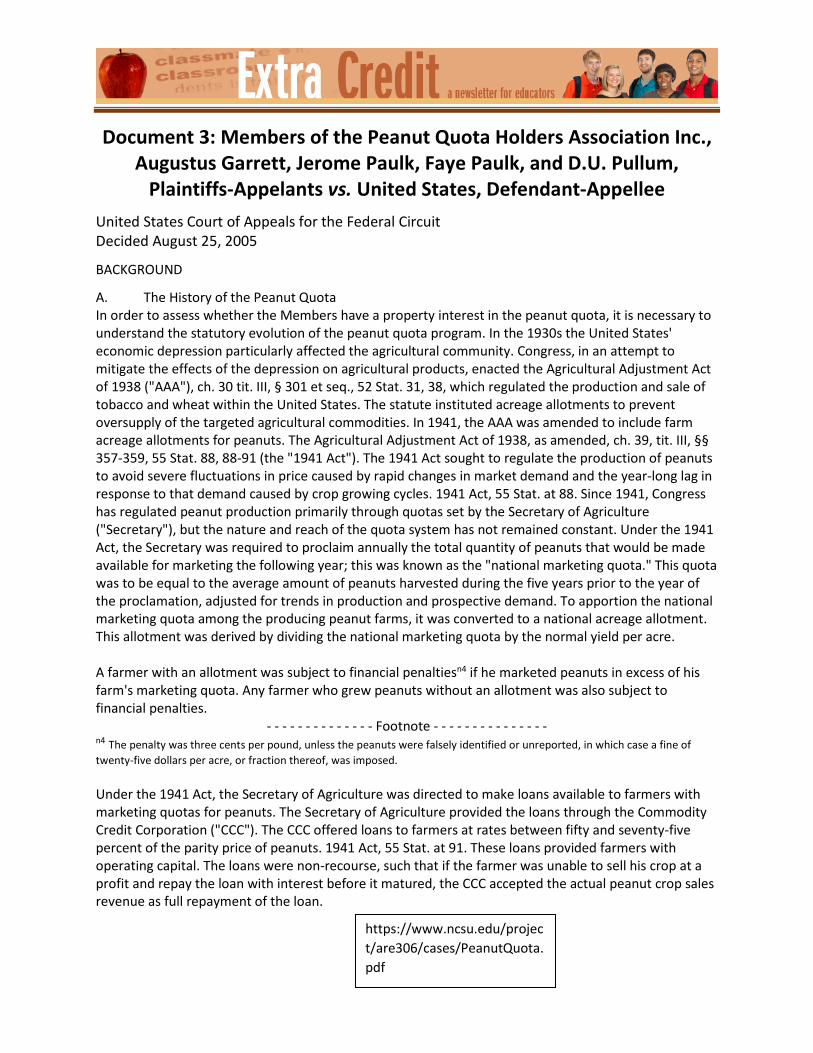
Document 3: Members of the Peanut Quota Holders Association Inc., Augustus Garrett, Jerome Paulk, Faye Paulk, and D.U. Pullum,
Plaintiffs-Appelants vs. United States, Defendant-Appellee United States Court of Appeals for the Federal Circuit Decided August 25, 2005
BACKGROUND
A. The History of the Peanut Quota In order to assess whether the Members have a property interest in the peanut quota, it is necessary to understand the statutory evolution of the peanut quota program. In the 1930s the United States' economic depression particularly affected the agricultural community. Congress, in an attempt to mitigate the effects of the depression on agricultural products, enacted the Agricultural Adjustment Act of 1938 ("AAA"), ch. 30 tit. III, § 301 et seq., 52 Stat. 31, 38, which regulated the production and sale of tobacco and wheat within the United States. The statute instituted acreage allotments to prevent oversupply of the targeted agricultural commodities. In 1941, the AAA was amended to include farm acreage allotments for peanuts. The Agricultural Adjustment Act of 1938, as amended, ch. 39, tit. III, §§ 357-359, 55 Stat. 88, 88-91 (the "1941 Act"). The 1941 Act sought to regulate the production of peanuts to avoid severe fluctuations in price caused by rapid changes in market demand and the year-long lag in response to that demand caused by crop growing cycles. 1941 Act, 55 Stat. at 88. Since 1941, Congress has regulated peanut production primarily through quotas set by the Secretary of Agriculture ("Secretary"), but the nature and reach of the quota system has not remained constant. Under the 1941 Act, the Secretary was required to proclaim annually the total quantity of peanuts that would be made available for marketing the following year; this was known as the "national marketing quota." This quota was to be equal to the average amount of peanuts harvested during the five years prior to the year of the proclamation, adjusted for trends in production and prospective demand. To apportion the national marketing quota among the producing peanut farms, it was converted to a national acreage allotment. This allotment was derived by dividing the national marketing quota by the normal yield per acre. A farmer with an allotment was subject to financial penaltiesn4 if he marketed peanuts in excess of his farm's marketing quota. Any farmer who grew peanuts without an allotment was also subject to financial penalties.
- - - - - - - - - - - - - - Footnote - - - - - - - - - - - - - - - n4 The penalty was three cents per pound, unless the peanuts were falsely identified or unreported, in which case a fine of twenty-five dollars per acre, or fraction thereof, was imposed.
Under the 1941 Act, the Secretary of Agriculture was directed to make loans available to farmers with marketing quotas for peanuts. The Secretary of Agriculture provided the loans through the Commodity Credit Corporation ("CCC"). The CCC offered loans to farmers at rates between fifty and seventy-five percent of the parity price of peanuts. 1941 Act, 55 Stat. at 91. These loans provided farmers with operating capital. The loans were non-recourse, such that if the farmer was unable to sell his crop at a profit and repay the loan with interest before it matured, the CCC accepted the actual peanut crop sales revenue as full repayment of the loan.
https://www.ncsu.edu/project/are306/cases/PeanutQuota.pdf
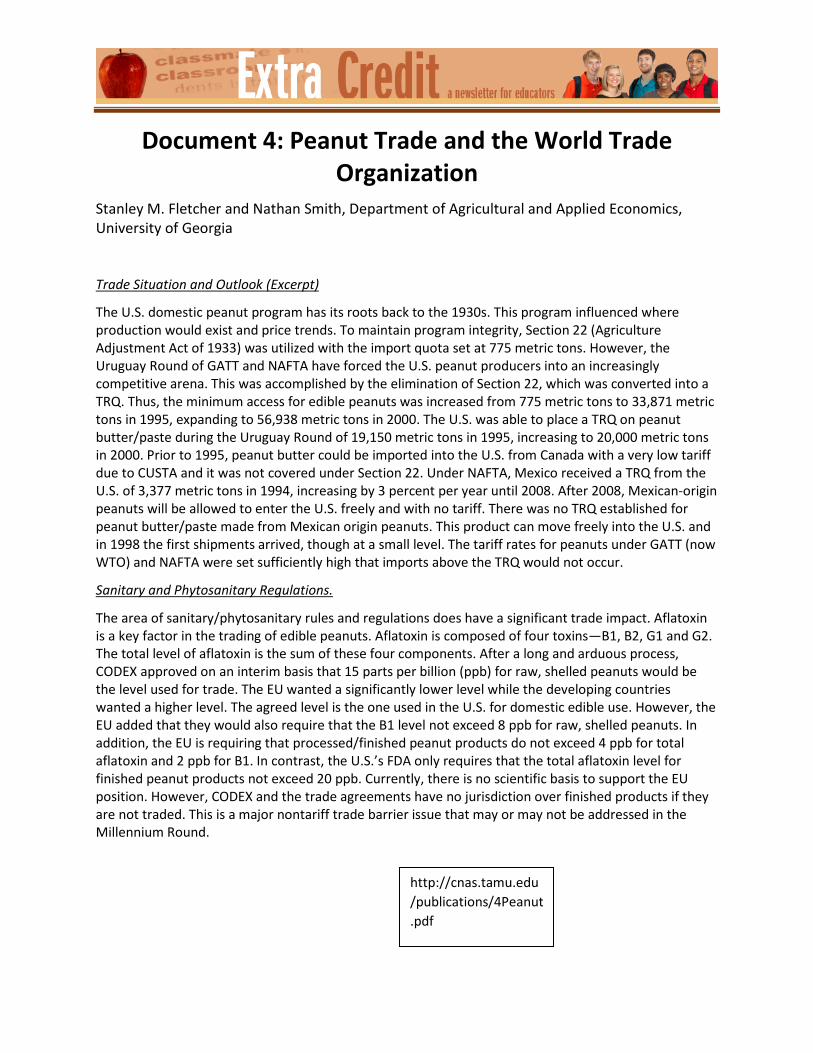
Document 4: Peanut Trade and the World Trade Organization
Stanley M. Fletcher and Nathan Smith, Department of Agricultural and Applied Economics, University of Georgia
Trade Situation and Outlook (Excerpt)
The U.S. domestic peanut program has its roots back to the 1930s. This program influenced where production would exist and price trends. To maintain program integrity, Section 22 (Agriculture Adjustment Act of 1933) was utilized with the import quota set at 775 metric tons. However, the Uruguay Round of GATT and NAFTA have forced the U.S. peanut producers into an increasingly competitive arena. This was accomplished by the elimination of Section 22, which was converted into a TRQ. Thus, the minimum access for edible peanuts was increased from 775 metric tons to 33,871 metric tons in 1995, expanding to 56,938 metric tons in 2000. The U.S. was able to place a TRQ on peanut butter/paste during the Uruguay Round of 19,150 metric tons in 1995, increasing to 20,000 metric tons in 2000. Prior to 1995, peanut butter could be imported into the U.S. from Canada with a very low tariff due to CUSTA and it was not covered under Section 22. Under NAFTA, Mexico received a TRQ from the U.S. of 3,377 metric tons in 1994, increasing by 3 percent per year until 2008. After 2008, Mexican-origin peanuts will be allowed to enter the U.S. freely and with no tariff. There was no TRQ established for peanut butter/paste made from Mexican origin peanuts. This product can move freely into the U.S. and in 1998 the first shipments arrived, though at a small level. The tariff rates for peanuts under GATT (now WTO) and NAFTA were set sufficiently high that imports above the TRQ would not occur.
Sanitary and Phytosanitary Regulations.
The area of sanitary/phytosanitary rules and regulations does have a significant trade impact. Aflatoxin is a key factor in the trading of edible peanuts. Aflatoxin is composed of four toxins—B1, B2, G1 and G2. The total level of aflatoxin is the sum of these four components. After a long and arduous process, CODEX approved on an interim basis that 15 parts per billion (ppb) for raw, shelled peanuts would be the level used for trade. The EU wanted a significantly lower level while the developing countries wanted a higher level. The agreed level is the one used in the U.S. for domestic edible use. However, the EU added that they would also require that the B1 level not exceed 8 ppb for raw, shelled peanuts. In addition, the EU is requiring that processed/finished peanut products do not exceed 4 ppb for total aflatoxin and 2 ppb for B1. In contrast, the U.S.’s FDA only requires that the total aflatoxin level for finished peanut products not exceed 20 ppb. Currently, there is no scientific basis to support the EU position. However, CODEX and the trade agreements have no jurisdiction over finished products if they are not traded. This is a major nontariff trade barrier issue that may or may not be addressed in the Millennium Round.
http://cnas.tamu.edu/publications/4Peanut.pdf

Document 5: U.S. Peanut Program and Issues Congressional Research Service Dennis A. Shields, Specialist in Agricultural Policy August 19, 2015
Source: CRS, using 2014 and 2015 price forecasts by USDA. Notes: Under the 2014 farm bill, the PLC payment rate is the Reference Price minus annual farm price (or loan rate if higher). An estimate for the 2014 PLC rate is $95 per ton ($535 - $440). Under the 2002 and 2008 farm bills, the trigger for Counter-Cyclical Price (CCP) payments was $459 per ton, which equaled the target price of $495 per ton minus the direct payment rate of $36 per ton. The loan rate is part of the formula because marketing loan benefits provide additional price protection when prices fall below the loan rate.
https://fas.org/sgp/crs/misc/R44156.pdf

Document 6: United States International Trade Commission
March 2016 Publication Number: 4588
https://hts.usitc.gov/current

Document 7: U.S. Peanut Program and Issue
Congressional Research Service Dennis A Shields, Specialist in Agricultural Policy, August 19, 2015
https://fas.org/sgp/crs/misc/R44156.pdf

Extension Activity: Structured Discussion Introduction
In this classroom discussion activity, students learn to follow the rules for collegial discussions in a structure that encourages a civil, democratic discussion on topics that may evoke a variety of strong opinions. Collegial discussions are defined as mutually respectful discussions that occur between students in the classroom setting.
Objectives:
1. Students will learn the rules of collegial discussion and apply them in a classroom setting. 2. Students will synthesize knowledge gained about peanut farming subsidies from a variety of
sources in order to participate in a classroom discussion on the topic.
Time Required: 30–45 minutes, depending on class size and number of chips given
Materials:
Copy of Collegial Discussion Guide, either displayed on an interactive whiteboard, overhead projector, or computer with projector, or enough copies so that there is at least one for every two students: http://www.isbe.net/common_core/pls/level2/pdf/collegial-discussions.pdf “Speaking chips,” two for each student, with a few extras for bonus chips. Chips can be pieces of paper, paper clips, poker or bingo chips, bottle caps, or any small item, although it is preferable that they are something that is both quiet and sturdy. (See further explanation in Step 7 of the activity.)
Articles 1–3 on farm subsidies, one copy for each student or table, read by class prior to discussion
Article 1: “Peanut Growers Quick to Defend Quota System” http://newsok.com/article/2485258
Article 2: “Peanut Proposals Put a New Wrinkle on Farm Subsidies” http://www.nytimes.com/2002/03/04/us/peanut-proposals-put-a-new-wrinkle-on-farm-subsidies.html
Article 3: “U.S. Should End Its Nutty Subsidy Programs” http://www.investors.com/politics/capital-hill/us-government-should-stop-shelling-out-for-peanut-subsidies/
Procedure:
1. Tell students that now that they have read three articles on the history of peanut farming subsidies and support, the class will participate in a discussion about the topic.

2. Explain to students that they will be introduced to a new type of discussion called collegial discussion. Ask students what they think the word “collegial” means. (Answers will vary.)
3. Let students know that the word “collegial” comes from the word “colleague,” someone with whom you work. Collegial means power shared equally among colleagues and is also thought of as meaning something that is shared, interconnected, mutually respectful, and friendly. In this discussion, rules will be established to make sure that everyone gets to have their opinion heard and respected.
4. Referring to the Collegial Discussion Guide (page two), have students read or read together the guidelines and skills on the left side of the page.
5. Ask students if they have any questions. Answer questions as they arise.
6. Direct student’s attention to the right side of the page and explain that when they contribute to the discussion, they must begin with a discussion sentence stem (similar to the game Jeopardy, where you must begin your answer with “What is…”). Students will not be able to speak unless they begin with these stems and will lose their turn if they do not follow the rules. The first speaker will begin without using a sentence stem.
7. To make sure that every student gets an equal turn, explain that each student will receive one (or two, depending on the amount of time you have allotted to the activity) “speaking chips” and they will give that chip to the teacher after they have spoken. (You may also designate a student to collect the chips.) Students may not speak unless they have a speaking chip. Extra chips may be given for particularly thoughtful contributions or taken away for comments that are disrespectful or do not begin with the discussion stems.
8. Allow students time to look over the discussion stems and then distribute the speaking chips. You may allow each student to speak according to their own opinion, or assign students a side to represent. If assigning sides, give each student representing that side the same color chip, with another color representing the opposing side.
9. Make sure that students have copies of the readings in front of them, as referring to the texts is highly encouraged. It helps to number the texts and the paragraphs for students to make reference to them during the discussion. Let students know that their contributions should include references to the readings whenever possible.
10. To begin the discussion, one student will be the “starter” and will express his or her opinion without using a discussion stem, as other comments will build off this original comment.

11. Ask for a volunteer to begin the discussion, letting that person know that he or she will be the only speaker allowed to begin without a discussion stem. (If students seem confused on the rules and how the discussion will flow, set up a practice round without chips, allowing a few students to participate to model the activity and to give time for the teacher to reinforce the rules.)
12. Allow the discussion to build off of the first speaker, collecting chips as each student speaks, rewarding exemplary contributions with extra chips and penalizing those who do not follow the rules with a loss of turn and forfeiture of their remaining chips, if any.
13. When all students have had a chance to contribute and turned in their speaking chips, thank them for their collegial participation and collect the copies of the articles. If you would like to incorporate writing into the activity, the end of the discussion is a good time to translate their views into written form, using the ideas discussed in class and the articles they have studied.
The author of this activity would like to thank Patience Ciufo, literacy coach at Hidden Oaks Middle School, Palm City, Florida, and Diane McMurry, literacy coach at the Martin County School District, Palm City, Florida, for their excellent presentation and modeling of this technique at the 18th Annual University of Central Florida Literacy Symposium in April 2016.

Appendix 1: Extension Activity Graphs (Answer Key)

Appendix 1: Extension Activity Graphs (Answer Key continued)
Content Standards—Main Lesson
National Content Standards in Economics
1. Students will understand that: People usually respond predictably to positive and negative incentives.
2. Students will understand that: Markets exist when buyers and sellers interact. This interaction determines market prices and thereby allocates scarce goods and services.
3. Students will understand that: Prices send signals and provide incentives to buyers and sellers. When supply or demand changes, market prices adjust, affecting incentives.
4. Students will understand that: When individuals, regions, and nations specialize in what they can produce at the lowest cost and then trade with others, both production and consumption increase.
5. Students will understand that: Costs of government policies sometimes exceed benefits. This may occur because of incentives facing voters, government officials, and government employees, because of actions by special interest groups that can impose costs on the general public, or because social goals other than economic efficiency are being pursued.
Literacy in History/Social Studies, Science, and Technical Subjects Common Core Standards
Key Ideas and Details
Grades 9–10 CCSS.ELA-Literacy.RH.9-10.1 Cite specific textual evidence to support analysis of primary and secondary sources, attending to such features as the date and origin of the information. CCSS.ELA-Literacy.RH.9-10.2 Determine the central ideas or information of a primary or secondary source; provide an accurate summary of how key events or ideas develop over the course of the text. Grades 11–12 CCSS.ELA-Literacy.RH.11-12.2 Determine the central ideas or information of a primary or secondary source; provide an accurate summary that makes clear the relationships among the key details and ideas.
Craft and Structure
Grades 9–10 CCSS.ELA-Literacy.RH.9-10.6 Compare the point of view of two or more authors for how they treat the same or similar topics, including which details they include and emphasize in their respective accounts.

CCSS.ELA-Literacy.RH.9-10.9 Compare and contrast treatments of the same topic in several primary and secondary sources.
Grades 11–12 CCSS.ELA-Literacy.RH.11-12.6 Evaluate authors' differing points of view on the same historical event or issue by assessing the authors' claims, reasoning, and evidence.
Integration of Knowledge and Ideas
Grade 9–10 CCSS.ELA-Literacy.RH.9-10.7 Integrate quantitative or technical analysis (e.g., charts, research data) with qualitative analysis in print or digital text. CCSS.ELA-Literacy.RH.9-10.9 Compare and contrast treatments of the same topic in several primary and secondary sources.
Grades 11–12 CCSS.ELA-Literacy.RH.11-12.8 Evaluate an author's premises, claims, and evidence by corroborating or challenging them with other information. CCSS.ELA-Literacy.RH.11-12.9 Integrate information from diverse sources, both primary and secondary, into a coherent understanding of an idea or event, noting discrepancies among sources.
Content Standards—Extension Activity
The activity meets the following Common Core Standards for speaking and listening.
Comprehension and Collaboration
Grades 9–10
CCSS.ELA-Literacy.SL.9-10.1.a Come to discussions prepared, having read and researched material under study; explicitly draw on that preparation by referring to evidence from texts and other research on the topic or issue to stimulate a thoughtful, well-reasoned exchange of ideas.
CCSS.ELA-Literacy.SL.9-10.1.d Respond thoughtfully to diverse perspectives, summarize points of agreement and disagreement, and, when warranted, qualify or justify their own views and understanding and make new connections in light of the evidence and reasoning presented.
Grades 11–12
CCSS.ELA-Literacy.SL.11-12.1.a Come to discussions prepared, having read and researched material under study; explicitly draw on that

preparation by referring to evidence from texts and other research on the topic or issue to stimulate a thoughtful, well-reasoned exchange of ideas.
CCSS.ELA-Literacy.SL.11-12.1.b Work with peers to promote civil, democratic discussions and decision-making, set clear goals and deadlines, and establish individual roles as needed.
CCSS.ELA-Literacy.SL.11-12.1.c Propel conversations by posing and responding to questions that probe reasoning and evidence; ensure a hearing for a full range of positions on a topic or issue; clarify, verify, or challenge ideas and conclusions; and promote divergent and creative perspectives.
CCSS.ELA-Literacy.SL.11-12.1.d Respond thoughtfully to diverse perspectives; synthesize comments, claims, and evidence made on all sides of an issue; resolve contradictions when possible; and determine what additional information or research is required to deepen the investigation or complete the task.
CCSS.ELA-Literacy.SL.11-12.3 Evaluate a speaker's point of view, reasoning, and use of evidence and rhetoric, assessing the stance, premises, links among ideas, word choice, points of emphasis, and tone used.
Presentation of Knowledge and Ideas
Grades 9–10
CCSS.ELA-Literacy.SL.9-10.4 Present information, findings, and supporting evidence clearly, concisely, and logically such that listeners can follow the line of reasoning and the organization, development, substance, and style are appropriate to purpose, audience, and task.
Grades 11–12
CCSS.ELA-Literacy.SL.11-12.4 Present information, findings, and supporting evidence, conveying a clear and distinct perspective, such that listeners can follow the line of reasoning, alternative or opposing perspectives are addressed, and the organization, development, substance, and style are appropriate to purpose, audience, and a range of formal and informal tasks.