Embed Size (px)
Citation preview

Protecting Workers in theDigital Platform Economy
Prepared by the Indian Federation of App-based Transport workers (IFAT)in collaboration with the International Transport Workers' Federation (ITF), New Delhi Office
Investigating Ola and Uber Drivers' Occupational Health and Safety

About
The Indian Federation of App-based Transport Workers (IFAT) is a worker’s
organisation representing app-based transport and delivery workers. It has affiliate
unions from 10 cities across India with a membership of more than 20,000. It was
founded in December 2019 in Mumbai. IFAT is working extensively to champion the
labour rights of workers driving and riding for companies like Ola, Uber, Swiggy,
Zomato etc. IFAT is committed to work for the interest of app-based transport and
delivery workers through organizing, collectivizing, campaigning and collaborating
with unions and other civil society organisations aiming for decent work conditions,
policy formulation and regulation through advocacy and labour activism.
The International Transport Workers Federation (ITF) in Asia Pacific represents
over 2 million paid membership of transport workers through its affiliates—the
largest transport union membership outside of Europe. The Asia Pacific region
covers 30 countries and has a number of regional teams working to strengthen
transport workers’ rights. ITF’s Delhi Office is primarily responsible for affiliates in
South Asia and is working to increase trade union membership, improve union
capacities through education and skills building, and promote solidarity.
Acknowledgements
IFAT would like to express gratitude for the Centre for Internet and Society’s (CIS)
support in the post-production of this report. Akash Sheshadri, Ambika Tandon, and
Aayush Rathi, in particular, provided invaluable support.
1
Table of Contents
INTRODUCTION 5
SURVEY INFORMATION 8
Cities & Respondents 8
Need for this Study 9
DATA ANALYSIS 12
Demographic Information 13
Age Groups 13
Gender Composition 15
Employers 15
Additional Information 17
Educational Qualification 19
Income Groups 20
Harassment Faced by Drivers 22
Social Security & Protection 24
Health Issues & Indicators 26
Effects of Long Working Hours & Insufficient Rest 28
Addiction due to Work 30
Additional Health Issues due to Work 33
IMPLICATIONS OF PRECARITY 37
The Opacity of the System 38
Dehumanizing Work Practices 38
State Apathy & Excesses 39
CONCLUSION 41
REFERENCES 43
2
EXECUTIVE SUMMARY
This research studies occupational health and safety among app-based transport
workers, and identifying health conditions, risk factors, and unhealthy patterns of
behaviour that are a result of poor conditions of work. It also attempts to understand
the factors that limit workers’ access to health insurance or safety nets in case of
emergencies. The research also focuses on harassment faced by drivers from
customers, traffic officials and app-based transport companies significantly affects
their mental health. It highlights workers’ exposure to factors such as sleep
deprivation and substance abuse, which further puts them at risk of poor health.
The report also studies expenditure on health and access to safety nets such as
insurance, including the factors and priorities that workers take into account before
taking a decision on healthcare expenses.
This research was initiated through the efforts of the International Transport
Workers Federation (ITF), Delhi Office and the Indian Federation of App-based
Transport Workers (IFAT) between July and November 2019.
Surveys were conducted with 2,128 respondents from the following
6 cities: Bengaluru, Chennai, Delhi NCR, Hyderabad, Jaipur, and
Lucknow.
The questionnaires were distributed through WhatsApp. A majority of respondents
were “young adults” i.e. aged between 20 to 40 years. The subsequent inferences in
relation to work, income, health etc. were arrived at using age as the
governing parameter.
We found that health issues arising directly as a result of conditions of work is
affecting the day-to-day lives of workers. Backache, constipation, liver issues, waist
pain and neck pain are the top five health ailments that app-based transport
workers suffer from due to their work. A significant number of respondents, 60.7%
identified backache as a major health issue.
3

Another key finding is the complete absence of social security and
protection—a glaring 95.3% claimed to have no form of insurance,
accidental, health or medical.
We discuss the role of app-based companies in exploiting workers through an
opaque algorithmic system, which determines who gets to work and how they will
be compensated. These systems also determine penalties and grievance redressal,
which have an impact on the occupational health and safety. Critically, the design of
systems and logics of compensation are completely invisible to workers,
undermining their capacity to protect their rights.
We aim for this research to become a basic tool for trade unions and civil society
organisations working to protect labour rights and dignity of app-based transport
and delivery workers. This is the first step in a process to start this dialogue and
undertake future research to further develop our understanding of workers’ health
and safety in the so-called gig economy.
4

Owing to decline in earnings which forces long working hours, abetted by insecure and hazardous work, drivers are faced with health issues and stress affecting their physical and mental well-being.

INTRODUCTION
Ola Cabs (hereafter “Ola”) and Uber India (hereafter “Uber”) are India’s leading
companies that provide taxi services through their mobile applications. They have
successfully disrupted and changed the structure and operations of the Indian taxi
industry in the last over 6 years. Their business model has made it possible for people
to book a ride and pick-up from their doorstep at affordable rates and with a
minimum wait time.
Uber had the 2nd largest market operations in the world in India till 2015 and it was 1
reported that India had over 5 million weekly active riders in August 2017. Uber
currently controls 40% of the market in India, the world's 3rd largest. Domestic rival
Ola is the market leader, with a share of 56% . Ola operates in nearly 125 Indian cities, 2
offering cabs, auto rickshaws, and even two-wheelers while Uber services are
available in 36 cities. On a rough estimate available it is being speculated that there 3
are about 4.75 lakh vehicles operating for Uber and approximately 10 lakh vehicles
for Ola across India. Ola is also diversifying and making forays into the mobile
payment business through Ola Money , cloud kitchen, grocery delivery etc. Ola and 4 5
Uber engage drivers for business purposes through three categories of vehicles;
fleet, leased and partner.
These companies have a few categorisations of car ownership arrangements. These
are:
● Partner vehicles are those which are owned by the drivers themselves and by
registering with Ola and Uber through their online platform and after physical
verification of relevant documents and the vehicle, drivers can utilize their ride
1 "India Now Uber's Second Largest Market Following Expansion To 7 ....". https://techcrunch.com/2015/07/01/uber-india/. 2 "Uber Revenue and Usage Statistics (2019) - Business of Apps.". https://www.businessofapps.com/data/uber-statistics/. 3 "Ola vs Uber: The latest score in the great Indian taxi-app game - Quartz.". https://qz.com/india/1545042/ola-vs-uber-the-latest-score-in-the-great-indian-taxi-app-game/. 4 "Ola enters the mobile payments space with Ola Money - Livemint.". https://www.livemint.com/Companies/P4REfJgDkjHWkIi6q9shBP/Ola-enters-mobile-payments-space-with-Ola-Money.html. 5 "India's Ola switches gears on its food delivery business ...." 21 May. 2019, https://techcrunch.com/2019/05/21/ola-foodpanda-update/.
5

sharing service for earnings for a certain commission claimed by Ola and Uber from
the fare.
● Leased or “driver under a partner” (specifically for Uber), drivers who don’t own a
vehicle can lease a vehicle from Ola for Rs. 31,000 security deposit with a daily rental
fee of Rs. 1,150 while Uber drivers can start driving after registering for an Uber Fleet 6
vehicle as a cab driver. These drivers drive exclusively for Ola or Uber, based on which
company they register with.
● Fleet operators/owners have a number of vehicles registered with either of the
companies. Ola also provides assistance in securing drivers for fleet vehicles if fleet
operators/owners are unable to onboard them.
The drivers who drive for Ola and Uber end up driving for more than 15 hours a day.
They do so in order to justify the cost of fuel consumed, to pay the commission/EMI
they owe to Ola/Uber and even then, they don’t take home a decent enough earning
for survival.
The earnings of the driver have dwindled from Rs. 70,000-1,00,000
to Rs. 22,000-25,000 per month over the last 4 years . This 7
astronomical drop was fuelled by incentives and bonuses being cut
coupled with the rise in fuel prices and decrease in per kilometre
rates by Ola /Uber, pushing drivers towards
urban poverty . 8
Apart from the long hours they are plying their vehicles on the road, drivers also have
to be wary of harassment and violence from riders, the police and rash drivers.
There have been numerous reported incidences where drivers have been robbed,
abducted or in some cases even murdered during/after a ride. The virtual employers
bear no responsibility towards their driver partners in the event of an accident or any
untoward episode they encounter while driving. Owing to decline in earnings which
forces long working hours, abetted by insecure and hazardous work, drivers are
6 "How to Start Business with Ola and Uber in 2019 | WHITEDUST.". https://www.whitedust.net/how-to-start-business-with-olauber-taxi-for-sure/. 7 "No easy exit as Ola and Uber drivers in India face spiralling debt trap ....". https://www.thenewsminute.com/article/no-easy-exit-ola-and-uber-drivers-india-face-spiralling-debt-trap-102558. 8 "The challenges before cab aggregators in India - The Economic Times.". https://economictimes.indiatimes.com/industry/transportation/shipping-/-transport/the-challenges-before-cab-aggregators-in-india/articleshow/66394551.cms.
6

faced with health issues and stress affecting their physical and mental wellbeing.
These exploitative practices by the companies and aggravating circumstances are a
cause for an in-depth look into how the lives and livelihoods of the drivers are
affected. A serious focus on health and safety is needed to address issues faced by
the workers in the field.
To ascertain the wellbeing of drivers an elaborate study has been undertaken by
International Transport Workers Federation (ITF), Delhi Office in collaboration with
Indian Federation of App based Transport workers (IFAT) across major cities where
Ola and Uber operate. The initial data that has been collected reiterates the
legitimate concerns in relation to the health and safety of Ola and Uber drivers.
Although Ola and Uber have claimed that there exist health
insurance schemes for drivers and future initiatives being
advertised and announced, on the ground none of these plans or
measures are available to the drivers.
7

Service agreements essentially absolve the ride sharing/hailing company of all liabilities and responsibilities towards drivers and riders. Uber has also stopped using the word “partner” in the agreement and now defines individuals utilizing their app service for commercial gains as “customers”.

SURVEY INFORMATION
Cities & Respondents
Quantitative data has been collected through a questionnaire with Ola and Uber
drivers in Lucknow, Jaipur and the Delhi NCR region. The questionnaire was
prepared in both English and regional Indian languages in order to reach out to a
larger base and develop a comprehensive understanding of health and safety issues
and concerns of Ola and Uber drivers. It was designed to address three broad
themes: security, safety and health of drivers, which were identified through
preliminary interaction with drivers in these 3 cities. It is extensive in order to capture
all of the concerns raised by drivers, but is not exhaustive as beyond the core issues,
drivers in each city have their own set of problems and priorities.
Informal interviews with drivers in these cities were also conducted to ascertain their
awareness in relation to mental wellbeing and other issues they might be facing due
to their work. The questions in relation to mental health were not added to the
questionnaire as enquiries about an individual’s psychological constitution could be
met with derision and denial. The questions in relation to understanding about the
need for protection if engaging in sexual relations with multiple partners also
provided an insight into how taboo issues are perceived in the Indian society and
how there is always a push back to what is perceived to be immoral and corrupt.
In consultation with an external research organisation—IT for Change —the 9
questionnaire was further trimmed and tailored to focus on the central themes
exclusively. The questionnaire was then translated into the vernacular regional
languages for Bengaluru, Chennai and Hyderabad respondents. The respondents
from these cities provided a better insight and comprehensive picture on how
drivers driving for Ola and Uber are being exploited and the apathetic nature of the
organisations and state. These southern cities are also IT hubs, this control condition
provides an additional parameter that needs to be considered when gig/platform
work is being evaluated. In these cities the drivers also drive for IT companies, so not
9 "IT for Change." https://itforchange.net/. IT for Change is an NGO based in Bengaluru, India. It works in the areas of education, gender, governance, community informatics and internet/digital policies push the boundaries of existing vocabulary and practice, exploring new development and social change frameworks.
8

only do they work for multiple platform operators, they also work for multiple forms
of employers.
The hurdles in relation to collecting data included the limited time available to the
respondents to fill out the questionnaire and issues the drivers had with
understanding the questionnaire. Even though the questionnaire was in both
English and the regional vernacular language, due to the educational drawbacks of
some of the drivers, comprehending it was hard for several respondents. Possibility
of interviewing the families of the driver also needs to be considered in the future to
ensure that a holistic view of how the work of these respondents affects not only
their lives but also that of their dependents, relations and friends. This research is
necessary to work towards the ILO’s has proposed policy intervention to ensure the
well-being of workers engaged in digital labour platforms . The balance between 10
work and life for these app-based “drivers” needs to be scrutinized and the impact
their work has on multiple individuals connected directly or indirectly with them
needs to be evaluated.
Need for this Study
The requirement of this research at this juncture in India is critical in order to initiate
a dialogue between the government and the “aggregators” as they have been
defined in the Motor Vehicles (Amendment) Act, 2019, to safeguard the interests of 11
the vulnerable workforce. The government through various news media outlets has
announced that it plans to approach stakeholders for discussion in order to draw up
guidelines on how app-based ride sharing companies should be regulated in the
cities. In doing so the government has taken a positive step in reining in the irregular
operations and shedding light on the inscrutable business practices of these
companies. But if the “drivers/driver partners”, who comprise the workforce running
these businesses, are not represented in this policy and guideline making process,
they shall continue to remain disenfranchised.
10 "The architecture of digital labour platforms: Policy recommendations on platform design for worker well-being - ILO." https://www.ilo.org/wcmsp5/groups/public/---dgreports/---cabinet/documents/publication/wcms_630603.pdf. 11 "THE MOTOR VEHICLES (AMENDMENT) ACT, 2019 ... - Gazette of India." 9 Aug. 2019, http://egazette.nic.in/WriteReadData/2019/210413.pdf.
9

With the new code on wages they are rendered even more 12
invisible as neither the “aggregator” nor the “driver partner” are
recognised or mentioned in the new wage codes. The government
has proposed in the Motor Vehicle Amendment Act 2019 that the
“aggregator” will be governed by the Information and Technology
Act of 2000. This further insulates the companies from labour
litigations and allows them a freehand in how they can operate and
employ the workforce to run their businesses.
It also needs to be pointed out that Ola and Uber have recently updated their service
agreement for both their riders and drivers , . It has been observed that service 13 14
agreements essentially absolve the ride sharing/hailing company of all liabilities and
responsibilities towards drivers and riders. Uber has also stopped using the word
“partner” in the agreement and now defines individuals utilizing their app service for
commercial gains as “customers”. This can be seen as Uber distancing itself from any
language that would make them accountable towards providing the drivers with
social security or any form of protection and acknowledging any form of
“employee-employer” relationship. It is essential for any new regulation that the
government may initiate to safeguard the interests of the drivers needs to be
cognizant of this.
To make sure that the government takes cognizance of the issues of the workforce
not only in formulating the guidelines but also to ensure a holistic understanding of
how work affects the drivers and their family, there is an urgency for
this research.
Occupational health is a very important indicator that has been
used globally in determining under what circumstances are drivers
working and its effect on their lives . 15
12 "THE CODE ON WAGES, 2019." 18 Jul. 2019, http://164.100.47.4/BillsTexts/LSBillTexts/Asintroduced/184_2019_LS_Eng.pdf. 13 "Changes in lease agreement take Ola cabbies for a ride ...." 21 Jul. 2019, https://timesofindia.indiatimes.com/city/hyderabad/changes-in-lease-agreement-take-ola-cabbies-for-a-ride/articleshow/70321535.cms. 14 "Uber's new terms for users say it's a 'tech co connecting riders ...." 1 Oct. 2019, https://www.livemint.com/companies/start-ups/uber-s-new-terms-for-users-say-it-s-a-tech-co-connecting-riders-and-drivers-11569922192623.html. 15 "The Gig Economy and Contingent Work: An Occupational ... - NCBI." 27 Feb. 2017, https://www.ncbi.nlm.nih.gov/pmc/articles/PMC5374746/.
10

This involves understanding the impact that the precarious and hazardous nature of
work affects drivers’ physical and mental health. The absence of any form of social
protection or insurance schemes increases the precarity of the work due to the
health and social inequalities associated with it . This current assessment of health 16
for Ola and Uber drivers will provide a baseline to further negotiations on the critical
issues the drivers are plagued with.
This research is also in line with the recent push by the Government of India to
introduce the Code on Social Security, 2019. A third draft has been circulated for
comments and discussions between concerned and expert individuals and
organisations . The Occupational Safety, Health and Working Conditions Code, 201917
is also in the works. This research can provide a foundation on which a policy stand 18
can be taken on how perspectives of workers of the platform economy need to be
taken into account when negotiation over labour rights takes place.
16 (n.d.). OECD 2015 In It Together Chapter 1 Overview Inequality. Retrieved August 20, 2019, from https://www.oecd.org/els/soc/OECD2015-In-It-Together-Chapter1-Overview-Inequality.pdf 17 "THE CODE ON SOCIAL SECURITY, 2019 - Ministry of Labour ...." https://labour.gov.in/sites/default/files/THE_CODE_ON_SOCIAL_SECURITY%2C2019.pdf. 18 "The Occupational Safety, Health and Working Conditions ...." 16 Jul. 2019, http://164.100.47.4/BillsTexts/LSBillTexts/Asintroduced/186_2019_LS_Eng.pdf.
11

Over the years, the earnings have dwindled drastically for the drivers/driver partners; commission rates have increased, and minimum guaranteed business reduced resulting in workers being saddled with loans for vehicles they cannot afford or abandon.

DATA ANALYSIS
Surveys for this study were conducted across 6 cities in India to assess the health
and safety issues faced by Ola and Uber driver partners due to their work. The
surveys were conducted between July-November, 2019. There were 2128
respondents, with the largest number of respondents from Bengaluru (1,159). The
broad aim of the surveys was to ascertain the nature of health ailments that afflict
the driver partners as a result of their working conditions. The survey also focused on
their expenses and savings, harassment they faced on road, safety and security,
impact and stress due to work etc. The findings from the survey captured in this
report will be a tool that the workers can use against Ola and Uber in their fight for
dignity and decent work.
Ola and Uber are engaged in court battles with various states to retain their identity
of being an aggregator and as a service provider. The corporate and legal parlance
used by Ola and Uber obfuscates the nature of the working relationship that exists
between them and the drivers. In doing so, they also ignore almost all concerns and
predicaments faced by their partners on the road; be it legal, criminal, medical,
financial or otherwise.
Drivers for Ola and Uber have reiterated that the organisations
provide no assistance with regard to harassment and violence while
they are on the road.
Ola or Uber for the most part do not intervene if there is any intimidation from traffic
police or local authorities, incidents of road rage, violent attack by customers or
criminal elements that endanger drivers’ lives, accidents while driving etc. Efforts in
terms of providing assistance after the drivers/driver partners have faced these
unfortunate events has also been absent. Ola and Uber always fall back to the
argument that their organisation being an aggregator and drivers being partners
absolves them of any responsibility they have towards the drivers. It is curious then,
how these companies regulate the manner in which drivers operate, through their
commission and incentive structures, penalising through the blocking of drivers’ IDs
based on ad hoc company policies and rules.
12

The survey instrument was a questionnaire dispensed via Google Forms. These
questionnaires were forwarded by WhatsApp messages to the drivers. The process
has been a lengthy exercise, but the responses collected provide an initial
understanding of the health and safety concerns of the drivers engaged with
app-based ride sharing companies.
Demographic Information
The basic demographic details that have been collected from the respondents of 6
cities can be segregated into age, gender, and employer they work for. Additional
information on educational qualification, income, family size, marital status, religious
faith, migration etc. was not consistently available from all the respondents, so they
have not been included in the analysis.
Although this shortcoming in terms of data collection reveals the research gaps that
affect this research, this also presents the opportunity for future research to focus on
and use these data points as determinant parameters/factors for evaluating how
app-based transport and delivery workers lives and work are affected by them. Also,
in this research ‘age’ has come across as a significant variable against which the rest
of the data collected have been scrutinized.
Age Groups
The details that have been collected have been listed and analyzed in the
following sections.
Age group (in years) No. of Respondents
20 - 30 917
30 - 40 949
40 - 50 188
50 - 60 19
60 and above 5
13

This shows that the largest section of the workforce is “young adults” . When we 19
connect the data for the age group 20 to 40 years of age against the number of
years they have been working with the companies, some basic correlations can
be made.
No. of years in service No. of Respondents
0 - 2 477
2 - 4 1017
5 - 6 300
From the table it can be inferred that most of the driver partners
have joined the app-based companies quite recently. It was also
observed from the data that 48% of the respondents were in the 30
to 40 years of age bracket who have been working with the
companies for the last 4 years.
This also tips us to the information that these individuals are essential breadwinners
for their families. If we correlate this data with the accounts of the app-based 20
transport workers that have been chronicled over the years it can be observed that
the respondents had initially joined the work at a time when there was an
unprecedented competition between app-based transport companies in India. This
was during the period when Uber had started its operation in India and was offering
cut throat prices and earnings to both its customers and driver partners in
comparison to the local competitor Ola. So, it can be assumed that the respondents
had joined the “gig economy” in the period between 2015 - 17. This was also the
period when Ola and Uber started the leased part of their business model. An
individual could on down payment (usually between Rs. 30,000 to Rs. 40,000) lease a
19 "Young Adults (Ages 18-35) | UUA.org." https://www.uua.org/young-adults. Based on Erik H. Erikson’s research this stage is between the ages of 19 and 39. 20 "A Case study on Ola and Uber from the driver partners ...." https://tiss.edu/uploads/files/Cab_Aggregator_Services.pdf.
14

vehicle from either company. Over the course of 3 years, while working for the
company as a driver partner, they could keep paying a fixed daily EMI (usually
between Rs. 1300 to Rs. 1500), and he/she could eventually own
the vehicle.
Gender Composition
Additional demographic details in relation to gender from the data that has been
collected shows us that it is homogeneous in nature as all the respondents were
male across 6 cities. Although there are female cab drivers driving for app-based
companies in India they represent a miniscule component of the workforce. The
unions that have contributed to the research have claimed to have female
membership, but the data does not reflect that. To get a better picture of how the
female workforce in this sector are surviving in the rising platform economy there is
a need for future research focused solely on understanding the female perspective
who work for app-based transport and delivery companies. It is suggested that any
future exercise should take this into consideration and focus on the gender concerns
in this industry.
Employers
The respondents working for app-based transport companies from the data that
was collected show that they work for both the competitors, Ola and Uber. They
tend to switch between application based on the “surge pricing” or daily incentives 21
they are able to achieve on a particular day based on the business they can rake up.
Employers Ola Uber Both
No. of Respondents 520 320 1235
It can be seen from the data that the larger section of the workforce, even if they are
working independently, have preferred to work for Ola. The implications of this
21 "What Is Surge Pricing? | Transportation Plus." 20 May. 2018, https://www.tplusride.com/what-is-surge-pricing/. Commuters need to pay an extra amount to avail the service during odd hours or high demand periods.
15

information on why people drive for Ola more than Uber also brings to light the issue
of ownership of the vehicle. Who are the people who drive for Ola?
Ownership of the Vehicle
Employer
Ola Uber Somebody Else Own
Ola 73 1 87 355
Uber 1 19 57 241
Both 14 4 191 1020
It can be observed from the data that a large section of the people
who either drive for Ola or Uber or for both, own their vehicle while
only 14% for Ola and 5% for Uber have informed that they drive
vehicles owned by the company (leased vehicle).
On further probing and subsequent interviews with the driver/driver partners it was
uncovered that of the respondents who own their own vehicle, a significant number
are also driving “leased vehicles” but are at the cusp of making the final payments to
claim it as their own . Although Ola and Uber both have their own leasing arms (Ola 22
Fleet Technologies and Xchange Leasing India Pvt. Ltd), Ola captures a much larger
chunk of the market in terms of number of vehicles on the road in India. This
revelation also emphasizes the need to differentiate between the various types of
drivers who are driving for Ola and Uber.
22 This refers to the leasing scheme of Ola where on completion of EMI payment over the period of 3 years, the vehicle taken from the company on lease comes into the possession of the driver.
16

Within the ridesharing and gig economy model of operation of
app-based companies there also exists the third-party outsourcing
of work by individuals who informally lease out their vehicles on a
fixed rate to individuals who do not own any vehicle of their own.
The type of contract and gig work these workers are engaged in comes with its own
sets of problems and exploitative practices.
On further inquiry it is also seen that the drivers who drive for
“Somebody else” (15.7% of the respondents), are migrants.
This also shines light on how much it is necessary to bring in the outlook of these
workers and their concerns in relation to their lives and livelihood.
Additional Information
Although the data collected from 6 cities have some inconsistencies and disparities,
it can be grouped into two zones, North Zone comprising Delhi NCR, Jaipur,
Lucknow, and South Zone made up of Bengaluru, Chennai, Hyderabad. In the data
collected from each zone there are some unique data points which are significant
and can be extrapolated to represent the total workforce working with the
app-based transport companies.
This distinction in the data collected was due to a slight variation in the
questionnaires distributed in each zone. The questionnaires were modified based on
the inputs received from the respondents and experts involved in the survey
exercise. These changes in the questionnaires were also done in order to keep it
concise and targeted, and to ensure that there was a better chance of getting
responses from the participants and reaching out to a larger section of
the workforce.
17

Marital Status
Are you married?
Age group (in years) Yes No
20 - 30 114 20
30 - 40 61 2
40 - 50 29 2
50 - 60 3 0
60 and above 17 1
This data was collected from the North Zone in relation to age and marital status of
the workforce. It reflects what was assumed earlier in relation to how the app-based
transport workers had a family to take care of, their spouse, children, immediate
relations etc. Although additional inquiry in relation to the size of said family is being
speculated based on the subsequent interviews that were conducted, on average
the family size of the app-based drivers was between 5-7 members. This information
collected from the North Zone will hold true for the South Zone, there may exist
outliers but all in all the pattern can be generalized across the country in case of
app-based transport workers. From the data it can be seen that 89.9% of the
respondents were married.
18

Educational Qualification
Educational qualification of the respondents
Age groups
(in years)
Primary
(Class 1 - 5)
Secondary
(Class 9 - 10)
Higher Secondary
(Class 11 - 12)
Graduate Post Graduate
20 - 30 19 38 40 33 4
30 - 40 9 21 15 14 4
40 - 50 1 14 12 4 0
50 - 60 0 1 2 0 0
60 and above 1 8 6 3 0
This data has again been collected from the North Zone and depicts the educational
qualification of the respondents. The largest section of the participants has
completed secondary education as per the Indian schooling system. Overall, 63% of
the respondents have completed either their secondary or higher secondary
education. India being a lower middle-income country, individuals have to
participate in the job market at an early age. But given the global economic
downturn and rise of the “gig economy” we are also seeing the rise of the “graduate
employee” entering into gig work and platform economy in the absence of any
other opportunity. This is no doubt a skilled profession but the influx of graduates
and in some cases post graduates in this sector points to the dismal state of the job
market.
19

Income Groups
Monthly income groups (in thousand rupees)
Age group < 20 20-30 30-40 40-50 >50
20-30 563 160 28 5 5
30-40 648 156 43 6 3
40-50 120 22 5 2 2
50-60 13 2 0 0 0
60 and above 20 7 1 0 0
The monthly household income of an app based transport driver, as per government
standards who is considered to be self-employed is anywhere between Rs. 12,153 to
Rs. 21,462 . 23
75.3% of the South Zone respondents have quoted to earn less than
Rs. 20,000 in a month after they have paid for the EMI, fuel expense,
commission, penalties etc.
It is almost twice the national per capita monthly income of Rs. 11,254 . But if we are 24
rejoicing at this fact, we are ignoring the cost required to keep a vehicle running on
the street in India. The cost of fuel, vehicle maintenance, vehicle insurance, road tax,
license renewal etc. All of this coupled with corrupt officials demanding kickbacks
and cuts to allow the drivers/driver partners to operate and earn a living.
23 "Driving for Ola or Uber in India: How Much Do You Need to ...." 16 Sep. 2019, https://in.finance.yahoo.com/news/driving-ola-uber-india-much-194831509.html. 24 "India's per-capita income rises 6.8% to Rs. 11,254 a month in ...." 7 Jan. 2020, https://www.businesstoday.in/current/economy-politics/india-per-capita-income-rises-68-to-rs-11254-a-month-in-fy20/story/393333.html.
20

These additional and at times hidden costs limit the choice for
individuals engaged to take care of their own health. Investing on
one's own health becomes a very precarious decision, allocating or
saving for health emergencies becomes secondary and, in most
cases, as it was observed amongst the respondent almost none of
them had health insurance.
Over the years, the earnings have changed drastically for the drivers/driver partners,
and with dwindling earnings feel that they are being cheated by the companies. This
is in reaction to the commission rates going up, minimum guaranteed business
going down and being saddled with loans for the vehicles they cannot afford or
abandon. Loans they had taken out based on the promises and advertisements by
the app-based companies assuring high returns on their investments. This is when
the work and work practices associated around working in the “gig economy” also
changed for the worse.
It became increasingly tough for the respondents to earn enough for
survival after their commission, penalties and EMIs were deducted
by working for only 8 hours a day.
It can be observed from the data that the number of hours against earnings for the
drivers is atrocious and borderline inhumane.
No. of working
hours in a day 0 - 8 8 - 14 14 - 20
Monthly earnings (in
thousand Rupees)
<20 20 - 30 30 -
40 <20 20 - 30 30 - 40 <20 20 - 30 30 -
40
No. of respondents 78 13 6 628 149 28 655 181 22
This data has been collected from respondents from Bengaluru, Chennai and
Hyderabad. Data from Delhi, Jaipur and Lucknow was not available.
21

From this data it can be observed that the 94.6% respondents had
to work for an average of 8 to 20 hours a day to earn between Rs.
20,000 to Rs. 30,000 a month. 49.8% of the respondents have
claimed that they work 14 to 20 hours a day. At least 72.8% of the
respondents (from Bengaluru, Chennai and Hyderabad) have
claimed that they drive for close to 20 hours a day and after paying
off their EMIs, penalties and commission to the companies and have
less than Rs. 20,000 left at the end of the month.
Given the current rate of inflation and ever-increasing expenses for the family in
relation to education, health care, food and rent surviving on such meagre earnings
for an average sized family sounds impossible.
Harassment Faced by Drivers
The dangers app-based drivers and delivery partners face just to do their job have
been documented over the years. There are instances of robbery, physical attacks
and criminal accusations by customers, intimidation by authorities and at times
harassment by the company itself. The harassment faced by the workers is not
sporadic or intermittent in nature; it is systemic of the society and industry that they
have to engage and manoeuvre through. In the survey there were questions in
relation to the issues that the drivers/driver partners have faced on the road in the
last 12 months.
22

In the last 12 months have you been
Yes No
Robbed 493 1584
Confronted by a violent customer 1456 628
Attacked while on road 708 1191
Harassed by the police 1246 823
Although instances of getting robbed or attacked on the road is of lesser probability
to occur as it can be inferred from the responses, in quite a few cases these
encounters have been fatal . While on road they would be left stranded even if they 25
encountered any emergency.
The app-based companies claim to have a robust and technology driven grievance
resolution and help support for both its customers and partners. But for drivers and
delivery partners the experience has always been disappointing and unsatisfactory.
The drivers and delivery personnel have always been left on their own as the
companies have shied away from resolving their issues. This combined with the
state apathy to their problems and the administrative machinery and officials trying
to fleece off the app-based workers at every opportunity available is representative
of harassment which has been reported to be egregious and vengeful in nature. This
also takes a toll on their mental health, manifestation of it is noticeable in their
behaviour. During the interview when it was inquired how the respondents felt
when they returned back home after work, most of them replied they were irritable
and stressed and interaction with family and friends was always tense . The long 26
25 "Delhi: Ola driver cab murdered after being robbed, killer ...." 4 Jun. 2020, https://www.indiatoday.in/crime/story/delhi-ola-driver-cab-murdered-after-being-robbed-killer-arrested-from-jharkhand-1685541-2020-06-04. 26 "Give them a brake: Ola, Uber drivers are overworking to meet ...." 30 Mar. 2017, https://www.thehindu.com/opinion/op-ed/give-them-a-brake-ola-uber-drivers-are-overworking-to-meet-targets/article17739979.ece.
23

hours they have to put in for incentives and for a decent wage while essentially
soldiering through constant abuse and insensitivity on the part of customers and the
government officials takes a toll on their health, physically and mentally.
Social Security & Protection
Although the monthly household income for the app-based transport drivers and
delivery riders are almost twice the median household income of the country, they
are still a vulnerable workforce in the absence of social security and protection. Since,
the companies they work for deem them to be independent contractors and not as
employees they abdicate their responsibility in terms of providing them with any
cover; insurance, safety measures or otherwise. The workers given the inhumane
hours they put in to earn just enough for survival tend to ignore various underlying
health issues they suffer due to their work. The survey tried to find out what possible
health and safety protections they might have, given the fact that they are working
for transnational companies, the data can be represented in the following table.
24

App-based workers who received social security protections from companies
Type of social security Number of workers
Accidental Insurance 3
Compensation for death on job 40
Health Insurance 34
ESI 6
Provident fund 8
Nothing 1826
It can be seen that the largest section of the workforce has no form
of social security or protection while working in a comparatively
high-risk profession. And even if some of the respondents may have
claimed they receive Employee State Insurance (ESI) or Provident
Fund from the companies as per the contracts of the companies
(Ola and Uber) there is no provision of such access or availability of
said schemes to the drivers/driver partners.
Through this data it is also being impressed upon that only 0.15% of the respondents
have reported that they have had access to “Accidental Insurance” which should
have been the bare minimum companies like Ola and Uber should have provided to
its drivers/driver partners. So, even if the companies are not providing social security
and protection to all of their drivers/driver partners, for their own wellbeing the
workers have secured some insurance for themselves.
25

The agencies or organisations they have secured the insurance from can be
tabulated as below.
Who has provided you with insurance?
Ola Uber Union Yourself Nobody
17 9 162 366 1544
From the table, it can be clearly observed that a large section of the workforce still
doesn’t have any form of social protection. When the respondents were interviewed
it was realized that the insurance that was secured from Ola, Uber and Union were
“Accidental Insurance”. For personal health insurance only 17.4% of the respondents
could afford it while 73.5% of the workforce didn’t have any safety net in case of
health emergencies. When it was further probed, the respondents informed that
decisions had to be made in determining which expense takes precedence in the
household for the month and usually health always takes a backseat. This shows the
dilemma in the lives of the driver/driver partner in giving importance to their own
health over running their family and lives.
Health Issues & Indicators
A 5-point “Likert Scale” was used to ascertain how the respondents felt in relation to
their health with 1 being very poor and 5 being very good. This data is representative
of all the 6 cities. Focusing on the respondents in the age group of 20 to 40 as they
compose the largest section of the workforce engaged by the app-based
companies, their responses can be listed as below.
26

Age groups in years
Health (1 = very poor; 5 = very good) 20 - 30 30 - 40
1 267 282
2 159 175
3 241 246
4 89 94
5 115 96
From this data set it can be observed that a large number of respondents have
self-assessed themselves to be either being extremely poor in health or having a
more or less neutral stand in terms of any fitness issue. Although this may seem like
a redundant test but when it is evaluated in conjunction with the number of hours
these individuals work for, sleep or rest they can get and their consumption habits
(smoking, gutkha, alcohol) this will provide an understanding of what the
respondent terms or considers an health emergency.
27

Effects of Long Working Hours & Insufficient Rest
Number of hours driving the customers
Number of hours staying in the car
0 - 8 8 - 14 14 - 20 0 - 10 10 - 16 16 - 24
No. of Respond
ents 113 914 1022 144 1101 803
Number of hours of sleep after work
0 - 4 4 - 6 6 - 8
No. of Respondents 788 1104 214
In the survey details in relation to the hours an individual is driving and the amount
of time spent in a day in the car was inquired.
From this data we can see that on average drivers/driver partners
spend close to 16-20 hours in their cars in a day. As per the data
39.8% of the respondents spent close to 20 hours in their vehicle in a
day, and nearly for the same amount of time 49.2% spend driving
customers in their vehicle.
The long hours of work in fixed positions affects cab drivers physically (muscle and 27
joint pains) and also mentally due to the work they have to perform in a hostile
environment. Insensitive, indifferent customers and traffic officials who are
disrespectful and contemptuous, this tied in with an isolated workspace marked
exclusively with stressful human interaction exasperates their mental wellbeing.
27 "Low back pain among taxi drivers: A cross-sectional study." 23 Aug. 2017, https://www.researchgate.net/publication/316896904_Low_back_pain_among_taxi_drivers_A_cross-sectional_study.
28

This might not be apparent through the data presented but follow up interviews
point to how stressed and agitated drivers/driver partners are towards the
customers and the company they have to communicate or provide service to in
order to make an earning and survive for the day. With limited to almost negligible
amount of rest to recuperate and still having to continue to work in the same work
environment day in and day out also aggravates the problem.
89.8% of the respondents claim they get less than 6 hours of sleep.
“Young adults”, who comprise a majority of this workforce, are
supposed to have a sleep duration of 7-9 hours , inadequate sleep 28
endangers not only the lives of the drivers/driver partners but also
the customers, not to mention having negative health
consequences because of it.
28 "National Sleep Foundation’s sleep time duration recommendations" https://pubmed.ncbi.nlm.nih.gov/29073412/.
29
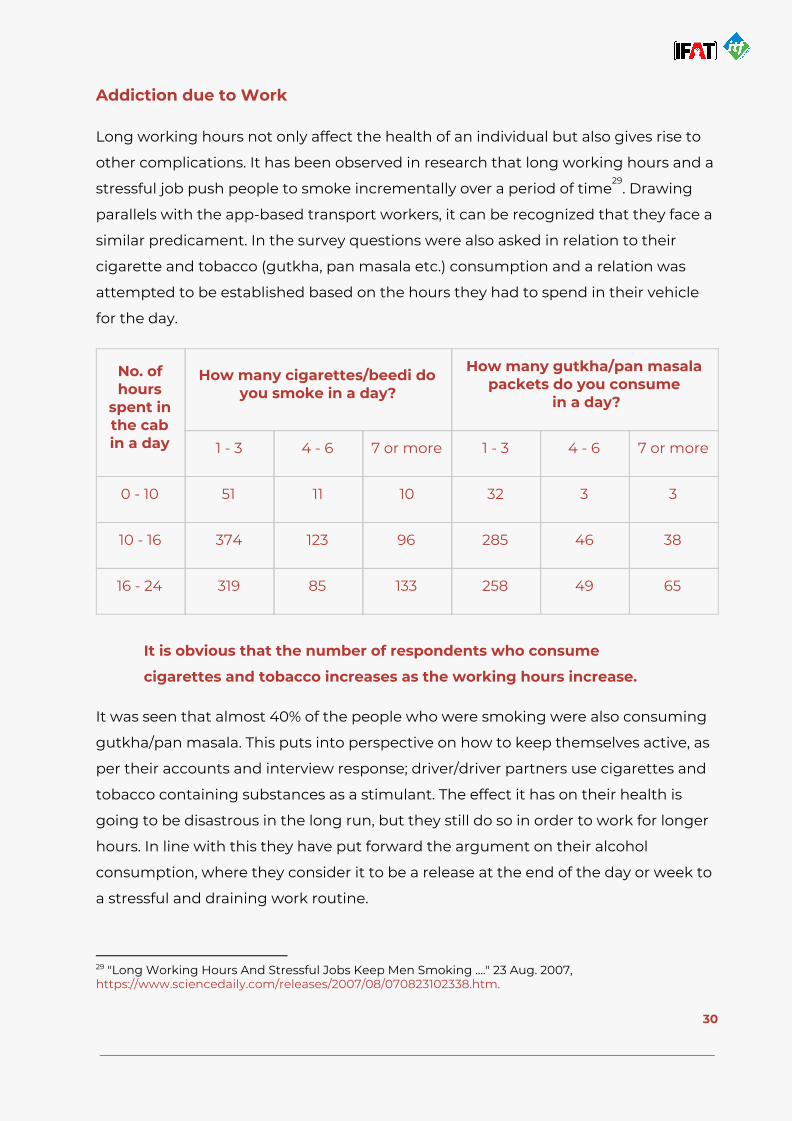
Addiction due to Work
Long working hours not only affect the health of an individual but also gives rise to
other complications. It has been observed in research that long working hours and a
stressful job push people to smoke incrementally over a period of time . Drawing 29
parallels with the app-based transport workers, it can be recognized that they face a
similar predicament. In the survey questions were also asked in relation to their
cigarette and tobacco (gutkha, pan masala etc.) consumption and a relation was
attempted to be established based on the hours they had to spend in their vehicle
for the day.
No. of hours
spent in the cab in a day
How many cigarettes/beedi do you smoke in a day?
How many gutkha/pan masala packets do you consume
in a day?
1 - 3 4 - 6 7 or more 1 - 3 4 - 6 7 or more
0 - 10 51 11 10 32 3 3
10 - 16 374 123 96 285 46 38
16 - 24 319 85 133 258 49 65
It is obvious that the number of respondents who consume
cigarettes and tobacco increases as the working hours increase.
It was seen that almost 40% of the people who were smoking were also consuming
gutkha/pan masala. This puts into perspective on how to keep themselves active, as
per their accounts and interview response; driver/driver partners use cigarettes and
tobacco containing substances as a stimulant. The effect it has on their health is
going to be disastrous in the long run, but they still do so in order to work for longer
hours. In line with this they have put forward the argument on their alcohol
consumption, where they consider it to be a release at the end of the day or week to
a stressful and draining work routine.
29 "Long Working Hours And Stressful Jobs Keep Men Smoking ...." 23 Aug. 2007, https://www.sciencedaily.com/releases/2007/08/070823102338.htm.
30

How many times in a week do you consume alcohol?
1 - 2 847
3 - 4 119
5 - 7 93
It can be observed that a significant number of respondents consume alcohol. The
impact or significance of the consumption, whether it is binge drinking or moderate
consumption is not clear from the data that is available. A more elaborate study on
alcohol consumption and its impact on various facets of the lives of drivers/driver
partners needs to be undertaken in the future to ascertain its effects on their lives
and livelihood. But as we have proceeded to question whether the respondents felt
their work has affected their consumption habits the data that has come up
highlights how an individual has observed a change in their own pattern.
Did your cigarette/beedi
consumption increase due to your work?
Did your gutkha/pan masala consumption increase due to your
work?
Did your alcohol consumption
increase due to your work?
Yes 724 455 608
No 445 599 572
Maybe 171 166 159
This data has been collected from the respondents from Bengaluru, Chennai and
Hyderabad, similar data was not available for the North Zone.
The data set shows how the respondents themselves have felt that
their consumption of cigarette, tobacco and alcohol have
significantly increased due to their work.
31

Medical journals over the years have chronicled how stressful work and work
environments contribute to addiction. The implications of this data set is that the
health issues such a lifestyle will entitle to will be severe and deleterious. These are
precursors of serious health ailments that the respondents would suffer from
subsequently, but in the absence of a proper safety net or social security or
protection, their family and they themselves will be left in the lurch.
32

Additional Health Issues due to Work
Below is a table listing out the health concerns that could be identified from the
interactions with the driver partners which they attributed to their work.
Health Issues faced by the driver partners
Age group of the respondents in years
20-30 30-40 Total
Back Ache 544 589 1133
High Blood Pressure 290 320 610
Neck Pain 321 384 705
Neck Pain 360 404 764
Respiratory Problems 244 265 509
Hand Tremors 177 208 385
Stress 337 348 685
Dizziness 155 168 323
Skin Inflammation 306 311 617
Eyesight 327 359 686
Constipation 413 491 904
Joint Pain 221 221 442
Piles 340 390 730
33

Headache 234 223 457
Liver Issues 427 454 881
Waist Pain 418 457 875
Obesity 323 338 661
Diabetes 168 197 365
Urinary Issues 242 306 548
Stomach Problems 270 279 549
The most frequent ailments faced by the respondents in the age group of 20-40 that
are back ache, constipation, liver issues, waist pain and neck pain.
60.7% of the respondents have claimed to have back problems. This
can be attributed to the long hours the app-based workers have to
be on the road and keep on driving in a rigid fashion.
Irregular food hours available to them due to their work also contributes to their
problem in relation to constipation and other stomach related issues. What is also
evident is that physical discomfort due to work such as back, neck and waist pain
was acknowledged by the workers but its long-term impact on their health is still
overlooked. The other issues that need to be looked into are in relation to stress that
they face and high blood pressure. These are silent killers that creep up on an
individual unbeknownst to them. Although high blood pressure is less frequently
observed, when paired with the more frequent obesity, diabetes and stress it's a sure
shot recipe for disaster for the workers. And workers tend to ignore, overlook or
simply put these concerns on hold to just survive. When this issue was probed
further the lack of financial stability due to the nature of their work was the most
important reason that popped up due to which the respondents tend to ignore the
severity of these health issues that arise due to their work.
34

This can also be traced back on the basis of what they earn in a month and how
much they are willing to spend on health in a year. This will also bring into light how
vulnerable the workers are and how much hardships and tough decisions they have
to take in terms of their own and their families health. The data here is for the cities
of Bengaluru, Chennai and Hyderabad, similar could not be collected from the other
cities. The data is again fixed for age groups between 20 to 40 as that is the target
population the research deems significant in identifying the problems of the
app-based workers.
Age group of the
respondents (in years)
20-30 30-40
Annual expenditure on health and medical expenses (in thousand rupees)
Monthly income (in thousand rupees)
1-5 5-15 15 > 15 1-5 5-15 15 >15
<20 188 (36)
208 (40)
104 (20)
22 (4) 225 228
101 43
No. of respondents
20-30 72 (56)
50 (39)
20 (16)
5 56 56 21 7
30-40 10/28 11 4 2 18 11 4 8
Irrespective of age and income group, most drivers are unable
to contribute even a month’s earnings to their annual
expenditure on health. This is particularly telling in light of
the frequency of health issues that they face.
35

Due to absence of health insurance and other social security and protection services,
the allocation of monthly expenses on health is a decision that the driver partner has
to take after serious thought and is made in times of urgency.
73.5% of the respondents did not have any health insurance.
This elaborates the point that the workers were unlikely to invest in health insurance
as they are faced with financial constraints in relation to running their families and to
ensure basic survival. With the absence of any form of social security or protection ,
untreated problems developed from work tend to become chronic, and coupled
with addictive habits brought on by their work and stress, reduce life expectancy of
the workforce significantly. As we see the ground reality, the gig economy is far from
the emancipatory road to self-actualization and freedom. It has the same, if not more
aggressive, vectors of worker exploitation.
36

The "gig economy" is far from the emancipatory road to self-actualization and freedom. It has the same, if not more aggressive, vectors of worker exploitation.

IMPLICATIONS OF PRECARITY
The platform economy is churning out jobs which are precarious and hazardous in
nature at an unprecedented rate in the last few years. Although the free market
maxim of these companies would argue that the worker being a free agent and not
an employee has the free will to log out whenever they want to. But this rationale
ignores the fact that it's the companies themselves that had enticed and entrapped
the vulnerable and marginalized workforce through initial programmes of high
incentives and bonuses.
Drivers can’t exit their current occupational status even if they want
to because they are shackled in debts and outstanding EMIs. As a
result, they race every day to complete targets so that they may
earn just enough to pay these liabilities.
The responses from the drivers in relation to their work when analysed through the
lens of precarity and forced/bonded labour ticks all the checkboxes. The work 30 31
these drivers are engaged in cannot be considered to be within the ambit of decent
work and in reality, is representative of modern slavery where a worker is not 32
bound by chains anymore but by debts and contracts.
The apathy of the state and the exploitation by app-based companies have brought
the transport and delivery workers in a precipitous position across the globe. This is
underlined and explained by the absence and lack of any social security or
protection for the workforce, there are some other issues that the workforce is
battling in these perilous times not only with the company but also the state. The
core issues that the Ola and Uber drivers are gripped with can be broadly classified
into these three categories, but these categories are not conclusive or exhaustive as
in each city the drivers will have their own set of problems which they prioritize over
the others.
30 "An Index of Precarity for Measuring Early Employment Insecurity." 18 Oct. 2018, https://link.springer.com/chapter/10.1007/978-3-319-95420-2_16. 31 "Measurement of forced labour - ILO." 19 Oct. 2018, https://www.ilo.org/wcmsp5/groups/public/---dgreports/---stat/documents/meetingdocument/wcms_636050.pdf. 32 "What is modern slavery? - Anti-Slavery International." https://www.antislavery.org/slavery-today/modern-slavery/.
37

The Opacity of the System
Drivers working in various cities and working for different
app-based platforms have complained about the lack of
transparency in how these app-based companies determine fares,
promotional cost, surge pricing, incentives, penalties and bonuses.
There is little to no information on how rides are being fixed or are
being allocated.
The drivers are always in the dark in terms of what is happening at the software end
of the business. Companies need to answer critical questions that determine the
income of workers: how does the rating system work for a driver in getting
rides/fares or their income? Are the customers rated on the same parameters as the
driver is being adjudged on? What is the relationship between the state monitoring
and regulating authorities/agencies and the companies?
Dehumanizing Work Practices
The drivers have complained how there doesn’t exist any effective
grievance redressal mechanism to resolve any of the issues faced by
them.
The automated system and scripted responses from the call centre personnel tend
to overlook and trivialize their problems and concerns. The algorithm keeps nudging
and needling them to complete at times impossible targets for insubstantial
incentives and bonuses . Due to long working hours the drivers lead a very isolated 33
existence in terms of social interaction with their families or friends, which have
become limited to non-existent in case of some of the drivers. The riders/customers
also exacerbate the problem, as most of the times the interaction between a driver
with the rider/customer is confrontational and the tone the rider/customer
addresses the driver is that of indignation and disdain.
33 "What People Hate About Being Managed by Algorithms ...." https://hbr.org/2019/08/what-people-hate-about-being-managed-by-algorithms-according-to-a-study-of-uber-drivers.
38

The drivers feel like they have been reduced to a cog of the machinery that exists
only to generate profit for its shareholders while shunning the human who drives
the business.
State Apathy & Excesses
The drivers also expressed their discontent on how the state machinery seems to be
working hand in glove with the companies.
The disappointing outcomes to major agitations spearheaded by
drivers unions and associations in recent times , ever increasing 34
road and municipal taxes for commercial vehicles , little to no 35
regulation of how these “aggregators” operate in the city, the
precariousness and hazardous nature of the job with no
intervention from either the state agencies or
employers/aggregators, absence of social security and protection.
These are but the tip of the iceberg on how the state regulatory authorities are
relegating their role in restraining the malpractices and bad faith conduct by the
aggregators towards the drivers. With the new Motor Vehicle (Amendment) Act
2019, the drivers have been further disenfranchised, all issues pertaining to
“aggregators” would be resolved under the Information and Technology Act 2000,
further denying the drivers their identity as employees working for an employer . 36
Although the concerns of the drivers have been categorized in these 3 major
brackets, the grave issues of importance or engagement if we have to pinpoint, it is
of fare and health. Commission deduction and how these aggregators determine
penalty and overall fare for the trip is not a transparent process. The confounding
nature of the financial statements the drivers are provided in relation to their
remuneration seems to edge on duplicity and deception.
34 "Ola, Uber drivers' strike to continue till Thursday, union to take ...." 31 Oct. 2018, https://timesofindia.indiatimes.com/city/mumbai/ola-uber-drivers-strike-to-continue-till-thursday-union-to-take-final-call-after-discussions/articleshow/66443088.cms. 35 "No RFID tag? Pay double the toll to enter Delhi post-August ...." 16 Aug. 2019, https://www.financialexpress.com/auto/car-news/no-rfid-tag-pay-double-the-toll-to-enter-delhi-post-august-16th/1675171/. 36 "THE MOTOR VEHICLES (AMENDMENT) ACT ... - eGazette." 9 Aug. 2019, http://egazette.nic.in/WriteReadData/2019/210413.pdf.
39

The health issues that the drivers face due to the work, both physical and mental,
has been put in the backburner or has been simply ignored by all, even by the
drivers themselves.
40

Drivers feel that they have been reduced to a cog of the machinery. A machinery obsessed with maximising value for its shareholders while shunning the humans driving the business.

CONCLUSION
This research and survey expects to highlight the decision-making process involved
for individuals working in the app-based industry as driver/driver partner in relation
to their health. It brings into focus on how precarious and hazardous this work is,
affecting health both physically and mentally. The long arduous hours of being in
the driver seat, sleep deprived to make sure to earn enough to pay for the day’s EMI.
They are forced to navigate the indifference of the customers they have to ferry and
the nagging traffic officials out there to penalize even the slightest of infractions. All
these hoops to jump through to still be stuck in a false consciousness of being an
“independent contractor” or “free agent” for the company so that they can forego
the liability of taking care of their employees. App-based drivers/driver partners work
in a very toxic and isolated work environment. The toll that it takes on their physical
health manifests in body ache, waist pain, muscle cramps, stomach problems due to
irregular food routine, sleep deprivation etc. Mentally they are always stressed and
agitated, a more comprehensive study in relation to their stressors and how these
affect their health in the long term is a necessary project to be pursued. The impact
of work and work environment in fuelling addictive habits in the workers in order to
perform their work.
Although this research and survey was not able to bring in the female drivers/driver
partners perspective, it acknowledges that there needs to be an independent
research project exclusively focused on their issues and concerns, beyond just health
and safety, but also in relation to their concerns with the work and equality of rights
and treatment in this profession. This research should be considered as an overview
of what the app-based transport and delivery partners have faced in order to work in
this industry and eke out a decent living in an unforgiving and competitive
workplace. The algorithm of the companies they work for, pits them against their
peers in order to maximize profit, while at the same time denying them social
security or protection and essentially refusing to acknowledge them as employees.
This research and survey report is expected to be used as a tool, a baseline if it may
be projected as, to further the agenda in securing the labour rights of the app-based
41

workers not only from the companies that they work from but also from the
government.
This research based on the survey expects to empower trade unions and
organisations working on the issues of app-based transport and delivery workers
with talking points to kick off conversations to acknowledge and protect the labour
rights of workers and create decent work standards. This research focused on
occupational health and safety of the workers but has also pointed to other
significant areas of intervention and action for future campaigns and initiatives.
42

REFERENCES
"The Platform Economy, A Case study on Ola and Uber from the driver partners’ perspective" https://tiss.edu/uploads/files/Cab_Aggregator_Services.pdf.
"An Index of Precarity for Measuring Early Employment Insecurity." 18 Oct. 2018, https://link.springer.com/chapter/10.1007/978-3-319-95420-2_16.
"Changes in lease agreement take Ola cabbies for a ride." 21 Jul. 2019, https://timesofindia.indiatimes.com/city/hyderabad/changes-in-lease-agreement-take-ola-cabbies-for-a-ride/articleshow/70321535.cms.
"Delhi: Ola driver cab murdered after being robbed, killer arrested from Jharkhand." 4 Jun. 2020, https://www.indiatoday.in/crime/story/delhi-ola-driver-cab-murdered-after-being-robbed-killer-arrested-from-jharkhand-1685541-2020-06-04.
"Driving for Ola or Uber in India: Much Do You Need to Work to be Profitable?" 16 Sep. 2019, https://in.finance.yahoo.com/news/driving-ola-uber-india-much-194831509.html.
"Give them a brake: Ola, Uber drivers are overworking to meet targets.” 30 Mar. 2017, https://www.thehindu.com/opinion/op-ed/give-them-a-brake-ola-uber-drivers-are-overworking-to-meet-targets/article17739979.ece.
"How to Start Business with Ola and Uber in 2019 | WHITEDUST." https://www.whitedust.net/how-to-start-business-with-olauber-taxi-for-sure/.
“In It Together: Why Less Inequality Benefits All, Overview Of Inequality Trends, Key Findings And Policy Directions.”20 Aug. 2019, https://www.oecd.org/els/soc/OECD2015-In-It-Together-Chapter1-Overview-Inequality.pdf
"India Now Uber's Second Largest Market Following Expansion To 7 New Cities." https://techcrunch.com/2015/07/01/uber-india/.
"India's Ola switches gears on its food delivery business Food Panda" 21 May.2019, https://techcrunch.com/2019/05/21/ola-foodpanda-update/.
"India's per-capita income rises 6.8% to Rs. 11,254 a month in a month in FY20." 7 Jan.2020, https://www.businesstoday.in/current/economy-politics/india-per-capita-income-rises-68-to-rs-11254-a-month-in-fy20/story/393333.html.
“Long Working Hours and Stressful Jobs Keep Men Smoking.” 23 Aug.2007, https://www.sciencedaily.com/releases/2007/08/070823102338.htm.
"Low back pain among taxi drivers: A cross-sectional study." 23 Aug.2017, https://www.researchgate.net/publication/316896904_Low_back_pain_among_taxi_drivers_A_cross-sectional_study.
"Measurement of forced labour - ILO." 19 Oct. 2018, https://www.ilo.org/wcmsp5/groups/public/---dgreports/---stat/documents/meetingdocument/wcms_636050.pdf.
"National Sleep Foundation's sleep time duration recommendations: methodology and results summary." https://pubmed.ncbi.nlm.nih.gov/29073412/.
43

"No easy exit as Ola and Uber drivers in India face spiralling debt trap." 28 May. 2019, https://www.thenewsminute.com/article/no-easy-exit-ola-and-uber-drivers-india-face-spiralling-debt-trap-102558.
"No RFID tag? Pay double the toll to enter Delhi post-August 16th!" 16 Aug. 2019, https://www.financialexpress.com/auto/car-news/no-rfid-tag-pay-double-the-toll-to-enter-delhi-post-august-16th/1675171/.
"Ola enters the mobile payments space with Ola Money - Livemint.". https://www.livemint.com/Companies/P4REfJgDkjHWkIi6q9shBP/Ola-enters-mobile-payments-space-with-Ola-Money.html.
"Ola vs Uber: The latest score in the great Indian taxi-app game - Quartz.". https://qz.com/india/1545042/ola-vs-uber-the-latest-score-in-the-great-indian-taxi-app-game/.
"Ola, Uber drivers' strike to continue till Thursday, union to take final call after discussions." 31 Oct. 2018, https://timesofindia.indiatimes.com/city/mumbai/ola-uber-drivers-strike-to-continue-till-thursday-union-to-take-final-call-after-discussions/articleshow/66443088.cms.
"The architecture of digital labour platforms: Policy recommendations on platform design for worker well-being- ILO." https://www.ilo.org/wcmsp5/groups/public/---dgreports/---cabinet/documents/publication/wcms_630603.pdf.
"The challenges before cab aggregators in India - The Economic Times.". https://economictimes.indiatimes.com/industry/transportation/shipping-/-transport/the-challenges-before-cab-aggregators-in-india/articleshow/66394551.cms.
"THE CODE ON SOCIAL SECURITY, 2019 - Ministry of Labour" https://labour.gov.in/sites/default/files/THE_CODE_ON_SOCIAL_SECURITY%2C2019.pdf.
"THE CODE ON WAGES, 2019." 18 Jul. 2019, http://164.100.47.4/BillsTexts/LSBillTexts/Asintroduced/184_2019_LS_Eng.pdf.
"The Gig Economy and Contingent Work: An Occupational Health Assessment - NCBI." 27 Feb. 2017, https://www.ncbi.nlm.nih.gov/pmc/articles/PMC5374746/.
"THE MOTOR VEHICLES (AMENDMENT) ACT – eGazette." 9 Aug. 2019, http://egazette.nic.in/WriteReadData/2019/210413.pdf.
"THE MOTOR VEHICLES (AMENDMENT) ACT, 2019 - Gazette of India." 9 Aug. 2019, http://egazette.nic.in/WriteReadData/2019/210413.pdf.
"The Occupational Safety, Health and Working Conditions ...." 16 Jul. 2019, http://164.100.47.4/BillsTexts/LSBillTexts/Asintroduced/186_2019_LS_Eng.pdf.
"Uber Revenue and Usage Statistics (2019) - Business of Apps.". https://www.businessofapps.com/data/uber-statistics/.
"Uber's new terms for users say it's a 'tech co connecting riders and drivers. " 1 Oct. 2019, https://www.livemint.com/companies/start-ups/uber-s-new-terms-for-users-say-it-s-a-tech-co-connecting-riders-and-drivers-11569922192623.html.
"What is modern slavery? - Anti-Slavery International." https://www.antislavery.org/slavery-today/modern-slavery/.
44

"What Is Surge Pricing? | Transportation Plus." 20 May. 2018, https://www.tplusride.com/what-is-surge-pricing/.
"What People Hate About Being Managed by Algorithms, According to a Study of Uber Drivers. " https://hbr.org/2019/08/what-people-hate-about-being-managed-by-algorithms-according-to-a-study-of-uber-drivers.
45

This report is shared under Creative Commons Attribution-NonCommercial-ShareAlike 4.0 International license (CC BY-NC-SA 4.0).
www.facebook.com/watch/connectifat/
www.twitter.com/Connect_IFAT/
www.youtube.com/channel/UCA1AxGq0Fb_A_O_Ey44eiPg
Shaik Salauddin, +91 96424 24799
Indian Federation of App-based Transport Workers
www.facebook.com/ITFDelhiOffice/
www.twitter.com/itf_delhioffice
www.itfglobal.org/en/region/itf-delhi-office
International Transport Workers' Federation