Embed Size (px)
Citation preview
Protecting the environment. Preserving the coast.

Recycled Water Program Advanced Water Treatment
SAN ELIJO JOINT POWERS AUTHORITY
2
Michael T. Thornton, P.E. General Manager

Who We Are… San Elijo JPA Member Agencies
City of Encinitas City of Solana Beach
Board of Directors
Chair Tom Campbell Vice-Chair Mark Muir Teresa Barth David Zito
3
Wastewater Service Area

What We Do…
4
Vision - “We pursue innovative practices to produce clean water in an environmentally, socially, and fiscally responsible manner."

A History of Coastal Stewardship Until the early 1950’s, sewage was discharged into the lagoon and coastal waters for Cardiff and Solana Beach.
San Elijo Water Pollution Control Facility was built in 1965 in response to water pollution in the San Elijo Lagoon.

Serving Today, Planning for Tomorrow.
Moving beyond wastewater treatment & disposal paradigm; the San Elijo JPA is focusing on maximizing recycling.

RECYCLED WATER PROGRAM
7
Produces approx. 1350 AFY Operated in Partnership with other local
districts and cities San Dieguito Water District Santa Fe Irrigation District Olivenhain Municipal Water District City of Del Mar
Reduces Ocean Discharge by 40% Strong Community Support

San Elijo Water Reclamation Facility Recycled Water Monthly Demands
Acre – Feet/Month
0
50
100
150
200
250
300
350
jan feb mar apr may jun jul aug sep oct nov dec
Ocean Discharge
Recycled

RECYCLED WATER SERVICE AREA
9
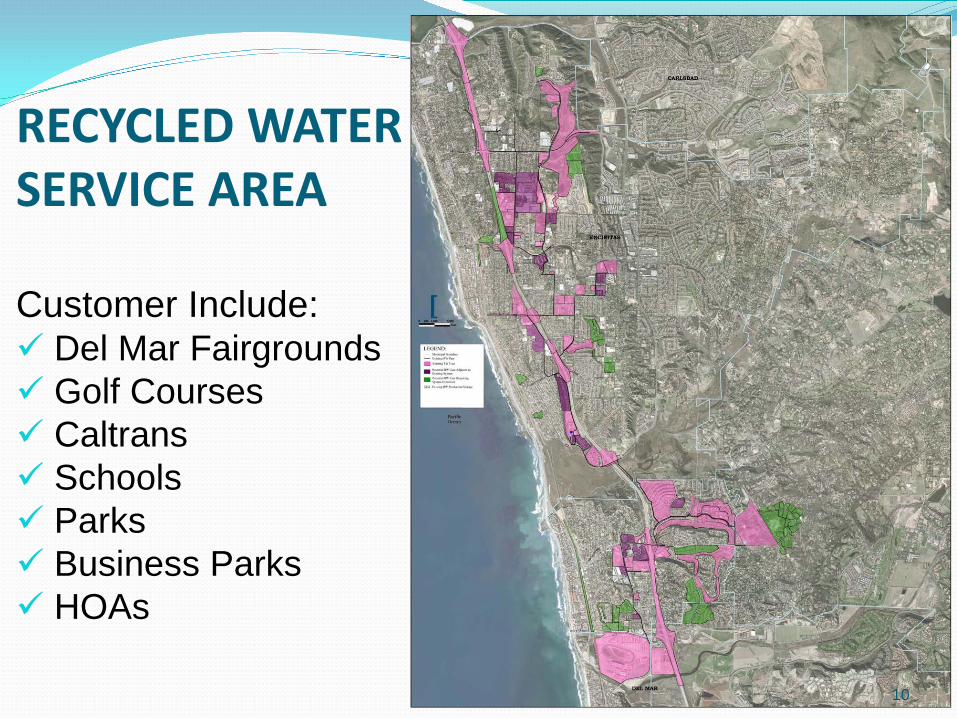
RECYCLED WATER SERVICE AREA
10
Customer Include: Del Mar Fairgrounds Golf Courses Caltrans Schools Parks Business Parks HOAs

RECYCLED WATER SERVICE AREA
Potential New Markets
11

PROGRAM CHALLENGES Maintain Financial Sustainability Develop & Grow the Program Maintain Excellent Water Quality

TOTAL DISSOLVED SOLIDS (TDS) Measurement of dissolved salts and minerals (e.g. calcium, magnesium, sulfate, chloride, sodium, etc.) in the water.

TOTAL DISSOLVED SOLIDS (TDS) Measurement of dissolved salts and minerals (e.g. calcium, magnesium, sulfate, chloride, sodium, etc.) in the water. Not a risk to human health Most plants have a limited tolerance Can impact some industrial processes Can limit the use of recycled water
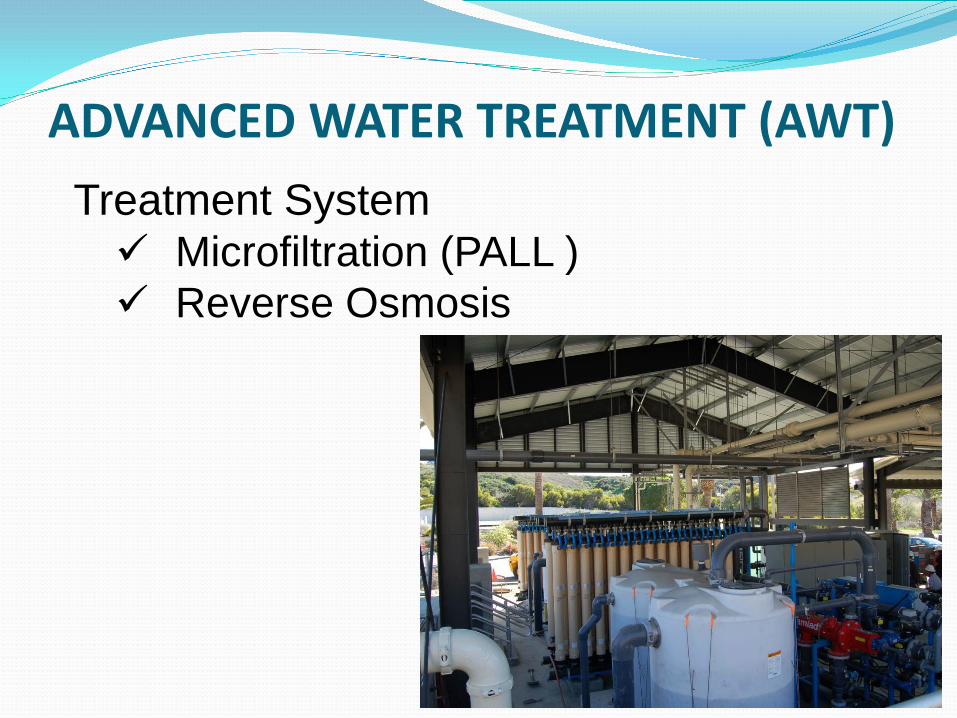
ADVANCED WATER TREATMENT (AWT) Treatment System Microfiltration (PALL ) Reverse Osmosis
15

ADVANCED WATER TREATMENT (AWT) Treatment System Microfiltration (PALL ) Reverse Osmosis
AWT parallels existing recycled water sand filtration system New RW capacity = 3.0 MGD
(expandable to 3.5 MGD)
16

ADVANCED WATER TREATMENT
17
Build Footprint: ~5,000 sq ft System Startup: April 2013 Cost: $5 million Grant: $850,000

THE PROJECT
18
DynaSand Filtration
Chlorine Disinfection
Existing RW Treatment Train
Wastewater Treatment
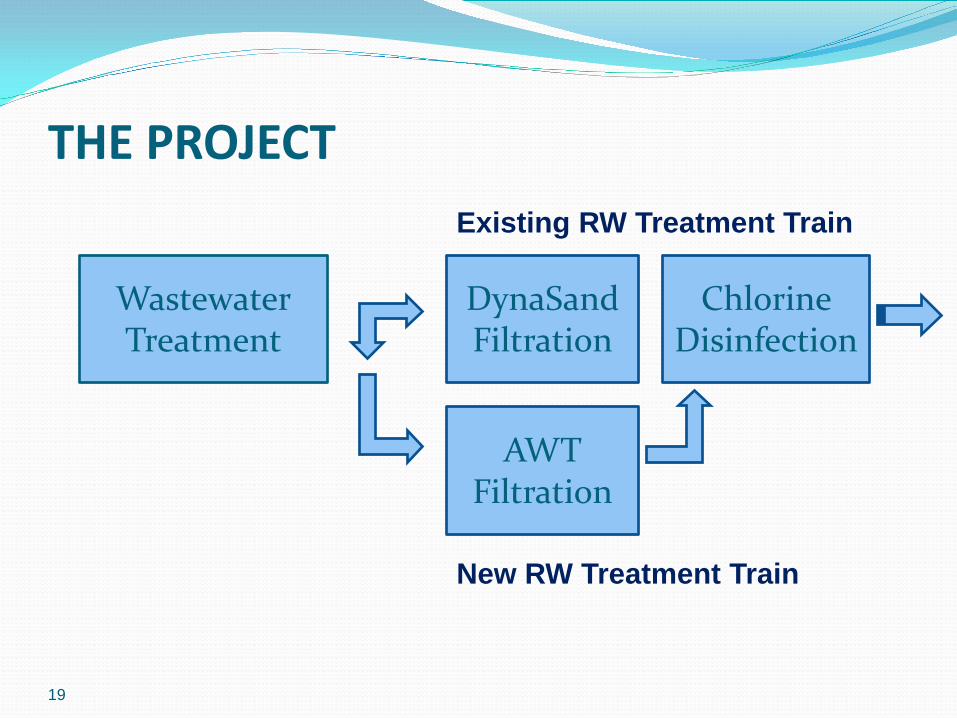
THE PROJECT
19
DynaSand Filtration
Chlorine Disinfection
Existing RW Treatment Train
AWT Filtration
New RW Treatment Train
Wastewater Treatment

THE PROJECT
20
DynaSand Filtration
Chlorine Disinfection
Existing RW Treatment Train
AWT Filtration
New RW Treatment Train
Wastewater Treatment
Design provides:
Operational flexibility
Cost effective (E&C)
Expandability
New Opportunities

THE PROJECT
21
DynaSand Filtration
Chlorine Disinfection
Existing RW Treatment Train
AWT Filtration
Future Opportunities?
Wastewater Treatment
Design provides:
Operational flexibility
Cost effective (E&C)
Expandability
New Opportunities
IPR

Better Wastewater = Better Recycled Water
22
Addition of an Anaerobic Selector in the Activated Sludge Bioreactor has removed P from an average of 4.8 mg/l to less than 0.5 mg/l

IMPROVING COST EFFECTIVENESS Wastewater treatment process was improved to
produce “best water quality” for membrane filtration.
RESULTS: Low turbidity/more filterable water Reduced levels of orthophosphate (reduces scaling) Reduced chemical and energy use in secondary
treatment process Improved treatment process stability (reduced variance
in treated water quality) 23

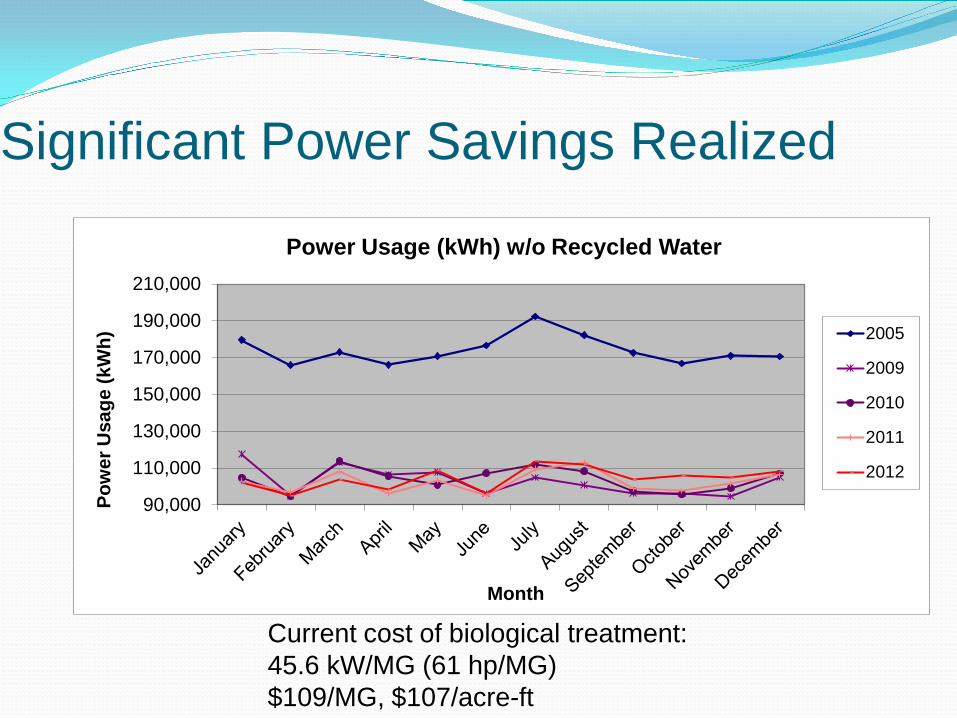
Significant Power Savings Realized
90,000
110,000
130,000
150,000
170,000
190,000
210,000
Pow
er U
sage
(kW
h)
Month
Power Usage (kWh) w/o Recycled Water
2005
2009

Significant Power Savings Realized
90,000
110,000
130,000
150,000
170,000
190,000
210,000
Pow
er U
sage
(kW
h)
Month
Power Usage (kWh) w/o Recycled Water
2005
2009
2010

Significant Power Savings Realized
90,000
110,000
130,000
150,000
170,000
190,000
210,000
Pow
er U
sage
(kW
h)
Month
Power Usage (kWh) w/o Recycled Water
2005
2009
2010
2011
Significant Power Savings Realized
Current cost of biological treatment: 45.6 kW/MG (61 hp/MG) $109/MG, $107/acre-ft
90,000
110,000
130,000
150,000
170,000
190,000
210,000
Pow
er U
sage
(kW
h)
Month
Power Usage (kWh) w/o Recycled Water
2005
2009
2010
2011
2012

Partial Nitrification
Maximizing Treatment Performance: Temperature for SRT Target
Mixed Liquor Temp (F)
SRT
(day
s)

Seasonal Treatment Performance
Target SRT ~ 1.5 days in summer Target SRT ~ 2.5 days in winter
Month Mon
thly
Avg
Sec
onda
ry E
fflue
nt T
urbi
dity
(NTU
)

Secondary Effluent Improvements
*Implemented SRT based on temperature May 2011
Mon
thly
Avg
Sec
onda
ry E
fflue
nt T
urbi
dity
(NTU
)
Month

PHOSPHOROUS REMOVAL
31
Anaerobic Selector resulted in biological removal of phosphorous.
Reduces: Chemicals & labor associated w/filter
cleaning.

32
Treatment Optimization Results – Better Treatment - Lower Cost Energy use reduced by ~800,000 kWh annually (or
40% reduction to achieve 61 HP/MG) Well flocculated biology - no need for chemical
addition to control settling (no polymer or NaOCl) Temperature adjusted SRT produces consistent
effluent quality without nitrifying Significant improvements to water quality reduces
the need for chemicals for filtration Provides bio-P removal at low SRT

MAXIMIZING COMMUNITY BENEFITS AWT provides the ability to do more than just produce
“really clean” recycled water.
New opportunity to strategically capture and treat urban runoff
Urban Runoff is one of the leading reasons for Beach and Lagoon pollution.
Impacts the City’s storm water permit compliance
Collaborated with the cities on a solution that leverages the treatment capacity of the proposed AWT.
33

URBAN RUNOFF TREATMENT San Elijo Water Reclamation Facility

URBAN RUNOFF TREATMENT
Storm Water System

URBAN RUNOFF TREATMENT

URBAN RUNOFF TREATMENT Construct diversion systems Use existing sewer system Treat at the SEWRF Protect coast waters New water to recycle

PROJECT PROGRESS Design Completed (Kennedy/Jenks) Peer Review (Trussell Technology) Financial Feasibility Analysis (GDH) CEQA documentation completed (DUDEK) Grant funding awarded Project financing secured Construction Initiated
38
Questions
SAN ELIJO JOINT POWERS AUTHORITY
39
Wastewater, storm water, recycled water… Providing Clean Water for the Future.